thesis - jeremy - 9-7-16 final
TRANSCRIPT

Power to the People: The Future of Electric Utilities and Distributed
Energy Resources in the 21st Century
By Jeremy Conway
Reviewed by Chris Gadomski

1
Copyright © 2016 by Jeremy Conway
All rights reserved. No part of this publication may be reproduced, distributed or transmitted without the express consent of the author.

2
Acknowledgements
First and foremost, I would like to express my gratitude to the professors who have kindled my interests in energy, finance, economics and environmental policy. In particular, I would like to thank Carolyn Kissane for providing one of the most engaging and enjoyable classroom experiences in my academic career and for taking such an interest in nurturing future energy leaders. I would like to especially thank Chris Gadomski for arousing my curiosity in the economics and finance of energy and Jay Taparia for urging me to take on this challenging topic. I am indebted to all of my professors, friends and family who have encouraged me along the way. I dedicate this work to my grandparents who have always believed in me. Without their kindness and generosity, this thesis never would have seen the light of day.

3
Recommended Research Sources
America’s Power Plan. http://americaspowerplan.com Center on Global Energy Policy. http://energypolicy.columbia.edu/ Cost of Renewable Energy Spreadsheet Tool. https://financere.nrel.gov/finance/content/crest-cost-energy-models Database of State Incentives for Renewables & Efficiency. http://www.dsireusa.org/ Edison Electric Institute. http://www.eei.org/ Energy Information Administration. http://www.eia.gov/ Federal Energy Regulatory Commission. http://www.ferc.gov/ Freeing the Energy Grid. http://freeingthegrid.org/ Institute for Local Self-Reliance. https://ilsr.org/ International Energy Agency. http://www.iea.org/ Interstate Renewable Energy Council. http://www.irecusa.org/ Lawrence Berkeley National Laboratory. http://www.lbl.gov MIT Energy Initiative. http://mitei.mit.edu/ National Renewable Energy Laboratory. http://www.nrel.gov/ NC Clean Energy Technology Center. https://nccleantech.ncsu.edu/ PV Watts Calculator. http://pvwatts.nrel.gov/ Rocky Mountain Institute. http://www.rmi.org/ Shared Renewables HQ. http://sharedrenewables.org/ Solar Energy Industries Association. http://www.seia.org/ SEIA Major Solar Projects List. http://www.seia.org/map/majorprojectsmap.php Smart Electric Power Association. http://www.solarelectricpower.org/ The Open PV Project. https://openpv.nrel.gov/rankings

4
List of Acronyms IOU – Investor Owned Utility EE—Energy Efficiency EEI – Edison Electric Institute EIA – Energy Information Administration DER – Distributed Energy Resource DG – Distributed Generation DR – Demand Response DOE – Department of Energy DSIRE – Database of State Incentives for Renewables & Efficiency DSP – Distribution Service Platform FERC – Federal Energy Regulatory Commission IPP – Independent Power Producer IREC – Interstate Renewable Energy Council ISO – Independent System Operator ITC – Investment Tax Credit LCOE – Levelized Cost of Electricity NCCETC – NC Clean Energy Technology Center NEG – Net Excess Generation NEM – Net Energy Metering NREL – National Renewable Energy Laboratory PUC – Public Utility Commission PURPA – Public Utility Regulatory Policies Act (1978) PV – Photovoltaic QF – Qualifying Facility REV – New York State’s Reforming the Energy Vision RTO – Regional Transmission Organization SEIA – Solar Energy Industries Association SEPA – Smart Electric Power Alliance T&D – Transmission & Distribution TPO – Third Party Ownership

5
Table of Contents Page 1 Executive Summary---------------------------------------------------------------------------7 2 An Overview of Investor Owned Utilities------------------------------------------------------9 3 Current Industry Structure and Competitive Forces-----------------------------------------25 4 IOUs Current Strategic Reactions (Case Studies)--------------------------------------------56 5 Policy Recommendations for Power Industry Stakeholders---------------------------------70 6 Conclusions----------------------------------------------------------------------------------75
List of Figures Figure 2.1: Growing Economies of Scale Reduces a Company’s Average Total Costs-------------10 Figure 2.2: Declining Economies of Scale for IOU Industry --------------------------------------- 15 Figure 2.3: Regional Transmission Organizations in the U.S.-------------------------------------- 16 Figure 2.4: Declining Electricity Use Now a Long Term Trend------------------------------------- 17 Figure 2.5: Evolving Energy Efficiency Standards--------------------------------------------------19 Figure 2.6: IOU’s Historical Credit Ratings--------------------------------------------------------- 20 Figure 2.7: The So Called Utility Death Spiral------------------------------------------------------ 21 Figure 2.8: IOU Industry Capital Spending & Retail Rates------------------------------------------ 23 Figure 3.1: Solar Prices & Installation Rates------------------------------------------------------- 27 Figure 3.2: Nationwide Electricity Rates by County------------------------------------------------ 30 Figure 3.3: Soft Costs for a Typical Solar Installation---------------------------------------------- 31 Figure 3.4: Residential PV System Costs Reaching Grid Parity------------------------------------ 32 Figure 3.5: Financial Performance of Pure Play Residential Solar Companies-------------------- 35 Figure 3.6: Financial Performance of IOUs--------------------------------------------------------- 36 Figure 3.7: EBITDA Comparison of Solar Providers & IOUs-----------------------------------------37 Figure 3.8: PV Solar Insolation Across the US------------------------------------------------------39 Figure 3.9: Solar Insolation & Retail Rates Shape the Economics of Solar Systems-------------- 40 Figure 3.10: State Changes to NEM Policies------------------------------------------------------- 47 Figure 3.11: Interconnection Standards by State-------------------------------------------------- 48 Figure 3.12: ITC Stimulates Annual Solar Installations-------------------------------------------- 50 Figure 3.13: Map of Third Party Ownership (TPO) Regulations------------------------------------ 52 Figure 3.14: Community Solar Policies & Programs----------------------------------------------- 54 Figure 3.15: Residential Solar Market Potential by State------------------------------------------ 55 Figure 4.1: Top 10 Utility Solar Installations, 2015------------------------------------------------- 58 Figure 4.2: Utility Scale Solar in South Atlantic Region Dominated by North Carolina, Georgia--- 59 Figure 4.3: APS Solar Innovation Study------------------------------------------------------------ 62 Figure 4.4: Integration of Customer, DER Service Providers and the Utility through the DSP----- 65 Figure 5.1: Performance-based Ratemaking------------------------------------------------------ 71 Figure 5.2: Generic Smart Utility Business Models------------------------------------------------ 72 Figure 5.3: The Power Industry’s “Inseparable Triad---------------------------------------------- 73

6
List of Tables Table 3.1: Ranking of States with Third Party Solar Operators by Retail Rate---------------------29 Table 3.2: Average Capacity Factors for Generation Technologies-------------------------------- 38 Table 3.3: Southern Nevada Net Metering Rate Change Forecast--------------------------------- 43 Table 3.4: NEM Rates in Top 10 DG Markets by Per Capita Installations, 2016-------------------- 45 Table 3.5: Solar Investment Tax Credit Time Horizon---------------------------------------------- 49 Table 3.6: Renewable Portfolio Standards Policies------------------------------------------------ 51 Table 5.1: Business Model Elements--------------------------------------------------------------- 72

7
Chapter 1
Executive Summary During the 20th century, the US power industry and its regulatory overseers sought to make electricity reliable, cheap and accessible to all of the nation’s citizens. The regulatory compact formulated by these stakeholders succeeded in accomplishing these goals by promoting the development of vast electrical transmission and distribution networks interconnected to large central power stations. However, in the 21st century, this regulatory structure is now being challenged. While policymakers seek to maintain the goals of sustaining affordable and reliable electricity as a public good, public policy also seeks to preserve a modern power grid that mitigates the negative “public health and environmental costs” caused by carbon emissions.1 Moreover, now that economies of scale peaked in the 1970s, infrastructure spending leads to rate increases—meaning that the investor owned utilities’ financial incentive encouraging infrastructure spending (an incentive embedded in the regulated ratemaking framework) no longer provides cost reducing benefits to consumers. Since 2008, the growth of residential solar energy markets has created interest in developing distributed energy resource (DER) markets that help consumers reduce their power consumption and lower their electricity bills while providing potential benefits to the whole grid through deferred investments and aggregation of demand side resources (i.e. demand side management and load shifting) to optimize the grid’s operation. As a whole, investor owned utilities (IOUs) dislike DERs because the rise of these resources exacerbate the declining consumption of centralized power. This secular trend completely undermines the traditional financial motive of utilities: namely, to promote consumer demand for utility delivered kilowatt hours as a means to boost revenue and justify future investments in grid infrastructure. So far, the rise of DERs is most pronounced in regions that complement non-policy supporting factors (i.e. higher than average retail prices and/or high solar capacity factors) with a strong collection of market enabling policies such as the availability of net metering and investment tax credits. However, while the rise of DERs is most pronounced in the following regions (the Mid-Atlantic, Northeast, Southwest and California), even IOUs operating in markets with low DER deployment levels have taken strategic precautions to confront the disruptive threat. Financial incentives of IOUs create conflict with policymakers that aim to facilitate DER growth and integrate the DER market into the power sector’s value chain. The growth of DERs hurt IOUs because they render future infrastructure spending unnecessary and cause some customers to reduce their consumption. Under the 1 Harvey, Hal and Sonia Aggarwal. “Rethinking Policy to Deliver a Clean Energy Future,” Energy Innovation Policy & Technology LLC. September 2013. http://energyinnovation.org/wp-content/uploads/2014/06/APP-OVERVIEW-PAPER.pdf

8
IOUs traditional business model and ratemaking framework, the growth of DERs poses a threat to their business strategy and financial well-being through the ongoing loss of revenue and loss of potential investment opportunities with a regulated rate of return. In general, vertically integrated IOUs have wielded defensive strategies aimed at hindering DER growth. Others have instituted offensive strategies seeking to enter and potentially control the DER market. Meanwhile IOUs operating in progressive DER markets like California have made unprecedented progress in stimulating DER market growth, but much of this has occurred under a compliance mindset. It has not principally been driven by natural business initiatives. Consequently, even IOUs in California rely more on regulatory mandates rather than financial drivers to integrate DERs into their business operations. In order to overcome this conflict between the goals of policymakers and regulators on the one hand and the goals of IOU shareholders on the other, the major stakeholders involved in the power industry’s future must cooperate to realign IOUs’ financial incentives to see DER growth as an opportunity rather than an existential threat. Working in tandem to create new business models supported by performance based regulation, policymakers, IOUs and other major energy stakeholders can potentially create a regulatory compact for the future—a regulatory compact that provides new valuable energy services for consumers while unleashing new revenue generating opportunities for utilities. Transforming the regulatory compact and utility business model of the 20th century without creating unintended consequences will be a challenging feat. Therefore, regulators and utilities will need to work in concert to develop a cogent transition plan.

9
Chapter 2
An Overview of Investor Owned Utilities I. A Brief History of Investor Owned Utilities
A. The Power Industry: Origins The origins of the electric utility industry emerged as a result of two key inventions by Thomas Edison: the introduction of the incandescent light bulb in 1879 and the emergence of the “world’s first central generating power station in New York City’s financial district” in 1882.2 Shortly after the arrival of centralized power, Thomas Edison and other innovative entrepreneurs took advantage of this new power source and created a variety of new electrical machines for commercial, industrial and residential applications. Within a few years, electricity now began to power manufacturing processes, public transportation, heating, etc. In short order, Edison’s innovations created the initial push toward electrification. But it would take another innovator to shape the “economic, structural and regulatory framework“ that would give rise to the modern vertically integrated electric utility companies that came to dominate the 20th century and still play an essential role in today’s electric power industry.3 His name was Samuel Insull.
B. Industry Growth Through Economies of Scale Samuel Insull, formerly Thomas Edison’s principal assistant in charge of Edison’s finances and business strategy, understood that growth in the power industry necessitated massive investment in new generation technology and infrastructure, mass consumption and industry consolidation. In other words, he realized that industry growth required his business to attain cost leadership position vis-à-vis his competitors through economies of scales. Economies of scale refer to the overall cost benefits a business attains from increasing the scale of its operations.4 As a business increases its economies of scales, it will reduce the cost of each unit produced as the total volume of output rises.5 Figure 2.1 below demonstrates how increased output reduces the average total cost for the industry. Growing asset heavy industries can significantly reduce these fixed costs by spreading them out over a larger quantity of output. During the early to mid 20th century, the power industry lived through a “decreasing cost era” that hinged on increasing economies of scale, and as
2 “Emergence of Electrical Utilities in America,” The National Museum of American History. http://americanhistory.si.edu/powering/past/h1main.htm 3 Lambert, Jeremiah D. The Power Brokers: The Struggle to Shape and Control the Electric Power Industry. MIT Press, 2015, 1. 4 Porter, Michael E. Competitive strategy: Techniques for analyzing industries and competitors. Simon and Schuster, 1980, 7. 5 Ibid.

10
utilities reduced the average total cost of its business operations, they were able to pass these savings on to their consumers.6
Figure 2.1: Growing Economies of Scale Reduces a Company’s Average Total Costs
Source: Investopedia
C. Transmission and Distribution Network Creates Mass Market Potential
A low cost business strategy through economies of scale also “requires a relatively high market share.”7 Insull’s creation of a vast unprecedented alternating current (AC) transmission system permitted generated electricity to reach ever greater distances and therefore immensely expanded the range of his company’s captive market. Before Insull, a central station’s generated electricity delivery radius exceeded no further than one-mile from the generation source.8 Even with additional steam turbine generators creating electricity more efficiently, electric power flowing over distribution lines would degrade quickly under Edison’s direct current system. With the introduction of AC technology, power stations could now break through this barrier and electricity could travel great distances “without experiencing much degradation.”9 This new transmission and distribution (T&D) system allowed utilities to reach every end user in its service area. By allowing power companies to reach every single end user in its extended service area, the T&D system may have been the most important element in permitting the scaling up of production. Consequently, the creation of this system greatly increased Insull’s marketing and distribution advantages relative to his
6 Olson, Wayne. The A to Z of Public Utility Regulation. Public Utilities Reports, Inc, 2015, 182. 7 Porter, Competitive Strategy, 36. 8 Lambert, The Power Brokers, 6. 9 Emergence of Electrical Utilities.
11
competitors and was one of the factors that led to Commonwealth Edison obtaining a virtual monopoly in the greater Chicago area.
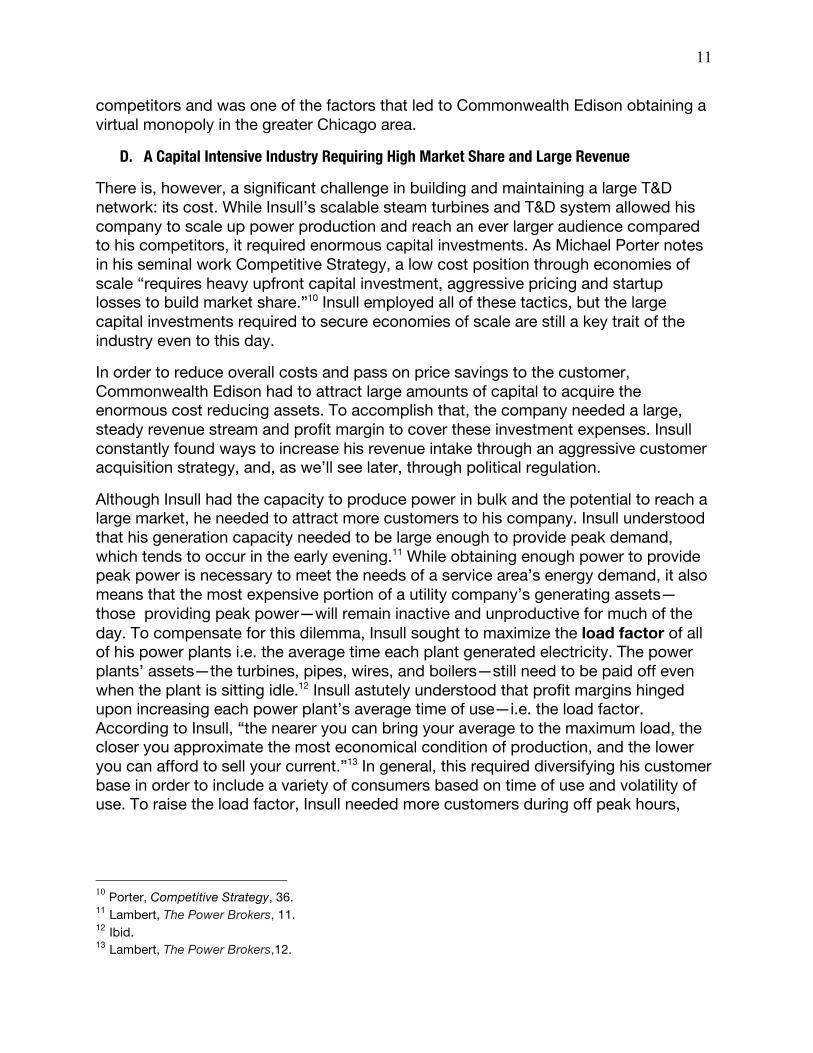
D. A Capital Intensive Industry Requiring High Market Share and Large Revenue There is, however, a significant challenge in building and maintaining a large T&D network: its cost. While Insull’s scalable steam turbines and T&D system allowed his company to scale up power production and reach an ever larger audience compared to his competitors, it required enormous capital investments. As Michael Porter notes in his seminal work Competitive Strategy, a low cost position through economies of scale “requires heavy upfront capital investment, aggressive pricing and startup losses to build market share.”10 Insull employed all of these tactics, but the large capital investments required to secure economies of scale are still a key trait of the industry even to this day. In order to reduce overall costs and pass on price savings to the customer, Commonwealth Edison had to attract large amounts of capital to acquire the enormous cost reducing assets. To accomplish that, the company needed a large, steady revenue stream and profit margin to cover these investment expenses. Insull constantly found ways to increase his revenue intake through an aggressive customer acquisition strategy, and, as we’ll see later, through political regulation. Although Insull had the capacity to produce power in bulk and the potential to reach a large market, he needed to attract more customers to his company. Insull understood that his generation capacity needed to be large enough to provide peak demand, which tends to occur in the early evening.11 While obtaining enough power to provide peak power is necessary to meet the needs of a service area’s energy demand, it also means that the most expensive portion of a utility company’s generating assets—those providing peak power—will remain inactive and unproductive for much of the day. To compensate for this dilemma, Insull sought to maximize the load factor of all of his power plants i.e. the average time each plant generated electricity. The power plants’ assets—the turbines, pipes, wires, and boilers—still need to be paid off even when the plant is sitting idle.12 Insull astutely understood that profit margins hinged upon increasing each power plant’s average time of use—i.e. the load factor. According to Insull, “the nearer you can bring your average to the maximum load, the closer you approximate the most economical condition of production, and the lower you can afford to sell your current.”13 In general, this required diversifying his customer base in order to include a variety of consumers based on time of use and volatility of use. To raise the load factor, Insull needed more customers during off peak hours,
10 Porter, Competitive Strategy, 36. 11 Lambert, The Power Brokers, 11. 12 Ibid. 13 Lambert, The Power Brokers,12.

12
less customers with volatile usage patterns and a more diverse group of customers whose time of use varied.14 Insull also made use of a new innovative demand meter created by Arthur Wright that allowed him to determine the actual use and the degree to which each consumer utilized his installed capacity. In other words, each consumer’s monthly bill revealed his disaggregated portion of the fixed costs of the utility company that arose from the generating capacity the utility provided to meet peak load.15 In measuring the quantity of electricity each user consumed, it also reflected each user’s contribution toward a central plant’s operating costs. In short, with the arrival of the Wright meter, monthly charges suddenly seemed more transparent, fair and reasonable. Additionally, Wright’s demand meter revealed that two customers with the same installed capacity (let’s say, 15 lamps as example) could have vastly different cost profiles.16 As an example, customer A only uses her electricity three times a year, while customer B uses her electricity every single day.17 Since the company must “invest so heavily in equipment” to provide peak load capacity for each customer, it actually costs more to serve the customer who uses her lamps only three times a year than the customer who leaves her lamp running each and every evening.18 Hence, the Wright meter concretely validated Insull’s growth paradigm: as customers increased their consumption, costs declined. Thus, the Wright meter reinforced Insull’s general growth strategy: to attract more end users and increase revenue through mass consumption.19 Ultimately, the Wright meter further encouraged Insull to capture a larger audience, abandon unprofitable power plants and confirmed a monopolistic system as the best path to push down both company expenses and service pricing.20
E. Natural Monopoly Leads to Regulatory Compact Despite Insull’s success vis-à-vis his competitors, remaining competition still undermined industry growth and subverted the benefits of economies of scale. Intense rivalry split market share, meaning that no single company could produce sufficient revenue to justify investment in larger turbines and an expanding T&D system.21 In order to overcome this limitation, Insull began to buyout competitors and consolidate the electricity market. This allowed him to absorb more customers and escalate his company’s load factor—that is, to increase the average use of his plants
14 Hughes, Thomas Parke. Networks of power: electrification in Western society, 1880-1930. JHU Press, 1993., 220 15 Ibid. 16 McDonald, Forrest. Insull: the rise and fall of a billionaire utility tycoon. Beard Books, 2004, 67. 17 Ibid. 18 Ibid. 19 Lambert, The Power Brokers, 12. 20 Lambert, The Power Brokers, 13. 21 Lambert, The Power Brokers, 13.

13
through customer acquisition.22 Despite Insull’s initial successes through free market competition, the destabilizing threat of competition persisted. Through parallel experiences in the railroad industry, some economists, politicians and industry insiders understood that certain asset heavy industries “exhibiting economies of scales” represented what some would deem as “natural monopolies.”23,24 While most consumers and politicians abhorred the potential for market abuse inherent in a monopolistic system, the exorbitant investment requirement in building a large T&D network tied to enormous turbine generators meant that “duplication” would be wasteful, raise both business costs and consumer prices and create an unstable bankrupt conducive business climate.25 At the same time, while some of the most powerful political, consumer and financial stakeholders accepted the electric utility industry as a natural monopoly, both investors and Progressive era politicians agreed upon the need to create a robust regulatory framework for the industry. The guiding principles that underpinned this regulation came to be known as the regulatory compact. Under the auspices of the regulatory compact, utility companies and consumers reached a bargain with state political committees providing regulatory oversight over utility companies. To this day, the basic features of the regulatory compact remains intact. The terms are as follows: each utility company in a given service area is “granted a monopoly,” and it is permitted to price its electricity at an approved rate that provides a fair return on its investments.26 In return for this favorable arrangement, the company must provide “low-cost, reliable” electricity to all of the consumers residing in its service area as a public good.27 In order to hold the utility accountable to this arrangement, a state appointed public utility commission (PUC) possesses ultimate authority over approving the utilities’ annual investment decisions and consumer pricing.28 For investors, regulation provided enormous financial benefits. In many markets, fierce competition pushed electricity prices under marginal costs—driving many power companies into insolvency.29 Protection from competition assured a steady and
22 Emergence of Electrical Utilities. 23 Emergence of Electrical Utilities. 24 Roberts, David. “Utilities for dummies: How they work and why that needs to change,” Grist. 21 May 2013. 25 Emergence of Electrical Utilities. 26 Ibid. 27 Ibid.28 A monopoly may have a perverse incentive to abuse its market power in a way that serves its own profit maximizing agenda in lieu of maximizing consumer utility. A monopoly seeking to increase profits can merely raise its price or reduce its output. Regulators can ensure that utility monopolies keep price and quantity in line with the lowest point of the firm’s average total cost curve in order to maximize public benefits to consumers and society at large. See Olson, Wayne. The A to Z of Public Utility Regulation, 31-34. 29 Brooks, Cameron. "The Periodic Table of the Electric Utility Landscape: A Series of Visual Tools for Enhanced Policy Analysis." The Electricity Journal 28.6 (2015): 82-95, 84

14
dependable revenue stream which guaranteed return on investment. As a result, capital costs declined and credit quality soared allowing cheaper financing, which was critical for such a “capital intensive and highly leveraged industry.”30,31
F. The Hope Case Creates Modern Ratemaking Paradigm Then, in 1944, the Supreme Court passed a ruling that left a momentous legacy on the utility industry’s ratemaking patterns. The ruling in the Federal Power Commission v. Hope Natural Gas Co. case proffered even greater financial protection to IOUs’ investment decisions by approving a new ratemaking standard that bundled utility capital expenditures along with a guaranteed rate of return into the customers’ rates.32 This ratemaking system allowed utilities to minimize risks to shareholders, and, hence, more effectively attract capital. However, as will be explained later, this ratemaking system embedded an incentive structure within the business model that favors the deployment of expensive capital projects (i.e. grid infrastructure) as a means to boost profit margins. While favorable to shareholders’ interests and the societal need for cheap, reliable and ubiquitous electrification in the 20th century, this incentive structure may not always adequately serve the interests of a society demanding a nimbler, more efficient and cleaner grid.
G. The Mid 20th Century: The Industry’s Boom Phase As utility CEOs like Insull relinquished regulatory authority to state commissions, conditions for industry growth boomed. Under this new system of regulatory protection, the industry quickly consolidated into vertically integrated monopolies all over the country, and throughout the 20th century, most of the country’s generation capacity and T&D system arose under this arrangement. The industry realized greater economies of scale, reduced costs in conjunction with rising demand while curtailing undesirable factors—like competing infrastructure—averse to industry growth.33 In sum, regulation accelerated the industry’s growth rate during the middle of the 20th century.
H. The Late 20th Century: Industry Maturation, Oil Shocks, and PURPA
During the 1970s, the industry began to undergo some economic changes. Firstly, as the industry entered the 1970s, the industry no longer achieved the same cost reducing benefits from boosting economies of scale. Figure 2.2 demonstrates how the electric industry’s increasing output beyond 20 billion kWh provided no further cost reductions for the industry at large; the cost curve remained completely flat beyond 20 billion kWh of generated power. Secondly, the two major oil shocks of the 1970s motivated utilities to lobby for the inclusion of fuel costs into customers’ electricity rates in order to attain greater financial security from volatile fuel 30 Brooks, The Periodic Table of the Electric Utility Landscape, 85. 31 Lambert, The Power Brokers, 17. 32 Brooks, The Periodic Table of the Electric Utility Landscape, 87.33 Ibid.

15
expenses.34 Within two decades, fuel costs were included into most utility customers’ rate cases.35 Moreover, during the 1970s, a greater focus on environmentalism and energy security in public policy began to place higher priority in clean and efficient energy generation.36 Then, with the passage of the Public Utility Regulatory Policies Act of 1978 (PURPA), the federal government pushed to end the total monopolization of the power generation part of the electric industry. It sought to promote the development of a “non-utility power sector” comprised of independent power producers competing side by side with utilities.37 PURPA encouraged energy efficiency through the growth of cogeneration facilities as well as other alternative energy sources such as solar power production. Over the past forty years, PURPA has played an essential role in promoting the deployment of small renewable energy production facilities under 80 MW.38
Figure 2.2: Declining Economies of Scale for IOU Industry39
Source: Christensen, L.R. Green.
34 Brooks, "The Periodic Table of the Electric Utility Landscape,” 87. 35 Ibid. 36 Ibid.37 Campbell, Richard J. “Customer Choice and the Power Industry of the Future” Congressional Research Service. September 2014, 1.38 “What is a Qualifying Facility?” Federal Energy Regulatory Commission. 30 June 2016. 39 Christensen, L.R. Green, W.R., 1976. Economies of Scale in US Electric Power Generation. J. Polit Econ 74 (4), 671.

16
I. The 90s: An Era of Industry Restructuring With the introduction of the Energy Policy Act of 1992 and the creation of the Federal Energy Regulatory Commission (FERC) in 1996, the federal government urged states to promote open wholesale market access between states and overall greater levels of competition in the energy utility sector. Throughout the 1990s, 16 states voluntarily embraced this shift toward restructuring and as of 2011, non-utility power producers generated as much as 40% of the electricity consumed in the United States.40 In order to manage and ensure more competition in electricity generation, participating states developed Regional Transmission Organizations (RTOs). RTOs seek to create transparent, non-discriminating and open wholesale electricity markets within its regional interstate service territory. In general, the RTOs have created a system that allows non-utility generators to compete more fairly with IOU owned generation facilities.
Figure 2.3: Regional Transmission Organizations in the U.S.
Source: FERC As a result of these changes, the traditional vertically integrated IOU industry fragmented into two more distinct entities in these 16 states: restructured utilities (an assortment of distribution companies) and retail utilities (which function as 40 Campbell, “Customer Choice and the Power Industry of the Future,” 2.

17
“commodity energy brokers”).41 With the exceptions of California and Texas, the regions most devoted to restructuring have been the Midwest, Mid-Atlantic and New England states. The rest of the country’s IOUs operating in the Southern or Western United States continue to adhere to the age old vertically integrated model pioneered by Insull.
J. Present Challenges for IOUs and with Current Utility Business & Regulatory Model
a. Declining Electricity Use Throughout the 20th century, economic growth heavily relied on substantial amounts of electricity. However, over time, GDP growth has come to be less reliant on electricity use. Between 1975 and 1995, as electricity use declined, the two variables moved in synchrony. Since the beginning of the 1990s, GDP growth steadily surpassed electricity use, which now appears to be flattening to about a 0.9% growth rate. The EIA projects that this will continue to be a long run trend. While this slowdown is partially a result of macroeconomic factors—such as a slowing population growth and outsourcing of heavy industry—it is also a result of improvements in energy efficiency.42 If this trend moves forward in line with the EIA’s estimates, there will likely be less overall demand for electricity in the coming future. This outcome could challenge the IOUs’ current investment and profit making strategies, which heavily rely on state regulators to sign off on the need for such capital spending.
Figure 2.4: Declining Electricity Use Now a Long Term Trend
Source: Energy Information Administration
41 Brooks, "The Periodic Table of the Electric Utility Landscape,” 87-88. 42 “U.S. Economy and Electricity Demand Growth Are Linked but Relationship Is Changing,” U.S. Energy Information Administration. 22 March 2013.

18
b. Societal and Consumer Aims for Energy in 21st Century Over the past forty years, consumer attitudes and public policy have demonstrated greater concern for environmental issues, especially concerning energy production. Changing environmental attitudes continue to create stricter legal and regulatory standards from state and federal governments. Meanwhile, innovative companies are seeking to capitalize from stricter clean energy requirements and growing consumer demand for clean energy. An ongoing survey conducted between 2002 and 2010 by the Natural Marketing Institute’s (NMI) Lifestyles of Health and Sustainability (LOHAS) Consumer Trends Database®, demonstrates that 80% to 90% of consumers contacted in the survey “care about renewable energy.”43 The survey reveals that about 80% of consumers increasingly care about using renewable energy in order to protect the environment. With that said, if given the choice for renewable sources of electricity at a higher price, many consumers in the survey demonstrate a degree of price sensitivity. In 2010, 69% of consumers stated that they “cared about the environment,” but that purchasing decisions were ultimately based on price.44 Twenty-six percent of the consumers said they would willingly pay “$5-$20 extra each month to have some of their power” derived from renewable sources.45 Finally, only 16% of consumers in the survey demonstrated a willingness to “pay more than 20% for products that are produced sustainably or in an environmentally friendly” manner.46 According to these trends, IOUs and state regulators will increasingly face more pressures from consumers and legal standards to simultaneously maintain affordable electricity, while also offering more environmentally friendly forms of electricity. Unfortunately, the IOUs’ outdated business model and regulatory framework may limit its potential to effectively innovate and meet the growing demand of its consumer base. As a result, in localities where utilities and lawmakers fail to cater to this demand, third party companies will attempt—where possible—to meet this demand. In the future, distributed energy resources, when priced appropriately, may play a significant role in the household of consumers. If that is the case, it could pose a significant threat to IOUs’ business model. 43 Bird, Lori and Jenny Sumner. “Consumer Attitudes About Renewable Energy: Trends and Regional Differences,” National Renewable Energy Laboratory, 6. 44 Bird and Sumner. “Consumer Attitudes About Renewable Energy,” 12. 45 Ibid. 46 Ibid.

19
c. Growing Threats: Demand Side Management and Distributed Energy Resources
At the same time the growth of electricity use has leveled out at less than one percent per annum, utility customers have demonstrated greater interest in demand side management through the adoption of energy efficiency appliances, demand response programs and the use of distributed energy resources—such as residential solar panels. Figure 2.5 shows how government standards have forced appliance manufacturers to improve their energy efficiency by more than two-thirds in the past forty years. All of these distributed energy resources and energy efficiency initiatives represent a threat to utilities by reducing its revenue stream.
Figure 2.5: Evolving Energy Efficiency Standards
Source: Energy Information Administration On a societal and consumer basis, many argue that distributed energy resources and demand reduction initiatives—such as energy efficiency improvements, demand side management, distributed rooftop solar systems and residential energy storage systems—have an important role to play in mitigating climate change, reducing pollution and offering cost savings to certain consumers. Many public policies, incentives, subsidies and utility commissions have forced utilities to adopt these measures—even though they run counter to the principle that undergirds their traditional cost of service business model: mass consumption. The industry’s current trend—slowing growth and a declining revenues—serves as a signal that IOUs are facing a growing competitive threat. Some analysts even believe that these distributed energy resources may pose an existential threat to the IOU industry.47 In fact, if we look at the historical credit rating trends of the utility industry 47 Kind, Peter. “Disruptive Challenges: Financial Implications and Strategic Responses to a Changing Retail Electric Business,” Edison Electric Institute, 2013, 11-12.

20
listed in figure 2.6, it becomes apparent that a combination of economic trends, business model and regulatory changes and increased competition over the past few decades have had a depressing impact on the industry’s credit ratings. The arrival of additional competitive forces could further pull down the industry’s credit ratings, raise the cost of capital and reduce “credit availability and investor receptivity to the sector.”48 Since the electric utility industry is such a highly leveraged industry, poor investment grades from ratings agencies could significantly “reduce the industry’s access to low cost capital” that it has relied upon historically to make needed improvements to the grid.49 It could also serve, according to some analysts, as a foreboding signal for worse things to come.
Figure 2.6: IOU’s Historical Credit Ratings
Source: EEI, Standard & Poor’s, Macquarie Capital
In fact, according to a report commissioned by the Edison Electric Institute (EEI)—the IOU industry’s leading think tank and lobby group—the continued growth of distributed energy resources could eventually undermine the strategic and financial viability of the utility business model.50 Under this potential scenario, revenues and profits would decline and credit quality would plummet leading to a higher cost of capital. Higher capital costs would require IOUs to raise retail rates. As more customers reduce their usage or defect from the grid, the utility would have less
48 Kind, “Disruptive Challenges,”, 9-10. 49 Kind, “Disruptive Challenges,” 9. 50 Ibid.

21
customers to cover the costs of its fixed investments. It would have to raise rates to cover these fixed costs and the remaining customers would be required to shoulder a greater burden of the utilities’ investments. Many of these remaining customers would likely react to these growing rate hikes by retrofitting their homes and adopting solar panels as a cost competitive alternative. Some have referred to this phenomenon as the utility industry’s potential “death spiral.”51
Figure 2.7: The So Called Utility Death Spiral
Source: EEI The figure above represents a worst case scenario. While the aforementioned disruption may not unfold with such severity, the IOU industry cannot ignore the threat posed by these competitive forces. To overcome this dilemma, many analysts believe the IOU industry will eventually need to adapt their business models. New business models could permit IOUs to take advantage of new opportunities and to capture new markets and revenue streams that could be a source of profit rather than a disruptive threat. Specifically, some argue that IOUs should compete or offer services that work in line with trends occurring along the consumer side of the distribution meter to prevent such an outcome. This approach would require managers, shareholders and regulators to develop new business models and regulatory frameworks to operate beyond its duty as a commodity provider of centralized power. It would also require the creation of new profit making incentives and scenarios for utilities to enter into the distributed energy market.
51 Kind, “Disruptive challenges,” 11-12.

22
d. Investor Owned Utilities’ Financial Incentives
i. Profit Maximization through Capital Spending and Asset Growth
Ever since the famous Hope Case ruling “invested capital” became the main criterion encouraging IOUs’ investment habits.52 Indeed, utility executives and shareholders have a vested interested to boost capital expenditures as a means to enhance profits since all of these fixed costs are automatically included into the rate base. Here is the ratemaking formula that most utilities still use today:
• 𝑅𝑒𝑣𝑒𝑛𝑢𝑒 = 𝐴𝑠𝑠𝑒𝑡𝑠 ratebase 𝑥𝑅𝑎𝑡𝑒𝑜𝑓𝑅𝑒𝑡𝑢𝑟𝑛 + 𝑂𝑝𝑒𝑟𝑎𝑡𝑖𝑛𝑔𝐸𝑥𝑝𝑒𝑛𝑠𝑒 • 𝐶𝑢𝑠𝑡𝑜𝑚𝑒𝑟𝑅𝑎𝑡𝑒𝑠 = 𝑅𝑒𝑣𝑒𝑛𝑢𝑒 + 𝐹𝑢𝑒𝑙𝐶𝑜𝑠𝑡𝑠53
As you can see, the utilities projected customer rates not only include all of its costs—fixed, operational and variable costs—but also include a predetermined rate of return attached to its capital investments. Because utilities’ capital spending offer a compounded growth in relation to its rate of return, these companies have a perverse incentive to spend on expensive supply side “generation and transmission” projects in lieu of “demand reduction, consumer side initiatives” and other such alternative demand side solutions.54 On the contrary, as our historical overview demonstrates, utilities prefer to invest in projects that boost economies of scale and mass consumption. Between 2003 and 2014, utilities’ capital spending more than doubled and residential rates surged by 40% (see figure 2.8). This is problematic—and some would argue a wasteful allocation of resources—since the benefits associated with increasing economies of scale already reached its limits in the 1970s. While a focus on increasing scale may have been ideal in the early to mid 20th century, this growth strategy is no longer as effective nor ideal in an era that places greater priority on social, environmental and consumer value added factors. In contrast to more competitive sectors, the electric industry’s static business model offers no intrinsic incentive for efficiency or for innovative practices that could produce large benefits to society at large. As will be argued later, the adoption of more distributed energy resources may prevent the need to invest as heavily in such expensive centralized generation facilities and T&D expansion projects.
52 Brooks, "The Periodic Table of the Electric Utility Landscape,” 87. 53 Brooks, "The Periodic Table of the Electric Utility Landscape,” 89. 54 Brooks, "The Periodic Table of the Electric Utility Landscape,” 89-90.

23
Figure 2.8: IOU Industry Capital Spending & Retail Rates
Source: EEI (spending), Department of Energy (prices), The Wall Street Journal
ii. Profit Maximization Through Sales and Revenue Growth Like all businesses, IOUs have an intrinsic incentive to boost its sales. After all, extra sales boost revenue and more revenue—once expenses are deducted—will create a heftier bottom line. However, in the case of utilities, regulators set the rates to meet the utility’s revenue requirement. For instance, using the regulatory principles of a cost of service rate of return, the PUC will attempt to set rates so that gross revenues “equal prudently incurred actual costs for the service proved plus a fair return on invested capital.”55 In setting the rate, regulators typically “work backward”—that is, they start with the “required revenue” amount they seek to achieve and then divide it by the projected quantity of power sales they predict in their forecasts.56 For example, if required revenue is $200 and estimated sales are 1,000 kWh, regulators will set the average rate at 20 cents/kWh.57 After regulators establish the average rate, it tends to stay in place for about “two to five years” before regulators will repeat the procedure.58 However, creating a static regulated rate that endures unchanged for long periods of time “encourages larger sales by utilities and discourages their energy efficiency efforts.”59 Because rates are
55 Fox-Penner, Peter. Smart power: Climate change, the Smart Grid and the Future of Electric Utilities.
Washington (2010), 181. 56 Ibid. 57 Ibid. 58 Ibid. 59 Ibid.

24
set in kilowatts per hour, the more kilowatt hours a utility sells will equate to larger revenues for the company. Therefore, utilities will often attempt to sell beyond the projected quantity estimated by the regulator. After all, more sales will eventually translate into larger profits. Moreover, larger sales, which signals business growth, will also please a company’s investors and shareholders—especially since such growth justifies the need to construct more infrastructure to meet rising demand.60 As a result of this sales incentive, many IOUs tend to dislike distributed energy resources, energy efficiency and other demand reducing entities or initiatives. Consequently, until a utility’s regulation, business model and financial incentives are adapted, utility shareholders and board members may continue to view demand side management, energy efficiency and distributed energy resources as source of competition rather than a business opportunity. 60 Fox-Penner, Peter. Smart power, 183.

25
Chapter 3
Current Industry Structure & Competitive Forces
A. Definition of Investor Owned Utility Electric Industry Today To this day, many IOUs still operate in all segments of the electricity value chain—from generation, transmission, distribution to retail. From the perspective of our analysis, I will refer to this entire value chain—in aggregate or in its separate components—as centralized power. Regardless of the market they operate in, the IOUs—integrated or restructured—in some way shape or form, generate, procure and distribute centralized power to a variety of industrial, commercial and residential end users. The structural analysis of the industry that follows will investigate and highlight the competitive forces emerging outside of the traditional segments of this value chain. It will especially demonstrate how distributed energy resources—represented by photovoltaic solar panels in this analysis—will be playing a significant disruptive role in the IOUs’ market power, industry structure and traditional business model.
B. Structural Analysis of the Investor Owned Utilities
In this current section, I will highlight the competitive forces and disruptive threats emerging against IOUs. Since the 1970s, IOUs faced competition from IPPs seeking to provide non-regulated power mostly to industrial and commercial end users. Now a new wave of competition has emerged in the form of distributed roof top solar companies. Unlike the earlier wave of competition, which focused more widely on industrial and commercial users exploiting cogeneration technology, providers of distributed roof top solar systems include residential end users as one of their primary markets. In the following section, we will look at how distributed solar providers represent competitive entrants into the electricity market by circumventing the utilities relationship with consumers and providing distributed power directly to end users. To analyze this market trend, I will utilize Michael Porter’s paradigm for structural analysis of industries. This analysis will particularly focus on the economic and regulatory factors that raise and lower barriers of entry into state electric markets.

26
i. Threat of Entry into IOUs’ Market According to Porter, the threat of entry in any given industry hinges upon the barriers of entry in place, as well as the organized response from incumbent competitors an entrant may face upon entering into the industry.61 In the analysis that follows, I have added additional variables unique to the electric utility industry to create a more detailed framework specific to the industry under consideration. The main barriers to entry include the following:
a. Economies of Scale As stated earlier in the chapter, IOUs centralized production of power utilizes economies of scale to reduce its average total costs of generating and distributing electricity. However, in general, economies of scale may create both barriers and opportunities for third party solar entrants facing off against incumbent IOUs. Since IOUs operate with scale efficiencies in the production of electricity, the distributed roof top solar industry will face cost challenges against the incumbent IOUs in certain markets across the United States where power prices remain lower than average (see table 3.1). And, generally speaking, the industry will need to incur heavy capital spending requirements to attain the cost benefits of scale. Many vertically integrated IOUs operating in traditionally regulated markets may have retained more cost benefits from scale vis-à-vis restructured IOUs that were forced to divest their generation assets. In general, markets with vertically integrated utilities offer lower rates than utilities operating in competitive markets.62 Therefore, markets with vertically integrated IOUs—whether through price competition or regulatory impediments—will likely retain stronger barriers to entry. These cost barriers will generally be stronger in most—though not all—states in the south, northwest, lower plains and upper plains. While residentially scaled solar does not experience scale efficiencies in the production of electrons, the PV panels used in such markets incur the benefits of scale economies during its manufacturing phase. As the prices of PV modules have declined from increased economies of scales, so too have PV sales and the level of PV installations (see figure 3.1). As solar PV prices continue to decline from technological improvements and scalability, third party solar operators should attract more clients and further build its customer base. This will create competitive pressures in certain markets where consumers have greater financial incentives to
61 Porter, Michael E. Competitive strategy: Techniques for analyzing industries and competitors. Simon and Schuster, 1980, p. 7. 62Johnston, David Cay. “Competitively Priced Electricity Cost More, Studies Show,” The New York Times. 06 November 2007.

27
switch over to a more cost competitive source of electricity—especially in regions that charge end users higher retail rates.
Figure 3.1: Solar Prices & Installation Rates
Source: GTM Research, SEIA Moreover, economies of scale no longer produces cost reduction benefits for IOUs. Since the end of the IOUs “decreasing cost era” by the 1970s, the industry entered into an increasing cost era. Now when a utility builds a new power plant or expands its distribution network, the utility must raise its rates to cover these investments. These rate increases (see figure 2.4 in the previous chapter) may impel some customers to view a distributed solar system as a more cost competitive source of electricity—especially in regions that charge end users higher retail rates.
b. Electricity Retail Rates
Regional electricity retail rates may create significant entry barriers—or opportunities—for third party solar operators seeking to establish beach heads or increase market share in certain markets. Retail rates for electricity vary significantly in the United States. Where utility retail rates are lower than average, solar companies may be much more reliant on government polices to create the financial incentives for residential users to adopt solar panels. Meanwhile, high retail rates create an enormous incentive for third party solar companies to enter into a state’s market. As Christensen Associates highlights, “the ten jurisdictions that offer the highest rate of return when tax incentives are removed

28
are present in states with retail rates that are 42% higher than those of the next ten states.”63 Table 3.1 lists a selected sample of US states ordered by retail price. In a number of states, electricity rates (measured in cents per kilowatt hour) have climbed high enough that adopting solar for residential use has reached a point of grid parity, i.e. the point in which the levelized cost of electricity (LCOE) for distributed solar is less than or equal to the price of centralized grid power. According to a report by Greentech Media, as of 2016, retail pricing in 20 states allow many rooftop PV users to attain grid parity.64 Where local utility rates exceed 15 cents per kilowatt hour, residential solar often becomes price competitive with grid power—granting certain customers the opportunity to save money by producing their own electricity.65 Moreover, if we assume that higher retail rates are correlated with higher wholesale costs, then states with higher retail rates could be appealing for those seeking higher net metering rates—even if the net metering credit offered in some states is pushed below the retail rate. 66 This means that utility companies will most likely face greater competitive threats in these jurisdictions where fundamental pricing trends will impel residential users—even before artificial subsidies are accounted for—to adopt solar panels as a means to save money on their monthly utility bills. 63 Olson, Wayne. “Customer Choice, Solar 3rd-Party Operators, Utility Ratemaking, and the Future of the Electric Distribution Business,” Seeking Alpha. 29 February 2016.64 However, most of these grid parity figures depend on government tax benefits and subsidies (such as net metering). Munsell, Mike. “GTM Research: 20 States at Grid Parity for Residential Solar,” Greentech Media. 10 February 2016.65 Biello, David. "Solar Wars." Scientific American 311.5 (2014): 66-71.66 Olson, Wayne. “Customer Choice.”

29
Table 3.1: Ranking of States with Third Party Solar Operators by Retail Rate67 State 2015
Residential Rate (Cents/kWh)*
DG Solar Capacity (Watts) per capita (2016)
RTO Retail Competition
SolarCity SunRun Vivint Solar
Hawaii 29.61* 237.54 No No Yes Yes Yes
Connecticut 20.91* 46.51 ISO-NE Yes Yes Yes Yes
New York 18.57* 24.13 NYISO Yes Yes Yes Yes
New Hampshire 18.52* 19.77 ISO-NE Yes Yes Yes Yes
Massachusetts 19.81* 84.88 ISO-NE Yes Yes Yes Yes
Vermont 17.07* 88.01 ISO-NE No Yes No No
California 17.02* 93.47 CAISO No Yes Yes Yes
Rhode Island 19.29* 10.51 ISO-NE Yes Yes No No
New Jersey 15.97* 98.63 PJM Yes Yes Yes Yes
Delaware 13.46 57.40 PJM Yes Yes Yes No
Nevada 12.77 53.10 No No No No No
Maryland 13.91 54.59 PJM Yes Yes Yes Yes
Pennsylvania 13.84 12.4 PJM Yes Yes Yes Yes
South Carolina 12.42 1.88 No No No Yes Yes
Texas 11.64 5.42 ERCOT Yes Yes No No
Colorado 11.98 48.38 No No Yes Yes No
New Mexico 12.55 37.94 No No Yes No Yes
Arizona 12.18 98.11 No No Yes Yes Yes
Utah 10.98 20.33 No No No No Yes
Oregon 10.66 18.62 No No Yes Yes No
Washington 9.00 8.14 No No Yes No No Source: Wayne Olson, EIA, US Census As figure 3.2 below demonstrates, states in the Northeast, Southwest and California have electricity rates that significantly exceed this price threshold. Thus far, service areas that have surpassed this electricity rate threshold and/or offer strong solar radiation have seen the largest adoption of solar panels. 67 Olson, Wayne. “Customer Choice”. * These jurisdictions have retail rates at or above 15 cents/kWh, a price point that raises consumers’ incentive to use solar energy instead of utility power.

30
Figure 3.2: Nationwide Electricity Rates by County
Source: US News, Joshua Rhodes, University of Texas at Austin
c. Soft Costs Perhaps one of the biggest cost hurdles third party solar companies must overcome are soft costs. Soft costs are all of the non-hardware costs involved in the development of a solar project. These include financing costs, installation labor, permitting, inspection and interconnection fees, and customer acquisition costs. While China’s massive output of PV panels have significantly pushed down hardware costs, soft costs—accounting for as much as 64% of the total system costs—are now seen as the biggest hurdle in solar deployment.68
68 OfficeofEnergyEfficiency&RenewableEnergy.“SoftCosts,”http://energy.gov/eere/sunshot/soft-costs

31
Although the U.S. Department of Energy Sunshot Initiative’s soft cost program seeks to lower these costs through data analysis, training programs, business innovation and networking and technical assistance to state and local lawmakers, this will be a difficult challenge because of the United States’ “fragmented energy marketplace.”69 In the U.S. “there are over 18,000 jurisdictions and 3,000 utilities” that impose unique “rules and regulations” for solar projects.70 However, greater market growth, competition and more streamlined and standardized rulemaking and regulation could significantly lower these costs. For instance, in 2013, German solar soft costs were $0.33 per watt; at the same time, they were $1.22 per watt in the U.S.—about 3.7 times higher.71 As of the fourth quarter of 2015, total system costs for residential solar systems fell to $3.50 per watt—though soft costs actually rose by 7 percent due to customer acquisition costs.72 Therefore, soft costs are stymying efforts to reduce residential solar system costs and LCOE.73 The DOE’s Sunshot Initiative aims to reduce 69 US Department of Energy. “Soft Costs Fact Sheet,” May 2016. http://energy.gov/sites/prod/files/2016/05/f32/SC%20Fact%20Sheet-508.pdf 70 US Department of Energy. “Soft Costs Fact Sheet,” May 2016. 71 Calhoun, Koben and Jesse Morris. “Can the Cost of Solar in the US Compete with Germany?” Rocky Mountain Institute. 05 December 2013. http://blog.rmi.org/blog_2013_12_05_can_usa_solar_cost_compete_with_germany 72 Gallagher, Ben. “Pricing for Solar Systems in the U.S. Dropped 17% in 2015,” Greentech Media. 15 March 2016. http://www.greentechmedia.com/articles/read/Pricing-For-Solar-Systems-in-the-US-Dropped-17-in-2015 73 The DOE defines the LCOE as “the ratio of an electricity-generation system’s costs to the electricity generated by the system over its operational lifetime, given units of cents/kilowatt-hour (kWh).” A system’s LCOE is “sensitive to installed costs, O&M costs, local solar resource and climate, PV panel orientation, financing terms, system lifetime, taxation and policy.” For more information, see Sunshot Vision Study, 76: http://energy.gov/sites/prod/files/2014/01/f7/47927_chapter4.pdf.
Figure 3.3: Soft Costs for A Typical Solar Installation
Source: Department of Energy

32
residential solar system costs to $1.50 per watt by 2020—mainly by reducing soft costs. If the DOE is successful in this endeavor, the LCOE of solar PV systems in certain jurisdictions could become less than or equal to the LCOE of utility retail rates. This would mean solar systems in such localities would attain grid parity—that is, the cost of generating residential solar would be equal to or cheaper than consuming electricity from the grid. Greater collaboration and cooperation between the private and public sector and federal and local governments could reduce these costs. If so, as system costs decline, more jurisdictions may attain grid parity and residential solar development will accelerate even further. To see how this may play out, figure 3.4 shows how reducing residential system costs from $3.50 per watt to $1.50 per watt could enable jurisdictions in almost all of the lower 48 US states to attain grid parity.74 Therefore, if residential solar soft costs continue to decline, IOUs’ protective barriers may erode at an even faster rate.
Figure 3.4: Residential PV System Costs Reaching Grid Parity
Source: US News, Joshua Rhodes, University of Texas at Austin
d. Product Differentiation Companies attain product differentiation when they possess “brand identification and customer loyalties” from “advertising, customer service, product differences or simply being the first in the industry.”75 Most IOUs—at least at the distribution level—possess a captive market due to their monopolized status. As a result, these distribution utility companies have not had much incentive to offer differentiated energy products or services. Rather, they have merely sold their product to consumers as a commodity. Hence, brand identification stems mostly from its market power and monopoly status, not due to the nature of the product or service rendered.
74 Grid parity estimates often rely on assumptions such as net metering compensation at retail rates and other market enabling incentives like state and federal tax credits. 75 Porter, 9.

33
By contrast, solar companies have a wide range of means to differentiate their product from the commoditized electricity sold by utility companies. Firstly, solar energy produces its electricity from a renewable resource: the sun. The product’s “green” credentials have already won over many environmentalists seeking to consume cleaner forms of energy. Other conservative or libertarian minded consumers celebrate how the product would promote more energy independence and boost self-reliance.76 The introduction of affordable rooftop solar panels, therefore, would please a large group of consumers. While energy storage technologies needed to go “off-grid” are still fairly expensive, there are still consumers seeking to develop micro-grids and community solar projects as a means to limit full reliance upon centralized power. Increasingly, some third party non-utility companies are offering “value added services” to further differentiate their company offerings from incumbent utilities. In the future, we may see both distributed rooftop solar companies and utilities including more “value added” services into their business models as competition along the distribution edge of the grid becomes more intense. However, at the moment, lack of product differentiation is a highlighted weakness of the IOUs that lowers the barriers of entry into the power industry. Third party companies will likely exploit product differentiation in order to attract a customer base seeking clean energy and greater energy independence.
e. Capital Requirements Capital requirements to enter in the power industry have always been high, creating a significant barrier to entry. Utility companies often allocate billions of dollars annually toward capital expenditures, though, as previously mentioned, these costs are recovered when regulators set the electricity rates in each service area. By contrast, non-regulated electricity companies face greater challenges in meeting capital requirements, raising capital and recovering the costs of these investments. As a basis of comparison, SolarCity, a vertically integrated roof top solar company, spent $1.8 billion in capex in 2015.77 Since its IPO in 2011, SolarCity reported growing negative free cash flows. By contrast, in 2015, Con Edison spent $3.2 billion and Southern Co allocated $7.4 billion in capex. In the past five years, Con Edison sustained positive cash flows; Southern Co reported negative free cash flows in the past two years, but, with such large operating cash flows and regulatory protection, the company can afford to take on moderate losses. The graphs below demonstrate how high capital requirements can challenge an industry entrant’s financial health. 76 Biello, 70 77 Financial data in this section obtained from Morningstar.com.

34
Mature companies operating in a stable industry environment, on the other hand, can more predictably and easily translate these capital expenditures into a healthy return on investment. This large capital requirement could give some utility companies a distinct advantage in entering the distributed solar rooftop space. An entrant like SolarCity or SunRun, by contrast, must be willing and able to accept large—and potentially unrecoverable—start-up losses to enter into a new market and compete with an established industry. New entrants assuming loads of debt, reporting negative cash outflows and attempting to take on stable cash flow positive industries like the IOUs would likely require ongoing access to capital markets and favorable government subsidies to stay afloat. These high capital costs combined with fierce competition in the PV solar sector could put additional pressure on margins leading to bankruptcies, mergers and acquisitions and/or greater vertical integration.78,79 As an example, in 2011, Total SA, one of Europe’s largest oil companies, bought a 60% stake of Sunpower Inc.80 As part of the deal, Total offered Sunpower a $1 billion line of credit and with cheaper borrowing costs, it may be able to help Sunpower procure cheaper capital as needed.81 While these capital costs for solar companies seem like an insurmountable burden in the short run, if the residential PV industry potentially consolidates in such a way, the economics of residential solar continues to improve and residential solar assumes larger market share in the generation mix of a utility’s service territory, cash flows and margins could surge into healthier levels. Should this happen, capital outlays could one day become much more manageable for the residential solar industry.
78 Ali-Oettinger, Shamsiah. “More mergers and acquisitions to come,” PV Magazine. 22 July 2015. http://www.pv-magazine.com/news/details/beitrag/more-mergers-and-acquisitions-to-come_100020302/ 79 Groom, Nichola. “Solar company Sungevity to go public in reverse merger,” Reuters. 29 June 2016. http://www.reuters.com/article/us-sungevity-easterlyacquisition-idUSKCN0ZF1HS 80 Herndon Andrew, et al. “Total to Buy 60% of SunPower for $1.38 Billion in Solar Bet,” Bloomberg. 29 April 2011. http://www.bloomberg.com/news/articles/2011-04-28/total-to-begin-friendly-tender-for-up-to-60-of-sunpower-shares 81 Herndon Andrew, et al. “Total to Buy 60% of SunPower for $1.38 Billion in Solar Bet,” Bloomberg. 29 April 2011.

35
Figure 3.5: Capital Expenditures & Financial Performance of Pure Play Residential Solar Companies, USD in Thousands82
82 The emerging rooftop solar industry requires immense capital spending to fuel its growth. However, SolarCity and SunRun have reported negative free cash flows and negative profit margins since their respective IPOs. These companies will continue to rely on further injections of debt and/or equity from capital markets as well as government subsidies while they attempt to expand their market share vis-à-vis utility companies and develop positive cash flows. (Financial data from Morningstar).

36
Figure 3.6: Capital Expenditures & Financial Performance of IOUs, USD in Thousands83
83 These graphs demonstrate how the IOU industry also utilizes heavy capital spending to boost profits. Although utilities worry how widespread distributed solar adoption could undermine the industry’s profitability in the long run, so far their cash flows and margins remain at healthy levels. This financial strength gives IOUs a competitive advantage over its solar competitors. (Financial data from Morningstar).

37
Figure 3.7: EBITDA Comparison of Solar Providers & IOUs, USD in Thousands84
84 Rooftop solar companies’ growing negative EBITDA demonstrates that it suffers problems producing both profit and cash flow. As more customers adopt solar panels, these companies may be able to overcome these financial difficulties. In the meantime, this metric is a further demonstration of the solar industry’s over reliance on capital markets to stay afloat. (Financial Data from Morningstar).

38
f. Switching Costs
Switching costs are defined as one-time costs consumers endure when switching from one product to another. For some, this could include the cost of learning how to use the new system. Since most distributed solar users remain connected to the grid and use centralized power as a secondary source of power, switching costs should be scant. For customers seeking to go off the grid completely—which would require some sort of storage device synced to the solar panels—switching costs would likely be more significant for customers unwilling to deal with this cost. Switching costs could create a barrier in customer acquisition.
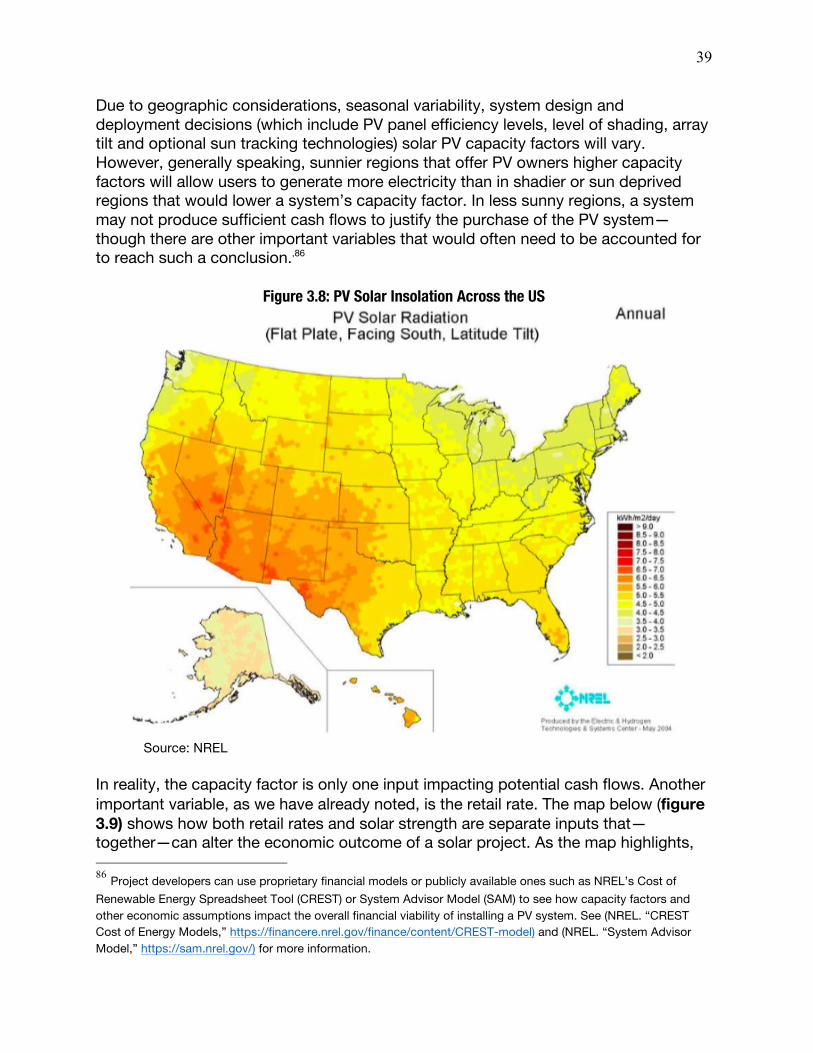
g. Solar Insolation and Capacity Factors Solar electricity produced by a photovoltaic system is an intermittent source of energy—that is, it only generates electricity while the sun shines. Moreover, as a result of geographic sunlight variations, PV systems produce different quantities of electricity in different regions. A map from NREL (figure 3.8) shows the PV solar radiation differentiation in the United States—and even variation between regions within each state. This variation in annual solar irradiance—or solar insolation—can significantly alter how much electricity a solar panel generates over the course of its productive lifespan. Since many PV owners receive financial compensation for the electricity they generate, this variation in solar irradiance can alter the financial performance of a PV system. Using a financial model, analysts can estimate the cash flows a PV system will produce over the course of its economic lifespan. One of the project performance assumptions an analyst can manipulate in the model is the system’s capacity factor. The capacity factor is a ratio that measures the amount of electricity a plant produces divided by the total amount of electricity it could have produced if it were hypothetically running 100% of the time over the course of a year. Basically, generating technologies with higher capacity factors have the capacity to generate more electricity during the course of a year.
• 𝐶𝑎𝑝𝑎𝑐𝑖𝑡𝑦𝐹𝑎𝑐𝑡𝑜𝑟 = DEFGHIJKLMNOPGEQPMQNRQHNJKLMQNRQHNHFNHFQPOGFMGF×TUVWLOGNXMQNRQHN
Table 3.2: Average Capacity Factors for Generation Technologies85 Plant Type Capacity Factor (%) Dispatchable Technologies Combined Cycle Gas Turbine 87 Advanced Nuclear 90 Geothermal 91 Non Dispatchable Technologies Wind 42 Solar PV 26
Source: EIA
85 Table 3.2 shows that solar PVs have a lower capacity factor in relation to other generation technologies. However, a solar panel that can store its surplus energy for later use would have a higher capacity factor. If manufacturers can reduce the cost of batteries, the economics of solar would become even more attractive.
39
Due to geographic considerations, seasonal variability, system design and deployment decisions (which include PV panel efficiency levels, level of shading, array tilt and optional sun tracking technologies) solar PV capacity factors will vary. However, generally speaking, sunnier regions that offer PV owners higher capacity factors will allow users to generate more electricity than in shadier or sun deprived regions that would lower a system’s capacity factor. In less sunny regions, a system may not produce sufficient cash flows to justify the purchase of the PV system—though there are other important variables that would often need to be accounted for to reach such a conclusion.,86
Figure 3.8: PV Solar Insolation Across the US
Source: NREL
In reality, the capacity factor is only one input impacting potential cash flows. Another important variable, as we have already noted, is the retail rate. The map below (figure 3.9) shows how both retail rates and solar strength are separate inputs that—together—can alter the economic outcome of a solar project. As the map highlights, 86 Project developers can use proprietary financial models or publicly available ones such as NREL’s Cost of Renewable Energy Spreadsheet Tool (CREST) or System Advisor Model (SAM) to see how capacity factors and other economic assumptions impact the overall financial viability of installing a PV system. See (NREL. “CREST Cost of Energy Models,” https://financere.nrel.gov/finance/content/CREST-model) and (NREL. “System Advisor Model,” https://sam.nrel.gov/) for more information.

40
California and Hawaii have both high retail rates and high solar insolation. Many areas in the southwest have lower retail rates. However, this is offset by the region’s strong annual solar irradiance and higher capacity factors. The northeast region is reversed; the retail rates are high and insolation levels are low. In these jurisdictions, PV systems can often produce sufficient cash flows in spite of the lower capacity factors. Finally, while Alaska has expensive retail rates, the state’s extremely low solar insolation levels pushes down the capacity factor for PV system. This would likely reduce the economic viability of solar in Alaska and help explain why Alaska has virtually no installed distributed solar capacity in the state. Hence, jurisdictions with extremely low solar irradiance can be a potential barrier for solar development.
Figure 3.9: Solar Insolation & Retail Rates Shape the Economics and Finance of Solar Systems
h. Key Government Policy Drivers Stimulating Residential Solar PV Markets Government policies have the power to reinforce or reduce barriers to entry to any given industry—especially highly regulated industries such as the electricity sector. For most of the 20th century, government regulation has greatly benefited the IOU industry. However, in the past 30 years, federal and state governments have designed standards and encouraged the development of renewable electricity. Some of these regulatory changes have also forced the utilities to slightly modify their business practices and have opened up the electricity sector to greater levels of competition.

41
In the following sections, I will enumerate and explain the most important government policies that have encouraged the development of the distributed PV solar market. h.1 Net Metering & Interconnection Standards Another potential market barrier to entry for any business is the need to access distribution channels to deliver its product.87 As it turns out, residential solar markets depend on access to a utility’s distribution network because most homeowners with solar panels can receive compensation for their surplus electricity through an arrangement made with their local utility companies. Through a policy known as net energy metering (NEM), owners of rooftop solar panels who receive authorization from their utility can connect their solar panels to the utility’s local distribution system. Through the NEM arrangement, a bidirectional meter is installed at the end user’s residence that measures both the inflows of grid power and outflows of surplus solar electricity sent back to the grid. During the course of each billing period, customers only pay for the net amount of electricity consumed at that time. For customers that produce ample solar power, this means they can, at times, “zero-out their utility bill.”88 During especially productive billing periods, they can even produce surplus power, which can then be credited toward future billing periods.89 While owners of rooftop solar panels—so long as they have ample storage capabilities—could in theory produce their own electricity off the grid all of the time—most potential consumers would need access to the grid and NEM in order to even make the investment a viable option.90 For this reason, quick and affordable interconnection to the grid—without debilitating red tape—and the capacity to sell net excess generation (NEG) through NEM to local distribution utilities is arguably the key market-enabling policy driver for residential solar markets.91,92 While 41 states offer NEM, the terms, limits and stability of NEM policy vary in each state and these variations impact the effectiveness of the NEM program as an market enabling tool. Interconnection best practices and standards also vary significantly. Historically, states that have had fewer NEM restrictions and laxer interconnection standards have developed more robust residential solar markets. 87 Porter, 10. 88 California Energy Commission & CPUC. “Net Energy Metering in California,” http://www.gosolarcalifornia.ca.gov/solar_basics/net_metering.php 89 Biello, 68 90 Due to high costs, battery storage technologies are too expensive for most residential solar users. 91 Interconnection is defined as the “technical rules and procedures allowing customers to plug into the grid.” Some states and municipalities have more onerous procedures to connect to the grid. These interconnection delays significantly raise the solar system’s soft costs. See www.freeingthegrid.org for more details. 92 Steward, D and E. Doris. “The Effect of State Policy Suites on the Development of Solar Markets,” National Renewable Energy Laboratory. November 2014.

42
h.2 Economics of Net Energy Metering Many customers, attracted by the prospect of lower monthly utility bills via net metering, have signed solar leases or loans with companies such as SolarCity or Vivint. Either way, NEM plays a crucial role in the economics of solar leases and loans. Without the financial benefit provided by NEM, many consumers would be unwilling or unable to adopt rooftop solar panels. In fact, 99% of the 1,957 MW of installed residential PV systems in the U.S. during 2015 were net metered, which seems to indicate the importance of the policy in enabling consumers to afford the investment.93 Alternatives to net metering—such as utility-owned residential programs and solar tariffs—represented less than 1% and almost 1% of installations, respectively.94 Until these emerging alternatives or other experimental policies, incentives or programs come to fruition, NEM will continue to be the most pertinent market enabling tool—especially when working in tandem with other policies and incentives. The Interstate Renewable Energy Council (IREC), one of the contributors at freeingthegrid.org, defines NEM as the “billing arrangement by which customers realize savings from their systems where 1kWh generated by the customer has the exact same value as 1kWh consumed by the customer.”95 In practice, compensation rates vary. According to the Database of State Incentives for Renewables & Efficiency (DSIRE), only 11 states firmly compensate net excess generation (NEG), at the retail rate.96 However, in total, about 32 states compensate net excess generation at or near the retail rate. Another 21 states initially remunerate NEG at the retail rate, however, NEG credits rolled over for the following months eventually expire or are reduced to the utility’s avoided cost.97 Currently, nine states compensate below the retail rate—though with the utility industry’s antipathy toward NEM policies, this number may grow. Until recently, the current top ten states ranked by installed residential solar capacity all had stable NEM policies with NEG compensated at retail rates. In the past year, Hawaii and Nevada—ranked number 1 and number 9 in installed watts per capita of distributed generated solar energy respectively—both drastically changed their NEM policies. Hawaii cancelled its NEM program. Although Hawaii is projected to install 105 MW of residential solar in 2016—a 57% increase from the previous year—many of these projects are merely delayed interconnections in the pipeline from the previous
93 “2015 Solar Market Snapshot,” Smart Electric Power Alliance. Accessed 1 July 2016. https://www.solarelectricpower.org/discover-resources/solar-tools/2015-solar-power-rankings.aspx 94 “2015 Solar Market Snapshot,” Smart Electric Power Alliance. Accessed 1 July 2016. 95 Freeing the Grid. Accessed 31 June 2016. http://freeingthegrid.org/ 96 DSIRE. “Customer Credits for Monthly NEG Under Net Metering,” Accessed 1 July 2016. http://ncsolarcen-prod.s3.amazonaws.com/wp-content/uploads/2016/01/NEG-1.2016.pdf 97 DSIRE. “Customer Credits for Monthly NEG Under Net Metering.”

43
year still qualifying for the NEM.98 Since the state dismantled its NEM program, solar companies have shed 39% of its workforce.99 The number of permits issued in the state in June 2016 fell by 42% compared to the previous year.100 In fact, the Hawaii Solar Energy Association (HSEA) claims that “unless the Hawaii PUC approves a motion filed by the HSEA to increase the cap on a new program that replaced net metering,” the state’s solar industry will likely continue to deteriorate.101 Meanwhile, Nevada’s PUC will incrementally triple net metered users’ monthly grid access fee and will gradually reduce NEG compensation to the state’s wholesale rate—approximately 2 cents per kilowatt hour—over the next twelve years.102 For means of comparison, Nevada’s average retail rate in 2015 was around $0.12 cents per kilowatt hour. Table 3.3 shows Nevada’s net energy metering rate change forecast.
Table 3.3: Southern Nevada Net Metering Rate Change Forecast Date Grid Access Fee Retail Rate Excess Energy Credit Prior rate $12.75 $0.11 $0.11 Jan 1 2016 $17.90 $0.11 $0.09 Jan 1 2019 $23.05 $0.10 $0.07 Jan 1 2022 $28.21 $0.10 $0.05 Jan 1 2025 $33.36 $0.10 $0.04 Jan 1 2028 $38.51 $0.10 $0.02
Source: NV Energy In general, before accounting for incentives, the cost of a residential solar PV system ranges between $0.25 to $0.30 cents per kilowatt hour.103 Federal and state tax incentives and subsidies tend to push the system cost down to around $0.15 cents per kilowatt hour.104 Without the cash flow benefits of retail rated net metering, solar
98 Walton, Robert. “Hawaii Solar Sector Braces for Job Losses after Net Metering Decision,” Utility Dive. 29 March 2016. http://www.utilitydive.com/news/hawaii-solar-sector-braces-for-job-losses-after-net-metering-decision/416417/ 99 Shimogawa, Duane. “Large majority of Hawaii solar companies reporting job losses,” Pacific Business News. 06 July 2016. http://www.bizjournals.com/pacific/news/2016/07/06/large-majority-of-hawaii-solar-companies-reporting.html 100 Shimogawa, Duane. “Oahu solar energy industry continues to cool down,” Pacific Business News. 05 July 2016. http://www.bizjournals.com/pacific/news/2016/07/05/oahu-solar-energy-industry-continues-to-cool-down.html 101 Shimogawa, Duane. “Large majority of Hawaii solar companies reporting job losses.” 102 “Southern Nevada 12-Year Net-Metering Rate Change Forecast” NVEnergy. Accessed 05 July 2016. https://www.nvenergy.com/renewablesenvironment/renewablegenerations/NetMetering.cfm?utm_source=nve_frontpage&utm_medium=banner&utm_content=net-meter-rates&utm_campaign=net-meter-ratesFP 103 Martin, Richard. “Battles Over Net Metering Cloud the Future of Rooftop Solar,” MIT Technology Review. 05 January 2016. https://www.technologyreview.com/s/545146/battles-over-net-metering-cloud-the-future-of-rooftop-solar/ 104 Martin, Richard. “Battles Over Net Metering.”

44
systems in regions with retail rates lower than $0.15 cents per kilowatt hour will generally offer a poor return on investment.105 With net metering compensated at retail rates, Nevada’s residential solar installations grew by 600% in 2014 and 2015. Since the PUC’s policy change, installation rates are projected to shrink by 73%.106 According to Bloomberg, Nevada’s new regulations “not only make it more expensive to go solar, but also make it uneconomical for those who have already signed up.”107 Put simply, for most residential rate payers in Nevada, the cost of solar panels is now no longer financially viable. This explains why all the major rooftop solar companies immediately abandoned Nevada’s market after the PUC ruling.108 Under the right set of circumstances, NEM can allow owners of solar energy systems to recoup the cost of their investments. However, the lifetime revenue potential and speed of cost recovery for the system heavily depends on two variables: how much electricity is produced and how much the customer is paid for the excess generation.109 I already discussed the first variable (the capacity factor) in the previous section. The second variable (the credited NEM rate) depends on the retail rate of the state and on the compensation rate awarded for the NEG. Both of these factors vary by state and can have an enormous impact on the lifetime revenue potential, internal rate of return and net present value of a residential solar PV investment. As you can see in table 3.4, historically the states with the most installed solar capacity mostly had stable NEM programs credited at the retail rate for many years. While other supportive policy factors and non-policy factors (such as the capacity factor) also play a significant role in enabling solar markets generally and in increasing the lifetime revenue potential from net metering more specifically, for over several years the top ten states ranked by installed residential solar capacity all had stable NEM policies with NEG compensated at retail rates. As we have seen in the case of Nevada, these NEM credits play a crucial role in making solar an attractive investment in states that have lower retail rates. Although reducing the compensation rate would raise barriers to entry for solar companies in all of the states with retail rated NEM, lower compensation would have a much more pronounced effect in states with lower retail rates.
105 Ibid. 106 Bromley, Hugh et al. “2016 US PV Market Outlook,” 06 June 2016. Bloomberg New Energy Finance. 107 Buyahar, Noah. “Who Owns the Sun?” Bloomberg Businessweek. 28 January 2016. 108 Buyahar, Noah. “Who Owns the Sun?” 109 To analyze all of the variables and financial assumptions involved in the lifetime revenue potential calculation from net metering, see Steward D and E. Doris, “The Effects of State Policy Suites on the Development of Solar Markets,” NREL, 2012, 21-25.

45
Table 3.4: NEM Rates in Top 10 DG Markets by Per Capita Installations, 2016
Rank State Net Metering Rate 2016
Average Retail Price (Cents per Kilowatt Hour) 2015
Total Distributed Solar PV Installed (Watts) Per Capita 2016
1 Hawaii Suspended* 29.61 273.54
2 New Jersey Retail Rate 15.97 98.63
3 Arizona Retail Rate† 12.18 98.11
4 California Retail Rate 17.02 93.47
5 Vermont Retail Rate 17.07 88.01
6 Massachusetts Less than retail rate** 19.81 84.88
7 Delaware Retail rate† 13.46 57.40
8 Maryland Retail Rate† 13.91 54.59
9 Nevada Less than retail rate*† 12.77 53.10
10 Colorado Retail Rate† 11.98 48.38 Source: (DSIRE, EIA, U.S. Census) * Previously compensated at retail rate. ** Varies by customer class h.3 Will Clashes Over Net Metering Undermine the Future of Residential Solar? Recently, many IOUs have been concerned that the rapid rise of net energy metered solar customers will undermine their efforts to recover costs for their companies’ fixed investments. These IOUs claim that net metered customers utilize the distribution network without adequately paying for these fixed costs as estimated by their cost of service ratemaking models. In response to these concerns, over the past year about half of the US state PUCs—at the behest of IOUs—ordered studies in order to consider changing their states’ existing NEM policies.110 The list of possible changes111 presently under consideration include:
o The implementation of monthly grid access fees. Monthly grid access fees could permit utilities to hedge against revenue losses caused by their rooftop solar customer’s load defection and to cover the fixed costs of its distribution network. However, large monthly fees, could undercut the economic viability of solar adoption.
† States with retail rates below 15 cents per kilowatt-hours tend to be more reliant on retail rated NEM to bolster their solar markets. 110 Meyers, Glenn. “Changing Net Metering Policies Being Studied In Over Half of US States,” Clean Technica. 16 November 2015. http://cleantechnica.com/2015/11/16/changing-net-metering-policies-studied-half-us-states/ 111 Mints, Paula. “Notes from the Solar Underground: The US Utility War against Net Metering,” Renewable Energy World. 23 February 2016. http://www.renewableenergyworld.com/articles/2016/02/notes-from-the-solar-underground-the-us-utility-war-against-net-metering.html

46
o Reducing the remuneration rate for net excess generation to the utility’s avoided cost (i.e. wholesale rate). Until an alternative compensation scheme for net excess generation is considered, slashing the compensation rates from retail rates to wholesale rates will hamper the growth of many residential solar markets.
o The adoption of demand charges or time of use rates. Lower compensation for off peak rates and higher prices during peak hours could undermine the economic benefits to net metered solar customers.112
o Ending net metering programs or upholding service territory’s net metering cap.113 As states approach the stated net metering caps in their service territories, utilities may press regulators to uphold the cap rather than raise it. Other states that experience rapid growth may pause or cancel their net metering program in order to maintain “grid stability.”114 This could impede further residential solar market growth by eroding the arrangement that made such investments financially viable in the first place.
112 Mints, Paula. “Notes from the Solar Underground.” 113 For recent figures on net metering caps by state, see Barnes, Justin and Rusty Haynes, “The Great Guessing Game: How Much Net Metering Capacity is Left?,” EQ Research. September 2015. http://eq-research.com/blog/the-great-guessing-game/ 114 Smith, Rebecca and Lynn Cook. “Hawaii Wrestles with Vagaries of Solar Power,” The Wall Street Journal. 28 June 2015. http://www.wsj.com/articles/hawaii-wrestles-with-vagaries-of-solar-power-1435532277

47
Some states with high residential solar penetration have already started to implement some or a combination of these policies ostensibly to recoup revenue losses from load defection. In 2015, twenty seven states in all contemplated potential changes to net metering compensation arrangements.115 Meanwhile, “sixty-one utilities in 30 states proposed monthly fixed charge increases and twenty-one utilities in 13 states propose new or increased existing charges specific to rooftop solar customers.”116 Overall, for both the distributed solar industry and the IOU industry, changes—or the lack thereof—in net metering represent a risk to their businesses—though especially for rooftop solar companies dependent on third party leasing and loan schemes. Until another alternative mechanism with widespread appeal can replace the market enabling function of NEM, government regulation over net metering policies will continue to be a contentious issue between IOUs and solar advocates. PUCs—or in some cases state legislatures—regularly have the power to alter net metering quotas and compensation levels. The decisions made by policymakers or regulatory bodies of each state could raise or lower barriers to entry by voting against or in favor of net metering. h.4 Interconnection Standards In accordance with guidelines set by state PUCs, distribution utilities need to analyze and provide an approval to new renewable electricity generators that enter into their service territory. IOUs decide which generators may or may not connect to their distribution network and what conditions they must meet to achieve interconnection. These procedures can create substantial barriers to entry for those seeking to install
115 Trabish, Herman K. “5 maps that show where the action is on solar policy,” Utility Dive. 22 March 2016. http://www.utilitydive.com/news/5-maps-that-show-where-the-action-is-on-solar-policy/415938/ 116 Trabish, Herman K. “5 maps that show where the action is on solar policy.”
Figure 3.10: State Changes to NEM Polices
Source: Wall Street Journal, GTM Research, SEIA

48
distributed energy systems. In cases where interconnection regulations “are unclear, or where redundant or unnecessary tests or steps are piled on the existing national standards, the results can be costly.”117 As a result of these varying standards, where some utilities take as little as one week to connect a solar system to their grid, others take well over two and a half months.118 Where such conditions exist, soft costs will be higher and serve as a stronger barrier to entry for residential solar systems.119,120
Figure 3.11: Interconnection Standards by State
Source: Center for Biological Diversity, IREC, DSIRE, Freeingthegrid.org h.5 Federal Tax Credit The solar investment tax credit (ITC) is one of the main federal policy instruments currently stimulating solar development in the United States. The Energy Policy Act of 2005 instituted a 30 percent ITC for commercial and residential solar projects ordered between January 1st 2006 and December 31st 2007. In 2008, Congress extended the ITC for an additional 8 years as part of an agreement reached in the Emergency Economic Stabilization Act. Most recently, in December 2015, Congress further extended the ITC to December 31st 2022. Under the auspices of the Consolidated
117 See http://freeingthegrid.org/#education-center/interconnection/ 118 Bogage, Jacob. “Study: Pepco is the country’s worst utility at connecting solar power,” The Washington Post. 21 July 2015. https://www.washingtonpost.com/news/energy-environment/wp/2015/07/21/study-pepco-is-the-countrys-worst-utility-at-connecting-solar-power/ 119 For a detailed national comparison of interconnections standards by state, visit http://freeingthegrid.org. 120 Marcacci, Silvio. “Solar Interconnection Delays Cost Americans Millions—Here’s How We Solve Them,” Clean Technica. 12 August 2015. http://cleantechnica.com/2015/08/12/solar-interconnection-delays-cost-america-millions-heres-solve/

49
Appropriations Act, the 30% credit will slowly wind down incrementally starting in 2020 to 26% until settling to 10% in 2022. After 2022, the rate will linger at 10% for commercial projects—though the tax credit will no longer apply to residential installations. Assuming there are no more future extensions, the tax credit phase out will proceed as follows:
Table 3.5: Solar Investment Tax Credit Time Horizon121 Year 2016 - 2019 12/31/20 12/31/21 12/31/22 Future
Years* Solar ITC Rate
30% 26% 22% 10% 10%
Source: Department of Energy *ITC only available for commercial projects after 2022. For the residential solar market, these tax credits are awarded to homeowners who purchase the solar panels. For those who sign solar lease agreements with third party providers like SolarCity, “banks like Goldman Sachs Group Inc and J.P. Morgan Chase & Co.” receive the tax credits because they are the institutions who finance those installations.122 In either case, whether they are the homeowners or financial institutions, the equity holders assume the most risk in undertaking any investment. The ITC and other tax incentives—such as accelerated depreciation—allow equity investors to more quickly recover the cost of their investment, increase cash flows and increase the investments’ rate of return. Since equity investors assume the most risk in any project, tax incentives can offer attractive rewards that encourage these investors to assume more risk. The graph below (figure 3.12) shows how solar installations dramatically expanded by “a compound rate of 76 percent” since 2006.123 For over 10 years, the ITC has been one of the main engines stimulating the boom in solar investments. According to Christensen Associates Energy Consulting, the ITC “accounts for 40% to 50% of solar developers net profits on residential installations.”124 Consequently, it will continue to be a pivotal policy driver boosting rooftop solar installations going into the next decade. The policy’s long extensions and gradual rate declines will provide ongoing stability and predictability for investors and the market as a whole.
121 Department of Energy. “Business Energy Investment Tax Credit,” Accessed 05 July 2016. http://energy.gov/savings/business-energy-investment-tax-credit-itc 122 Sweet, Cassandra. “Wind, Solar Companies Get Boost From Tax-Credit Extension,” The Wall Street Journal. 16 December 2015. 123 Martin, Richard. “Tax Credit Extension Gives Solar Industry New Boom,” MIT Technology Review. 28 December 2015. https://www.technologyreview.com/s/544981/tax-credit-extension-gives-solar-industry-a-new-boom/ 124 Morey, Mathew, et al. “Retail Choice in Electricity: “What Have We Learned in 20 Years?,” Christensen Associates Energy Consulting. 11 February 2016., p. 9.

50
Figure 3.12: ITC Stimulates Annual Solar Installations
Source: SEIA h.6 Renewable Portfolio Standards & Solar Carve Outs Across the United States, renewable portfolio standards (RPS) have played a substantial role in meeting renewable energy development goals. These state-wide directives force utilities to include a certain percentage or level of renewable power into their generation and/or distribution portfolio. While RPSs have helped stimulate solar development throughout the US, RPS requirements vary within each state. In all, 29 states have firmly committed to binding RPS standards; eight others have established non-binding renewable energy goals. Of the 29 states in the former category, 21 states included explicit solar or distributed generation (DG) carve-outs within their RPS requirements to nurture solar and/or DG markets in these states. Certain states with solar carve outs have even developed tradable Solar Renewable Energy Credit (SREC) markets where utilities can meet their RPS requirements by purchasing the energy produced from non-utility owned solar generators.125 States with more demanding RPS requirements can create more robust market opportunities for residential solar developers. Table 3.6 enumerates all of the RPS requirements for each state.
125 Edge, Ryan and Erika H. Myers. “Solar Fundamentals Volume 2: Markets,” SEPA. 2015. https://www.solarelectricpower.org/media/395320/Solar-Fundamentals-Vol-2.pdf

51
Table 3.6: Renewable Portfolio Standards Policies State Total
RPS Deadline Solar/DG
Carve-Out State Total
RPS Deadline Solar/DG
Carve-Out AZ 15% 2025 4.5% DG by
2025 ND* 10% 2015 -
CA 33% 2020 - NH 24.80% 2025 0.3% by 2014 CO 30% 2020 3% DG, 1.5%
customer sited by 2020
NJ 20.38% 2020 4.1% by 2028
CT 27% 2020 - NM 20% 2020 4%, 0.6% DG by 2020
DC 25% 2020 2.5% by 2023 NV 25% 2025 1.5% by 2025 DE 100% 2026 3.5% PV by
2026 NY 29% 2015 0.58%
customer sited by 2015
HI 100% 2045 - OH 12.50% 2026 0.5% by 2027 IA 105 MW OK* 15% 2015 - IL 25% 2026 1.5% PV,
0.25% DG by 2026
OR 25% 2025 20MW PV by 2020
IN* 10% 2025 - PA 18% 2021 0.5% PV by 2021
KS* 20% 2020 - RI 14.50% 2019 - MA 15%
(new) 6.03% (existing)
2020 2016
400 MW PV by 2020
SC* 2% 2021 0.25% DG by 2021
MD 20% 2022 2% by 2020 SD 10% 2015 - ME 40% 2017 - TX 5,880
MW 2015 -
MI 10% 2015 - UT* 20% 2025 - MN 27% 2025 1.5%, 0.15%
DGPV by 2020 VA* 15% 2025 -
MO 15% 2021 0.3% by 2021 VT 75% 2032 1% DG by 2017 + 0.6% per year until 2032
MT 15% 2015 - WA 15% 2020 2 MW DG NC 13% 2021 0.2% by 2018 WI 10% 2015 -
Source: SEPA, 2015 *Non-binding DG = Distributed Generation

52
h.7 Third Party Ownership Seventy-two percent of the 1.2 GW of residential solar panels installed in 2014 were third party owned.126 Third party ownership (TPO)—otherwise known as third party financing—utilizes two different financing methods: a leasing method and a power purchasing agreement (PPA) method.127 A residential end user can decide to enter into a leasing agreement and pay for the use of a rooftop PV system or sign a PPA where the user pays a fixed rate (typically less than the local utility’s retail rate) for the electricity produced on a monthly basis.128 Regulations that prohibit or promote third party ownership can significantly impact the growth potential of a state’s residential solar market. Currently, the legal status of TPO is unclear in twenty states, which leaves solar installers and third party financiers susceptible to regulatory risk.129 In seven other states PUCs and/or legislatures have established legal barriers against third party-ownership. Many of the states that have explicitly legalized TPO are also those states with high levels of solar installations.
Figure 3.13: Map of Third Party Ownership (TPO) Regulations
Source: Center for Biological Diversity, DSIRE While third party-owned residential solar projects are projected to lose market share to loan-based customer owned solar systems in the next four years, it is still projected
126 Munsell, Mike. “72% of US Residential Solar Installed in 2014 Was Third-Party Owned,” Greentech Media. 29 June 2015. http://www.greentechmedia.com/articles/read/72-of-us-residential-solar-installed-in-2014-was-third-party-owned 127 Greer, Ryan. “Throwing Shade: Ten Sunny States Blocking Distributed Solar Development,” Center for Biological Diversity. April 2016. 128 “Third-Party Solar Financing,” SEIA. Accessed 09 July 2016. http://www.seia.org/policy/finance-tax/third-party-financing. 129 Greer, Ryan. “Throwing Shade,” Center for Biological Diversity. April 2016.

53
to account for 46% of residential solar financing methods in 2020—making it an especially important financing method for consumers lacking the means to purchase and own their own solar panels.130 In sum, the regional legal status of third party ownership will not only significantly impact barriers to entry for third solar installers and financiers but also the rate of residential solar installations.
h.8 Community Solar According to statistics from NREL, about fifty percent of all companies and homes are prevented from installing solar panels due to “ownership, space or shading limitations.”131 Another more conservative NREL figure focused solely on the residential market purports that only “fifteen percent of residential rooftops are suitable for solar.”132 In order to serve the demand for this underserved portion of the market, certain states have created laws giving rise to community or shared solar power programs. Shared solar programs permit a group of utility end users to individually purchase a stake of a community solar project. Much like customers with rooftop solar panels, these individuals receive credits for electricity that is produced and sent back to the grid. Generally, through a mechanism known as virtual net energy metering, customers receive credits for their bills in proportion to their share of the generated power.133 Presently, only 14 jurisdictions (including D.C.) have enacted concrete rules promoting community solar development. However, as figure 3.14 demonstrates, 24 states are greenlighting utility-led community solar programs, though many of these are pilot programs or still under development. Community solar programs have the potential to create a substantial distributed solar market wedged between the residential and utility-scaled markets.134 In fact, reports by Greentech Media and Navigant Research predict that the U.S. community solar
130 Munsell, Mike. “72% of US Residential Solar Installed in 2014 Was Third-Party Owned,” Greentech Media. 29 June 2015. http://www.greentechmedia.com/articles/read/72-of-us-residential-solar-installed-in-2014-was-third-party-owned 131 Pyper, Julia. “PG&E Launches Community Solar Program Enabling Customers to Go 100% Renewable,” Greentech Media. 05 February 2016. https://www.greentechmedia.com/articles/read/pge-launches-community-solar-program-enabling-customers-to-go-100-renewable 132 Trabish, Herman K. “Community-Owned Solar Creates a New Business Model in Massachusetts,” Greentech Media. 21 January 2014. https://www.greentechmedia.com/articles/read/How-Virtual-Net-Energy-Metering-Attracts-Money-to-Solar-in-Massachusetts 133 Farrell, John. “Updated: States Supporting Virtual Net Metering,” Institute for Local Self-Reliance. 04 November 2015. https://ilsr.org/virtual-net-metering/ 134 Sweet, Cassandra. “Solar-Power Sharing Programs May Be Poised to Take Off,” The Wall Street Journal. 13 September 2015. http://www.wsj.com/articles/solar-power-sharing-programs-may-be-poised-to-take-off-1442197726

54
market may reach an installation capacity of between 500 MW135 and 1.5 GW136 by 2020. Compared to residentially scaled solar, community solar may also seem more attractive due to the cost benefits it will deliver through economies of scale. Nevertheless, in states where community solar rules are unclear or non-existent, market opportunities may be limited—especially for companies operating under the TPO business model.
Figure 3.14: Community Solar Policies & Programs
Source: SEPA, Vote Solar, NCCETC and Meister Consultants Group II. Conclusion: Residential Solar Market Potential by State Using the variables and drivers mentioned in the previous sections, analysts can forecast which states will possess greater potential for distributed solar installations. In general, there are three main drivers that stimulate a solar market: retail prices, solar insolation and aggregated policy drivers.137 The interaction of these three set of variables vary in each state, and, as a result, market outcomes will also vary by state. In general, the market potential of residential solar is more likely to be robust where a “suite of market enabling policies and incentives exist alongside other non-policy 135 Munsell, Mike. “US Community Solar Market to Grow Fivefold in 2015, Top 500MW in 2020,” Greentech Media. 23 June 2016. http://www.greentechmedia.com/articles/read/us-community-solar-market-to-grow-fivefold-in-2015-top-500-mw-in-2020 136 Meza, Edgar. “US Community Solar Programs Could Reach 1.5 GW by 2020,” http://www.pv-magazine.com/news/details/beitrag/us-community-solar-programs-could-reach-15-gw-by-2020_100024178/ 137 Edge, Ryan and Erika Myers. “Solar Fundamentals, Volume 2: Markets,” Solar Electric Power Association. 2015. https://www.solarelectricpower.org/media/395320/Solar-Fundamentals-Vol-2.pdf

55
enabling factors” i.e. the presence of high retail rates and/ or high solar insolation rates.138 The map below, figure 3.15, demonstrates where these market enabling factors have successfully converged to create the strongest markets: predominantly in the West, Southwestern and Northeastern United States. Due to a combination of lower retail rates and an unfavorable policy environment most of the states in the South, Central and most of the Northwest offer poor market conditions for residential solar developers—even in regions with high solar insolation such as the Deep South.
Figure 3.15: Residential Solar Market Potential by State
Source: SEPA 138 Steward, D and E. Doris. “The Effect of State Policy Suites on the Development of Solar Markets,” National Renewable Energy Laboratory. November 2014.

56
Chapter 4
IOUs Current Strategic Reactions (Case Studies)
As growing distributed solar installations threaten utilities’ top and bottom lines, some utilities have already started to institute business strategies to ward off this competitive threat. The strategies vary. Although most utility leaders agree that strategic changes will be necessary to prevent DERs from disrupting the industry, there is little overall consensus on what strategic changes will be needed. In this chapter, we will look at the changes that have been promoted or adopted thus far. We will break down our analysis into two groups: vertically integrated IOUs and distribution utilities in restructured markets. In each of these sections we will look at how IOUs in these markets have reacted to the threat—or perceived threat—of residential solar systems. As we pass through each section, it should be clear that a variety of strategic initiatives—ranging from defensive or offensive in nature to cooperative—are being implemented across the country. In the past several years, most of the vertically integrated utilities have implemented defensive strategies—i.e. the introduction of grid access fees and anti-net metering lobbying—to stifle the rapid ascent of DERs in their service territories and prevent revenue loss and disproportionate cost shifting to legacy customers. However, in addition to this short term strategy, we are also seeing some vertically integrated utilities begin to adopt more sustainable long term strategies that aim to soak up market share or procure sustainable revenue flows from the growing DER market. By entering into the DER market, these firms seek to prevent a potential disruption by directly controlling the DER market—or at least effectively competing in it—rather than allowing their legacy customers to be lured away by a whole new industry. Meanwhile, some distribution utilities in key markets have adopted more cooperative strategies that aim to produce innovative utility business models capable of fulfilling the complex demands of a 21st century energy system. In other cases, IOUs located in states with progressive DER friendly policies have been forced into integrating DERs through compliance to established regulations. The following subsections—broken down by state—will briefly describe the IOUs reactive strategies against DERs in their service territories.

57
I. Vertically Integrated Utilities’ Strategies
a. Georgia Power Launches Offensive Entry Strategy In July 1st 2015, Georgia Power (GP)—the biggest subsidiary under the control of Southern Company—initiated its entry into Georgia’s residential solar market.139 The date also marked the formal passing of a law permitting TPO financing in Georgia—opening up the residential market to unregulated third party players. Georgia Power Energy Services—an unregulated wing of GP—now provides solar consulting and sales services.140 Customers can now quickly receive consulting services—via a questionnaire on the company’s website—to estimate the monthly savings (or lack thereof)—from purchasing a solar system. After completing a sale, the utility either subcontracts the project to a third party installer or carries out the installation itself—contingent upon the customer’s decision. Overall, the firm’s entry strategy into the residential solar market aims to protect its long term growth prospects. “If distributed generation is eroding your growth,” says Southern Co. CEO Tom Fanning, “own distributed generation!”141 This strategy uses strong customer engagement tactics through its online service portal to seamlessly walk the customer through the consulting and sales services. Customer engagement services are now becoming an important feature in maintaining customer loyalty by providing value added services to its customers. GP now offers a suite of energy services supported by smart meters—such as demand control and prepay energy billing.142 The addition of such customer services shows that the utility seeks to compete directly with third party solar installers and other energy service providers. However, this move has alienated some third party solar business advocates because the utility has much lower customer acquisition costs—giving the utility a huge advantage in competing for market share. Some analysts are concerned that GP may pass on customer data from its captive market to its affiliate and “streamline customer acquisition.”143 Third party installers will likely complain of monopolistic market abuse and anti-competitive behavior. If GP saturates enough market share in its residential solar sales market, it could potentially produce a conflict of interest with its parent
139 Pyper, Julia and Eric Wesoff. “Georgia Power is Launching its Own Rooftop Solar Business,” Greentech Media. 01 July 2015. https://www.greentechmedia.com/articles/read/Georgia-Power-is-Launching-its-Own-Rooftop-Solar-Business 140 Pyper, Julia and Eric Wesoff. “Georgia Power is Launching its Own Rooftop Solar Business,” Greentech Media. 01 July 2015. 141 Trabish, Herman. “Inside Georgia Power’s Move Into the Residential Solar Market,” Utility Dive. 11 June 2015. http://www.utilitydive.com/news/inside-georgia-powers-move-into-the-residential-solar-market/400562/ 142 Tweed, Katherine. “Georgia Power Leverages Smart Meters for Prepaid Electricity,” Greentech Media. 22 April 2015. http://www.greentechmedia.com/articles/read/georgia-power-leverages-smart-meters-for-prepay 143 Trabish, Herman. “Inside Georgia Power’s Move Into the Residential Solar Market,” Utility Dive. 11 June 2015.

58
company—especially if the parent continues to prioritize its centrally produced power and T&D assets over a holistic plan aiming to synchronize DER assets into the company’s power system. So far, after GP’s first year offering solar installations, of 10,000 customer inquiries, only 5 residential solar systems have been installed.144 By comparison, GP’s annual utility scale solar installation numbers for 2015 (189 MW) were the 9th highest in the country (see figure 4.1).145 Although low electricity rates may create a poor economic environment for residential solar adoption, this sharp discrepancy nonetheless highlights GPs strong preference in developing utility scale solar. With the recent legalization of TPO financing and launch of GP’s solar installation program, analysts will need more time to see how well GP’s program will perform. However, regardless of performance, GP’s strategic initiative shows how one utility in a weak residential solar market has taken a proactive measure to take control of the DER market and stymie competition in its service territory.
b. North Carolina: Duke Energy Defensive at Home and Offensive Abroad
Duke, the largest investor owned utility company in the U.S., has unleashed a mixed strategy. As opportunities in distributed energy have grown, the company decided to launch an unregulated renewable energy subsidiary called Duke Energy Renewables that develops large scale renewable energy projects across the United States. It also recently acquired REC Solar, a solar company specializing in commercial solar installations, in order to enter into the growing distributed solar market. However, while Duke recognizes the financial opportunities that the renewable DER market presents, it has taken a more overtly defensive approach within its own regulated service territory.146 Within its own service territory, Duke has been supportive of centrally planned solar projects under its control, but has made efforts to stifle the development of a third party residential solar
144 Pyper, Julia. “Georgia Power’s Rooftop Solar Program Signs Up Only 5 Customers,” Greentech Media. 17 July 2016. http://www.greentechmedia.com/articles/read/Georgia-Powers-Rooftop-Solar-Program-Signs-Up-Only-Five-Customers 145 Trabish, Herman. “Top Ten Solar Utilities See Growth Through Declining Prices, Favorable Policies,” Utility Dive. 28 April 2016. http://www.utilitydive.com/news/top-10-solar-utilities-see-growth-through-declining-prices-favorable-polic/417990/ 146 Trabish, Herman. “Duke Buying $500M of North Carolina Solar to Mixed Reviews,” Greentech Media. 18 September 2014. http://www.greentechmedia.com/articles/read/Duke-Buying-500M-of-North-Carolina-Solar-to-Mixed-Reviews
Figure 4.1: Top 10 Utility Solar Installations, 2015
Source: SEPA

59
market it perceives as a threat. The numbers speak for themselves. According to data collected by the EIA on May 2016, North Carolina’s IOUs—Duke and Dominion—have collectively supported the installation of 1,633 MW of utility scale solar—even surpassing Arizona in total utility scale solar installations to claim second place among all states.147 In 2015 alone, Duke Energy installed 461 MW of utility scale solar—claiming 3rd place behind California’s two largest utilities (see figure 4.1).148 In contrast, the state has only installed about 75 MW of distributed solar systems—placing it in 17th place for total capacity.149
Figure 4.2: Utility Scale Solar in South Atlantic Region Dominated by North Carolina, Georgia150
Source: EIA By focusing principally on centrally planned solar projects, Duke can either rate base the projects—i.e. recover the investment costs through customer rates—or cheaply purchase the electricity at the avoided cost of electricity through attractive PPAs. For instance, in 2014 the company purchased 500 MW of solar power into its portfolio. From this amount, it included 128 MW into its rate base, which qualified for a 10 percent return on invested capital.151 Duke purchased the remaining 372 MW under
147 “Table 6.2B. Net Summer Capacity Using Primarily Renewable Energy Sources and by State, May 2016 and 2015,” EIA. Accessed 08 August. 2016. http://www.eia.gov/electricity/monthly/epm_table_grapher.cfm?t=epmt_6_02_b 148 Trabish, Herman. “Top Ten Solar Utilities See Growth Through Declining Prices, Favorable Policies,” Utility Dive. 28 April 2016. http://www.utilitydive.com/news/top-10-solar-utilities-see-growth-through-declining-prices-favorable-polic/417990/ 149 “Table 6.2B. Net Summer Capacity Using Primarily Renewable Energy Sources and by State, May 2016 and 2015,” EIA. Accessed 08 August 2016. 150 “Utility Scale Solar in South Atlantic Region Dominated by North Carolina, Georgia,” EIA. Accessed 08 August 2016. http://www.eia.gov/todayinenergy/detail.cfm?id=24192 151 Trabish, Herman. “Duke Buying $500M of North Carolina Solar to Mixed Reviews.” 18 Sept 2014.

60
PPAs sold at about one-third the price of the state’s net-metered rate (about 11 cents per kilowatt hour).152 Meanwhile, around the same time, Duke effectively leveraged its political clout with the state’s PUC to impose stifling legal and financial barriers to entry for third party solar developers. For instance, Duke has asked its PUC to reduce the lifespan of standard PPAs from 15 years to 10 years as well as lower the state’s maximum qualified system size from 5 MW to 100 kw.153 Reducing the time and size of the PPA’s qualifying facilities recommended under PURPA would increase investment costs for third party owners and leave Duke—with its large balance sheet and access to cheap capital—with an enormous advantage. Changing these requirements would also possibly steer investors more toward large utility scale projects that would be less costly and offer more secure returns on invested capital. Although the measure failed to pass, it highlights, nonetheless, Duke’s attempts to use its lobbying power to snuff out 3rd party competitors participating in the DER market and widen its own economic moat in its service territory.154 Although Duke has recently initiated a proactive strategy to capture the commercially scaled distributed energy market across the continental US, its strategic initiatives within its own regulated service territory represent a defensive approach aimed at hindering the state’s DER market. Duke Energy’s actions demonstrate its continued preference for traditional cost recovery ratemaking or cheaply contracted utility scale solar projects. In its own territory, it sees distributed solar energy as a threat rather than an opportunity. In all, Duke Energy and its unregulated renewable energy subsidiary operate with conflicting interests—at least within its own service territory.
c. Arizona IOUs Deliver Short Term Defensive & Long Term Offensive Strategies Arizona’s main IOUs are Arizona Public Service Co. (APS) and Tucson Electric Power (TEP). In the past few years, Arizona’s IOUs have continually developed both defensive and offensive initiatives to prevent profit margin erosion from the growing use of residential solar systems. These utilities have argued with its public utility commission—known as the Arizona Corporate Commission (ACC)—for permission to implement a set of defensive measures which include increasing grid interconnection fees, reducing net metering compensation rates, and implementing demand rates for its solar customers.155 We have already discussed many of these short term defensive
152 Trabish, Herman. “Duke Buying $500M of North Carolina Solar to Mixed Reviews.” 18 Sept 2014. 153 Trabish, Herman. “Duke Buying $500M of North Carolina Solar to Mixed Reviews.” 18 Sept 2014. 154 Puttre, Michael. “Utility Commission Order Bolsters N.C.’s Status as a Rising Solar Power,” Solar Industry Magazine. 08 January 2015. http://solarindustrymag.com/utility-commission-order-bolsters-ncs-status-as-a-rising-solar-power 155 Trabish, Herman. “Arizona utility TEP wants to add solar fee, reduce net metering credit,” Utility Dive. 06 November 2015. http://www.utilitydive.com/news/arizona-utility-tep-wants-to-add-solar-fee-reduce-net-metering-credit/408791/

61
measures and their impact on residential solar market prosperity in section h.3 in the previous chapter. However, more recently, some vertically integrated utilities have implemented innovative strategies in order to assert more control over their DER markets. According to a recent survey conducted by Utility Dive, 82% of utility executives believe they should be allowed to own and rate base DERs.156 Both APS and TEP have proposed distributed solar business models using this logic, and, in December 2014, the ACC permitted both utilities to carry out a pilot program to build and own rooftop solar systems.157 While both utilities will be allowed to own and rate base customer sited residential solar systems, their business models are quite different. The APS business model is a “roof rental payment”; the TEP model offers savings on the customer’s monthly bill similar to a TPO leasing model.158 Both projects were approved by the ACC under the condition that the solar panels would benefit low income users and that the programs are limited to research purposes.159 The APS solar pilot project will offer a $30 rental payment to customers for twenty years in return for allowing it access to the participating customer’s roof. In addition, APS has also unveiled a Solar Innovation Study (SIS) program that will research how customers can manage their electricity demand and aid utilities in an endeavor to reduce and shift peak load by exploiting customer sited DERs.160 With the SIS program, APS is performing studies in order to understand how to effectively modernize the grid and what kind of strategic DER investments it will need to make in order to do so.161 Under the pilot program, APS aims to develop a fully interoperable system, which can be seen below in figure 4.3.162 The study should provide the utility with critical experience that will allow it to compete effectively in the markets growing DER market.
156 Pyper, Julia. “Utilities See Distributed Generation as a Challenge—and Owning It as the Solution,” Greentech Media. 18 February 2016. https://www.greentechmedia.com/articles/read/utilities-see-distributed-generation-as-a-challenge-and-owning-it-as-the-so 157 Pyper, Julia. “Arizona Utilites Get Approval to Own Rooftop Solar,” Greentech Media. 26 December 2014. http://www.greentechmedia.com/articles/read/arizona-utilites-get-the-go-ahead-to-own-rooftop-solar 158 Trabish, Herman. “Arizona utility TEP wants to add solar fee, reduce net metering credit,” Utility Dive. 159 Pyper, Julia. “Arizona Utilites Get Approval to Own Rooftop Solar,” Greentech Media. 26 December 2014. 160 Pyper, Julia. “How Arizona’s Biggest Utility is Modelling the Customer of the Future in Its ‘Rate Design Laboratory,” Greentech Media. 13 July 2016. https://www.greentechmedia.com/articles/read/How-APS-is-Modeling-the-Utility-Customer-of-the-Future 161 Pyper, Julia. “How Arizona’s Biggest Utility is Modelling the Customer of the Future in Its ‘Rate Design Laboratory,” Greentech Media. 13 July 2016 162 Pyper, Julia. “How Arizona’s Biggest Utility is Modelling the Customer of the Future in Its ‘Rate Design Laboratory,” Greentech Media. 13 July 2016

62
Figure 4.3: APS Solar Innovation Study
Source: APS Essentially, APS is seeking to develop a new model “where energy efficiency, demand side management and renewable energy” coalesce and “work together seamlessly and symbiotically.”163 The pilot is one of the most forward thinking utility 2.0 test programs currently under consideration—especially in relation to initiatives being carried out in other vertically integrated utility markets. Meanwhile, in the past two years, TEP has implemented two programs: a residential solar program and a community solar program. The former is a limited 3.5 MW pilot program serving a maximum of 500 customers. It is a regulated program (included in TEP’s rate base) with a $10 million capital expenditure. After paying a single $250 application fee, customers will receive a fixed electricity rate under a 25 year contract. Customers’ fixed payments under this contract are projected to “cover the cost of electricity and zero out their traditional utility bill.”164 Additionally, TEP is also developing a utility-led community solar program that will lock customers rates under a fixed ten year contract.165 Ostensibly, offering solar at community scale will not only
163 Pyper, Julia. “How Arizona’s Biggest Utility is Modelling the Customer of the Future in Its ‘Rate Design Laboratory,” Greentech Media. 13 July 2016 164 Trabish, Herman K. “Arizona’s utility-owned solar programs: the new business models utilities are looking for?,” Utility Dive. 07 January 2015. http://www.utilitydive.com/news/arizonas-utility-owned-solar-programs-the-new-business-models-utilities-a/348331/ 165 Pyper, Julia. “Tucson Electric Power Seeks to Expand Its Residential Solar Programs,” 10 July 2015. http://www.greentechmedia.com/articles/read/tucson-electric-power-seeks-to-expand-its-residential-solar-programs
63
permit TEP to develop solar at a lower cost, but also allow the company to offer its consumers more options.166 Although these pilot programs—according to their foundational policy—aim to create “a level playing field between third party owned business models and the utility,” DER advocates view these programs with a great deal of suspicion.167 Solar advocates believe that incumbent regulated utilities have an unfair advantage vis-à-vis third party solar companies if they can rate base their residential solar investments. So far, the ACC has ruled in favor of these complaints by limiting the scale of these projects to utility research programs. Principal among these requirements is that the program costs must be less than or equal to residential solar options currently offered by third party ownership models.168 Regardless of how these pilot programs and other future strategies develop, so far they undeniably represent a proactive offensive strategy that would allow these incumbent utilities to more effectively compete in their respective DER markets. In the future, if regulated ratemaking is permitted, it will also award utilities a certain portion of the DER market with regulated returns—though third party solar business advocates will likely fight to prevent such an outcome from establishing itself as a widely accepted national precedent.
d. Nevada’s NV Energy Unveils a Defensive Strategy Of the four states with vertically integrated IOUs under examination, Nevada’s NV Energy has enacted the most retrograde strategic initiatives. As reported in section h.2 of the previous chapter, NV Energy recently instituted changes aimed at reducing the subsidies previously enjoyed by participants in Nevada’s residential solar market. After years of persistent lobbying, Nevada’s PUC gave NV Energy permission to institute a grid access fee along with a gradual reduction of the NEM compensation rate. Like Duke Energy, NV Energy is not anti-renewable per se; its strategy merely demonstrates its opposition to DERs. The IOU is perfectly content with expanding its renewable investments—so long as they are utility scaled projects purchased under an affordable PPA or utility owned projects compensated through a PUC approved rate base. As part of the company’s three-part strategy, the company aims to:
1) Increase energy efficiency and conservation to provide our customers with tools to lower their energy bills while improving the environment.
2) Expand renewable initiatives and investments that have already made us
a national leader. 166 Pyper, Julia. “Tucson Electric Power Seeks to Expand Its Residential Solar Programs,” 10 July 2015. 167 Trabish, Herman K. “Arizona’s utility-owned solar programs,” Utility Dive. 07 January 2015. 168 Pyper, Julia. “Tucson Electric Power Seeks to Expand Its Residential Solar Programs,” 10 July 2015.

64
3) Add new, efficient generating plants and transmission lines that will use
the best available technology to benefit our customers and our environment.169
Although the energy efficiency (EE) initiative would nominally provide tangible benefits to customers in sync with DER market aims, the Nevadan utilities were able to rate base these EE investments. However, Nevada’s PUC recently eliminated funding for four popular EE measures.170 According to the commission, the EE programs required rate hikes171 to recover program costs, which have motivated large commercial consumers—such as casinos and large corporations—to defect from the grid.172 Meanwhile, the final two prongs of NV Energy’s strategy highlight the company’s devotion to centrally planned power projects and assets—placing much greater priority on utility scale power projects and transmission assets in lieu of investing in DERs aggregation. While NV Energy successfully lobbied the PUC to squash the residential solar industry’s market enabling policies last year, the utility installed 224 MW of utility scale solar in 2015—the 7th highest among IOUs in the US (see figure 4.1). Massive investments toward centralized power clearly reinforces the company’s long term strategy, which signals a return to the traditional utility business model of the 20th century. II. De-integrated Distribution Utilities’ Strategies
a. New York IOUs Embrace A Cooperative Strategy that Unify Major Stakeholders In contrast to the vertically integrated IOUs in the previous section, regulators and utility companies in New York have enacted a cooperative strategy seeking to work with third party energy companies and develop its nascent DER market. In 2016, the state’s six IOUs—along with three prominent solar companies—established an alliance formally known as the Solar Progress Partnership. Key members of the partnership include SolarCity, SunPower Corporation, SunEdison, Consolidated Edison, Central Hudson Gas & Electric, New York State Electric & Gas Corp., National Grid, Rochester Gas & Electric, and Orange & Rockland Utilities. The partnership’s formation centered on reaching a compromise on the contentious battle over net metering. In April 2016, the partners submitted a plan to New York’s Public Service 169 “Three Party Strategy,” NV Energy. Accessed 08 August 2016. https://www.nvenergy.com/company/energytopics/threepartstrategy.cfm 170 Pyper, Julia. “Regulators Cut Funding for Efficiency Program in Nevada.” Greentech Media. 25 January 2016. http://www.greentechmedia.com/articles/read/regulators-cut-funding-for-efficiency-programs-in-nevada 171 Schwartz, David McGrath. “NV Energy customers may get zapped for conserving,” Las Vegas Sun. 04 May 2011. http://lasvegassun.com/news/2011/may/04/nv-energy-does-good-so-it-wants-raise/ 172 Pyper, Julia. “Regulators Cut Funding for Efficiency Program in Nevada.” Greentech Media. 25 January 2016.

65
Commission to gradually transition away from the subsidy driven DER market via net metering to the state government’s plan to develop a mature distributed energy market under the Reforming the Energy Vision (REV) initiative.173 Under the REV initiative, utility companies throughout the state are working with state government energy officials, regulators and third party energy companies to help craft a utility business model more suited for the 21st century. The aforementioned net metering compromise will temporarily extend retail rated NEM compensation until 2020. By then, state officials and regulators have tasked IOUs with the responsibility of creating Distribution Service Platforms (DSPs) where utilities can provide a space for third party services to provide their energy products and services to its customers. Customers will be able to access this platform and select energy service providers that fulfill their particular needs—ranging from a variety of DER options.
Figure 4.4: Integration of Customer, DER Service Providers and the Utility through the DSP
Source: Navneet Travedi Where utilities have previously seen DERs as a threat, through the promotion of DSPs, the REV initiative aims to create a symbiotic relationship between utility companies and third party companies developing a more robust DER market. From a revenue standpoint, both the utility and the third party energy company stand to benefit. As a
173 Kann, Shayle. “How to Find Compromise on Net Metering,” Greentech Media. 27 April 2016. https://www.greentechmedia.com/articles/read/how-to-find-compromise-on-net-metering

66
given third party company utilizes the platform to offer its services to customers, the utility will receive a share of the revenue in return for creating and maintaining a valuable platform for third party companies to distribute their product or service. Richard Kaufman, New York’s energy czar, compares the DSP to Apple’s digital iOS platform from which the tech company generates immense value for its third party partners, its customers and its shareholders. As Kaufman puts it, Apple’s iOS platform creates “a virtuous cycle where the more Apple invests in the platform to make it valuable to the app developers, the more Apple gets paid back in revenue.”174 In other words, the utilities will now have a financial incentive to develop a competitive DER market because it will obtain a healthy portion of those competitive profit margins—or market based earnings according to REV nomenclature. Third party companies will benefit from having a valuable space to directly engage customers. Finally, customers stand to benefit from the availability of new value added energy services. In order to make this shift as seamless as possible, the major IOUs of New York have begun to unveil a number of demonstration projects and experiments to test out the feasibility of the DSP projects. A number of examples abound. In Ithaca, NYSEG seeks to integrate new time of use electricity rates in 12,000 homes equipped with smart electric meters.175 The aim is to enhance grid resilience and create energy savings for utilities and customers by promoting demand response to real time energy prices. In Rochester, RG&E will launch an “e-commerce site” where customers will be able to purchase “energy management devices and storage batteries” from third party energy companies.176 Finally, in New York City, ConEd has collaborated with Sunverge and SunPower to establish a Virtual Power Plant Pilot where 300 participating customers will lease solar panels paired with lithium-ion battery storage units.177 In addition to testing how revenues from “software-enabled aggregation of energy” can be allocated among project stakeholders, ConEd will also examine how these customer sited DERs can help shave peak load, provide surplus energy to wholesale markets and avoid—or at least reduce—the need for future T&D investments.178, 179 In sum, all of these demonstration projects show how New York’s utilities are taking proactive strategic measures to cooperate with third party energy companies and to 174 Roberts, David. “New York is Transforming its Energy Systems. Meet the ‘Czar’ in Charge,” Vox. 20 November 2015. http://www.vox.com/2015/11/20/9769856/new-york-kauffman-interview 175 Rahim, Saqib and Peter Behr. “Grid: Utilities give a first peek at NY’s distributed energy future,” E&E News. 07 July 2016. http://www.eenews.net/energywire/stories/1060039893 176 Rahim, Saqib and Peter Behr. “Grid: Utilities give a first peek at NY’s distributed energy future,” E&E News. 177 Wesoff, Eric. “New York’s Con Ed is Building a Virtual Power Plant From Sunverge Energy Storage and SunPower PV,” Greentech Media. 12 June 2016. http://www.greentechmedia.com/articles/read/New-Yorks-ConEd-Is-Building-a-Virtual-Power-Plant-From-Sunverge-Energy-Sto 178 Wesoff, Eric. “New York’s Con Ed is Building a Virtual Power Plant From Sunverge Energy Storage and SunPower PV,” Greentech Media. 12 June 2016. 179 Walton, Robert. “ConEd virtual power plant shows how New York’s REV is reforming utility practices,” Utility Dive. 21 June 2016. http://www.utilitydive.com/news/coned-virtual-power-plant-shows-how-new-yorks-rev-is-reforming-utility-pra/421053/

67
integrate DERs into their underlying business models. By attempting to completely realign the utility company’s financial incentives in a manner that turns DERs into a revenue generating opportunity, New York’s REV initiative may be the most innovative and visionary attempt at forging a new utility business model in the 21st century.
b. California’s IOUs Acquiesce to Regulatory Aims Yet Remain Strategically Conflicted
In California, the significant rise of DERs in the state’s grid can be highly attributed to the California state government’s ambitious clean energy goals upheld by strict PUC mandates. However, California, unlike New York, has used a piecemeal regulatory approach to pursue its renewable targets. California is not completely overhauling the utility business model or ratemaking methods. Nevertheless, California’s renewable policies have successfully prompted the state’s IOUs to incorporate DERs into their energy infrastructure—though it appears that regulatory compliance rather than business motive has driven IOUs in this direction. For instance, Californian utilities have been ordered to create concrete Distribution Resource Plans (DRPs) and Advanced Distribution Management Systems (ADMS) to better optimize the deployment and integration of DERs in their service territories.180 Moreover, the PUC ordered the three big IOUs to develop a Demand Response Auction Mechanism (DRAM) in order to integrate hundreds of MWs of third party DER assets to reduce and actively manage the grid’s load requirements.181 Although these programs have resulted in the expansion of DER markets, these are often driven by government mandates and not the utilities’ organic business strategies. Although the IOUs have generally cooperated to meet the state’s required DER mandates, the companies have also, at times, employed defensive strategies aimed at deterring DER market enabling policies. Recently, the state’s three IOUs vehemently lobbied to reduce net metering rates and institute a monthly fee for customers with rooftop solar panels.182 The PUC rejected the IOUs proposals and voted in favor of solar advocates. Additionally, the IOUs also feel reluctant to share data with third party DERs operating in their territory. Real time grid data is still seen as sensitive and proprietary, though such data is critical for DER providers to deliver more valuable energy services to utility end users. In other words, for now, regulation seems to be the main driver for utility integration of DERs and what seems like cooperation is actually mostly acquiescence. 180 St. John, Jeff. “Southern California Edison’s Grand Software Plan Is a System of Systems at the Grid Edge,” Greentech Media. 11 February 2016. http://www.greentechmedia.com/articles/read/Southern-California-Edisons-Grand-Software-Plan-is-a-System-of-Systems-at 181 St. John, Jeff. “California’s DRAM Auction Contract for 82MW of Distributed Energy as Grid Resource,” Greentech Media. 03 August 2016. http://www.greentechmedia.com/articles/read/californias-dram-auction-Contracts-for-82mw-of-distributed-energy-as-grid-r 182 Baker, David R. “Solar Homeowners Win Big in California Ruling, For Now,” SF Gate. 28 January 2016. http://www.sfgate.com/business/article/Solar-companies-and-customers-win-big-in-6790872.php

68
There is not a natural strategic impulse driving Californian utilities to embrace the growth of DERs. California commissioner Michael Florio believes that DER investments will need to offer a similar—or even better—rate of return for IOUs than those promised by traditional infrastructure projects they have favored in the past. Utility shareholders dislike DER growth because DER deployment replaces the need for grid infrastructure—which offers immense value to utility shareholders. Commissioner Florio recommended a proposal that “offer a shareholder incentive for the deployment of cost-effective DERs that displace or defer a utility expenditure, based on a fixed percentage of the payment made to the DER provider (customer or vendor).”183 The commissioners is trying to eliminate the natural clash between the state government’s policy aims and the utilities financial incentives.184 This solution will essentially utilize the same rate base mechanics used in traditional investments, but reallocate them toward DER investments. Although the merits of the commissioner’s proposal are still being debated by the grid’s various stakeholders, all agree that a new utility business model and ratemaking methodology will be needed to naturally propel the utilities’ business incentives toward greater DER deployment.
III. Conclusion Due to adherence to outdated business models, ratemaking frameworks and regulatory standards, most IOUs regard DER growth in their service territories as a threat to their businesses’ long term health and prosperity. In general, vertically integrated IOUs have implemented strategies aimed at either controlling the DER market or stifling it altogether. These utilities have executed these strategies in order to safeguard their revenue streams from potentially disruptive competition. Usually, these IOUs will introduce DER initiatives only in order to comply with regulators or if there is an attractive profit motive associated with it. For most vertically integrated utilities, their most attractive investment opportunities still reside in utility scaled generation or grid infrastructure that can be included in the company’s rate base. Because DERs undermine consumption of centrally produced power, this creates a natural conflict with the DER market. Regulators will need to create strong DER profit motives for utilities that match the attractiveness of their traditional investments, while, at the same time, not completely undermining competition in the DER market space—a very formidable task to be sure. Distribution utilities in restructured markets also share some similar financial biases toward infrastructure investments that put these companies at odds with DER growth. However, distribution utilities that have been willing to adopt progressive structural
183 Pyper, Julia. “Californians Just Saved $192 Million Thanks to Efficiency and Rooftop Solar,” Greentech Media. 31 May 2016. http://www.greentechmedia.com/articles/read/Californians-Just-Saved-192-Million-Thanks-to-Efficiency-and-Rooftop-Solar 184 Maloney, Peter. “California Dreaming: Utilities Uneasy with Regulator’s Vision to Remake Their Business Model,” Utility Dive. 06 July 2016. http://www.utilitydive.com/news/california-dreaming-utilities-uneasy-with-regulators-vision-to-remake-the/422035/

69
reforms (i.e. realign their ratemaking methodologies and business models) and work with other stakeholders have had more success in fostering nascent DER markets. New York’s REV initiative provides a cogent example of such a scenario. However, unlike the REV initiative, which has created a holistic solution in synchronizing utility financial incentives with the growth of a competitive third party DER market, California still relies too heavily on regulatory mandates to compel utilities into adopting DERs. Without proper ratemaking reforms that realign the shareholders’ financial incentives toward DERs, IOUs will continue to naturally view DERs as both a regulatory and financial burden—not an opportunity. Ultimately, regulators, utilities and other stakeholders will have to develop more holistic solutions like New York’s REV initiative. Sweeping proposals that seek to synchronize the reform of business models with regulation and ratemaking could potentially allow both IOUs and DER markets to flourish side by side.

70
Chapter 5
Policy Recommendations for Power Industry Stakeholders
The following recommendations seek to deliver a list of short term and long term proposals that will help major stakeholders—state and federal policymakers, public utility regulators, utility executives and DER business advocates—create the utility business models and regulatory frameworks needed for the 21st century. It should be noted that the power industry in the United States varies significantly by region in terms of its market structure, energy policies, regulatory preferences and energy portfolio. Although some of these recommendations may prove useful nationally, others may only apply to certain regions. Due to America’s highly diverse and complex power industry structure, it is highly unlikely we will encounter a universal panacea to make our transition to “utility 2.0”. Nevertheless, I have compiled a list of some of the most important regulatory framework and business model adaptations that stakeholders should consider. 1. Regulators should adopt performance based ratemaking to incentivize utility
investments toward DER aggregation. Utilities’ financial incentives often remain conflicted with the energy planning goals of policymakers and regulators because traditional ratemaking biases IOU capital spending toward expensive utility scale assets. Basically, policymakers and regulators want to use their regulatory tools to transform utilities from being commodity businesses to energy service companies.185 Policymakers and regulators can alter this financial incentive from capital spending to performance outcomes they desire by implementing performance based regulation. Utilities should be rewarded for taking calculated risks that fulfill established performance guidelines (reducing demand load by aggregating 1,000 MW of DERs, for example) set by regulators and policymakers. Failure to meet such performance metrics over the course of a set period of time would result in a penalty (see figure 5.1). If the rewards for positive outcomes are shaped properly, utilities would have a strong incentive to exceed—or at the very least meet—the performance targets set by the regulators. If designed correctly, performance based regulation can facilitate utilities to innovate—or at least to cooperate with other firms to offer more value added energy services to end users.
185 Harvey, Hal and Sonia Aggarwal. “Rethinking Policy to Deliver a Clean Energy Future,” Energy Innovation Policy & Technology LLC. September 2013. http://energyinnovation.org/wp-content/uploads/2014/06/APP-OVERVIEW-PAPER.pdf

71
Figure 5.1: Performance-based Ratemaking
Source: Energy Innovation186 2. Utilities should transition from volumetric sales of kilowatt hours to alternative
energy services revenue streams. Ending utilities addiction to volumetric kilowatt hour driven sales is tied to the previous proposal but deserves special attention. Since the time of Samuel Insull, traditional regulatory frameworks have incentivized utilities to sell more (not less) kilowatt hours. This incentive is inextricably linked to traditional cost recovery ratemaking since projected revenue—based on forecasted kilowatt hours—is what utilities and regulators have used to set the rate base. Therefore, utilities and regulators will have to work with other stakeholders to locate new revenue generating opportunities for IOUs. New York State’s REV program provides a great example in the case of the distribution service platform (DSP). 3. Develop new utility business models that focus less on commodity delivery and
more on value added energy services. Due to market structure and regulatory variations, vertically integrated IOUs and de-integrated distribution IOUs will likely adopt different business models. Nevertheless, both of these IOUs should focus more on business model elements that place less emphasis on their assets and place more emphasis on business models elements that utilize smart technologies to aggregate DERs and provide energy services to their customers. Table 5.1 enumerates a list of available business model elements and figure 5.2 shows where these business models would interact in the electricity value chain. 186 Harvey, Hal and Sonia Aggarwal. “Rethinking Policy to Deliver a Clean Energy Future,” Energy Innovation Policy & Technology LLC. September 2013, 20.

72
Figure 5.2: Generic Smart Utility Business Models
Source: Peter Fox-Penner, PwC
Table 5.1 Business Model Elements BusinessModels BusinessFocus BusinessAlignment ProfitabilityBasisTraditionalcorebusiness
Assets-Customers Generation-T&D–Retail
RegulatedReturnonInvestedCapital(ROIC)
Gentailer Assets-Customers Generation-Retail CompetitiveMarginPurePlayMerchant
Assets Generation CompetitiveMargin
GridDeveloper Assets Transmission RegulatedROICNetworkManager Assets Transmission-
DistributionRegulatedROIC
ProductInnovator Customers Retail CompetitiveMarginPartnerofPartners'
Customers Retail CompetitiveMargin
Value-addedEnabler
Customers Retail CompetitiveMargin
VirtualUtility Customers Distribution-Retail CompetitiveMarginSource: PwC

73
4. Complete market restructuring where possible.
Where the political will exists, states with vertically integrated utilities should be encouraged to promote market restructuring. This analyst believes that competition in the DER market will enhance innovation and create positive spillover effects. Unfortunately, after the California Electricity Crisis of 2001, restructuring has lost its political appeal, so this may not be a viable option for the foreseeable future. Where restructuring is inhibited by a region’s economic and political conditions, regulation should evolve to stronger performance based metrics. Diverting financial incentives toward more productive goals will be especially important in these vertically integrated markets. 5. Business model transformation requires complementary regulatory adaptation. Regulatory changes aiming to create new financial incentives must occur in sync with the transformation of utility business models. A transformation of such a grand scale requires coordination because of the strong interconnection of markets, regulation and business model formation (see figure 5.3). All significant stakeholders involved in this process must be willing to work together and reach a holistic solution to create the proper ecosystem to help create the utility of the future.
Figure 5.3: The Power Industry’s “Inseparable Triad”187
Source: Peter Fox-Penner
187 Fox-Penner, Peter. Smart power: Climate change, the Smart Grid and the Future of Electric Utilities. Washington (2010), 158.

74
6. Incorporate DER growth into integrated resource planning and investment planning forecasts.188
In the past, IOUs developed large scale generation and infrastructure plans to meet electricity demand. However, if IOUs properly account for the demand reduction of centrally produced electricity caused by DER growth, IOU investment planning will require appropriate recalibration. In theory, this will prevent IOUs from allocating resources in an economically wasteful manner and promote the development of a more efficient energy system.189 7. Regulators and utilities will need a transition strategy.190 Although a holistic transformation of regulation, ratemaking, market structuring and business model design is needed, some of these changes will need to take place gradually. The transition must not undermine the financial health of the utility company. Reducing investor risk and keeping the cost of capital low will allow the transformation to transpire with less economic and political volatility. Therefore, as utilities and regulators propose new revenue streams and performance based ratemaking metrics, old ratemaking habits will need to be scaled down gradually until new revenue generating opportunities demonstrate their sustainability. The financial returns for legacy assets and stranded assets must be accounted for during the transition.191 For instance, as we shift to performance based regulation, we should not expect to abandon traditional ratemaking standards overnight. It should be done gradually and in a piecemeal fashion. For example, even the REV planners have allowed IOUs to rate base their software investments during this interim transition period.192 Utility stakeholders have demonstrated more willingness to adopt transition plans when adaptations to regulation and business models occur at a measured pace. Patience will be required during this complex transformation. 188 Roberts, David. “Imagining power utilities for the 21st century,” Grist. 04 June 2013. http://grist.org/climate-energy/imagining-power-utilities-for-the-21st-century-with-slow-lorises/ 189 York, Dan and Marty Kushler. “Utility Initiatives: Integrated Resource Planning,” American Council for an Energy Efficient Economy. 02 July 2014. http://aceee.org/policy-brief/utility-initiatives-integrated-resource-planning 190 Roberts, David. “Imagining power utilities for the 21st century,” Grist. 04 June 2013. 191 Roberts, David. “Imagining power utilities for the 21st century,” Grist. 04 June 2013. 192 Buckley, Brian. “Ten Important Details You May Not Know About the New York REV Proceeding,” Northeast Energy Efficiency Partnership. 03 August 2016. http://www.neep.org/blog/ten-important-details-about-ny-rev

75
Chapter 6
Conclusion Although the power industry has changed significantly since the days of Samuel Insull, many of the key traditions Insull established persist: namely, the regulatory compact and the financial incentives it spawned. Utilities still cling to these financial incentives, which explains their financial preference for expensive capital investments complemented with a fixed rate of return. Many public utility commissioners, meanwhile, still regulate utility investments in an outdated manner that uphold these incentives. As this paper has argued, the capital investments these incentives encourage may not best serve the interests of society or provide value enhancing services to consumers. While the regulatory compact of the 20th century unleashed tangible benefits in its heyday, these potential economic benefits have peaked long ago. The expansion and upgrading of T&D networks no longer produce the cost reducing benefits they unveiled in the past century. Meanwhile, if properly integrated into distribution network systems, DERs could produce concrete benefits in this century—both for consumers seeking better value and for society at large. Unfortunately, the rise of these potentially valuable resources has represented a threat to the financial viability of IOUs. DER proliferation undermines the revenue base of IOUs that invest primarily in utility scale generation and the grid infrastructure that delivers this centrally produced power. Nevertheless, despite the threat posed by DER proliferation, governments at the federal and state level view these resources as a means to produce consumer savings and satisfy their environmental goals. As of 2016, more than a dozen states possess favorable market characteristics to stimulate distributed solar market growth. If costs continue to decline and states pass more market enabling policies, DERs could provide more energy services to individual consumers and grid operators. Across the country, IOUs have instituted a range of strategies to deal with this emerging threat. Many have employed short term defensive strategies which include the introduction of monthly grid access fees and demand charges and the reduction of net metering compensation that aim to mitigate revenue loss caused by self-generation and load defection. Others IOUs have employed offensive strategies—usually by directly entering into the distributed solar and DER markets with unregulated subsidiaries. However, some third party energy companies and regulators express concern that utility entrance into the DER sector could undermine competition and stymie innovation within the DER market space—especially given the utility’s bias toward centrally produced power. On the other hand, some IOUs, encouraged by policymakers and regulators, have received praise for their efforts to promote DER growth and cooperate with third party energy services companies. The REV initiative in New York, for example, has been one of the most ambitious projects aiming to encourage distribution utilities toward achieving such aims. However, most IOUs—

76
even in progressive California—integrate DERs principally from compliance to regulation rather than from an innate business initiative. To this day, IOUs’ financial incentives continue to put IOUs at odds with the growth of DER markets controlled by third party energy companies. In order to overcome this conflict with DER market growth, policymakers and utilities will need to create and synchronize new regulatory frameworks and business models that realign utilities’ financial incentives. Regulators and utilities need to shift away from rate of return ratemaking and embrace performance based regulation. IOUs should be rewarded for carrying out goals—like DER integration efforts—and receive some form of compensation for achieving them. The utilities of the future should become energy services companies rather than mere energy delivery companies. The shift from a commodity driven industry to an energy services industry aggregating DERs should allow companies to exploit new revenue generating opportunities. Given the grand complexity involved in transforming the power industry, the transition to “utility 2.0” should occur gradually. Ultimately, the transition cannot undermine the financial health of IOUs. If regulators and utilities carefully design the above changes, the IOUs of the future could usher in a new era of electricity.

77
Bibliography
“2015 Solar Market Snapshot,” Smart Electric Power Alliance. Accessed 1 July 2016. https://www.solarelectricpower.org/discover-resources/solar-tools/2015-solar-power-rankings.aspx
“2016 State of the Electric Utility Survey,” Utility Dive.
http://www.utilitydive.com/library/state-of-the-electric-utility-2016/ “About 60% of the US electric power supply is managed by RTOs,” EIA. 04 April
2011. http://www.eia.gov/todayinenergy/detail.cfm?id=790 Ali-Oettinger, Shamsiah. “More mergers and acquisitions to come,” PV Magazine. 22
July 2015. http://www.pv-magazine.com/news/details/beitrag/more-mergers-and-acquisitions-to-come_100020302/
Baker, David R. “Solar Homeowners Win Big in California Ruling, For Now,” SF Gate.
28 January 2016. http://www.sfgate.com/business/article/Solar-companies-and-customers-win-big-in-6790872.php
Barnes, Justin and Rusty Haynes. “The Great Guessing Game: How Much Net
Metering Capacity is Left?” EQ Research. September 2015. http://eq-research.com/wp-content/uploads/2015/08/NEM-Cap-Reporting-09_01_15.pdf
Berthold, Hannes and Matt Abbott. “Distributed energy: Disrupting the utility business
model,” Bain & Company. 2013. http://www.bain.com/publications/articles/distributed-energy-disrupting-the-utility-business-model.aspx
Biello, David. "Solar Wars." Scientific American 311.5 (2014): 66-71. Bradford Travis, et al. “Valuing Distributed Energy: Economic and Regulatory
Challenges,” Center on Global Energy Policy. 26 April 2013. http://energypolicy.columbia.edu/sites/default/files/energy/Valuing%20Distributed%20Generation_Economic%20and%20Regulatory%20Challenges.pdf
Bradford, Travis, et al. “2nd Distributed Energy Valuation Roundtable: Toward
Technical, Business, and Policy Solutions,” Center on Global Energy Policy. 10 April 2014. http://energypolicy.columbia.edu/sites/default/files/energy/Summary%20Paper_Distributed%20Energy%20Valuation%20Roundtable%202014_102314.pdf
Bird, Lori and Jenny Sumner. “Consumer Attitudes About Renewable Energy: Trends
and Regional Differences,” National Renewable Energy Laboratory. http://apps3.eere.energy.gov/greenpower/pdfs/50988.pdf
78
Bogage, Jacob. “Study: Pepco is the country’s worst utility at connecting solar
power,” The Washington Post. 21 July 2015. https://www.washingtonpost.com/news/energy-environment/wp/2015/07/21/study-pepco-is-the-countrys-worst-utility-at-connecting-solar-power/
Bromley, Hugh and Nathan Serota. “2016 US PV Market Outlook,” 06 June 2016.
Bloomberg New Energy Finance. Brooks, Cameron. "The Periodic Table of the Electric Utility Landscape: A Series of
Visual Tools for Enhanced Policy Analysis." The Electricity Journal 28.6 (2015): 82-95
Buckley, Brian. “Ten Important Details You May Not Know About the New York REV
Proceeding,” Northeast Energy Efficiency Partnership. 03 August 2016. http://www.neep.org/blog/ten-important-details-about-ny-rev
Buhayar, Noah. “Who Owns the Sun?,” Bloomberg Businessweek. 28 January 2016.
http://www.bloomberg.com/features/2016-solar-power-buffett-vs-musk/ Burger, Scott, et al. “The Value of Aggregators in Electricity Systems,” MIT CEEPR.
January 2016. http://energy.mit.edu/wp-content/uploads/2016/01/CEEPR_WP_2016-001.pdf
Calhoun, Koben and Jesse Morris. “Can the Cost of Solar in the US Compete with
Germany?” Rocky Mountain Institute. 05 December 2013. http://blog.rmi.org/blog_2013_12_05_can_usa_solar_cost_compete_with_germany
Campbell, Richard J. “Customer Choice and the Power Industry of the Future”
Congressional Research Service. September 2014. https://www.fas.org/sgp/crs/misc/R43742.pdf
California Energy Commission & CPUC. “Net Energy Metering in California,”
http://www.gosolarcalifornia.ca.gov/solar_basics/net_metering.php Carey, Brian, et al. “Financing US Residential Solar: Owning, rather than leasing, will
bode well for homeowners,” PricewaterhouseCoopers. August 2015. https://www.pwc.com/us/en/technology/publications/assets/pwc-financing-us-residential-solar-08-2015.pdf

79
Christensen, L.R. Green, W.R., 1976. Economies of Scale in US Electric Power Generation. J. Polit Econ 74 (4), 671.
Department of Energy. “Business Energy Investment Tax Credit,” Accessed 05 July
2016. http://energy.gov/savings/business-energy-investment-tax-credit-itc Department of Energy, “Sunshot Vision Study” Accessed 20 June 2016.
http://energy.gov/sites/prod/files/2014/01/f7/47927_chapter4.pdf. Detterman, Brook J. “Don’t Let the Sun Go Down on Me: The Controversy Over Net
Metering,” EnviroStructure. 03 March 2016. http://www.envirostructure.com/2016/03/dont-let-the-sun-go-down-on-me-the-controversy-over-net-metering/
DSIRE. “Customer Credits for Monthly NEG Under Net Metering,” http://ncsolarcen-
prod.s3.amazonaws.com/wp-content/uploads/2016/01/NEG-1.2016.pdf Edge, Ryan and Erika Myers. “Solar Fundamentals, Volume 2: Markets,” Solar Electric
Power Association. 2015. https://www.solarelectricpower.org/media/395320/Solar-Fundamentals-Vol-2.pdf
“Emergence of Electrical Utilities in America,” The National Museum of American
History. http://americanhistory.si.edu/powering/past/h1main.htm Farrell, John. “Updated: States Supporting Virtual Net Metering,” Institute for Local
Self-Reliance. 04 November 2015. https://ilsr.org/virtual-net-metering/ Fox-Penner, Peter. Smart Power: Climate change, the Smart Grid and the Future of
Electric Utilities. Washington (2010). Freeing the Grid. Accessed 31 June 2016. http://freeingthegrid.org/ Gallagher, Ben. “Pricing for Solar Systems in the U.S. Dropped 17% in 2015,”
Greentech Media. 15 March 2016. http://www.greentechmedia.com/articles/read/Pricing-For-Solar-Systems-in-the-US-Dropped-17-in-2015
Greer, Ryan. “Throwing Shade: 10 Sunny States Blocking Distributed Solar
Development,” Center for Biological Diversity. April 2016. https://www.biologicaldiversity.org/programs/population_and_sustainability/energy/pdfs/ThrowingShade.pdf

80
Groom, Nichola. “Solar company Sungevity to go public in reverse merger,” Reuters. 29 June 2016. http://www.reuters.com/article/us-sungevity-easterlyacquisition-idUSKCN0ZF1HS
Harvey, Hal and Sonia Aggarwal. “Rethinking Policy to Deliver a Clean Energy Future,”
Energy Innovation Policy & Technology LLC. September 2013. http://energyinnovation.org/wp-content/uploads/2014/06/APP-OVERVIEW-PAPER.pdf
Henry, Ray and Susan Montoya Bryan. “Big utilities enter market for small rooftop
solar,” Chicago Tribune. 29 September 2015. http://www.chicagotribune.com/news/nationworld/sns-bc-us--rooftop-solar-20150929-story.html
Herndon Andrew, et al. “Total to Buy 60% of SunPower for $1.38 Billion in Solar Bet,”
Bloomberg. 29 April 2011. http://www.bloomberg.com/news/articles/2011-04-28/total-to-begin-friendly-tender-for-up-to-60-of-sunpower-shares
Hill, Joshua. “New Survey Reveals American Attitudes To Energy And Environment,”
Cleantechnica. 15 January 2015. http://cleantechnica.com/2015/01/30/new-survey-reveals-american-attitudes-energy-environment/
Hughes, Thomas Parke. Networks of power: electrification in Western society, 1880-
1930. JHU Press, 1993 Hyman, Leonard S. and William Tilles. “The Sun Will Set on Electric Utilities,” Barron’s.
09 July 2016. http://www.barrons.com/articles/the-sun-will-set-on-electric-utilities-1468041067?mod=BOL_hp_highlight_8
Johnston, David Cay. “Competitively Priced Electricity Cost More, Studies Show,” The
New York Times. 06 November 2007. http://www.nytimes.com/2007/11/06/business/06electric.html?ex=1352091600&en=7bfa79ca0ab29cd5&ei=5124&partner=permalink&exprod=permalink
Kann, Shayle. “How to Find Compromise on Net Metering,” Greentech Media. 27 April
2016. https://www.greentechmedia.com/articles/read/how-to-find-compromise-on-net-metering
Kihm, Steve, et al. “You Get What You Pay For: Moving Toward Value in Utility
Compensation,” Western Grid Group. June 2015. http://www.westerngrid.net/wp-content/uploads/2015/06/CostValue-Part1-Revenue.pdf

81
Kind, Peter. “Disruptive challenges: financial implications and strategic responses to a changing retail electric business,” Edison Electric Institute, 2013. http://www.eei.org/ourissues/finance/documents/disruptivechallenges.pdf
Lambert, Jeremiah D. The Power Brokers: The Struggle to Shape and Control the
Electric Power Industry. MIT Press, 2015 Lisovicz, Susan. “Arizona’s Largest Utility is Trying to Solve a Big Problem with Solar
Powered Homes,” Yahoo! Finance. 05 June 2016. http://finance.yahoo.com/news/arizona-utility-solar-innovation-study-005740702.html
Maloney, Peter. “California Dreaming: Utilities Uneasy with Regulator’s Vision to
Remake Their Business Model,” Utility Dive. 06 July 2016. http://www.utilitydive.com/news/california-dreaming-utilities-uneasy-with-regulators-vision-to-remake-the/422035/
Marcacci, Silvio. “Community Solar Programs Can Reach Millions of People—If
Utilities Design and Market Them Right,” Greentech Media. 03 June 2016. http://www.greentechmedia.com/articles/read/community-solar-programs-can-reach-millions-of-people-if-utilities-design-a?utm_source=facebook&utm_medium=social&utm_campaign=gtmsocial
Marcacci, Silvio. “Solar Interconnection Delays Cost Americans Millions—Here’s How
We Solve Them,” Clean Technica. 12 August 2015. http://cleantechnica.com/2015/08/12/solar-interconnection-delays-cost-america-millions-heres-solve/
Martin, Richard. “Battles Over Net Metering Cloud the Future of Rooftop Solar,” MIT
Technology Review. 05 January 2016. https://www.technologyreview.com/s/545146/battles-over-net-metering-cloud-the-future-of-rooftop-solar/
Martin, Richard. “Tax Credit Extension Gives Solar Industry New Boom,” MIT
Technology Review. 28 December 2015. https://www.technologyreview.com/s/544981/tax-credit-extension-gives-solar-industry-a-new-boom/
Mascoff, Dean, et al. “From defense to offense: distributed energy and the challenge
of transformation in the utility sector,” Ernst & Young. 2014. http://www.ey.com/Publication/vwLUAssets/EY_-_From_defense_to_offense/$FILE/EY-From-defense-to-offense.pdf
McDonald, Forrest. Insull: the rise and fall of a billionaire utility tycoon. Beard Books,
2004.

82
Meyers, Glenn. “Changing Net Metering Policies Being Studied In Over Half of US
States,” Clean Technica. 16 November 2015. http://cleantechnica.com/2015/11/16/changing-net-metering-policies-studied-half-us-states/
Meza, Edgar. “US Community Solar Programs Could Reach 1.5 GW by 2020,”
http://www.pv-magazine.com/news/details/beitrag/us-community-solar-programs-could-reach-15-gw-by-2020_100024178/
Mints, Paula. “Notes from the Solar Underground: The US Utility War against Net
Metering,” Renewable Energy World. 23 February 2016. http://www.renewableenergyworld.com/articles/2016/02/notes-from-the-solar-underground-the-us-utility-war-against-net-metering.html
Morey, Mathew, et al. “Retail Choice in Electricity: “What Have We Learned in 20
Years?,” Christensen Associates Energy Consulting. 11 February 2016. http://emrf.net/uploads/3/4/4/6/34469793/retail_choice_in_electricity_for_emrf_final.pdf
Munsell, Mike. “72% of US Residential Solar Installed in 2014 Was Third-Party
Owned,” Greentech Media. 29 June 2015. http://www.greentechmedia.com/articles/read/72-of-us-residential-solar-installed-in-2014-was-third-party-owned
Munsell, Mike. “GTM Research: 20 States at Grid Parity for Residential Solar,”
Greentech Media. 10 February 2016. http://www.greentechmedia.com/articles/read/GTM-Research-20-US-States-at-Grid-Parity-for-Residential-Solar
Munsell, Mike. “US Community Solar Market to Grow Fivefold in 2015, Top 500MW in
2020,” Greentech Media. 23 June 2016. http://www.greentechmedia.com/articles/read/us-community-solar-market-to-grow-fivefold-in-2015-top-500-mw-in-2020
“Net Metering,” Solar Energy Industries Association.
http://www.seia.org/policy/distributed-solar/net-metering NREL. “CREST Cost of Energy Models,”
https://financere.nrel.gov/finance/content/CREST-model NREL. “System Advisor Model,” https://sam.nrel.gov/ Office of Energy Efficiency & Renewable Energy. “Soft Costs,”
http://energy.gov/eere/sunshot/soft-costs

83
Olson, Wayne. “Customer Choice, Solar 3rd-Party Operators, Utility Ratemaking, and
the Future of the Electric Distribution Business,” Seeking Alpha. 29 February 2016. http://seekingalpha.com/article/3941286-customer-choice-solar-3rd-party-operators-utility-ratemaking-future-electric-distribution
Olson, Wayne. The A to Z of Public Utility Regulation. Public Utilities Reports, Inc,
2015. Olson, Wayne. “Will Solar and Home Batteries Disrupt the Electric Utility Business
Model?” Seeking Alpha. 17 January 2016. http://seekingalpha.com/article/3815536-will-solar-home-batteries-disrupt-electric-utility-business-model
Pentland, William. “Regulated Utilities Are Spending Billions, But Why?” Forbes. 19
Nov 2015. http://www.forbes.com/sites/williampentland/2015/11/19/regulated-utilities-are-spending-billions-but-why/#4383cdfa44be
Porter, Michael E. Competitive Strategy: Techniques for Analyzing Industries and
Competitors. Simon and Schuster, 1980. Puttre, Michael. “Utility Commission Order Bolsters N.C.’s Status as a Rising Solar
Power,” Solar Industry Magazine. 08 January 2015. http://solarindustrymag.com/utility-commission-order-bolsters-ncs-status-as-a-rising-solar-power
Pyper, Julia and Eric Wesoff. “Georgia Power is Launching its Own Rooftop Solar
Business,” Greentech Media. 01 July 2015. https://www.greentechmedia.com/articles/read/Georgia-Power-is-Launching-its-Own-Rooftop-Solar-Business
Pyper, Julia. “Arizona Utilites Get Approval to Own Rooftop Solar,” Greentech Media.
26 December 2014. http://www.greentechmedia.com/articles/read/arizona-utilites-get-the-go-ahead-to-own-rooftop-solar
Pyper, Julia. “Californians Just Saved $192 Million Thanks to Efficiency and Rooftop
Solar,” Greentech Media. 31 May 2016. http://www.greentechmedia.com/articles/read/Californians-Just-Saved-192-Million-Thanks-to-Efficiency-and-Rooftop-Solar
Pyper, Julia, “Does Nevada’s Controversial Net Metering Decision Set a Precedent for
the Nation,” Greentech Media. 04 February 2016. https://www.greentechmedia.com/articles/read/nevada-net-metering-decision

84
Pyper, Julia. “Georgia Power’s Rooftop Solar Program Signs Up Only 5 Customers,” Greentech Media. 17 June 2016. http://www.greentechmedia.com/articles/read/Georgia-Powers-Rooftop-Solar-Program-Signs-Up-Only-Five-Customers
Pyper, Julia. “How Arizona’s Biggest Utility is Modelling the Customer of the Future in
Its ‘Rate Design Laboratory,” Greentech Media. 13 July 2016. https://www.greentechmedia.com/articles/read/How-APS-is-Modeling-the-Utility-Customer-of-the-Future
Pyper, Julia. “Maine Proposes to Replace Net Metering With a Market-Based
Alternative,” Greentech Media. 26 February 2016. https://www.greentechmedia.com/articles/read/Maine-Proposes-To-Replace-Net-Metering-With-a-Market-Based-Al
Pyper, Julia. “PG&E Launches Community Solar Program Enabling Customers to Go
100% Renewable,” Greentech Media. 05 February 2016. https://www.greentechmedia.com/articles/read/pge-launches-community-solar-program-enabling-customers-to-go-100-renewable
Pyper, Julia. “Regulators Cut Funding for Efficiency Program in Nevada.” Greentech
Media. 25 January 2016. http://www.greentechmedia.com/articles/read/regulators-cut-funding-for-efficiency-programs-in-nevada
Pyper, Julia. “Regulators Reject Third-Party-Ownership Petition in North Carolina,”
Greentech Media. 18 April 2016. http://www.greentechmedia.com/articles/read/regulators-reject-third-party-ownership-Petition-in-north-carolina
Pyper, Julia. “Tendril Launches a Customer Acquisition Solution for Utility-Owned
Community Solar,” Greentech Media. 08 June 2016. http://www.greentechmedia.com/articles/read/Tendril-Launches-a-Customer-Acquisition-Solution-for-Utility-Owned-Communit
Pyper, Julia. “Tucson Electric Power Seeks to Expand Its Residential Solar Programs,”
10 July 2015. http://www.greentechmedia.com/articles/read/tucson-electric-power-seeks-to-expand-its-residential-solar-programs
Pyper, Julia. “Utilities See Distributed Generation as a Challenge—and Owning It as
the Solution,” Greentech Media. 18 February 2016. https://www.greentechmedia.com/articles/read/utilities-see-distributed-generation-as-a-challenge-and-owning-it-as-the-so

85
Rahim, Saqib and Peter Behr. “Grid: Utilities give a first peek at N.Y.’s distributed energy future,” E&E News. 07 July 2016. http://www.eenews.net/energywire/stories/1060039893
Randazzo, Ryan. “APS solar customers facing approval delays while paying electric
bills,” AZ Central. 15 February 2016. http://www.azcentral.com/story/money/business/energy/2016/02/15/rooftop-solar-aps-delays-arizona-electric-bills/79842702/
Randazzo, Ryan. “How much power do you use at home? Not knowing could cost
you,” AZ Central. 08 May 2016. http://www.azcentral.com/story/money/business/energy/2016/05/08/how-much-power-do-you-use-home-not-knowing-could-cost-you/83988622/
Rhodes, Joshua D. “When Will Rooftop Solar Be Cheaper Than the Grid,” US News &
World Report. 31 March 2016. http://www.usnews.com/news/articles/2016-03-31/when-will-rooftop-solar-be-cheaper-than-the-grid
Roberts, David. “Imagining power utilities for the 21st century,” Grist. 04 June 2013.
http://grist.org/climate-energy/imagining-power-utilities-for-the-21st-century-with-slow-lorises/
Roberts, David. “New York is Transforming its Energy Systems. Meet the ‘Czar’ in
Charge,” Vox. 20 November 2015. http://www.vox.com/2015/11/20/9769856/new-york-kauffman-interview
Roberts, David. “Utilities for dummies: How they work and why that needs to change,”
Grist. 21 May 2013. http://grist.org/climate-energy/utilities-for-dummies-how-they-work-and-why-that-needs-to-change/
Roselund, Christian. “SolarCity continues streak of aggressively raising capital,” PV
Magazine. 22 March 2016. http://www.pv-magazine.com/news/details/beitrag/solarcity-continues-streak-of-aggressively-raising-capital_100023850/
Savenije, Davide. “What utility execs think the future holds,” Utility Dive. 27 January
2015. http://www.utilitydive.com/news/what-utility-execs-think-the-future-holds/356710/
Schwartz, David McGrath. “NV Energy customers may get zapped for conserving,”
Las Vegas Sun. 04 May 2011. http://lasvegassun.com/news/2011/may/04/nv-energy-does-good-so-it-wants-raise/

86
Shimogawa, Duane. “Oahu solar energy industry continues to cool down,” Pacific Business News. 05 July 2016. http://www.bizjournals.com/pacific/news/2016/07/05/oahu-solar-energy-industry-continues-to-cool-down.html
Shimogawa, Duane. “Large majority of Hawaii solar companies reporting job losses,”
Pacific Business News. 06 July 2016. http://www.bizjournals.com/pacific/news/2016/07/06/large-majority-of-hawaii-solar-companies-reporting.html
Sherman, Amy. “PolitiFact: Is Florida 1 of 5 states that bans electricity sales by solar
installers?” Tampa Bay Times. 18 January 2015. http://www.tampabay.com/news/business/energy/politifact-is-florida-1-of-5-states-that-bans-electricity-sales-by-solar/2214172
Smart, Anne. “Value of Solar Tariffs (VOSTs) Are Value of Solar Taxes,” Huffington
Post. 28 March 2014. http://www.huffingtonpost.com/anne-smart/value-of-solar-power-tariffs-_b_5051448.html
Smith, Rebecca and Lynn Cook. “Hawaii Wrestles with Vagaries of Solar Power,” The
Wall Street Journal. 28 June 2015. http://www.wsj.com/articles/hawaii-wrestles-with-vagaries-of-solar-power-1435532277
Smith, Rebecca. “Utilities’ Profit Recipe: Spend More.” The Wall Street Journal. 20
April 2015. http://www.wsj.com/articles/utilities-profit-recipe-spend-more-1429567463
Sommer, Lauren and Molly Samuel. “Like Night and Day: How Two States’ Utilities
Approach Solar,” NPR. 01 January 2016. http://www.npr.org/2016/01/01/460960961/like-night-and-day-how-two-states-utilities-approach-solar
“Southern Nevada 12-Year Net-Metering Rate Change Forecast” NVEnergy. Accessed
05 July 2016. https://www.nvenergy.com/renewablesenvironment/renewablegenerations/NetMetering.cfm?utm_source=nve_frontpage&utm_medium=banner&utm_content=net-meter-rates&utm_campaign=net-meter-ratesFP
Spector, Phillip. “Monetizing US Tax Credits in Solar Project Finance,” Naclean
Energy. Nov/Dec 2008. http://www.troutmansanders.com/files/FileControl/abb5bb08-2952-4f30-99cf-74bbc5827e97/7483b893-e478-44a4-8fed-f49aa917d8cf/Presentation/File/NACE_NovDec2008_Spector.pdf

87
St. John, Jeff. “California’s DRAM Auction Contract for 82MW of Distributed Energy as Grid Resource,” Greentech Media. 03 August 2016. http://www.greentechmedia.com/articles/read/californias-dram-auction-Contracts-for-82mw-of-distributed-energy-as-grid-r
St. John, Jeff. “Southern California Edison’s Grand Software Plan Is a System of
Systems at the Grid Edge,” Greentech Media. 11 February 2016. http://www.greentechmedia.com/articles/read/Southern-California-Edisons-Grand-Software-Plan-is-a-System-of-Systems-at
“State of the Electric Utility: 2015 Survey Results,” Utility Dive. 2015.
https://s3.amazonaws.com/dive_assets/rlpsys/utilitydive_seu_2015.pdf Steward, D and E. Doris. “The Effect of State Policy Suites on the Development of
Solar Markets,” National Renewable Energy Laboratory. November 2014. http://www.nrel.gov/docs/fy15osti/62506.pdf
Sweet, Cassandra. “Solar-Panel Installers Face Clouded Future,” The Wall Street
Journal. 25 March 2016. http://www.wsj.com/articles/solar-panel-installers-face-clouded-future-1458926502
Sweet, Cassandra. “Solar-Power Sharing Programs May Be Poised to Take Off,” The
Wall Street Journal. 13 September 2015. http://www.wsj.com/articles/solar-power-sharing-programs-may-be-poised-to-take-off-1442197726
Sweet, Cassandra. “Wind, Solar Companies Get Boost From Tax-Credit Extension,”
The Wall Street Journal. 15 December 2015. http://www.wsj.com/articles/wind-solar-companies-get-boost-from-tax-credit-extension-1450311501
“Table 6.2B. Net Summer Capacity Using Primarily Renewable Energy Sources and by
State, May 2016 and 2015,” EIA. Accessed 08 August. 2016. http://www.eia.gov/electricity/monthly/epm_table_grapher.cfm?t=epmt_6_02_b
Taylor, Mike. “The Minnesota Solar Experiment – Solar in Minnesota? Part I,”
Renewable Energy World. 03 June 2016. http://www.renewableenergyworld.com/articles/2016/06/the-minnesota-solar-experiment-solar-in-minnesota-part-i.html
Third-Party Solar Financing,” SEIA. Accessed 09 July 2016.
http://www.seia.org/policy/finance-tax/third-party-financing. “Three Party Strategy,” NV Energy. Accessed 08 August 2016.
https://www.nvenergy.com/company/energytopics/threepartstrategy.cfm

88
Trabish, Herman K. “5 maps that show where the action is on solar policy,” Utility Dive. 22 March 2016. http://www.utilitydive.com/news/5-maps-that-show-where-the-action-is-on-solar-policy/415938/
Trabish, Herman K. “Arizona’s utility-owned solar programs: the new business models
utilities are looking for?,” Utility Dive. 07 January 2015. http://www.utilitydive.com/news/arizonas-utility-owned-solar-programs-the-new-business-models-utilities-a/348331/
Trabish, Herman. “Arizona utility TEP wants to add solar fee, reduce net metering
credit,” http://www.utilitydive.com/news/arizona-utility-tep-wants-to-add-solar-fee-reduce-net-metering-credit/408791/
Trabish, Herman K. “Community-Owned Solar Creates a New Business Model in
Massachusetts,” Greentech Media. 21 January 2014. https://www.greentechmedia.com/articles/read/How-Virtual-Net-Energy-Metering-Attracts-Money-to-Solar-in-Massachusetts
Trabish, Herman. “Duke Buying $500M of North Carolina Solar to Mixed Reviews,”
Greentech Media. 18 September 2014. http://www.greentechmedia.com/articles/read/Duke-Buying-500M-of-North-Carolina-Solar-to-Mixed-Reviews
Trabish, Herman. “Inside Georgia Power’s Move into the Residential Solar Market,” 11
June 2015. http://www.utilitydive.com/news/inside-georgia-powers-move-into-the-residential-solar-market/400562/
Trabish, Herman. “The fight over solar moves from net metering to rate design,” Utility
Dive. 03 November 2014. http://www.utilitydive.com/news/the-fight-over-solar-moves-from-net-metering-to-rate-design/327742/
Trabish, Herman. “Top Ten Solar Utilities See Growth Through Declining Prices,
Favorable Policies,” Utility Dive. 28 April 2016. http://www.utilitydive.com/news/top-10-solar-utilities-see-growth-through-declining-prices-favorable-polic/417990/
Tweed, Katherine. “Georgia Power Leverages Smart Meters for Prepaid Electricity,”
Greentech Media. 22 April 2015. http://www.greentechmedia.com/articles/read/georgia-power-leverages-smart-meters-for-prepay
Tweed, Katherine. “States Are Doing a Poor Job of Measuring Net-Metering Caps,
According to Report,” Green Tech Media. 03 September 2015. http://www.greentechmedia.com/articles/read/murky-net-metering-reporting-slowing-solar-growth

89
US Department of Energy. “Soft Costs Fact Sheet,” May 2016.
http://energy.gov/sites/prod/files/2016/05/f32/SC%20Fact%20Sheet-508.pdf “U.S. Economy and Electricity Demand Growth Are Linked But Relationship Is
Changing,” U.S. Energy Information Administration. 22 March 2013. http://www.eia.gov/todayinenergy/detail.cfm?id=10491
“Utility Scale Solar in South Atlantic Region Dominated by North Carolina, Georgia,”
EIA. Accessed 08 August 2016. http://www.eia.gov/todayinenergy/detail.cfm?id=24192
Verzola, Roberto. “Net Metering History & Logic – Part 1,” Clean Technica. 6
September 2015. http://cleantechnica.com/2015/09/06/net-metering-history-logic-part-1/
Walton, Robert. “ConEd virtual power plant shows how New York’s REV is reforming
utility practices,” Utility Dive. 21 June 2016. http://www.utilitydive.com/news/coned-virtual-power-plant-shows-how-new-yorks-rev-is-reforming-utility-pra/421053/
Walton, Robert. “Hawaii Solar Sector Braces for Job Losses after Net Metering
Decision,” Utility Dive. 29 March 2016. http://www.utilitydive.com/news/hawaii-solar-sector-braces-for-job-losses-after-net-metering-decision/416417/
Wesoff, Eric. “New York’s Con Ed is Building a Virtual Power Plant From Sunverge
Energy Storage and SunPower PV,” Greentech Media. 12 June 2016. http://www.greentechmedia.com/articles/read/New-Yorks-ConEd-Is-Building-a-Virtual-Power-Plant-From-Sunverge-Energy-Sto
“What is a Qualifying Facility?” Federal Energy Regulatory Commission. 30 June 2016.
http://www.ferc.gov/industries/electric/gen-info/qual-fac/what-is.asp York, Dan and Marty Kushler. “Utility Initiatives: Integrated Resource Planning,”
American Council for an Energy Efficient Economy. 02 July 2014. http://aceee.org/policy-brief/utility-initiatives-integrated-resource-planning