thesis - defense technical information center engine for uav and missile applications 6. author(s)...
TRANSCRIPT

NAVAL POSTGRADUATE SCHOOL Monterey, California
THESIS
Approved for public release; distribution is unlimited
DESIGN AND TESTING OF A COMBUSTOR FOR A TURBO-RAMJET FOR UAV AND MISSILE
APPLICATIONS
by
Ross H. Piper III
March 2003
Thesis Advisor: Garth V. Hobson Second Reader: Raymond P. Shreeve

THIS PAGE IS INTENTIONALLY LEFT BLANK

i
REPORT DOCUMENTATION PAGE Form Approved OMB No. 0704-0188 Public reporting burden for this collection of information is estimated to average 1 hour per response, including the time for reviewing instruction, searching existing data sources, gathering and maintaining the data needed, and completing and reviewing the collection of information. Send comments regarding this burden estimate or any other aspect of this collection of information, including suggestions for reducing this burden, to Washington headquarters Services, Directorate for Information Operations and Reports, 1215 Jefferson Davis Highway, Suite 1204, Arlington, VA 22202-4302, and to the Office of Management and Budget, Paperwork Reduction Project (0704-0188) Washington DC 20503. 1. AGENCY USE ONLY (Leave blank)
2. REPORT DATE March 2003
3. REPORT TYPE AND DATES COVERED Master’s Thesis
4. TITLE AND SUBTITLE: Design and Testing of a Combustor for a Turbo-ramjet Engine for UAV and Missile Applications
6. AUTHOR(S) Ross H. Piper III
5. FUNDING NUMBERS
7. PERFORMING ORGANIZATION NAME(S) AND ADDRESS(ES) Naval Postgraduate School Monterey, CA 93943-5000
8. PERFORMING ORGANIZATION REPORT NUMBER
9. SPONSORING / MONITORING AGENCY NAME(S) AND ADDRESS(ES) N/A
10. SPONSORING / MONITORING AGENCY REPORT NUMBER
11. SUPPLEMENTARY NOTES The views expressed in this thesis are those of the author and do not reflect the official policy or position of the Department of Defense or the U.S. Government. 12a. DISTRIBUTION / AVAILABILITY STATEMENT Approved for public release; distribution is unlimited
12b. DISTRIBUTION CODE
13. ABSTRACT (maximum 200 words) An existing freejet facility was upgraded and its range of operation extended into the high subsonic regime for operation as a test rig for the development of a combined-cycle, turbo-ramjet engine. A combustor was designed, developed, and tested as the afterburner for the turbo-ramjet engine. At subsonic speeds with the afterburner running, an increase in thrust of 40% was measured over the baseline turbojet running at 80% spool speed. A Computational Fluid Dynamics model of the flow through the shrouded turbojet engine was developed and successfully used to assist in predicting the bypass ratio of the engine at different Mach numbers. Numerous recommendations were made to improve the operation of the test rig, to improve the performance of the turbo-ramjet engine, and refine the numerical models. These recommended improvements will extend the present capabilities to design and analyze small combined cycle engines which have an application in unmanned aerial vehicles and missiles.
15. NUMBER OF PAGES
97
14. SUBJECT TERMS turbo-ramjet, afterburner, UAV propulsion, missile propulsion, Computational Fluid Dynamics, OVERFLOW, freejet, small-scale engines
16. PRICE CODE
17. SECURITY CLASSIFICATION OF REPORT
Unclassified
18. SECURITY CLASSIFICATION OF THIS PAGE
Unclassified
19. SECURITY CLASSIFICATION OF ABSTRACT
Unclassified
20. LIMITATION OF ABSTRACT
UL

ii
THIS PAGE IS INTENTIONALLY LEFT BLANK

iii
Approved for public release; distribution is unlimited
DESIGN AND TESTING OF A COMBUSTOR FOR A TURBO-RAMJET FOR UAV AND MISSILE
APPLICATIONS
Ross H. Piper III Lieutenant, United States Navy
B.S., United States Naval Academy, 1995
Submitted in partial fulfillment of the requirements for the degree of
MASTER OF SCIENCE IN AERONAUTICAL ENGINEERING
from the
NAVAL POSTGRADAUTE SCHOOL March 2003
Author: Ross H. Piper III Approved by: Garth V. Hobson
Thesis Advisor Raymond P. Shreeve
Second Reader Max F. Platzer Chairman, Department of Aeronautics

iv
THIS PAGE IS INTENTIONALLY LEFT BLANK

v
ABSTRACT
An existing freejet facility was upgraded and its range of operation extended into
the high subsonic regime for operation as a test rig for the development of a combined-
cycle, turbo-ramjet engine. A combustor was designed, developed, and tested as the
afterburner for the turbo-ramjet engine. At subsonic speeds with the afterburner running,
an increase in thrust of 40% was measured over the baseline turbojet running at 80%
spool speed. A Computational Fluid Dynamics model of the flow through the shrouded
turbojet engine was developed and successfully used to assist in predicting the bypass
ratio of the engine at different Mach numbers. Numerous recommendations were made
to improve the operation of the test rig, to improve the performance of the turbo-ramjet
engine, and refine the numerical models. These recommended improvements will extend
the present capabilities to design and analyze small combined cycle engines which have
an application in unmanned aerial vehicles and missiles.

vi
THIS PAGE IS INTENTIONALLY LEFT BLANK

vii
TABLE OF CONTENTS
I. INTRODUCTION .................................................................................................1 II. ENGINE DEVELOPMENT PROGRAMS .........................................................5
A. EXPERIMENTAL SETUP.......................................................................5
1. Overview .........................................................................................5 2. Engine Test Rig ..............................................................................5 3. Propane Pilot Burner Test Setup..................................................8 B. DATA ACQUISITION AND REDUCTION...........................................9 1. Overview .........................................................................................9 2. Instrumentation and Control a. Thrust Measurements........................................................9 b. Fuel Flow Rate Measurements .........................................9 c. Freejet Measurements .....................................................10 d. Pressure Measurements...................................................10 e. Flow Visualization............................................................10 C. FREEJET RESULTS ON SHROUDED ENGINE...............................12 1. Single Beam Thrust Measurements at 100% Spool Speed ......12 2. Dual Beam Thrust Measurements at 100% Spool Speed ........13 3. Summary of Shrouded Engine Thrust Measurements at 100% Spool Speed...................................................................................14
4. Mass Flow Rate and Velocity Calculations ...............................15
D. AFTERBURNER DESIGN AND DEVELOPMENT...........................20 1. Overview .......................................................................................20 2. Afterburner Sizing .......................................................................21 3. Initial Flame Holder Design........................................................22 4. Propane Pilot Flame Design........................................................25 5. Final Flame Holder Configuration.............................................27 6. Coleman Fuel Manifold ..............................................................28 E. FREEJET RESULTS ON TURBO-RAMJET......................................29 1. Afterburner Results .....................................................................29 2. Afterburner Comparison with Shrouded Turbojet at 80%
Spool Speed...................................................................................30
viii
III. COMPUTATIONAL FLUID DYNAMICS ANALYSIS .................................33 A. BACKGROUND ......................................................................................33 B. SOFTWARE.............................................................................................34 1. GRIDGEN ....................................................................................34
2. GRIDED........................................................................................34 3. OVERFLOW................................................................................34 4. FAST .............................................................................................34
C. RESULTS .................................................................................................35
1. Ramjet Shroud with Nose Cone..................................................35 2. Turbo-Ramjet Geometry with Inflow and Outflow Through
the Turbojet..................................................................................36 3. Turbo-Ramjet Geometry with Flow Through the Turbojet
with an Actuator Disk and Heating............................................37 IV. ANALYSIS OF DESIGN AND PREDICTION TOOLS .................................41 V. CONCLUSIONS AND RECOMMENDATIONS.............................................43 APPENDIX A. SOPHIA J450 ENGINE SPECIFICATIONS....................................45 APPENDIX B. INSTRUMENTATION CALIBRATION RESULTS .......................47 APPENDIX C. SHROUDED ENGINE AT 100% SPOOL SPEED IN FREEJET FLOW RESULTS ............................................................................................................53 APPENDIX D. SAMPLE MASS FLOW RATE CALCULATION AT M = 0.212 ..57 APPENDIX E. AFTERBURNER MEASUREMENTS ..............................................61 APPENDIX F. RESULTS AND INPUT FILES TO OVERFLOW...........................65 APPENDIX G. PREDICTED RESULTS FROM GASTURB ...................................73 LIST OF REFERENCES................................................................................................81 INITIAL DISTRIBUTION LIST ...................................................................................83

ix
LIST OF FIGURES Figure 1. SFC vs. Mach Number for Airbreathing Engines ......................................... 1 Figure 2. Schematic of Freejet Test Facility with Turbo-Ramjet Engine..................... 6 Figure 3. Engine Test Rig ............................................................................................. 6 Figure 4. Afterburner Fuel System Schematic.............................................................. 7 Figure 5. Single Beam Thrust Measurements at 100% Spool Speed ...........................12 Figure 6. Dual Beam Thrust Measurements at 100% Spool Speed..............................13 Figure 7. Shrouded Engine Thrust Measurements at 100% Spool Speed ....................14 Figure 8. Schematic of Pressure Measurement Locations............................................15 Figure 9. Pressure Measurement Diagram....................................................................16 Figure 10. Mixing Model Diagram.................................................................................18 Figure 11. Calculated Mass Flow Rate Through Shrouded Engine at 100%
Spool Speed ..................................................................................................19 Figure 12. Predicted Bypass Ratio for Shrouded Turbojet .............................................20 Figure 13. Afterburner Size ............................................................................................21 Figure 14. Flame Holder Design Diagram......................................................................23 Figure 15. Initial Flame Holder ......................................................................................25 Figure 16. Final Flame Holder Configuration with Pilot Flame ....................................27 Figure 17. Coleman Fuel Manifold Installed on Turbo-Ramjet ....................................28 Figure 18. Schematic of the Final Turbo-Ramjet Engine Configuration .......................29 Figure 19. Thrust Measurement with Afterburner at 80% Spool Speed ........................30 Figure 20. Comparison of Afterburner vs. Non-afterburner at 80% Spool Speed .........31 Figure 21. Turbo-Ramjet at Maximum Afterburner at M∞ = 0.15.................................32 Figure 22. Ramjet Grid ...................................................................................................35 Figure 23. Mach Number Distribution through Ramjet at M∞=0.6 ...............................36 Figure 24. Turbo-Ramjet Grid with Engine Inflow/Outflow .........................................37 Figure 25. Mach Number Distribution for Engine Inflow/Outflow at M∞=0.6 .............37 Figure 26. Close-Up of Grid with Engine Through-Flow Modeling .............................38 Figure 27. Mach Number Distribution for Flow Through Turbo-Ramjet at M∞=0.6 ....39 Figure 28. Pressure Distribution for Flow Through Turbo-Ramjet at M∞=0.6..............41 Figure 29. Density Distribution for Flow Through Turbo-Ramjet at M∞=0.6...............42 Figure 30. Thrust Beam Calibration ...............................................................................47 Figure 31. Fuel Flow Calibration....................................................................................48 Figure 32. P1 Pressure Transducer Calibration ..............................................................50 Figure 33. P2 Pressure Transducer Calibration ..............................................................50 Figure 34. Pressure Distribution for Turbo-Ramjet Shroud at M∞=0.6 .........................65 Figure 35. Stagnation Pressure Distribution for Turbo-Ramjet Shroud at M∞=0.6 .......65 Figure 36. L2 Residual Norm for Turbo-Ramjet shroud at M∞=0.6 ..............................66 Figure 37. Pressure Distribution for Turbo-Ramjet with Engine Inflow/Outflow at M∞=0.6 ......................................................................................................68 Figure 38. L2 Residual Norm for Turbo-Ramjet with Engine Inflow/Outflow at M∞=0.6 .....................................................................................................68

x
Figure 39. Temperature Distribution for Turbo-Ramjet with Engine Through Flow at M∞=0.6 ............................................................................................70 Figure 40. Stagnation Pressure Distribution for Turbo-Ramjet with Engine Through Flow at M∞=0.6 .............................................................................70 Figure 41. L2 Residual Norm for Turbo-Ramjet with Engine Through Flow at M∞=0.6 ............................................................................................71 Figure 42. Predicted J450 Turbojet Net Thrust vs. Mach Number ................................73 Figure 43. Predicted J450 Turbojet Turbine Exit Temperature vs. Mach Number ........74 Figure 44. Predicted J450 Turbojet Turbine Exit Pressure vs. Mach Number...............75 Figure 45. Predicted J450 Turbojet Mass Flow Rate vs. Mach Number........................76

xi
LIST OF TABLES Table A1. Sophia J450 Engine Specifications................................................................45 Table B1. Thrust and Fuel Flow Rate Calibration Values..............................................49 Table B2. Pressure Transducer 1 Calibration Values .....................................................51 Table B3. Pressure Transducer 2 Calibration Values .....................................................51 Table C1. Measurements of Single Thrust Beam Run at 100% Spool Speed ................53 Table C2. Measurements of Dual Thrust Beam Run 1 at 100% Spool Speed................54 Table C3. Measurements of Dual Thrust Beam Run 2 at 100% Spool Speed................55 Table C4. Measurements of Garcia Run 2 at 100% Spool Speed (From: Ref 7) ...........56 Table D1. Mass Flow Calculations Run 1 ......................................................................59 Table D2. Mass Flow Calculations Run 2 ......................................................................60 Table E1. Measurements of Afterburner Run 1..............................................................61 Table E2. Measurements of Afterburner Run 2..............................................................62 Table E3. Results From Garcia (Ref 7) Shrouded Engine in Freejet at 80% Spool Speed..............................................................................................................63 Table G1. Predicted Off-Design Values of J450 Turbojet ............................................73 Table G2. Single Cycle Results of Turbo-Ramjet Modeled as Mixed Flow Turbofan ..77 Table G3. Input Table for GASTURB Turbofan Modeling of Turbo-ramjet.................78

xii
THIS PAGE IS INTENTIONALLY LEFT BLANK

1
I. INTRODUCTION
There have been many advances in air-breathing propulsion since the invention of
the first gas turbine engine over sixty years ago. Single-cycle, airbreathing engines have
been optimized to operate efficiently over a relatively narrow Mach number range as
shown in Figure 1 below. The specific fuel consumption (SFC) of a high bypass turbofan
is a minimum at subsonic speeds, a low bypass turbofan (usually with reheat) is
optimized in the supersonic range below Mach 2, and the afterburning turbojet operates
most efficiently in the Mach 3 to 4 range. Beyond Mach 4 the ramjet theoretically is the
most efficient engine up to a Mach number of 6, beyond which the supersonic
combustion ramjet (SCRAMjet) has been predicted to be most efficient at approximately
Mach 8. The most striking feature of each of the engines shown in Figure 1 is that with
increasing Mach number, the turbomachinery within each engine is reduced or
completely eliminated.
MACH NO.
0 1 2 4 6 8 10
SFC
High Bypass Turbofan
Low Bypass Turbofan
Turbojet
RamjetScramjet
Turbo-RamjetVariable Cycle Turbofan
Figure 1. SFC vs. Mach Number for Airbreathing Engines

2
The only way to increase the operating range of airbreathing engines is to
consider combined cycle engines (CCE), such as variable cycle turbofans for transonic
flight and turbo-ramjet engines for high supersonic flight.
The first turbo-ramjet engine powered the Nord-Aviation Griffon II in 1953. The
French Griffon II aircraft was a ramjet wrapped around a SNECMA Atar 101 E3 dry
turbojet. By controlling the fuel flow rate to the two engines, the fraction of the total
thrust generated by the ramjet varied from 0 under static conditions to over 80 percent at
a flight Mach number of 2. It flew at Mach 2.1 at an altitude of 18,600 m (61,000 ft), and
established a world speed record for the 100 km closed circuit of 1640 km/h in 1959 (Ref
1). In the early 1960’s the United States developed the SR-71 Blackbird, which had two
Pratt and Whitney J58 turbo-ramjet engines each producing 32,500 lbs thrust. It was
capable of a cruise Mach number of 3.0 at an altitude of 24,400 m. In September 1974
one flew from New York to London in less than 2 hours, at an average speed of more
than 2,900 km/h (1,800 mi/h). Maximum range at that speed was 4,825 km (3,000 mi)
(Ref 2). Since the design of the SR-71 Blackbird the focus of research and testing has
been limited to below Mach 3 or above Mach 6.
Despite the emphasis on the design and development of Unmanned Aerial
Vehicles (UAVs) or Unmanned Combat Aerial Vehicles (UCAVs), there has been little
published work with small-scale gas turbine engines. Most of these vehicles are designed
and operated in the subsonic region using internal-combustion, propeller-driven engines
or turbofan engines. The development of a small scale Combined Cycle Engine (CCE)
that could self-sufficiently accelerate from rest to Mach 6 would clearly be a beneficial
technology for high speed UAVs or UCAVs. In addition, a low cost self-sustaining
turbo-ramjet would allow for UAVs half the size of those currently in operation to fly
supersonically to targets, either to deliver ordinance or gather intelligence.
Work was started at the Naval Postgraduate School’s Turbopropulsion Laboratory
(TPL) in June 1998 to design and develop a turbo-ramjet engine. Initially, Rivera (Ref 3)
tested the performance of the Sophia J450 engine, a low-cost turbojet engine for model
aircraft. In March 1999, Hackaday (Ref 4) performed a study of the static performance

3
of the J450 with a constant area ejector. In September 1999, Andreou (Ref 5) tested the
J450 in a shrouded duct of varying lengths with an elliptical intake.
In June 2000, al-Namani (Ref 6) continued the testing of the J450 in a shrouded
duct of varying lengths. He measured engine shaft rotational speed and exhaust gas
temperature on a remotely controlled and instrumented engine. Finally, he designed the
current supersonic intake for a flight Mach number of 2.0.
In December 2000, Garcia (Ref 7) tested the ducted engine in a newly designed
and constructed freejet facility at TPL. Tests were completed of the engine running with
elliptical and supersonic intakes. He also tested the shrouded engine in the freejet facility
at speeds less than Mach 0.5 with and without the engine running at various Mach
numbers and engine spool speeds. Garcia used Computational Fluid Dynamics (CFD) to
analyze the Mach number and pressure distributions of the shrouded engine intake at
Mach 2. Finally, Garcia also completed preliminary design and testing for a fuel injection
system (spray bars) for a possible afterburner/turbo-ramjet configuration.
The objective of this thesis was the design, development, and testing of a
combustor or afterburner for the turbo-ramjet engine. It had to successfully light off
under static conditions and remain operational with increasing forward speed.
Experimental and computational tools were also developed for the analysis of such a
combined cycle engine, which was also analyzed with currently available performance
prediction software for conventional engines.

4
THIS PAGE IS INTENTIONALLY LEFT BLANK

5
II. ENGINE DEVELOPMENT PROGRAMS
A. EXPERIMENTAL SETUP
1. Overview
The purpose of this thesis was to design, develop, and test a combustor for a
turbo-ramjet engine using the Sophia J450 jet engine as the gas generator. The J450 is a
small commercially available turbojet engine that is in design and principle of operation
very similar to a full-scale turbojet engine. Pertinent performance specifications are
listed in Appendix A as Table A1.
2. Engine Test Rig
Figure 2 shows a schematic of the turbo-ramjet engine in the freejet facility as
tested during the current research. Numerous modifications were implemented to
facilitate development and testing of the turbo-ramjet. The original engine test rig was
documented by Garcia in Ref 7. An additional strain-gauged thrust beam was added to
the existing thrust stand. The additional beam increased the stiffness of the structure and
provided for redundancy in measurement. An additional full Whetstone bridge was
placed on the additional beam. The strain measuring systems from both beams were
wired in parallel on the same data acquisition line. A concern that arose from prior
testing was that the Angle of Attack of the engine changed with respect to Mach number
as it pitched as a result of the large pressure forces. By securing the engine assembly
with two thrust beams, the engine would remain horizontal at all Mach numbers.
At Mach numbers greater than 0.3, the forces on the engine were large enough to
induce a transverse oscillatory condition. In order to reduce these oscillations and
maintain stability, support bars were placed on each side of the engine assembly next to
the forward engine mounting strut as shown in Figure 3. This eliminated the undesired
vibrations and oscillations.

6
Turbo-ramjet engine
Air supply system
Dual thrust beams
6" diameterfreejet
Exhaustcollector
Figure 2. Schematic of Freejet Test Facility with Turbo-Ramjet Engine
Figure 3. Engine Test Rig

7
One pressure transducer was installed on the freejet plenum upstream of the final
6” nozzle. Pressure transducers were mounted on the main I-beam to allow for pressure
measurements throughout the length of the turbo-ramjet. Multiple video cameras were
used as flow visualization tools and to document testing. A low pressure propane fuel
system was installed for the ramjet combustor pilot light. An additional Coleman Fuel
tank and delivery system were installed to provide fuel to the ramjet combustor as shown
in Figure 4.
Colemangas manifold
Propanegas manifold
Propanetank
Solenoid controlledvalves
12 voltelectricfuel pump
Colemanfuel tank
Turbo-ramjet engine
Figure 4. Afterburner Fuel System Schematic

8
3. Propane Pilot Burner Test Setup
The aft portion of the turbo-ramjet was removed and placed in a freestanding
fashion in order to investigate propane combustion. The purpose of this test was to
determine the feasibility of designing and implementing a propane pilot flame to facilitate
afterburner/ramjet combustion. Propane was stored in a standard low pressure tank and a
standard regulator attachment hose was used and routed from outside the laboratory
inside through two fail-safe, electrically operated, solenoid valves. The propane gas was
routed through the gas line to the manifold shown previously in Figure 4.
The aft duct was secured horizontally within the freejet test rig. This allowed for
quick reassembly and modification if necessary. A large blower was placed upstream to
simulate slow velocity flight conditions, and as a safety precaution to blow flames and
unburned propane out of the laboratory through the exhaust duct.

9
B. DATA ACQUISITION AND REDUCTION
1. Overview
The HP9000 Series 300 workstation was used to control the data acquisition
system and store the measured data. The system was well documented by al-Namani
(Ref 6) and Garcia (Ref 7). Measurements were taken of net engine thrust, engine fuel
flow rate, freejet plenum pressure, and static pressures at two ports in the shroud
assembly. Voltages from the various sensors were acquired using a [HP6944A] DACU
in conjunction with a HP digital voltmeter [DVM], which received signals through a
signal conditioner. The DACU, DVM, and multi-programmer were connected to the
workstation via a general purpose [IEEE-448] interface bus.
2. Instrumentation and Control
a. Thrust Measurements
The engine thrust was determined using the two beams from which the
engine was suspended. Each beam contained four strain-gages [two on each side] that
were configured in a full Wheatstone bridge, which were connected in parallel. The
thrust signal was read through channel six on the signal conditioner panel. Prior to
engine testing, the thrust beams were calibrated using the device shown by Garcia in Ref
7 in both the negative and positive directions, so as to measure both thrust and drag.
Typical calibration results are provided in Appendix B as Table B1.
b. Fuel Flow Rate Measurements
The fuel flow was determined by using the existing apparatus as shown by
Garcia in Ref 7. Two strain gages configured in a half Wheatstone bridge were used on
the cantilevered beam to measure the fuel tank weight. The signal from the bridge was
provided to the data acquisition system through Channel 0 at the signal conditioner panel.
The data acquisition system took measurements of the current fuel tank weight over a
constant time interval. The change in fuel weight was calculated which gave the fuel
flow rate. Prior to engine testing, the beam was calibrated using known weights, the
results of which are provided in Appendix B as Table B1.

10
c. Freejet Measurements
The engine inlet Mach number was determined by measuring the total
pressure in the duct upstream of the freejet nozzle. The pressure was measured using a
calibrated pressure transducer which measured the total pressure in the duct. The
ambient pressure was measured in the room using a standard wall-mounted barometer.
The total pressure was the sum of ambient pressure and the pressure measured by the
transducer. Rearranging the expression below
γγγ 1
2 )2
11(−
−+= M
PP
amb
t
(1)
to get Mach number gave
−
−
=−
11
2 1γγ
γ amb
t
PP
M
(2)
This allowed for the Mach number of the freejet flow to be calculated. Calibration of the
pressure transducer used established a linear output of 1000 mV to 1 psid, differential
pressure.
d. Pressure Measurements
Two pressure transducers were installed on the top of the support I-beam
to be connected to the shroud at various locations. The transducers measured static
pressure throughout the ramjet duct. These measurements were used to estimate mass
flow rates throughout the ramjet. Typical calibration results are located in Appendix B as
Figures 32 and 33 and tables B2 and B3.
e. Flow Visualization
Flow visualization was achieved using a video camera with zoom lens
directed up the exhaust of the freejet facility at the exhaust of the turbo-ramjet. This

11
allowed for instant feedback of the results of any changes made to the flame holder or
fuel injection assemblies, after a test run, and to document the run itself.
A video feed was provided in the lab during the last test run in order for
the test conductors to see flame position and quality behind the flame holder. This
allowed for adjustments to be made to the fuel/air mixture in real time.

12
C. FREEJET RESULTS ON SHROUDED ENGINE
1. Single Beam Thrust Measurements at 100% Spool Speed
In order to repeat the thrust measurements by Garcia (Ref 7), a freejet test on the
shrouded engine was conducted. The air supply tanks were pressurized to 50 psi. The
engine was started and stabilized at 100% spool speed. The air supply system valve was
opened to achieve a Mach number of approximately M = 0.5. The Mach number of the
freejet was allowed to decrease to M < 0.2. The duration of the test run was
approximately 6 minutes. Results from this test are shown graphically below. A table of
numerical values is given in Appendix C as table C1.
-40
-35
-30
-25
-20
-15
-10
-5
0
5
0.0 0.1 0.2 0.3 0.4 0.5 0.6Mach Number
Thr
ust (
lbf)
Figure 5. Single Beam Thrust Measurements at 100% Spool Speed

13
2. Dual Beam Thrust Measurements at 100% Spool Speed
After the addition of the second thrust beam and the two variable location static
pressure transducers, a freejet test of the dual beam thrust stand was conducted. The air
supply tanks were charged to 125 psi for the first run. Thrust, fuel flow, total pressure,
and static pressure measurements were taken. The run lasted approximately 5 minutes
after which, the tank pressure had decreased to 105 psi.
A second run was conducted to obtain measurements of thrust, fuel flow, total
pressure, and static pressure at higher Mach numbers than obtained in the first run. With
the lower pressure in the tanks, the valve was opened more to obtain a larger flow rate
and corresponding Mach number. This run lasted approximately 5 minutes. Graphical
depiction of the results is shown below. A full table of numerical measurements is
located in Appendix C as tables C2 and C3.
-60
-50
-40
-30
-20
-10
0
10
20
0.0 0.1 0.2 0.3 0.4 0.5 0.6Mach Number
Thr
ust (
lbf)
Run 1 Run 2
Figure 6. Dual Beam Thrust Measurements at 100% Spool Speed

14
3. Summary of Shrouded Engine Thrust Measurements at 100% Spool Speed Shown below is a plot of net thrust vs. Mach number for both the single beam and
dual beam runs. Also included are the results by Garcia in Ref 7 for his run on 19 August
2000.
-60
-50
-40
-30
-20
-10
0
10
20
0.0 0.1 0.2 0.3 0.4 0.5 0.6
Mach Number
Thr
ust (
lbf)
Garcia 19 Aug 2000 Run #1 22 Nov 2002Run #2 22 Nov 2002 26-Aug-02
Figure 7. Shrouded Engine Thrust Measurements at 100% Spool Speed
The results from all four runs were very similar. The addition of the second thrust
beam did not significantly change the thrust measurements. The trend in the
measurement was as a result of the difference between the positive thrust vs. Mach
number of the J450 engine and the negative drag vs. Mach number of the intake spike as
calculated by Garcia in Ref 7 as Figure 19.

15
4. Mass Flow Rate and Velocity Calculations
The test run on 22 November had the primary purpose of verifying the changes to
the thrust measuring system. The secondary purpose was to measure pressure at two
locations on the shroud to calculate total mass flow rate through the shrouded engine as
shown in Figure 8.
Figure 8. Schematic of Pressure Measurement Locations
The Bernoulli equation
212m m
c
P Vg
ρ+ =constant
(3)
can be applied to describe the flow through a convergent nozzle as shown in Figure 9.
P1 P2
Pe

16
Figure 9. Pressure Measurement Diagram
Applying equation (3) to the flow between the duct and exit planes, the equation becomes
22
21
21
ec
emc
m Vg
PVg
P ρρ +=+
(4)
The m subscript denotes the location where pressure was measured either at location P1
or P2. Rearranging and defining ∆Pm as the pressure measured by the transducers the
equation becomes
( )22
21
mec
em VVg
PPP −=−=∆ ρ
(5)
Density ρ was assumed to be constant, eρρ =1 so the continuity equation
== AVm ρ constant becomes
eemm VAVA =
(6)
or
em
em V
AA
V
=
(7)
Substituting for Vm,
Pm
Pe=PAmbient
Vm Ve

17
−=∆
m
ee
c AA
Vg
P 12
1 2ρ
(8)
and therefore
−
∆=
2
1
2
m
e
c
e
AA
PgV ρ
(9)
For one-dimensional isentropic flow, the nozzle has a discharge coefficient, Cd of
1. Nozzles typically have a discharge coefficient between 0.9 and 1 where the steady
flow continuity equation becomes
AVCm d ρ=
(10)
with Cd assumed to be .95 for the shrouded turbojet nozzle.
Equation (9) was used to calculate the exit velocity Ve and the total exit mass flow
rate was calculated using equation (10). The mass flow of the engine core was
approximated by using calculated off-design values from GASTURB (Ref 8). The mass
flow of the bypass flow was determined by subtracting the core flow from the total flow.
Total temperature of the flow in the duct was calculated iteratively using
6 6 6 6' 6' 6 '7
7 7
p t p tt
p
m C T m C TT
m C+
=
(11)
where stations 6 and 7 are depicted in Figure 10.
18
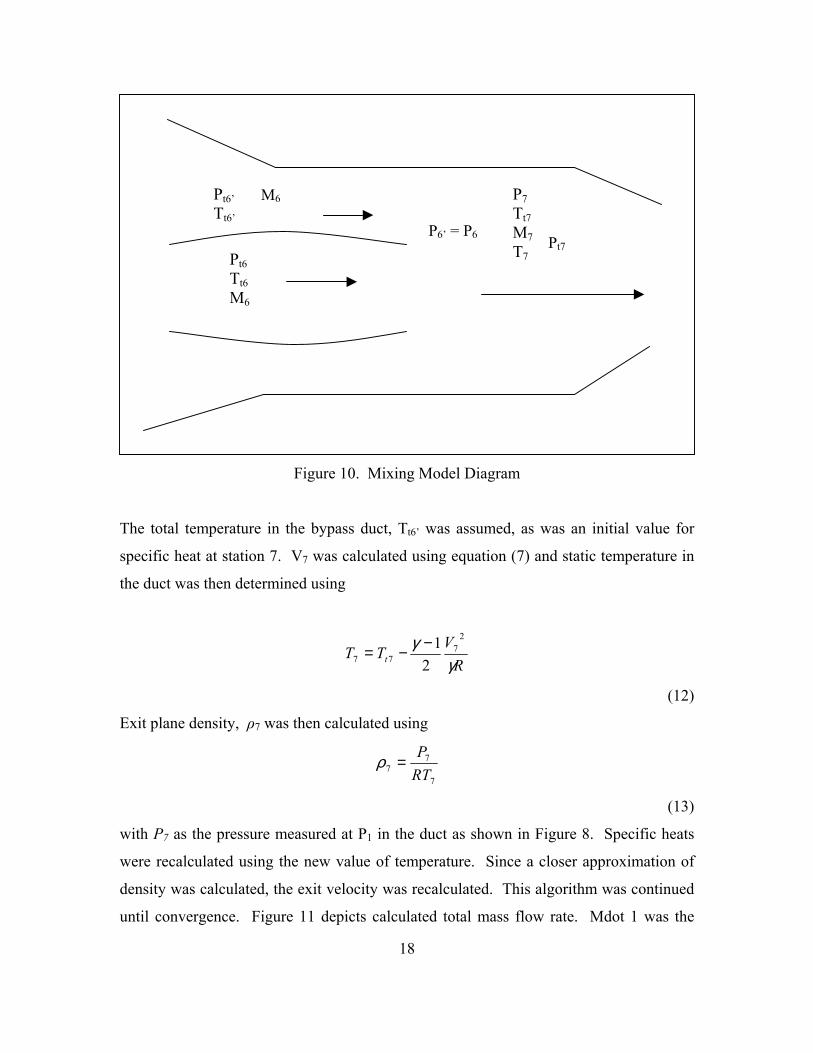
Figure 10. Mixing Model Diagram
The total temperature in the bypass duct, Tt6’ was assumed, as was an initial value for
specific heat at station 7. V7 was calculated using equation (7) and static temperature in
the duct was then determined using
RV
TT t γγ 2
777 2
1−−=
(12)
Exit plane density, ρ7 was then calculated using
7
77 RT
P=ρ
(13)
with P7 as the pressure measured at P1 in the duct as shown in Figure 8. Specific heats
were recalculated using the new value of temperature. Since a closer approximation of
density was calculated, the exit velocity was recalculated. This algorithm was continued
until convergence. Figure 11 depicts calculated total mass flow rate. Mdot 1 was the
Pt6’ Tt6’
Pt6 Tt6 M6
P7 Tt7 M7 T7
P6’ = P6
M6
Pt7

19
calculated mass flow based on the measured pressure at port 1. Appendix D contains a
sample calculation at Mach = 0.212 and a complete table of mass flow calculations as
Table D1.
0.0
0.5
1.0
1.5
2.0
2.5
0.0 0.1 0.2 0.3 0.4 0.5 0.6Mach Number
Mas
s Flo
w R
ate
(lbm
/s)
Mdot 1 Run 1
Mdot1 Run 2
GASTURB
Trend Line 4.4962x-0.532
Figure 11. Calculated Mass Flow Rate Through Shrouded Engine at 100% Spool Speed
A line was fit through the data from Mach 0.2 to Mach .54. The non-linearity in
mass flow rate at Mach 0.54 was due to a transient condition. During both runs the
freejet control valve was opened from a lower Mach number of 0.35 or 0.2 to the larger
value of Mach 0.54. The large increase in total pressure on the engine caused the
momentary spike in measured pressure in the duct. After the transient condition settled,
the total mass flow rate through the engine was linear below Mach 0.54. This
phenomenon also occurred when opening the control valve from static conditions to
Mach 0.35 but was not as pronounced. The trend line was used with the predicted values
of mass flow rate of the J450 from GASTURB, and the resulting bypass ratio was
calculated and shown in Figure 12. Bypass ratio was defined here as the ratio of mass
flow rate through the bypass shroud duct to the engine mass flow rate.

20
0.0
0.5
1.0
1.5
2.0
2.5
3.0
3.5
4.0
4.5
5.0
0.0 0.1 0.2 0.3 0.4 0.5 0.6
Mach Number
Byp
ass R
atio
(mdo
t shr
oud/
mdo
t eng
ine)
Figure 12. Predicted Bypass Ratio for Shrouded Turbojet
D. AFTERBURNER DESIGN AND DEVELOPMENT
1. Overview
The data acquired from the freejet run on the shrouded engine and resulting
calculations provided the prerequisites necessary to design the afterburner/ramjet
combustor. The afterburner design consisted of four separate items: afterburner duct
size, flame holder size and geometry, fuel delivery method, and ignition source. An
initial afterburner fuel delivery manifold or spray bars, were previously designed and
tested by Garcia (Ref 7). These had to be further developed during this research and the
remaining items were designed, developed, and tested.

21
2. Afterburner Sizing
The sizing of the afterburner was completed using the existing shroud diameter of
4.5 inches as tested by al-Namani (Ref 6) and Garcia (Ref 7). The length of the
combustor duct was determined using Figure 13 taken from Mattingly (Ref 9).
Figure 13. Afterburner Size (From Ref 9)
Figure 13 shows the ratio of the length of the combustor duct to duct diameter, DL , as a
function of mass flow bypass ratio at sea level standard conditions for a mixed flow
turbofan. The assumption was made to approximate the cycle of the turbo-ramjet as a
mixed flow turbofan with an outer fan pressure ratio of unity. The resulting calculations
of mass flow rate in Figures 11 and 12 showed that the bypass ratio was near 0.5 at a
Mach of 0.2 and increased to a value of 4.75 at a Mach of 0.54. As a result, a value of
1.5 for L/D was selected as a design starting point. This resulted in the length, L, of the
afterburner to be 6.75 inches. Two shroud lengths were available for the combustor, 6
inches or 9 inches. The shorter was selected based on the premise that the nozzle section

22
was 3 inches in length and testing by al-Namani (Ref 6) demonstrated maximum net
thrust by the J450 turbojet without afterburner.
3. Initial Flame Holder Design
The initial design of the flame holder manifold was also based on information
presented in Mattingly (Ref 9). A vee gutter geometry with a half-angle of 15 degrees
and an area blockage ratio, B, of 0.30 was selected. Much testing had been done on that
configuration which gave the largest probability of flame stabilization with reasonable
total pressure losses. The vee gutter design is shown in Figure 14.

23
Figure 14. Flame Holder Design Diagram. [From: Mattingly (Ref 9)]
Typical flame holder used in analysis of stabilization where
V1 = Velocity of approaching stream
V2 = Velocity of flow at edge of mixing zone
d = Width of the flame holder
L = Length of the recirculation zone
W = Width of the wake
H = Width of duct
The analysis is typically applied to a 2-dimensional duct where the blockage ratio
HdB = .
(14)
However since the afterburner duct was circular, the blockage ratio was taken as
the area blocked by the flame holders. This analysis was valid as Mattingly stated that
the same analysis used for 2-D ducts can be applied to axi-symmetric ducts. The width
of the flame holder, d, needed to be calculated first. The cross-sectional area of the duct
was

24
( )22 2.25 15.904A rπ π= = = in2
(15)
The resulting cross sectional area of the flame holder (30% of total area) was calculated
to be 4.77 in2. The center of the flame holder in the circular duct was desired be at a
radius of 1 inch from the center of the duct. The inner and outer diameters of the flame
holder were calculated using equation 16.
( ) ( ) ( )[ ] 22222 77.411 inxxrrA innerouterrflameholde =−−+=−= ππ
(16)
The value of x was determined to be 0.38 inches. The width of the flame holder, d
became
xd 2=
(17)
d = 0.76 inches
This led to the flame holder outer diameter of 1.38 inches and an inner diameter of .62
inches. Table 9.4 from Ref 7 gave the ratio of wake width with respect to flame holder
width for a wedge half-angle of 15 degrees and blockage ratio, B of 0.3 to be
3.1=dW
W = 0.988 inches
Ref 7 further states that the recirculation zone L can be approximated as
4=WL
or
L = 3.952 inches.
The initial flame holder assembly is shown in Figure 15.

25
Figure 15. Initial Flame Holder.
The flame holder was initially placed 3 inches downstream of the fuel injection
system. A J450 turbojet spark plug was placed approximately one half inch downstream
of the flame holder.
The initial configuration was unsuccessful. It was determined that either the fuel
had not atomized and/or vaporized enough for ignition, the spark plug did not create a
large enough ignition source, or the fuel air mixture was not close enough to
stoichiometric behind the flame holder in the recirculation regions. Further research
revealed that numerous military aircraft afterburning engines use a pilot flame, or torch
igniter, to ensure afterburner light off.
4. Propane Pilot Flame Design
To create a pilot flame behind the flame holder manifold, a fuel injection
manifold was placed within the flame holder. This would ensure that there was a proper

26
fuel/air mixture behind a localized area of recirculation and low Mach number. The
Coleman Fuel/Kerosene mixture used previously was replaced with propane gas to
ensure combustion at standard pressure and temperature. The aft portion of the turbojet
was removed from the engine test rig and placed horizontally on a bench. The flame
could be observed through the nozzle upstream and downstream to the back of the flame
holders to obtain qualitative information for further development.
Initial testing consisted of a manual valve opened up slowly until ignition was
achieved using a spark igniter. Once ignition was successful, an external blower was
added upstream to simulate low mass flow, low Mach number conditions. Once a stable
flame in the duct was accomplished using the external blower, the duct was replaced on
the engine.
The pilot flame was lit initially using the external fan and the manual propane
control valve without the engine running. The external fan created a large enough flow
through the engine to maintain the flame downstream of the turbojet engine. Engine
starting air was then used to spin the turbojet to observe the effects of engine exhaust on
the pilot flame. With the maximum amount of starting air placed on the compressor, the
pilot flame remained stabilized in position. The engine was then started. As the engine
spooled up, the flame blew out. It was determined that a larger fuel flow would be
required. After the test, the videotape from the downstream camera revealed a large
amount of swirl exiting from the turbojet. This created a very large shearing effect and
compounded the difficulty of flame stabilization.
The initial propane manifold had 9 holes at 0.013 of an inch. Since the
extinguished flame was blue in color the indication was that the flame was lean, hence
more fuel was needed to keep the pilot flame lit during engine start up.
New spray bars were developed with 24 larger holes at .050 of an inch spraying
propane radially inward and outward within the final flame holder. This configuration
worked well, but a larger mass flow rate was still needed. Two constriction points in the
supply line were removed to give the current configuration (Figure 4).

27
5. Final Flame Holder Configuration
The large swirl caused by the turbojet exhaust made flame stabilization difficult.
In order to minimize the effect, a new flame holder was designed and implemented. The
final flame holder inner radius was circumferentially continuous. This eliminated the
effect of the large swirl from the turbojet entering the recirculation zone as previously
occurred on the initial flame holder. The final flame holder was also more uniform in
appearance and eliminated asymmetries in the afterburner duct. The final flame holder
configuration is shown in Figure 16.
Figure 16. Final Flame Holder Configuration with Pilot Flame
The J450 spark plug was not long enough to be positioned directly within the
recirculation zone of the flame holder. This made pilot ignition difficult. A final
modification to the flame holder assembly was the addition of a longer spark plug. The
longer spark plug was also shielded from direct exposure to the flow and the spark was

28
placed directly behind the flame holder. The spark plug was within close proximity of
the propane pilot manifold, which facilitated ignition.
6. Coleman Fuel Manifold
Once the pilot flame and flame holder were successfully tested, a Coleman fuel
manifold was added 3 inches upstream of the vee gutters. This fuel system was driven by
an additional 12V fuel pump. This fuel manifold had 12 injection ports spraying radially
inward onto the hot turbojet exhaust, which vaporized the Coleman fuel. Figure 17
shows the manifold installed over the engine exhaust. The final turbo-ramjet
configuration is shown in Figure 18.
Figure 17. Coleman Fuel Manifold Installed on Turbo-Ramjet

29
Figure 18. Schematic of the Final Turbo-Ramjet Engine Configuration
E. FREEJET RESULTS ON TURBO-RAMJET
1. Afterburner Results
The turbo-ramjet was tested three times in the final configuration. The initial test
run was conducted to test the engine with the afterburner running, however, little control
of the freejet flow rate was possible. The control of the freejet flow rate was improved by
including a digital readout of the plenum pressure to the operator of the air supply system
control valve. Once the turbojet was running at 80% spool speed with sustained
afterburner, the freejet was started and the Mach number gradually increased. Fuel was
added to maintain stable combustion in the burner. The turbojet ran successfully at static
conditions with the afterburner running, however with a decrease in net thrust. This was
most likely due to the large back pressure placed on the turbojet by the afterburner. With
the freejet running, the turbo-ramjet maintained positive net thrust from static conditions
to Mach 0.2 as shown in Figure 19.

30
0.0
1.0
2.0
3.0
4.0
5.0
6.0
0.00 0.05 0.10 0.15 0.20 0.25
Mach Number
Net
Thr
ust (
lbf)
Run 1 Run 2
Figure 19. Thrust Measurements with Afterburner at 80% Spool Speed
2. Afterburner Results Comparison with Shrouded Turbojet at 80% Spool Speed
Figure 20 depicts measured net thrust vs. free stream Mach number with the
turbojet running at 80% spool speed. Tests were also conducted by Garcia (Ref 7) of the
shrouded engine at varying engine spool speeds. These values are tabulated in Appendix
E as Table E3. Garcia's results at 80% spool speed are compared to the net thrust results
of the turbo-ramjet running with afterburner. It can be seen that on average there was a
net increase of three pounds thrust up to Mach 0.2. This equated to a 40% increase in
thrust over the baseline J450 at 80% spool speed. This was equal to the typical increase
in thrust experienced by conventional afterburning turbofan and turbojet engines.

31
-6
-4
-2
0
2
4
6
0.00 0.05 0.10 0.15 0.20 0.25 0.30
Mach Number
Net
Thr
ust (
lbf)
Run 1, 7 Mar 03
Run 2, 7 Mar 03
Garcia 80% 19 Oct 2000 No AB
Figure 20. Comparison of Afterburner vs. Non-Afterburner at 80% Spool Speed
The values of thrust approaching a Mach number of 0.2 are misleading. At this
Mach number, the fuel pump did not supply adequate fuel to maintain a proper fuel air
ratio in the afterburner. During this time it was noted that the flame was only on one
section of the flame holder. Beyond Mach 0.2 the flame in the afterburner was
extinguished thus a larger fuel pump is needed to extend the range of the turbo-ramjet.
The calculated mass flow rate through the shrouded engine depicted on Figure 11 shows
a small increase in total mass flow rate through the turbo-ramjet up to a Mach number of
0.2. The amount of bypass flow that was combusted at these speeds was relatively small
(0.5 bypass ratio) compared with the J450 mass flow rate. Shown in Figure 21 is the
turbo-ramjet engine running at 80% spool speed with full afterburner at M∞ = 0.15.

32
Figure 21. Turbo-Ramjet at Maximum Afterburner at M∞ = 0.15

33
III. COMPUTATIONAL FLUID DYNAMICS ANALYSIS
A. BACKGROUND
Computational Fluid Dynamics (CFD) is widely used in aeronautics as a modern
engineering design tool. The Naval Postgraduate School (NPS) currently supports
numerous software applications for applied engineering science using Silicon Graphics
Workstations. The purpose of using CFD was to obtain solutions to the internal flow field
of the turbo-ramjet and to compare these results to experimental and analytical results.
One of these software codes is the NASA supported CFD code OVERFLOW (Ref 10)
that NASA uses extensively for modeling Space Shuttle vehicle aerodynamics.
OVERFLOW has been applied to numerous single- and multi-block grid geometries at
various flight conditions at NPS.
Modeling of the internal flow of the turbo-ramjet engine was accomplished using
OVERFLOW. A two-dimensional planar grid was generated using the grid generation
software GRIDGEN. The points were exported from GRIDGEN to be manipulated upon
by the code GRIDED.
Four computational grids were created for use in OVERFLOW. All grids were C-
type axi-symmetric grids. Part of the outer boundary of the grid was set as the ramjet
shroud, which allowed for the simulation of the internal flow field. From prior analysis,
the results from an internal/external flow solution and an internal only solution did not
differ. Solving for the internal flow allowed for less required computational time and
required fewer boundary conditions to be specified.
Simple test cases of a ramjet with nose-cone shroud and a cylindrical pipe were
run to ensure no difference in the solutions between internal only and internal/external
solutions.
Even with the change of an internal only flow solution, convergence of solutions
for a free stream Mach number below 0.6 were unattainable.

34
B. SOFTWARE
1. GRIDGEN
GRIDGEN is software for the generation of 3D, multiple block, and structured
grids. The code may also be used to generate single block structured grids, single surface
structured grids, and overset structured grids. The Version 9 of the software system was
used during the current research. The code can be used to convert a 3D domain into
blocks, distribute grid points on curves, initialize and refine grid points on surfaces, and
initialize volume grid points. The code was written using the Silicon Graphics Iris GL
graphics library and hence may only be run on Silicon Graphics 4D Series and IBM
RS/6000 Series workstations.
2. GRIDED
GRIDED is a grid editing software package. This powerful code can do many
manipulations to existing 2D and 3D grids. For the purpose of this thesis, this tool was
used to interchange the J and K grid families of the single input grid generated from
GRIDGEN and to generate two additional planes that were supplied to OVERFLOW to
solve the axi-symmetric flow field.
3. OVERFLOW
OVERFLOW is a Navier-Stokes flow solver for structured grids. First-order
implicit time stepping was used. A time-accurate mode is available, or local time step
scaling can be selected for acceleration to steady state. A more complete description of
the flow solver and implementation examples were documented by Coyne in Ref 11,
Garcia in Ref 7, and Williams in Ref 12.
4. FAST
FAST is a software environment for analyzing Computational Fluid Dynamics
data. FAST consists of a collection of separate programs (modules) that run
simultaneously and allowed the user to examine the results of numerical simulations by
loading grid and solution data files. Calculations could be performed on the solution for
flow visualization which may be animated and recorded.

35
C. RESULTS
1. Ramjet Shroud with Nose Cone
The first configuration modeled was a pure ramjet. The solution to this
configuration provided information on the flow at the inlet area of the ramjet. A test case
was run with free stream Mach = 0.6. The grid size was a 411x51x3 grid and the extent
of the shroud and inlet nose cone are shown in Figure 22. The OVERFLOW input file is
listed in Appendix F.
Figure 22. Ramjet Grid (411x51x3)
Garcia obtained a supersonic solution at Mach 2 for the inlet only. He had to
guess the amount of back pressure within the shroud, hence making his calculations
suspect. The present full shroud simulation allowed for the opportunity to analyze the
flow through the duct and determine the amount of spillage caused by the nosecone and
shroud back pressure at subsonic speeds. A solution was obtained at a free stream Mach
number of 0.6. The solution was obtained after 10,000 iterations and reached 3 orders of
magnitude convergence as documented by the L2 norm residuals plot in Appendix F.

36
Figure 23. Mach Number Distribution through the Ramjet at 6.0=∞M
As can be seen in Figure 23, the majority of inlet flow bypassed around the
ramjet. The remaining flow accelerated through the duct and exhausted at slightly less
than free stream Mach number. The conical engine inlet was designed by al-Namani
(Ref 4) and was optimized at Mach 2. The Mach 0.6 results from OVERFLOW showed
a large amount of spillage caused by the nose cone and a large area of recirculation
developed downstream of the conical inlet.
2. Turbo-Ramjet Geometry with Inflow and Outflow Through the Turbojet
The grid used was 556x51x3 in size. As shown in Figure 24, the J450 engine inlet
was modeled as a constant pressure outflow with the pressure adjusted to allow for the
proper mass flow rate into the turbojet. The exhaust nozzle of the J450 was modeled as a
nozzle inflow at free stream conditions. The exit velocity of the turbojet was the same as
the free stream Mach number as shown in Figure 25, and the exhaust gasses in the
solution were cold as opposed to the hot exhaust in the experiment.

37
Figure 24. Turbo-Ramjet Grid with Engine Inflow/Outflow
Figure 25. Mach Number Distribution for Engine Inflow/Outflow at M∞ = 0.6
3. Turbo-Ramjet Geometry with Flow Through the Turbojet with an Actuator Disk and Heating
The next modeling attempt was to model the flow through the turbojet in order to
produce an exit gas temperature and pressure closely resembling actual conditions. This
grid was 592x109x3 in size.
The flow through the engine was modeled by using a combination of constant
temperature walls internal to the engine and an actuator disk to simulate an increase in
pressure through the engine as shown in Figure 26. Values from GASTURB (Table G1)
were used at a free stream Mach number of 0.6 to predict exit conditions from the

38
turbojet to be a temperature of 1440 degrees R and a pressure of 21.5 psia. The actuator
disk boundary condition in OVERFLOW required a value equal to PP∞
∆ as a specified
BCPAR(1) input in the $BCINP namelist. The final value to obtain the proper exit
pressure from the turbojet was 0.18. Viscous adiabatic constant temperature walls were
set in the input file to produce exhaust gas temperature consistent with the predicted
value of 1440 degrees. This was done through a series of iterations via trial and error.
The inner boundary of the turbojet was modeled as a constant temperature adiabatic wall
from just inside the engine inlet to the end of the engine exhaust at 3000 degrees R as
shown in Figure 26. The outer wall of the engine casing was set as a constant
temperature adiabatic wall with a temperature of 1000 deg R to model heat exchange into
the bypass duct. Finally, the outer surface of the exhaust pipe of the J450 was modeled
as a constant temperature adiabatic wall with a value of 1500 degrees R to simulate
convective heating into the bypass flow.
Figure 26. Close-Up of Grid with Engine Through-Flow Modeling

39
Figure 27 shows the Mach number distribution through the engine at M∞= 0.6.
What was of interest was the low Mach number (0.3) at the bypass duct constriction at
the largest radius of the J450 engine. Also noteworthy was that the bypass flow remained
at this Mach number until mixing with the J450 exhaust. At this point, the Mach number
varied with respect to distance radially outward of the turbojet exhaust flow from
between Mach 0.2 and 0.3. Lastly, when compared to the Mach number results of the
ramjet shroud and the Engine Inflow/Outflow, the Mach number profile at the inlet was
remarkably similar. In addition, the Mach profile of the Engine Inflow/Outflow and the
Through Flow model from the inlet to the throat of the bypass duct were also very
similar.
Figure 27. Mach Number Distribution for Flow Through Turbo-Ramjet at M∞= 0.6

40
THIS PAGE IS INTENTIONALLY LEFT BLANK

41
IV. ANALYSIS OF DESIGN AND PREDICTION TOOLS
Previously discussed was the importance of flow visualization with respect to
gaining a qualitative representation of the properties of the afterburner flame during
operation. The CFD results of the turbo-ramjet modeling of the turbojet engine flow
gave qualitative and quantitative data of the flow through the turbo-ramjet. Figure 28
shows the pressure distribution through the turbo-ramjet at M∞= 0.6.
Figure 28. Pressure Distribution of Flow Through Turbo-Ramjet at M∞=0.6
The pressure downstream of the turbojet engine exhaust was calculated to be 0.79
from Figure 28. This equated to a pressure of 16.25 psi (1.56 psig) at standard pressure
in the duct at station 7 in Figure 10. The pressure measured during the shrouded engine
at 100% spool speed in the freejet at M∞= 0.54 was 1.7508 psig (Table D2).
The mass flow calculations discussed in Section II.C.4 used the assumption of
constant density from station 7 to exit. The density solution from OVERFLOW depicted
almost constant density radially over the profile of the mixed exhaust flow. Hence, the
CFD model of the shrouded engine closely simulated the actual flow through the engine
with the bypass duct. The calculated bypass ratio results were then used with GASTURB
to predict the performance of the turbo-ramjet as a mixed flow, afterburning turbofan
engine with a fan pressure ratio of one. The GASTURB predictions are shown in
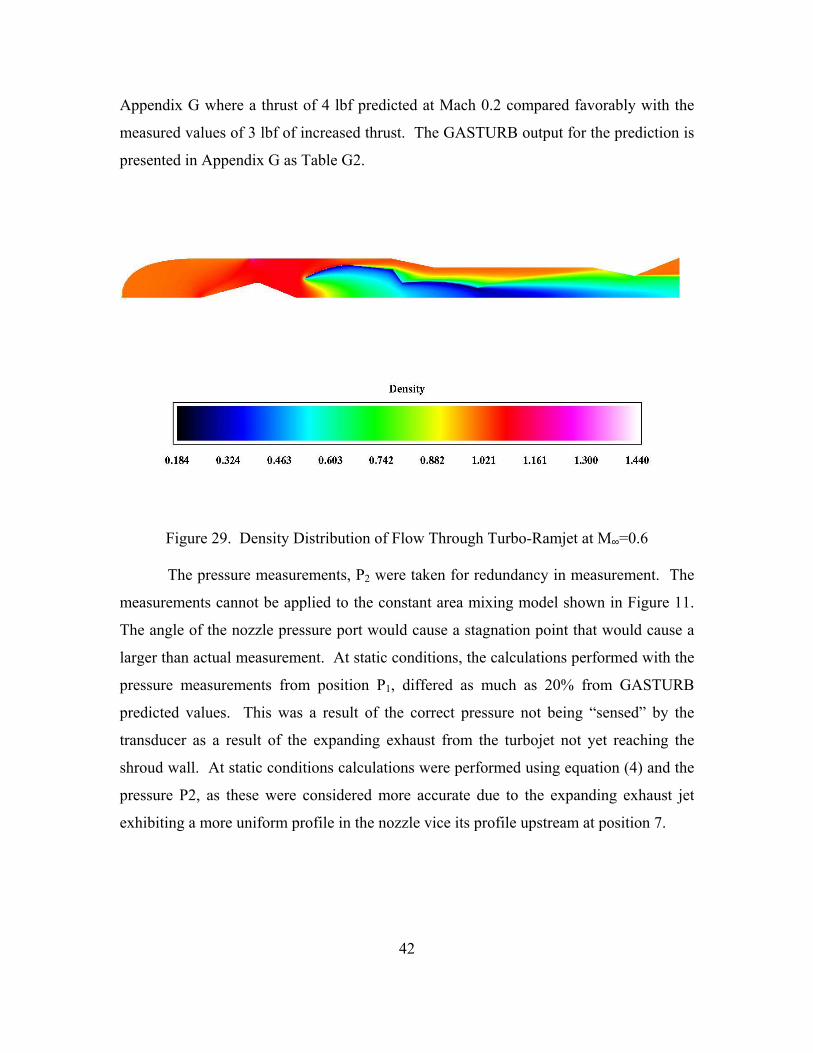
42
Appendix G where a thrust of 4 lbf predicted at Mach 0.2 compared favorably with the
measured values of 3 lbf of increased thrust. The GASTURB output for the prediction is
presented in Appendix G as Table G2.
Figure 29. Density Distribution of Flow Through Turbo-Ramjet at M∞=0.6
The pressure measurements, P2 were taken for redundancy in measurement. The
measurements cannot be applied to the constant area mixing model shown in Figure 11.
The angle of the nozzle pressure port would cause a stagnation point that would cause a
larger than actual measurement. At static conditions, the calculations performed with the
pressure measurements from position P1, differed as much as 20% from GASTURB
predicted values. This was a result of the correct pressure not being “sensed” by the
transducer as a result of the expanding exhaust from the turbojet not yet reaching the
shroud wall. At static conditions calculations were performed using equation (4) and the
pressure P2, as these were considered more accurate due to the expanding exhaust jet
exhibiting a more uniform profile in the nozzle vice its profile upstream at position 7.

43
V. CONCLUSIONS AND RECOMMENDATIONS The freejet facility was upgraded with the introduction of a second thrust beam to
stabilize the engine and eliminate undesired vibration and pitching movements during
high Mach number test runs. Testing of the shrouded turbojet engine was extended from
Mach 0.45 to Mach 0.6, however a more capable control valve must be added to ensure
subsequent successful testing at higher Mach numbers. The inability to slowly change
free stream conditions during testing resulted in non-linear measurements at higher Mach
numbers and afterburner flame blow out. Static pressures in the shrouded engine were
measured to determine a cold-flow bypass ratio of 0.4 at Mach 0.2 and 4.75 at Mach
0.54.
A combustor was successfully designed, developed and tested for a turbo-ramjet
engine. The combustor consisted of a propane pilot and vee gutter flame holder,
Coleman fuel manifold, and extended spark plug. The combustor was successfully tested
to a Mach number of 0.2 with stable operation during increased and decreased free
stream velocities. The turbojet engine was run at 80% spool speed and with the
afterburner lit an increase in thrust of three pounds was measured. The thrust increase
was 40% over the baseline turbojet engine. The positioning of the video camera to view
the afterburner flame during engine operation, was vital in maintaining a stable flame
during changes in free stream Mach number. Although the turbo-ramjet was operating at
subsonic speeds, a significant increase in thrust was measured at these low subsonic
speeds. This provided optimism for future testing at higher speeds in conjunction with
optimization of the flame holder. The increase in bypass flow rate from Mach 0.2 to
Mach 0.54 should result in a further increase in thrust due to the combustion of the cold
bypass flow. Further tests are needed with the turbojet engine running at 100% spool
speed.
Further testing of the combustor cannot be completed without a higher flow rate
fuel pump. The large increase in total mass flow rate calculated using the shrouded
turbojet static pressure measurements demonstrate the large fuel rates needed at higher
Mach numbers. One idea for future testing is to use the turbojet compressor bleed air as

44
the power source for the afterburner fuel pump. An improved flame holder should be
manufactured more closely resembling full-scale afterburning turbojet and turbofan
engines. This could result in greater combustion efficiency, and hence greater thrust at
higher speeds. The ramjet shroud should be redesigned from its present convergent shape
aft of the turbojet to a constant diameter duct followed by a convergent nozzle.
The gas turbine prediction program GASTURB was considered highly accurate in
predicting the baseline performance characteristics of the J450 turbojet. The predicted
flow parameters through the turbojet were used in conjunction with the flow solver
OVERFLOW to produce a valid solution of the flow through the turbo-ramjet at M = 0.6.
The computational grid should be further refined with the modeling of the flame holder.
Combustion in the afterburner could then be modeled with heat addition from the flame
holders. Current and future turbo-ramjet model configurations need to be computed at
supersonic speeds in an attempt to assist the performance prediction of such a combined
cycle engine.

45
APPENDIX A. SOPHIA J450 ENGINE SPECIFICATIONS
SOPHIA J450 ENGINE SPECIFICATIONS
Length/Diameter 13.19/4.72 [in]
Total weight 4 [lb]
Fuel Coleman/Kerosene
Starting System Compressed Air
Ignition System Spark Plug
Lubrication 6V pulsed oil pump
Fuel Feed System 12V turbine fuel pump
Compressor Single stage centrifugal
Thrust 11 [lbf] at 123000 [RPM]
Fuel consumption 19.98 [lbm/hr]
Throttle system Manual control
Table A1.

46
THIS PAGE IS INTENTIONALLY LEFT BLANK

47
APPENDIX B. INSTRUMENTATION CALIBRATION RESULTS
y = 95.663x - 46.141R2 = 0.998
-50
-40
-30
-20
-10
0
10
20
30
0 0.1 0.2 0.3 0.4 0.5 0.6 0.7 0.8
Voltage (mV)
Loa
d (lb
f)
Figure 30. Thrust Beam Calibration
48
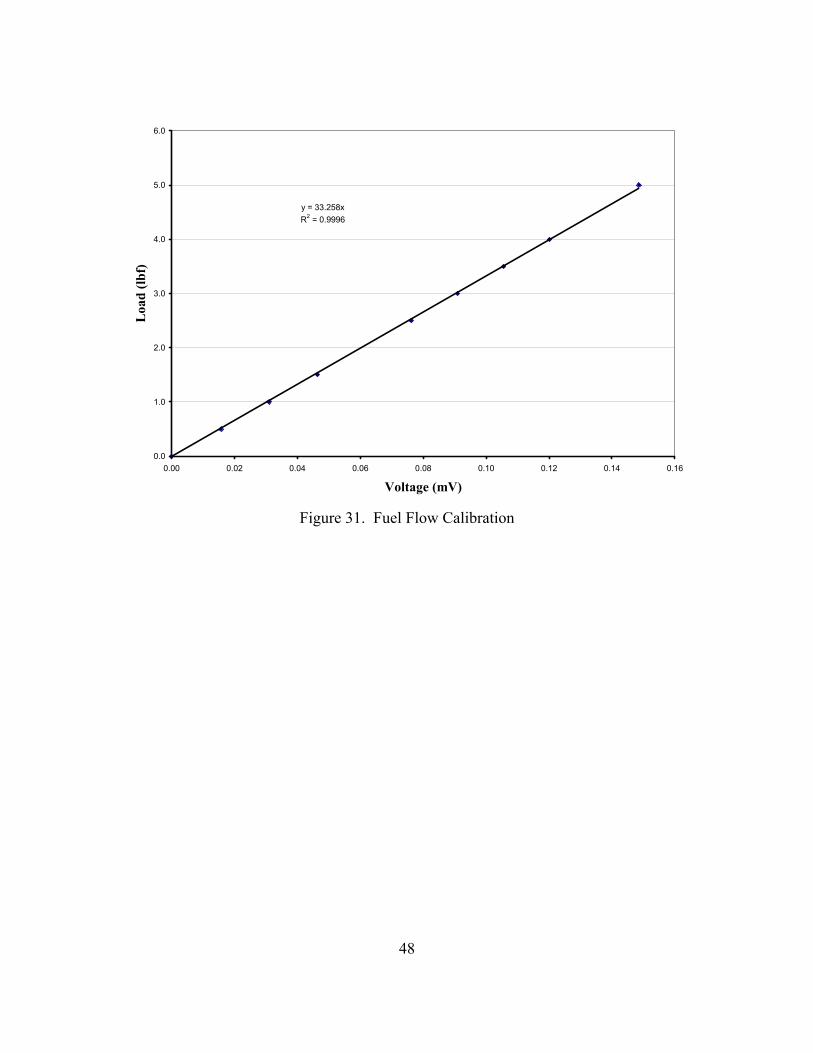
y = 33.258xR2 = 0.9996
0.0
1.0
2.0
3.0
4.0
5.0
6.0
0.00 0.02 0.04 0.06 0.08 0.10 0.12 0.14 0.16
Voltage (mV)
Loa
d (lb
f)
Figure 31. Fuel Flow Calibration

49
7 March 2003 Calibration Data
Fuel Thrust mV LBS mV LBS
0.0000 0.0 0.475 0 0.0157 0.5 0.407 -8.25 0.0310 1.0 0.356 -13.25 0.0463 1.5 0.306 -18.25 0.0761 2.5 0.244 -23.25 0.0909 3.0 0.197 -28.25 0.1056 3.5 0.128 -33.25 0.1201 4.0 0.081 -38.25 0.1486 5.0 0.123 -33.25
0.179 -28.25 0.245 -23.25 0.282 -18.25 0.333 -13.25 0.405 -8.25 0.471 0 0.565 8.25 0.616 13.25 0.664 18.25 0.72 23.25 0.674 18.25 0.625 13.25 0.574 8.25 0.495 0
Table B1. Thrust and Fuel Flow Rate Calibration Values

50
y = 0.1628x - 0.0099R2 = 0.9995
0
0.5
1
1.5
2
2.5
0 2 4 6 8 10 12 14
Voltage (mV)
Pres
sure
(psi
d)
Figure 32. P1 Pressure Transducer Calibration.
y = 0.15x + 0.0054R2 = 1
0
0.5
1
1.5
2
2.5
0 2 4 6 8 10 12 14
Voltage (mV)
Pres
sure
(psi
d)
Figure 33. P2 Pressure Transducer Calibration

51
P 1
MV psi 12.21 2.0
9.30 1.56.39 1.03.23 0.51.90 0.31.24 0.20.61 0.10.00 0.0
Table B2. Pressure Transducer 1 Calibration Values
P 2
MV psi 13.33 2.011.31 1.7
9.95 1.56.59 1.03.96 0.63.29 0.50.00 0.0
Table B3. Pressure Transducer 2 Calibration Values

52
THIS PAGE IS INTENTIONALLY LEFT BLANK
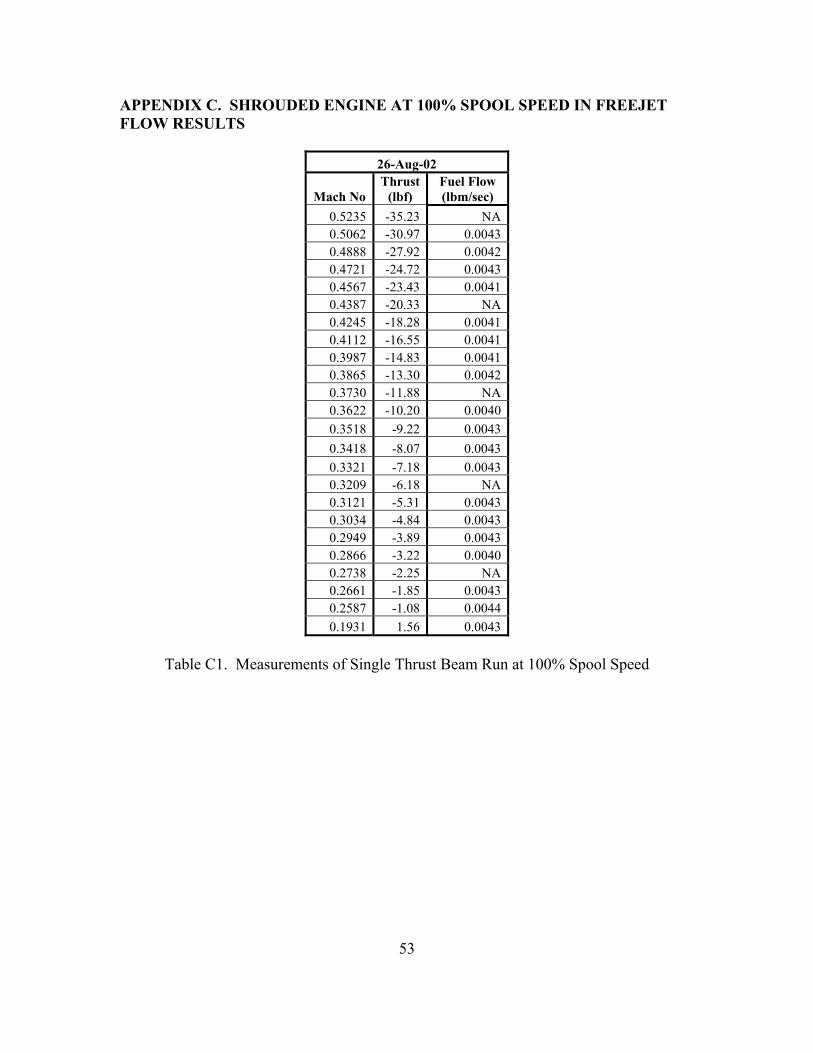
53
APPENDIX C. SHROUDED ENGINE AT 100% SPOOL SPEED IN FREEJET FLOW RESULTS
26-Aug-02
Mach No Thrust
(lbf) Fuel Flow (lbm/sec)
0.5235 -35.23 NA0.5062 -30.97 0.00430.4888 -27.92 0.00420.4721 -24.72 0.00430.4567 -23.43 0.00410.4387 -20.33 NA0.4245 -18.28 0.00410.4112 -16.55 0.00410.3987 -14.83 0.00410.3865 -13.30 0.00420.3730 -11.88 NA0.3622 -10.20 0.00400.3518 -9.22 0.00430.3418 -8.07 0.00430.3321 -7.18 0.00430.3209 -6.18 NA0.3121 -5.31 0.00430.3034 -4.84 0.00430.2949 -3.89 0.00430.2866 -3.22 0.00400.2738 -2.25 NA0.2661 -1.85 0.00430.2587 -1.08 0.00440.1931 1.56 0.0043
Table C1. Measurements of Single Thrust Beam Run at 100% Spool Speed

54
P total (psig)
P1 (psig)
P2 (psig)
Fuel Flow
(lbm/s) Thrust (lbf) Mach #
0.0000 0.1193 0.0553 0.00415 10.56 0.000 0.0000 0.1194 0.0599 0.00419 10.56 0.000 0.0000 0.1173 0.0591 0.00401 10.47 0.000 0.0000 0.1202 0.0583 0.00412 10.51 0.000 0.0000 0.1191 0.0533 0.00413 10.42 0.000 0.4676 0.1745 0.1614 0.00569 5.00 0.212 0.4792 0.1741 0.1619 0.00564 4.30 0.214 0.4724 0.1719 0.1568 0.00564 4.49 0.213 0.4667 0.1668 0.1575 0.00564 4.51 0.212 0.4617 0.1659 0.1526 0.00563 4.63 0.210 0.4576 0.1626 0.1533 0.00554 4.89 0.209 1.5233 0.7945 0.6382 0.00561 -10.57 0.378 1.5563 0.8150 0.6428 0.00543 -12.40 0.381 0.0062 0.1144 0.0544 0.00544 3.52 0.025 0.0000 0.1170 0.0597 0.00572 7.73 0.000 0.0000 0.1199 0.0561 0.00571 7.76 0.000 0.0000 0.1185 0.0802 0.00568 7.87 0.000 1.2751 0.6672 0.5489 0.00563 -6.98 0.346 1.3568 0.6918 0.5519 0.00532 -9.81 0.357 1.3388 0.6821 0.5424 0.00567 -8.93 0.355 1.3247 0.6793 0.5396 0.00554 -9.18 0.353 1.3080 0.6693 0.5287 0.00576 -9.38 0.351 1.2990 0.6611 0.5313 0.00545 -9.37 0.349 1.2878 0.6567 0.5249 0.00550 -9.09 0.348 1.2723 0.6414 0.5158 0.00565 -9.04 0.346 1.2635 0.6443 0.5114 0.00540 -8.92 0.345 1.2459 0.6306 0.5038 0.00527 -8.93 0.342 1.2315 0.6279 0.4976 0.00543 -9.02 0.341 1.2097 0.6067 0.4835 0.00523 -8.79 0.338 1.1920 0.5996 0.4829 0.00517 -8.46 0.335 1.1662 0.5867 0.4721 0.00526 -8.28 0.332 1.1475 0.5757 0.4663 0.00526 -8.02 0.329 1.1441 0.5802 0.4610 0.00539 -7.81 0.329 3.2658 2.0162 1.5759 0.00524 -39.72 0.542 3.2704 2.0393 1.5598 0.00517 -49.54 0.543 3.2696 1.9999 1.5322 0.00514 -48.91 0.543 0.0000 0.1082 0.0536 0.00520 3.02 0.000
Run
#1
0.0000 0.1076 0.0522 0.00553 3.77 0.000
Table C2. Measurements of Dual Thrust Beam Run 1 at 100% Spool Speed

55
P total (psig)
P1 (psig)
P2 (psig)
Fuel Flow
(lbm/s) Thrust (lbf) Mach #
0.0000 0.1203 0.0526 0.00424 4.28 0.000 0.0000 0.1229 0.0502 0.00446 4.22 0.000 1.4647 0.7756 0.6001 0.00414 -13.84 0.370 1.4564 0.7549 0.5923 0.00398 -14.26 0.369 1.4477 0.7481 0.5885 0.00406 -14.09 0.368 1.4392 0.7460 0.5865 0.00427 -13.91 0.367 1.4003 0.7182 0.5675 0.00561 -13.79 0.362 3.2741 2.2230 1.7370 0.00552 -47.07 0.543 3.2755 2.2630 1.7451 0.00529 -51.77 0.543 3.2748 2.2363 1.7122 0.00531 -51.70 0.543 3.2748 2.2161 1.6990 0.00515 -51.29 0.543 3.2732 2.2143 1.6840 0.00524 -50.58 0.543 3.2731 2.1757 1.6495 0.00520 -50.17 0.543 3.2719 2.1562 1.6347 0.00531 -49.41 0.543 3.2716 2.1222 1.6100 0.00526 -48.98 0.543 3.2707 2.0827 1.5797 0.00513 -47.97 0.543 3.2656 1.9604 1.4920 0.00522 -45.29 0.542 3.2630 1.8415 1.3882 0.00423 -44.09 0.542 3.2560 1.7508 1.3255 0.00555 -41.63 0.542 3.1251 1.6603 1.2521 0.00478 -39.51 0.531 2.9619 1.5707 1.1870 0.00497 -37.40 0.518 2.8149 1.4960 1.1317 0.00505 -35.69 0.506 2.6770 1.4348 1.0932 0.00582 -31.94 0.494 2.5368 1.3595 1.0456 0.00584 -30.39 0.482 2.4180 1.2949 0.9956 0.00592 -28.83 0.471 2.3032 1.2305 0.9466 0.00572 -27.20 0.460 2.1915 1.1666 0.9044 0.00586 -25.89 0.449 2.0949 1.1100 0.8610 0.00593 -24.78 0.440 2.0129 1.0744 0.8340 0.00594 -23.59 0.432 0.0000 0.1177 0.0447 0.00581 1.39 0.000 0.0000 0.1184 0.0517 0.00589 3.67 0.000
Run
#2
0.0000 0.1181 0.0449 0.00560 3.59 0.000
Table C3. Measurements of Dual Thrust Beam Run 2 at 100% Spool Speed

56
19 October 2000
Mach # Thrust 0.4100 -18.950.4000 -17.590.3900 -16.110.3700 -15.040.3600 -13.500.3500 -12.070.3500 -11.120.3400 -10.200.3300 -9.410.3200 -8.500.3100 -7.560.3000 -6.820.2965 -6.120.2898 -5.500.2829 -4.800.2761 -3.800.2693 -3.400.2622 -3.100.2549 -1.850.2489 -1.500.2426 -1.220.2326 -0.830.2296 -0.500.2239 0.090.2180 0.600.2119 0.990.2057 1.340.2010 1.700.1968 1.850.1925 2.200.1881 2.350.1836 2.680.1776 3.150.1715 3.330.1651 3.700.1584 3.890.1522 4.390.1390 4.680.1319 4.90
Table C4. Measurements of Garcia Run 2 at 100% Spool Speed (From: Ref 7)
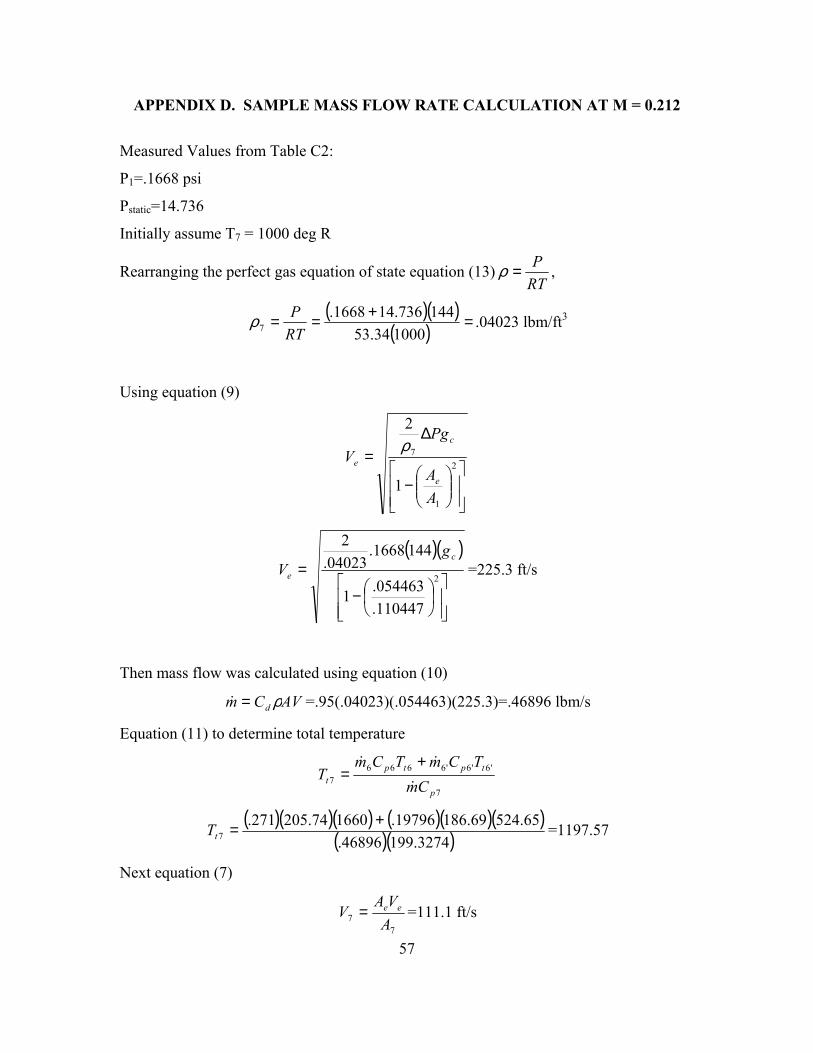
57
APPENDIX D. SAMPLE MASS FLOW RATE CALCULATION AT M = 0.212
Measured Values from Table C2:
P1=.1668 psi
Pstatic=14.736
Initially assume T7 = 1000 deg R
Rearranging the perfect gas equation of state equation (13)RTP=ρ ,
( )( )( ) =+==100034.53
144736.141668.7 RT
Pρ .04023 lbm/ft3
Using equation (9)
−
∆=
2
1
7
1
2
AA
PgV
e
c
eρ
( )( )
−
=2
110447.054463.1
1441668.04023.
2c
e
gV =225.3 ft/s
Then mass flow was calculated using equation (10)
AVCm d ρ= =.95(.04023)(.054463)(225.3)=.46896 lbm/s
Equation (11) to determine total temperature
7
'6'6'66667
p
tptpt Cm
TCmTCmT
+=
( )( )( ) ( )( )( )( )( )3274.19946896.
65.52469.18619796.166074.205271.7
+=tT =1197.57
Next equation (7)
77 A
VAV ee= =111.1 ft/s

58
And equation (12)
RV
TT t7
277
77 21
γγ −
−=
( )34.53365.11.111
21365.157.1197
2
7−−=T =1166.6 deg R
The temperature for the second iteration was assumed to be 1324 deg R and the following
values calculated.
ρ = 0.03095
Ve = 256.88
7m = 0.4113
Tt7 = 1325.28
V7 = 126.67
T7 = 1324.03

59
P total P1 Mach # m6 TT6 rho 1 Ve1 m dot
1 tt7 1 t7 1 0.0000 0.1193 0.000 0.260 1707 0.02351 249.27 0.3032 1706.90 1705.760.0000 0.1194 0.000 0.260 1707 0.02351 249.37 0.3033 1706.90 1705.760.0000 0.1173 0.000 0.260 1707 0.0235 247.18 0.3006 1706.90 1705.780.0000 0.1202 0.000 0.260 1707 0.02351 250.15 0.3043 1706.90 1705.750.0000 0.1191 0.000 0.260 1707 0.02351 249.03 0.3029 1706.90 1705.760.4676 0.1745 0.212 0.271 1660 0.0308 263.40 0.4197 1308.8 1307.490.4792 0.1741 0.214 0.271 1660 0.03075 263.29 0.4189 1310.44 1309.130.4724 0.1719 0.213 0.271 1660 0.03096 260.71 0.4176 1312.93 1311.640.4667 0.1668 0.212 0.271 1660 0.03095 256.88 0.4113 1325.28 1324.030.4617 0.1659 0.210 0.271 1660 0.03095 256.19 0.4102 1327.52 1326.270.4576 0.1626 0.209 0.271 1660 0.03024 256.59 0.4015 1345.41 1344.171.5233 0.7945 0.378 0.297 1570 0.05241 430.80 1.1682 802.996 799.271.5563 0.8150 0.381 0.297 1570 0.05281 434.68 1.1877 798.44 794.6460.0062 0.1144 0.025 0.260 1707 0.02499 236.68 0.3061 1604.76 1603.730.0000 0.1170 0.000 0.260 1707 0.02528 238.03 0.3114 1585.93 1584.890.0000 0.1199 0.000 0.260 1707 0.02564 239.28 0.3175 1565.02 1563.970.0000 0.1185 0.000 0.260 1707 0.02548 238.58 0.3145 1575.08 1574.041.2751 0.6672 0.346 0.292 1587 0.04998 404.28 1.0455 835.007 831.7261.3568 0.6918 0.357 0.292 1590 0.05042 409.84 1.0692 829.235 825.8631.3388 0.6821 0.355 0.292 1590 0.05021 407.84 1.0595 832.049 828.7091.3247 0.6793 0.353 0.292 1590 0.0502 407.03 1.0572 832.655 829.3291.3080 0.6693 0.351 0.292 1590 0.04999 404.89 1.0472 835.631 832.341.2990 0.6611 0.349 0.292 1590 0.04978 403.23 1.0386 838.268 835.0031.2878 0.6567 0.348 0.291 1590 0.04977 401.94 1.0350 838.214 834.9711.2723 0.6414 0.346 0.291 1590 0.04942 398.61 1.0193 843.17 839.981.2635 0.6443 0.345 0.291 1590 0.04949 399.23 1.0222 842.14 838.9411.2459 0.6306 0.342 0.291 1590 0.04921 396.09 1.0085 846.555 843.4051.2315 0.6279 0.341 0.291 1590 0.04914 395.50 1.0056 847.427 844.2861.2097 0.6067 0.338 0.287 1600 0.04873 390.43 0.9844 852.917 849.8571.1920 0.5996 0.335 0.287 1600 0.04859 388.69 0.9772 855.308 852.2741.1662 0.5867 0.332 0.287 1600 0.04827 385.77 0.9634 860.114 857.1261.1475 0.5757 0.329 0.287 1600 0.04801 383.17 0.9518 864.283 861.3351.1441 0.5802 0.329 0.287 1600 0.04808 384.38 0.9562 862.621 859.6543.2658 2.0162 0.542 0.338 1470 0.06602 611.46 2.0887 692.817 685.313.2704 2.0393 0.543 0.338 1470 0.06621 614.08 2.1037 691.674 684.0933.2696 1.9999 0.543 0.338 1470 0.06586 609.72 2.0777 693.721 686.2470.0000 0.1082 0.000 0.260 1707 0.02349 237.50 0.2887 1706.9 1705.86
Run
#1
0.0000 0.1076 0.000 0.260 1707 0.02349 236.83 0.2878 1706.9 1705.87
Table D1. Mass Flow Calculations Run 1

60
P total P1 Mach # m6 TT6 rho 1 Ve1
m dot 1 tt7 1 t7 1
0.0000 0.1203 0.000 0.260 1707 0.02351 250.30 0.3045 1706.9 1705.750.0000 0.1229 0.000 0.260 1707 0.02351 252.92 0.3077 1706.9 1705.721.4647 0.7756 0.370 0.296 1570 0.05221 426.44 1.1521 805.678 802.0221.4564 0.7549 0.369 0.296 1580 0.05163 423.10 1.1302 814.07 810.4711.4477 0.7481 0.368 0.296 1580 0.05148 421.81 1.1235 815.822 812.2451.4392 0.7460 0.367 0.296 1580 0.05141 421.50 1.1212 816.406 812.8341.4003 0.7182 0.362 0.294 1580 0.05107 414.94 1.0963 820.945 817.4843.2741 2.2230 0.543 0.338 1470 0.06733 635.79 2.2148 683.443 675.3163.2755 2.2630 0.543 0.338 1470 0.06819 637.43 2.2489 681.086 672.9173.2748 2.2363 0.543 0.338 1470 0.06798 634.62 2.2322 682.233 674.1363.2748 2.2161 0.543 0.338 1470 0.0678 632.60 2.2191 683.146 675.1013.2732 2.2143 0.543 0.338 1470 0.06779 632.37 2.2181 683.207 675.1673.2731 2.1757 0.543 0.338 1470 0.06744 628.49 2.1930 684.995 677.0543.2719 2.1562 0.543 0.338 1470 0.06726 626.48 2.1802 685.908 678.0183.2716 2.1222 0.543 0.338 1470 0.06693 623.07 2.1576 687.57 679.7653.2707 2.0827 0.543 0.338 1470 0.06658 618.87 2.1318 689.505 681.8053.2656 1.9604 0.542 0.338 1470 0.06542 605.71 2.0502 695.928 688.5523.2630 1.8415 0.542 0.338 1470 0.0643 592.14 1.9700 702.782 695.7333.2560 1.7508 0.542 0.337 1470 0.06349 581.03 1.9088 707.833 701.0463.1251 1.6603 0.531 0.335 1480 0.06261 569.80 1.8458 713.908 707.382.9619 1.5707 0.518 0.328 1490 0.06192 557.30 1.7853 717.025 710.7812.8149 1.4960 0.506 0.327 1495 0.0612 547.05 1.7323 722.296 716.282.6770 1.4348 0.494 0.325 1500 0.06063 538.26 1.6886 726.26 720.4352.5368 1.3595 0.482 0.318 1515 0.05993 526.98 1.6341 730.629 725.0462.4180 1.2949 0.471 0.317 1515 0.05928 517.12 1.5862 735.464 730.0882.3032 1.2305 0.460 0.315 1525 0.05849 507.53 1.5358 742.504 737.3252.1915 1.1666 0.449 0.313 1526 0.05778 497.18 1.4864 747.928 742.9592.0949 1.1100 0.440 0.311 1530 0.05711 487.79 1.4415 753.825 749.0412.0129 1.0744 0.432 0.309 1530 0.05676 481.41 1.4138 756.346 751.6860.0000 0.1177 0.000 0.260 1707 0.02538 238.25 0.3129 1580.78 1579.730.0000 0.1184 0.000 0.260 1707 0.02548 238.56 0.3145 1575.19 1574.14
Run
#2
0.0000 0.1181 0.000 0.260 1707 0.02544 238.40 0.3139 1577.3 1576.26
Table D2. Mass Flow Calculations Run 2

61
APPENDIX E. AFTERBURNER MEASUREMENTS
P total P1 P2 FF Thrust Mach 0.0000 0.0737 0.0532 NA 5.03 0.0000.0000 0.0742 0.0553 0.00329 5.22 0.0000.0000 0.0753 0.0555 NA 5.37 0.0000.0000 0.0759 0.0565 0.00404 5.53 0.0000.0000 0.0768 0.0581 0.00361 5.57 0.0000.0000 0.0777 0.0573 0.00377 5.68 0.0000.0000 0.0395 0.0222 0.00504 5.86 0.0000.0000 0.0181 0.0148 0.00623 5.74 0.0000.0000 0.0147 0.0084 0.00528 5.31 0.0000.0000 0.0126 0.0063 0.00483 5.04 0.0000.0000 0.0109 0.0031 0.00483 4.75 0.0000.0000 0.0080 0.0023 0.00491 4.70 0.0000.2219 0.0918 0.0897 0.00459 3.31 0.1460.2205 0.0886 0.1026 0.00474 3.51 0.1460.2188 0.1467 0.1471 0.00465 3.69 0.1450.2162 0.1453 0.1453 0.00471 3.75 0.1440.2159 0.1425 0.1397 0.04723 3.80 0.1440.2123 0.1366 0.1403 0.00501 3.82 0.1430.2077 0.1373 0.1315 0.00473 3.94 0.1420.3861 0.1710 0.1799 0.00513 1.28 0.1930.3804 0.1615 0.1786 0.00528 1.33 0.1910.3743 0.1604 0.1695 0.00541 1.47 0.1900.3704 0.1480 0.1611 0.00502 1.59 0.1890.3560 0.1389 0.1528 0.00500 1.70 0.1850.3510 0.1376 0.1477 0.00552 1.91 0.1840.3383 0.1301 0.1401 0.00509 2.01 0.1800.3340 0.1184 0.1369 0.00460 2.08 0.1790.3256 0.1188 0.1394 0.00471 2.17 0.1770.3207 0.1160 0.1301 0.00520 2.17 0.1760.2714 0.0830 0.1040 0.00498 2.59 0.162
Run
#1
0.1446 0.0357 0.0662 0.00501 4.01 0.118
Table E1. Measurements of Afterburner Run 1.

62
P total P1 P2 FF Thrust Mach
0.0000 0.0715 0.0532 NA 5.08 0.0000.0000 0.0743 0.0551 0.00313 5.33 0.0000.0000 0.0763 0.0565 0.00339 5.44 0.0000.0000 0.0777 0.0580 0.00319 5.53 0.0000.0000 0.0777 0.0586 0.00281 5.65 0.0000.0000 0.0774 0.0521 0.00342 5.65 0.0000.0000 0.0556 0.0405 0.00290 5.82 0.0000.0000 0.0447 0.0311 0.00486 5.82 0.0000.0000 0.0285 0.0166 0.00489 5.87 0.0000.0000 0.0186 0.0119 0.00538 5.72 0.0000.0000 0.0165 0.0083 0.00525 5.60 0.0000.0000 0.0117 0.0055 0.00467 5.39 0.0000.0000 0.0088 0.0056 0.00508 5.33 0.0000.0000 0.0098 0.0048 0.00502 5.17 0.0000.0000 0.0123 0.0068 0.00503 5.29 0.0000.0000 0.0107 0.0072 0.00512 5.37 0.0000.0000 0.0131 0.0064 0.00469 5.41 0.0000.1533 0.0124 0.0243 0.00459 4.94 0.1220.1521 0.0591 0.0683 0.00556 4.26 0.1210.2786 0.1713 0.1721 0.00505 3.47 0.1640.2720 0.1702 0.1708 0.00463 3.50 0.1620.2365 0.1486 0.1464 0.00518 3.98 0.1510.2344 0.1549 0.1485 0.00507 4.00 0.1500.2301 0.1527 0.1558 0.00493 4.11 0.1490.2245 0.1488 0.1483 0.00509 4.31 0.1470.2228 0.1433 0.1433 0.00492 4.38 0.1470.3054 0.1275 0.1331 0.00416 3.29 0.1710.3017 0.1226 0.1310 NA 3.40 0.1700.2959 0.1098 0.1216 0.00494 3.48 0.1690.2869 0.1008 0.1232 0.00498 3.61 0.1660.1636 0.0964 0.0916 0.00632 4.72 0.1260.1601 0.0898 0.0900 0.00521 4.41 0.1240.1554 0.0888 0.0886 0.00482 4.33 0.1220.1501 0.0845 0.0843 0.00579 4.51 0.1200.1477 0.0831 0.0843 0.00513 4.80 0.1190.1446 0.0817 0.0815 0.00536 5.08 0.1180.1443 0.0793 0.0807 0.00553 5.24 0.118
Run
# 2
0.1421 0.0785 0.0816 0.00524 5.41 0.117
Table E2. Measurements of Afterburner Run 2.

63
Mach No lbf
0.1962 -2.13 0.1869 -1.88 0.1770 -1.49 0.1666 -1.11 0.1554 -0.675 0.2436 -5.35 0.2397 -5.04 0.2358 -4.83 0.2317 -4.61 0.2276 -4.45 0.2378 -5.08 0.2373 -5.15 0.2368 -5.28 0.2363 -5.12 0.2358 -5.05
Table E3. Results from Garcia (Ref 7) Shrouded Engine in Freejet at 80% Spool Speed

64
THIS PAGE IS INTENTIONALLY LEFT BLANK

65
APPENDIX F. RESULTS AND INPUT FILES TO OVERFLOW
Figure 34. Pressure Distribution for Turbo-Ramjet Shroud at M∞=0.6
Figure 35. Stagnation Pressure Distribution for Turbo-Ramjet Shroud at M∞=0.6

66
Figure 36. L2 Residual Norm for Turbo-Ramjet Shroud at M∞=0.6

67
Overflow.in Input File for Turbo-Ramjet Shroud $GLOBAL CHIMRA= .F., NSTEPS=10000, RESTRT= .F., NSAVE =100, NQT = 202, $END $FLOINP ALPHA =0, FSMACH= .6000, REY = 1.1420E7, TINF = 520.000, XKINF=.0001, RETINF=0.1, GAMINF=1.4, $END $VARGAM IGAM=0, $END $GRDNAM NAME = 'Axi-symmetric shroud with nose cone', $END $NITERS $END $METPRM $END $TIMACU ITIME=1, CFLMIN=5, CFLMAX=10; $END $SMOACU $END $VISINP VISC =.T., CFLT = 1, ITERT = 3, $END $BCINP NBC = 9, IBTYP = 5, 5, 32, 32, 32, 22, 16,16, 16, IBDIR = -2, 2, 1, 2, -2, 3, 1, 2, 2, JBCS = 85, 31, -1,378, 1, 1, 1, 1,134, JBCE = 377,133, -1, -1, 84, -1, 1,31, -1, KBCS = 51, 1, 1, -1, -1, 1, 1, 1, 1, KBCE = 51, 1, -1, -1, -1, -1, -1, 1, 1, LBCS = 1, 1, 1, 1, 1, 1, 1, 1, 1, LBCE = -1, -1, -1, -1, -1, 1, -1,-1, -1, $END $SCEINP $END

68
Figure 37. Pressure Distribution for Turbo-Ramjet with Engine Inflow/Outflow at
M∞=0.6
Figure 38. L2 Residual Norm for Turbo-Ramjet with Engine Inflow/Outflow at M∞=0.6

69
Overflow.in Input File for Actual Turbo-Ramjet with Engine Inflow/Outflow
$GLOBAL CHIMRA= .F., NSTEPS=15000, RESTRT= .F., NSAVE =100, NQT = 202, $END $FLOINP ALPHA =0, FSMACH= .6000, REY = 1.0420E7, TINF = 520.000, XKINF=.0001, RETINF=0.1, GAMINF=1.4, $END $VARGAM IGAM=0, $END $GRDNAM NAME = 'Axi-symmetric nozzle inlet', $END $NITERS $END $METPRM $END $TIMACU ITIME=1, CFLMIN=5, CFLMAX=10; $END $SMOACU $END $VISINP VISC =.T., CFLT = 1, ITERT = 3, $END $BCINP NBC = 12, IBTYP = 5, 5, 5, 32, 32, 32, 33, 49, 22, 16,16, 16, IBDIR = 2, -2, 2, 1, 2, -2, -2, 2, 3, 1, 2, 2, JBCS = 31, 85,171, -1,523, 1,148,411, 1, 1, 1,429, JBCE = 147,522,410, -1, -1, 84,170,428, -1, 1,30, -1, KBCS = 1, -1, 1, 1, -1, -1, 1, 1, 1, 1, 1, 1, KBCE = 1, -1, 1, -1, -1, -1, 1, 1, -1, -1, 1, 1, LBCS = 1, 1, 1, 1, 1, 1, 1, 1, 1, 1, 1, 1, LBCE = -1, -1, -1, -1, -1, -1, -1, -1, 1, -1,-1, -1, BCPAR1(7)=1.18, $END $SCEINP $END

70
Figure 39. Temperature Distribution for Turbo-Ramjet with Engine Through Flow at
M∞=0.6
Figure 40. Stagnation Pressure Distribution for Turbo-Ramjet with Engine Through Flow at M∞=0.6

71
Figure 41. L2 Residual Norm for Turbo-Ramjet with Engine Through Flow at M∞=0.6

72
Overflow.in Input File for Actual Turbo-Ramjet Through Flow Modeling
$GLOBAL CHIMRA= .F., NSTEPS=30000, RESTRT= .F., NSAVE =1000, NQT = 202, $END $FLOINP ALPHA =0, FSMACH= .6000, REY = 1.0420E7, TINF = 520.000, XKINF=.0001, RETINF=0.1, GAMINF=1.4, $END $VARGAM IGAM=0, $END $GRDNAM NAME = 'Throughflow into engine heating grid TEMP change', $END $NITERS $END $METPRM $END $TIMACU ITIME=1, CFLMIN=1, CFLMAX=10; $END $SMOACU $END $VISINP VISC =.T., CFLT = 1, ITERT = 3, $END $BCINP NBC = 13, IBTYP = 5, 5, 5, 7, 7, 7, 44, 32, 32, 32, 22, 16, 16, IBDIR = 2, -2, 2, 2, 2, -2, 1, 2, -2, 1, 3, 1, 2, JBCS = 1,105,191,296,382,191,290,558, 1, -1, 1, 1,173, JBCE = 172,558,295,381,437,437,291, -1,104, -1, -1, 1, -1, KBCS = 1, -1, 49, 49, 49, 48, 1, -1, -1, 1, 1, 1, 1, KBCE = 1, -1, 49, 49, 49, 48, 47, -1, -1, -1, -1, -1, 1, LBCS = 1, 1, 1, 1, 1, 1, 1, 1, 1, 1, 1, 1, 1, LBCE = -1, -1, -1, -1, -1, -1, -1, -1, -1, -1, 1, -1, -1, BCPAR1(4)=1000, BCPAR1(5)=1500, BCPAR1(6)=3000, BCPAR1(7)=.18, $END $SCEINP $END

73
APPENDIX G. PREDICTED RESULTS FROM GASTURB
Mach Net Thrust TT6 Pt6 Mdot 6 0.00 9.90 1706.90 19.135 0.260 0.05 9.49 1703.93 19.149 0.261 0.10 9.12 1695.01 19.191 0.263 0.15 8.80 1680.86 19.263 0.266 0.20 8.52 1661.79 19.365 0.270 0.25 8.28 1638.63 19.501 0.276 0.30 8.10 1614.09 19.684 0.283 0.35 7.95 1586.75 19.907 0.292 0.40 7.84 1557.58 20.173 0.302 0.45 7.75 1526.70 20.483 0.313 0.50 7.69 1496.31 20.838 0.326 0.55 7.65 1466.72 21.250 0.339 0.60 7.64 1438.16 21.727 0.355
Table G1. Predicted Off-Design Values of J450 Turbojet
7
8
9
10
11
12
13
Net
Thr
ust [
lb]
0 .5 1 1.5 2
Mach Number
Mach Number = 0 ... 2
Figure 42. Predicted J450 Turbojet Net Thrust vs. Mach Number

74
1200
1300
1400
1500
1600
1700
1800Tu
rbin
e E
xit T
empe
ratu
re T
5 [R
]
0 .5 1 1.5 2
Mach Number
Mach Number = 0 ... 2
Figure 43. Predicted J450 Turbojet Turbine Exit Temperature vs. Mach Number

75
10
20
30
40
50
60
70
80
90Tu
rbin
e E
xit P
ress
ure
P5
[psi
a]
0 .5 1 1.5 2
Mach Number
Mach Number = 0 ... 2
Figure 44. Predicted J450 Turbojet Turbine Exit Pressure vs. Mach Number

76
.2
.4
.6
.8
1
1.2
1.4
1.6
1.8N
ozzl
e Th
roat
Flo
w W
8 [lb
/s]
0 .5 1 1.5 2
Mach Number
Mach Number = 0 ... 2
Figure 45. Predicted J450 Turbojet Mass Flow Rate vs. Mach Number

77
Table G2. Single Cycle Results of Turbo-Ramjet Modeled as Mixed Flow Turbofan

78
Table G3. Input Table for GASTURB Turbofan Modeling of Turbo-Ramjet

79
Table G3 (cont). Input Table for GASTURB Turbofan Modeling of Turbo-Ramjet

80
THIS PAGE IS INTENTIONALLY LEFT BLANK

81
LIST OF REFERENCES 1. Pratt, W.H., and Heiser, D.T., Hypersonic Airbreathing Propulsion, American Institute of Aeronautics and Astronautics, Inc., 1994. 2. Mondey, D., editor, “The International Encyclopedia of Aviation”, Octopus Books, Ltd., 1977. 3. Rivera, G., Turbochargers to Small Turbojet Engines for Uninhabited Aerial Vehicles, Engineer’s Thesis, Department of Aeronautics and Astronautics, U.S. Naval Postgraduate School, Monterey, CA, June 1998, 4. Hackaday, G., Thrust Augmentation for a Small Turbojet Engine, Master’s Thesis, Department of Aeronautics and Astronautics, U.S. Naval Postgraduate School, Monterey, CA, March 1999. 5. Andreou, L., Performance of a Ducted Micro-Turbojet Engine, Master’s Thesis, Department of Aeronautics and Astronautics, U.S. Naval Postgraduate School, Monterey, CA, September 1999. 6. Al-Namani, S. M., Development of Shrouded Turbojet to Form a Turboramjet for Future Missile Applications, Master’s Thesis, Department of Physics, U.S. Naval Postgraduate School, Monterey, CA, June 2000. 7. Garcia, H., Testing and Development of a Shrouded Gas Turbine Engine in a Freejet Facility, Master’s Thesis, Department of Physics, U.S. Naval Postgraduate School, Monterey, CA, December 2000. 8. Kurzke, J., GASTURB 9.0 for Windows: A Program to Calculate Design and Off Design Performance of Gas Turbine Engines, 2001. 9. Mattingly, J.D., Heiser, W.H., and Daley, D.H., Aircraft Engine Design, American Institute of Aeronautics and Astronautics, Inc., 1987. 10. Buning, P.G., Chiu, I.T., Obayashi, S., Rizk, Y.M., and Steger, J.L., “Numerical Simulation of the Integrated Space Shuttle Vehicle in Ascent”, AIAA-88-4359-CP, AIAA Atmospheric Flight Mechanics Conference, Minneapolis, MN, August 1988. 11. Coyne, E., Computational Analysis of the Off-design Performance of a Mach 6
maxsp
L ID
Optimized Waverider, Master’s Thesis, Department of Aeronautics and
Astronautics, U.S. Naval Postgraduate School, Monterey, CA, September 1999.

82
12. Williams, A.N., Computational Fluid Dynamics Analysis of a Dual Mode Thruster, Master’s Thesis, Department of Aeronautics and Astronautics, U.S. Naval Postgraduate School, Monterrey, CA, September 1999.

83
INITIAL DISTRIBUTION LIST 1 Defense Technical Information center Ft Belvoir, VA 2 Dudley Knox Library Naval Postgraduate School Monterey, CA 3 Prof Max Platzer Chairman, Department of Aeronautics Naval Postgraduate School Monterey, CA 4 Prof Garth V. Hobson Naval Postgraduate School Monterey, CA 5 Prof Raymond P. Shreeve Naval Postgraduate School Monterey, CA 6 Naval Air Warfare Center Aircraft Division Propulsion and Power Engineering Patuxent River, MD ATTN: C. Georgio, Code 4.4 7. Ross H. Piper III Lakeside, CA