thesis ali nov-2013 - laurentian university · ii thesis defence committee/comitÉ de soutenance de...
TRANSCRIPT
DETERMINATION AND SPECIATION OF TELLURIUM IN
ENVIRONMENTAL SAMPLES USING
HYDRIDE GENERATION ATOMIC FLUORESCENCE SPECTROSCOPY
(HG-AFS)
by Ali Alzahrani
A thesis submitted in partial fulfillment of the requirements for the degree of
Master of Science (MSc) in Chemical Sciences
The School of Graduate Studies Laurentian University
Sudbury, Ontario, Canada
© Ali Alzahrani, 2013
ii
THESIS DEFENCE COMMITTEE/COMITÉ DE SOUTENANCE DE THÈSE
Laurentian Université/Université Laurentienne School of Graduate Studies/École des études supérieures
Title of Thesis Titre de la thèse DETERMINATION AND SPECIATION OF TELLURIUM IN ENVIRONMENTAL SAMPLES USING HYDRIDE GENERATION ATOMIC FLUORESCENCE SPECTROSCOPY (HG-AFS) Name of Candidate Nom du candidat Alzahrani, Ali Degree Diplôme Master of Science Department/Program Date of Defence Département/Programme Chemical Sciences Date de la soutenance November 22, 2013
APPROVED/APPROUVÉ Thesis Examiners/Examinateurs de thèse: Dr. Nelson Belzile (Co-supervisor/Co-directeur) de thèse) Dr. Yu-Wei Chen (Co-supervisor/Co-directrice de thèse) Approved for the School of Graduate Studies Dr. Joy Gray-Munro Approuvé pour l’École des études supérieures (Committee member/Membre du comité) Dr. David Lesbarrères M. David Lesbarrères Dr. Enea Pagliano Director, School of Graduate Studies (External Examiner/Examinateur externe) Directeur, École des études supérieures
ACCESSIBILITY CLAUSE AND PERMISSION TO USE
I, Ali Alzahrani, hereby grant to Laurentian University and/or its agents the non-exclusive license to archive and make accessible my thesis, dissertation, or project report in whole or in part in all forms of media, now or for the duration of my copyright ownership. I retain all other ownership rights to the copyright of the thesis, dissertation or project report. I also reserve the right to use in future works (such as articles or books) all or part of this thesis, dissertation, or project report. I further agree that permission for copying of this thesis in any manner, in whole or in part, for scholarly purposes may be granted by the professor or professors who supervised my thesis work or, in their absence, by the Head of the Department in which my thesis work was done. It is understood that any copying or publication or use of this thesis or parts thereof for financial gain shall not be allowed without my written permission. It is also understood that this copy is being made available in this form by the authority of the copyright owner solely for the purpose of private study and research and may not be copied or reproduced except as permitted by the copyright laws without written authority from the copyright owner.
iii
Abstract
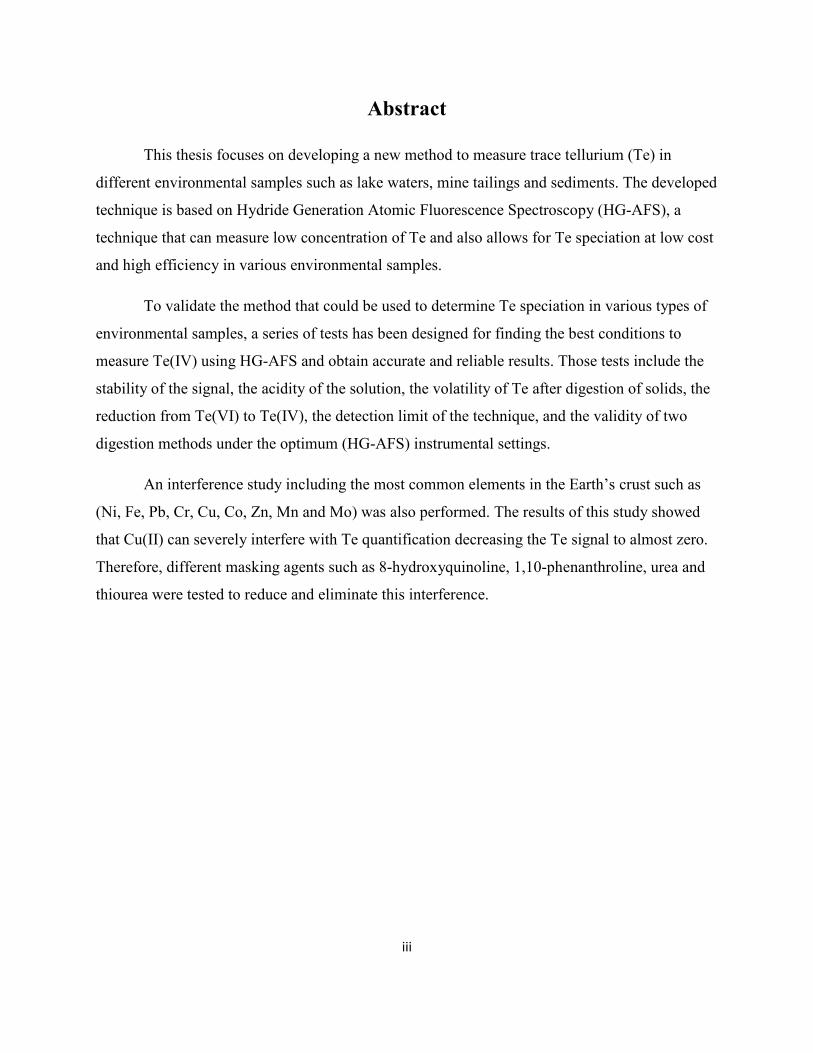
This thesis focuses on developing a new method to measure trace tellurium (Te) in
different environmental samples such as lake waters, mine tailings and sediments. The developed
technique is based on Hydride Generation Atomic Fluorescence Spectroscopy (HG-AFS), a
technique that can measure low concentration of Te and also allows for Te speciation at low cost
and high efficiency in various environmental samples.
To validate the method that could be used to determine Te speciation in various types of
environmental samples, a series of tests has been designed for finding the best conditions to
measure Te(IV) using HG-AFS and obtain accurate and reliable results. Those tests include the
stability of the signal, the acidity of the solution, the volatility of Te after digestion of solids, the
reduction from Te(VI) to Te(IV), the detection limit of the technique, and the validity of two
digestion methods under the optimum (HG-AFS) instrumental settings.
An interference study including the most common elements in the Earth’s crust such as
(Ni, Fe, Pb, Cr, Cu, Co, Zn, Mn and Mo) was also performed. The results of this study showed
that Cu(II) can severely interfere with Te quantification decreasing the Te signal to almost zero.
Therefore, different masking agents such as 8-hydroxyquinoline, 1,10-phenanthroline, urea and
thiourea were tested to reduce and eliminate this interference.

iv
Acknowledgements
I very much appreciate that my advisors, Drs Yu- Wei Chen and Nelson Belzile provided
me with academic guidance throughout all my graduate studies. I really appreciate their patience
and the knowledge I obtained from them. I want to thank Dr. Joy Gray-Munro for her advice as a
member of my thesis committee.
I want to thank the Ministry of High Education of Saudi Arabia for their financial
support. I also want to express my thanks to the Saudi Bureau and to my advisors for their help.
I am very grateful to the department of Chemistry and Biochemistry and to Laurentian
University for providing the facilities needed for my research.
I feel deep indebtedness to my parents, my wife and my brothers. Their spiritual support
and encouragement throughout this program were very helpful to me.

v
Table of Contents
Abstract………………………………………………………………………………………...…iii
Acknowledgements……………………………………………………………………………….iv
Table of contents…………..………………………………………………………………………v
List of Figures…….…………………………..…………………………………………………viii
List of Tables…...…………………………...……………………………………………………ix
List of Appendices………………………. ………………………………………………….……x
Chapter 1. Introduction………………..………………………………………………………..1
1.1. Tellurium an element with great potential but little renown……………….……..…………2
1.1.1 Discovery and geochemistry………………………………..……………………………….2
1.1.2 Basic chemistry and properties………………………….…….…………………………..2
1.1.3 Tellurium in biology.………………………………………….…………………………….4
1.1.4 Detection of Tellurium - Techniques………….………………………………………….…6
1.2 Atomic Fluorescence Spectroscopy (AFS)…………………….…………………………....8
1.2.1 Discovery of AFS and types of fluorescence energy transitions…………………………9
1.2.2 Principles of AFS……………………..……………………………………………………11
1.2.3 Instrumentation……………………….……………………………………………………11
1.2.4 Hydride Generation…………………...……………………………………………………13
1.3 Objective of the Research……………………………………………………………………14
Chapter 2. Methodology…………………………..……………………………………………15
2.1 Reagents and preparation of solution………………………………………………………...15
2.1.1 Chemical reagents……………….…………………………………………………………15
2.1.2 Preparation of solutions……………………………………………………………………16
2.2 Apparatus……………….……………………………………………………………………16
2.2.1 Microwave digestion system……………………………………………………………...16
2.2.2 Hydride Generation - Atomic Fluorescence Spectrometer (HG-AFS)…………………16
2.3. Optimum instrumental conditions………………………………………………..………18
2.3.1. Effect of hydrochloric acid concentration (HCl) on the Te(IV) signal..….………………18
2.3.2. Detection limit……………………………………………………………………………18

vi
2.3.3. Tellurium linearity range………………………………………………………….………18
2.4. Pre-reduction of Te(VI) to Te(IV)…………………………………………………..………18
2.4.1 Volatility of tellurium in HCl matrix subjected to a microwave pre-reduction…..……..…18
2.4.2. Pre-reduction using 3.0M HCl…………….………………………………………………19
2.4.3. KBr as reducing agent at 100 °C under microwave conditions..………………………….19
2.4.4. Pre-reduction under different concentrations of HCl and higher temperatures..……….20
2.5. Interference of metal ions on Te(IV) determination and masking agent selection………….20
2.5.1. Selection of a masking agent……………………………………………………………20
2.6. Determination of total Te in Sudbury lake waters………………………………………20
2.7. Digestion method for mine tailings, lake sediments and certified reference materials……21
2.7.1 Comparison of two methods for total Te measurement in tailings and sediments…….21
2.8. Test of Te (VI) reduction using the microwave digestion system……………..…………22
2.9. Digestion of certified reference material (CRM)…………………………………………23
2.10. Digestion method for environmental samples………………………………………..……23
Chapter 3. Results and Discussion…………………………………………………………….24
3.1. Optimal instrumentation and measurement conditions...…………..……………………24
3.1.1. Lamp current (mA)………………………….……………………………………………24
3.1.2. Effect of hydrochloric acid concentration on the analytical signal……...………………24
3.1.3. Detection limit of tellurium by PSA 10.055 Millennium Excalibur.………….………25
3.1.4 Study on linearity range of tellurium……….……….……………………………………26
3.2. Pre-reduction of Te(VI) to Te(IV)………………………………………………………27
3.2.1. Study on the volatility of tellurium in HCl matrix under microwave conditions……...…27
3.2.2. KBr as reducing agent…………...………………….……………………………………29
3.2.3. Pre-reduction using different concentrations of HCl and temperatures…………………31
3.3. Interference from metal ions on the Te(IV) signal.……………..…………………………31
3.4. Selection of masking agents…….………………….…….…………………………………33
3.5. Tellurium in Sudbury Lake waters…………..……………………………………………36
3.6. Digestion method for tailings and sediments……………………………………………38
3.6.1. Hot plate digestion method……………………………………………………………….38
3.6.2. Microwave digestion system: Digestion temperature…………………………………….39

vii
3.6.3. Digestion reagents…………………………………………………………………………40
3.6.4. Test on Te(VI) reduction under the selected digestion reagent system………….……41
3.7. Method validation with certified reference material GBW07312……….………………42
3.8. Determination of total Te in sediment and tailing samples…………………………………42
4. Conclusions…….………………………………………………………………………………44
References………….……………………………………………………………………………..46
Appendices….……….……………………...……….……………………………………………49

viii
List of Figures
Figure 1-1 Basic energy diagram representing the principle of AFS……………………………9
Figure 1-2 The different fluorescent energy transitions………….……………………………10
Figure 1-3 Schematic representation of an AFS setup………………………………………12
Figure 3-1 Effect of HCl molarity on 20, 40 and 60 µg/L Te (IV) solution signal….…...……25
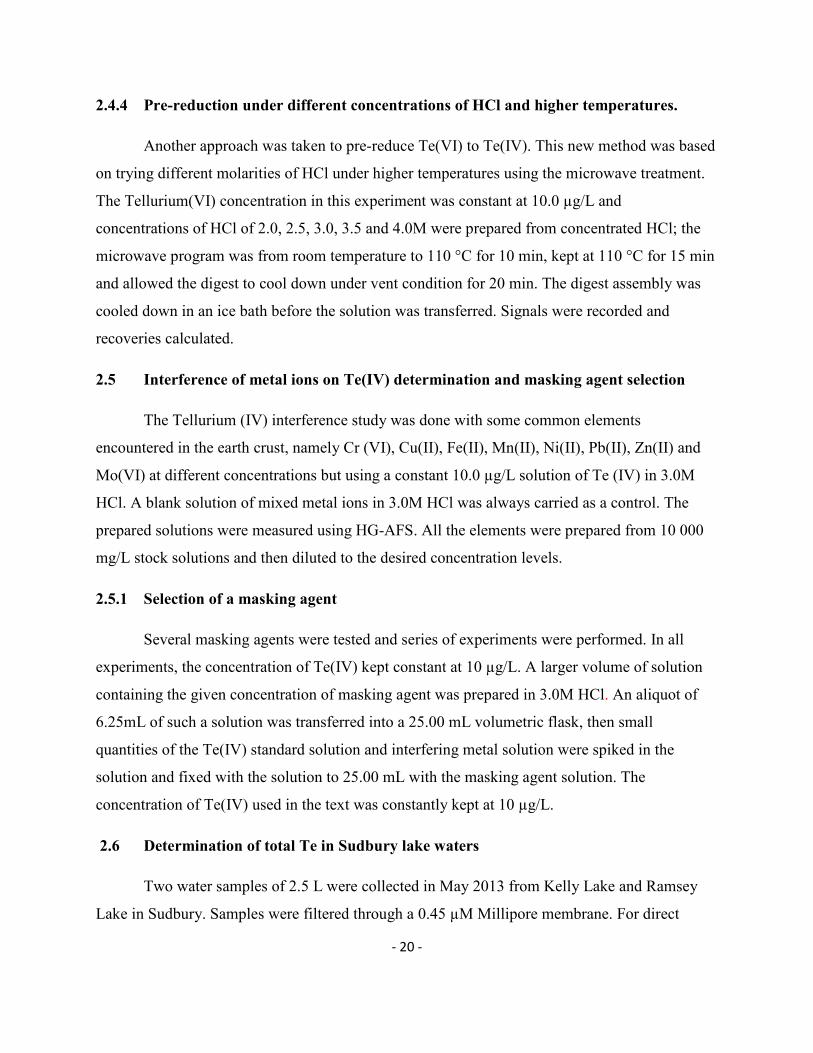
Figure 3-2 Detection limit of Te(IV) by PSA10.055 Millennium Excalibur.…………………26
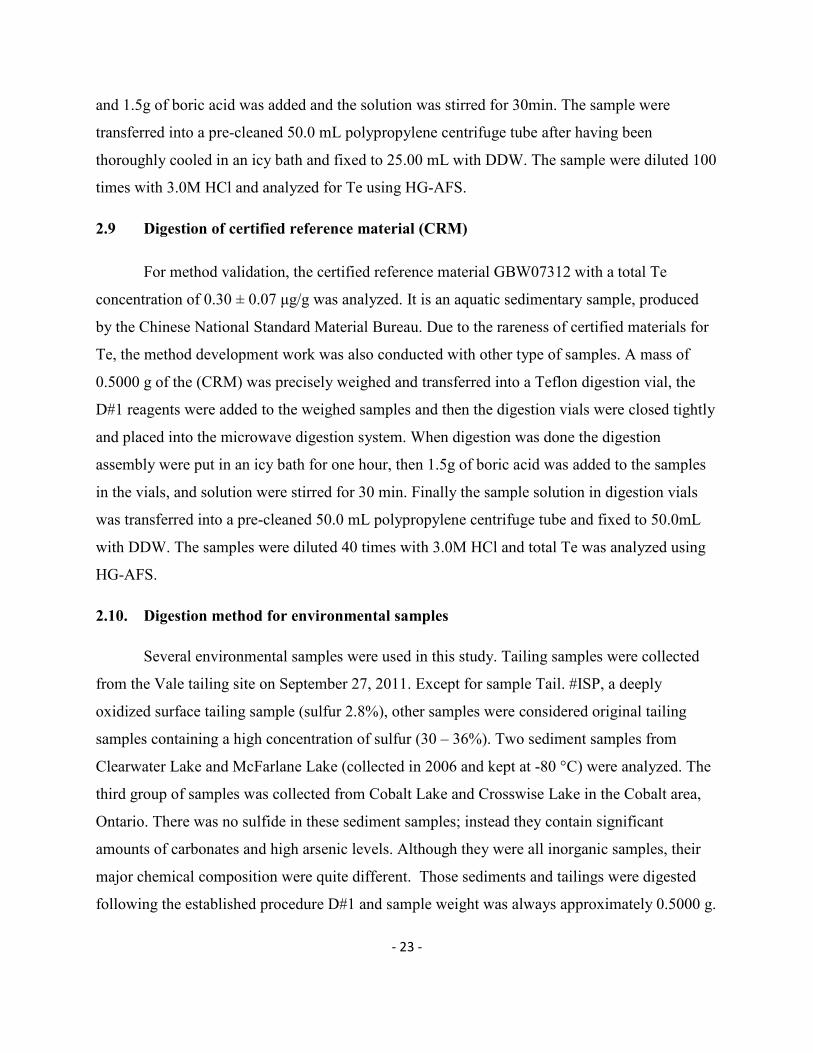
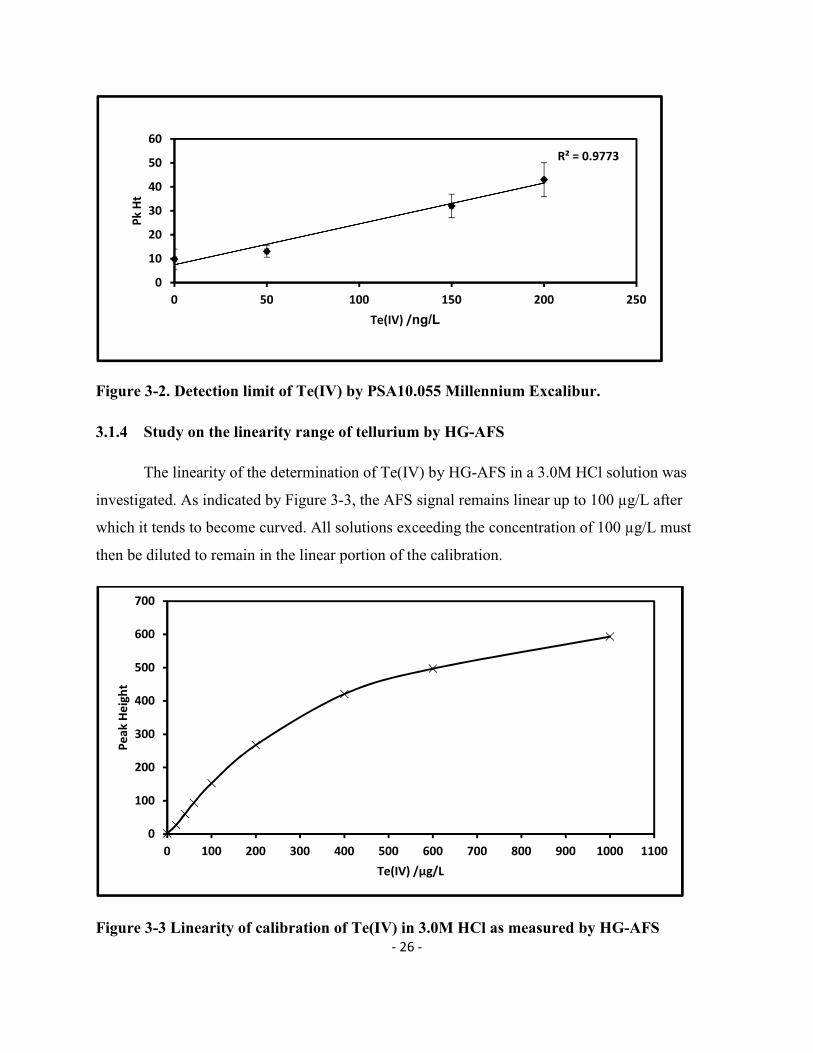
Figure 3-3 Linearity of calibration of Te(IV) in 3.0M HCl as measured by HG-AFS…………26
Figure 3-4 (A) Tested solutions containing 10 µg/L Te(IV) in presence of 3.0M HCl………28
Figure 3-4 (B) Tested solutions containing 10 µg/L Te(IV) in presence of 3.0M HCl………29
Figure 3-5 Pre-reduction of Te(VI) in presence of 0.17M KBr under a microwave treatment at
110 °C and comparison with a standard Te(IV) calibration curve…....................................30
Figure 3-6 Concentration effect of KBr on the reduction of a 10 µg/L Te(VI) solution..…30
Figure 3-7 Study of Ni(II), Co(II), Cr (VI), Fe(III) and Pb(II) interference on a 10 µg/L Te(IV)
solution in 3M HCl………………...…………………………………………………………….32
Figure 3-8 Study of Zn(II), Cr (III), Mo(VI) and Mn(II) interference on a 10 µg/L Te(IV)
solution in 3M HCl………………...……………………………………………………….……32
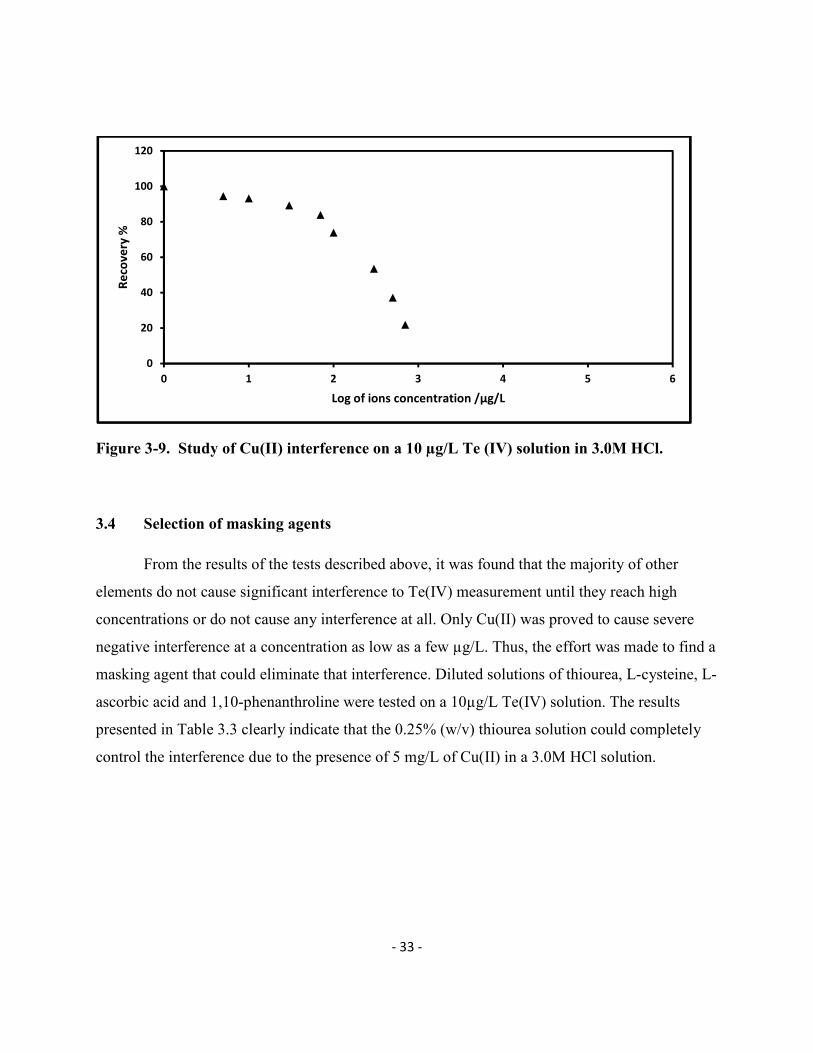
Figure 3-9 Study of Cu(II) interference on a 10 µg/L Te(IV) solution in 3M
HCl…………………………………………………....……………………..…..……………….33
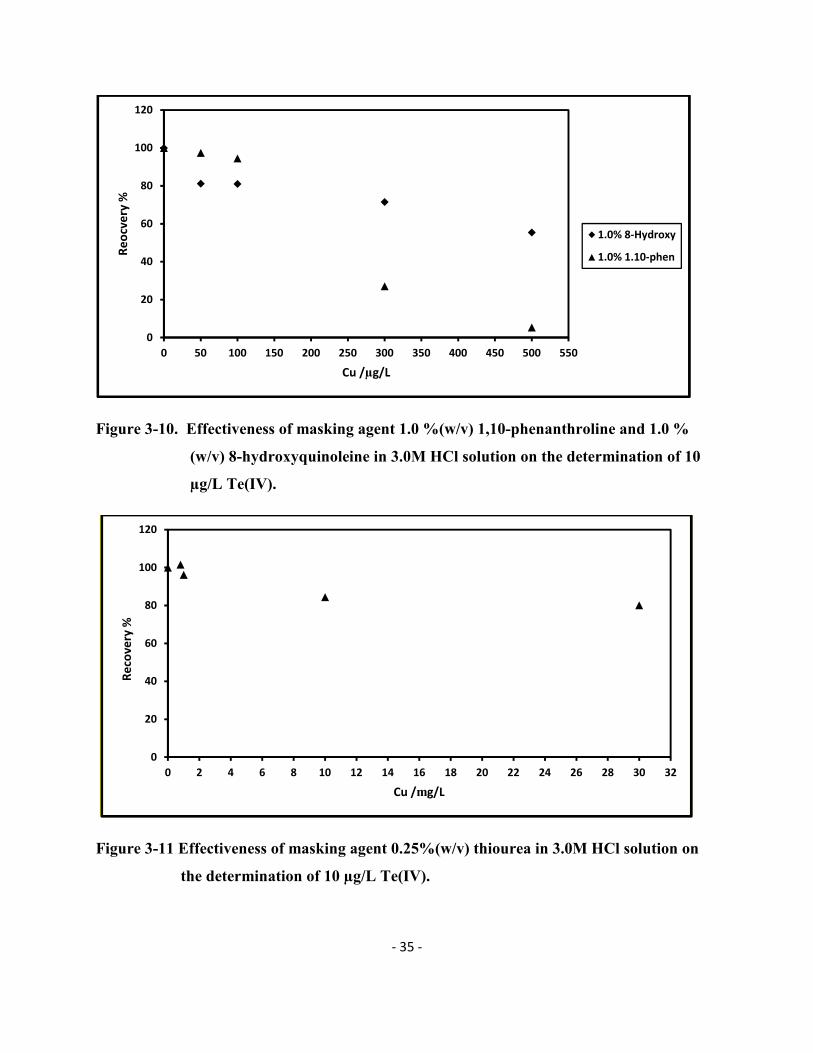
Figure 3-10 Effectiveness of masking agent 1 %(w/v) 1,10-phenanthroline and 1 %(w/v)
8-hydroxyquinoleine in 3.0M HCl solution on the determination of 10 µg/L Te(IV)
solution……………………………………………………………………………..………….…35
Figure 3-11 Effectiveness of masking agent 0.25%(w/v) thiourea in 3.0M HCl solution on the
determination of 10 µg/L Te(IV) solution…………….………………………………………....35
Figure 3-12 Effect of the mixture of different element ions Cu(II), Cr(VI), Cr(III), Fe(III), Zn(II),
Co(III), Mn(II), Mo(VI) and Ni(II) on the recovery of 10 µg/L Te(IV) in presence of 0.25%(w/v)
thiourea……………………………………………………………………………………….….36
Figure 3-13 Digestion of tailings under different temperatures using the microwave system. The
final solution concentration was 3.0M HCl……………..………………….……………………39
Figure 3-14 Summary of the microwave digestion program in 3.0M HCl………………....……40
ix
List of Tables
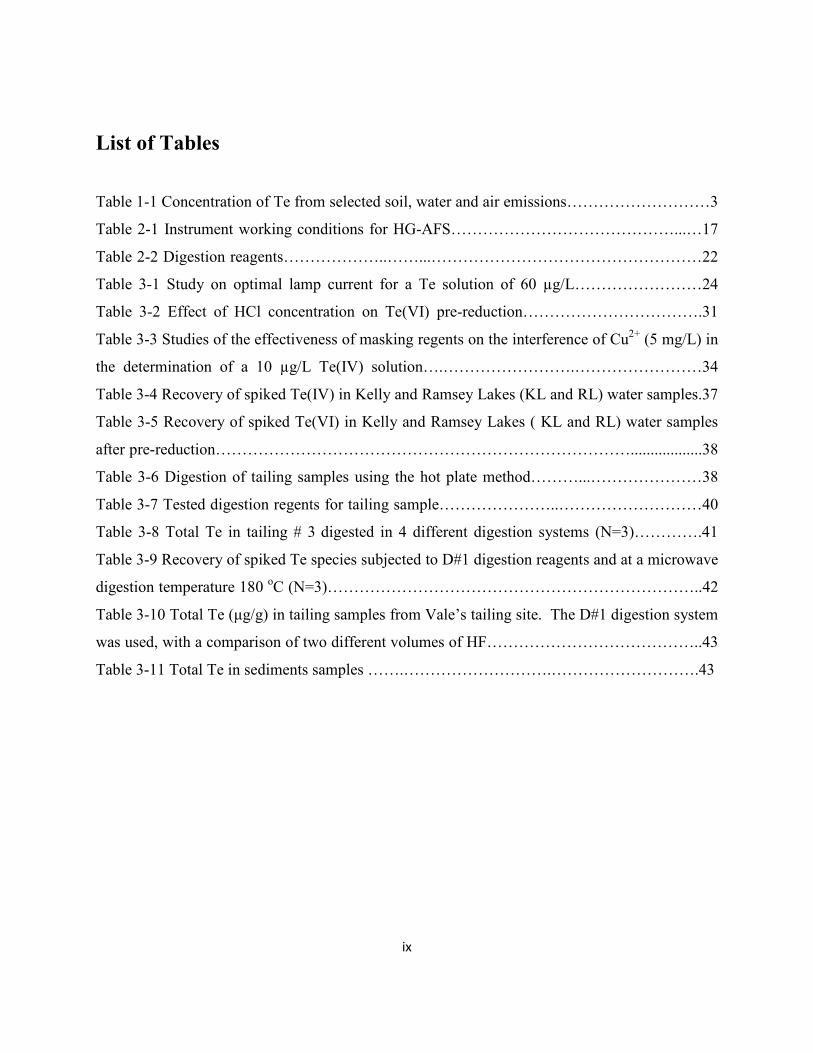
Table 1-1 Concentration of Te from selected soil, water and air emissions………………………3
Table 2-1 Instrument working conditions for HG-AFS……………………………………...…17
Table 2-2 Digestion reagents………………..……...……………………………………………22
Table 3-1 Study on optimal lamp current for a Te solution of 60 µg/L……………………24
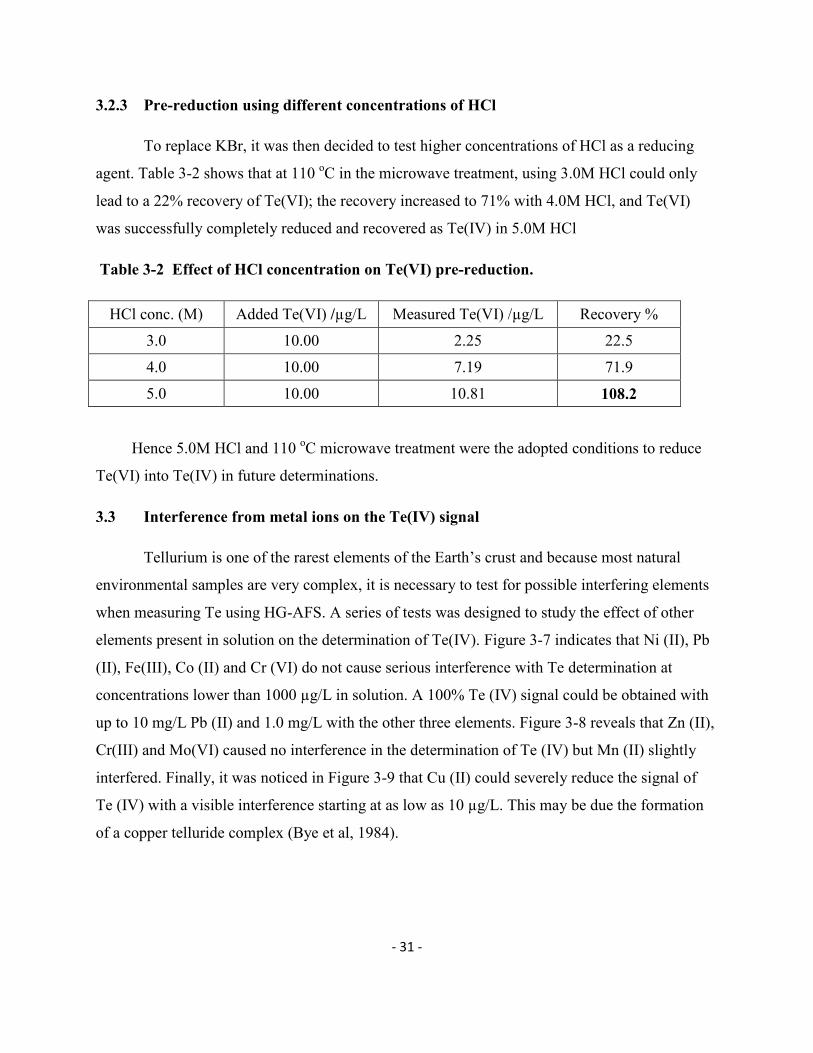
Table 3-2 Effect of HCl concentration on Te(VI) pre-reduction…………………………….31
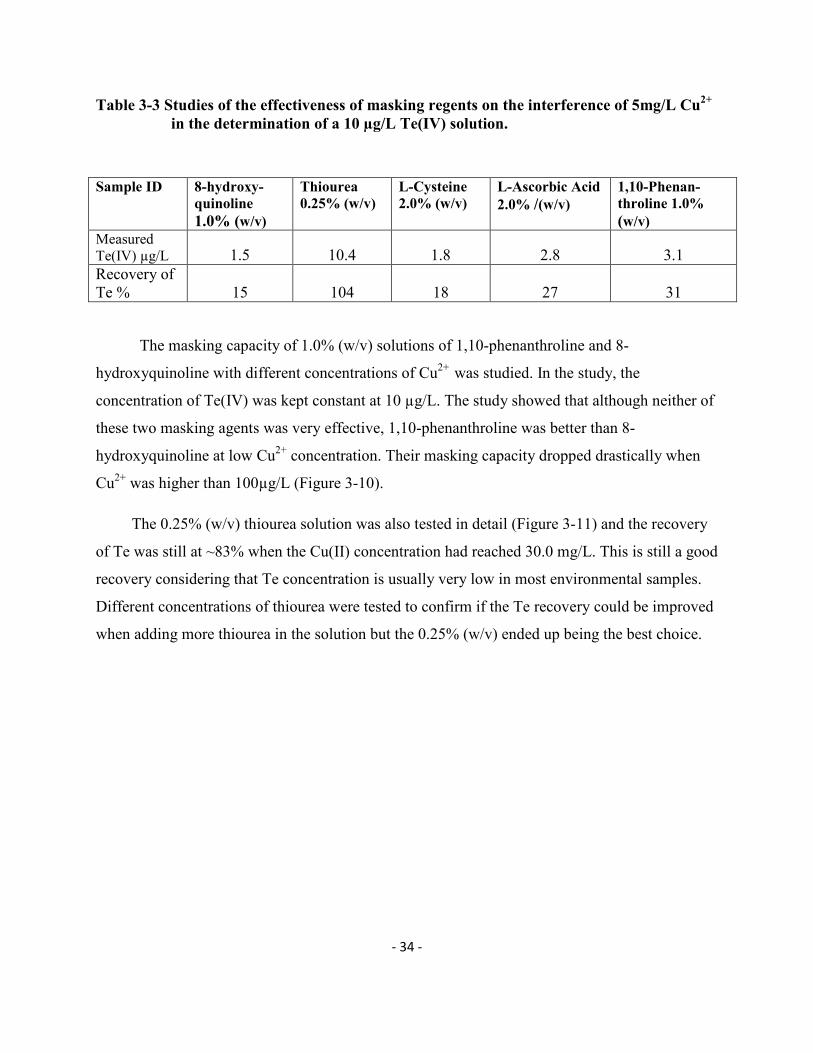
Table 3-3 Studies of the effectiveness of masking regents on the interference of Cu2+ (5 mg/L) in
the determination of a 10 µg/L Te(IV) solution….…………………….……………………34
Table 3-4 Recovery of spiked Te(IV) in Kelly and Ramsey Lakes (KL and RL) water samples.37
Table 3-5 Recovery of spiked Te(VI) in Kelly and Ramsey Lakes ( KL and RL) water samples
after pre-reduction……………………………………………………………………..................38
Table 3-6 Digestion of tailing samples using the hot plate method………...…………………38
Table 3-7 Tested digestion regents for tailing sample…………………..………………………40
Table 3-8 Total Te in tailing # 3 digested in 4 different digestion systems (N=3)………….41
Table 3-9 Recovery of spiked Te species subjected to D#1 digestion reagents and at a microwave
digestion temperature 180 oC (N=3)……………………………………………………………..42
Table 3-10 Total Te (µg/g) in tailing samples from Vale’s tailing site. The D#1 digestion system
was used, with a comparison of two different volumes of HF…………………………………..43
Table 3-11 Total Te in sediments samples …….……………………….……………………….43
x
List of Appendices
Appendix 1: Instrumental settings………………………………………………………………49
Appendix 2. Interference of metal ions and selection of a masking agent…………………….50
Appendix 3. Digestion determination method………………………………………………...…56

- 1 -
Chapter 1
1. Introduction
The detection and measurement of elements in environmental and biological samples is
very important to reveal the roles of these elements in nature. This becomes especially pertinent
to elements that are present in trace amounts in the environment, but nonetheless have several
applications or potential toxicities. Tellurium (Te) is one such element which has been found to
have known applications in metallurgy, semiconductor technology, anticancer biology and drug
development (Cunha et al., 2009). Tellurium can be found in soil, water and gaseous emissions
and is part of the sludge that is generated from copper and gold ores following elemental
extraction. Tellurium exists in several oxidation states and this property is responsible for many
of its known functions/applications. Several methods have been successfully used for the
determination and detection of Te from its natural sources. Some of these include atomic
absorption spectrometry, inductively-coupled plasma - mass spectrometry (ICP-MS) and hydride
generation coupled to atomic fluorescence spectroscopy (HG-AFS). Each of these techniques has
certain advantages and disadvantages over the others and over time, several methods for sample
pre-concentration, atomization and detection have been developed to neutralize some of the
interference effects and limitations caused by the various techniques. The use of hydride
generation as a method of derivatization of the analyte into a volatile hydride before detection
has proven to be especially useful for the determination of trace elements that can form hydrides.
The combination of hydride generation with atomic fluorescence spectroscopy has been shown
valid and efficient for the detection of Te in the microgram per litre (ppb) range (Feng & Fu,
1998). Further understanding of the properties of this element and the existing detection methods
will aid in the development of technological innovations that yield improved sensitivity.
- 2 -
1.1. Tellurium – an element with great potential but little renown
1.1.1. Discovery and geochemistry
Tellurium is a semi-metallic substance and it forms part of the group of chalcogens which
include sulfur and selenium. The term ‘tellurium’ is derived from the latin term, ‘tellus’ which
means earth. Te was discovered in 1782 by a chemist and mine inspector, Franz-Joseph Mueller
von Reichenstein, in Transylvania. Reichenstein thought that the substance he had isolated from
an ore of gold was antimony. But when he saw that this element did not resemble antimony in
any of its properties, he named it metallum problematicum or aurum paradoxicum. Later, a
German chemist, M. H. Kalproth mentioned this element in a publication and called it tellurium.
(Cunha et al., 2009)
There is still a lot to be discovered about the geochemistry of Te. In the Earth’s crust, Te
is as abundant as metals like silver and gold and is present at a concentration around 27 µg/kg
(ppb) (Ba et al., 2010). Tellurium is isolated from the sludge that is produced after copper
extraction from ores. The alkaline extraction is complex since the method employed will depend
upon what other compounds or elements are present. It is also present as an impurity in gold and
silver ores. There seems to be an uneven distribution of Te on the earth. For instance, although
the overall abundance is thought to be 27 µg/kg, in some areas like the Dongping village in
North China, the amount of Te found in the gold deposits reaches an average of 671 µg/kg (Hua,
2000). The concentration of Te in natural water sources is below the µM range (Pedro et al.,
2006). Plants have also been shown to accumulate Te to the mg/kg range. The amount of Te
found in the world differs from one region to another and between land, water and air sources.
(Table 1-1.)
1.1.2. Basic chemistry and properties
Tellurium belongs to the 5th period and group 16 of the periodic table and has oxygen,
sulfur and selenium belonging to the same group. It has an atomic number of 52 and the
electronic configuration [Kr] 4d105s25p4 (Ba et al., 2010). Being so low in the group, it exhibits a
combination of metallic and non-metallic qualities and is hence called a metalloid or a semi-
metallic element. The elemental form of Te can be either brownish-black or metallic silver and
both allotropes occur in nature (Ba et al., 2010). Naturally occurring Te is a combination of 8

- 3 -
isotopic forms with rounded atomic masses of 120, 122, 123, 124, 125, 126, 128 and 130 a.m.u.,
respectively. Mass spectrometry analysis has shown that the most abundant form of Te is 130Te at
34.1% and the least abundant is 120Te at 0.1% (Ba et al., 2010).
Table 1-1. Concentration of Te from selected soil, water and air emissions (modified from Ba et al., 2010).
Soil sources µg/kg
San Joaquin soil (California, USA) 90
Guangxi area (China) 70
Atmospheric deposition (Norway) 5.2
Water sources µg/kg or µg/L
River and harbor sediments <0.001
Geothermal waters (New Zealand) <0.001
Air sources µg/kg
Soil gases near ore deposits (Germany) 0.000003
Emissions near waste treatment facilities 0.0001
Emissions from industrial sludge fermenters 0.1
Sewage gas (Germany) 0.001
Tellurium shows many similarities with the other chalcogens such as As S and Se; Te
exists in a number of different oxidation states. In the most reduced state it is seen as hydrogen
telluride (H2Te), with an oxidation state of -2. In Na2Te2, the ditelluride anion Te has a -1
oxidation state. Higher oxidation states and the cationic nature of Te are seen in its oxides, for
example, Te has a +4 oxidation state in TeO2 and is +6 in TeO3. Further oxidation of Te from
these states leads to the formation of tellurous (H2TeO3) and telluric acids (Te(OH)6) and the
salts tellurites and tellurates respectively. However, unlike sulfur, the oxidation states +4 and +6
of Te have comparable stabilities and this redox behavior becomes vital for some of its

- 4 -
biological activities. (Ba et al., 2010). Tellurium can also form numerous inorganic and organic
complexes.
1.1.3 Tellurium in biology
Since the 1920s, published literature suggests the use of Te as a therapeutic agent for
diseases like syphilis and leprosy. Tellurium has also been shown to have antimicrobial
properties and to reverse the sickling of red blood cells in sickle cell anemia patients. In the late
1980s, an AIDS cocktail containing Te compounds was made. This drug, called AS-101, has
been shown to modulate the expression of interleukins like IL-2, -5 and -10 and gamma
interferon. More recently, Te related therapeutic effects include hair growth, protection from
apoptosis, and promotion of neuronal cell survival after ischemia and protection of dopaminergic
neurons in Parkinson’s disease (Cunha et al., 2009).
Much of the exposure to Te compounds is occupational and via inhalation, for example,
among metal foundry workers. Accidental ingestion of Te compounds has also been documented
in a few cases (Hazardous Substance Data Bank, HSDB). The organs that show Te accumulation
after exposure include the liver, spleen and kidneys. Tellurium(IV) has a physiological half-life
of two months and exposed individuals may also show significant amounts of Te in their soft
tissue, skin and body fluids, from where Te is transformed and eliminated in its dimethylated
form. (MAK Value Documentation, 2006).
Toxicity studies for Te have been conducted by several authors and it has been shown
that low concentrations of Te, either inhaled or ingested, can cause acute or chronic toxicity
depending on the duration of exposure. Compared to selenium, Te is less soluble and in its
reduced form, it is easily degraded by exposure to light or air. This has been suggested as reasons
for the apparent lower toxicity of Te compared to selenium (Cunha et al., 2009). The common
signs and symptoms of chronic Te toxicity include a sour garlicky odor to the breath and feces,
dry and metallic taste in the mouth, tiredness, sleeplessness and nausea. Acute exposure can also
cause these symptoms, in addition to respiratory distress and edema, retinal changes and in rare
cases, death. (HSDB, 1971)
- 5 -
Several mechanisms have been reviewed for the toxicity of Te in the body. One of the
ways by which Te acts in the body is by inhibiting cholesterol synthesis. Tellurium and its
oxyanionic forms interact with the enzyme squalene monoxygenase, which is the rate-limiting
enzyme in the cholesterol biosynthetic pathway. This enzyme catalyzes the oxidation of squalene
to squalene-2,3-oxide. By blocking this enzyme, cholesterol is not synthesized. Cholesterol is
needed for the generation of cell membranes and in neurons, it is the chief constituent of the
myelin sheath that provides insulation and allows for rapid nerve impulse conduction. Lack of
cholesterol leads to demyelination and can cause neuropathy like symptoms. At the molecular
level, Te, both as itself and in a methylated form, binds to active site cysteine residues at
positions 490 and 557 in squalene monoxygenase causing inhibition of the enzyme (Cunha et al.,
2009; Ba et al., 2010). In a similar manner, methyl tellurium compounds also inhibit the enzyme
squalene epoxidase in Schwann cells that surround axons of nerve fibers. (Ba et al., 2010).
Organotellurium compounds like diphenyl ditelluride exert their neurotoxic and teratogenic
effects in rats by interacting with –SH groups present in enzymes like Na+- and K+- ATPase (Ba
et al., 2010).
Apart from their toxic effects, Te compounds have been shown to have antioxidant
effects as well. This has been observed in the case of organic Te compounds and their interaction
with the glutathione peroxidase system. Glutathione is a natural reducing agent present in cells
that helps to scavenge free radicals produced as a result of normal metabolic activities. The
conversion of glutathione from its reduced to oxidized form is catalyzed by the glutathione
peroxidase enzyme. The active site of this enzyme has a selenium atom. It has been found that
organic Te compounds can act as a selenium mimic and take its place in the enzyme. In fact, it
has been shown that aryl derivatives of Te can augment the antioxidant capabilities of the
enzyme. (Cunha et al., 2009). Other antioxidant systems that are improved by Te compounds
include the thioredoxin / thioredoxin reductase system. This is particularly interesting as this
system is a well-known target of many chemotherapy drugs. (Cunha et al., 2009).
Furthermore, exposure to Te compounds does not affect fertility in rats, although fetal
hydrocephalus was observed when elemental Te was given at a dose between 165 and 220 mg/kg
body weight during gestation. Tellurium dioxide also adversely affected neonatal development
- 6 -
while potassium tellurate and cadmium telluride did not have any effect. (MAK Value
Documentation, 2006).
1.1.4 Detection of tellurium – Techniques
Given its low terrestrial abundance and its toxicity in mammalian systems, the accurate
and precise determination of Te is extremely important. Several techniques have been developed
for this purpose and differ in the type and amount of raw material needed, sensitivity and time
taken for detection. The first step for the detection is generally pre-concentration of the ore/raw
material so that trace amounts of Te can be accurately detected and eluted. Several methods have
been proposed over the years. It has been proposed that trace concentrations of inorganic Te in
the air can be detected by first adsorbing the element onto gold beads and using cationic and
anionic resins to separate it. Once separated on these resins, Te can be eluted by changing the pH
of the reaction mix. Then the element can be detected by graphite furnace atomic absorption
spectrometry (GFAAS).
Another method of pre-concentration is by co-precipitating Te with metal oxides like
those of lanthanum and iron. Pedro et al., (2006) used La(OH)3 to co-precipitate Te from air
samples followed by its adsorption onto XAD resins. The authors found that the XAD resin
showed 72% efficiency in adsorbing Te and had an upper limit of detection of 66 ng/L (Pedro et
al., 2006). Using a similar principle, (Donaldson and Leaver 1990 ) utilized hydrous ferric oxide
to co-precipitate Te present in copper ores. The method involved dissolving the ore in an
ammoniacal medium, co-precipitating Te with ferric oxide, dissolving the precipitate in
hydrochloric acid and using GFAAS to detect Te. This method was considered advantageous as
it could be directly applied to any terrestrial samples suspected of containing as low as 10 pg of
Te for each gram of the sample. Other metal oxides and salts used for co-precipitating trace
elements such as Te include mercury, tin, magnesium (Yildirim et al., 2012) and aluminum
(Duan et al., 2003). Iron and aluminum oxides are favored over other metal oxides because of
their ability to co-precipitate a large number of trace elements and Fe(OH)3 shows a superior
separation efficiency (Duan et al., 2003).

- 7 -
Yet another way by which pre-concentration is done is by online in situ trapping of
gaseous H2Te onto graphite tubes. In this process, the analyte is atomized in the presence of a
strong reducing agent, preferably sodium borohydride (NaBH4) and the H2Te that is generated is
trapped on graphite tubes (Yildirim et al., 2012). This method has the advantages of high
sensitivity, reproducibility, low atomization interferences and easy operation (Yildirim et al.,
2012). Further, the technique can be modified by using graphite tubes pretreated with elements
like iridium (Ir), magnesium (Mg), zirconium (Zr), niobium (Nb) and palladium (Pd) either
singly or in combination. This increases sensitivity and allows detection as a level as low as
0.007 ng of Te (Yildirim et al., 2012). Xi et al. (2010) used this principle to trap Te onto quartz
tubes that were incorporated with a tungsten (W) coil. The use of the tungsten coil for hydride
trapping has been considered more advantageous than the use of graphite furnace because W has
an easier availability and a better resilience. Also, it helps to safe energy and power as it heats up
faster than graphite. This technique of hydride trapping with tungsten was developed
independently by de Souza et al. (2007) and Ataman (2008) as cited in Xi et al. (2010). A similar
principle was used by Matusiewicz and Krawcyzk (2007) for the determination of Te in sediment
samples, coal fly ash and garlic. They used the air-acetylene flame to atomize the analyte and
used in situ hydride trapping in a customized PVC/PTFE tube and then used atomic absorption
spectrometry to detect the levels of Te. They found that the use of this technique allowed for the
detection of Te in fly ash and garlic to the precision levels of 1.863 ± 0.112 mg/kg and 0.058 ±
0.005 mg/kg, respectively. The authors also detected no interference due to matrix effects or
technical errors (Matusiewicz & Krawcyzk, 2007).
As Te exists in various oxidation states and these differ from each other in their
properties, it is also important to have techniques that not only detect total Te levels in the
analyte, but also provide information regarding speciation. For example, the bioavailability and
toxicology profile of Te(IV) is different from that of Te(VI) (Kuo & Jiang, 2008). For this
purpose, Kuo and Jiang (2008) used a combination of ion exchange chromatography to separate
the different oxidation states of Te and then used inductively coupled plasma mass spectrometry
(ICP-MS) to detect the different species in samples of milk, rice flour and urine. In their analysis,
they used a pneumatic nebulizer to vaporize the analyte sample and ammonium citrate was used
as the mobile phase in chromatography. By standardizing the concentration and the pH of the

- 8 -
mobile phase, they were able to retain the Te(IV) species onto the matrix and separate these from
the others. A similar principle was also used by Yu et al. (2003) whereby the analyte was
allowed to interact with ammonium pyrrolidine dithiocarbamate (APDC) under low pH
conditions. This caused Te(IV) species to be retained on the solid phase extraction cartridge and
allowed Te(VI) to flow through. Detection was again performed by ICP-MS (Yu et al., 2003).
Tellurium determination by hydride generation atomic absorption spectroscopy in nickel
and copper alloys has been done by Liu et al. (2002). The authors used a 5% (w/v) solution of
ascorbic acid as a reducing agent to generate tellurium hydride and then extracted Te from the
copper alloys using the chelating agent, N-nitroso-N-phenylhydroxylamine (cupferron). They
then used atomic absorption spectrometry to detect Te. One of the limitations with cupferron
dependent extraction for Te is that it is also pH dependent with the best extraction occurring at
around pH 7. Also, this is a novel technique and therefore requires much optimization before it
can be used routinely (Liu et al., 2002).
1.2 Atomic Fluorescence Spectroscopy (AFS)
Atomic Fluorescence Spectroscopy is an analytical technique that is very sensitive for the
detection of trace amounts of elements in different environmental samples. This technique
exploits the idea that when the sample is exposed to electromagnetic radiation, the atoms go from
the ground energy state to an excited state. When these come back to the ground state, they emit
fluorescence. The energy diagram is provided in figure 2. The emission is unique to each
element and can thus be used to detect it. The main advantage of this technique over atomic
absorption or ICP-MS is that there is no background signal produced, the instrumentation is
relatively inexpensive and multi-elemental analysis can be done. Additionally, as the
fluorescence intensity is proportional to the concentration of the element, this method can be
used for the quantitative analysis of elements.
- 9 -
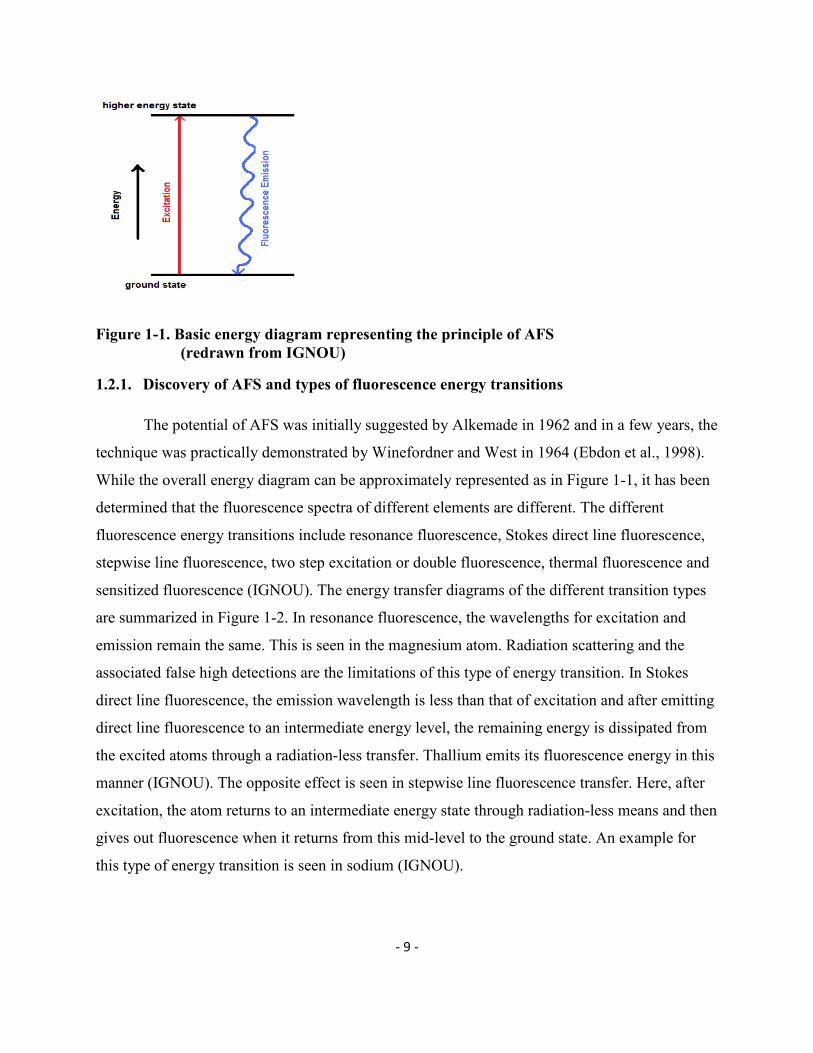
Figure 1-1. Basic energy diagram representing the principle of AFS (redrawn from IGNOU)
1.2.1. Discovery of AFS and types of fluorescence energy transitions
The potential of AFS was initially suggested by Alkemade in 1962 and in a few years, the
technique was practically demonstrated by Winefordner and West in 1964 (Ebdon et al., 1998).
While the overall energy diagram can be approximately represented as in Figure 1-1, it has been
determined that the fluorescence spectra of different elements are different. The different
fluorescence energy transitions include resonance fluorescence, Stokes direct line fluorescence,
stepwise line fluorescence, two step excitation or double fluorescence, thermal fluorescence and
sensitized fluorescence (IGNOU). The energy transfer diagrams of the different transition types
are summarized in Figure 1-2. In resonance fluorescence, the wavelengths for excitation and
emission remain the same. This is seen in the magnesium atom. Radiation scattering and the
associated false high detections are the limitations of this type of energy transition. In Stokes
direct line fluorescence, the emission wavelength is less than that of excitation and after emitting
direct line fluorescence to an intermediate energy level, the remaining energy is dissipated from
the excited atoms through a radiation-less transfer. Thallium emits its fluorescence energy in this
manner (IGNOU). The opposite effect is seen in stepwise line fluorescence transfer. Here, after
excitation, the atom returns to an intermediate energy state through radiation-less means and then
gives out fluorescence when it returns from this mid-level to the ground state. An example for
this type of energy transition is seen in sodium (IGNOU).
- 10 -
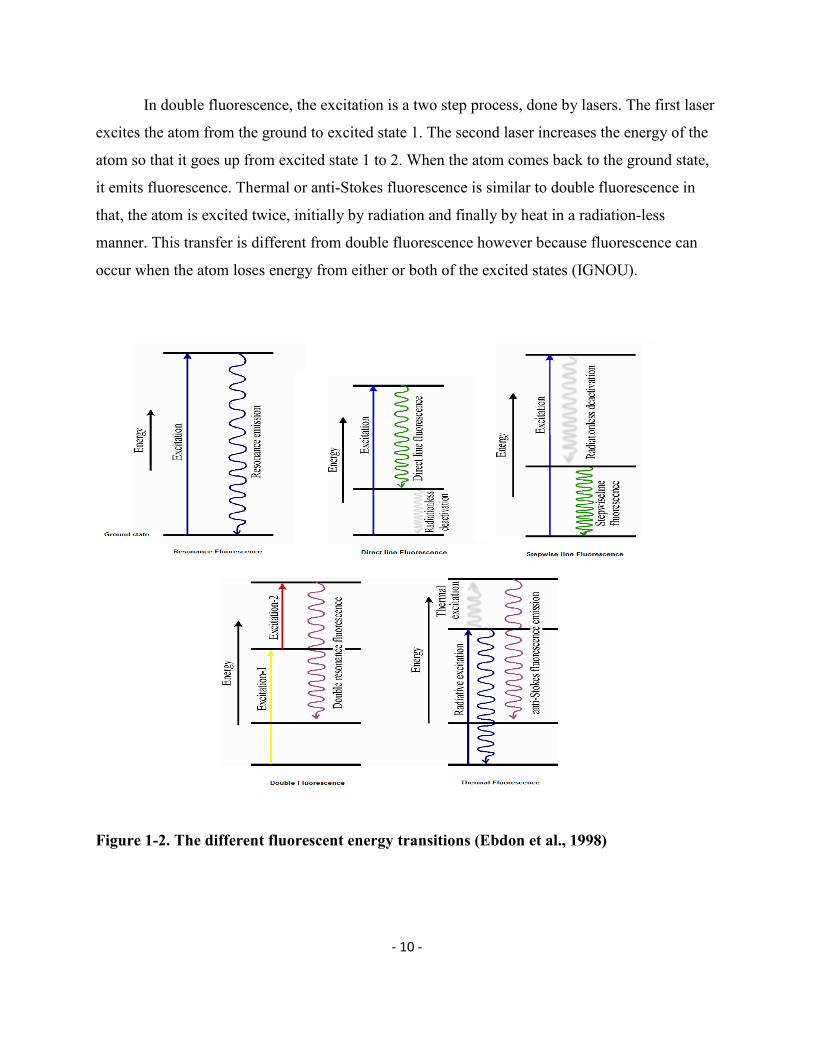
In double fluorescence, the excitation is a two step process, done by lasers. The first laser
excites the atom from the ground to excited state 1. The second laser increases the energy of the
atom so that it goes up from excited state 1 to 2. When the atom comes back to the ground state,
it emits fluorescence. Thermal or anti-Stokes fluorescence is similar to double fluorescence in
that, the atom is excited twice, initially by radiation and finally by heat in a radiation-less
manner. This transfer is different from double fluorescence however because fluorescence can
occur when the atom loses energy from either or both of the excited states (IGNOU).
Figure 1-2. The different fluorescent energy transitions (Ebdon et al., 1998)

- 11 -
1.2.2. Principle of AFS
The overall rationale behind AFS is as follows. The sample to be analyzed, also called the
analyte is atomized with the help of a flame or furnace. These atoms are in the ground state and
are excited by using either a continuous or a monochromatic wavelength source. The atomic
fluorescence is then measured using a relevant detection and quantification device. The
fluorescence intensity is proportional to the amount of the element of interest in the analyte, at
low concentrations. This is summarized by the following equation (Ebdon et al., 1998):
If = kεI0C
Where
If = fluorescence intensity
k = constant
ε = quantum efficiency
I0 = radiation source intensity at the wavelength for absorption
C = concentration of the atoms
However, beyond a threshold concentration, problems of self absorption and quenching
effects occur and that may affect the efficiency of this procedure, although AFS can be modified
to reduce these effects (IGNOU).
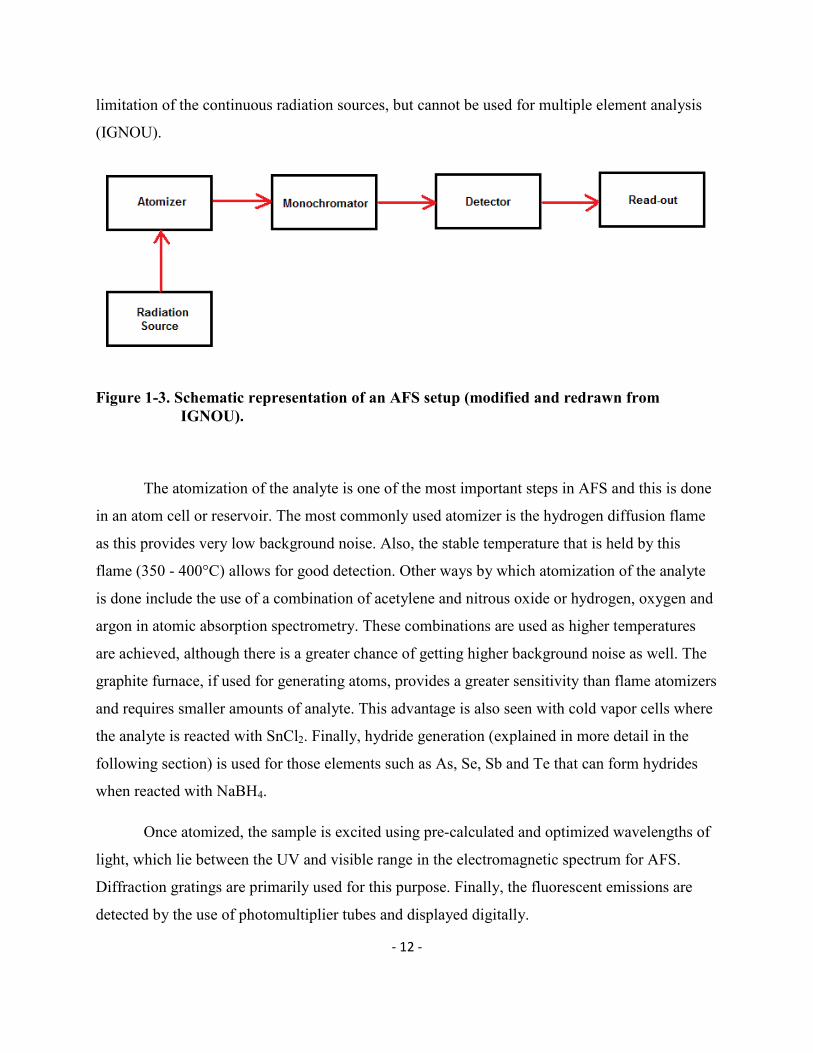
1.2.3. Instrumentation
The components of an AFS setup are a source of radiation, an atomic reservoir where
analytes are atomized, a monochromator to select the appropriate wavelength, a detector and a
readout system (Figure 1-3).
The radiation source can be continuous like a tungsten halide lamp, which has the benefit
of allowing for multi-element analysis but lacks high radiant density for sensitive detection. The
use of hollow cathode lamps provides single line radiation and hence overcome the sensitivity
- 12 -
limitation of the continuous radiation sources, but cannot be used for multiple element analysis
(IGNOU).
Figure 1-3. Schematic representation of an AFS setup (modified and redrawn from IGNOU).
The atomization of the analyte is one of the most important steps in AFS and this is done
in an atom cell or reservoir. The most commonly used atomizer is the hydrogen diffusion flame
as this provides very low background noise. Also, the stable temperature that is held by this
flame (350 - 400°C) allows for good detection. Other ways by which atomization of the analyte
is done include the use of a combination of acetylene and nitrous oxide or hydrogen, oxygen and
argon in atomic absorption spectrometry. These combinations are used as higher temperatures
are achieved, although there is a greater chance of getting higher background noise as well. The
graphite furnace, if used for generating atoms, provides a greater sensitivity than flame atomizers
and requires smaller amounts of analyte. This advantage is also seen with cold vapor cells where
the analyte is reacted with SnCl2. Finally, hydride generation (explained in more detail in the
following section) is used for those elements such as As, Se, Sb and Te that can form hydrides
when reacted with NaBH4.
Once atomized, the sample is excited using pre-calculated and optimized wavelengths of
light, which lie between the UV and visible range in the electromagnetic spectrum for AFS.
Diffraction gratings are primarily used for this purpose. Finally, the fluorescent emissions are
detected by the use of photomultiplier tubes and displayed digitally.

- 13 -
There are merits and demerits to the use of AFS. The main advantage is that this
technique offers minimum background effects, very good sensitivities for the detection of
metalloids and can be used with solid, liquid and gaseous analytes. But, sample preparation is
often time consuming and techniques like chromatography need to be used in combination with
AFS to perform speciation analysis for elements like Te. Also, matrix effects and chemical
interference can occur that can cause limitations to the sensitivity of the protocol (IGNOU).
1.2.4. Hydride Generation
Hydride generation is one of the routinely used techniques for the derivatization of
analytes before subjecting them to atomic or fluorescence spectroscopy. In a simplified reaction
for Te(IV), the oxidation state needed to form the hydride:
4 H2TeO3 + 3 BH4- + 3 H+ � 4 H2Te + 3 H3BO3 + 4 H2O
It can be used for elements such as arsenic, antimony, selenium, tellurium and others that
are capable of forming hydrides. These hydrides are generated by exposing the analyte to a
strong reducing agent. Zinc/hydrochloric acid mediated reduction, though initially used, is not
preferred because this process needs an extra collection reservoir as part of the spectroscopic
setup and is time-consuming. A more powerful reducing agent, sodium borohydrate is now
commonly used as it eliminates all the above limitations. This reagent can be used to generate
the hydrides of antimony, arsenic, bismuth, germanium, lead, selenium, tellurium and tin (Ebdon
et al., 1998; D’Ulivo et al., 2011).
Hydride generation is a sensitive method of atomization, although it has several
limitations. The first is called liquid phase interference. This happens when other elements such
as copper, gold, nickel and cobalt present in the acid leachate liquid analyte also get reduced in
the presence of NaBH4 (Hall et al.,1997). This is a real concern, especially since it is known that
copper and gold ores are good sources of Te. There are two methods by which this limitation can
be reduced. The first involves complexing these elements with substances such as EDTA,
tartarate and citrate, which is extremely time consuming and impractical. The second method to

- 14 -
reduce liquid phase interference is much simpler and requires the co-precipitation of the analyte
with metal oxides like La(OH)3 (Hall et al., 1997; Pedro et al., 2008; D’Ulivo et al., 2000)
Another limitation to the process of hydride generation is the gas phase interference that
can occur when diatomic species are formed from two different elements in the analyte. This
interference can either reduce the number of free atoms of the element of interest available for
detection or can make them decay or degrade. Either way, this interference can lead to false
negative values during detection. This limitation can be removed by increasing the temperature
used for the atomization process (Hall et al., 1998).
1.3 Objectives of the research
The main objective of this thesis was to develop analytical protocols based on the
technique of Hydride Generation coupled to Atomic Fluorescence Spectroscopy to measure with
accuracy and precision the concentration of tellurium in various types of environmental samples.
Solids such as lake sediments and mine tailings will be digested and measured and lakewater
samples will be analyzed to measure the concentration of Te(IV) and Te(VI) or spiked with those
two chemical species to determine the feasibility of the HG-AFS technique to measure both in
natural waters.
- 15 -
Chapter 2
2. Methodology
In this chapter, all aspects related to experimental processes are described.
2.1. Reagents and preparation of solution
Chemical reagents used in this study are listed below and different solutions were
prepared according to the following instructions.
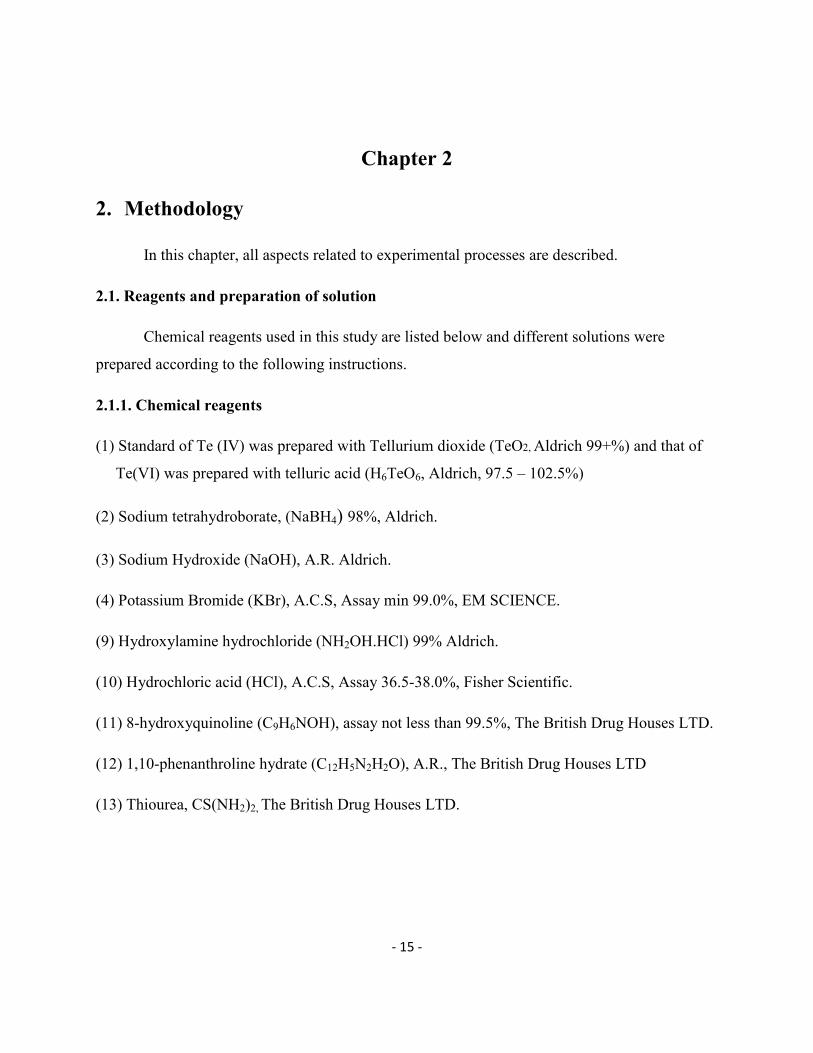
2.1.1. Chemical reagents
(1) Standard of Te (IV) was prepared with Tellurium dioxide (TeO2, Aldrich 99+%) and that of
Te(VI) was prepared with telluric acid (H6TeO6, Aldrich, 97.5 – 102.5%)
(2) Sodium tetrahydroborate, (NaBH4) 98%, Aldrich.
(3) Sodium Hydroxide (NaOH), A.R. Aldrich.
(4) Potassium Bromide (KBr), A.C.S, Assay min 99.0%, EM SCIENCE.
(9) Hydroxylamine hydrochloride (NH2OH.HCl) 99% Aldrich.
(10) Hydrochloric acid (HCl), A.C.S, Assay 36.5-38.0%, Fisher Scientific.
(11) 8-hydroxyquinoline (C9H6NOH), assay not less than 99.5%, The British Drug Houses LTD.
(12) 1,10-phenanthroline hydrate (C12H5N2H2O), A.R., The British Drug Houses LTD
(13) Thiourea, CS(NH2)2, The British Drug Houses LTD.

- 16 -
2.1.2. Preparation of solutions
(1) Standard Te(IV) stock solution at 1000 mg/L: 0.06254 g of TeO2 was dissolved in an HCl
solution, fixed to 50.00 mL to obtain a final HCl 3.0M solution and stored in a HDPE bottle
and kept in the refrigerator.
(2) Standard Te(VI) stock solution at 1000 mg/L: 0.0900 g of H6TeO6 in an HCl solution, fixed
to 50.00mLto obtain a final HCl 3.0M solution and stored in a HDPE bottle and kept in the
refrigerator.
(2) 0.7% (w/v) sodium tetrahydroborate solution in 0.1M NaOH: 7.0 g of NaBH4 powder and 4.0
g of NaOH were dissolved in 1000 mL of distilled water. The solution was stable for at least
1 week at 4 oC.
(3) Concentrated hydrochloric acid was used to prepare a 3.0M HCl solution. Concentrated nitric
acid and hydrofluoric acid were also used in this study to digest solid samples.
(4) For the interference study, all standard solutions (Ni, Cu, Mo, Mn, Cr(VI), Cr(III), Zn, Pb,
and Fe) were prepared from their corresponding 10000 mg/L standards in 5% (v/v) HCl
solutions.
2.2 Apparatus
2.2.1 Microwave digestion system
A Milestone Ethos 1600 URM, HPR 1000/10 (Bergamo, Italy) microwave digestion
system was used for digestion and pre-reduction tests on Te(VI)
2.2.2. Hydride Generation - Atomic Fluorescence Spectrometer (HG-AFS)
A PSA 10.055 Millennium Excalibur equipped with a continuous flow hydride
generation system and a boosted discharge hollow cathode lamp as the radiation source of atomic
fluorescence detector was used to determine the concentration of Te(IV) in sample solution.
Instrumental working conditions are given in Table 2-1.

- 17 -
The simplified work principle of this instrument can be presented as follows:
NaBH4 + 3 H2O + HCl H3BO3 + NaCl + 8 H* Te(IV) H2Te + H2 (excess)
where E is the analyte with oxidation state m, which may or may not be equal to n.
The hydride and excess hydrogen are swept out of the generation vessel using a stream of
argon into a chemically-generated hydrogen diffusion flame. The hydrides are atomized and the
resulting atoms are detected by atomic fluorescence spectroscopy. The concept of nascent
hydrogen gas is not accepted by all researchers and it has been suggested the transfer of
hydrogen from the borohydride to the analyte is a concerted step-by-step reaction (D’Ulivo et al.
2011).
Table 2-1 Instrument working conditions for HG-AFS.
Sample flow rate (mL/min) 7.5
NaBH4 flow rate (mL/min) 4.5
Carrier solution (mol/L HCl) 3.0
Argon inner pressure (psi) 30
Argon flow rate (mL/min) 250
Carrier gas (Ar) (mL/min) 300
Dryer gas (Ar) (mL/min) 2.5
Hydrogen flow rate (mL/min) 120
Lamp current (mA) 15
Delay time (s) 13
Analysis time (s) 20
Memory time (s) 28
Signal type Peak height

- 18 -
2.3. Optimal instrumental conditions
The best signal that can be obtained using a hallow cathode lamp to measure Te(IV) was
tested by changing the primary and boost power of the lamp. The Te(IV) stock solution
concentration was 1000 mg/L in 5% (v/v) HCl. From the 1000 mg/L Te(IV) solution, a 60 µg/L
working solution was prepared in 3.0M HCl through successive dilutions.
2.3.1 Effect of hydrochloric acid concentration (HCl) on Te(IV) signal
Tellurium was analyzed under different concentration of HCl to determine the acidity that
can provide the best signal using HG-AFS. Three different concentrations of Te of 20, 40 and 60
µg/L were tested in 2.0, 2.5, 3.0, 3.5 and 4.0M HCl, respectively.
2.3.2 Detection limit
To determine the detection limit for Te(IV) using HG-AFS it is very important to avoid
excessive dilution in future experiments. Therefore, aliquots of 25.00 mL of different
concentrations of Te(IV) from 50 to 200 ng/L were prepared in 3.0M HCl solution and analyzed
using HG-AFS.
2.3.3 Tellurium linearity range
Aliquots of 25.00 mL of different concentrations of Te(IV) were prepared in 3.0M HCl
solution and analyzed using HG-AFS to test the linearity of the technique.
2.4. Pre-reduction of Te(VI) to Te(IV)
Some commonly used reducing reagents were tested at room temperature with a
maximum concentration of 0.602M for KI, 0.420M for KBr, 0.284M for ascorbic acid, 0.555M
for oxalic acid in a solution that contained 60 µg/L of Te(VI) in 3.0M HCl. These solutions were
set on the counter at room temperature (25 °C) for 24 hours before the Te concentration could be
determined.
2.4.1. Volatility of tellurium in HCl matrix subjected to a microwave pre-reduction
The test on the possible losses of Te during digestion in HCl was conducted as below.

- 19 -
An aliquot of 25.00 mL of 10 µg/L Te(IV) in 3.0M HCl was transferred into a Teflon
digestion vial and subjected to microwave treatment (20 – 110 oC in 10 min, kept at 110 oC for
10 min, vented for 20 min to reduce the pressure before being removed from the microwave
oven).
Two groups of tests were designed and each group included 5 samples. For Group One,
the sample solution in the digestion vial was transferred in time sequence into a pre-cleaned 50.0
mL polypropylene centrifuge tube without previous cooling. For Group Two, the sample
assembly together with the vials and the rotor segments were completely cooled down in an icy
water bath before the digestion vials were opened. The thoroughly cold solutions were
transferred into 50.0 mL polypropylene tubes. The Te(IV) in the sample solutions of the two
groups were determined by HG-AFS.
2.4.2 Pre-reduction using 3.0M HCl
Attempts to reduce Te(VI) to Te(IV) were performed. Two groups of tests were designed.
For group one, different concentrations of Te(IV) were prepared in 3.0M HCl in a final volume
of 25.00 mL. For group two, it was the same as for group one but with Te(VI) and the samples
were subjected to a microwave treatment.
The tests using the microwave digestion system included: from room temperature to 110 °C
in 10 minutes; kept at 110 °C for 15 minutes and cooling for 20 min before placing the samples
in an ice bath for one hour.
2.4.3 KBr as reducing agent at 100 oC under microwave conditions
In this study, KBr was used to reduce Te(VI) to Te(IV). One series was prepared using
0.17M KBr in 3.0M HCl with different concentrations of Te(VI) added into each sample; the
final volume was 25.00 mL. The sample was treated in the microwave digestion system from
room temperature to 100 °C in 10 min, kept at 100 °C for 15 min and allowed to cool for 20 min
before being put in an ice bath for one hour before the digests were transferred. The Te(IV)
signals were measured by HG-AFS and compared with a standard calibration curve produced by
Te(IV).
- 20 -
2.4.4 Pre-reduction under different concentrations of HCl and higher temperatures.
Another approach was taken to pre-reduce Te(VI) to Te(IV). This new method was based
on trying different molarities of HCl under higher temperatures using the microwave treatment.
The Tellurium(VI) concentration in this experiment was constant at 10.0 µg/L and
concentrations of HCl of 2.0, 2.5, 3.0, 3.5 and 4.0M were prepared from concentrated HCl; the
microwave program was from room temperature to 110 °C for 10 min, kept at 110 °C for 15 min
and allowed the digest to cool down under vent condition for 20 min. The digest assembly was
cooled down in an ice bath before the solution was transferred. Signals were recorded and
recoveries calculated.
2.5 Interference of metal ions on Te(IV) determination and masking agent selection
The Tellurium (IV) interference study was done with some common elements
encountered in the earth crust, namely Cr (VI), Cu(II), Fe(II), Mn(II), Ni(II), Pb(II), Zn(II) and
Mo(VI) at different concentrations but using a constant 10.0 µg/L solution of Te (IV) in 3.0M
HCl. A blank solution of mixed metal ions in 3.0M HCl was always carried as a control. The
prepared solutions were measured using HG-AFS. All the elements were prepared from 10 000
mg/L stock solutions and then diluted to the desired concentration levels.
2.5.1 Selection of a masking agent
Several masking agents were tested and series of experiments were performed. In all
experiments, the concentration of Te(IV) kept constant at 10 µg/L. A larger volume of solution
containing the given concentration of masking agent was prepared in 3.0M HCl. An aliquot of
6.25mL of such a solution was transferred into a 25.00 mL volumetric flask, then small
quantities of the Te(IV) standard solution and interfering metal solution were spiked in the
solution and fixed with the solution to 25.00 mL with the masking agent solution. The
concentration of Te(IV) used in the text was constantly kept at 10 µg/L.
2.6 Determination of total Te in Sudbury lake waters
Two water samples of 2.5 L were collected in May 2013 from Kelly Lake and Ramsey
Lake in Sudbury. Samples were filtered through a 0.45 µM Millipore membrane. For direct

- 21 -
measurement, 6.25 mL of 12M HCl was added into a 25.00 mL volumetric flask and the rest of
the volume was the filtered lake water sample. The matrix of the sample was then 3.0M HCl and
the dilution factor of the sample was 1.33. In another series, an aliquot of 6.25 mL HCl (12M)
was added into a 25.00 mL volumetric flask, known amounts of Te(IV) or Te(VI) were spiked
and the volume was fixed to 25.00 mL with the filtered lake water. The sample matrix was 3.0M
HCl and dilution factor was 1.33. To determine the possible concentration of Te(VI), the samples
were pre-reduced in the microwave oven.
2.7 Digestion method for mine tailings, lake sediments and certified reference materials
2.7.1. Comparison of two methods for total Te measurement in tailings and sediments
To determine the concentration of total Te in solid samples, different digestion methods
were tested on tailings, lake sediments and certified reference materials. Tailing samples were
collected from the Vale tailing site in 2011. They were dried slowly at room temperature and
ground with a ring pulverizer to pass through a 20-mesh (0.84 mm) sieve. Sediments included
freeze-dried compound samples from two Sudbury area lakes, McFarlane and Clearwater and 5
other from lakes of the Cobalt area in Ontario.
Hot plate digestion. Three tailing samples were used with this method for which 7.3 mL of 15M
HNO3, 1.85 mL of 12M HCl and 1.0 mL of 27.4M HF were added into a Teflon digestion beaker
containing 0.5000 g of tailings. Samples were placed into the oven at 80-100 °C for one hour,
then in the sand bath at 110-130 °C for three hours with manual stirring from time to time. After
the samples were cooled down to room temperature, 1.5 g of H3BO3 was added and all samples
were stirred for 30 min. Samples were fixed to 25.00 mL with DDW, than diluted 100 times with
3.0M HCl. The samples were analyzed for Te determination using HG-AFS.
Microwave digestion.
(1) Digestion temperature: 0.5000 g of tailing samples were precisely weighed and transferred
into a Teflon digestion vial with 10.0 mL of aqua regia (2.5 mL of 15.0M HNO3 + 7.5 mL of
12.0M HCl). The samples were treated in the microwave digestion system from room
temperature to 85 °C in 5 min, from 85 °C to different test points starting from 120 to 220 oC in
7 min, left at the test point temperature for 20 min and then let to cool down for 20 min before

- 22 -
being placed in an icy bath. When samples reached room temperature, they were diluted 10 times
then added the appropriate amount of thiourea to have a concentration of 0.25% (w/v) in the final
solution. The digest was fixed to 25.00 mL. The sample was then diluted 100 times with 3.0M
HCl. The samples were analyzed for total Te using HG-AFS.
(2) Proportions of digestion reagents: To determine the best digestion conditions,
approximately 0.5000 g of tailing sample was weighed precisely and added to different volumes
of concentrated acids and were transferred to Teflon digestion vial (Table 2-2). After the
microwave digestion was done and the sample cooled, boric acid was added to neutralize HF.
The samples were fixed to 25.00 mL with DDW. After an appropriate dilution with 3.0M HCl,
the sample was analyzed using HG-AFS. Standard additions of Te(IV) to the digestion matrix
were performed to validate the method and also investigate whether there was any interference
caused by the digestion matrix.
Table 2-2 Digestion reagents
Digestion ID Sample
weight/g Mass of
boric acid/g 27M HF
/mL 15M HNO3
/mL 12M HCl
/mL
D#1 0.5004 1.500 2.0 7.3 1.9
D#2 0.5002 0.750 1.0 2.0 5.0
D#3 0.5007 0.400 0.5 5.0 2.5
D#4 0.5010 0.400 0.5 3.0 5.0
The microwave digestion system that was used to the following experiments is: from room
temperature to 85 °C in 5 min, from 85 °C to 220 oC in 7 min, left at 180 °C for 20 min and then
let it vent for 20 min to reduce the pressure.
2.8. Test of Te (VI) reduction using the microwave digestion system
The objective of this experiment was to test if Te(VI) could be reduced using the D#1
digestion system (2.0 mL HF, 7.3 mL HNO3, 1.9 mL HCl). Two groups of samples were
prepared. Group one contained 100 µg/L Te (IV) and D#1 reagents; and Group two containing
100 µg/L Te(VI) and D#1 reagents. Both samples were subjected to the microwave treatment
- 23 -
and 1.5g of boric acid was added and the solution was stirred for 30min. The sample were
transferred into a pre-cleaned 50.0 mL polypropylene centrifuge tube after having been
thoroughly cooled in an icy bath and fixed to 25.00 mL with DDW. The sample were diluted 100
times with 3.0M HCl and analyzed for Te using HG-AFS.
2.9 Digestion of certified reference material (CRM)
For method validation, the certified reference material GBW07312 with a total Te
concentration of 0.30 ± 0.07 µg/g was analyzed. It is an aquatic sedimentary sample, produced
by the Chinese National Standard Material Bureau. Due to the rareness of certified materials for
Te, the method development work was also conducted with other type of samples. A mass of
0.5000 g of the (CRM) was precisely weighed and transferred into a Teflon digestion vial, the
D#1 reagents were added to the weighed samples and then the digestion vials were closed tightly
and placed into the microwave digestion system. When digestion was done the digestion
assembly were put in an icy bath for one hour, then 1.5g of boric acid was added to the samples
in the vials, and solution were stirred for 30 min. Finally the sample solution in digestion vials
was transferred into a pre-cleaned 50.0 mL polypropylene centrifuge tube and fixed to 50.0mL
with DDW. The samples were diluted 40 times with 3.0M HCl and total Te was analyzed using
HG-AFS.
2.10. Digestion method for environmental samples
Several environmental samples were used in this study. Tailing samples were collected
from the Vale tailing site on September 27, 2011. Except for sample Tail. #ISP, a deeply
oxidized surface tailing sample (sulfur 2.8%), other samples were considered original tailing
samples containing a high concentration of sulfur (30 – 36%). Two sediment samples from
Clearwater Lake and McFarlane Lake (collected in 2006 and kept at -80 °C) were analyzed. The
third group of samples was collected from Cobalt Lake and Crosswise Lake in the Cobalt area,
Ontario. There was no sulfide in these sediment samples; instead they contain significant
amounts of carbonates and high arsenic levels. Although they were all inorganic samples, their
major chemical composition were quite different. Those sediments and tailings were digested
following the established procedure D#1 and sample weight was always approximately 0.5000 g.

- 24 -
Chapter 3
3. Results and Discussion
In this Chapter, the experimental results are presented along with the corresponding
discussions.
3.1 Optimal instrumentation and measurement conditions
3.1.1 Lamp current (mA)
Any hollow cathode lamp or boosted hollow cathode lamp used in atomic adsorption and
atomic fluorescence emission has a certain lifetime. The selection of its optimal operating
condition does not only affect its lifetime but also the sensitivity of the analysis.
Table 3-1 shows the best signal that could be obtain from the lamp to detect Te (IV)
using HG-AFS. The best signal obtained was at a primary power of 15 mA and a boost of 15.7
mA. These setting have been used to perform all the experimental work presented in this thesis.
Table 3-1 Study on optimal lamp current for a Te solution of 60 µg/L.
Primary (mA)
10.0 11.1 12.2 13.3 14.4 15.0 15.0 15.0
Boost (mA)
10.8 12.0 13.1 14.3 15.5 15.7 16.2 17.5
Te (IV) Peak Height
10.0 14.4 24.1 32.4 46.0 71.2 69.3 55.8
3.1.2 Effect of hydrochloric acid concentration on the analytical signal
Different concentrations of HCl were used to determine the best conditions of acidity to
react with the borohydride solution and analyze Te element using HG-AFS. As illustrated in
Figure 3-1, a 3.0M concentration of HCl was determined as the best acidity for Te determination
using HG-AFS.

- 25 -
Figure 3-1. Effect of HCl molarity on 20, 40 and 60 µg/L Te (IV) solution signal
(15 mA primary, 15.7 mA boost of the lamp)
3.1.3 Detection limit of Tellurium by PSA 10.055 Millennium Excalibur
Figure 3-2 shows the lowest value of Te(IV) that could be detected using HG-AFS. As
indicated by the figure, the signal produced by a 50 ng/L solution is very close to the background
noise produced by the blank solution. Considering also the instrumental variations, the detection
limit of Te by this instrument was therefore estimated at around 150 ng/L or three times the
value of the lowest signal close to blank. Although in their earlier advertisement, PSA claimed a
detection limit of 10 ng/L for Te, our results show that detection limit for quantification should
be much higher than the claimed value.
0
20
40
60
80
100
120
140
1 1.5 2 2.5 3 3.5 4 4.5 5
Pe
ak
He
igh
t
HCl/M
20µg/L
40µg/L
60µg/L
- 26 -
Figure 3-2. Detection limit of Te(IV) by PSA10.055 Millennium Excalibur.
3.1.4 Study on the linearity range of tellurium by HG-AFS
The linearity of the determination of Te(IV) by HG-AFS in a 3.0M HCl solution was
investigated. As indicated by Figure 3-3, the AFS signal remains linear up to 100 µg/L after
which it tends to become curved. All solutions exceeding the concentration of 100 µg/L must
then be diluted to remain in the linear portion of the calibration.
Figure 3-3 Linearity of calibration of Te(IV) in 3.0M HCl as measured by HG-AFS
0
100
200
300
400
500
600
700
0 100 200 300 400 500 600 700 800 900 1000 1100
Pe
ak
He
igh
t
Te(IV) /µg/L
R² = 0.9773
0
10
20
30
40
50
60
0 50 100 150 200 250
Pk
Ht
Te(IV) /ng/L
- 27 -
3.2 Pre-reduction of Te(VI) to Te(IV)
As it has been mentioned in the Introduction, Te(VI) cannot form H2Te without previously
being converted to Te(IV). To be able to determine Te in other valences, a conversion to Te(IV)
is therefore needed. In most geological and biological samples, sample digestion with strong
acids under high temperatures is needed, which would be very likely to bring Te to its higher
valence of 6, therefore a pre-reduction of Te(VI) to Te(IV) is essential.
Some commonly used reducing reagents were tested at room temperature with a maximum
concentration of 0.602M for KI, 0.420M for KBr, 0.284M for ascorbic acid and 0.555M for
oxalic acid in a solution that contained 60 µg/L of Te(VI) and 3.0M HCl. These solutions were
set on the counter for 24 h and the Te concentration was determined. It was found that Te(VI)
was not efficiently converted to Te(IV) in all chemical systems above-mentioned.
Also, in 3.0M HCl with the microwave treatment at a temperature of 110 oC did not
reduce Te(VI) to Te(IV) and it was suspected that temperature could be not high enough. Prior to
testing higher temperatures, the possible volatility of Te compounds was investigated.
3.2.1 Study on the volatility of tellurium in HCl matrix under microwave conditions
Under a high temperature, several metals and metalloids such as lead, selenium and zinc
tend to form volatile compound when chloride ions are present in solution. Since a relatively
high concentration of HCl 3.0M and high temperature (110oC) were used in pre-reduction tests
with the microwave oven, it was necessary to evaluate the potential loss of Te during the sample
digestion and manipulation.
The results from the Group One test (see details in section 2.4.1) showed a gradual
increase in recovery, from 83 to 104 % (Figure 3-4a), whereas results from the Group Two test
demonstrated a constant recovery of nearly 100% (Figure 3-4 b). Because in the Group One test,
the solution in each digestion vial was not previously cooled down before transfer, the
temperature in the solution was still relatively high when the first vial was opened and a
noticeable amount of Te was lost, probably in the gaseous form of TeCl2. The temperature of the
solution in the second and other vials become lower and the loss of volatile Te became lower,
consequently improving the recovery of Te(IV) in solution (Figure 3-4a). Since the solutions in

- 28 -
the Group Two test were previously cooled down before transfer, the loss of Te(IV) was
insignificant.
Considering the formation of volatile Te and its potential loss under high HCl and
temperature conditions, it is necessary to transfer a digested solution when it was thoroughly
cooled down. The cooling of digestion segments was therefore practiced in all our microwave
digestion treatments.
Figure 3-4 (A) Tested solutions containing 10 µg/L Te(IV) in presence of 3.0M HCl.
The solutions in Group One Test were transferred before they were thoroughly cooled down.
0
20
40
60
80
100
120
#1 #2 #3 #4 #5
Re
cov
ery
%
replicate # in time sequence

- 29 -
Figure 3-4 (B) Tested solutions containing 10 µg/L Te(IV) in presence of 3.0M HCl.
The solutions in Group Two Test were transferred after they were completely cooled.
3.2.2 KBr as reducing agent
The utilization of the 3.0M HCl solution at 110 °C was inefficient to reduce Te(VI) to
Te(IV). Therefore, KBr was tested as reducing agent. As shown in Figure 3-5, a 0.17M KBr
solution proved to be a good reducing agent with almost 100% reduction of Te (VI); the figure
also shows that KBr does not interfere with the Te(IV) signal because the two linear correlations
using Te(VI) or Te(IV) are almost identical.
Most of the experiments in this section were done with a 10 µg/L or less Te(IV) solution,
to determine the right amount of KBr needed to reduce 10 µg/L of Te(VI). Several
concentrations of KBr were prepared. As indicated in Figure 3-6, the recovery of Te(VI)
increased up to a concentration of 0.17M in the solution with a 98% recovery. The addition of
more KBr did not affect the reduction because almost all Te(VI) had already been transformed to
Te(IV). However, it was necessary to test another reducing agent because the digestion of
tailings and sediments in presence of aqua regia lead to the formation of bromine in solution and
to the creation of a major interference in the analytical process as it expressed in the reaction
0
20
40
60
80
100
120
#1 #2 #3 #4 #5
Re
cov
ery
%
replicate number

- 30 -
below:
4H+ + 2 NO3- + 2 Br- 2 NO2 (g) + Br2 + 2H2O
Figure 3-5 Pre-reduction of Te(VI) in presence of 0.17M KBr under microwave treatment
at 110 oC and comparison with a standard Te(IV) calibration curve.
Figure 3-6 Concentration effect of KBr on the reduction of a 10µg/L Te(VI) solution.
0
10
20
30
40
50
60
0 2 4 6 8 10 12
Pk
Ht
Te /µg/L
Te(VI) µg/L
Te(IV) µg/L
0
20
40
60
80
100
120
0 0.05 0.1 0.15 0.2 0.25 0.3 0.35
Re
cov
ery
%
KBr /M
- 31 -
3.2.3 Pre-reduction using different concentrations of HCl
To replace KBr, it was then decided to test higher concentrations of HCl as a reducing
agent. Table 3-2 shows that at 110 oC in the microwave treatment, using 3.0M HCl could only
lead to a 22% recovery of Te(VI); the recovery increased to 71% with 4.0M HCl, and Te(VI)
was successfully completely reduced and recovered as Te(IV) in 5.0M HCl
Table 3-2 Effect of HCl concentration on Te(VI) pre-reduction.
HCl conc. (M) Added Te(VI) /µg/L Measured Te(VI) /µg/L Recovery %
3.0 10.00 2.25 22.5
4.0 10.00 7.19 71.9
5.0 10.00 10.81 108.2
Hence 5.0M HCl and 110 oC microwave treatment were the adopted conditions to reduce
Te(VI) into Te(IV) in future determinations.
3.3 Interference from metal ions on the Te(IV) signal
Tellurium is one of the rarest elements of the Earth’s crust and because most natural
environmental samples are very complex, it is necessary to test for possible interfering elements
when measuring Te using HG-AFS. A series of tests was designed to study the effect of other
elements present in solution on the determination of Te(IV). Figure 3-7 indicates that Ni (II), Pb
(II), Fe(III), Co (II) and Cr (VI) do not cause serious interference with Te determination at
concentrations lower than 1000 µg/L in solution. A 100% Te (IV) signal could be obtained with
up to 10 mg/L Pb (II) and 1.0 mg/L with the other three elements. Figure 3-8 reveals that Zn (II),
Cr(III) and Mo(VI) caused no interference in the determination of Te (IV) but Mn (II) slightly
interfered. Finally, it was noticed in Figure 3-9 that Cu (II) could severely reduce the signal of
Te (IV) with a visible interference starting at as low as 10 µg/L. This may be due the formation
of a copper telluride complex (Bye et al, 1984).

- 32 -
Figure 3-7. Study of Ni(II), Co(II), Cr(VI), Fe(III) and Pb(II) interference on
a 10 µg/L Te(IV) solution in 3.0M HCl.
Figure 3-8. Study of Zn(II), Cr (III), Mo(VI) and Mn(II) interference on a 10 µg/L Te (IV) solution in 3.0M HCl.
0
20
40
60
80
100
120
0 1 2 3 4 5 6
Re
cov
ery
%
Log of ions concentration /µg/L
Ni
Co
Cr
Pb
Fe(III)
0
20
40
60
80
100
120
0 1 2 3 4 5 6 7
Re
cov
ery
%
Log of ions concentration /µg/L
Zn
Cr(III)
Mo(VI)
Mn(II)
- 33 -
Figure 3-9. Study of Cu(II) interference on a 10 µg/L Te (IV) solution in 3.0M HCl.
3.4 Selection of masking agents
From the results of the tests described above, it was found that the majority of other
elements do not cause significant interference to Te(IV) measurement until they reach high
concentrations or do not cause any interference at all. Only Cu(II) was proved to cause severe
negative interference at a concentration as low as a few µg/L. Thus, the effort was made to find a
masking agent that could eliminate that interference. Diluted solutions of thiourea, L-cysteine, L-
ascorbic acid and 1,10-phenanthroline were tested on a 10µg/L Te(IV) solution. The results
presented in Table 3.3 clearly indicate that the 0.25% (w/v) thiourea solution could completely
control the interference due to the presence of 5 mg/L of Cu(II) in a 3.0M HCl solution.
0
20
40
60
80
100
120
0 1 2 3 4 5 6
Re
cov
ery
%
Log of ions concentration /µg/L
- 34 -
Table 3-3 Studies of the effectiveness of masking regents on the interference of 5mg/L Cu2+ in the determination of a 10 µg/L Te(IV) solution.
Sample ID 8-hydroxy-quinoline 1.0% (w/v)
Thiourea 0.25% (w/v)
L-Cysteine 2.0% (w/v)
L-Ascorbic Acid 2.0% /(w/v)
1,10-Phenan-throline 1.0% (w/v)
Measured Te(IV) µg/L 1.5 10.4 1.8 2.8 3.1 Recovery of Te % 15 104 18 27 31
The masking capacity of 1.0% (w/v) solutions of 1,10-phenanthroline and 8-
hydroxyquinoline with different concentrations of Cu2+ was studied. In the study, the
concentration of Te(IV) was kept constant at 10 µg/L. The study showed that although neither of
these two masking agents was very effective, 1,10-phenanthroline was better than 8-
hydroxyquinoline at low Cu2+ concentration. Their masking capacity dropped drastically when
Cu2+ was higher than 100µg/L (Figure 3-10).
The 0.25% (w/v) thiourea solution was also tested in detail (Figure 3-11) and the recovery
of Te was still at ~83% when the Cu(II) concentration had reached 30.0 mg/L. This is still a good
recovery considering that Te concentration is usually very low in most environmental samples.
Different concentrations of thiourea were tested to confirm if the Te recovery could be improved
when adding more thiourea in the solution but the 0.25% (w/v) ended up being the best choice.
- 35 -
Figure 3-10. Effectiveness of masking agent 1.0 %(w/v) 1,10-phenanthroline and 1.0 %
(w/v) 8-hydroxyquinoleine in 3.0M HCl solution on the determination of 10
µg/L Te(IV).
Figure 3-11 Effectiveness of masking agent 0.25%(w/v) thiourea in 3.0M HCl solution on
the determination of 10 µg/L Te(IV).
0
20
40
60
80
100
120
0 50 100 150 200 250 300 350 400 450 500 550
Re
ocv
ery
%
Cu /µg/L
1.0% 8-Hydroxy
1.0% 1.10-phen
0
20
40
60
80
100
120
0 2 4 6 8 10 12 14 16 18 20 22 24 26 28 30 32
Re
cov
ery
%
Cu /mg/L

- 36 -
To further test the masking capacity of thiourea, different concentrations of mixed metal
ions of Cu(II), Cr(VI), Cr(III), Fe(III), Zn, Cr(III), Mn(II), Mo(VI) and Ni(II) were prepared with
the presence of 10 µg/L of Te(IV) and 0.25%(w/v) thiourea in each sample solution. The results
are presented on Figure 3-12; the recovery of Te(IV) was around 100% up to 10 mg/L and then it
dropped to 50% when the mixed metal ions reached 25 mg/L of each metal. The results show
that thiourea is a very effective masking agent for an analytical system that contains high level of
transition metals. The data also show that a thiourea concentration of 0.25%(w/v) should be
sufficient to be used to remove interferences for most sample analysis.
Figure 3-12. Effect of the mixture of different element ions Cu(II), Cr(VI), Cr(III), Fe(III),
Zn, Co(II), Mn(II), Mo(VI) and Ni(II) on the recovery of 10µg/L Te(IV) in
presence of 0.25%(w/v) thiourea.
3.5. Tellurium in Sudbury Lake waters
Water samples collected from Ramsey Lake (RL) and Kelly Lake (KL) were analyzed in
the presence of 0.25%(w/v) thiourea masking agent and no Te was detected in these two
samples. Therefore, water samples were spiked with known amounts of Te(IV) and Te(VI) to
confirm the method. As indicated by data presented in Table 3-4, the recovery of Te(IV) was
very good.
0
20
40
60
80
100
120
0 5 10 15 20 25 30
Re
cov
ery
%
Mix metal ions /mg/L

- 37 -
Table 3-4 Recovery of spiked Te (IV) in Kelly and Ramsey Lakes (KL and RL) water samples.
Sample ID Spiked Te(IV) /µg/L Measured Te(IV) /µg/L Recovery %
KL0 0.00 ND N/A
KL1 3.00 3.21 107
KL2 5.00 5.07 101
KL3 7.00 7.34 104
KL4 9.00 9.79 108
RL0 ND ND N/A
RL1 5.00 5.40 108
RL2 15.00 14.66 97
RL3 20.00 20.89 104
ND: not detected; N/A: not applicable
To determine Te(VI) in the two lake samples, the samples were first spiked with a Te(VI)
standard solution, then these solutions were subjected to a pre-reduction in 5.0M HCl at 120 oC
in a microwave oven as described in section 2.6. The results are given in Table 3-5.
The results showed that in both lake surface water, the concentrations of Te(IV) and
Te(VI) were below the detection limit of this instrument. However, the recovery of the spiked
Te(IV) and Te(VI) are both very satisfactory.

- 38 -
Table 3-5 Recovery of spiked Te (VI) in Kelly and Ramsey Lakes ( KL and RL) water samples after pre-reduction.
Sample ID Spiked Te(VI) /µg/L Measured Te(VI) /µg/L Recovery %
K L0 0.00 ND N/A
KL1 3.00 3.15 105
KL2 5.00 4.72 94
KL3 9.00 9.28 103
RL0 0.00 ND N/A
RL1 3.00 3.16 105
RL2 5.00 4.84 96
RL3 9.00 8.50 94
ND: not detected; N/A: not applicable
3.6. Digestion method for tailings and sediments.
3.6.1. Hot plate digestion method: Three tailing samples were digested using the hot plate
digestion process described in section 2.7. Data in Table 3-6 show that tailing number 1
contained more Te than the other tailing samples. Also that sample did not get digested
completely and it was possible to observe some small solid particles at the bottom of the
digestion tubes; this could be some resistant alumino-silicates in the sample and it would affect
the recovery of Te.
Table 3-6 Digestion of tailing samples using the hot plate method.
Sample ID Measured Te /µg/g
Tail#1 10.41
Tail#3 5.29
Tail#5 2.75

- 39 -
3.6.2. Microwave digestion system: Digestion temperature: one of the important factors that
can help to digest solid samples is the temperature. Therefore, it is important to know the
optimum conditions to design the microwave digestion system steps. It can be observed clearly
from Figure 3-13 that the extraction of Te from the tailing samples gradually got higher up to a
temperature of 180 oC, then started to drop. This is possibly caused by the loss of Te in volatile
forms by leakage during the digestion step at temperatures higher than 180 oC. Therefore, 180 oC
was chosen as optimal temperature for sample digestion. A summary of the temperature program
used in the microwave digestion program in presented in Figure 3-14.
Figure 3-13 Digestion of tailings under different temperatures using the microwave system.
The final solution concentration was 3.0M HCl.
0
0.5
1
1.5
2
2.5
3
3.5
4
60 80 100 120 140 160 180 200 220
Te
/µ
g/g
Temperture /oC
Tailing No 1
Tailing No 3
Tailing No 5

- 40 -
Figure 3-14 Summary of the microwave digestion program in 3.0M HCl.
3.6.3. Digestion Regents: Four different combinations of reagents were used to digest tailing
sample#3 as described in Table 3-7 below. The goal was to find the best digestion system for the
solid environmental samples.
Table 3-7 Tested digestion reagents for tailing sample.
Digestion ID Sample
weight /g 27M HF
/mL 15M HNO3
/mL 12M HCl
/mL Boric acid /g
D#1 0.5003 2.0 7.3 1.9 0.7500
D#2 0.5005 1.0 2.0 5.0 0.7500
D#3 0.5007 0.5 5.0 2.5 0.4000
D#4 0.5001 0.5 3.0 5.0 0.4000
Table 3-8 shows that the D#1 digestion system produced the highest total Te value. The
efficiency maybe due to the high concentration of HF acid to digest silica in the sample and the
high concentration of nitric acid to break chemical bonds and free all Te ions from the sample.
-10
5
20
35
50
65
80
95
110
125
140
155
170
185
200
0 10 20 30 40 50 60
Te
mp
era
ture
/°C
Time /min
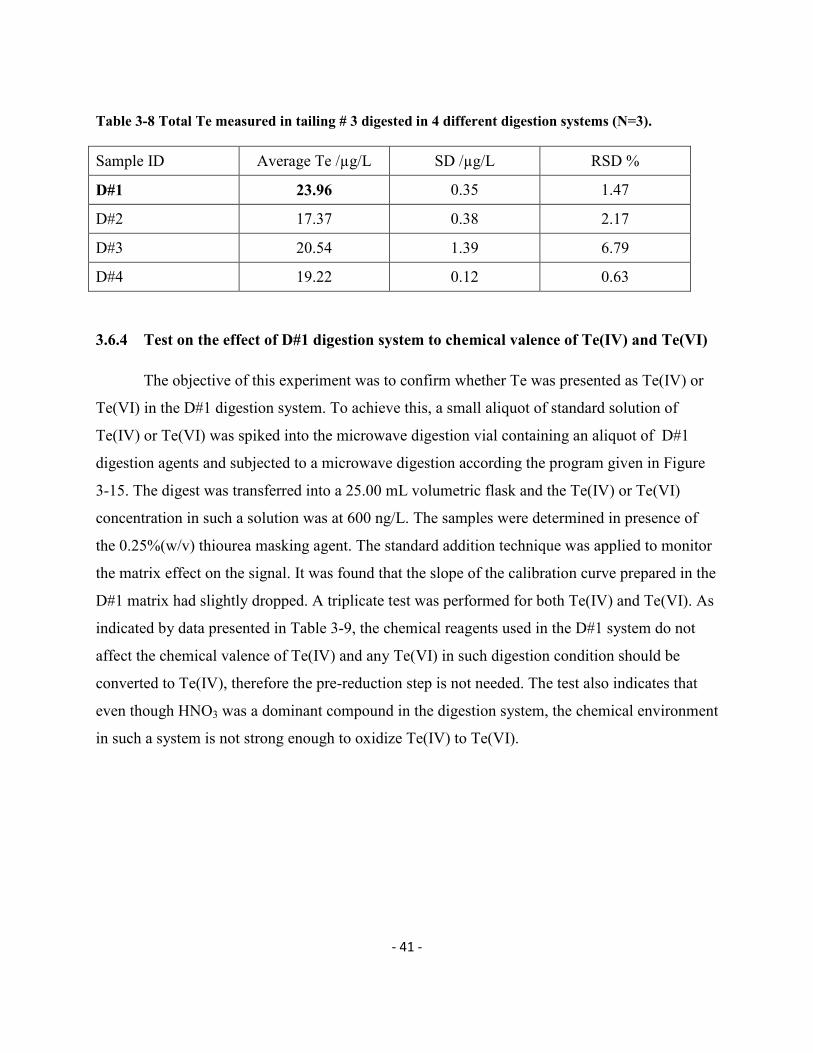
- 41 -
Table 3-8 Total Te measured in tailing # 3 digested in 4 different digestion systems (N=3).
Sample ID Average Te /µg/L SD /µg/L RSD %
D#1 23.96 0.35 1.47
D#2 17.37 0.38 2.17
D#3 20.54 1.39 6.79
D#4 19.22 0.12 0.63
3.6.4 Test on the effect of D#1 digestion system to chemical valence of Te(IV) and Te(VI)
The objective of this experiment was to confirm whether Te was presented as Te(IV) or
Te(VI) in the D#1 digestion system. To achieve this, a small aliquot of standard solution of
Te(IV) or Te(VI) was spiked into the microwave digestion vial containing an aliquot of D#1
digestion agents and subjected to a microwave digestion according the program given in Figure
3-15. The digest was transferred into a 25.00 mL volumetric flask and the Te(IV) or Te(VI)
concentration in such a solution was at 600 ng/L. The samples were determined in presence of
the 0.25%(w/v) thiourea masking agent. The standard addition technique was applied to monitor
the matrix effect on the signal. It was found that the slope of the calibration curve prepared in the
D#1 matrix had slightly dropped. A triplicate test was performed for both Te(IV) and Te(VI). As
indicated by data presented in Table 3-9, the chemical reagents used in the D#1 system do not
affect the chemical valence of Te(IV) and any Te(VI) in such digestion condition should be
converted to Te(IV), therefore the pre-reduction step is not needed. The test also indicates that
even though HNO3 was a dominant compound in the digestion system, the chemical environment
in such a system is not strong enough to oxidize Te(IV) to Te(VI).

- 42 -
Table 3-9 Recovery of spiked Te species subjected to D#1 digestion reagents and at a
microwave digestion temperature 180 oC (N=3).
Sample ID Recovery % SD /µg/L
Te(IV) 600ng/L 93.26 4.85
Te(VI) 600ng/L 91.00 1.52
3.7 Method validation with certified reference material GBW07312.
To validate the digestion and analytical method, the certified reference material
GBW07312 was digested following the same procedure and the total Te was measured. The
digestion combined reagent was D#1 (2.0 mL of 27M HF, 7.3 mL of 15M HNO3 and 1.9 mL of
12M HCl). The microwave digestion program included the following steps: from room
temperature to 85 °C in 5 min, from 85 °C to 180 oC in 7 min, left at 180 °C for 20 min and then
left cooled for 20 min to reduce the pressure. The digested samples were transferred after being
thoroughly cooled. To eliminate the matrix effect, the standard addition technique was applied.
The obtained total Te value was 0.45 ± 0.03 µg/g (N=4). The certified value for GBW07312 is
0.30 ± 0.07 µg/g.
It should be mentioned that the very low concentration of total Te in the certified
sediment sample makes difficult the accurate determination of Te. Even in presence of the
thiourea solution the possibility of spectral interference in this complex matrix cannot be totally
excluded. The relatively large gap between the measured value and the certified value can be
likely be explained by this fact.
3.8 Determination of total Te in Sediments and tailing samples.
After the method was validated, other sediments and tailing sample were tested to
measure the concentration of total Te in each sample using the established method.

- 43 -
Table 3-10 Total Te (µg/g) in tailing samples from Vale’s tailing site. The D#1 digestion system was used, with a comparison of two different volumes of HF.
Sample ID Total Te (1.0 mL HF) Total Te (2.0 mL HF)
Tailing #2 58.14 56.26
Tailing #4 29.14 33.36
Tailing #10 61.66 66.74
ISP Tailing (oxidized) 13.37 15.06
The results of Table 3-10 shows that increased a 2.0 mL volume of HF do not improve
significantly the digestion efficiency. Thus 1.0 mL of 27.0M HF should be sufficient to dissolve
all silica in the sample and it would limit the amount of boric acid required to neutralize this
acid.
Table 3-11 Total Te in sediments samples (N=3).
Sample ID Average Te /µg/g SD /µg/g RSD %
Sediments samples from Sudbury Lakes
McFarlane Lake 29.48 2.3 7.79
Clearwater Lake 24.26 2 8.10
Sediments samples from Lakes of Cobalt area
CrA14 3.21 0.72 22.47
CrA25 10.90 1.10 10.09
CrF6 10.70 1.05 9.77
CoA4 3.46 0.48 13.83
CoA6 3.57 0.47 13.13
A larger RSD was obtained when the concentration of Te was lower than 10 µg/g (Table 3-11).

- 44 -
Conclusions
The following conclusions can be drawn concerning the determination of Te in
environmental samples with the protocol that was developed in this thesis:
(1) In general, the acidity level that can give the best signal for Te when analyzing it using
HG-AFS was a 3.0M HCl solution. The detection limit using HG-AFS was approximately 150
ng/L.
(2) Tellurium is volatile at high temperatures in the presence of a large amount of HCl.
Therefore, it is important to let the sample cool down to room temperature after microwave
digestion and before transferring it. KBr could be use as a reducing agent to convert Te(VI) to
Te(IV) at 100 oC. However, it severely interferes with the Te signal when it is mixed with nitric
acid. The addition of hydroxylamine cannot eliminate this interference. It can be only used for
Te(VI) pre-reduction in the absence of high HNO3 concentrations. In addition, Te(VI) can be
reduced to Te(IV) by using a 5.0M HCl solution during the microwave digestion procedure.
(3) Several metals such as Co(II), Cr(III), Cr (VI), Fe(III), Mn(II), Mo(VI), Ni(II), Pb(II) and
Zn(II) did not create any significant interference for the determination of Te. However, when the
concentration of Cu2+ in the matrix was higher than 5 mg/L, it led to significant interference and
required the use of a making agent. Several compounds were tested and the thiourea solution
ended up being a good and effective masking agent at an optimum concentration of 0.25% (w/v)
in solution.
(4) After comparison of a variety of methods to digest lake sediments and mine tailings, it
was found that the best digestion matrix was a mixture of the concentrated acids HF (27.0M, 2
mL), HNO3 (15.0M, 7.3 mL) and HCl (12.0M, 1.9 mL) using a microwave digestion program
that consisted of the following steps: 1) room temperature to 85 oC in 5 min; 2) from 85 oC to
180 oC in 7 min; 3) stay at 180 oC for 20 min and let drop pressure for 20 min before immersion
in an ice bath for one hour.
- 45 -
(5) A certified reference material, sediment and tailing samples were successfully digested
using the established method and total Te in each sample was measured using HG-AFS.
(6) The new established method can used to determine with acceptable precision and
accuracy low concentrations of Te in several types of environmental samples including lake
water, sediments and tailings at low cost.
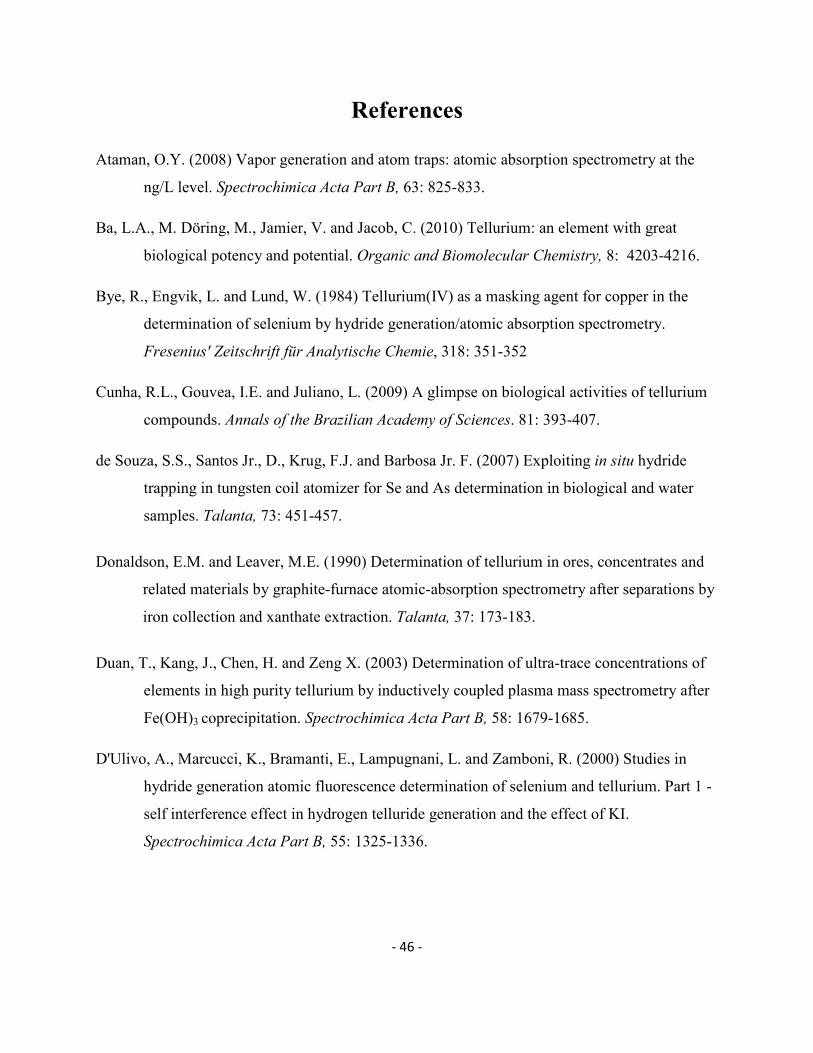
- 46 -
References
Ataman, O.Y. (2008) Vapor generation and atom traps: atomic absorption spectrometry at the
ng/L level. Spectrochimica Acta Part B, 63: 825-833.
Ba, L.A., M. Döring, M., Jamier, V. and Jacob, C. (2010) Tellurium: an element with great
biological potency and potential. Organic and Biomolecular Chemistry, 8: 4203-4216.
Bye, R., Engvik, L. and Lund, W. (1984) Tellurium(IV) as a masking agent for copper in the
determination of selenium by hydride generation/atomic absorption spectrometry.
Fresenius' Zeitschrift für Analytische Chemie, 318: 351-352
Cunha, R.L., Gouvea, I.E. and Juliano, L. (2009) A glimpse on biological activities of tellurium
compounds. Annals of the Brazilian Academy of Sciences. 81: 393-407.
de Souza, S.S., Santos Jr., D., Krug, F.J. and Barbosa Jr. F. (2007) Exploiting in situ hydride
trapping in tungsten coil atomizer for Se and As determination in biological and water
samples. Talanta, 73: 451-457.
Donaldson, E.M. and Leaver, M.E. (1990) Determination of tellurium in ores, concentrates and
related materials by graphite-furnace atomic-absorption spectrometry after separations by
iron collection and xanthate extraction. Talanta, 37: 173-183.
Duan, T., Kang, J., Chen, H. and Zeng X. (2003) Determination of ultra-trace concentrations of
elements in high purity tellurium by inductively coupled plasma mass spectrometry after
Fe(OH)3 coprecipitation. Spectrochimica Acta Part B, 58: 1679-1685.
D'Ulivo, A., Marcucci, K., Bramanti, E., Lampugnani, L. and Zamboni, R. (2000) Studies in
hydride generation atomic fluorescence determination of selenium and tellurium. Part 1 -
self interference effect in hydrogen telluride generation and the effect of KI.
Spectrochimica Acta Part B, 55: 1325-1336.
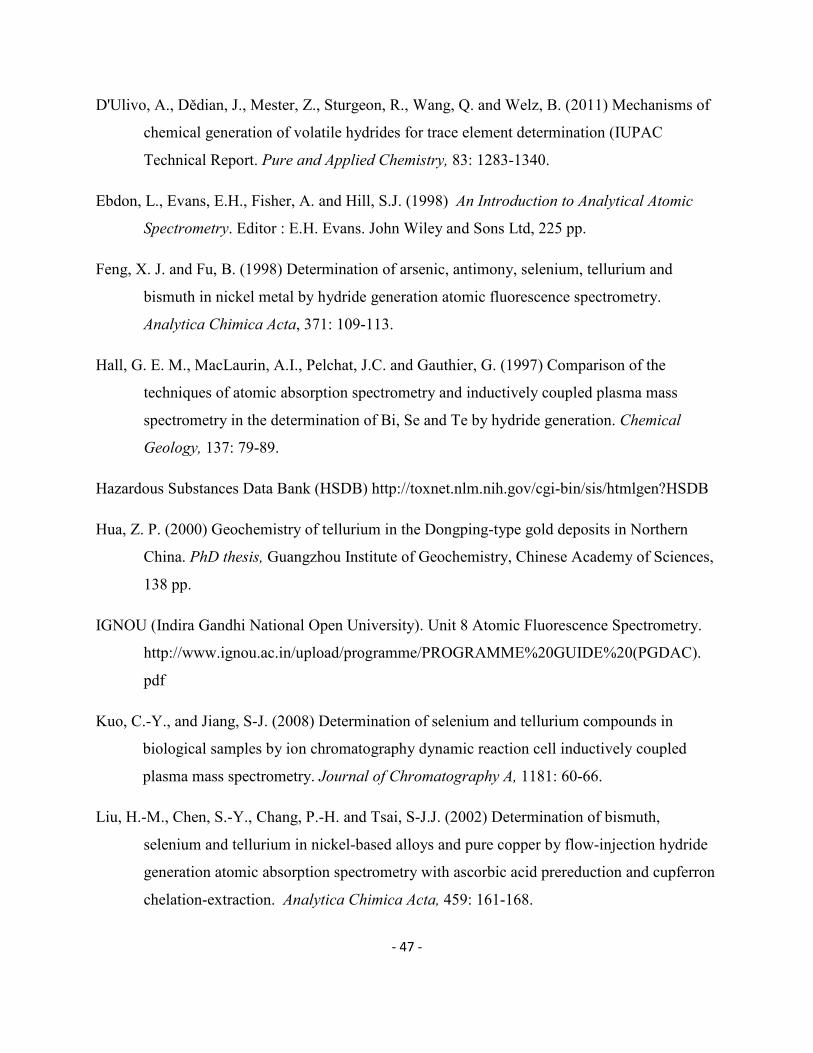
- 47 -
D'Ulivo, A., Dědian, J., Mester, Z., Sturgeon, R., Wang, Q. and Welz, B. (2011) Mechanisms of
chemical generation of volatile hydrides for trace element determination (IUPAC
Technical Report. Pure and Applied Chemistry, 83: 1283-1340.
Ebdon, L., Evans, E.H., Fisher, A. and Hill, S.J. (1998) An Introduction to Analytical Atomic
Spectrometry. Editor : E.H. Evans. John Wiley and Sons Ltd, 225 pp.
Feng, X. J. and Fu, B. (1998) Determination of arsenic, antimony, selenium, tellurium and
bismuth in nickel metal by hydride generation atomic fluorescence spectrometry.
Analytica Chimica Acta, 371: 109-113.
Hall, G. E. M., MacLaurin, A.I., Pelchat, J.C. and Gauthier, G. (1997) Comparison of the
techniques of atomic absorption spectrometry and inductively coupled plasma mass
spectrometry in the determination of Bi, Se and Te by hydride generation. Chemical
Geology, 137: 79-89.
Hazardous Substances Data Bank (HSDB) http://toxnet.nlm.nih.gov/cgi-bin/sis/htmlgen?HSDB
Hua, Z. P. (2000) Geochemistry of tellurium in the Dongping-type gold deposits in Northern
China. PhD thesis, Guangzhou Institute of Geochemistry, Chinese Academy of Sciences,
138 pp.
IGNOU (Indira Gandhi National Open University). Unit 8 Atomic Fluorescence Spectrometry.
http://www.ignou.ac.in/upload/programme/PROGRAMME%20GUIDE%20(PGDAC).
Kuo, C.-Y., and Jiang, S-J. (2008) Determination of selenium and tellurium compounds in
biological samples by ion chromatography dynamic reaction cell inductively coupled
plasma mass spectrometry. Journal of Chromatography A, 1181: 60-66.
Liu, H.-M., Chen, S.-Y., Chang, P.-H. and Tsai, S-J.J. (2002) Determination of bismuth,
selenium and tellurium in nickel-based alloys and pure copper by flow-injection hydride
generation atomic absorption spectrometry with ascorbic acid prereduction and cupferron
chelation-extraction. Analytica Chimica Acta, 459: 161-168.
- 48 -
MAK Value Documentations (2006) Tellurium and its Inorganic Compounds. MAK collection
Vol.22. http://onlinelibrary.wiley.com/doi/10.1002/3527600418.mb1349480vere0022/pdf
Matusiewicz, H. and Krawczyk, M. (2007) Determination of tellurium by hydride generation
with in situ trapping flame atomic absorption spectrometry. Spectrochimica Acta Part B,
62: 309-316.
Pedro, J., Stripekis, J., Bonivardi, A. and Tudino, M. (2006) Thermal stabilization of tellurium in
mineral acids solutions: Use of permanent modifiers for its determination in sulfur by
GFAAS. Talanta, 69: 199-203.
Pedro, J., Stripekis, J., Bonivardi, A. and Tudino, M. (2008) Determination of tellurium at ultra-
trace levels in drinking water by on-line solid phase extraction coupled to graphite
furnace atomic absorption spectrometer. Talanta, 63: 86-91.
Xi, M., Liu, R., Wu, P., Xu, K., Hou, X. and Lv, Y. (2010) Atomic absorption spectrometric
determination of trace tellurium after hydride trapping on platinum-coated tungsten coil.
Microchemical Journal, 95: 320-325.
Yildirim, E., Akay, P., Arslan, Y., Bakirdere, S. and Ataman, O.Y. (2012) Tellurium speciation
analysis using hydride generation in situ trapping electrothermal atomic absorption
spectrometry and ruthenium or palladium modified graphite tubes. Talanta, 102: 59-67.
Yu, C., Cai, Q., Guo, Z.-X., Yang, Z. and Khoo, S.B. (2003) Speciation analysis of tellurium by
solid-phase extraction in the presence of ammonium pyrrolidine dithiocarbamate and
inductively coupled plasma mass spectrometry." Analytical and Bioanalytical Chemistry,
376: 236-242.

- 49 -
Appendices
Appendix 1: Instrumental settings.
A-1 The effect of HCl concentration on Te(IV) signal (peak height).
Te(IV) µg/L 2.0M HCl 3.0M HCl 3.5M HCl 4.0M HCl
20. 40.33 47.53 46.45 41.55
40 76.88 87.61 85.44 80.81
60 125.38 128.48 119.91 107.82
A-2 Reduction of Te(VI) to Te(IV) using 0.17M KBr as reducing agent (N=3).
Te(VI) µg/L Peak Height Average STD RSD%
3.0 8.72 0.57 6.53
5.0 19.78 0.79 4.03
7.0 32.36 2.50 7.74
10.0 48.38 2.48 5.14
A-3 Stability of Te (IV) in 0,17M KBr in three days.
Te(IV) µg/L Peak Height Average STD RSD%
3.0 10.55 1.75 16.63
5.0 20.72 1.03 4.97
7.0 31.49 3.09 9.83
10.0 47.46 2.65 5.58

- 50 -
Appendix 2. Interference of metal ions and selection of masking agent.
A-4 Test of interference of Nickel (mg/L). The 10 µg/L of Te(IV) was present in all solutions used in interference study in 3.0M HCl. Te(IV) was added to different concentration of Ni(II) expressed in mg/L.
Sample ID Te
+0.005 Te
+0.01 Te+ 0.05
Te +0.10
Te+ 0.30
Te+ 0.50
Te+ 0.70
Pk Ht 78.8 80.1 74.7 76.9 76.0 76.3 70.2
Measured Te (µg/L)
10.48 10.66 9.94 10.24 10.12 10.15 9.34
Recovery% 102 104 97 100 99 99 91
Interference of Ni(II) results (continued):
Sample ID Te +1
Te +10
Te + 25
Te + 50
Te + 75
Te +5
Te + 100
Te + 500
Pk Ht 64.9 59.6 49.12 37.96 23.84 13,23 3.47 3.03
Measured Te (µg/L)
8.65 7.93 6.55 5.07 3.19 1.83 0.49 0.43
Recovery% 84 77 64 49 31 18 5 4
A-5 Test of interference of Cobalt (mg/L).
Sample ID Te
+0.10 Te
+0.25 Te
+0.50 Te +1
Te +10
Te +50
Te +100
Te +150
Te +200
Te +250
Pk Ht 65.36 64.23 64.98 62.76 47.65 36.39 28.78 25.94 12.78 11.32
Measured Te (µg/L)
9.79 9.62 9.73 9.39 7.12 5.42 4,27 3.84 1.86 1.64
Recovery% 100 98 99 96 73 55 43 39 19 16
A-6 Test of interference of chromium(VI) (mg/L).
Sample ID Te
+0.01 Te
+0.25 Te
+0.50 Te +1
Te +20
Te +30
Te +50
Te +100
Pk Ht 56.34 56.44 57.88 57.78 41.08 23.53 9.33 1.68
Measured Te (µg/L)
9.27 9.29 9.53 9.51 6.73 3.80 1.44 0.16
Recovery% 98 98 101 101 71 40 15 2
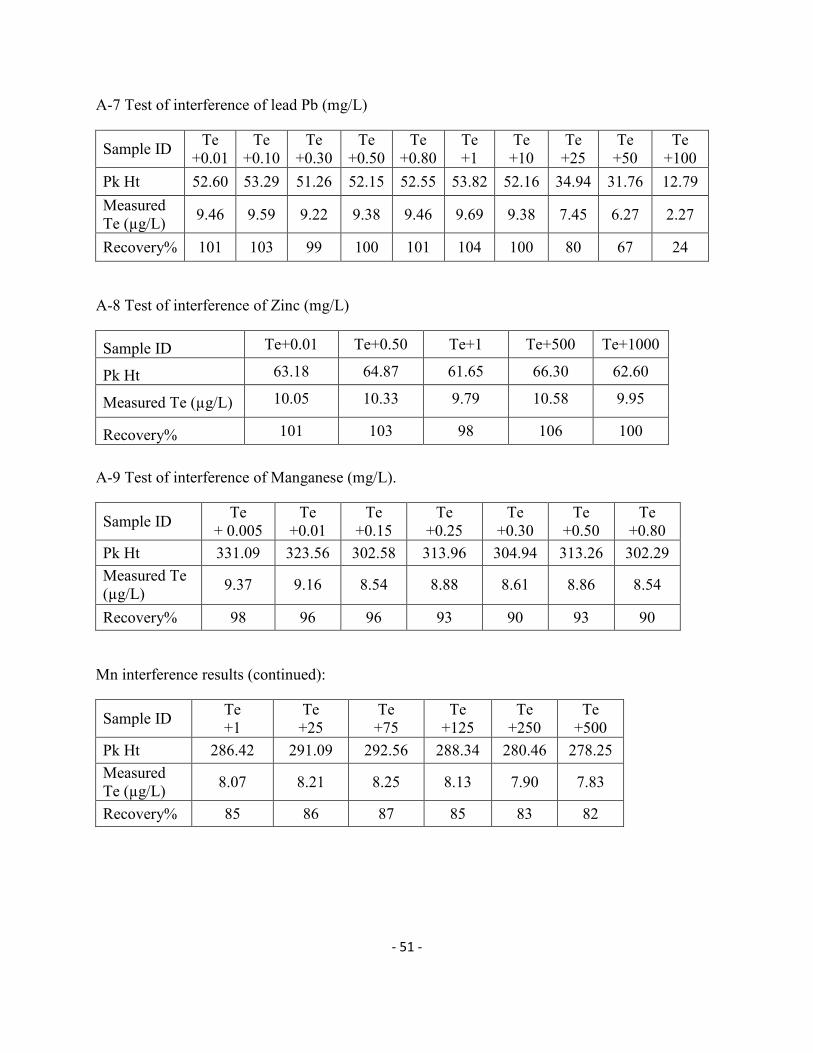
- 51 -
A-7 Test of interference of lead Pb (mg/L)
Sample ID Te
+0.01 Te
+0.10 Te
+0.30 Te
+0.50 Te
+0.80 Te +1
Te +10
Te +25
Te +50
Te +100
Pk Ht 52.60 53.29 51.26 52.15 52.55 53.82 52.16 34.94 31.76 12.79
Measured Te (µg/L)
9.46 9.59 9.22 9.38 9.46 9.69 9.38 7.45 6.27 2.27
Recovery% 101 103 99 100 101 104 100 80 67 24
A-8 Test of interference of Zinc (mg/L)
A-9 Test of interference of Manganese (mg/L).
Sample ID Te
+ 0.005 Te
+0.01 Te
+0.15 Te
+0.25 Te
+0.30 Te
+0.50 Te
+0.80
Pk Ht 331.09 323.56 302.58 313.96 304.94 313.26 302.29
Measured Te (µg/L)
9.37 9.16 8.54 8.88 8.61 8.86 8.54
Recovery% 98 96 96 93 90 93 90
Mn interference results (continued):
Sample ID Te +1
Te +25
Te +75
Te +125
Te +250
Te +500
Pk Ht 286.42 291.09 292.56 288.34 280.46 278.25
Measured Te (µg/L)
8.07 8.21 8.25 8.13 7.90 7.83
Recovery% 85 86 87 85 83 82
Sample ID Te+0.01 Te+0.50 Te+1 Te+500 Te+1000
Pk Ht 63.18 64.87 61.65 66.30 62.60
Measured Te (µg/L) 10.05 10.33 9.79 10.58 9.95
Recovery% 101 103 98 106 100
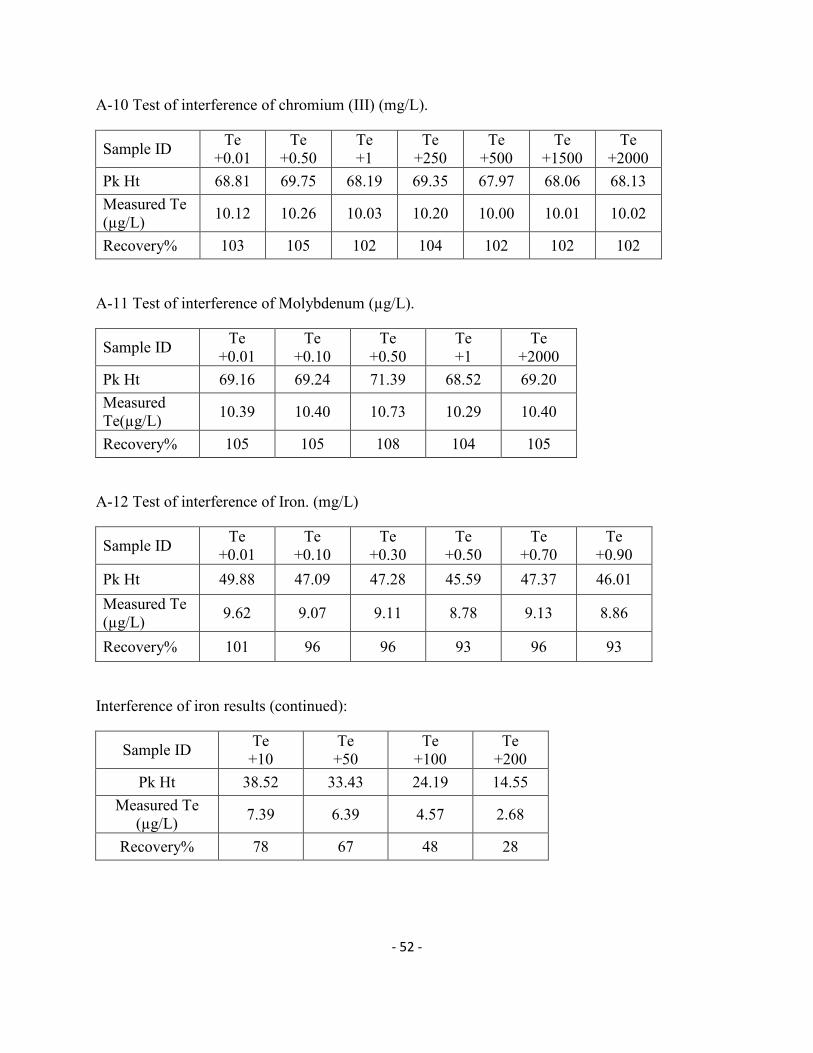
- 52 -
A-10 Test of interference of chromium (III) (mg/L).
Sample ID Te
+0.01 Te
+0.50 Te +1
Te +250
Te +500
Te +1500
Te +2000
Pk Ht 68.81 69.75 68.19 69.35 67.97 68.06 68.13
Measured Te (µg/L)
10.12 10.26 10.03 10.20 10.00 10.01 10.02
Recovery% 103 105 102 104 102 102 102
A-11 Test of interference of Molybdenum (µg/L).
Sample ID Te
+0.01 Te
+0.10 Te
+0.50 Te +1
Te +2000
Pk Ht 69.16 69.24 71.39 68.52 69.20
Measured Te(µg/L)
10.39 10.40 10.73 10.29 10.40
Recovery% 105 105 108 104 105
A-12 Test of interference of Iron. (mg/L)
Sample ID Te
+0.01 Te
+0.10 Te
+0.30 Te
+0.50 Te
+0.70 Te
+0.90
Pk Ht 49.88 47.09 47.28 45.59 47.37 46.01
Measured Te (µg/L)
9.62 9.07 9.11 8.78 9.13 8.86
Recovery% 101 96 96 93 96 93
Interference of iron results (continued):
Sample ID Te
+10 Te
+50 Te
+100 Te
+200
Pk Ht 38.52 33.43 24.19 14.55
Measured Te (µg/L)
7.39 6.39 4.57 2.68
Recovery% 78 67 48 28

- 53 -
A-13 Test of interference of copper (mg/L).
Sample ID Te
+0.005 Te
+0.01 Te
+0.03 Te
+0.07 Te
+0.10 Te
+0.30 Te
+0.50 Te
+0.70
Pk Ht 54.51 53.87 51.89 49.14 44.10 33.79 25.54 17.80
Measured Te (µg/L)
10.26 10.12 9.70 9.11 8.02 5.81 4.04 2.37
Recovery% 95 93 89 84 74 54 37 22
A-14 Effect of masking of 1%(w/v) 8-hydroxyquinoline.
Te(IV) /µg/L
Cu(II) µg/L
Peak Height
Te (µg/L) in Cu+10ppbTe + % 8-hydroxyquinoline
Te Recovery% of Cu+Te10/µg/L+ 1% 8-hydroxyquinoline
10 0 39.83 10.00 100.00
10 50 32.80 8.24 81.23
10 100 32.73 8.22 81.05
10 300 29.15 7.25 71.49
10 500 23.14 6.62 55.43
A-15 Effect of masking of 1%(w/v) 1,10-phenanthroline.
Te(IV) / µg/L
Cu(II) µg/L
Peak Height
Te (µg/L) in Cu + Te10/µg/L+ 1% 1,10-Phenanthroline
Te Recovery%
10 0 31.00 9.80 100.0
10 0.5 30.27 9.55 97.4
10 1 29.44 9.26 94.5
10 10 9.18 2.40 23.5
10 20 6.44 1.36 13.9
10 30 5.13 0.97 9.96

- 54 -
A-16 Effect of masking agent of 0.25%(w/v) thiourea.
A-17 Effect of mixture of different element ions [Cu(II), Cr(VI), Cr(III), Ni(II),
Fe(III), Zn(II), Co(II), Mn(II) and Mo(VI)]
Te(IV) /µg/L
Ions Mix / mg/L
Peak Height
Measured Te(VI) /µg/L+0.25% thiourea
Te(VI) Recovery%
10 0 34.78 10 100
10 5 35.24 10.27 101.4
10 10 33.38 9.71 95.9
10 15 29.38 8.51 84.0
10 20 21.81 6.24 61.6
10 25 17.45 4.93 48.7
Te(IV) /(µg/L)
Cu (µg/L)
Peak Height
Te in, (µg/L) Cu+Te10/µg/L+0.25% thiourea
Te Recovery%
10 0 21.60 9.72 97.16
10 0.5 19.76 8.80 90.54
10 0.8 21.91 9.87 101.59
10 1 20.86 9.35 96.23
10 10 18.57 8.21 84.45
10 30 17.72 7.78 80.10

- 55 -
A-18 Spiked Te(IV) recovery from Kelly and Ramsey Lakes water samples.
Sample ID Spiked Te µg/L
Peak Height Measured Te /µg/L
Recovery %
K1 blk NA 5.74 NA NA
K1 3 20.02 3.21 107
K2 5 29.96 5.07 101
K3 7 42.07 7.34 104
K4 9 55.21 9.79 108
R1 blk NA 2.73 NA NA
R1 5 13.66 5.40 108
R2 15 33.36 14.66 97
R3 20 46.6 20.89 104
A-19 Spiked Te(VI) recovery from Kelly and Ramsey Lakes water samples.
Sample ID Spiked Te (VI) µg/L
Peak Height Measured Te (VI) µg/L
Recovery %
K1 blk 0.0 4.62 0.0 NA
K1 3 15.53 3.15 105
K2 5 21.81 4.72 94
K4 9 40.16 9.28 103
R1 blk 0.0 5.37 0.0 NA
R1 3 15.58 3.16 105
R2 5 22.29 4.84 96
R3 9 36.96 8.50 94
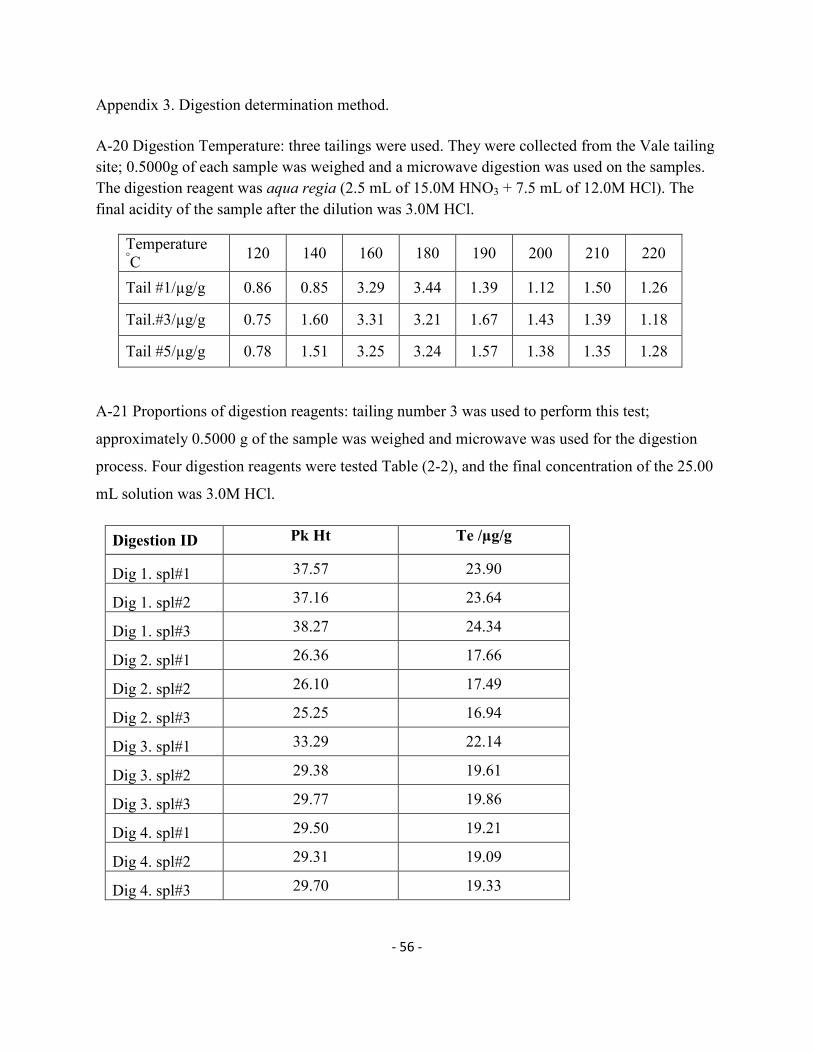
- 56 -
Appendix 3. Digestion determination method.
A-20 Digestion Temperature: three tailings were used. They were collected from the Vale tailing site; 0.5000g of each sample was weighed and a microwave digestion was used on the samples. The digestion reagent was aqua regia (2.5 mL of 15.0M HNO3 + 7.5 mL of 12.0M HCl). The final acidity of the sample after the dilution was 3.0M HCl.
Temperature °C
120 140 160 180 190 200 210 220
Tail #1/µg/g 0.86 0.85 3.29 3.44 1.39 1.12 1.50 1.26
Tail.#3/µg/g 0.75 1.60 3.31 3.21 1.67 1.43 1.39 1.18
Tail #5/µg/g 0.78 1.51 3.25 3.24 1.57 1.38 1.35 1.28
A-21 Proportions of digestion reagents: tailing number 3 was used to perform this test;
approximately 0.5000 g of the sample was weighed and microwave was used for the digestion
process. Four digestion reagents were tested Table (2-2), and the final concentration of the 25.00
mL solution was 3.0M HCl.
Digestion ID Pk Ht Te /µg/g
Dig 1. spl#1 7.573 23.90
Dig 1. spl#2 37.16 23.64
Dig 1. spl#3 38.27 24.34
Dig 2. spl#1 26.36 17.66
Dig 2. spl#2 26.10 17.49
Dig 2. spl#3 25.25 16.94
Dig 3. spl#1 33.29 22.14
Dig 3. spl#2 29.38 19.61
Dig 3. spl#3 29.77 19.86
Dig 4. spl#1 29.50 19.21
Dig 4. spl#2 29.31 19.09
Dig 4. spl#3 29.70 19.33
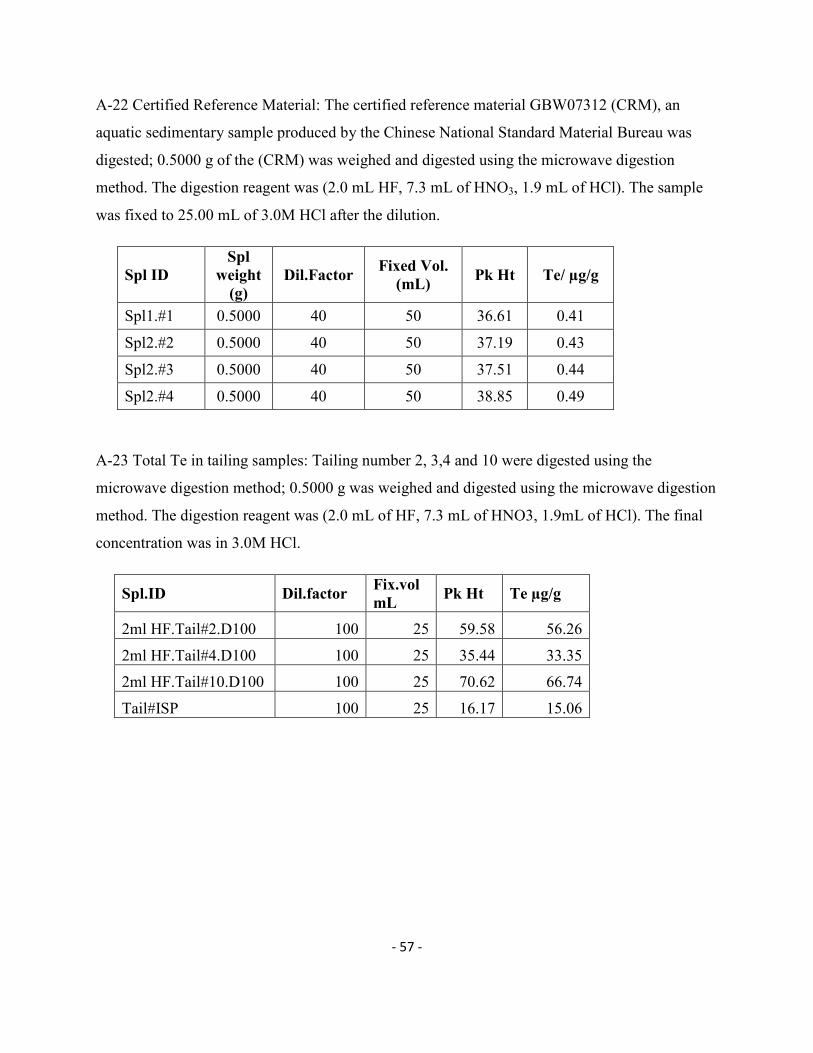
- 57 -
A-22 Certified Reference Material: The certified reference material GBW07312 (CRM), an
aquatic sedimentary sample produced by the Chinese National Standard Material Bureau was
digested; 0.5000 g of the (CRM) was weighed and digested using the microwave digestion
method. The digestion reagent was (2.0 mL HF, 7.3 mL of HNO3, 1.9 mL of HCl). The sample
was fixed to 25.00 mL of 3.0M HCl after the dilution.
Spl ID Spl
weight (g)
Dil.Factor Fixed Vol.
(mL) Pk Ht Te/ µg/g
Spl1.#1 0.5000 40 50 36.61 0.41
Spl2.#2 0.5000 40 50 37.19 0.43
Spl2.#3 0.5000 40 50 37.51 0.44
Spl2.#4 0.5000 40 50 38.85 0.49
A-23 Total Te in tailing samples: Tailing number 2, 3,4 and 10 were digested using the
microwave digestion method; 0.5000 g was weighed and digested using the microwave digestion
method. The digestion reagent was (2.0 mL of HF, 7.3 mL of HNO3, 1.9mL of HCl). The final
concentration was in 3.0M HCl.
Spl.ID Dil.factor Fix.vol mL
Pk Ht Te µg/g
2ml HF.Tail#2.D100 100 25 59.58 56.26
2ml HF.Tail#4.D100 100 25 35.44 33.35
2ml HF.Tail#10.D100 100 25 70.62 66.74
Tail#ISP 100 25 16.17 15.06
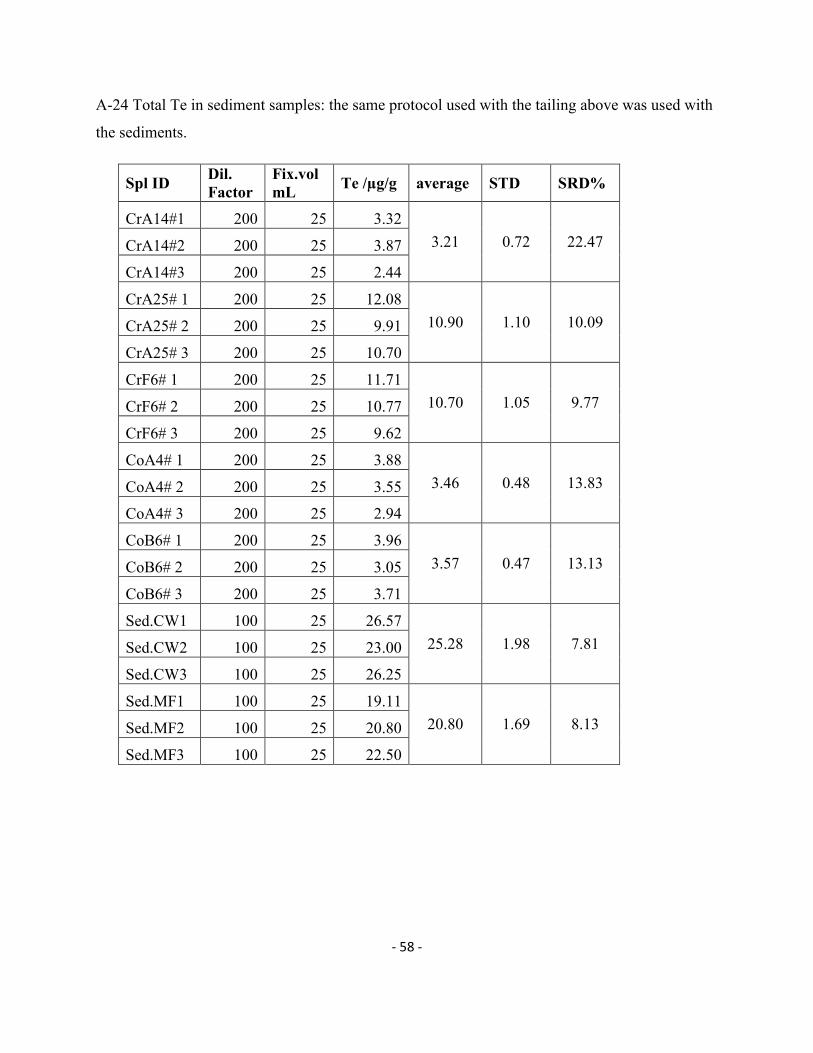
- 58 -
A-24 Total Te in sediment samples: the same protocol used with the tailing above was used with
the sediments.
Spl ID Dil. Factor
Fix.vol mL
Te /µg/g average STD SRD%
CrA14#1 200 25 3.32
CrA14#2 200 25 3.87 3.21 0.72 22.47
CrA14#3 200 25 2.44 CrA25# 1 200 25 12.08 CrA25# 2 200 25 9.91 10.90 1.10 10.09
CrA25# 3 200 25 10.70 CrF6# 1 200 25 11.71 CrF6# 2 200 25 10.77 10.70 1.05 9.77
CrF6# 3 200 25 9.62 CoA4# 1 200 25 3.88 CoA4# 2 200 25 3.55 3.46 0.48 13.83
CoA4# 3 200 25 2.94 CoB6# 1 200 25 3.96 CoB6# 2 200 25 3.05 3.57 0.47 13.13
CoB6# 3 200 25 3.71 Sed.CW1 100 25 26.57
25.28 1.98 7.81 Sed.CW2 100 25 23.00
Sed.CW3 100 25 26.25
Sed.MF1 100 25 19.11
20.80 1.69 8.13 Sed.MF2 100 25 20.80
Sed.MF3 100 25 22.50