(these figures are unaudited) (1)(2) for personal use only · the group all-in sustaining cost...
TRANSCRIPT

Quarterly Report Newcrest Mining Limited For the three months ended 31 March 2016
(these figures are unaudited)
Newcrest Mining - Quarterly Report to 31 March 2016
Key Points(1)(2) Gold production increased 2.6% to 637koz for the quarter Copper production increased 30.4% to 23kt for the quarter Group All-In Sustaining Cost per ounce decreased 4.5% to USD 723/oz for the quarter Group All-In Sustaining Cost per ounce margin increased 33% to USD 458/oz for the quarter FY16 Group gold production guidance remains unchanged at 2.4moz to 2.6moz(2) FY16 Group AISC spend guidance has decreased to USD 1,875 – 1,975m (from USD 1,900 – 2,050m) FY16 Group capital expenditure guidance has decreased to USD 440 – 540m (from USD 480 – 575m)
Overview Production Highlights Metric
March 2016 Qtr
December 2015 Qtr
September 2015 Qtr(3)
YTD FY16(3) YTD FY15(3)
Group production - gold oz 636,521 620,691 583,745 1,840,957 1,749,027
- copper t 22,924 17,581 21,337 61,842 74,646
All-In Sustaining Cost(1) USD/oz sold 723 757 785 753 787 Realised gold price USD/oz 1,181 1,100 1,126 1,137 1,232 All-In Sustaining Cost margin USD/oz sold 458 343 341 384 445
(1) See information under heading “Non-IFRS Financial Information” on the last page of this report for further information on this measure (2) See “Forward Looking Statements” on the last page of this report (3) Comparative financial information included in this report previously reported in AUD has been restated into USD. Further details of the restatement process are provided in the Market Release of 17 December 2015
Gold production was higher in the March 2016 quarter primarily driven by a full quarter of production at Cadia, partially offset by lower production at Gosowong following the previously announced geotechnical event in February 2016.
The Group All-In Sustaining Cost (AISC) per ounce improved 4.5% to USD 723/oz driven by higher production from the low cost Cadia operation and a significant reduction in AISC per ounce at Hidden Valley. Lihir maintained a stable AISC of USD 804/oz, and achieved a grinding throughput rate of 12.9mtpa for the quarter. Telfer and Gosowong’s AISC per ounce increased primarily due to lower grade ore feed and mine suspension respectively.
Newcrest Managing Director and Chief Executive Officer, Sandeep Biswas, said: “It was a quarter with a number of challenges, although it is pleasing to have increased our production and lowered our All-In Sustaining Cost per ounce in the quarter. We increased the level of throughput at Cadia as planned, and Lihir continued its improvement journey with another lift in throughput rates.”
For
per
sona
l use
onl
y
2 Newcrest Mining - Quarterly Report to 31 March 2016
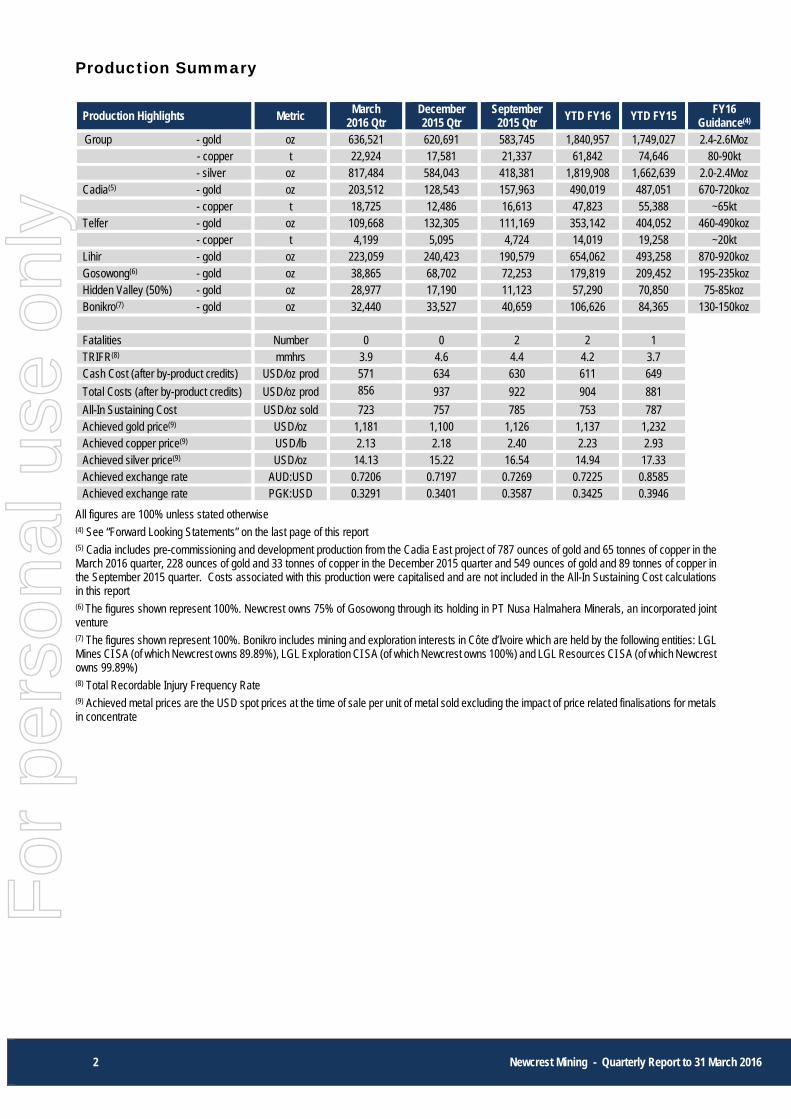
Production Summary
All figures are 100% unless stated otherwise (4) See “Forward Looking Statements” on the last page of this report
(5) Cadia includes pre-commissioning and development production from the Cadia East project of 787 ounces of gold and 65 tonnes of copper in the March 2016 quarter, 228 ounces of gold and 33 tonnes of copper in the December 2015 quarter and 549 ounces of gold and 89 tonnes of copper in the September 2015 quarter. Costs associated with this production were capitalised and are not included in the All-In Sustaining Cost calculations in this report (6) The figures shown represent 100%. Newcrest owns 75% of Gosowong through its holding in PT Nusa Halmahera Minerals, an incorporated joint venture (7) The figures shown represent 100%. Bonikro includes mining and exploration interests in Côte d’Ivoire which are held by the following entities: LGL Mines CI SA (of which Newcrest owns 89.89%), LGL Exploration CI SA (of which Newcrest owns 100%) and LGL Resources CI SA (of which Newcrest owns 99.89%) (8) Total Recordable Injury Frequency Rate (9) Achieved metal prices are the USD spot prices at the time of sale per unit of metal sold excluding the impact of price related finalisations for metals in concentrate
Production Highlights Metric March
2016 Qtr December 2015 Qtr
September 2015 Qtr
YTD FY16 YTD FY15 FY16
Guidance(4) Group - gold oz 636,521 620,691 583,745 1,840,957 1,749,027 2.4-2.6Moz
- copper t 22,924 17,581 21,337 61,842 74,646 80-90kt - silver oz 817,484 584,043 418,381 1,819,908 1,662,639 2.0-2.4Moz
Cadia(5) - gold oz 203,512 128,543 157,963 490,019 487,051 670-720koz - copper t 18,725 12,486 16,613 47,823 55,388 ~65kt
Telfer - gold oz 109,668 132,305 111,169 353,142 404,052 460-490koz - copper t 4,199 5,095 4,724 14,019 19,258 ~20kt
Lihir - gold oz 223,059 240,423 190,579 654,062 493,258 870-920koz Gosowong(6) - gold oz 38,865 68,702 72,253 179,819 209,452 195-235koz Hidden Valley (50%) - gold oz 28,977 17,190 11,123 57,290 70,850 75-85koz Bonikro(7) - gold oz 32,440 33,527 40,659 106,626 84,365 130-150koz Fatalities Number 0 0 2 2 1 TRIFR(8) mmhrs 3.9 4.6 4.4 4.2 3.7 Cash Cost (after by-product credits) USD/oz prod 571 634 630 611 649
Total Costs (after by-product credits) USD/oz prod 856 937 922 904 881
All-In Sustaining Cost USD/oz sold 723 757 785 753 787 Achieved gold price(9) USD/oz 1,181 1,100 1,126 1,137 1,232 Achieved copper price(9) USD/lb 2.13 2.18 2.40 2.23 2.93 Achieved silver price(9) USD/oz 14.13 15.22 16.54 14.94 17.33 Achieved exchange rate AUD:USD 0.7206 0.7197 0.7269 0.7225 0.8585 Achieved exchange rate PGK:USD 0.3291 0.3401 0.3587 0.3425 0.3946
For
per
sona
l use
onl
y

3 Newcrest Mining - Quarterly Report to 31 March 2016
Operations Cadia, Australia
Production Highlights Metric March
2016 Qtr December 2015 Qtr
September 2015 Qtr
YTD FY16 YTD FY15
TRIFR mmhrs 14.9 15.6 8.5 12.6 7.1 Ridgeway production - gold oz 11,489 14,359 23,182 49,030 180,760
- copper t 2,223 2,841 5,209 10,273 28,402
Cadia East production(10) - gold oz 192,024 114,184 134,781 440,989 306,291 - copper t 16,501 9,645 11,404 37,550 26,986
Total Cadia production - gold oz 203,512 128,543 157,963 490,019 487,051 - copper t 18,725 12,486 16,613 47,823 55,388
All-In Sustaining Cost USD/oz sold 199 314 181 227 208 All-In Sustaining Cost margin USD/oz sold 982 786 945 910 1,024
(10) Cadia production includes pre-commissioning and development production from the Cadia East project of 787 ounces of gold and 65 tonnes of copper in the March 2016 quarter, 228 ounces of gold and 33 tonnes of copper in the December 2015 quarter and 549 ounces of gold and 89 tonnes of copper in the September 2015 quarter. Costs associated with this production were capitalised and are not included in the All-In Sustaining Cost calculations in this report
The Ridgeway block cave mine was placed on care and maintenance on 3 March 2016 following 14 years of operation.
Production for the March quarter increased 58% on the previous quarter principally due to an increase in tonnes milled, with the December quarter being impacted by the Concentrator 1 SAG mill motor outage. The tonnes treated in the quarter represented an annualised throughput rate of 25.2mtpa. Other factors driving increased production were higher grade Cadia East ore replacing Ridgeway ore in the last month of the March quarter and marginally higher gold recovery.
Ore reclaimed from stockpiles generated during the prior quarter was used to supplement ore supply from the mines in the March quarter. This will continue in the next quarter, with the stockpile of ore to be substantially processed by the end of the June 2016 quarter.
AISC per ounce decreased due to the higher throughput and grade following the processing issues in the prior quarter noted above. The throughput-driven reduction in on-site operating costs and capital expenditure per ounce was partially offset by higher royalties (following the refund of royalties in the prior quarter) and lower by-product credits due to a lower copper to gold ratio and lower copper prices.
Consistent with expectations, operation of a second extraction drive from Panel Cave 1 (PC1) was discontinued during the quarter due to the ongoing interaction between PC1 and Panel Cave 2 (PC2). Interaction between the caves will continue over the coming months, with one more PC1 extraction drive scheduled to be suspended. PC2 continued to ramp up production, with 706,000 tonnes of mine production in the quarter, compared to 461,000 tonnes in the prior quarter.
Seventeen drawbells were fired during the quarter, bringing the total number of drawbells fired at PC2 to 110 out of a planned 165.
For
per
sona
l use
onl
y

4 Newcrest Mining - Quarterly Report to 31 March 2016
Lihir, PNG
Production Highlights Metric March
2016 Qtr December 2015 Qtr
September 2015 Qtr
YTD FY16 YTD FY15
TRIFR mmhrs 0.3 0.7 0.4 0.4 0.9 Production - gold oz 223,059 240,423 190,579 654,062 493,258 All-In Sustaining Cost USD/oz sold 804 803 996 859 1,183 All-In Sustaining Cost margin USD/oz sold 377 297 130 278 49
Gold production in the quarter was lower than the prior quarter primarily due to lower recovery rates and lower head grade.
Grinding mill throughput achieved for the quarter was at an annualised rate of 12.9 mtpa, despite mill shutdowns on each of the grinding circuits. This represents record throughput for the site.
Lower recoveries during the quarter were driven by unplanned equipment failures downstream of the autoclaves, which returned to full operation in the second week of the June quarter. There was an increase in material processed via the flotation circuit during this period which also negatively impacted overall recoveries.
AISC per ounce for the quarter was in line with the prior quarter, with a reduction in site costs per ounce being offset by an increase in production stripping per ounce due to the ramp up in waste stripping activity in Phase 14.
Lihir – Material Movements
Ore Source Metric March
2016 Qtr December 2015 Qtr
September 2015 Qtr
YTD FY16 YTD FY15
Ex-pit crushed tonnes kt 1,684 1,719 1,132 4,535 2,066 Ex-pit to stockpile kt 842 1,224 1,941 4,006 1,425 Waste kt 2,130 1,806 2,092 6,028 4,846 Total Ex-pit kt 4,656 4,748 5,164 14,569 8,337 Stockpile reclaim kt 1,502 1,312 1,523 4,336 5,838 Stockpile relocation kt 3,216 4,613 3,861 11,690 9,307 Total Other kt 4,718 5,925 5,384 16,027 15,145 Total Material Moved kt 9,374 10,673 10,548 30,596 23,482
Mining during the quarter remained on Phase 9 ore and Phase 14 waste stripping.
Lihir – Processing
Equipment Metric March
2016 Qtr December 2015 Qtr
September 2015 Qtr
YTD FY16 YTD FY15
Crushing kt 3,186 3,031 2,655 8,872 7,903 Milling (Grinding) kt 3,197 3,128 2,803 9,128 7,873 Flotation kt 2,063 1,599 1,236 4,899 3,680 Total Autoclave kt 2,003 2,137 2,030 6,170 5,592
The target remains to achieve a sustainable grinding mill throughput rate of 13 mtpa by the end of December 2016.
Rainfall increased during the quarter, reducing water constraints at the site. For
per
sona
l use
onl
y

5 Newcrest Mining - Quarterly Report to 31 March 2016
Telfer, Australia
Production Highlights Metric March
2016 Qtr December 2015 Qtr
September 2015 Qtr
YTD FY16 YTD FY15
TRIFR mmhrs 11.6 17.1 10.9 12.8 11.3 Production - gold oz 109,668 132,305 111,169 353,142 404,052 - copper kt 4,199 5,095 4,724 14,019 19,258 All-In Sustaining Cost USD/oz sold 1,028 850 1,108 979 737 All-In Sustaining Cost margin USD/oz sold 153 250 18 158 495
Contract mining and mobile mining equipment maintenance in the open pit commenced in February 2016.
Gold production in the March quarter was lower than the prior quarter, principally driven by a reduction in material from the open pit as the contractor ramped up its operations, which resulted in an increase of lower grade stockpiled ore supplementing feed. Lower underground grade also contributed to an overall decrease in gold grade in the quarter. A reduction in recovery with respect to both the open pit and underground ore also impacted production.
The increase in AISC per ounce for the quarter was driven by a combination of:
lower tonnes mined and lower grade ore; an increase in sustaining capital expenditure associated with increased underground development,
commencement of Western Flanks development and the commissioning of the carbon-in-leach upgrade; and
a decrease in by-product credits due to lower copper production and a lower realised copper price.
Gosowong, Indonesia
Production Highlights(11) Metric March
2016 Qtr December 2015 Qtr
September 2015 Qtr
YTD FY16 YTD FY15
TRIFR mmhrs 2.3 4.7 6.4 4.0 4.9 Production - gold oz 38,865 68,702 72,253 179,819 209,452 All-In Sustaining Cost USD/oz sold 1,291 825 679 858 802 All-In Sustaining Cost margin USD/oz sold (110) 275 447 279 430
(11) The figures shown represent 100%. Newcrest owns 75% of Gosowong through its holding in PT Nusa Halmahera Minerals, an incorporated joint venture
Gold production was lower at Gosowong in the quarter due to the suspension of mining following the previously announced geotechnical event at the Kencana mine on 8 February 2016. Production for the quarter represented underground mine production to 7 February 2016, the processing of low grade stockpiles and trial milling of 4kt of mineralised waste from Toguraci in March. As announced on 12 April 2016, mining has recommenced at the Toguraci mine and work continues on resumption plans at Kencana. Mining is unlikely to resume at the Kencana mine before the end of FY16. During the suspension, the opportunity was taken to progress technical studies and rehabilitation activities in both mines.
The increase in AISC per ounce was principally driven by the suspension of mining activity resulting in lower production and sales than the prior quarter and higher sustaining capital (mainly due to the purchase of two boggers and a full quarter of activity on the extension of the tailings storage facility).
For
per
sona
l use
onl
y

6 Newcrest Mining - Quarterly Report to 31 March 2016
Hidden Valley, PNG (50%)
Production Highlights(12) Metric March
2016 Qtr December 2015 Qtr
September 2015 Qtr
YTD FY16 YTD FY15
TRIFR mmhrs 1.8 2.4 4.9 3.1 2.7 Production - gold oz 28,977 17,190 11,123 57,290 70,850
- silver oz 588,775 322,257 147,775 1,058,807 708,326 All-In Sustaining Cost USD/oz sold 542 1,589 2,222 1,161 1,419 All-In Sustaining Cost margin USD/oz sold 639 (489) (1,096) (24) (187)
(12) The figures shown represent 50%
Gold production for the quarter increased by 69% and silver production increased by 83%. The increase in gold production was driven by a 29% increase in tonnes treated and 28% increase in gold grade, reflecting presentation of high grade ore from Stage 4.
AISC per ounce for the quarter decreased substantially due to the higher grade, the benefit of the depreciation of the PNG Kina against the US Dollar, and the impact of suspension of operations and write-down in ore inventory in the prior quarter.
The level of high grade ore available from Stage 4 is expected to decline and to be fully mined in the June quarter, and accordingly, the outcomes achieved for production and AISC in the March quarter are not expected to be maintained.
The joint venture partners continue to assess all strategic options in relation to the future of the asset.
Bonikro, Côte d’Ivoire
Production Highlights(13) Metric March
2016 Qtr December 2015 Qtr
September 2015 Qtr
YTD FY16 YTD FY15
TRIFR mmhrs 2.1 0.0 1.4 1.3 1.1 Production - gold oz 32,440 33,527 40,659 106,626 84,365 All-In Sustaining Cost USD/oz sold 996 912 674 860 775 All-In Sustaining Cost margin USD/oz sold 185 188 452 277 457
(13) The figures shown represent 100%. Bonikro includes mining and exploration interests in Côte d’Ivoire which are held by the following entities: LGL Mines CI SA (of which Newcrest owns 89.89%), LGL Exploration CI SA (of which Newcrest owns 100%) and LGL Resources CI SA (of which Newcrest owns 99.89%)
Gold production at Bonikro was marginally lower than the prior quarter primarily due to a reduction in head grade, largely offset by higher tonnes treated.
Bonikro’s AISC per ounce increased due to higher production stripping primarily due to waste removal to access ore in the Hiré pits and higher sustaining capital related to the ramp up of capital projects (including increasing the tailings storage facility capacity). This was partially offset by lower onsite operating costs.
For
per
sona
l use
onl
y

7 Newcrest Mining - Quarterly Report to 31 March 2016
Project Development Wafi-Golpu, PNG (50%) Engagement with the PNG Government in relation to the pre-mine development agreement is ongoing. The timing of advanced exploration work remains under review and the Feasibility Study work continues.
Exploration Brownfield Exploration
Exploration was undertaken within all of our brownfield sites including drilling at Gosowong, Telfer, Cadia and Bonikro. Key exploration activities included:
Three underground rigs were operating at Telfer. The drilling was focussed on resource definition drilling around the M Reefs and exploration within the vicinity of the Sub-level Cave. On the regional front, a prospectivity review was completed, with eleven new target regions identified within Newcrest tenements. Assessment and ranking of these targets will be undertaken during the next quarter.
Drilling targeting resource growth within the vicinity of the Gosowong operations was ongoing. The drilling completed during the quarter intersected veining and mineralisation but further assessment is required to determine the size of these new zones. A review of the structural controls of the mineralisation near mine was also completed with a number of new targets identified. Evaluation of these targets and drill testing of the priority exploration targets will also be undertaken during the next quarter.
Figure 1. Summary of Newcrest’s brownfield exploration activities
For
per
sona
l use
onl
y

8 Newcrest Mining - Quarterly Report to 31 March 2016
Greenfield Exploration
Portfolio rebuild continued with three new transactions entered into within West Africa during the quarter. This brings the global total of new exploration agreements within the last twelve months to 11.
Figure 2. Summary of Newcrest’s greenfield exploration activities
Newcrest is searching for new porphyry discoveries at Mungana (North Queensland) and Wamum (PNG). Newcrest has a proven track record of discovering porphyry related Au and Au-Cu deposits including deep deposits within the Cadia district and at Golpu. Newcrest is applying this knowledge and experience to these projects.
At Mungana, the exploration target is a bulk tonnage porphyry target within the vicinity of the historical porphyry deposits, Red Dome and Mungana. A target generation exercise was completed during the quarter including geochemical sampling, mapping and over 20km of high resolution electrical ground geophysical surveys. This work identified over 50 targets with ranking and prioritisation resulting in five key areas being highlighted for drill testing. Drill testing of these targets has commenced.
The exploration target at Wamum is higher grade porphyry related mineralisation below the Idzan Creek and Wamum prospects. Drilling was undertaken at Idzan Creek with diamond drill hole NWDD003 completed 100m west of NWDD001. The hole did intersect Au-Cu mineralisation but of a lower tenor to the intercept within NWDD001 (reported last quarter), however the width, strike extent and intensity of alteration present indicates that Idzan Creek is a robust porphyry system. Geochemical sampling completed during the quarter also indicates that the Idzan Creek target is much larger with new anomalies identified outside the area drill tested.
Within the Southern Coromandel project, New Zealand and Topacio project, Nicaragua, the exploration target is a high grade epithermal gold deposit, similar in style to the deposits previously discovered by Newcrest within the Gosowong and Cracow districts.
The Southern Coromandel project is located within the historical Karangahake – Golden Cross epithermal gold corridor in the Coromandel Peninsula, New Zealand. This region is host to the world-class Waihi Au-Ag epithermal deposit along with the historical Golden Cross and Karangahake Au-Ag deposits. Target generation work comprising field mapping, surface geochemical sampling and over 15 line km of ground geophysical survey (induced polarization) was completed. Five priority drill targets have been identified with drill testing of these targets to commence next quarter.
For
per
sona
l use
onl
y

9 Newcrest Mining - Quarterly Report to 31 March 2016
The Topacio project is centred on a very large epithermal vein system located within southern Nicaragua within Central America. Only a small proportion of this vein system has been drill tested. Exploration commenced during the quarter with a program of regional scale mapping and sampling.
Newcrest is searching for orogenic gold deposits within Côte d’Ivoire, West Africa. Côte d’Ivoire is an emerging gold province which is relatively under explored in comparison to the rest of West Africa.
Building a Côte d’Ivoire exploration portfolio continued with Newcrest signing an option agreement to acquire the Seguela concession located in Côte d’Ivoire which is held by a local subsidiary of Apollo Consolidated Limited. Newcrest has also entered into a heads of agreement with OSEAD to enter into a farm in agreement on ground that is immediately adjacent to the Seguela concession. Exploration has commenced on the Seguela concession.
A binding farm-in agreement has been entered into with Taruga in regard to ground in the Dabakala region of Côte d’Ivoire and target generation has commenced.
Finally Newcrest took steps to acquire more ground within the Dabakala region, entering into an agreement to acquire three exploration licences from Cape Lambert Resources.
Figure 3. Location of Newcrest’s exploration and mining projects, Cote d’Ivoire
For
per
sona
l use
onl
y

10 Newcrest Mining - Quarterly Report to 31 March 2016
Guidance Group gold production guidance for FY16 remains unchanged at 2.4 to 2.6 million ounces. Individual asset guidance has been updated in the table below.
Gold production guidance at Lihir has increased, due to improvements in grinding throughput and an anticipated improvement in recoveries compared to the March quarter.
The ramp-up of PC2 at Cadia has been stronger than originally forecast, resulting in a slight increase in gold production guidance. Production risks remain associated with the timing of interaction between PC1 and PC2.
A decrease in gold production guidance at Gosowong is due to the mine suspension previously announced.
Copper and silver production guidance remains unchanged.
Production guidance FY16(14) For the 12 months ending 30 June 2016
Cadia - gold koz 670 – 720 - copper kt ~65 Telfer - gold koz 460 – 490 - copper kt ~20 Lihir - gold koz 870 – 920 Gosowong - gold koz 195 – 235 Hidden Valley (50%) - gold koz 75 - 85 Bonikro - gold koz 130 – 150 Group production - gold Moz 2.4 – 2.6
- copper kt ~80 – 90 - silver Moz 2.0 – 2.4
(14) See “Forward Looking Statements” on the last page of this report
AISC guidance for FY16 has been reduced predominantly as a result of lower costs at Gosowong (due to the mine suspension) and Telfer (due to lower underground mining activity and lower production stripping).
Overall Group sustaining capital expenditure has been lowered. Sustaining capital expenditure in the final quarter is expected to be higher than prior quarters as a result of the timing of the planned expenditures and receipt of capital equipment.
Cost and Capital Guidance FY16 (15,16)
USDM Cadia Telfer Lihir
Goso-wong
(100%)
Hidden Valley (50%)
Bonikro (100%) Other Group
All-In Sustaining Cost 165-180 450-470 740-780 230-240 90-100 130-140 70-80 1,875-1,975
Capital expenditure
- Production stripping - 20-25 20-30 - - 15-20 - 55-75
- Sustaining capital 45-55 55-65 60-75 50-55 ~5 10-15 ~10 235-280
- Major projects (non-sustaining) 110-130 - 20-30 - - - 20-25 150-185
Total Capital expenditure
155-185 75-90 100-135 50-55 ~5 25-35 30-35 440-540
Exploration expenditure 40-50
Depreciation and amortisation (including production stripping) 675-725
(15) Assumes weighted average copper price of USD 2.20 per pound, silver price of USD 14.82 per ounce and AUD/USD exchange rate of 0.72 for the 2016 financial year (16) See “Forward Looking Statements” on the last page of this report Corporate
For
per
sona
l use
onl
y

11 Newcrest Mining - Quarterly Report to 31 March 2016
Gold hedging
On 24 March 2016, Newcrest announced it had placed AUD gold price hedges for a portion of Telfer’s future gold production. Having regard to the favourable spot and forward prices at the time, the Board felt it prudent to secure margins on a portion of future production, which in turn will help support the investment in future cutbacks and mine development. Further hedging of Telfer’s gold production may be undertaken in the future.
Financial year ending Gold ounces hedged Average price AUD/oz
30 June 2016 64,714 1,707 30 June 2017 300,694 1,730 30 June 2018 165,341 1,761 Total 530,749 1,737
Class action
On 22 February 2016, Newcrest announced it had reached an agreement to settle the shareholder class action proceedings commenced by Earglow Pty Ltd on 21 July 2014 in the Federal Court of Australia (Court). Both parties are now awaiting the Court’s approval.
Executive management appointment
As announced 12 April 2016, Ian Kemish has been appointed as Executive General Manager – Public Affairs & Social Performance, effective 16 May 2016. He will be a member of Newcrest’s Executive Committee.
Sandeep Biswas Managing Director and Chief Executive Officer
For
per
sona
l use
onl
y

12 Newcrest Mining - Quarterly Report to 31 March 2016
Gold Production Summary
March 2016 Quarter
Mine Production
Tonnes (000’s)(17)
Tonnes Treated (000’s)
Head Grade
(g/t Au)
Gold Recovery
(%)
Gold Production
(oz)
Gold Sales (oz)
All-In Sustaining
Cost (USD/oz)
Ridgeway 1,079 900 0.49 80.3 11,489 11,599 Cadia East(18) 4,598 5,358 1.34 83.9 192,024 182,742 Total Cadia 5,677 6,259 1.22 83.7 203,512 194,341 199 Telfer Open Pit 5,312 4,029 0.69 83.6 75,154 Telfer Underground 1,229 1,161 1.04 85.4 33,169 Telfer Dump Leach 1,345 Total Telfer 6,541 5,190 0.77 84.1 109,668 119,885 1,028 Lihir 4,656 3,197 3.07 70.6 223,059 231,925 804 Gosowong 82 87 13.68 97.0 38,865 46,170 1,291 Hidden Valley (50%) 1,088 540 1.89 89.3 28,977 30,427 542 Bonikro 3,944 603 1.77 94.0 32,440 34,544 996 Total 21,988 15,875 1.56 79.9 636,521 657,291 723
Nine months to 31 March 2016
Ridgeway 4,921 3,841 0.51 77.7 49,030 50,212 Cadia East(18) 13,000 12,447 1.32 83.8 440,989 429,321 Total Cadia 17,921 16,288 1.13 83.1 490,019 479,533 227 Telfer Open Pit 18,118 12,544 0.69 82.7 229,784 Telfer Underground 3,646 3,509 1.19 87.4 118,183 Telfer Dump Leach 5,176 Total Telfer 21,765 16,052 0.80 84.3 353,142 359,693 979 Lihir 14,569 9,128 2.97 74.9 654,062 639,874 859 Gosowong 447 449 12.78 96.5 179,819 210,304 858 Hidden Valley (50%) 3,747 1,275 1.63 87.0 57,290 57,625 1,161 Bonikro 8,019 1,781 1.97 94.4 106,626 109,098 860 Total 66,467 44,973 1.55 81.9 1,840,957 1,856,126 753
Notes: (17) Mine production for open pit and underground includes ore and waste (18) Cadia East includes pre-commissioning and development production and sales of 787 ounces of gold in the March 2016 quarter and 1,564 ounces of gold in the nine months ended 31 March 2016
All figures are 100%, other than Hidden Valley shown at 50%
For
per
sona
l use
onl
y

13 Newcrest Mining - Quarterly Report to 31 March 2016
Copper Production Summary
March 2016 Quarter Copper Grade (%)
Copper Recovery (%)
Concentrate Produced (tonnes)
Metal Production (tonnes)
Ridgeway 0.31 79.7 8,886 2,223
Cadia East(19) 0.35 86.8 67,092 16,501 Total Cadia 0.35 85.9 75,978 18,725 Telfer Open Pit 0.06 68.5 12,850 1,740 Telfer Underground 0.25 83.9 14,294 2,459 Total Telfer 0.11 76.8 27,144 4,199 Total 0.24 84.0 103,122 22,924
Nine months to 31 March 2016
Ridgeway 0.33 81.8 41,215 10,273 Cadia East(19) 0.35 87.0 160,788 37,550 Total Cadia 0.34 85.8 202,003 47,823 Telfer Open Pit 0.07 65.4 45,313 5,846 Telfer Underground 0.28 82.5 45,140 8,173 Total Telfer 0.12 74.4 90,453 14,019 Total 0.23 82.9 292,456 61,842
Notes: (19) Cadia East includes pre-commissioning and development production and sales of 65 tonnes of copper in the March 2016 quarter and 187 tonnes of copper in the nine months ended 31 March 2016
All figures are 100%, other than Hidden Valley shown at 50%
Silver Production Summary March 2016 Quarter
Head Grade (g/t)
Silver Recovery (%)
Tonnes Treated (000’s)
Silver Production (oz)
Cadia(20) 6,259 118,463 Telfer(20) 5,190 53,532 Lihir(20) 3,197 7,558 Gosowong 16 91.4 87 44,676 Hidden Valley (50%) 44 77.9 540 588,775 Bonikro(20) 603 4,479 Total 15,875 817,484
Nine months to 31 March 2016
Cadia(20) 16,288 312,235 Telfer(20) 16,052 152,351 Lihir(20) 9,128 17,723 Gosowong 21 86.8 449 265,163 Hidden Valley (50%) 36 74.9 1,275 1,058,807 Bonikro(20) 1,781 13,628 Total 44,973 1,819,908
Notes: (20) Silver head grade and recovery not currently assayed
All figures are 100%, other than Hidden Valley shown at 50%
For
per
sona
l use
onl
y

14 Newcrest Mining - Quarterly Report to 31 March 2016
All-In Sustaining Cost per Ounce of Gold Sold 3 months to 31 March 2016
USD/oz 9 months to 31 March 2016
USD/oz
Cadia(21) Telfer Lihir Gosowong Hidden Valley Bonikro
Corporate/ Other Group Cadia(21) Telfer Lihir Gosowong
Hidden Valley Bonikro
Corporate/ Other Group
Gold Sales (oz) 194,341 119,885 231,925 46,170 30,427 34,544 657,291 479,533 359,693 639,874 210,304 57,625 109,098 1,856,126
On site operating costs (including adjustments to inventory)
439 877 671 894 655 717 - 658 511 876 736 592 1,238 690 - 702
Royalties 50 29 28 53 31 52 - 38 35 34 25 50 34 40 - 33
Third party smelting, refining and transport costs
110 85 3 15 41 2 - 52 118 94 3 12 40 2 - 53
By-product credits (443) (183) (0) (19) (287) (2) - (179) (496) (205) (0) (21) (265) (2) - (179)
Adjusted operating costs 156 808 702 943 440 769 - 569 168 799 764 634 1,047 731 - 609
Corporate general & administrative costs(22) - - - - - - 22 22 - - - - - - 22 22
Reclamation and remediation costs 3 16 4 48 53 (0) - 11 4 17 4 40 37 9 - 12
Production stripping & underground mine development
- 20 33 - - 157 - 24 - 37 23 - - 60 - 19
Capital expenditure (sustaining) 39 181 65 270 50 69 2 95 53 119 68 163 77 54 2 87
Exploration (sustaining) 0 3 1 30 - 1 0 3 2 8 1 21 - 5 0 5
All-In Sustaining Cost 199 1,028 804 1,291 542 996 24 723 227 979 859 858 1,161 860 24 753
Notes: (21) Cadia includes pre-commissioning and development sales from the Cadia East project of 787 ounces of gold and 65 tonnes of copper in the March 2016 quarter, and 1,564 ounces of gold and 187 tonnes of copper in the nine months ended 31 March 2016. Costs associated with these sales are capitalised and are not included in the operating cost calculations throughout this report (22) Corporate general & administrative costs includes share-based remuneration
All figures are 100%, other than Hidden Valley shown at 50%. All-In Sustaining Cost metrics per World Gold Council Guidance Note on Non-GAAP Metrics, released 27 June 2013 For
per
sona
l use
onl
y
15 Newcrest Mining - Quarterly Report to 31 March 2016
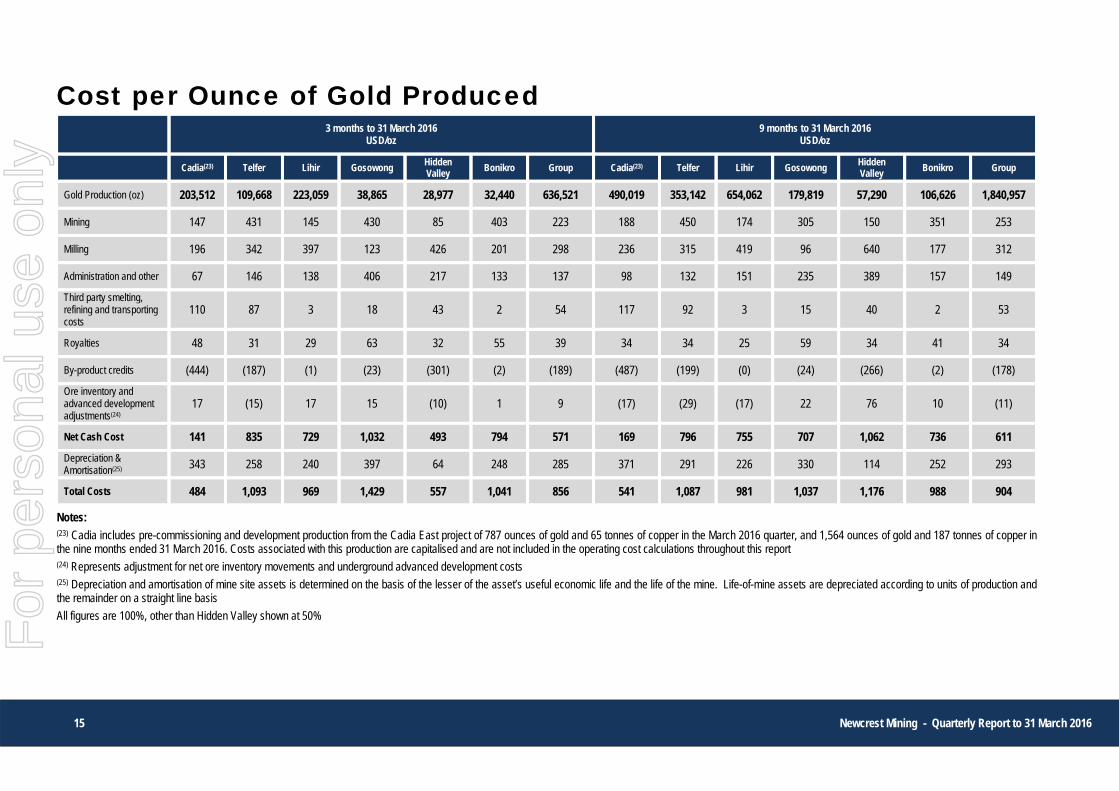
Cost per Ounce of Gold Produced 3 months to 31 March 2016
USD/oz 9 months to 31 March 2016
USD/oz
Cadia(23) Telfer Lihir Gosowong Hidden Valley Bonikro Group Cadia(23) Telfer Lihir Gosowong
Hidden Valley Bonikro Group
Gold Production (oz) 203,512 109,668 223,059 38,865 28,977 32,440 636,521 490,019 353,142 654,062 179,819 57,290 106,626 1,840,957
Mining 147 431 145 430 85 403 223 188 450 174 305 150 351 253
Milling 196 342 397 123 426 201 298 236 315 419 96 640 177 312
Administration and other 67 146 138 406 217 133 137 98 132 151 235 389 157 149
Third party smelting, refining and transporting costs
110 87 3 18 43 2 54 117 92 3 15 40 2 53
Royalties 48 31 29 63 32 55 39 34 34 25 59 34 41 34
By-product credits (444) (187) (1) (23) (301) (2) (189) (487) (199) (0) (24) (266) (2) (178)
Ore inventory and advanced development adjustments(24)
17 (15) 17 15 (10) 1 9 (17) (29) (17) 22 76 10 (11)
Net Cash Cost 141 835 729 1,032 493 794 571 169 796 755 707 1,062 736 611
Depreciation & Amortisation(25) 343 258 240 397 64 248 285 371 291 226 330 114 252 293
Total Costs 484 1,093 969 1,429 557 1,041 856 541 1,087 981 1,037 1,176 988 904
Notes: (23) Cadia includes pre-commissioning and development production from the Cadia East project of 787 ounces of gold and 65 tonnes of copper in the March 2016 quarter, and 1,564 ounces of gold and 187 tonnes of copper in the nine months ended 31 March 2016. Costs associated with this production are capitalised and are not included in the operating cost calculations throughout this report (24) Represents adjustment for net ore inventory movements and underground advanced development costs (25) Depreciation and amortisation of mine site assets is determined on the basis of the lesser of the asset’s useful economic life and the life of the mine. Life-of-mine assets are depreciated according to units of production and the remainder on a straight line basis
All figures are 100%, other than Hidden Valley shown at 50%
For
per
sona
l use
onl
y

16 Newcrest Mining - Quarterly Report to 31 March 2016
Simplified Lihir Pit Material Flow – March 2016 Quarter
Ore Source Metric Mar 2016 Qtr
Ex-pit crushed tonnes kt 1,684 Ex-pit to stockpile kt 842 Waste kt 2,130 Total Expit kt 4,656 Stockpile Reclaim kt 1,502 Stockpile Relocation kt 3,216 Total Other kt 4,718 Total Material Moved kt 9,374
Stockpile relocation
3.22 Mt
WASTE
Stockpile reclaim
1.50 Mt
Ex-pit to stockpile
0.84 Mt
EX-PIT MINING
ACTIVITY
ROM CRUSHER
Ex-pit crushed tonnes
Waste
2.13 Mt
LOW GRADE STOCKPILES
Ex-pit crushed tonnes
1.68 Mt
For
per
sona
l use
onl
y

17 Newcrest Mining - Quarterly Report to 31 March 2016
For
per
sona
l use
onl
y

18 Newcrest Mining - Quarterly Report to 31 March 2016
Corporate Information Board Peter Hay Non-Executive Chairman Sandeep Biswas Managing Director and CEO Gerard Bond Finance Director and CFO Philip Aiken AM Non-Executive Director Roger J. Higgins Non-Executive Director Winifred Kamit Non-Executive Director Richard Knight Non-Executive Director Rick Lee AM Non-Executive Director Xiaoling Liu Non-Executive Director John Spark Non-Executive Director
Francesca Lee Company Secretary
Registered & Principal Office Level 8, 600 St Kilda Road, Melbourne, Victoria, Australia 3004 Telephone: +61 (0)3 9522 5333 Facsimile: +61 (0)3 9522 5500 Email: [email protected] Website: www.newcrest.com.au
Stock Exchange Listings Australian Securities Exchange (Ticker NCM) New York ADR’s (Ticker NCMGY) Port Moresby Stock Exchange (Ticker NCM)
Forward Shareholder Enquiries to Link Market Services Level 1, 333 Collins Street Melbourne, Victoria, 3000 Australia Telephone: 1300 554 474 +61 (0)2 8280 7111 Facsimile: +61 (0)2 9287 0303 Email: [email protected] Website: www.linkmarketservices.com.au Substantial Shareholder(s) at 31 March 2016 Blackrock 11.4% First Eagle Investment Management 9.0% Commonwealth Bank of Australia 6.5% Orbis Group 5.4% Issued Share Capital At 31 March 2016 issued capital was 766,510,971 ordinary shares. Quarterly Share Price Activity High Low Close AUD AUD AUD Jan – Mar 2016 18.29 12.56 16.96
Forward Looking Statements These materials include forward looking statements. Often, but not always, forward looking statements can generally be identified by the use of forward looking words such as “may”, “will”, “expect”, “intend”, “plan”, “estimate”, “anticipate”, “continue”, and “guidance”, or other similar words and may include, without limitation, statements regarding plans, strategies and objectives of management, anticipated production or construction commencement dates and expected costs or production outputs. The Company continues to distinguish between outlook and guidance in forward looking statements. Guidance statements are a risk-weighted assessment constituting Newcrest’s current expectation as to the range in which its gold production in the current financial year will ultimately fall. Outlook statements are a risk-weighted assessment constituting Newcrest’s current view regarding the possible range of gold production in years subsequent to the current financial year.
Forward looking statements inherently involve known and unknown risks, uncertainties and other factors that may cause the Company’s actual results, performance and achievements to differ materially from any future results, performance or achievements. Relevant factors may include, but are not limited to, changes in commodity prices, foreign exchange fluctuations and general economic conditions, increased costs and demand for production inputs, the speculative nature of exploration and project development, including the risks of obtaining necessary licences and permits and diminishing quantities or grades of reserves, political and social risks, changes to the regulatory framework within which the Company operates or may in the future operate, environmental conditions including extreme weather conditions, recruitment and retention of personnel, industrial relations issues and litigation.
Forward looking statements are based on the Company and its management’s good faith assumptions relating to the financial, market, regulatory and other relevant environments that will exist and affect the Company’s business and operations in the future. The Company does not give any assurance that the assumptions on which forward looking statements are based will prove to be correct, or that the Company’s business or operations will not be affected in any material manner by these or other factors not foreseen or foreseeable by the Company or management or beyond the Company’s control.
Although the Company attempts and has attempted to identify factors that would cause actual actions, events or results to differ materially from those disclosed in forward looking statements, there may be other factors that could cause actual results, performance, achievements or events not to be as anticipated, estimated or intended, and many events are beyond the reasonable control of the Company. Accordingly, readers are cautioned not to place undue reliance on forward looking statements. Forward looking statements in these materials speak only at the date of issue. Subject to any continuing obligations under applicable law or any relevant stock exchange listing rules, in providing this information the Company does not undertake any obligation to publicly update or revise any of the forward looking statements or to advise of any change in events, conditions or circumstances on which any such statement is based.
Ore Reserves and Mineral Resources Reporting Requirements As an Australian Company with securities listed on the Australian Securities Exchange (“ASX”), Newcrest is subject to Australian disclosure requirements and standards, including the requirements of the Corporations Act 2001 and the ASX. Investors should note that it is a requirement of the ASX listing rules that the reporting of ore reserves and mineral resources in Australia comply with the 2012 Edition of the Australasian Code for Reporting of Exploration Results, Mineral Resources and Ore Reserves (the “JORC Code”) and that Newcrest’s ore reserve and mineral resource estimates comply with the JORC Code.
Competent Person’s Statement The information in this report that relates to Exploration Targets, Exploration Results, and related scientific and technical information, is based on and fairly represents information compiled by Mr F. MacCorquodale. Mr MacCorquodale is the General Manager – Exploration and a full-time employee of Newcrest Mining Limited. He is a shareholder in Newcrest Mining Limited and is entitled to participate in Newcrest’s executive equity long term incentive plan, details of which are included in Newcrest’s 2015 Remuneration Report. Replacement of Reserves and Resources depletion is one of the performance measures under that plan. He is a Member of Australian Institute of Geoscientists. Mr MacCorquodale has sufficient experience which is relevant to the styles of mineralisation and types of deposits under consideration and to the activity which he is undertaking to qualify as a Competent Person as defined in The JORC Code. Mr MacCorquodale consents to the inclusion in this report of the matters based on his information in the form and context in which it appears including sampling, analytical and test data underlying the results.
Non-IFRS Financial Information Newcrest results are reported under International Financial Reporting Standards (IFRS). This report includes a non-IFRS financial information, being All-In Sustaining Cost (determined in accordance with the World Gold Council Guidance Note on Non-GAAP Metrics released June 2013). This measure is used internally by management to assess the performance of the business and make decisions on the allocation of resources and is included in this presentation to provide greater understanding of the underlying performance of the Company’s operations. When reviewing business performance, this non-IFRS information should be used in addition to, and not as a replacement of, measures prepared in accordance with IFRS, available on Newcrest’s website and on the ASX platform. Non-IFRS information has not been subject to audit or review by Newcrest’s external auditor. Newcrest Group All-In Sustaining Costs will vary from period to period as a result of various factors including production performance, timing of sales, the level of sustaining capital and the relative contribution of each asset.
For further information, please contact:
Investor Enquiries Christopher Maitland T: +61 3 9522 5717 E: [email protected]
Ryan Skaleskog T: +61 3 9522 5407 E: [email protected]
Media Enquiries Jason Mills T: +61 3 9522 5690 E: [email protected]
This information is available on our website at www.newcrest.com.au
For
per
sona
l use
onl
y