thermographic properties of eu3+- and sm3+-doped … · that lutetium oxide has high chemical...
TRANSCRIPT

J. Serb. Chem. Soc. 77 (12) 1735–1746 (2012) UDC 536.51+546.669–31:547.441–036.7+ JSCS–4385 535.37:546.18+539.12 Original scientific paper
1735
Thermographic properties of Eu3+
- and Sm3+
-doped Lu2O3 nanophosphor
VESNA LOJPUR, ŽELJKA ANTIĆ, RADENKA KRSMANOVIĆ, MINA MEDIĆ, MARKO G. NIKOLIĆ and MIROSLAV D. DRAMIĆANIN*
Vinča Institute of Nuclear Sciences, University of Belgrade, P. O. Box 522, 11001 Belgrade, Serbia
(Received 21 October, revised 8 December 2012)
Abstract: Samples of Lu2O3:Eu3+ (3 at. % Eu) and Lu2O3:Sm3+ (1 at. % Sm), were prepared via the polymer complex solution method using poly(ethylene glycol) as the fuel and as nucleation agent for crystallization process. Knowing that lutetium oxide has high chemical stability and temperature resistance, in this study, the possibility for its application in high-temperature phosphor ther-mometry was investigated. This non-contact technique uses the thermal depen-dence of phosphor fluorescence to measure temperature remotely. The struc-tural and morphological properties were investigated by X-ray powder diffrac-tion (XRPD) analysis and transmission electron microscopy (TEM). The ob-tained results confirmed that this synthesis yields the desired crystalline struc-ture with particle sizes in the range from 30 to 50 nm. Photoluminescence emission measurements were recorded in the temperature range from ambient up to 873 K. The obtained results demonstrated the performance of Eu3+- and Sm3+-doped Lu2O3 as high temperature thermographic phosphors of very good sensitivity.
Keywords: Lu2O3; Eu3+; Sm3+; thermometry; FIR; luminescence.
INTRODUCTION
Rare-earth luminescent phosphor represents a very important group of mate-rials since they find application in biomedical multicolor imaging, scintillators, high-energy physics, lamps and display devices, etc.1–5 Recently, their applica-tion as temperature sensors has become very popular. In order to obtain an opti-cal temperature sensor with appropriate characteristics, it is necessary to choose an adequate optically active ion and a suitable host matrix. Rare earth ions, such as Eu3+, Sm3+, Er3+, Tm3+, Ho3+ and Nd3+, are luminescent activators that have coupled energy levels required for application in optical temperature sensors. These ions accommodate easily into a variety of different host materials. It is
* Corresponding author. E-mail: [email protected] doi: 10.2298/JSC121021140L
__________________________________________________________________________________________________________________
2012 Copyright (CC) SCS
Available online at shd.org.rs/JSCS/
1736 LOJPUR et al.
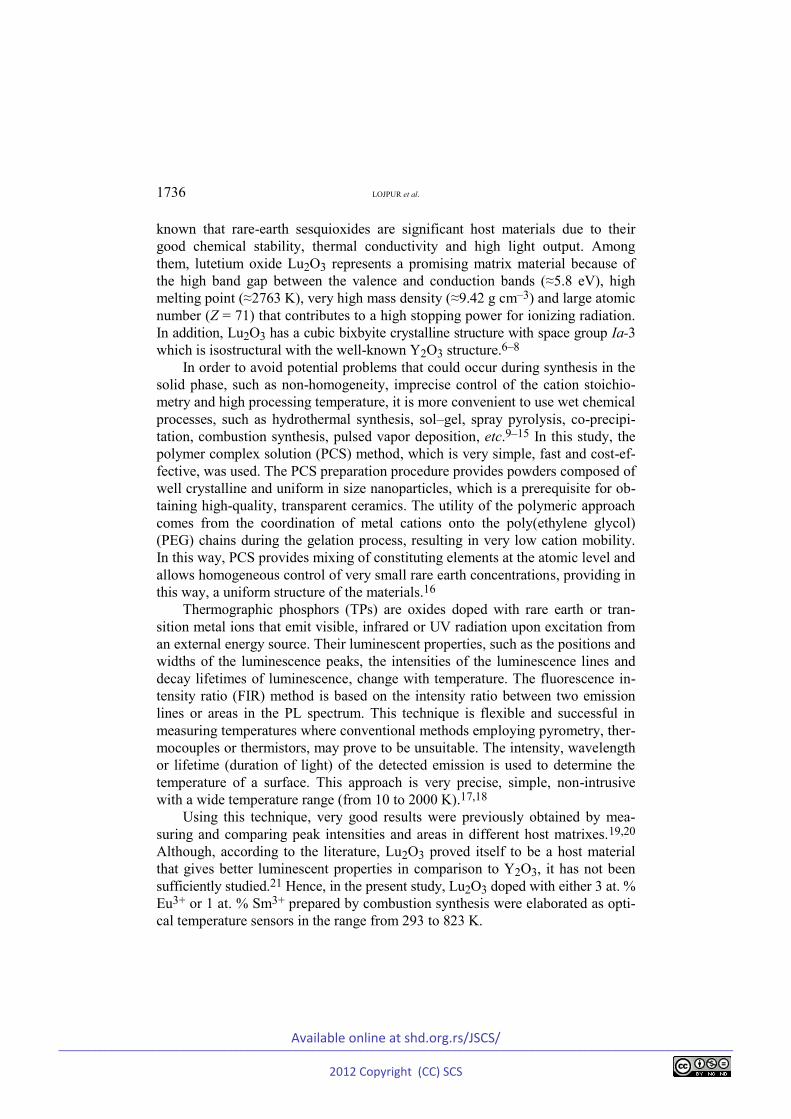
known that rare-earth sesquioxides are significant host materials due to their good chemical stability, thermal conductivity and high light output. Among them, lutetium oxide Lu2O3 represents a promising matrix material because of the high band gap between the valence and conduction bands (≈5.8 eV), high melting point (≈2763 K), very high mass density (≈9.42 g cm–3) and large atomic number (Z = 71) that contributes to a high stopping power for ionizing radiation. In addition, Lu2O3 has a cubic bixbyite crystalline structure with space group Ia-3 which is isostructural with the well-known Y2O3 structure.6–8
In order to avoid potential problems that could occur during synthesis in the solid phase, such as non-homogeneity, imprecise control of the cation stoichio-metry and high processing temperature, it is more convenient to use wet chemical processes, such as hydrothermal synthesis, sol–gel, spray pyrolysis, co-precipi-tation, combustion synthesis, pulsed vapor deposition, etc.9–15 In this study, the polymer complex solution (PCS) method, which is very simple, fast and cost-ef-fective, was used. The PCS preparation procedure provides powders composed of well crystalline and uniform in size nanoparticles, which is a prerequisite for ob-taining high-quality, transparent ceramics. The utility of the polymeric approach comes from the coordination of metal cations onto the poly(ethylene glycol) (PEG) chains during the gelation process, resulting in very low cation mobility. In this way, PCS provides mixing of constituting elements at the atomic level and allows homogeneous control of very small rare earth concentrations, providing in this way, a uniform structure of the materials.16
Thermographic phosphors (TPs) are oxides doped with rare earth or tran-sition metal ions that emit visible, infrared or UV radiation upon excitation from an external energy source. Their luminescent properties, such as the positions and widths of the luminescence peaks, the intensities of the luminescence lines and decay lifetimes of luminescence, change with temperature. The fluorescence in-tensity ratio (FIR) method is based on the intensity ratio between two emission lines or areas in the PL spectrum. This technique is flexible and successful in measuring temperatures where conventional methods employing pyrometry, ther-mocouples or thermistors, may prove to be unsuitable. The intensity, wavelength or lifetime (duration of light) of the detected emission is used to determine the temperature of a surface. This approach is very precise, simple, non-intrusive with a wide temperature range (from 10 to 2000 K).17,18
Using this technique, very good results were previously obtained by mea-suring and comparing peak intensities and areas in different host matrixes.19,20 Although, according to the literature, Lu2O3 proved itself to be a host material that gives better luminescent properties in comparison to Y2O3, it has not been sufficiently studied.21 Hence, in the present study, Lu2O3 doped with either 3 at. % Eu3+ or 1 at. % Sm3+ prepared by combustion synthesis were elaborated as opti-cal temperature sensors in the range from 293 to 823 K.
__________________________________________________________________________________________________________________
2012 Copyright (CC) SCS
Available online at shd.org.rs/JSCS/

Eu3+ AND Sm3+ DOPED Lu2O3 NANOPHOSPHOR 1737
EXPERIMENTAL Lutetium oxide doped with either 3 at. % Eu3+ or 1 at. % Sm3+ was fabricated by the
polymer complex solution method. The starting materials, Lu2O3, Eu2O3 and Sm2O3 (all Alfa Aesar, 99.9 %), were appropriately measured and dissolved in hot nitric acid. To the obtained solutions, PEG (Alfa Aesar, wM = 200) was added in a 1:1 mass ratio to the starting oxides, whereby metal–PEG solutions were formed. The solutions were continuously stirred at 80 °C for a few hours until solid complexes were formed that were subsequently combusted at 800 °C in air for 2 h, giving white powders as the resulting products.
The phase composition was investigated by X-ray powder diffraction analysis (XRPD) on a Philips PW 1050 instrument, using Ni filtered CuKα1,2 radiation. The diffraction data were recorded in the 2θ range from 10° to 120° counting for 12 s in each 0.02° step. The mic-rostructure at the local level was analyzed by the TEM technique using a Philips/FEI CM300 electron microscope operating at 300 kV. The photoluminescence spectra were collected under the excitation light of a 450 W xenon lamp on a Fluorolog-3 model FL3-221 (Horiba Jobin-Yvon) spectroflurometer (λexc(Lu2O3:Eu) = 393 nm and λexc(Lu2O3:Sm) = 406 nm), elevating the temperature from ambient to 823 K in steps of 50 K.
RESULTS AND DISCUSSION
The X-ray diffraction pattern for the Lu2O3:3 at. % Eu sample is shown in Fig. 1. The XRD analysis confirmed that during calcination at 800 °C the sample crystallized in a cubic bixbyte crystal structure with the space group Ia-3. The peak positions were indexed according to the JCPDS card No. 12-0728 for the cubic Lu2O3 structure. The narrow peaks of high intensities imply good crystal-linity of the sample.
Fig. 1. XRD Pattern of Lu2O3:3 at. % Eu3+ nanopowder sample with diffraction peaks indexed
according to JCPDS card No. 12-0728.
__________________________________________________________________________________________________________________
2012 Copyright (CC) SCS
Available online at shd.org.rs/JSCS/

1738 LOJPUR et al.
The morphology of Lu2O3:3 at. % Eu3+ sample analyzed with transmission electron microscopy (TEM) is presented in Fig. 2. The micrograph revealed the presence of agglomerates that consisted of nanoparticles in the range from 30 nm to 50 nm. High-resolution TEM (HR-TEM) showed a good crystalline structure without any irregularities, which are in good agreement with results obtained in the XRD measurements.
Fig. 2. Bright field image showing agglomerates of the powder sample with particle sizes
ranging from 30–50 nm (A) and high-resolution images of constituting nanosized particles (B).
The FIR method is based on the selection of two emission lines from photo-luminescent spectra and estimation of the temperature based on the ratio of their intensities. Two lines are considered appropriate for the intensity ratio method if they both have strong emission intensities over the whole temperature range and if their intensity ratio gives high temperature resolution.22 This approach elimi-nates a number of errors arising from fluctuations of the excitation light source, temperature changes of excitation bands and non-uniform dopant concentrations. A special case of the FIR measurement technique involves using the fluorescence intensities from two closely spaced, “thermally coupled” energy levels, the rela-tive population of which follows a Boltzmann type population distribution and is dependent on the temperature and the energy gap. Here, the ideal case was used, where the intensity of one of the emission lines is independent of temperature (internal reference); in this way, a calibration between the ratios of emissions is indicative of temperature. The main mechanism behind this phenomenon is ther-malization: when two energy levels of the RE activator are closely separated by a difference of approx. 1000 cm–1, the upper level will not emit fluorescence at low temperatures due to the high multi-phonon relaxation that quenches the energy.
__________________________________________________________________________________________________________________
2012 Copyright (CC) SCS
Available online at shd.org.rs/JSCS/
Eu3+ AND Sm3+ DOPED Lu2O3 NANOPHOSPHOR 1739
With increasing temperature, the upper level becomes more populated and there-fore the fluorescence from this level gradually increases at the expense of that of the lower level population.23 The relative population between the two levels, R, which follows a Boltzmann-type population distribution, is given by:
31
21
Δexp( )
I ΕR C
I kT (1)
where k is the Boltzmann constant, k = 0.695 034 76(63) cm−1 K–1, and ∆E = E32 is the energy gap between two excited levels (upper i = 3, lower i = 2, ground i = 1).
The rate at which the ratio R changes with temperature represents the sensor sensitivity, S:
2
d Δd
R ES RT kT
(2)
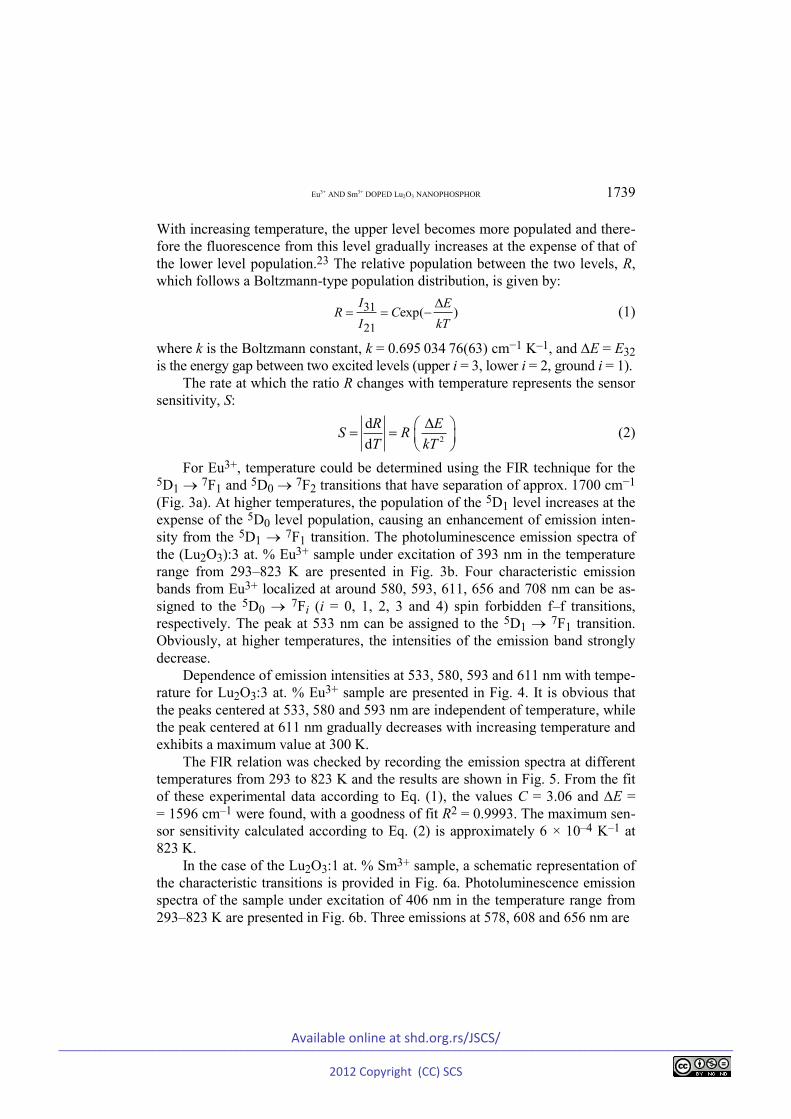
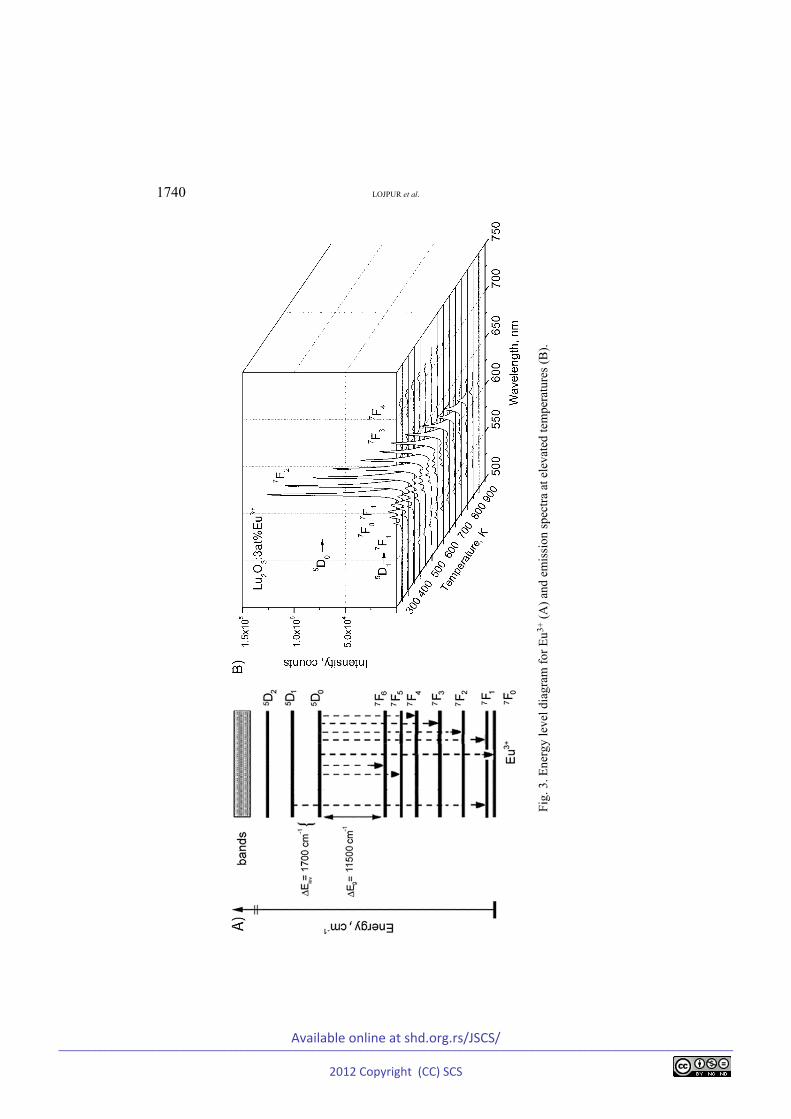
For Eu3+, temperature could be determined using the FIR technique for the 5D1 7F1 and 5D0 7F2 transitions that have separation of approx. 1700 cm−1 (Fig. 3a). At higher temperatures, the population of the 5D1 level increases at the expense of the 5D0 level population, causing an enhancement of emission inten-sity from the 5D1 7F1 transition. The photoluminescence emission spectra of the (Lu2O3):3 at. % Eu3+ sample under excitation of 393 nm in the temperature range from 293–823 K are presented in Fig. 3b. Four characteristic emission bands from Eu3+ localized at around 580, 593, 611, 656 and 708 nm can be as-signed to the 5D0 7Fi (i = 0, 1, 2, 3 and 4) spin forbidden f–f transitions, respectively. The peak at 533 nm can be assigned to the 5D1 7F1 transition. Obviously, at higher temperatures, the intensities of the emission band strongly decrease.
Dependence of emission intensities at 533, 580, 593 and 611 nm with tempe-rature for Lu2O3:3 at. % Eu3+ sample are presented in Fig. 4. It is obvious that the peaks centered at 533, 580 and 593 nm are independent of temperature, while the peak centered at 611 nm gradually decreases with increasing temperature and exhibits a maximum value at 300 K.
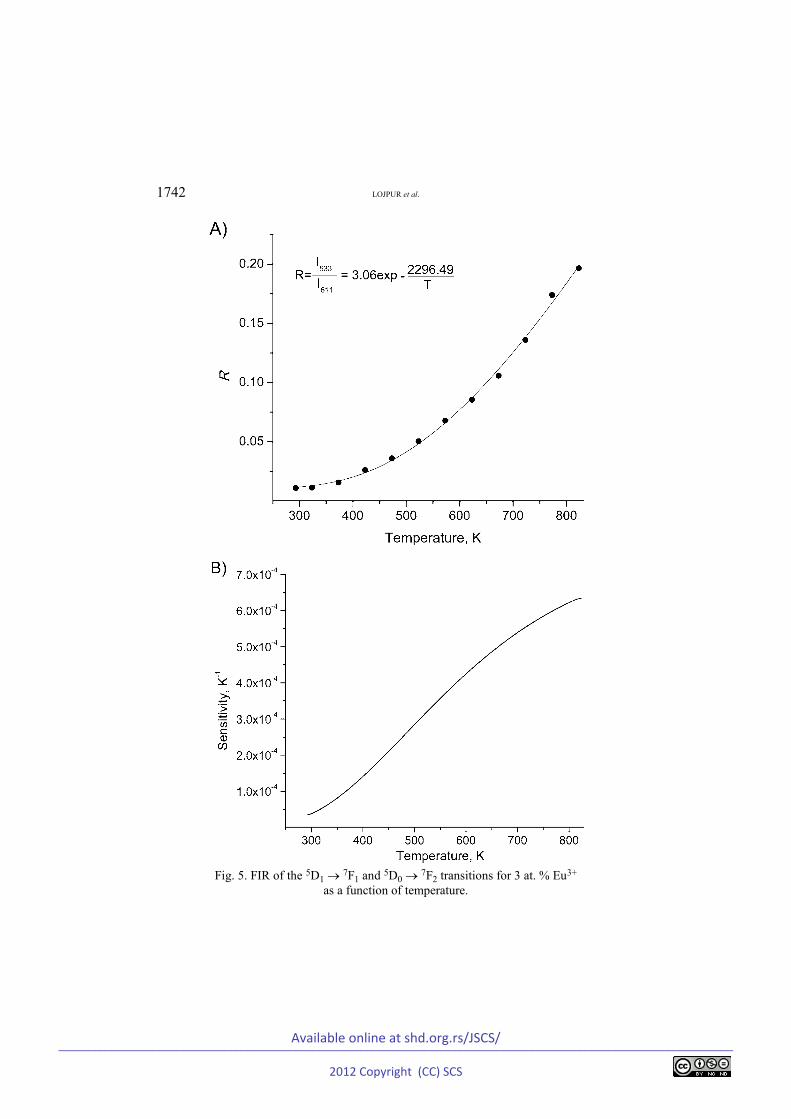
The FIR relation was checked by recording the emission spectra at different temperatures from 293 to 823 K and the results are shown in Fig. 5. From the fit of these experimental data according to Eq. (1), the values C = 3.06 and ∆E = = 1596 cm–1 were found, with a goodness of fit R2 = 0.9993. The maximum sen-sor sensitivity calculated according to Eq. (2) is approximately 6 × 10⁻⁴ K–1 at 823 K.
In the case of the Lu2O3:1 at. % Sm3+ sample, a schematic representation of the characteristic transitions is provided in Fig. 6a. Photoluminescence emission spectra of the sample under excitation of 406 nm in the temperature range from 293–823 K are presented in Fig. 6b. Three emissions at 578, 608 and 656 nm are
__________________________________________________________________________________________________________________
2012 Copyright (CC) SCS
Available online at shd.org.rs/JSCS/
1740 LOJPUR et al.
Fig.
3. E
nerg
y le
vel d
iagr
am fo
r Eu3+
(A) a
nd e
mis
sion
spec
tra a
t ele
vate
d te
mpe
ratu
res (
B).
__________________________________________________________________________________________________________________
2012 Copyright (CC) SCS
Available online at shd.org.rs/JSCS/

Eu3+ AND Sm3+ DOPED Lu2O3 NANOPHOSPHOR 1741
Fig. 4. Temperature dependant variations of the selected peaks’ intensity centered at 533, 580,
593 and 611 nm for Lu2O3:3 at. % Eu3+ sample. The sizes of the symbols represent the error of the measurements.
ascribed to the 4G5/2 6H5/2, 6H7/2, 6H9/2 transitions of Sm3+, respectively. As internal reference, the 4G5/2 6H5/2 transition (emission line at 578 nm) was chosen.
The dependence of the emission intensities at 578, 608, and 656 nm on tem-perature for Lu2O3:1 at. % Sm3+ sample are presented in Fig. 7. In this case, the peaks centered at 608 and 656 nm gradually decreased with increasing tempera-ture, while the peak centered at 578 nm showed irregular behavior with changing temperature.
The FIR of the emission at 578 nm relative to the emissions at 608 nm and 656 nm was checked by recording the emission spectra at different temperatures from 293 to 873 K and the results are presented in Fig. 8. From the fit of the obtained experimental data to Eq. (1), values of C = 8.02 and ∆E = 842.8 cm–1 were found for 4G5/2 6H5/2, 6H9/2, and C = 4.16, ∆E = 972.4 cm–1 for the 4G5/2 6H5/2, 6H7/2 transition ratio, with goodness of fits of 0.9871 and 0.9912, respectively. The maximum sensor sensitivities were approximately 3.6×10⁻³ K–1 at about 580 K for the 4G5/2 6H5/2, 6H9/2 ratio and 1.6×10⁻³ K–1 at about 700 K for the 4G5/2 6H5/2, 6H7/2 ratio.
__________________________________________________________________________________________________________________
2012 Copyright (CC) SCS
Available online at shd.org.rs/JSCS/
1742 LOJPUR et al.
Fig. 5. FIR of the 5D1 7F1 and 5D0 7F2 transitions for 3 at. % Eu3+
as a function of temperature.
__________________________________________________________________________________________________________________
2012 Copyright (CC) SCS
Available online at shd.org.rs/JSCS/

Eu3+ AND Sm3+ DOPED Lu2O3 NANOPHOSPHOR 1743
Fig.
6. E
nerg
y le
vel d
iagr
am fo
r the
Sm
3+ (A
) and
em
issi
on sp
ectra
und
er e
leva
ted
tem
pera
ture
s (B
).
__________________________________________________________________________________________________________________
2012 Copyright (CC) SCS
Available online at shd.org.rs/JSCS/

1744 LOJPUR et al.
Fig. 7. Temperature dependant variations of the intensity of se-lected peaks centered at 578, 608 and 656 nm for the Lu2O3:1 at. % Sm3+ sample. The sizes of the symbols represent the error of the measurements.
Fig. 8. FIR of the 4G5/2 6H5/2, 6H9/2 and 4G5/2 6H5/2, 6H7/2 transitions for 1 at. % Sm3+ as a function of temperature.
__________________________________________________________________________________________________________________
2012 Copyright (CC) SCS
Available online at shd.org.rs/JSCS/

Eu3+ AND Sm3+ DOPED Lu2O3 NANOPHOSPHOR 1745
CONCLUSION
Lutetium oxide doped with either Eu3+ or Sm3+ was synthesized via the po-lymer complex solution method. The FIR technique was used to examine poten-tial use of these materials in high-temperature phosphor thermometry. For Eu3+, the emission intensity was monitored with increasing temperature for the main transitions 5D1 7F1 and 5D0 7F2, and detected the maximum sensitivity of approximately 6×10⁻⁴ K–1 was detected at 823 K. For the Sm3+ ion, the 4G5/2 6H5/2, 6H9/2 and 4G5/2 6H5/2, 6H7/2 emission intensities were tracked and the maximum sensitivities of 3.6×10⁻³ and 1.6×10⁻³ K–1 were found at about 580 K and at about 700 K, respectively. Based on these results, it is evident that these materials could be used as temperature sensors at elevated temperatures.
Acknowledgement. This research was financially supported by the Ministry of Education, Science and Technological Development of the Republic of Serbia through Project Numbers 45020 and 171022.
И З В О Д
ТЕРМОГРАФСКА СВОЈСТВА Eu3+
И Sm3+
ДОПИРАНОГ Lu2O3 НАНОФОСФОРА
ВЕСНА ЛОЈПУР, ЖЕЉКА АНТИЋ, РАДЕНКА КРСМАНОВИЋ, МИНА МЕДИЋ, МАРКО Г. НИКОЛИЋ
и МИРОСЛАВ Д. ДРАМИЋАНИН
Институт за нуклеарне науке Винча, Универзитет у Београду, п. пр. 522, 11001 Београд
Узорци Lu2O3:Eu3+ (3 at. % Eu) и Lu2O3:Sm3+ (1 at. % Sm), су припремљени ме-тодом полимерног комплексног раствора уз коришћење полиетилен гликола као горива и нуклеационог агенса за процес кристализације. Узимајући у обзир да лутецијум-оксид има високу хемијску и температурску стабилност, у овом раду истражили смо могућ-ност његове примене за високо-температурску термометрију. Ова термометријска ме-тода је заснована на температурској зависност флуоресценце фосфора. Структурна и морфолошка својства су испитана коришћењем дифракције X зрака и трансмисионе електронске микроскопије. Добијени резултати су потвдили да примењена метода син-тезе даје узорке жељене кристалне структуре, са честицама праха пречника од 30 до 50 nm. Фотолуминесцентна мерења су изведена у опсегу од собне темературе до 873 K. Остварени резултати показују да Eu3+ и Sm3+ допиран Lu2O3 има добре перформансе као високо-температурски термографски фосфор.
(Примљено 21. октобра, ревидирано 8. децембра 2012)
REFERENCES 1. E. Zych, M. Wawrzyniak, A. Kossek, J. Trojan-Piegza, L. Kepinski, J. Alloy. Compd. 451
(2008) 591 2. M. Xu, W. Zhang, N. Dong, Y. Jiang, Y. Tao, M. Yin, J. Solid State Chem. 178 (2005) 477 3. A. Garcia-Murillo, C. Le Luyer, C. Dujardin, T. Martin, C. Garapon, C. Pedrini, J.
Mugnier, Nucl. Ins. Methods, A 486 (2002) 81 4. H. Wei, Z. Cleary, S. Park, K. Senevirathne, H. Eilers, J. Alloy. Compd. 500 (2010) 96 5. H. Guo, X. Yang, T. Xiao, W. Zhang, L. Lou, J. Mugnier, Appl. Surf. Sci. 230 (2004) 215 6. A. Martinez, J. Morales, L. A. Diaz-Torres, P. Salas, E. De la Rosa, J. Oliva, H. Desirena,
Mater. Sci. Eng., B 174 (2010) 164
__________________________________________________________________________________________________________________
2012 Copyright (CC) SCS
Available online at shd.org.rs/JSCS/

1746 LOJPUR et al.
7. A. N. Gruzintsev, G. A. Emelchenko, Yu. V. Yermolayeva, V. M. Masalov, A. V. Tolmachev, P. Benalloul, C. Barthou, Phys. Solid State 53 (2011) 1263
8. L. An, J. Zhang, M. Liu, S. Chen, S. Wang, Opt. Mater. 30 (2008) 957 9. M. Kottaisamy, D. Jeyakumar, R. Jagannathan, M. M. Rao, Mater. Res. Bull. 31 (1996)
1013 10. P. D. Volanti, V. I. Rosa, C. E. Paris, A. C. Paskocimas, S. P. Pizani, Opt. Mat. 31 (2009)
995 11. C. Dujardin, C. Le Luyer, C. Martinet, C. Garapon, J. Mugnier, A. G. Murillo, C. Pedrini,
T. Martin, Nucl. Ins. Methods, A 537 (2005) 237 12. M. Nichkova, D. Dosev, S. J. Gee, B. D. Hammock, I. M. Kennedy, Anal. Chem. 77 (2005)
6864 13. W. Q. Chen, Y. Shi, Q. L. An, W. S. Wang, J. Y. Chen, L. J. Shi, J. Eur. Ceram. Soc. 27
(2007) 191 14. S. Cho, H. Lee, C. Moon, J. Kim, J. Park, G. Jeon, R. Lee,,, S. Nam, J. Sol–Gel Sci.
Technol. 53 (2010) 171 15. C. Martinet, A. Pillonnet, J. Lancok, C. Garapon, J. Lumin. 126 (2010) 807 16. R. Krsmanovic, Z. Antic, B. Bartova, M. D. Dramicanin, J. Alloy. Compd. 505 (2010)
224 17. S. A. Wade, S. F. Collins, G. W. Baxter, J. Appl. Phys. 94 (2003) 4743 18. S. K. Singh, K. Kumar, B. S. Rai, Sensor Actuat., A 149 (2009) 16 19. M. G. Nikolic, D. J. Jovanovic, V. Ðordjevic, Z. Antic, R. M. Krsmanovic, M. D.
Dramicanin, Phys. Scr. T149 (2012) 014063 20. V. Lojpur, M. Nikolic, L. Mancic, O. Milosevic, M. D. Dramicanin, Ceram. Int. 39 (2013)
1129 21. F. Vetrone, J. C. Boyer, J. A. Capobianco, A. Speghini, M. Bettinelli, J. Phys. Chem., B 106
(2002) 5622 22. J. Petit, B. Viana, P. Goldner, J. P. Roger, D. Fournier, J. Appl. Phys. 108 (2010) 123108 23. L. Liu, Y. Wang, X. Zhang, K. Yang, Y. Bai, C. Huang, Y. Song, Opt. Commun. 284
(2011) 1876.
__________________________________________________________________________________________________________________
2012 Copyright (CC) SCS
Available online at shd.org.rs/JSCS/