thermogenic capacity of brown adipocytes isolated by proteinase k digestion followed by...
TRANSCRIPT
1
Mitochondrial Turnover: A Phenotype Distinguishing Brown Adipocytes from Interscapular Brown
Adipose Tissue and White Adipose Tissue
Emilia Gospodarska, Pawel Nowialis and Leslie P. Kozak
Institute of Animal Reproduction and Food Research
Polish Academy of Sciences
Olsztyn, Poland
*Running title: Thermogenic capacity of brown adipocytes
To whom correspondence should be addressed: Leslie P. Kozak, Institute of Animal Reproduction
and Food Research, Polish Academy of Sciences, ul. Tuwima 10, 10-748 Olsztyn, Poland, Tel: 48-
89-5234621; Fax:48-89-5240124; E-mail: [email protected]
Keywords: brown adipocytes, cold adaptation, energy metabolism, mitochondrial respiratory chain
complex, UCP1, mitophagy, obesity, thermogenesis
Background: It is unknown whether there is a
difference in the thermogenic potential of brown
adipocytes.
Results: In iBAT, UCP1 and mitochondrial
content are stable during temperature transitions
whereas in WAT they fluctuate.
Conclusion: A difference between iBAT and
WAT lies in mitochondrial turnover during
temperature transitions.
Significance: Brown adipocytes from iBAT or
WAT may determine energy balance linked to
obesity.
ABSTRACT
To determine the differences between
brown adipocytes from iBAT and those induced
in white adipose tissue (WAT) with respect to
their thermogenic capacity, we examined two
essential characteristics: the dynamics of
mitochondrial turnover during reversible
transitions from 29°C to 4°C, and the
quantitative relationship between UCP1 and
selected subunits of mitochondrial respiratory
complex (RC) in the fully recruited state. To
follow the kinetics of induction and involution
of mitochondria, we determined the expression
pattern of UCP1 and other mitochondrial
proteins, as well as analyzed mtDNA content,
after cold stimulation and reacclimation to
thermoneutrality. We showed that UCP1
turnover is very different in iBAT and
ingWAT; the former showed minimal changes
in protein content, while the latter major
changes. Similarly, in iBAT both mtDNA
content and the expression of mitochondrial
proteins were stable and expressed at similar
levels during reversible transitions from 29°C
to 4°C, whereas ingWAT revealed dynamic
changes. Further analysis showed that in iBAT,
the expression patterns for UCP1 and other
mitochondrial proteins resembled each other,
whereas in ingWAT, UCP1 varied about 100-
fold during the transition from cold to warmth,
and no other mitochondrial proteins matched
UCP1. In turn, quantitative analysis of
thermogenic capacity determined by estimating
the proportion of UCP1 to RC components,
showed no significant differences between
brown and brite adipocytes, suggesting similar
thermogenic potentiality. Our results indicate
that dynamics of brown adipocytes turnover
during reversible transition from warm to cold
may determine the thermogenic capacity of an
individual in a changing temperature
environment.
Traditionally, there are two functionally
different types of adipose tissue in mammals,
white (WAT) and interscapular brown (iBAT).
WAT is primarily engaged in the storage of energy
in the form of triglycerides, while iBAT is
specialized in burning fat stores to produce heat to
http://www.jbc.org/cgi/doi/10.1074/jbc.M115.637785The latest version is at JBC Papers in Press. Published on February 1, 2015 as Manuscript M115.637785
Copyright 2015 by The American Society for Biochemistry and Molecular Biology, Inc.
by guest on June 5, 2018http://w
ww
.jbc.org/D
ownloaded from
2
maintain body temperature. The uncoupling
protein 1 (UCP1), located in the inner membrane
of brown adipocytes mitochondria, mediates the
process of thermogenesis by uncoupling oxidative
phosphorylation. It has been proposed that brown
adipose tissue is involved in regulation of energy
balance and body fat content when an individual is
in positive energy balance as a consequence of
living in an obesogenic environment (1,2). This
mechanism for brown fat thermogenesis is largely
based on administration of drugs and on transgenic
models in which the regulation of Ucp1 expression
and induction of brown adipocytes under normal
physiological regulation has been disrupted (3).
Recently increasing attention is being directed to
the fact that brown adipocytes exist in two forms:
those residing in iBAT and those in WAT of adult
mice where they can be induced with a broad
range of reagents and environmental conditions,
thereby providing increased opportunities to
regulate their thermogenic potentiality (4).
Brown adipocytes that initially arise in the
fetus and form discrete depots in iBAT and those
that are induced to varying extent in WAT arise
from distinct developmental origins. The former
cells arise from a Myf5 positive progenitors that
differentiate into muscle or brown adipocytes
depending on the expression of PRDM16 (5). The
second type of brown adipocytes found in WAT,
also named “beige” or “brite” cells (6,7), belong to
a cell lineage different from classical brown cells:
they first emerge in WAT as a diffuse variable
population of cells between 10 and 21 days of age
in rodents, and then disappear spontaneously by 30
days of age, but can be induced in WAT of adult
animals by -adrenergic stimulation, such as cold
acclimation or treatment with a ß3-adrenergic
receptor agonist (8). Genetic variation in the
induction of brown adipocytes in WAT but not in
iBAT also point to separate developmental origins
for these cells (8). There are two main hypotheses
concerning the developmental origin of brite
adipocytes. The first one is that the white fat
depots are seeded with progenitor cells that are
activated and differentiate into brown adipocytes
during cold exposure or other means of adrenergic
stimulation (9). A second model is based upon the
reversible activation of the brown adipocyte
program that converts a white adipocyte to brown
adipocyte. Changes in the microenvironment,
including the density of vascularization, the types
of stromal-vascular cells in the adipocyte’s
vicinity, adrenergic nerve fibers, may become a
determining factor for a white adipocyte to
differentiate into a brown adipocyte (10,11).
Despite the similarities in the phenotype of
brown adipocytes in WAT and iBAT, and their
expression of UCP1 protein, the mechanisms to
induce brown adipocytes obviously depends on
their developmental origin, since the signaling and
transcription pathways, as well as gene expression
profiles, appear different, e.g. allelic differences at
genetic loci among different inbred strains of mice
control the amount of UCP1-positive cells in the
white fat but have no effects in classical iBAT
(8,12-15). Therefore, it is not clear whether the
thermogenic potentiality of brite adipocytes differs
from that of classical brown adipocytes residing in
interscapular brown fat.
To date there is little quantitative data,
even in mice, concerning differences of
thermogenic function of brite cells compared to
classical brown adipocytes, because studies of
brite adipocytes are complicated by problems
regarding the isolation of an enriched brown
adipocyte cell population. Additionally, studies of
brite adipose tissue thermogenesis have mostly
focused on Ucp1 mRNA measurements, but the
metabolic relevance of such expression, at least for
the Ucp1 gene, is questionable (16). Comparative
estimates of thermogenic capacity may be evident
from the relative content of UCP1 protein to other
components of the mitochondrial respiratory
complex. This possibility follows from the fact
that the reduced content of the F1F0-ATPase and
ability to produce ATP through oxidative
phosphorylation is much lower in brown fat
mitochondria than in heart or muscle mitochondria
(17). Since mitochondria of BAT have evolved to
maximize the high levels of UCP1 for heat
generation and not ATP production, the
quantitative relationship of UCP1 to the
respiratory components is an indicator of
thermogenic potential. Thus, in this study, to
evaluate the thermogenic capacity of brite versus
brown adipocytes, we have used immnunoblots to
determine the ratio of UCP1 to selective members
of the respiratory chain in mitochondria isolated
from brown adipocytes of inguinal fat and
classical brown adipocytes. This comparison was
carried out after cold adaptation at 4°C over a
period of 15 days, followed by de-induction at
by guest on June 5, 2018http://w
ww
.jbc.org/D
ownloaded from

3
thermoneutrality (29°C). To accommodate the
large difference in brown adipocytes content that
can exist between white fat depots and
interscapular brown fat, the study was facilitated
by the use of the AXB8 recombinant inbred strain
of mice, which are genetically the highest known
inducers of brite cells (13).
We found that in mitochondria isolated
from ingWAT of cold-acclimated mice, UCP1
protein levels reached 60% of that obtained in
brown-fat mitochondria, but the ratio of UCP1 to
the representative subunits of the respiratory chain
was remarkably similar between the iBAT and
ingWAT under cold conditions. Thus, the results
suggest that the thermogenic capacity of brown
adipocytes from iBAT and white fat depots is
remarkably similar.
A second objective of this study was to
determine the molecular basis for the differences
in involution of brown adipocytes occurring in
classical iBAT and ingWAT during reversible
transitions from 29oC to 4°C. The experiment
indicates that while the thermogenic potential of
mitochondria in brown and brite adipocytes is
similar, a major difference exists in determining
the fate of the brown adipocyte phenotypes during
the reversible transitions between thermoneutrality
and the cold.
MATERIALS AND METHODS
Animals and Experimental Design: We
compared the induction of Ucp1 mRNA and
protein expression in ingWAT of AXB8
recombinant inbred mice, because ingWAT
undergoes a facile conversion of its white
adipocyte population to brown adipocytes and
shows the highest levels of Ucp1 mRNA after cold
stimulation (7,13).
Breeding pairs of the AXB8 strain were
fed a standard chow diet (13.2 kcal% fat, 62.1
kcal% carbohydrate and 24.7% protein; Picolab
5053 Rodent Diet 20) ad libitum with 12-hour
light and dark cycles. All parental mice and their
pups were kept at room temperature (23oC). Pups
were weaned at 21 days of age into the same
conditions. Both male and female mice were used
for cold/warm acclimation experiments.
Eight weeks-old mice were singly housed and
initially acclimated to a thermoneutral temperature
(29oC) for 7 days. These mice were used as
controls. It should be noted that 8 week-old mice
raised at an ambient temperature of 23°C have
levels of UCP1 that are very similar to those in
mice maintained at 29°C.
The induction and involution of brown
adipocytes of ingWAT and iBAT: This
experiment was conducted with the same animals
for ingWAT and iBAT. Following initial
acclimation for 7 days at 29°C, mice were
maintained at 4oC for increasing periods of time
that ranged from 0.5 to 10 days, and then re-
acclimated to 29oC for up to 21 days in order to
stimulate their involution. Animals (four at each
time point) were sacrificed after initial acclimation
and at 0.5, 1, 2, 3, 5, 7 and 10th day of cold
exposure, and at 1, 3, 5, 7, 14 and 21th day of re-
acclimation at thermoneutrality. iBAT and
ingWAT tissues were dissected immediately after
killing, thoroughly rinsed with phosphate buffer to
remove traces of blood and immediately frozen in
liquid nitrogen and stored at -80oC.
The thermogenic capacity of brown adipocytes
in ingWAT and iBAT: To establish the maximal
level of the brown adipocyte phenotype induction
in ingWAT and iBAT, mice initially acclimated at
29oC were exposed to 4
oC and selected animals
were sacrificed after 5, 10, 15, 20, 25 days of cold
exposure. Further steps were performed as
described above. To estimate the relative
thermogenic capacity of brown adipocytes in
iBAT and ingWAT, day 15th of cold exposure was
chosen for detailed investigation, at which time
UCP1 expression reached the peak of expression.
Freshly dissected iBAT and ingWAT (one pad per
mice) from four mice per time point were
individually pooled and mitochondria were
isolated.
Light microscopy: Freshly dissected iBAT and
ingWAT were fixed in 10% (w/v) formalin and
embedded in paraffin prior to sectioning. The 10-
µm sections were stained with eosin/hematoxylin.
Measurement of mitochondrial DNA content:
Mitochondrial DNA (mtDNA) content in iBAT
and ingWAT was determined at three time points:
after 7 days of initial acclimation at 29oC, 10 days
of cold exposure and 14 days of reacclimation to
29oC (five animals per group). Tissues were
prepared as described previously. Total DNA was
by guest on June 5, 2018http://w
ww
.jbc.org/D
ownloaded from

4
isolated by proteinase K digestion followed by
phenol/chloroform extraction and ethanol
precipitation. DNA was diluted to 20 ng/µl in
nuclease free water (Sigma), and then diluted 1:10
(2 ng/µl) just before use. 5 µl of diluted DNA (10
ng) was used in a 25 µl of the reaction mixture.
The relative amounts of mitochondrial and nuclear
DNA were determined by real-time PCR using
primers specific to mtDNA-encoded cytochrome b
and to nuclear DNA-encoded cyclophilin,
respectively. The PCR was performed in a ViiA 7
Real-Time PCR System (Applied Biosystems)
using the SYBR Green PCR Kit (Applied
Biosystems). Serial dilutions of mixed DNA from
iBAT and ingWAT were analyzed in parallel to
obtain a standard curve. MtDNA content was
calculated from the ratio of cytochrome b to
cyclophilin quantity. The primer sequences are
available on request.
Isolation of mitochondria: Freshly dissected
iBAT and ingWAT were homogenized using a
Teflon-glass homogenizer in 10 vol of ice-cold
TES buffer (250 mM sucrose, 50 mM Tris-HCl
pH 7.4, 1 mM EDTA) supplemented with 1mM
PMSF and protease inhibitor cocktail (Sigma). All
steps were performed on ice. The homogenate was
centrifuged at 1000xg for 10 min. The infranatant
containing mitochondria was transferred into a
fresh tube and re-centrifuged at 1000xg for 10
min. Pellets from low-speed centrifugations were
re-suspended in 3 vol of TES buffer and again
centrifuged at 1000xg for 10 min. Supernatants
obtained from low-speed centrifugations were
transferred to a clean tube and centrifuged at
10,000xg for 10 min. The crude mitochondrial
pellet was re-suspended in 3 vol of the re-
suspension buffer (250 mM sucrose, 50 mM Tris-
HCl pH 7.4, 0.5 mM EDTA) supplemented with
1mM PMSF and protease inhibitor coctail
(Sigma), and centrifuged at 8,500xg for 10 min.
The final pellet was re-suspended in 100 µl of
resuspension buffer supplemented with 1mM
PMSF and protease inhibitors (Sigma). Protein
concentration was measured using the Bradford
reagent (Sigma). The mitochondrial suspension
was stored at -80oC.
Preparation of tissue lysates for Western
blotting: Frozen tissue was homogenized using a
Teflon-glass homogenizer in 5 vol of ice-cold
RIPA buffer (50 mM Tris/HCl, pH 7.4, 150 mM
NaCl, 1 mM EDTA, 0.1% SDS, 1% Nonidet P-40,
0,25% sodium deoxycholate) supplemented with
1mM PMSF and protease inhibitor coctail
(Sigma). The homogenate was incubated on ice for
1 hour and then centrifuged at 10,000xg for 15
min at 4oC. The clear supernatant was carefully
transferred to a new tube and protein concentration
was determined by the Bradford method. The
lysate was stored at −80°C for Western blot
analysis.
Western blotting: Proteins from the total tissue
lysate (30 µg) or mitochondrial fraction (15 µg)
were separated on a 12% or 15% SDS-PAGE gel
and transferred onto a nitrocellulose membrane.
The membrane was incubated for 2 h with
blocking solution from Li-COR and then
incubated overnight at 4oC with primary antibody
diluted in blocking solution supplemented with
0,1% (w/v) Tween-20. Primary antibodies used:
UCP1 (1:1000, ab23841, Abcam), VDAC1 (1:500,
sc-32063, Santa Cruz Biotechnology), COX IV
(1:2 000, ab14744, Abcam), cytochrome c (1:1
000, 11940, Cell Signaling), MitoProfile Total
OXPHOS Rodent WB Antibody Cocktail (1:250,
ab110413, Abcam), β-actin (1:10000, ab6276,
Abcam). After four 10-min. washes in PBS
(Sigma) supplemented with 0,1% (w/v) Tween-20,
the membrane was incubated with the
corresponding secondary antibody diluted in
blocking solution (1:10 000) supplemented with
0,1% (w/v) Tween-20 and 0.01% (w/v) SDS for 1
h at room temperature. The specific signals were
detected by the Odyssey Infrared Imaging System
(Li-COR, Lincoln, NE, USA). The resulting
images were quantified using Li-COR Image
Studio (version 2.0). Protein expression was
normalized to the internal control β-actin.
qPCR: Total RNA was isolated from tissues using
Tri-reagent according to the manufacturer’s
protocol (Molecular Research Center, Cincinnati,
OH). RNA was diluted to 20 ng/µl in nuclease free
water (Sigma), and then diluted 1:10 (2 ng/µl) in
nuclease free water just before use. 3 µl of diluted
RNA (6 ng) was used in a 10 µl reaction with a
single-reporter measurement. Pooled iBAT and
ingWAT RNA from eight mice was used as a
standard. Both standards and samples were run in
duplicate using 7900 Real-Time PCR System
by guest on June 5, 2018http://w
ww
.jbc.org/D
ownloaded from

5
(Applied Biosystems). Each transcript level was
normalized to the level of cyclophilin in the
sample. Primers of specific TaqMan assay primers
were obtained from Life Technologies and their
DNA sequences are available on request.
Statistical analysis: Data are presented as means
± std.dev. Statistical analysis was performed by
Student’s t test for single comparisons using
GraphPad Prism 6 software.
RESULTS
The brown adipocyte phenotype in ingWAT
and iBAT in the transition from the cold
environment to thermoneutrality
There are two essential characteristics of
brown adipocytes that define their capacity for
thermogenesis in a changing temperature
environment. One is the relative content or
stoichiometry of UCP1 to the respiratory
components, and the second determines the
dynamics of mitochondrial or brown adipocytes
turnover. We have assumed that mitochondria
turnover as a function of ambient temperature
occurs in a largely fixed population of brown
adipocytes in both iBAT and ingWAT (18). To
elucidate the changes in the brown adipocyte
phenotype as a consequence of changes in ambient
temperature, we utilized the protocol described in
Fig. 1A.
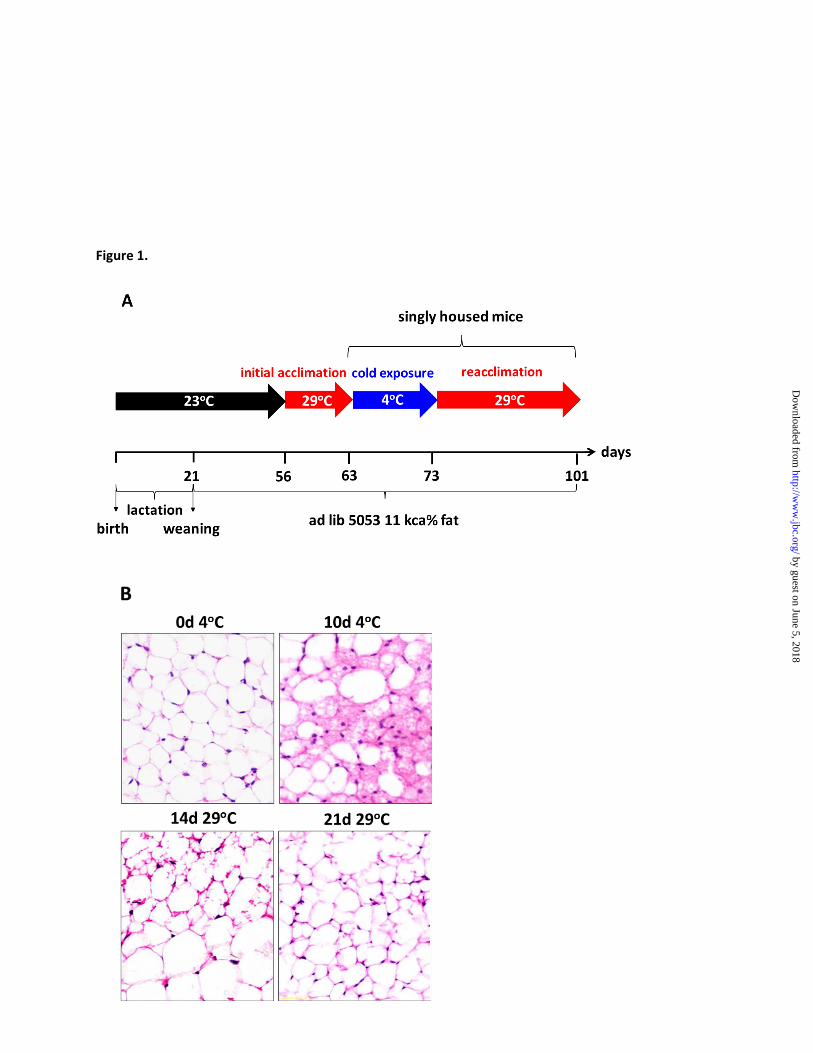
Histological images show the presence of
only unilocular adipocytes characteristic for white
fat after initial acclimation at 29°C (Fig. 1B, 0
days 4°C). But after 10 days of cold exposure,
large regions of the tissue were populated by cells
with the typical multilocular morphology of brown
adipocytes. This multilocular morphology was
substantially reduced after 14 days at 29°C and
completely lost after 21 days.
Synthesis and degradation of Ucp1 mRNA and
protein in ingWAT and iBAT
Ucp1 in ingWAT: The main hallmark of the
brown adipocyte phenotype within brown and
white fat depots is the expression of UCP1. We
determined the kinetics of induction and
regression of the UCP1 and other mitochondrial
components in brown adipocytes from iBAT and
inguinal WAT (ingWAT) during exposure to the
cold at 4°C and the return to thermoneutrality at
29°C as described in the methods.
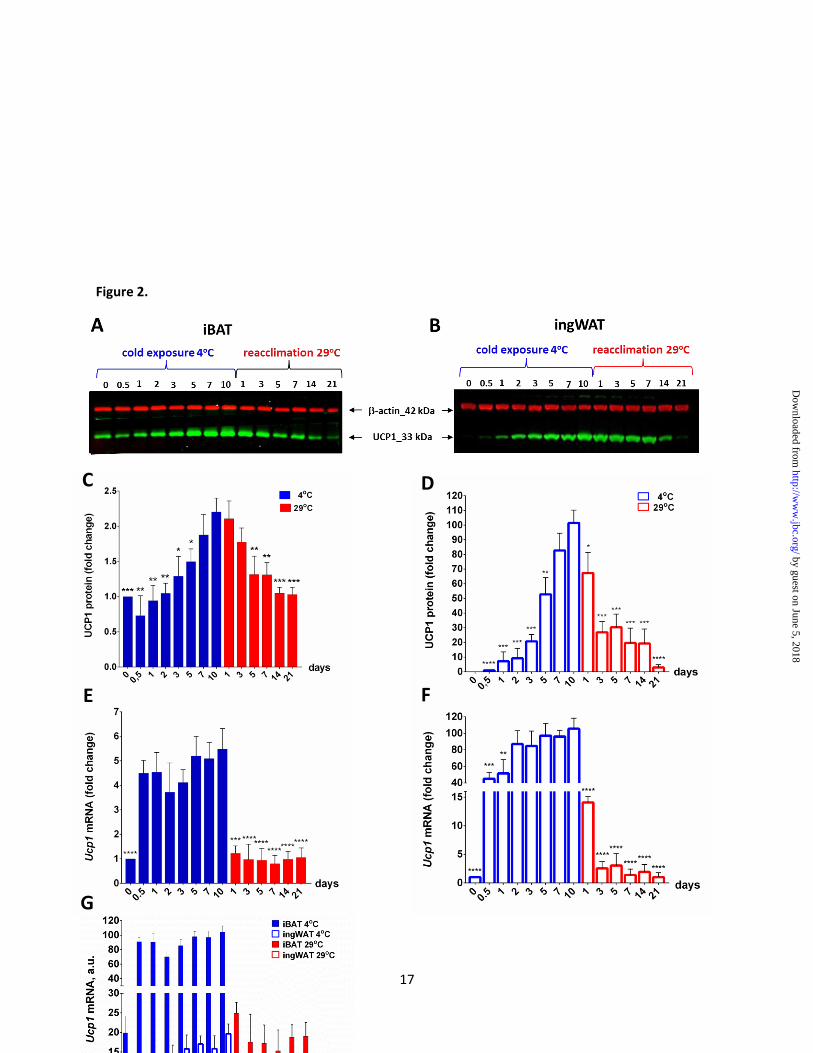
As shown on Fig. 2, immunoblot analysis
revealed no UCP1 signal in ingWAT of control
mice unexposed to the cold. Twelve hours after
being transferred to 4°C, UCP1 protein is first
detected and gradually increases during the
following 10 days of cold exposure, achieving
approximately 100-fold higher levels relative to
that measured after 12 hours. When animals were
returned to 29°C, the cold-induced levels of UCP1
began to decline within 1 day and after 21 days
reached the level initially observed at the start of
cold exposure. Ucp1 mRNA, in turn, was induced
to approximately 50% of maximal levels just after
12 hours at 4°C (Fig. 2F); whereas a comparable
induction of UCP1 protein required 5 days (Fig.
2D). Then Ucp1 mRNA level progressively
increased and after 10 days at 4oC a 100-fold
increase in expression was achieved (Fig. 2F). Re-
exposing mice to 29°C resulted in a precipitous
decline in Ucp1 mRNA levels in one day and a
return to pre-stimulation levels after 7 days at
29oC (Fig. 2F). In contrast, UCP1 protein declined
more slowly (Fig. 2D) possibly related to
stabilization of proteins imbedded in the
mitochondrial membrane (19). Additionally, it has
been reported that the half-life for UCP1 protein in
iBAT after prolonged cold exposure is about 200
times longer than that for mRNA (20). Despite
large differences in the kinetics of change in Ucp1
mRNA compared to the protein during
temperature transitions, the overall change of 100-
fold were similar for mRNA and protein.
Ucp1 in iBAT: In contrast to ingWAT, the
changes in UCP1 protein levels in iBAT during
the transitions between 29oC and 4
oC were small
(Fig. 2A, C). After 10 days of cold exposure,
UCP1 increased approximately 2- fold and then
returned to the pre-cold level after 14 days at 29oC
(Fig. 2C).
Under thermoneutral conditions, Ucp1
mRNA levels in iBAT were comparable to
induced levels in inguinal fat, and after 12 hours of
cold exposure a 6-fold increase of gene expression
rapidly occurred and remained stable for the entire
period in the cold (Fig. 2E). The mRNA levels in
iBAT decreased abruptly after the end of cold
stimulation, as in ingWAT, and reached pre-
stimulation levels after 1 day at 29oC, while
by guest on June 5, 2018http://w
ww
.jbc.org/D
ownloaded from
6
protein levels did not differ significantly from that
in cold conditions at this time point (Fig. 2C, E).
However, unlike iBAT which in thermoneutral
conditions sustains about 20% of induced Ucp1
mRNA levels, in ingWAT the Ucp1 mRNA levels
are undetectable, constituting a fundamental
difference in mechanisms regulating Ucp1 mRNA
levels in iBAT vs. inguinal fat.
Thus, upon cold exposure, both iBAT and
ingWAT responded with large induction of Ucp1
gene expression; however higher absolute levels
were reached in iBAT. Although the fold
induction in the brite adipocytes was greater (100-
fold), this is simply a consequence of the virtual
absence of Ucp1 mRNA expression in the
ingWAT of mice at thermoneutrality. It is
noteworthy that the onset and kinetics of the
transcriptional response to changes in ambient
temperature are similar for iBAT and ingWAT
(Fig. 2G).
Mitochondrial respiratory proteins: induction
in the cold (4°C) and degradation after
rewarming (29oC)
We have shown above that in the
transition from the cold to thermoneutrality, the
fold induction of Ucp1 in iBAT was modest at
both the mRNA (6-fold) and the protein (2-fold)
levels, whereas the fold induction in ingWAT was
>100 for mRNA and protein. Given the pivotal
role of the mitochondria in the function of brown
adipocytes, the above results set up an interesting
situation, in which it is possible that the kinetics of
induction support a simple economic model for
cold adaptation in which mitochondria are
degraded by mitophagy at thermoneutrality and
replaced by mitochondrial biogenesis upon
subsequent adrenergic stimulation in the cold,
whereas other subcellular components of the
brown adipocyte are preserved. Mechanisms for
controlling expression of genes for Ucp1 and
components of mitochondrial respiration would be
sufficient without whole cell turnover or renewal,
which seems to be the prevailing model for brown
adipocyte turnover.
As was shown above, UCP1 turnover in
the transition from cold to warm is very different
in iBAT and ingWAT. The former showed
minimal changes in protein content, while the
latter major changes. Thus, to better understand
the turnover states of brown adipocytes from
ingWAT and iBAT of cold-exposed and re-
warmed mice, we analyzed proteins of the
mitochondrial respiratory apparatus that varied in
their location within the mitochondria.
Additionally, we assessed whether patterns of
protein expression were linked to sub-
mitochondrial location. These include VDAC1 of
the outer mitochondrial membrane, cytochrome c,
which is loosely associated with the inner
membrane and and COX IV localized in the inner
mitochondrial membrane. Other representative
subunits of the respiratory complexes (RC)
including NDUFB8 (RC I), SDHB (RC II),
UQCRC2 (RC III), COX IV (RC IV), MTCO1
(RC IV) and ATP5A (RC V) were selected
because of the availability of antibodies.
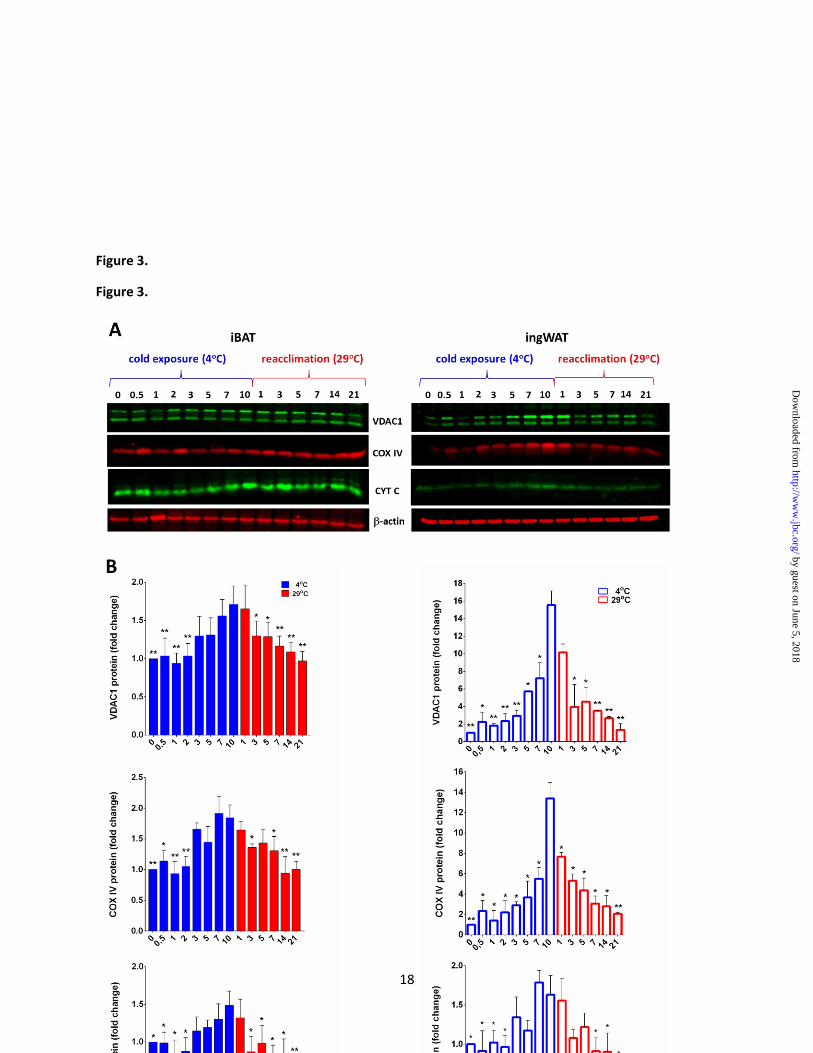
As evident in Fig. 3, in ingWAT the
expression patterns of VDAC1 and COX IV are
very similar to UCP1 (Fig. 2B), although the fold
induction is much lower than UCP1 (about 16 for
VDAC1 and 14 for COX IV). An exception is
cytochrome c, whose expression is stable in both
cold and warm conditions. In iBAT, on the other
hand, the expression profiles of these
mitochondrial proteins are nearly constant (Fig. 3).
An extension of this analysis to selected subunits
of the mitochondrial respiratory complexes
showed that in iBAT the patterns for UCP1 and
selected mitochondrial proteins resembled each
other (Fig. 4 and Fig. 5A). However, when a
similar comparative analysis was done for inguinal
fat, where the UCP1 varied about 100-fold during
the transition from cold to warmth, no other
proteins matched UCP1. Even if you keep in mind
that in inguinal fat non-brite cells with
mitochondria are present, there are proteins in
respiratory complexes, for example selected
components of RC II and RC V, that do not
significantly change levels of expression in going
from the cold to the warm (Fig. 4 and Fig. 5A).
One possible explanation for our findings is the
existence of different mechanisms of turnover for
mitochondrial proteins associated with brown
adipocytes (21-26) or, as suggested by
Klingenspor et al., up-regulation during cold
stimulation is not uniform for all subunits of each
RC (27). This may also suggest critical and rate-
limiting roles for specific subunits in the
thermogenic process.
A characteristic feature of brown-fat
mitochondria versus white-fat mitochondria is a
by guest on June 5, 2018http://w
ww
.jbc.org/D
ownloaded from
7
low content of the F0F1-ATP synthase (RC V),
because in brown adipocytes ATP synthesis is
bypassed for heat generation. Therefore we
compared the mRNA expression level of the two
subunits of ATP synthase, Atp5g1 and Atp5a1, in
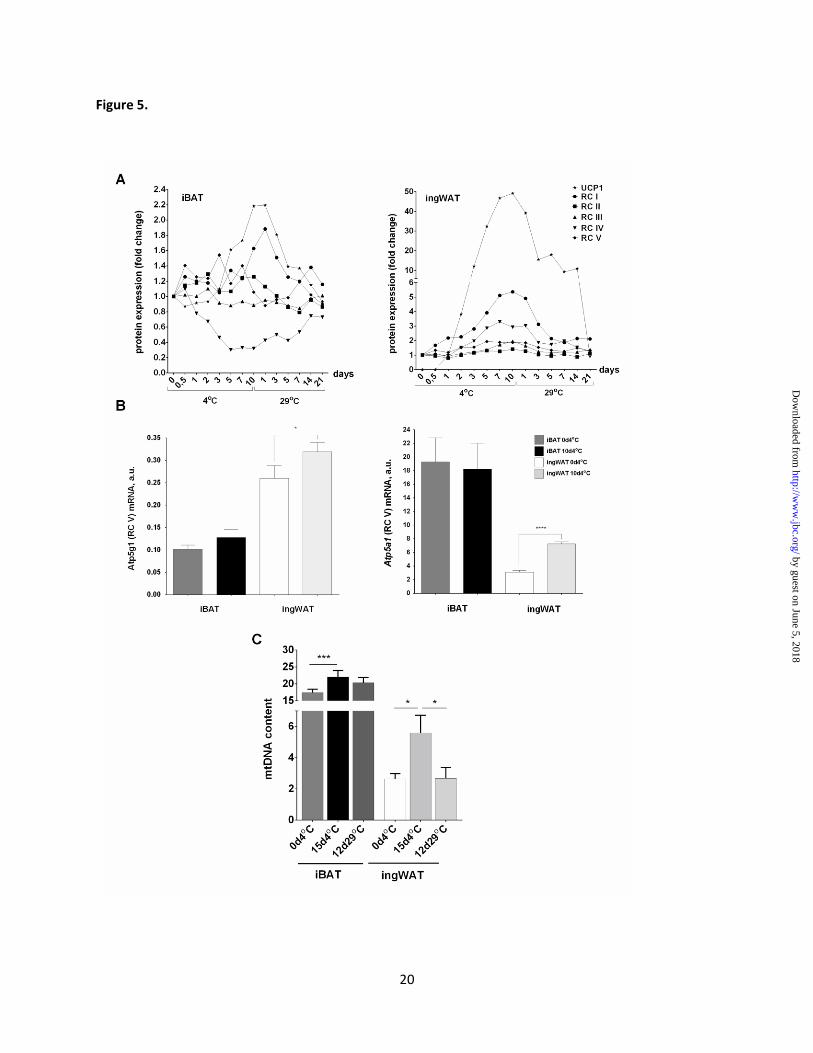
brown and white fat. We found that mRNA level
of the Atp5g1 was 2.5-fold higher in ingWAT
compared to iBAT in both cold and
thermoneutrality conditions (Fig. 5B).
Interestingly, mRNA levels of Atp5a1 are much
higher in cold and warm conditions compared to
Atp5g1 in both iBAT and ingWAT, however, they
reached higher values in brown fat (6-fold higher
expression in 29oC and 2.5 higher expression in
4oC compared to ingWAT) (Fig. 5B). These data
are consistent with previous reports where almost
all subunits of the ATP synthase are expressed at
high mRNA levels (as are all other OXPHOS
proteins) in brown-fat mitochondria, the exception
is the P1 isoform of subunit c (c-F0 subunit P1-
isoform or ATP5G1). The level of ATP5G1
mRNA and protein is exceptionally low in brown
adipocytes and is the rate limiting component
determining the low activity of the ATPase
complex (28-30). Interestingly, in iBAT levels of
ATP synthase subunits were unchanged after cold
stimulation, whereas in ingWAT we noted an
increase of expression of both Atp5a1 and Atp5g1
subunits (Fig. 5B).
In addition to overexpression of the UCP1
protein, the thermogenic recruitment process is
accompanied by a major increase in mitochondrial
biogenesis (31). The equivalent to the
mitochondria number is the mitochondria DNA
(mtDNA) content, and changes in the mtDNA
reflect fluctuation in the mitochondria number in
the cell. In our experiment, mtDNA content
increased 2-fold after 10 days of cold exposure in
ingWAT, and then decreased after 14 days of re-
acclimation to a pre-stimulation level (Fig. 5C). In
iBAT, a slight increase in the amount of
cytochrome b DNA after 10 days at 4oC was
followed by a statistically insignificant decrease at
14th
day in 29oC (Fig. 5C). However, total amount
of mtDNA was 4-fold higher in iBAT compared to
ingWAT after 10 days of cold exposure.
It is reasonable to assume that both
mtDNA content and the expression of
mitochondrial proteins in iBAT are stable and
present at similar levels at 4 and 29°C (Fig. 2A, C;
Fig. 3; Fig. 4), whereas in ingWAT, the expression
of UCP1 and mitochondrial biogenesis, as
reflected by up-regulation of mitochondrial
markers (VDAC1 and COX IV), as well as
mtDNA content, reveals dynamic changes during
reversible transitions from 29oC to 4°C. Thus, a
defining difference in brown adipocytes from
WAT and iBAT concerns the susceptibility of
mitochondrial turnover and stability for
components of mitochondria, and indicates that
iBAT possesses comparatively similar
thermogenic capacity in cold and thermoneutral
environment, whereas in ingWAT thermogenic
potential is temporary and occurs only at low
ambient temperature.
Thermogenic potential of brown adipocytes in
iBAT and ingWAT
The relative thermogenic capacity of
brown adipocytes in iBAT and those in white fat
was estimated by determining the proportion of
UCP1 protein expression to components of RC in
mitochondria isolated from iBAT and ingWAT.
This comparison was carried out according to a
protocol aimed at achieving the maximal level of
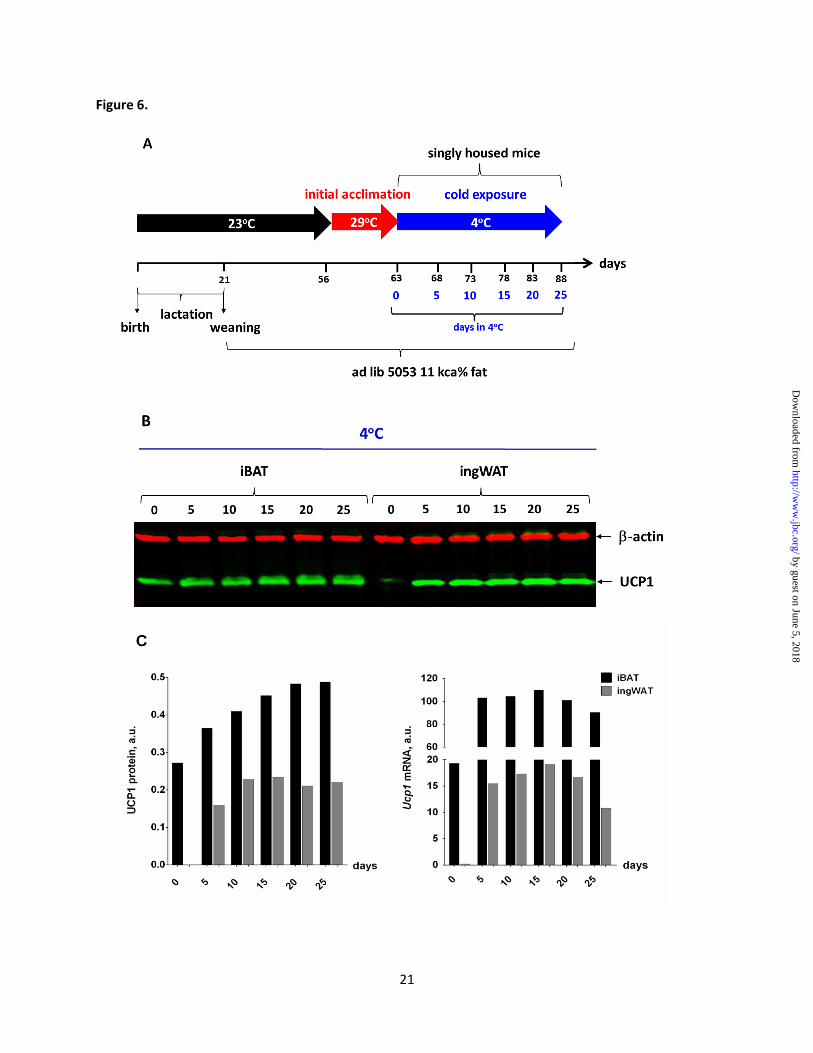
Ucp1 expression (Fig. 6A). The time of cold
acclimation needed for the UCP1 protein and
mRNA to reach their maximal level in ingWAT
was 15 days (Fig. 6B and C), therefore this time
point was chosen for further experiments.
Mitochondrial fractions were isolated from
iBAT and ingWAT of two groups of mice, one
exposed to 29oC for 7 days (in text 0 days at 4°C)
and the other exposed to 4oC for 15 days.
Expression levels of UCP1 and representative
subunits of the mitochondrial RC I-V were
determined using Western blot analysis (Fig. 7A,
B, C). Expression of UCP1 in mitochondria
isolated from ingWAT of cold-acclimated mice
reached 60% of the level in iBAT mitochondria
(Fig. 7B).
To estimate the ratio of UCP1 to RC
components in brite adipocytes, protein expression
values from 0 days at 4°C were subtracted from
values obtained after 15 days of cold exposure.
This value is variable because the reduction in
these respiratory components is not constant, as
evident in Fig. 4 and 5A. It was assumed that at
29oC brown adipocytes are not induced within
ingWAT, and the signals for the RC components
are derived from white adipocytes and non-
adipocytes in the tissue. Thus expression levels of
by guest on June 5, 2018http://w
ww
.jbc.org/D
ownloaded from
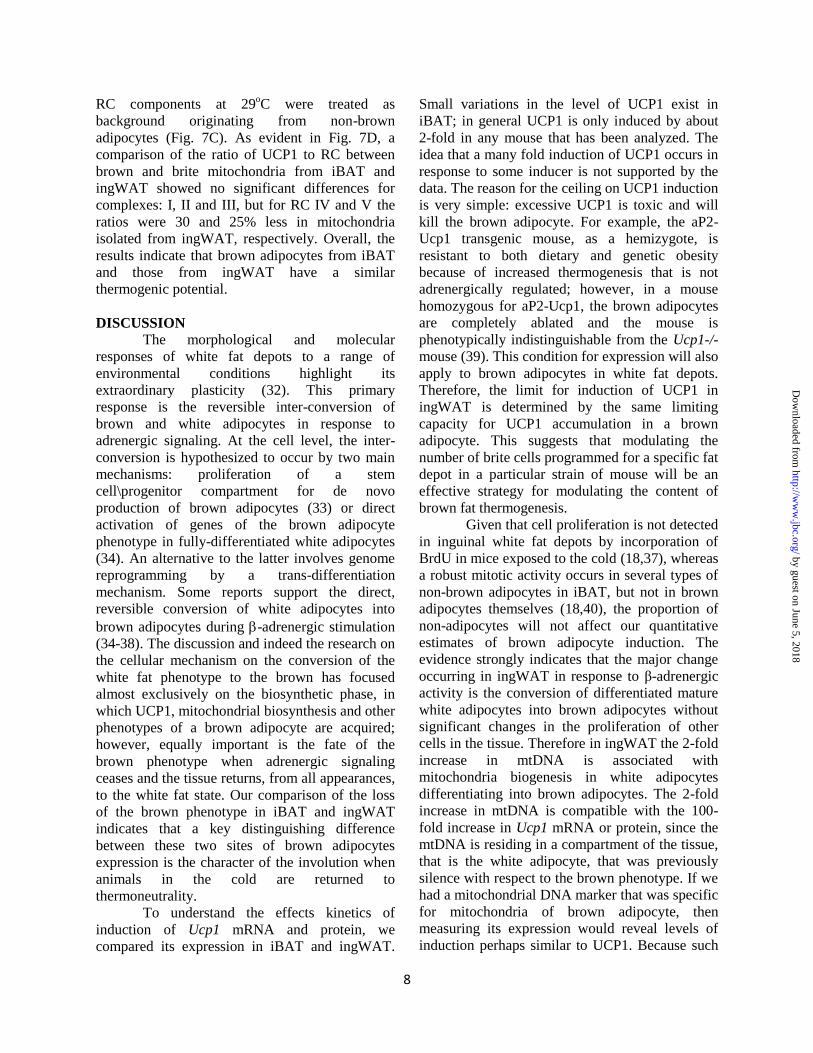
8
RC components at 29oC were treated as
background originating from non-brown
adipocytes (Fig. 7C). As evident in Fig. 7D, a
comparison of the ratio of UCP1 to RC between
brown and brite mitochondria from iBAT and
ingWAT showed no significant differences for
complexes: I, II and III, but for RC IV and V the
ratios were 30 and 25% less in mitochondria
isolated from ingWAT, respectively. Overall, the
results indicate that brown adipocytes from iBAT
and those from ingWAT have a similar
thermogenic potential.
DISCUSSION
The morphological and molecular
responses of white fat depots to a range of
environmental conditions highlight its
extraordinary plasticity (32). This primary
response is the reversible inter-conversion of
brown and white adipocytes in response to
adrenergic signaling. At the cell level, the inter-
conversion is hypothesized to occur by two main
mechanisms: proliferation of a stem
cell\progenitor compartment for de novo
production of brown adipocytes (33) or direct
activation of genes of the brown adipocyte
phenotype in fully-differentiated white adipocytes
(34). An alternative to the latter involves genome
reprogramming by a trans-differentiation
mechanism. Some reports support the direct,
reversible conversion of white adipocytes into
brown adipocytes during -adrenergic stimulation
(34-38). The discussion and indeed the research on
the cellular mechanism on the conversion of the
white fat phenotype to the brown has focused
almost exclusively on the biosynthetic phase, in
which UCP1, mitochondrial biosynthesis and other
phenotypes of a brown adipocyte are acquired;
however, equally important is the fate of the
brown phenotype when adrenergic signaling
ceases and the tissue returns, from all appearances,
to the white fat state. Our comparison of the loss
of the brown phenotype in iBAT and ingWAT
indicates that a key distinguishing difference
between these two sites of brown adipocytes
expression is the character of the involution when
animals in the cold are returned to
thermoneutrality.
To understand the effects kinetics of
induction of Ucp1 mRNA and protein, we
compared its expression in iBAT and ingWAT.
Small variations in the level of UCP1 exist in
iBAT; in general UCP1 is only induced by about
2-fold in any mouse that has been analyzed. The
idea that a many fold induction of UCP1 occurs in
response to some inducer is not supported by the
data. The reason for the ceiling on UCP1 induction
is very simple: excessive UCP1 is toxic and will
kill the brown adipocyte. For example, the aP2-
Ucp1 transgenic mouse, as a hemizygote, is
resistant to both dietary and genetic obesity
because of increased thermogenesis that is not
adrenergically regulated; however, in a mouse
homozygous for aP2-Ucp1, the brown adipocytes
are completely ablated and the mouse is
phenotypically indistinguishable from the Ucp1-/-
mouse (39). This condition for expression will also
apply to brown adipocytes in white fat depots.
Therefore, the limit for induction of UCP1 in
ingWAT is determined by the same limiting
capacity for UCP1 accumulation in a brown
adipocyte. This suggests that modulating the
number of brite cells programmed for a specific fat
depot in a particular strain of mouse will be an
effective strategy for modulating the content of
brown fat thermogenesis.
Given that cell proliferation is not detected
in inguinal white fat depots by incorporation of
BrdU in mice exposed to the cold (18,37), whereas
a robust mitotic activity occurs in several types of
non-brown adipocytes in iBAT, but not in brown
adipocytes themselves (18,40), the proportion of
non-adipocytes will not affect our quantitative
estimates of brown adipocyte induction. The
evidence strongly indicates that the major change
occurring in ingWAT in response to β-adrenergic
activity is the conversion of differentiated mature
white adipocytes into brown adipocytes without
significant changes in the proliferation of other
cells in the tissue. Therefore in ingWAT the 2-fold
increase in mtDNA is associated with
mitochondria biogenesis in white adipocytes
differentiating into brown adipocytes. The 2-fold
increase in mtDNA is compatible with the 100-
fold increase in Ucp1 mRNA or protein, since the
mtDNA is residing in a compartment of the tissue,
that is the white adipocyte, that was previously
silence with respect to the brown phenotype. If we
had a mitochondrial DNA marker that was specific
for mitochondria of brown adipocyte, then
measuring its expression would reveal levels of
induction perhaps similar to UCP1. Because such
by guest on June 5, 2018http://w
ww
.jbc.org/D
ownloaded from

9
a marker does not exist, it does not mean that the
mitochondria in brown fat may not be induced a
100-fold like UCP1. However, it is likely to be
lower, because there is not a uniform rate of
degradation of the components of mitochondria as
shown in Figure 5A. A ratio of induction
characteristic for mtDNA will occur whether white
fat depots have a high or low number of white fat
cells capable of differentiating into brown
adipocytes, but their quantification will be
obscured in fat tissue with low numbers of brown
adipocytes. The number of cells capable of
differentiating will determine the absolute level of
UCP1. Since the brown adipocytes in iBAT are
also not proliferating, the induction, which is
approximately 2-fold for UCP1, but does not
involve mitochondrial DNA proliferation,
represents the adrenergically stimulated up-
regulation of the brown phenotype of the resident
brown adipocytes in iBAT.
To follow the mechanism of brown
adipocytes induction during cold stimulation and
then its involution in thermoneutrality, we
performed a time course analysis of the expression
of UCP1 protein, the crucial functional marker of
cells capable of non-shivering thermogenesis, and
selected mitochondrial proteins involved in
electron transport activity. As shown in Fig. 2B,
D, UCP1 was undetected in ingWAT of mice
adapted to 29°C, but during cold exposure levels
gradually increased 100-fold over 10 days. As
shown in Fig. 7 this maximal level of UCP1
expression is similar to that accumulating in
brown adipocytes of iBAT after 15 days in the
cold. This temperature-sensitive induction is
reversible, since UCP1 returned to pre-stimulation
levels when the temperature was returned to 29oC.
In contrast to ingWAT, brown adipocyte content
estimated by the level of UCP1 protein expression
in iBAT is relatively stable. Similar stability was
previously found in mal-nourished mice during the
lactation period (41). Additionally, Fig. 3 and Fig.
4 show that the induction/involution of brite
adipocytes and classical brown adipocytes resulted
in parallel increases/decreases of UCP1 with the
expression pattern of other mitochondrial proteins:
VDAC1, COX IV and mitochondrial respiratory
complex I, II, III and IV. However, the fold
change for these proteins in iBAT was generally
much smaller than that observed in ingWAT. An
exception is that some of the proteins, SDHB and
ATP5A remained relatively stable in both
ingWAT and iBAT. If the goal of this study is to
uncover mechanisms for essentially the complete
loss of UCP1 in brite cells and retention of the
complexes in iBAT, what is the meaning of the
retention of individual components in ingWAT
with normal white fat morphology? In a
quantitative study of mitochondrial proteins in
iBAT and WAT Forner et al. (2009) suggested the
presence of heterogeneity of induction for each of
the subunits of each respiratory complex and
indicated specific, rate limiting functions for
particular subunits of respiratory chain in the
process of thermogenesis. Also the existence of
different mechanisms of turnover for
mitochondrial proteins may explain the retention
of individual components of RC, e.g. the PINK1-
Parkin pathway in Drosophila promotes selective
turnover of membrane-bound RC subunits in a
manner independent of conventional autophagy
(23). Additionally, it has been proposed that the
similarity of the turnover rate for UCP1 and other
mitochondrial proteins is the result of a
stimulatory effect of UCP1 on mitochondrial
biogenesis (42) and parallel proteolytic rates, as
was shown by Desautels and colleagues (43,44).
In general, according to previous
published data and the above results, iBAT
maintains UCP1-dependent thermogenic capacity
even in a thermoneutral environment, but the
thermogenic capacity in ingWAT is transient,
active at low ambient temperature or upon
stimulation with β-adrenergic agonists, but
essentially non-existent above 23°C.
Our experiment to estimate the
thermogenic content of brown adipocytes from
iBAT and WAT resembles a recent study by
Nedergaard and colleagues (45), and both studies
indicate that the thermogenic capacity is similar.
Furthermore, the kinetic response of the Ucp1
gene transcription and the rate of degradation of
the components determining the brown phenotype
in the two cells types in the transition from the
warm to the cold and vice-versa is similar. The
differences between brown and brite cells are
found in the process of involution when mice at a
fully cold-induced state are returned to
thermoneutrality. At the mRNA level a
mechanism exists that maintains the basal level of
Ucp1 mRNA in iBAT to 20% of the fully induced
level, whereas the Ucp1 mRNA in ingWAT is
by guest on June 5, 2018http://w
ww
.jbc.org/D
ownloaded from
10
completely degraded. At the protein level, UCP1
is maintain at 50% of its maximally induced level
in iBAT, whereas UCP1 in ingWAT is completely
degraded. An important similarity between iBAT
and WAT is the kinetic response of Ucp1 mRNA
induction on cold exposure which is virtually
indistinguishable with 50% of maximal levels
achieved in 12 hours. These results complement
accumulating evidence that classical brown and
brite adipocytes are not the same cell phenotype,
either developmentally or in terms of selective
biomarker profiles, although they share the same
mechanism of induction (noradrenergic-mediated
induction by cold), the same capacity for
thermogenesis and the primary purpose, that is
protection of body temperature by non-shivering
thermogenesis (7,9,45,46). The thermogenic
potential of a fully differentiated brown adipocyte
in iBAT and WAT may be equivalent at the tissue
level in an experiment with forced cold adaptation.
However, because of differences in the stability of
the brown phenotype in iBAT vs. brite cells, in a
normal living environment with constantly
fluctuating ambient temperature the thermogenic
potential could be very different depending on
which type of brown adipocyte resides in the
tissue.
REFERENCES
1. Rothwell, N. J., and Stock, M. J. (1979) Regulation of energy balance in two models of reversible obesity in the rat. Journal of comparative and physiological psychology 93, 1024-1034
2. Cannon, B., and Nedergaard, J. (2004) Brown adipose tissue: function and physiological significance. Physiological reviews 84, 277-359
3. Wu, J., Cohen, P., and Spiegelman, B. M. (2013) Adaptive thermogenesis in adipocytes: Is beige the new brown? Gene Dev 27, 234-250
4. Kozak, L. P., and Koza, R. A. (2010) The genetics of brown adipose tissue. Progress in molecular biology and translational science 94, 75-123
5. Seale, P., Bjork, B., Yang, W., Kajimura, S., Chin, S., Kuang, S., Scime, A., Devarakonda, S., Conroe, H. M., Erdjument-Bromage, H., Tempst, P., Rudnicki, M. A., Beier, D. R., and Spiegelman, B. M. (2008) PRDM16 controls a brown fat/skeletal muscle switch. Nature 454, 961-967
6. Petrovic, N., Walden, T. B., Shabalina, I. G., Timmons, J. A., Cannon, B., and Nedergaard, J. (2010) Chronic Peroxisome Proliferator-activated Receptor gamma (PPAR gamma) Activation of Epididymally Derived White Adipocyte Cultures Reveals a Population of Thermogenically Competent, UCP1-containing Adipocytes Molecularly Distinct from Classic Brown Adipocytes. J Biol Chem 285, 7153-7164
7. Walden, T. B., Hansen, I. R., Timmons, J. A., Cannon, B., and Nedergaard, J. (2012) Recruited vs. nonrecruited molecular signatures of brown, "brite," and white adipose tissues. American journal of physiology. Endocrinology and metabolism 302, E19-31
8. Xue, B. Z., Rim, J. S., Hogan, J. C., Coulter, A. A., Koza, R. A., and Kozak, L. P. (2007) Genetic variability affects the development of brown adipocytes in white fat but not in interscapular brown fat. J Lipid Res 48, 41-51
9. Wu, J., Bostrom, P., Sparks, L. M., Ye, L., Choi, J. H., Giang, A. H., Khandekar, M., Virtanen, K. A., Nuutila, P., Schaart, G., Huang, K., Tu, H., van Marken Lichtenbelt, W. D., Hoeks, J., Enerback, S., Schrauwen, P., and Spiegelman, B. M. (2012) Beige adipocytes are a distinct type of thermogenic fat cell in mouse and human. Cell 150, 366-376
10. Jimenez, M., Barbatelli, G., Allevi, R., Cinti, S., Seydoux, J., Giacobino, J. P., Muzzin, P., and Preitner, F. (2003) Beta 3-adrenoceptor knockout in C57BL/6J mice depresses the occurrence of brown adipocytes in white fat. European journal of biochemistry / FEBS 270, 699-705
by guest on June 5, 2018http://w
ww
.jbc.org/D
ownloaded from

11
11. Vitali, A., Murano, I., Zingaretti, M. C., Frontini, A., Ricquier, D., and Cinti, S. (2012) The adipose organ of obesity-prone C57BL/6J mice is composed of mixed white and brown adipocytes. J Lipid Res 53, 619-629
12. Coulter, A. A., Bearden, C. M., Liu, X., Koza, R. A., and Kozak, L. P. (2003) Dietary fat interacts with QTLs controlling induction of Pgc-1 alpha and Ucp1 during conversion of white to brown fat. Physiological genomics 14, 139-147
13. Guerra, C., Koza, R. A., Yamashita, H., Walsh, K., and Kozak, L. P. (1998) Emergence of brown adipocytes in white fat in mice is under genetic control - Effects on body weight and adiposity. Journal of Clinical Investigation 102, 412-420
14. Koza, R. A., Hohmann, S. M., Guerra, C., Rossmeisl, M., and Kozak, L. P. (2000) Synergistic gene interactions control the induction of the mitochondrial uncoupling protein (Ucp1) gene in white fat tissue. J Biol Chem 275, 34486-34492
15. Xue, B. Z., Coulter, A., Rim, J. S., Koza, R. A., and Kozak, L. P. (2005) Transcriptional synergy and the regulation of Ucp1 during brown adipocyte induction in white fat depots. Mol Cell Biol 25, 8311-8322
16. Nedergaard, J., and Cannon, B. (2013) UCP1 mRNA does not produce heat. Biochimica et biophysica acta 1831, 943-949
17. Houstek, J., Andersson, U., Tvrdik, P., Nedergaard, J., and Cannon, B. (1995) The Expression of Subunit-C Correlates with and Thus May Limit the Biosynthesis of the Mitochondrial F0f1-Atpase in Brown Adipose-Tissue. J Biol Chem 270, 7689-7694
18. Lee, Y. H., Petkova, A. P., Konkar, A. A., and Granneman, J. G. (2015) Cellular origins of cold-induced brown adipocytes in adult mice. FASEB journal : official publication of the Federation of American Societies for Experimental Biology 29, 286-299
19. Puigserver, P., Herron, D., Gianotti, M., Palou, A., Cannon, B., and Nedergaard, J. (1992) Induction and degradation of the uncoupling protein thermogenin in brown adipocytes in vitro and in vivo. Evidence for a rapidly degradable pool. The Biochemical journal 284 ( Pt 2), 393-398
20. Jacobsson, A., Muhleisen, M., Cannon, B., and Nedergaard, J. (1994) The uncoupling protein thermogenin during acclimation: indications for pretranslational control. The American journal of physiology 267, R999-1007
21. Margineantu, D. H., Emerson, C. B., Diaz, D., and Hockenbery, D. M. (2007) Hsp90 inhibition decreases mitochondrial protein turnover. PloS one 2, e1066
22. Neuspiel, M., Schauss, A. C., Braschi, E., Zunino, R., Rippstein, P., Rachubinski, R. A., Andrade-Navarro, M. A., and McBride, H. M. (2008) Cargo-selected transport from the mitochondria to peroxisomes is mediated by vesicular carriers. Current biology : CB 18, 102-108
23. Vincow, E. S., Merrihew, G., Thomas, R. E., Shulman, N. J., Beyer, R. P., MacCoss, M. J., and Pallanck, L. J. (2013) The PINK1-Parkin pathway promotes both mitophagy and selective respiratory chain turnover in vivo. Proceedings of the National Academy of Sciences of the United States of America 110, 6400-6405
24. Koppen, M., and Langer, T. (2007) Protein degradation within mitochondria: versatile activities of AAA proteases and other peptidases. Critical reviews in biochemistry and molecular biology 42, 221-242
25. Neutzner, A., Youle, R. J., and Karbowski, M. (2007) Outer mitochondrial membrane protein degradation by the proteasome. Novartis Foundation symposium 287, 4-14; discussion 14-20
26. Clarke, K. J., Adams, A. E., Manzke, L. H., Pearson, T. W., Borchers, C. H., and Porter, R. K. (2012) A role for ubiquitinylation and the cytosolic proteasome in turnover of mitochondrial uncoupling protein 1 (UCP1). Biochimica et biophysica acta 1817, 1759-1767
by guest on June 5, 2018http://w
ww
.jbc.org/D
ownloaded from

12
27. Forner, F., Kumar, C., Luber, C. A., Fromme, T., Klingenspor, M., and Mann, M. (2009) Proteome differences between brown and white fat mitochondria reveal specialized metabolic functions. Cell metabolism 10, 324-335
28. Houstek, J., Andersson, U., Tvrdik, P., Nedergaard, J., and Cannon, B. (1995) The expression of subunit c correlates with and thus may limit the biosynthesis of the mitochondrial F0F1-ATPase in brown adipose tissue. J Biol Chem 270, 7689-7694
29. Andersson, U., Houstek, J., and Cannon, B. (1997) ATP synthase subunit c expression: physiological regulation of the P1 and P2 genes. The Biochemical journal 323 ( Pt 2), 379-385
30. Kramarova, T. V., Shabalina, I. G., Andersson, U., Westerberg, R., Carlberg, I., Houstek, J., Nedergaard, J., and Cannon, B. (2008) Mitochondrial ATP synthase levels in brown adipose tissue are governed by the c-Fo subunit P1 isoform. FASEB journal : official publication of the Federation of American Societies for Experimental Biology 22, 55-63
31. Klaus, S., Casteilla, L., Bouillaud, F., and Ricquier, D. (1991) The uncoupling protein UCP: a membraneous mitochondrial ion carrier exclusively expressed in brown adipose tissue. The International journal of biochemistry 23, 791-801
32. Giordano, A., Smorlesi, A., Frontini, A., Barbatelli, G., and Cinti, S. (2014) White, brown and pink adipocytes: the extraordinary plasticity of the adipose organ. European journal of endocrinology / European Federation of Endocrine Societies 170, R159-171
33. Wang, Q. A., Tao, C., Gupta, R. K., and Scherer, P. E. (2013) Tracking adipogenesis during white adipose tissue development, expansion and regeneration. Nature medicine 19, 1338-1344
34. Rosenwald, M., Perdikari, A., Rulicke, T., and Wolfrum, C. (2013) Bi-directional interconversion of brite and white adipocytes. Nature cell biology 15, 659-667
35. Cancello, R., Zingaretti, M. C., Sarzani, R., Ricquier, D., and Cinti, S. (1998) Leptin and UCP1 genes are reciprocally regulated in brown adipose tissue. Endocrinology 139, 4747-4750
36. Cousin, B., Bascands-Viguerie, N., Kassis, N., Nibbelink, M., Ambid, L., Casteilla, L., and Penicaud, L. (1996) Cellular changes during cold acclimatation in adipose tissues. Journal of cellular physiology 167, 285-289
37. Himms-Hagen, J., Melnyk, A., Zingaretti, M. C., Ceresi, E., Barbatelli, G., and Cinti, S. (2000) Multilocular fat cells in WAT of CL-316243-treated rats derive directly from white adipocytes. American journal of physiology. Cell physiology 279, C670-681
38. Granneman, J. G., Li, P., Zhu, Z., and Lu, Y. (2005) Metabolic and cellular plasticity in white adipose tissue I: effects of beta3-adrenergic receptor activation. American journal of physiology. Endocrinology and metabolism 289, E608-616
39. Stefl, B., Janovska, A., Hodny, Z., Rossmeisl, M., Horakova, M., Syrovy, I., Bemova, J., Bendlova, B., and Kopecky, J. (1998) Brown fat is essential for cold-induced thermogenesis but not for obesity resistance in aP2-Ucp mice. The American journal of physiology 274, E527-533
40. Bukowiecki, L., Collet, A. J., Follea, N., Guay, G., and Jahjah, L. (1982) Brown adipose tissue hyperplasia: a fundamental mechanism of adaptation to cold and hyperphagia. The American journal of physiology 242, E353-359
41. Kozak, L. P., Koza, R. A., Anunciado-Koza, R., Mendoza, T., and Newman, S. (2012) Inherent plasticity of brown adipogenesis in white fat of mice allows for recovery from effects of post-natal malnutrition. PloS one 7, e30392
42. Rossmeisl, M., Barbatelli, G., Flachs, P., Brauner, P., Zingaretti, M. C., Marelli, M., Janovska, P., Horakova, M., Syrovy, I., Cinti, S., and Kopecky, J. (2002) Expression of the uncoupling protein 1 from the aP2 gene promoter stimulates mitochondrial biogenesis in unilocular adipocytes in vivo. European journal of biochemistry / FEBS 269, 19-28
by guest on June 5, 2018http://w
ww
.jbc.org/D
ownloaded from
13
43. Moazed, B., and Desautels, M. (2002) Differentiation-dependent expression of cathepsin D and importance of lysosomal proteolysis in the degradation of UCP1 in brown adipocytes. Canadian journal of physiology and pharmacology 80, 515-525
44. Moazed, B., and Desautels, M. (2002) Control of proteolysis by norepinephrine and insulin in brown adipocytes: role of ATP, phosphatidylinositol 3-kinase, and p70 S6K. Canadian journal of physiology and pharmacology 80, 541-552
45. Shabalina, I. G., Petrovic, N., de Jong, J. M., Kalinovich, A. V., Cannon, B., and Nedergaard, J. (2013) UCP1 in brite/beige adipose tissue mitochondria is functionally thermogenic. Cell reports 5, 1196-1203
46. Sharp, L. Z., Shinoda, K., Ohno, H., Scheel, D. W., Tomoda, E., Ruiz, L., Hu, H., Wang, L., Pavlova, Z., Gilsanz, V., and Kajimura, S. (2012) Human BAT possesses molecular signatures that resemble beige/brite cells. PloS one 7, e49452
FOOTNOTES
This work was supported by a grant to LPK from the Foundation for Polish Science, programme
WELCOME, no. WELCOME/2010-4/3 entitled ” Nutrition and ambient temperature during early
development can reduce susceptibility to obesity” financed by EU Structural Funds in Poland
within the Innovative Economy Programme and REFRESH project (FP7-REGPOT-2010-1-264103). We
thank Elzbieta Malinowska and Agnieszka Korytko for outstanding support in the management of the
laboratory and mouse colony.
Figure Legends
Figure 1. The induction of brite adipocytes in ingWAT during cold stimulation and their involution
in thermoneutral conditions. (A) Scheme of the experimental design to assess brite adipocytes turnover.
Young adult (9 weeks) female AXB8 mice were singly housed for 10 days at 4oC, following 7 days of
initial acclimation at 29oC (control group), and subsequently reacclimated to 29
oC. iBAT and ingWAT
were collected from four animals per group at the following time points: 7th day of initial acclimation (in
text 0d4oC); 1, 2, 3, 5, 7 and 10
th day at 4
oC; 1, 3, 5, 7, 14, and 21
th day of reacclimation to 29°C. (B)
Hematoxylin and eosin-stained paraffin sections of ingWAT of cold-stressed and rewarmed mice.
Figure 2. Effect of ambient temperature on UCP1 expression in iBAT and ingWAT. Western blot
analysis of UCP1 protein expression performed by using the whole tissue lysate (30 g) from iBAT (A)
and ingWAT (B) of mice maintained at 4oC or 29
oC for different time points. The number of mice was 4
for each time point; -actin was used as a protein loading control. Representative images are shown.
Quantitative analysis of Western blot results (panel C and D). Signals corresponding to UCP1 protein in
iBAT (C) and ingWAT (D) were normalized to that of -actin and are shown as the fold change relative
to the control group. Each time point is the average value from four animals for Ucp1 mRNA expression
in iBAT (E) and ingWAT (F) based on the results of qPCR analysis and expressed relative to the levels of
cyclophilin. Results are shown as the fold-change relative to the levels of the control group (0 days). (G)
Ucp1 gene expression in iBAT and ingWAT during cold and reacclimation conditions. Each time point is
the average value from four individual animals analyzed in duplicate by qPCR and related to cyclophilin.
The asterisks in Figure 2C-F indicate statistically significant differences in protein or mRNA expression
between mice exposed to cold for 10 days and mice from selected time points of the experiment.
by guest on June 5, 2018http://w
ww
.jbc.org/D
ownloaded from
14
Student’s unpaired t test (ns, statistically non-significant, * p < 0.05, ** p<0.01, *** p < 0.001,
**** p < 0.0001).
Figure 3. The kinetics of induction and regression of mitochondrial components in iBAT and
ingWAT during reversible transitions from 29 to 4°C. Above: Protein expression analysis of selected
mitochondrial proteins: VDAC1, COX IV and cytochrome c (CYT C) performed by using the whole
tissue lysate (30 g) of mice maintained at 4 or 29oC for the different lengths of time. Proteins were
detected on different membranes that were prepared in parallel from the same sample dilution (for iBAT
and ingWAT separately). The protein loading control sample from only one of the membranes is shown.
The number of mice was 4 for the time point. Representative images are shown. Below: Quantitative
analysis of Western blot results. Signals of the protein expression were normalized to that of actin and
are shown as the fold change relative to the control group. Each time point is the average value from four
animals. The asterisks indicate statistically significant differences in protein expression between mice
exposed to cold for 10 days and mice from selected time points in the experiment; Student’s unpaired t
test (* p < 0.05, ** p<0.01).
Figure 4. Expression of selected subunits of mitochondrial respiratory chain complexes in iBAT
and ingWAT in cold and thermoneutral conditions. Above: Protein levels of representative subunits
of the mitochondrial respiratory complexes (RC) I-V: NDUFB8 (RC I), SDHB (RC II), UQCRC2 (RC
III), MTCO1 (RC IV) ATP5A (RC V) performed by using the whole tissue lysate (30 g) of mice
maintained at 4 or 29oC for the different time lengths. Representative images are shown. Below: Graphs
presenting quantitative analysis of expression of subunits of the mitochondrial respiratory complexes and
UCP1 protein in iBAT (filled bars) and ingWAT (open bars) as the average value from four individual
animals. Signals of the protein expression are shown as the fold change relative to the control group (0
days). The asterisks indicate statistically significant differences in protein expression between mice
exposed to cold for 10 days and mice from selected time point of the experiment; Student’s unpaired t test
(ns, statistically non-significant, * p < 0.05, ** p<0.01, *** p < 0.001, **** p < 0.0001). RC, respiratory
complex.
Figure 5. Effect of ambient temperature on UCP1, respiratory chain components and
mitochondrial DNA turnover in iBAT and ingWAT. (A) Line graphs of WB results (see Figure 2A
and Figure 4) comparing the change in expression of UCP1 protein and selected subunits of
mitochondrial respiratory chain during cold and warm acclimation. . Signals of the protein expression are
shown as a multiple of the levels in control group (fold change). (B) Expression of Atp5a1 and Atp5g1
mRNA. Data are means ± SE from 4-6 mice in each group. (C) Changes in mitochondrial DNA content;
mitochondrial DNA-encoded cytochrome b measurement relative to the nuclear gene cyclophilin was
analysed for four mice in duplicate. d, days; RC, respiratory complex; Student’s unpaired t test (ns,
statistically non-significant, * p < 0.05, *** p < 0.001).
Figure 6. Estimation the optimal time of cold exposure needed for maximum expression of UCP1. (A) Scheme of the experiment for estimating the optimal time of cold exposure to reach the maximum
induction of brite adipocytes in ingWAT. Young adult (9 weeks) female AXB8 mice were caged
individually for 0, 5 10, 15, 20 and 25 days at 4oC, following 7 days of initial acclimation at 29
oC. Four
mice from selected time points were sacrificed, iBAT and ingWAT were collected and UCP1 gene and
protein expression were analyzed. (B) WB analysis of UCP1 protein expression and (C) quantitative
analysis carried out by using the whole tissue lysate (30 g) of mice maintained at 4oC for selected time
points. Signals corresponding to UCP1 protein were normalized to that of -actin. (D) Ucp1 mRNA
expression based on the results of qPCR analysis. Each time point is the average value from four mice
analyzed in duplicate and expressed relative to the levels of cyclophilin.
by guest on June 5, 2018http://w
ww
.jbc.org/D
ownloaded from

15
Figure 7. Thermogenic capacity of mitochondria from brown adipocytes from iBAT and ingWAT
from cold-acclimated mice. (A) Levels of UCP1 and mitochondrial respiratory chain subunits in purified
mitochondria isolated from iBAT and ingWAT from a pool of 4 mice acclimated to 29oC for 7 days
(0d4oC) or to 4
oC for 15 days. (B) Levels of UCP1 and (C) mitochondrial respiratory chain proteins in
iBAT and ingWAT mitochondria isolated from mice acclimated to 29oC for 7 days (0d4
oC) or to 4
oC for
15 days. (D) The ratio of UCP1 protein to respiratory complex subunits in mice acclimated to 4oC. In
ingWAT, respiratory complex protein levels from initial acclimation conditions were subtracted from
values obtained after 15 days of cold exposure (the asterisk). It was assumed that at 29oC brite adipocytes
are not induced within ingWAT and have no signal corresponding to UCP1 (A) Thus, expression levels of
RC components at 29oC were treated as background originating from other non-brown adipocytes. d,
days; RC, respiratory complex.
by guest on June 5, 2018http://w
ww
.jbc.org/D
ownloaded from
17
Figure 2.
C D
E F
G
by guest on June 5, 2018http://w
ww
.jbc.org/D
ownloaded from
18
Figure 3.
Figure 3.
B
by guest on June 5, 2018http://w
ww
.jbc.org/D
ownloaded from


22
Figure 7
C
B C
D
by guest on June 5, 2018http://w
ww
.jbc.org/D
ownloaded from

Emilia Gospodarska, Pawel Nowialis and Leslie P. Kozakinterscapular brown adipose tissue and white adipose tissue
Mitochondrial turnover: A phenotype distinguishing brown adipocytes from
published online February 1, 2015J. Biol. Chem.
10.1074/jbc.M115.637785Access the most updated version of this article at doi:
Alerts:
When a correction for this article is posted•
When this article is cited•
to choose from all of JBC's e-mail alertsClick here
by guest on June 5, 2018http://w
ww
.jbc.org/D
ownloaded from