thermoelectric transport in rare-earth compounds
TRANSCRIPT

Thermoelectric transport inrare-earth compounds
Dissertation
zur Erlangung des akademischen Grades
Doctor rerum naturalium
(Dr. rer. nat.)
vorgelegt
der Fakultat Mathematik und Naturwissenschaften
der Technischen Universitat Dresden
von
Ulrike Kohler
geboren am 09.01.1977 in Dresden
Max-Planck-Institut fur Chemische Physik fester Stoffe,
Dresden 2007

Gutachter:
Prof. Dr. F. Steglich
Prof. Dr. M. Loewenhaupt
Prof. Dr. A. M. Strydom
Beginn der Promotion: 15. September 2003
Eingereicht am: 17. Dezember 2007
Tag der Verteidigung: 08. Mai 2008

Contents
Symbols and abbreviations v
1 Introduction 1
2 Theory 5
2.1 Characteristic phenomena of 4f -electron systems . . . . . . . . . . . . . . 5
2.1.1 Crystal electric field effects . . . . . . . . . . . . . . . . . . . . . . . 6
2.1.2 Single-ion Kondo effect . . . . . . . . . . . . . . . . . . . . . . . . . 7
2.1.3 Kondo lattices and RKKY interaction . . . . . . . . . . . . . . . . 8
2.1.4 Landau Fermi-liquid theory and heavy-fermion behavior . . . . . . 11
2.1.5 Non-Fermi liquid behavior . . . . . . . . . . . . . . . . . . . . . . . 12
2.1.6 Intermediate valence . . . . . . . . . . . . . . . . . . . . . . . . . . 13
2.1.7 Kondo insulators . . . . . . . . . . . . . . . . . . . . . . . . . . . . 14
2.2 Thermoelectric transport in magnetic fields . . . . . . . . . . . . . . . . . . 15
2.2.1 Generalized transport equations . . . . . . . . . . . . . . . . . . . . 15
2.2.2 The Boltzmann equation . . . . . . . . . . . . . . . . . . . . . . . . 17
2.2.3 Thermal conductivity . . . . . . . . . . . . . . . . . . . . . . . . . . 18
2.2.4 Thermopower . . . . . . . . . . . . . . . . . . . . . . . . . . . . . . 20
2.2.5 Thermal Hall effect . . . . . . . . . . . . . . . . . . . . . . . . . . . 22
2.2.6 Nernst effect . . . . . . . . . . . . . . . . . . . . . . . . . . . . . . . 23
3 Experimental techniques 25
3.1 Measurements with commercially available systems . . . . . . . . . . . . . 25
3.1.1 Magnetic properties . . . . . . . . . . . . . . . . . . . . . . . . . . . 25
3.1.2 Electrical transport properties . . . . . . . . . . . . . . . . . . . . . 26
3.1.3 Thermoelectric transport properties . . . . . . . . . . . . . . . . . . 26
3.1.4 Specific heat . . . . . . . . . . . . . . . . . . . . . . . . . . . . . . . 28
3.2 A new setup for measuring thermal transport in magnetic fields . . . . . . 28
3.2.1 Motivation . . . . . . . . . . . . . . . . . . . . . . . . . . . . . . . . 28
3.2.2 Experimental setup . . . . . . . . . . . . . . . . . . . . . . . . . . . 29
3.2.3 Thermometry . . . . . . . . . . . . . . . . . . . . . . . . . . . . . . 32
3.2.4 Measurement procedure . . . . . . . . . . . . . . . . . . . . . . . . 37
– i –

Contents
3.2.5 Test measurements . . . . . . . . . . . . . . . . . . . . . . . . . . . 40
3.2.6 Measurement accuracy . . . . . . . . . . . . . . . . . . . . . . . . . 42
3.2.7 Summary and outlook . . . . . . . . . . . . . . . . . . . . . . . . . 44
4 Cage compounds - candidates for thermoelectric applications 47
4.1 An introduction to clathrates . . . . . . . . . . . . . . . . . . . . . . . . . 47
4.1.1 Clathrate-I structure . . . . . . . . . . . . . . . . . . . . . . . . . . 48
4.1.2 Electronic properties of type-I clathrates . . . . . . . . . . . . . . . 50
4.2 K6Eu2Ga10Ge36, K6Eu2Zn5Ge41, and K6Eu2Cd5Ge41 . . . . . . . . . . . . . 50
4.2.1 Samples . . . . . . . . . . . . . . . . . . . . . . . . . . . . . . . . . 51
4.2.2 Magnetic properties . . . . . . . . . . . . . . . . . . . . . . . . . . . 51
4.2.3 Electrical resistivity . . . . . . . . . . . . . . . . . . . . . . . . . . . 54
4.2.4 Summary and discussion . . . . . . . . . . . . . . . . . . . . . . . . 56
4.3 Ba8−xEuxGe43�3 (x ≤ 0.6) . . . . . . . . . . . . . . . . . . . . . . . . . . . 56
4.3.1 Samples . . . . . . . . . . . . . . . . . . . . . . . . . . . . . . . . . 56
4.3.2 Magnetic properties . . . . . . . . . . . . . . . . . . . . . . . . . . . 57
4.3.3 Electrical resistivity . . . . . . . . . . . . . . . . . . . . . . . . . . . 57
4.3.4 Specific heat . . . . . . . . . . . . . . . . . . . . . . . . . . . . . . . 59
4.3.5 Summary and discussion . . . . . . . . . . . . . . . . . . . . . . . . 62
4.4 Ba8−xEuxCu16P30 (x ≤ 2) . . . . . . . . . . . . . . . . . . . . . . . . . . . 63
4.4.1 Samples . . . . . . . . . . . . . . . . . . . . . . . . . . . . . . . . . 63
4.4.2 Magnetic properties . . . . . . . . . . . . . . . . . . . . . . . . . . . 64
4.4.3 Electrical resistivity . . . . . . . . . . . . . . . . . . . . . . . . . . . 66
4.4.4 Specific heat . . . . . . . . . . . . . . . . . . . . . . . . . . . . . . . 67
4.4.5 Summary and discussion . . . . . . . . . . . . . . . . . . . . . . . . 69
4.5 A system with skutterudite-like structure: Ce3Rh4Sn13 . . . . . . . . . . . 70
4.5.1 Structure and properties . . . . . . . . . . . . . . . . . . . . . . . . 71
4.5.2 Samples . . . . . . . . . . . . . . . . . . . . . . . . . . . . . . . . . 72
4.5.3 Results . . . . . . . . . . . . . . . . . . . . . . . . . . . . . . . . . . 72
4.5.4 Discussion . . . . . . . . . . . . . . . . . . . . . . . . . . . . . . . . 77
4.6 Summary . . . . . . . . . . . . . . . . . . . . . . . . . . . . . . . . . . . . 78
5 Energy scales in systems with localized magnetic moments 81
5.1 Ce- and Yb-based heavy-fermion systems . . . . . . . . . . . . . . . . . . . 82
5.1.1 The electron-hole analogy between Ce3+ and Yb3+ . . . . . . . . . 82
5.1.2 Dilution of magnetic moments . . . . . . . . . . . . . . . . . . . . . 83
5.1.3 The ThCr2Si2 crystal structure . . . . . . . . . . . . . . . . . . . . 84
5.2 Yb-based Kondo-lattice compounds: YbRh2(Si1−xGex)2 and YbIr2Si2 . . . 85
5.2.1 Physical properties . . . . . . . . . . . . . . . . . . . . . . . . . . . 86
5.2.2 Samples . . . . . . . . . . . . . . . . . . . . . . . . . . . . . . . . . 89
– ii –

Contents
5.2.3 Special considerations on thermal transport measurements with the
PPMS on small samples . . . . . . . . . . . . . . . . . . . . . . . . 90
5.2.4 Results of the thermopower measurements . . . . . . . . . . . . . . 90
5.3 Dilution of Yb moments in Lu1−xYbxRh2Si2 . . . . . . . . . . . . . . . . . 94
5.3.1 Introduction . . . . . . . . . . . . . . . . . . . . . . . . . . . . . . . 94
5.3.2 Samples . . . . . . . . . . . . . . . . . . . . . . . . . . . . . . . . . 95
5.3.3 Experimental results . . . . . . . . . . . . . . . . . . . . . . . . . . 96
5.3.4 Energy scales . . . . . . . . . . . . . . . . . . . . . . . . . . . . . . 99
5.3.5 Discussion . . . . . . . . . . . . . . . . . . . . . . . . . . . . . . . . 102
5.3.6 Conclusions . . . . . . . . . . . . . . . . . . . . . . . . . . . . . . . 104
5.4 A Ce-based system: CexLa1−xNi2Ge2 . . . . . . . . . . . . . . . . . . . . . 104
5.4.1 Introduction . . . . . . . . . . . . . . . . . . . . . . . . . . . . . . . 104
5.4.2 Physical properties . . . . . . . . . . . . . . . . . . . . . . . . . . . 105
5.4.3 Samples . . . . . . . . . . . . . . . . . . . . . . . . . . . . . . . . . 108
5.4.4 Experimental results: Resistivity and thermopower . . . . . . . . . 109
5.4.5 Discussion . . . . . . . . . . . . . . . . . . . . . . . . . . . . . . . . 111
5.4.6 Conclusions . . . . . . . . . . . . . . . . . . . . . . . . . . . . . . . 114
5.5 Summary . . . . . . . . . . . . . . . . . . . . . . . . . . . . . . . . . . . . 114
6 Towards Ettingshausen cooling: The Nernst effect in CeNiSn 117
6.1 Introduction . . . . . . . . . . . . . . . . . . . . . . . . . . . . . . . . . . . 117
6.2 The Nernst effect and Ettingshausen cooling . . . . . . . . . . . . . . . . . 119
6.3 Properties of CeNiSn . . . . . . . . . . . . . . . . . . . . . . . . . . . . . . 120
6.3.1 Overview . . . . . . . . . . . . . . . . . . . . . . . . . . . . . . . . 120
6.3.2 Thermal transport in CeNiSn . . . . . . . . . . . . . . . . . . . . . 124
6.4 Experimental details . . . . . . . . . . . . . . . . . . . . . . . . . . . . . . 126
6.4.1 Samples . . . . . . . . . . . . . . . . . . . . . . . . . . . . . . . . . 126
6.4.2 Experimental techniques . . . . . . . . . . . . . . . . . . . . . . . . 127
6.5 Results . . . . . . . . . . . . . . . . . . . . . . . . . . . . . . . . . . . . . . 127
6.5.1 Thermal conductivity and thermal Hall coefficient . . . . . . . . . . 127
6.5.2 Thermopower . . . . . . . . . . . . . . . . . . . . . . . . . . . . . . 128
6.5.3 Nernst coefficient . . . . . . . . . . . . . . . . . . . . . . . . . . . . 131
6.6 Discussion . . . . . . . . . . . . . . . . . . . . . . . . . . . . . . . . . . . . 133
6.6.1 The thermal Hall gradient . . . . . . . . . . . . . . . . . . . . . . . 133
6.6.2 The thermopower and the gap formation . . . . . . . . . . . . . . . 133
6.6.3 The Nernst effect and potential thermomagnetic cooling . . . . . . 136
6.7 Conclusions . . . . . . . . . . . . . . . . . . . . . . . . . . . . . . . . . . . 141
7 Summary 143
– iii –

Contents
A Thermocouple calibration and manganine correction curves 147
A.1 Chromel-AuFe0.07% thermocouples . . . . . . . . . . . . . . . . . . . . . . . 147
A.2 Chromel-Constantan thermocouple . . . . . . . . . . . . . . . . . . . . . . 149
A.3 Manganin correction for the thermopower . . . . . . . . . . . . . . . . . . 150
Bibliography 169
List of publications 171
Acknowledgements 173
Versicherung 175
– iv –

Symbols and Abbreviations
Below, the most important symbols and abbreviations used in this work are summarized.
Notations, which have been utilized only on selected pages, are not included. Symbols
containing indices are only mentioned, if they are ambiguous.
Generally, SI units are used in this thesis. An important exception is the applied
magnetic field. It is denoted as B and given in the units of Tesla (T) instead of using the
SI notations H and Ampere per meter (A/m), respectively.
A general treatment of thermoelectric transport processes in magnetic fields requires
the use of tensors. However, for a simpler notation tensor components are only used in
those sections, where they are inevitable for a precise description.
A cross section
a crystallographic axis; lattice constant; factor
ac alternating current
B magnitude of the magnetic field vector−→B
b crystallographic axis; lattice constant; dimension
C constant
c crystallographic axis; lattice constant
cel electronic specific heat
cmag magnetic specific heat
cp specific heat at constant pressure
cph phononic specific heat
CEF crystal electric field
d thickness, dimension
dc direct current
DOS density of states
DP Dulong-Petit value
– v –

Symbols and Abbreviations
E energy of a state−→E electric field vector with components Ex, Ey, Ez
e absolute value of the electron charge
EDX energy dispersive X-ray (absorption)
EF Fermi level
� Planck’s constant
HF heavy fermion
i index
IV intermediate valence
J total angular momentum; exchange interaction
j magnitude of the electrical current vector−→j ; index
k index−→k wave vector
kB Boltzmann’s constant
L thermal Hall coefficient
l length, dimension
LFL Landau-Fermi liquid
m mass; magnetic moment
m0 free electron mass
m∗ effective mass renormalized due to electron-electron interactions
(cf. footnote 5 on page 12)
meff effective mass; effective magnetic moment
MPMS Magnetic Property Measurement System
N density of states; Nernst signal
n charge carrier concentration; number of atoms
n4f occupancy of the 4f level
NAV Avogadro’s constant
nD number of Debye phonon modes
nE number of Einstein phonon modes
NFL non-Fermi liquid
Nsp single-particle density of states
– vi –

P heat power
p pressure
PPMS Physical Property Measurement System
q magnitude of the heat current vector −→qQCP quantum critical point
qe charge of an electron or hole including the sign
R gas constant
RH Hall resistivity, the Hall coefficient corresponds to RH(B → 0)
RKKY Ruderman-Kittel-Kasuya-Yosida (interaction)
RRR residual resistivity ratio
S thermopower; spin
S entropy
Sd drift contribution to the thermopower
Si thermopower along direction i, a diagonal component of the
thermopower tensor ε: Si ≡ εii
Smag magnetic contribution to the thermopower
SSE solid state electrotransport
T temperature
t time
T1 temperature in the compensated zone
T2 temperature at the sample platform
TC Curie temperature
Tc superconducting transition temperature
TCEF temperature at which a signature corresponding to ΔCEF shows up in the
data (cf. footnote 6 on page 99)
TΔCEF temperature corresponding to a CEF splitting of ΔCEF
TΔCEF1−2 temperature corresponding to the CEF splitting between two distinct
levels 1 and 2
TK Kondo temperature
TN Neel temperature
Ts temperature of the sample
Us thermal voltage of the sample
UTC thermal voltage of a thermocouple
u(x) uncertainty or error of a measured quantity
u.c. unit cell
– vii –

Symbols and Abbreviations
v valence
VF valence fluctuating
vF Fermi velocity
Vs−f matrix element of s − f mixing
VTI variable temperature insert
Vuc unit-cell volume
x concentration of alloying; coordinate
XAS X-ray absorption spectra
xeff effective concentration
xnom nominal concentration
ZT dimensionless thermoelectric figure of merit
ZmagT dimensionless thermomagnetic figure of merit
γ saturation value of the electronic specific heat for T → 0
γ0 free-electron value of γ
Δ4f broadening of the 4f level
ΔT temperature difference
ΔCEF energy splitting between the ground state and an excited CEF state
ε energetic position with respect to the Fermi level, i.e. ε = E − EF
ε4f binding energy of the undisturbed 4f level
ε thermopower tensor with components εik
ΘCW Weiss temperature
ΘD Debye temperature
ΘE Einstein temperature
ΘH Hall angle
κ thermal conductivity (along a certain direction)
κ thermal conductivity tensor
κi thermal conductivity along direction i, a diagonal component of the
thermal conductivity tensor κ: κi ≡ κii
κph phononic contribution to the thermal conductivity
κel electronic contribution to the thermal conductivity
– viii –

μB Bohr’s magneton
ν Nernst coefficient (at finite field)
ν0 Nernst coefficient for B → 0 (cf. footnote 7 on page 17)
νa adiabatic Nernst coefficient
νn normal Nernst coefficient
π Peltier coefficient tensor
ρ electrical resistivity
ρmag magnetic contribution to the electrical resistivity
σ electrical conductivity
τ relaxation time
χ magnetic susceptibility
χ0 free-electron value of χ
∇T temperature gradient with components (∇T )x, (∇T )y, (∇T )z
– ix –

Symbols and Abbreviations
– x –

Chapter 1
Introduction
Thermoelectric phenomena arise from the entanglement of thermal and electrical trans-
port processes due to (1) heat transport by charge carriers and (2) scattering processes
between charge carriers and other heat-carrying quasiparticles, e.g. phonons. Therefore, a
flow of heat or charge generally induces both a temperature gradient and an electrical field.
The focus of this work lies on the thermoelectric transport properties of rare-earth com-
pounds containing Ce, Eu, and Yb. At low temperatures these systems usually exhibit
enhanced thermopowers compared to normal metals. In combination with low thermal
conductivities, large thermopower values are desirable for materials used in thermoelec-
tric applications. Furthermore, the thermopower of rare-earth systems provides valuable
information on the characteristic electronic energy scales. In this work the thermoelec-
tric transport properties of Ce, Eu, and Yb systems are studied either to evaluate their
potential for thermoelectric applications or with respect to fundamental problems.
Rare-earth elements are characterized by an incompletely filled 4f shell, which is small
compared to interatomic distances and may carry a magnetic moment. A large number
of rare-earth compounds exhibit unusual low-temperature properties, which are ascribed
to interactions of the localized 4f moments with their environment: The crystal elec-
tric field (CEF) at the rare-earth ion site splits the free-ion ground-state multiplet. The
temperature-dependent occupation probability of the CEF levels is reflected in many phys-
ical properties. The Kondo interaction induces a screening of the local 4f moments by the
conduction electrons and thus favors a nonmagnetic ground state. By contrast, the indi-
rect Ruderman-Kittel-Kasuya-Yosida (RKKY) interaction promotes magnetic ordering of
the moments at low temperatures. The competing energy scales of CEF splitting, Kondo
and RKKY interaction cause the large variety of exceptional phenomena observed in rare-
earth systems, such as heavy-fermion (HF) behavior, intermediate valence, unconventional
superconductivity, and quantum criticality. Generally, the low-T properties of rare-earth
systems depend sensitively on the position of the undisturbed 4f state with respect to the
Fermi level EF. Thus, the hybridization between the 4f and conduction-electron states
may give rise to either an enhanced density of states (DOS) near EF in HF metals or to
– 1 –

Chapter 1. Introduction
the formation of a gap at EF in Kondo insulators.
An important aspect in terms of technical applications is the large magnitude of the
thermopower commonly observed in HF systems [1]. It is attributed to the enhanced
DOS at EF. Large thermopower values are required for thermoelectric applications such
as Peltier refrigeration or thermal-to-electrical energy conversion. In addition, low lat-
tice thermal conductivities as frequently realized in cage compounds, e.g. clathrates, are
essential to design a good thermoelectric material [2]. Therefore, rare-earth containing
cage compounds appear promising candidates for the utilization in thermoelectric devices.
Several new Eu clathrates are investigated in this work to evaluate their potential for ap-
plications. In the potassic systems K6Eu2Ga10Ge36, K6Eu2Zn5Ge41, and K6Eu2Cd5Ge41
transition metal elements are incorporated into the network to enhance the hybridiza-
tion between the Eu 4f states and the conduction band. Ba8Ge43�3 and Ba8Cu16P30
were chosen as starting materials to study the effect of Ba-Eu exchange because of re-
ported semiconductor-like resistivities. Furthermore, a Ce system with skutterudite-like
structure, Ce3Rh4Sn13, is investigated with regard to its thermoelectric performance. It
attracted attention with large displacement parameters for the Sn(2) atoms.
Investigations of the thermopower S provide information on electronic excitations and
scattering processes in metallic systems. In rare-earth compounds Kondo interaction and
CEF excitations usually give rise to large anomalies in S(T ). Therefore, thermopower in-
vestigations are suited excellently to study the Kondo and CEF energy scales in these ma-
terials. This is of particular importance for compounds showing unconventional behavior,
e.g. close to a quantum critical point. In this work, thermopower investigations are used to
study the Kondo and CEF energy scales of the Yb-based HF systems YbRh2(Si1−xGex)2
(x = 0, 0.05) and YbIr2Si2. Additionally, two substitutional series, Lu1−xYbxRh2Si2 and
CexLa1−xNi2Ge2, are investigated. The evolution of the Kondo temperature TK upon
Lu/Yb exchange in Lu1−xYbxRh2Si2 allows to determine TK for YbRh2Si2. The change
of the temperature dependence S(T ) with Ce concentration in CexLa1−xNi2Ge2 is used to
identify the CEF level scheme of CeNi2Ge2.
Recently, the transverse thermopower in a magnetic field, the Nernst coefficient ν,
attracted considerable attention. Unusually large values of ν have been observed in various
correlated rare-earth systems. This finding raised the question, whether giant Nernst
coefficients are generic to HF compounds [3]. Formerly, large Nernst coefficients had
already been observed in normal semimetals and semiconductors. However, due to the
low effective mass of the charge carriers these materials are not suited for thermomagnetic
refrigeration in an Ettingshausen device. Therefore, heavy-electron semimetals, such as
CeNiSn, have been claimed to be promising for thermomagnetic applications [4]. The
Nernst coefficient of CeNiSn is studied for the first time in this work. Additionally, the
thermopower in magnetic fields is discussed. Large values are observed below 10 K in both
quantities, ν and S, which are ascribed to the gap formation in this temperature region.
In this context, another important task was the setup of a new apparatus to measure
– 2 –

the longitudinal and transverse thermoelectric transport coefficients in magnetic fields. It
was optimized to study small single crystals with low thermal conductance. Test measure-
ments on a standard sample confirm the high accuracy of the data, particularly for the
thermopower and Nernst coefficient. The measurement uncertainty at temperatures down
to 1.5 K is significantly reduced compared to the commercial PPMS.
This work focuses on the thermoelectric transport in rare-earth compounds. The mea-
surements of the thermal conductivity, thermopower, and Nernst coefficient are supple-
mented by investigations of other quantities as magnetic susceptibility and specific heat.
Chapter 2 provides an introduction to the relevant physical concepts. Section 1 of that
chapter summarizes the characteristic properties of rare-earth systems; section 2 gives an
overview on thermoelectric transport processes in magnetic fields. The applied experimen-
tal techniques as well as the new experimental setup are described in detail in Chapter 3.
The experimental results are presented in Chapter 4-6, of which each concentrates on a dif-
ferent subject. In Chapter 4, various Eu clathrates and the skutterudite-like Ce3Rh4Sn13
are presented, which have been investigated as potential thermoelectric materials for ap-
plications. Chapter 5 focusses on the study of the energy scales in the heavy-fermion series
Lu1−xYbxRh2Si2 and CexLa1−xNi2Ge2 by means of thermopower investigations. Chapter 6
is dedicated to the thermoelectric transport properties of the correlated semimetal CeNiSn
with special emphasis on the Nernst coefficient of this compound. The final conclusions
are summarized in Chapter 7.
– 3 –

Chapter 1. Introduction
– 4 –

Chapter 2
Theory
This chapter gives a general overview on the physical concepts that are used to motivate
and interpret the measurements presented in this thesis. At first, an introduction into the
particularities of the physics of 4f -electron systems is given with a focus on Ce, Yb and Eu
compounds (Sec. 2.1). The second part, Sec. 2.2, is dedicated to thermoelectric transport
processes in magnetic fields. After a general discussion, the thermoelectric transport in
4f systems, in particular, is addressed. Since the compounds and problems investigated
in this work are rather diverse, specific concepts are introduced in connection with the
presentation and discussion of the experimental results.
2.1 Characteristic phenomena of 4f-electron systems
Rare-earth elements possess an incompletely filled 4f shell, which is very small compared
to typical interatomic distances. As a consequence, rare-earth elements and compounds
exhibit characteristic properties, which deviate significantly from those of other systems,
containing for instance transition-metal elements with expanded 3d shells. The main
implications are:
� Due to the small radius of the 4f shell, the 4f electrons do not participate in chemical
bonding. Instead, the 4f electrons together with the nucleus act virtually as an
effective nucleus, and, from a chemical point of view, all rare-earth elements behave
similarly.
� Since the overlap of neighboring f shells is extremely small, the initial or unperturbed
4f states have the same energy.
� The magnetic moments associated with the 4f shell may be treated as well localized
moments. In general there is negligible direct interaction between the 4f moments.
The following sections give an overview on characteristic phenomena that may be observed
in 4f systems and are caused by the localized character of the 4f shell and moment. The
– 5 –

Chapter 2. Theory
discussion is restricted to effects that are important to understand the measurements
presented in this work.
2.1.1 Crystal electric field effects
The ground state of a free ion or atom with a partially filled 4f shell can be derived using
Hund’s rules. States other than the 2J + 1 states of the ground-state multiplet with total
angular momentum J may in general be neglected, since they have much higher energies.
In zero magnetic field the 2J+1 states of the free-ion ground-state multiplet are completely
degenerated.
In a compound a 4f ion is exposed to crystal electric fields (CEF), which reflect the
symmetry at the rare-earth ion site. They completely or partially lift the degeneracy of
the 4f free-ion ground-state multiplet. The number of resulting multiplets is determined
by the local crystal symmetry. Their relative energetic positions depend on the exact
form and magnitude of the CEF. For ions with an odd number of 4f electrons, such as
Ce3+ and Yb3+, the CEF splitting leaves at least a twofold degeneracy of each level, in
accordance with Kramer’s rule. Ideally, rotationally invariant ground states, such as the
4f 7 8S 72
of Eu2+, are not effected by the CEF. Admixtures of higher lying states, however,
allow for a small splitting of the free-ion ground-state multiplet in real Eu systems of
several 100 mK [5]. The first excited CEF level of Ce and Yb systems is typically at
ΔCEF = kBTΔCEF with TΔCEF = (20 . . . 200) K above the ground state1.
The CEF splitting affects many physical properties. For a system with a first excited
level at kBTΔCEF above the ground state, only the lowest lying multiplet has a significant
probability of occupancy for T � TΔCEF. Consequently, the properties of the system are
determined by the ground-state multiplet. With increasing temperature higher CEF levels
become populated. The corresponding increase of entropy shows up as an extra contribu-
tion to the specific heat of the system in the region of TΔCEF, in the form of a Schottky
anomaly. The transport properties reflect the enhanced scattering on CEF excitations
around TΔCEF. The change of the effective moment with increasing occupancy of higher
lying multiplets becomes apparent in the magnetic susceptibility. At low temperatures
(T � TΔCEF) the effective magnetic moment is determined by the ground-state multiplet.
A Curie-Weiss behavior of the susceptibility with the free-ion magnetic moment is observed
only at temperatures well above the excitation temperature of the highest multiplet.
1Within this thesis the terms ’ground state’ and ’ground-state multiplet’ generally denote the lowestlying multiplet in the presence of a CEF. The lowest lying 2J + 1 manyfold of a free 4f ion is normallyreferred to as the ’free-ion ground-state multiplet’. However, if no misconception is possible, the term’ground-state multiplet’ is used likewise. States of higher energy than the lowest lying 2J + 1 manifoldare generally not taken into consideration, i.e. terms as ’the highest multiplet’ refer to the lowest lying2J + 1 manifold.
– 6 –
2.1. Characteristic phenomena of 4f -electron systems
2.1.2 Single-ion Kondo effect
A single magnetic impurity in an otherwise nonmagnetic metal couples to the conduction
electrons via the spin-exchange interaction. For a negative exchange integral J , i.e. an
antiferromagnetic interaction, the conduction electrons tend to screen the local moment.
This is the single-ion Kondo effect. In general it is observed in diluted alloys with a
small amount of 4f or 3d impurities, in which the magnetic moments may not interact,
directly or indirectly, due to the large distance. The single-ion Kondo effect facilitates a
nonmagnetic ground state in these compounds.
The interaction between the magnetic impurities and the conduction electrons alters
the low-temperature properties of diluted Kondo systems with respect to normal, nonmag-
netic metals. It entails the formation of a many-particle singlet state, which is accompanied
by a lowering of the energy of kBTK, where:
kBTK ∼ 1
N(EF)e− 1
N(EF)|J| (2.1)
Here, N(EF) denotes the density of states (DOS) at the Fermi level. The Kondo temper-
ature TK determines the characteristic energy scale of the interaction. The antiferromag-
netic coupling constant J depends on the hybridization strength or matrix element of s-f
mixing Vsf and the binding energy2 of the 4f level ε4f :
J = − V 2sf
|ε4f | (2.2)
The hybridization between the local 4f states and the conduction-electron states gives
rise to a strong enhancement of the DOS near the Fermi level with a width of the order
of kBTK, which is called the Abrikosov-Suhl or Kondo resonance.
The physical properties of diluted Kondo systems may be classified with respect to TK.
At T � TK the resistivity ρ and specific heat cp of diluted Kondo systems resemble those
of normal metals. The impurity spins behave as free magnetic moments, therefore a Curie-
Weiss behavior of the magnetic susceptibility χ is observed. For temperatures of the order
of TK, for which the screening of the moments sets in, the behavior changes qualitatively.
While the resistivity of normal metals typically decreases upon cooling, diluted Kondo sys-
tems exhibit a minimum, and subsequently an increase in ρ with decreasing temperature.
This differing ρ(T ) dependence originates from an extra contribution ρK to the resistivity
due to spin-flip scattering of the conduction electrons on the magnetic impurities, which
behaves as ρK ∝ − ln(T/C) for T ∼ TK, with C being a constant. At very low temper-
atures T � TK the resistivity saturates to a constant value. As soon as the moments
are completely screened, the magnetic susceptibility adopts the temperature-independent
Pauli susceptibility of itinerant electrons. Due to the enhanced DOS at EF the saturation
2Within this thesis, the capital letter E denotes the energy of a state, while ε is used for the energeticposition with respect to the Fermi level, i.e. εi = Ei − EF.
– 7 –

Chapter 2. Theory
value χ0, normalized to the amount of impurities, is large compared to normal metals.
Likewise, in the specific heat a saturation of cp/T for T → 0 at large values is found,
corresponding to large γ coefficients of the order of (100 . . . 1000) γ0. Here, γ0 denotes the
free-electron value. The high DOS at the Fermi level may also give rise to large values of
the thermopower S around TK. This fact is discussed in more detail below in connection
with the introduction to thermoelectric transport (Sec. 2.2.4).
2.1.3 Kondo lattices and RKKY interaction
The single-ion Kondo effect is caused by the antiferromagnetic exchange interaction J
between the conduction electrons and a small amount of magnetic impurities, e.g. 4f or
3d ions. The situation changes qualitatively if the localized magnetic moments completely
occupy a lattice site, as it is realized for a large number of stoichiometric rare-earth com-
pounds3. A regular arrangement of localized 4f magnetic moments is called a Kondo
lattice, in contrast to the diluted Kondo systems discussed above. The magnetic moments
obey the translational symmetry of the crystal, therefore coherence effects due to the
formation of extended Bloch states may arise. This alters, in particular, the transport
properties, as, for instance, the resistivity. With decreasing temperature the magnetic
contribution of a Kondo lattice ρKL initially shows a ρKL ∝ − ln(T/C) behavior, as in
diluted Kondo systems. Upon further cooling, however, as coherence sets in, ρKL exhibits
a pronounced maximum near the characteristic temperature Tcoh, and then strongly de-
creases. In the zero temperature limit, according to the Bloch theorem, the magnetic
scattering rate goes to zero and ρKL → 0.
The distance between neighboring magnetic moments in a Kondo lattice is relatively
small compared to diluted Kondo systems. Although the direct interaction between the
magnetic 4f moments is in general still negligible, they may interact via the conduction
electrons: A local magnetic moment induces a spatially oscillating spin polarization of
the conduction electrons, which affects the orientation of neighboring 4f moments. This
indirect, so-called Ruderman-Kittel-Kasuya-Yosida (RKKY) interaction favors a magnetic
ordering of the 4f moments at low temperatures. The coupling between two spins Si and
Sj at distance rij is [6]:
J ijRKKY = 6πZJ2N(EF)
[sin(2kFrij)
(2kFrij)4− cos(2kFrij)
(2kFrij)3
](2.3)
where Z is the number of conduction electrons per atom and kF the Fermi momentum.
For typical distances between the magnetic moments in rare-earth compounds an effec-
tively antiferromagnetic coupling is usually found. However, in some cases a ferromagnetic
ground state is observed, e.g in CeRu2Ge2 [7]. The energy associated with the RKKY in-
3In transition-metal compounds the direct interaction between the expanded 3d shells destroys theKondo effect. Generally, the discussion in this work is restricted to rare-earth compounds.
– 8 –

2.1. Characteristic phenomena of 4f -electron systems
Figure 2.1: Doniach diagram according to [9]. TK and TRKKY are the characteristic temper-
atures of the Kondo and the RKKY interaction, respectively. Magnetic ordering occurs
for low J at Tmag. In the upper part the regions with different behavior are marked:
M - magnetic materials, KM - Kondo magnetics, HF - heavy fermions, and VF - valence
fluctuating or intermediate-valence compounds.
teraction is:
kBTRKKY ∼ J2N(EF) (2.4)
The interplay between the Kondo interaction, which favors a nonmagnetic ground
state, and the RKKY interaction, which promotes magnetic ordering of the moments,
gives rise to a large variety of low-temperature behaviors in Kondo-lattice compounds.
The interdependence is best illustrated by the Doniach diagram [8], which is displayed in
a slightly modified form in Fig. 2.1 [9]. The characteristic temperatures of the Kondo and
RKKY interaction TK and TRKKY as well as the magnetic ordering temperature Tmag are
shown vs. the antiferromagnetic exchange interaction J . In the upper part, the regions
with different characteristic behaviors are depicted:
(M) - magnetic materials: For a small exchange integral J between the local moments and
the conduction electrons, the Kondo interaction is negligible. The RKKY interaction
gives rise to a magnetically ordered ground state.
(KM) - Kondo magnetics: With increasing J the Kondo interaction gains influence.
However, at low temperatures magnetic ordering is observed due to the stronger
RKKY interaction.
(HF) - heavy fermions : In this region, where Kondo and RKKY interaction are of the
same order of magnitude, so called heavy-fermion behavior is observed, which is
– 9 –
Chapter 2. Theory
addressed in a separate section (Sec. 2.1.4). With increasing J , the magnetic or-
dering temperature is lowered. At a critical value of J , ordering occurs in the zero-
temperature limit. Such a phase transition, taking place at 0 K upon changing a
control parameter other than the temperature, is called a quantum critical point
(QCP). Close to a QCP, unconventional or non-Fermi liquid behavior may be ob-
served.
(VF) - valence fluctuating or intermediate valence compounds: With further increasing
J the Kondo energy scale rises to the order CEF-excitation energies. In this region,
intermediate valence (IV), i.e. a non-integer valence of the f ion, is observed. A
more detailed introduction to IV compounds is given below (Sec. 2.1.6).
The Doniach model is based on a number of very simple assumptions, which may be vi-
olated in real systems. A quantitative comparison to experimental results can therefore
be problematic, except for small J [7]. A brief overview on the limitations of the Do-
niach model and the corresponding literature may be found e.g. in [10, 11]. Despite these
limitations, the Doniach diagram yields a qualitative description of the varying proper-
ties of a number of rare-earth series, e.g. EuCu2(SixGe1−x)2 [12], Ce(Pd1−xNix)2Ge2 and
CeNi2(Ge1−xSix)2 [13]. In these systems, the change in the unit-cell volume upon substitu-
tion x gives rise to a differing J and thus a shift of the compound in the Doniach diagram.
A similar effect is found for Ce compounds under pressure, e.g. in CeCu2Ge2 [14].
In the presence of a CEF splitting the occupation probability of different CEF levels
changes with temperature. This influences the transport properties, especially the resis-
tivity. Without Kondo effect the enhanced scattering on CEF excitations around TΔCEF
generates a maximum in the magnetic contribution to the resistivity. Likewise, in a Kondo
lattice the temperature-dependent occupation of CEF levels is reflected in ρKL. At low
temperatures spin-flip scattering of charge carriers occurs on only the ground-state multi-
plet. With the occupation of higher CEF levels, more states contribute to the scattering.
Then, the Kondo temperature of the ground-state multiplet TK = T lowK is no longer the
characteristic temperature of the system4. Instead, the properties are determined by a
high-temperature Kondo scale T highK , which depends on both T low
K and TΔCEF. For Ce
systems with three doublets, T highK has been related to T low
K as [15]:
T highK = 3
√T low
K · TΔCEF1−2 · TΔCEF1−3 (2.5)
Depending on the relative position of the CEF levels with respect to TK, differing behavior
in ρKL is observed. Calculations of the resistivity of compounds with Ce impurities in the
presence of Kondo interaction and CEF splitting, which apply to almost integer valences,
predict a logarithmic contribution to the resistivity for each CEF level [16]. The resistivity
4Within this work, TK in general denotes the characteristic temperature of Kondo scattering on the4f ground-state multiplet, i.e. TK = T low
K . If an explicit distinction to Kondo scattering on thermallypopulated CEF states is necessary, T high
K and T lowK are used.
– 10 –

2.1. Characteristic phenomena of 4f -electron systems
of Kondo lattices with a CEF splitting was calculated qualitatively for both magnetically
ordering and nonmagnetic systems [17]. Within this model a separate observation of the
Kondo effect on the ground state and on thermally populated CEF level is only possible, if
TΔCEF > a · TK. The value of a, obtained on exemplary calculations shown in Ref. [17], is
approximately 20. Otherwise, only a single maximum in ρmag is observed at a temperature
of the order of TΔCEF.
The influence of CEF effects and Kondo interaction on the thermopower of Kondo
systems is addressed in Sec. 2.2, which gives an introduction to thermoelectric transport.
2.1.4 Landau Fermi-liquid theory and heavy-fermion behavior
At low temperatures, the conduction electrons in a nonmagnetic metal can be approxi-
mately treated as an ideal Fermi gas, i.e. a system of noninteracting fermions. The char-
acteristic properties of a Fermi gas are a linear temperature dependence of the electronic
specific heat cel = γ0T and a constant magnetic susceptibility χ0. Due to the absence of
interactions and, consequently, scattering between the electrons, there is no corresponding
contribution to the resistivity.
In real systems the electrons interact, for instance via the Coulomb repulsion. Such
a system of interacting fermions is called a Fermi liquid, if the collective excitations or
quasiparticles of the interacting system directly correspond to excitations of the Fermi gas.
Landau developed a theoretical description, which predicts the properties of the so-called
Landau-Fermi liquid (LFL). Within this theory the quasiparticles are no longer eigenstates
of the system, in contrast to a Fermi gas. At low enough temperatures, however, the energy
uncertainty associated with the finite life time of the quasiparticles is lower than the
thermal energy kBT . In this case the properties of the system of interacting fermions are
similar to those of the Fermi gas. The interactions are accounted for via the introduction
of Landau parameters Fs(a)l . In particular, the susceptibility, specific heat and resistivity
contribution of a Landau Fermi liquid behave as:
cP,LFL
T= γLFL = γ0
m∗
m0where
m∗
m0= 1 +
F s1
3(2.6)
χLFL = χ0m∗
m0
1
1 + F a0
(2.7)
ρLFL = AT 2 where A ∝ (m∗)2 (2.8)
Here, γ0 and χ0 are the values of the noninteracting system, m0 is the free-electron mass. It
is seen that the electron-electron interactions mainly cause a renormalization of the particle
mass: The free-electron mass is replaced by the effective mass m∗. The linear temperature
dependence of the electronic specific heat and the constant Pauli susceptibility, which are
predicted as in the case of noninteracting electrons, are indeed detected in nonmagnetic
metals. The ρLFL ∝ T 2 behavior, however, which is indicative of the electron-electron
– 11 –

Chapter 2. Theory
interactions, generally cannot be resolved in the presence of the much stronger electron-
phonon interaction, which generates a low-temperature contribution ρel−ph ∝ T 5. Yet,
careful measurements on In and Al revealed a T 2 contribution to ρ at low temperatures
(T < 4 K) [18].
In rare-earth systems with comparable Kondo and RKKY interaction, so called heavy-
fermion (HF) behavior is found. In this case the hybridization of the 4f electron states with
the conduction-electron states gives rise to very large effective masses of (100 . . . 1000) m0.
Despite the strong interactions, a large number of these systems still behave like a LFL
at low T . Due to the large effective masses, they exhibit a strongly enhanced Pauli
susceptibility χLFL, a large γLFL coefficient, and a ρLFL ∝ T 2 contribution to the resistivity
at low T . Comparing Eq. 2.6 and 2.7 it is evident that χLFL and γLFL are similarly
enhanced by a factor m∗/m0 compared to the free-electron values. This is expressed by
the dimensionless Sommerfeld-Wilson ratio RSW, which relates χLFL and γLFL as:
RSW =π2k2
B
3μ0μ2B
χLFL
γLFL=
1
1 + F a0
(2.9)
While RSW = 1 for noninteracting electrons, it typically takes values between 2 and 5 for
HF systems [19].
It should be mentioned that the influence of the crystal lattice on the motion of elec-
trons in a metal is also accounted for by the introduction of an effective mass meff , which
typically takes values of (0.1 . . . 10) m0. This form of an effective mass, however, is not
accompanied by a T 2 contribution to the resistivity, since no electron-electron interactions
are taken into consideration5.
2.1.5 Non-Fermi liquid behavior
The LFL theory, as it was briefly outlined in the previous section, explains the low-
temperature properties of a large number of metallic systems. Even many Kondo-lattice
compounds with strongly enhanced effective masses can be understood within the LFL
model. Some systems, however, exhibit so-called non-Fermi liquid (NFL) behavior,
i.e. they may not be described as a Fermi liquid. Different scenarios have been devel-
oped, which predict NFL behavior. The origin of NFL behavior is not directly subject of
investigations within this thesis. However, since some of the investigated systems exhibit
NFL behavior at low temperatures, the most important models shall briefly be mentioned:
Distribution of Kondo temperatures: Disorder in a Kondo system may give rise to
a variation of TK within a sample. As a result the low-T properties can deviate from
the predictions of the LFL theory. A description of this model can be found in [20].
5The notation for the effective mass is not completely consistent within this work. Usually both effects– the band structure and electron-electron interactions – are present, however, with differing significance.If the electron-electron interactions are dominating, the renormalized mass of the quasiparticles is denotedas m∗. Otherwise, meff is used.
– 12 –

2.1. Characteristic phenomena of 4f -electron systems
Formation of a Griffiths phase: Another possible consequence of disorder in a Kondo
system is the formation of a Griffiths phase [21]: magnetic clusters in a paramag-
netic metallic phase. The resulting inhomogeneous environment may induce NFL
behavior. This model is described in detail in [22].
Quantum phase transition: If the transition temperature of a phase transition is
lowered to 0 K upon varying an external parameter x, then the point of the phase
diagram where x = xcrit is called a quantum critical point (QCP). As external
parameters serve, for instance, chemical substitution, pressure or a magnetic field. In
the Doniach diagram (Fig. 2.1) a QCP is reached for Tmag = 0. The quantum phase
transition occurring at 0 K is driven by quantum instead of thermal fluctuations.
At low temperatures, for x ≈ xcrit, NFL behavior is observed. A large number
of theoretical models have been proposed, which may be roughly divided into two
classes, those of itinerant character [23, 24] and local scenarios [25, 26]. A brief
overview of the models and literature can be found e.g. in [27].
Multichannel Kondo effect: The Kondo effect, as it was described above, consists in
the screening of a local magnetic moment by a ’cloud’ of conduction electrons due to
an antiferromagnetic coupling between both of them. For the multichannel Kondo
effect it is assumed that the local magnetic moment interacts with different channels
of conduction electrons [28]. The independent screening by more than one channel
produces an overcompensation of the local moment [29]. As a result a net magnetic
moment is generated, which may again couple to the conduction electrons. The
continuation of this process leads to a diverging extension of the Kondo ’cloud’. In
the case of 2 channels and spin 1/2 a specific heat cmag/T ∝ − ln(T/TK) is predicted
[29, 28]. So far, the nature of the different channels is not resolved. Multiple bands
at EF, which are not hybridized, have been proposed as a possible reason [30].
2.1.6 Intermediate valence
The hybridization between the 4f and conduction electrons, Vsf , leads to a broadening Δ
of the unperturbed 4f level by:
Δ = π|V 2sf |Nsp(EF) (2.10)
Here, Nsp is the single-particle DOS of the 4f level. A comparison of Δ with the binding
energy ε4f represents an alternative to the Doniach picture described above for understand-
ing the varying behavior of Kondo systems. It is particularly useful as a simple model
of intermediate valence: For Δ � ε4f the hybridization is negligible and J is small. The
rare-earth ions possess stable 4f shells with well localized magnetic moments, which may
become ordered due to the RKKY interaction. With increasing hybridization or alterna-
tively the 4f level shifting towards the Fermi energy (Δ < ε4f ) virtual excitations of the 4f
– 13 –

Chapter 2. Theory
Figure 2.2: Schematic band structure and DOS of a Kondo insulator (a and b) and a
Kondo metal (c and d) according to [17]
electrons become important. As a result the 4f moments are destabilized and the Kondo
resonance develops near the Fermi level. The resulting high DOS at EF causes HF be-
havior. The valence of the 4f ion only slightly deviates from integer values. For Δ ≥ ε4f
a strong mixing of 4f and conduction-electron states occurs. Real excitations between
neighboring valence states generate a non-integer valence. In this case a non-integer occu-
pancy of the 4f level is found. At the same time, the high DOS and in consequence the HF
behavior is destroyed. Such systems are called valence-fluctuating or intermediate-valent
compounds. The transition from HF systems with tiny deviations from integer valence to
valence-fluctuating compounds is not a phase transition, but a smooth crossover.
2.1.7 Kondo insulators
Kondo insulators are Kondo-lattice compounds, which exhibit semiconducting behavior
at low temperatures. The high-temperature properties, on the other hand, resemble those
of metallic Kondo-lattice systems. The change in behavior upon cooling is attributed to
the opening of a small gap in the DOS at EF due to the hybridization of a flat 4f band
with the conduction-electron band.
A simple model, which accounts for the differing behavior of metallic Kondo lattices
with their enhanced DOS near the Fermi level and Kondo insulators with a gap in the
DOS at EF, is depicted in Fig. 2.2. It shows the schematic band structures and DOS for a
Kondo insulator and a Kondo metal. If the dispersion of the 4f band is small (Fig. 2.2a),
the hybridization may give rise to the formation of a gap in the DOS (Fig. 2.2b). At
appropriate filling, EF lies inside the gap. On the other hand, if the dispersion of the
f band due to electron-phonon or other interactions is large enough (Fig. 2.2c), then an
enhanced DOS around EF is found (Fig. 2.2d).
In real systems the situation is in general more complex. The band structure shown
– 14 –

2.2. Thermoelectric transport in magnetic fields
in Fig. 2.2 is a simple one with only one conduction band crossing EF. However, if more
than one band crosses EF, no gap is formed, even if the dispersion is small [31].
From a more general, theoretical treatment it is found that an even number of electrons
per unit cell is required, with the f band crossing exactly one conduction band, to get
semiconducting or Kondo insulating behavior [31]. Therefore it is comprehensible, why
most Kondo insulators have a cubic crystal structure: The requirement of exactly one
conduction band at the Fermi level is more easily achieved for highly symmetric crystal
structures. Exceptions are the orthorhombic compounds CeNiSn and CeRhSb, whereas
CeNiSn is no clean Kondo insulator. The gap in CeNiSn closes along specific directions
of the k space, allowing for a residual electrical conductivity at T → 0 in these directions
[32, 33].
2.2 Thermoelectric transport in magnetic fields
2.2.1 Generalized transport equations
Itinerant electrons act as charge carriers and heat carriers. Thermal and electrical trans-
port are therefore generally connected: A temperature gradient ∇T along a sample induces
both a flow of heat and an electric current in the sample. Likewise, an electric field−→E
generates a heat flow as well as an electric current. Experimentally it is more convenient
to apply an electric current and to measure the resulting electric field. The generalized
transport equations in the presence of a temperature gradient and an applied electric
current take the following form:
−→E = ρ
−→j + ε∇T , −→q = π
−→j − κ∇T (2.11)
where−→j and −→q denote the electric current density and the heat-flow density, respectively.
The coefficients for the electrical resistivity ρ, the thermopower ε, the Peltier effect π and
the thermal conductivity κ are second-order tensors. In an applied magnetic field−→B these
coefficients depend on the field. They obey the Onsager symmetry relations [34], therefore:
ρik(−→B ) = ρki(−−→
B ) , κik(−→B ) = κki(−−→
B ) , πik(−→B ) = Tεki(−−→
B ) (2.12)
In general the matrices of the coefficients ε and π are not symmetric.
According to Eq. 2.11, the description of the thermoelectric transport in a material
requires the knowledge of 36 parameters, which are connected via the 15 relations 2.12.
The remaining 21 independent quantities may depend on the direction and size of the
magnetic field in a complex manner. Consequently, for an arbitrary choice of−→j , ∇T , and−→
B the treatment of 2.11 is sophisticated, and a large number of thermoelectric phenomena
may be observed.
Thermoelectric transport measurements performed within the scope of this thesis have
been taken without application of an electric current, i.e. for−→j = 0. Therefore, the
– 15 –

Chapter 2. Theory
following discussion is restricted to this special situation, for which the treatment of the
transport coefficients is much simpler. In this case the transport equations 2.11 take the
form: −→E = ε∇T , −→q = −κ∇T (2.13)
with the components:
Ei =∑
εik(∇T )k , qi = −∑
κik(∇T )k (2.14)
However, these equations do not describe the situation during the experiments. In fact, a
flow of heat was applied to the sample and the resulting temperature gradient measured:
−→E = ε∇T , ∇T = −κ−1−→q (2.15)
Assuming as a special case that −→q ‖ x and−→B ‖ z ⊥ x, the components of the temperature
gradient become:
(∇T )x = − κyy
κxxκyy + κ2xy
q , (∇T )y = −κxy
κyy
(∇T )x , (∇T )z = 0 (2.16)
In zero magnetic field, for which κxy = 0, this reduces to
(∇T )x = −q/κxx , (∇T )y = (∇T )z = 0 (2.17)
Knowing q and measuring the temperature gradient along a sample, Eq. 2.17 allows the
determination of the ordinary or longitudinal thermal conductivity6 along x, κxx. Since
for most materials the transverse components of the thermal conductivity tensor are much
smaller than the longitudinal elements: κxy � (κxx, κyy), Eq. 2.17 may be taken as a
good approximation to determine the ordinary thermal conductivity, even in an applied
magnetic field. The second relation of Eq. 2.16 describes the thermal Hall or Righi-Leduc
effect: the appearance of a transverse temperature gradient in the presence of a magnetic
field perpendicular to a flow of heat. The thermal Hall coefficient Lxy for B ‖ z is generally
defined as:
Lxy =κxy
B= −κyy
B
(∇T )y
(∇T )x
(2.18)
Regarding the symmetry relations 2.12 it is evident that Lxy = −Lyx.
The components of the induced electric field for −→q ‖ x and−→B ‖ z ⊥ x take the form:
Ex = εxx(∇T )x + εxy(∇T )y , Ey = εyx(∇T )x + εyy(∇T )y , (∇T )z = 0 (2.19)
6In literature usually the terms ’thermal conductivity’ and ’thermopower’ are used to designate a diag-onal component of κ or ε along a certain direction i, i.e. κii or εii. Likewise, within this thesis the ’thermalconductivity’ and ’thermopower’ generally denote these values. The tensors of thermal conductivity andthermopower are explicitly referred to as such. The supplements ’longitudinal’ or ’transversal’ are usedto distinguish between the diagonal and off-diagonal elements of the tensors, respectively. For formulasthe conventions are as follows: κ and ε are used for the tensors, while κ or κii as well as S or Si ≡ εii isused to denote the value along a certain direction i.
– 16 –

2.2. Thermoelectric transport in magnetic fields
Since in general εxy � εxx and (∇T )y � (∇T )x (for −→q ‖ x) the first relation of Eq. 2.19
may be used to determine the normal thermopower along x, Sx = εxx, even in an applied
magnetic field. The second equation describes the adiabatic Nernst effect: the emergence
of a transverse voltage in the presence of a magnetic field perpendicular to a flow of heat.
The adiabatic Nernst effect is observed for qy = 0, contrary to the normal Nernst effect,
which is measured for (∇T )y = 0. Using the expression for (∇T )y from Eq. 2.16, the
electric field along y can be written as:
Ey =
(εyx − εyy
κxy
κyy
)(∇T )x = νa
yxB(∇T )x = Nayx(∇T )x (2.20)
with the adiabatic Nernst coefficient7 νayx and the adiabatic Nernst signal Na = νaB. Due
to the non-symmetry of ε it is in general νaxy �= −νa
yx. The corresponding normal Nernst
coefficient νnyx may be determined from relation 2.13 for (∇T )y = 0: νn
yx = εyx/B. Normal
and adiabatic Nernst coefficient are related via the thermal Hall effect:
νayx = νn
yx −εyy
κyy
Lxy (2.21)
This relation is of importance, because it allows to estimate the difference between νayx
and νnyx from a measurement of κyy, εyy, and Lxy. Theoretical calculations are generally
performed for the normal Nernst coefficient. However, they apply to the adiabatic Nernst
coefficient as well, if Lxyεyy/κyy � νnyx ≈ νa
yx.
It should be noted that, according to the conventions used above, Lxy and νayx are
both measured along y direction for −→q ‖ x and−→B ‖ z. The converse indices of the
two quantities follow from definition 2.14 in connection with the experimental situation
described by Eq. 2.15.
So far the description of the thermoelectric transport was a phenomenological one,
without discussing the structure or origin of the transport coefficients. In the following
the main sources and contributions of thermal conductivity, thermopower, thermal Hall
coefficient, and Nernst coefficient are summarized with particular regard to rare-earth
compounds. A detailed description of the main theoretical concepts in thermoelectric
transport may be found e.g. in [35, 36].
2.2.2 The Boltzmann equation
Classical transport phenomena are controlled by two contrary mechanisms: driving forces
induce a directive motion of particles, while scattering retards it. An important description
for this situation is given by the linearized Boltzmann equation. Under certain assump-
tions this theory may be used to describe charge and heat transport in solids. The most
7Accurately, the Nernst coefficient is determined in the limit B → 0. However, in the following theterm ’Nernst coefficient’ is also used for the field dependent quantities, e.g. νa
yx(B) = Ey/(B(∇T )x). Ifnecessary, the limit of ν for B → 0 is denoted explicitly as ν0. The Nernst signal N is determined as νB.
– 17 –

Chapter 2. Theory
important requirement is, that the charge or heat carriers can be described as classical
particles with well-defined momentum �−→k and position −→r . In this case, in equilibrium,
the time-dependent distribution function f(−→r ,−→k , t) must satisfy the equation:
−→k · ∇kf + −→v k · ∇rf =
(∂f
∂t
)c
(2.22)
Here, f(−→r ,−→k , t) is a measure for the density of carriers with wave vector
−→k at position
−→r and time t. The velocity −→v is the group velocity of a wave packet of charge or heat
carriers. The terms on the left-hand side of Eq. 2.22 are the drift terms, which describe
the change of the local distribution function due to acceleration and movement of carriers.
The right-hand side of Eq. 2.22 is the collision term, which depends on the scattering
processes. An exact calculation of this term is difficult. Therefore, the collision term is
generally estimated using the relaxation time approximation:(∂f
∂t
)c
= −f − f0
τ(2.23)
The undisturbed distribution function f0 is given by the Fermi-Dirac or the Bose-Einstein
statistics in the case of fermions or bosons, respectively. The relaxation time τ is deter-
mined by the different effective scattering processes. If independent scattering processes
with relaxation times τi are considered, the effective total relaxation time is generally
calculated as the inverse of a sum of the inverse τi:
1
τ=
∑i
1
τi(2.24)
The solution of the linearized Boltzmann equation using the relaxation time approximation
provides a basis for many theoretical calculations of thermal transport processes.
2.2.3 Thermal conductivity
The thermal conductivity κ is a measure for the ability of a material to transport heat.
Electrons, thermal vibrations of the lattice (phonons) and other excitations, e.g magnons,
may act as heat carriers. At this point only the heat transport by phonons (κph) and
electrons (κel) is discussed. The total thermal conductivity can be calculated as the sum
of the contributions resulting from different types of heat carriers: κ = κph + κel.
Electronic contribution and Wiedemann-Franz law
A solution of the linearized Boltzmann equation within the relaxation-time approximation
allows to calculate the electronic contribution to the thermal conductivity. Assuming a
spherical Fermi surface and that the relaxation time τ only depends on the energy of the
charge carriers, κel may be related to the electronic specific heat cel:
κel =1
3v2
Fτ(EF)cel (2.25)
– 18 –

2.2. Thermoelectric transport in magnetic fields
where vF is the Fermi velocity. For the free-electron gas this may be written as:
κel =π2
3τ(EF)nk2
B
T
meff
(2.26)
with the effective electron mass meff . The electrical conductivity σ can be calculated
from Boltzmann theory to be σ = e2τ(EF)n/meff , where e is the absolute value of the
elementary charge8. The ratio of electronic thermal to electrical conductivity is linear in
temperature:κel
σ=
π2
3
(kB
e
)2
T = L0T (2.27)
This is the Wiedemann-Franz law with the constant Lorentz number
L0 = 2.45 × 10⁻⁸WΩ/K2. It is strictly valid for elastic scattering processes, e.g. impurity
scattering at low temperatures. Therefore, Eq. 2.27 holds in a Fermi liquid as T
approaches zero. At elevated temperatures (10 K to several 100 K) inelastic scattering
dominates and deviations from the Wiedemann-Franz law are observed. At high temper-
atures the energy loss due to inelastic scattering is small compared to kBT , therefore the
Wiedemann-Franz law is valid again.
Phononic contribution
Using the Debye approximation for the phonon dispersion relation the phonon thermal
conductivity may be calculated:
κph =kB
2π2vph
(kB
�
)3
T 3
∫ ΘD/T
0
z4ez
(ez − 1)2τph(z, T )dz (2.28)
with vph =kBΘD
�
(6π2N
)−1/3(2.29)
N denotes the number of atoms per unit cell, ΘD the Debye temperature and τph the
phonon relaxation time. Thermal transport by phonons is limited due to a large number
of different scattering processes with relaxation times τi, including scattering on sample
or grain boundaries (τB), scattering from crystal imperfections (τD), phonon-electron scat-
tering (τph−el), normal and umklapp scattering on other phonons (τN and τU), isotope
scattering (τI) and resonant scattering (τR). The phonon relaxation time τph is generally
calculated according to Eq. 2.24. The dominating mechanism depends on the temperature
and the number of scatterers. However, in the temperature range investigated within this
thesis (2 K . . . 200 K) generally several of these mechanisms are important. A quantita-
tive description of thermal conductivity data without further knowledge of the investigated
system is therefore difficult and entails the determination of a large number of free pa-
rameters. Since modeling of thermal conductivity data is not performed within this work,
a specification or derivation of the relaxation times for different scattering mechanisms is
omitted. They can be found in the literature provided above.
8The absolute value of the electron charge is denoted as e. If the sign of the charge is relevant, qe isused instead, i.e. qe = +e for holes and qe = −e for electrons.
– 19 –

Chapter 2. Theory
2.2.4 Thermopower
The thermopower calculated from the linearized Boltzmann equation in the degenerate
limit (kBT � EF) is given by the Mott expression:
Sd =π2
3
k2BT
qe
(∂ lnσ(ε)
∂ε
)EF
(2.30)
where σ is the dc electrical conductivity. This is the diffusion thermopower, which, in
simple terms accounts for the different average velocities of ’warm’ and ’cold’ electrons.
More precisely, Sd results from the temperature dependence of the Fermi-Dirac distribu-
tion, which produces both a differing average velocity of the charge carriers and a change
in the occupation numbers with varying T .
Assuming a spherical Fermi surface and an isotropic relaxation time τ , the electrical
conductivity and thermopower can be written as:
σ =2
3e2N(E)v2(E)τ(E) (2.31)
Sd =2π2k2
Bqe
9T
(∂ ln N(ε)
∂ε+
∂v2(ε)
∂ε+
∂τ(ε)
∂ε
)EF
(2.32)
For normal metals with light charge carriers, the first term in Eq. 2.32 generally prevails
significantly and therefore:
S lightd =
π2
3
k2BT
qe
(∂ ln N(ε)
∂ε
)EF
(2.33)
At very low temperatures, where the relaxation time τ is limited by scattering from im-
purities, the thermopower calculated in the free-electron approximation is linear in tem-
perature:
Sd =π2k2
BT
3qeEF(2.34)
Eqs. 2.33 and 2.34 are frequently applied to understand the large values of the ther-
mopower found in HF compounds (see below). They are attributed to the enhanced DOS
near the Fermi level resulting from the hybridization between the local 4f states and the
conduction-electron states. In Ce- and Yb-based Kondo systems this Abrikosov-Suhl reso-
nance typically has a halfwidth of the order of (1-100) K. Therefore, the energy derivative
of N(E) at EF, and thus the thermopower, may reach giant values, which exceed those
of simple metals by a factor of 10-100. Furthermore, as EF ∝ m∗, a large initial slope in
Sd(T ) is expected in the HF state according to Eq. 2.34. However, this intuitive picture
yields the wrong sign compared to the low-T thermopower of most Ce and Yb-based HF
compounds. This is caused by the second and third term in Eq. 2.32, which cannot be
neglected in these systems [37]. Yet, a recent theoretical treatment of this problem [38]
evidenced that, within certain approximation:
SFLd = F
π2
3
k2BT
qe
(∂ ln N(ε)
∂ε
)EF
(2.35)
– 20 –

2.2. Thermoelectric transport in magnetic fields
The factor F depends amongst others on the DOS and the renormalization amplitude
and is expected to be of the order of ±1. For Ce-based HF systems 2.35 yields positive
thermopower values, for Yb compounds negative ones, in agreement with experimental
findings.
In addition to Sd, the phonon drag may produce a thermopower contribution Sph−drag.
For Kondo systems, Sph−drag is generally small compared to Sd and may be neglected.
Likewise other contributions to S, as, for instance, due to a magnon drag, are not relevant
for the investigations presented in this thesis. Therefore, subsequently it is presumed that
S ≈ Sd.
If independent scattering processes contribute to an effective relaxation time τ , then
the corresponding thermopower contributions sum up according to the Gorter-Nordheim
rule:
Sd =∑
i
SdiWi (2.36)
where W = κ−1 is the thermal resistivity. If the Wiedemann-Franz law is valid, Eq. 2.36
can be written as
Sd =∑
i
Sdiρi (2.37)
This equation allows a rough separation of contributions due to different scattering pro-
cesses. Particularly, it can be used to separate the diffusion thermopower of light charge
carriers S lightd from the magnetic contribution9 in rare-earth systems Smag.
Thermopower of Kondo systems
In rare-earth compounds both Kondo interaction and CEF excitations may generate large
anomalies in S(T ). The thermopower of Yb and Ce HF compounds typically exhibits a
maximum (Ce) or minimum (Yb) around TK [39, 40, 41], e.g. in Ce(NixPd1−x)2Si2 [42]. Ad-
ditionally, for a CEF level at TΔCEF � TK theoretical calculations predict a large positive
(Ce) or negative (Yb) contribution with an extremum at (0.3 . . . 0.6) TΔCEF [43, 44, 41].
It is caused by Kondo scattering on thermally populated CEF levels. Thermopower in-
vestigations may therefore be used for the determination of the Kondo and CEF energy
scales.
Several Ce and Yb systems show deviations from this simple S(T ) dependence with a
’Kondo peak’ and a ’CEF peak’ reflecting Kondo scattering on the ground state and the
excited CEF levels10. For small TK, the low-temperature peak may not be developed due
to magnetic ordering or the onset of superconductivity. With increasing hybridization,
9In the strict sense, both Slightd and Smag represent diffusion contributions. However, for a simpler
description, Slightd is in the following referred to as the ’diffusion thermopower’ Sd (i.e. of light charge
carriers). The contribution from Kondo scattering is denoted as Smag.10The two peaks frequently observed in S(T ) are both attributed to Kondo scattering. The low-T
peak is caused by Kondo scattering on the ground-state multiplet, usually a doublet. The high-T peakresults from combined scattering on thermally populated CEF levels (i.e. the the ground-state doubletand excited CEF levels). To simplify the notation, these two peaks are referred to as ’Kondo peak’ and
– 21 –
Chapter 2. Theory
e.g. upon application of pressure (Ce-systems) or substitution (Ce and Yb), the ’Kondo
peak’ shifts to higher temperatures, while the position of the ’CEF peak’ remains almost
constant. For TK � 0.1 × TΔCEF the two peaks merge into a single large anomaly around
(0.3 . . . 0.6)TΔCEF, e.g. in Ce(NixPd1−x)2Si2 [45] or CeRu2Ge2 [46]. Thus, a determination
of TK from S(T ) becomes impossible. With further increasing hybridization the system
approaches the IV regime, for which CEF are no longer relevant. The thermopower of IV
compounds usually exhibits a single large maximum (Ce, Eu) or minimum (Yb) around
TK. It shifts to higher temperatures with further increasing hybridization. This continuous
evolution of the shape of S(T ) is nicely seen from investigations under pressure [47, 48].
A similar behavior may be found upon substitution, e.g. in Ce(NixPd1−x)2Si2 [45] or
Yb(Cu1−xNix)2Si2 [49].
The large values usually found for the thermopower of rare-earth systems have been
related to the likewise large electronic contribution to the specific heat. In the zero tem-
perature limit, the ratio S/γT of several correlated compounds takes a quasi-universal
value [37]. The dimensionless quantity
q = NAVqeS
γT(2.38)
with the Avogadro number NAV is close to ±1, whereas the sign depends on the type of
charge carriers. For Ce systems q ∼ +1, for Yb compounds q ∼ −1. This observation can
be understood within the Fermi-liquid theory assuming impurity scattering as the relevant
scattering process [38].
Calculations for the multi-channel Kondo effect in Ce systems suggest a strong de-
pendence of the thermopower on the number of channels [50]. Large positive values of
S at low T are found for the one-channel Kondo effect in Ce compounds. In the case of
two or three channels, however, a small negative S is predicted. Therefore, thermopower
investigations may be used to ascertain the existence of a multichannel Kondo effect in Ce
systems.
2.2.5 Thermal Hall effect
The simplest picture to understand the emergence of a thermal Hall effect is that of charge
carriers drifting in a sample with a temperature gradient e.g. along x direction ∇T ‖ x
in a magnetic field parallel z. ’Hot’ carriers coming from the warm and ’cold’ carriers
from the cold end are deflected by the Lorentz force in opposite directions ±y. Thus,
a transverse component to the temperature gradient (∇T )y arises. Calculations of the
corresponding thermal Hall coefficient show that high values are obtained in materials
with a large concentration of charge carriers of high mobility and a small lattice thermal
’CEF peak’. The reason for this naming is mainly a suggestive one: For TK � TΔCEF the ’Kondo peak’has its extremum around TK, while the ’CEF peak’ is situated near (0.3 . . . 0.6)TΔCEF.
– 22 –

2.2. Thermoelectric transport in magnetic fields
conductivity [51]. Investigations on Cd3As2 revealed ratios (∇T )y/(∇T )x as large as 50 %
at room temperature in an external magnetic field of 10 T [52].
The transverse thermal conductivity κxy corresponding to (∇T )y is purely electronic
in origin. Therefore, under certain assumptions, the thermal Hall effect can be used
to separate electronic (κel) and phononic (κph) contributions to the (longitudinal) ther-
mal conductivity. This is especially useful for materials, for which the validity of the
Wiedemann-Franz law is uncertain, such as the high-temperature superconductors. How-
ever, the separation into κph and κel is not straightforward, and further assumptions for
the relevant relaxation times are required. In normal-state YBa2Cu3O7−δ the observa-
tion was used that both κxx and (κxy/B) exhibit the same magnetic-field dependence
[53, 54]. Assuming in addition a magnetic-field independent κph, it could be shown that
the quasiparticle contribution to the thermal conductivity is strongly enhanced below the
superconducting transition temperature Tc.
In the superconducting state, in addition to the normal-state electronic contribution
to κxy described above, the diamagnetic screening currents may influence the thermal Hall
effect [55]. The supercurrents flowing from the hot end of the sample to the cold end heat
one side of the sample. Returning on the other side, the opposite part is cooled. This
produces an additional contribution to κxy.
2.2.6 Nernst effect
The Nernst effect is the appearance of a transverse electric field in the presence of a thermal
gradient and a perpendicular magnetic field. Assuming an applied temperature gradient
along the x direction and the field parallel to z, the Nernst signal is observed along y.
Depending whether (∇T )y = 0 or qy = 0, the normal or the adiabatic Nernst coefficient
are determined (Sec. 2.2.1). In experiments usually the adiabatic Nernst coefficient νa is
measured. It differs from the normal Nernst coefficient νn by a thermopower contribution
induced by the transverse temperature gradient due to a nonzero thermal Hall effect.
Both coefficients are related via the thermal Hall coefficient, as seen from Eq. 2.21. In the
following only νn is discussed.
Comparably large values of ν of ∼ 10 to 100 μV/KT are usually observed in semi-
conductors and semimetals, such as Ge [56], GaSb [57], and bismuth [58]. By contrast,
the quasiparticle contribution to the normal Nernst coefficient in a metal is usually very
small. Carriers moving in opposite directions are deflected to different sides by the Lorentz
force. In the simplest case of one type of charge carriers and a spherical Fermi surface, the
two currents are equal, and no transverse voltage is observed. This so-called ’Sondheimer
cancelation’ predicts a zero Nernst signal [59]. Due to the energy dependence of the scat-
tering time the cancelation is incomplete in any real system. An expansion of the energy
– 23 –

Chapter 2. Theory
dependence of the relaxation time within the free-electron model yields a contribution νnτ :
νnτ =
π2k2BT
3m0
[∂τ (ε)
∂ε
]ε=EF
(2.39)
This contribution, which is even found for systems with an isotropic, spherical Fermi sur-
face, is usually small. For an anisotropic Fermi surface, the combination of currents from
different portions of the Fermi surface gives rise to a potentially larger contribution νnFS.
In small magnetic fields, i.e. to linear order, the corresponding transverse thermopower εyx
represents the conductivity-weighted correlation of the Hall angle θH and the longitudinal
thermopower εxx around the Fermi surface [60]:
εyx = 〈θHεxx〉σ − 〈θH〉σ〈εxx〉σ (2.40)
In this equation, the brackets represent an average over the Fermi surface, while the
subscript σ indicates the weighting by the electrical conductivity. The Hall angle θH is
defined from the electrical conductivity tensor σ = ρ−1 as θH = σyx/σxx. For isotropic
transport tensors, i.e. cubic or tetragonal systems with appropriate orientation, the normal
Nernst coefficient of a degenerate Fermi liquid may be directly related to the Hall angle
[61, 62]:
νn =π2k2
BT
3qe
[∂ tan θH
∂ε
]ε=EF
(2.41)
The Nernst coefficient of materials with different types of charge carriers is not affected
by compensation effects, unlike the Hall coefficient [63]. Instead, electrons and holes are
deflected to opposite Nernst electrodes of a sample. This may lead to an enhancement
of the Nernst signal in multiband metals. It is speculated that an ambipolar flow of
quasiparticles is responsible for the comparably large Nernst signal observed in NbSe2 [64].
Type-II superconductors in the mixed state exhibit a vortex contribution to the Nernst
coefficient, which is large close to the upper critical field Bc2 [65, 66, 67]. Due to the temper-
ature dependence of the vortex density, vortices are driven to the cooler end of the sample.
The Josephson effect induces an electric field with orientation perpendicular to both the
magnetic field and the temperature gradient. In the high-temperature superconductors, a
vortex-like Nernst signal persists also at temperatures above Tc. This observation was in-
terpreted in terms of strong fluctuations between the pseudogap and the superconducting
state [68].
In high magnetic fields a quantum-Nernst effect with large oscillations of εyx(B) has
been predicted, analogous to the quantum-Hall effect [69]. Experimentally, quantum os-
cillations have been observed in Bi [70].
– 24 –

Chapter 3
Experimental techniques
This chapter provides an introduction to the applied measuring methods. Most investiga-
tions were performed on commercial multi-purpose devices, the PPMS and MPMS. The
relevant methods are briefly described in Sec. 3.1. An important part of this work was the
assembly of an experiment for measuring the thermal transport properties of small sam-
ples in the temperature range from 1.5 K to 250 K. The new setup permits investigations,
which were formerly not available at the institute, particularly, of the Nernst effect. It is
described in detail in Sec. 3.2.
3.1 Measurements with commercially available sys-
tems - the PPMS and MPMS
Most measurements in the temperature range between 0.35 K and 400 K presented in this
thesis have been performed on a Magnetic Property Measurement System (MPMS) or a
Physical Property Measurement System (PPMS) (Quantum Design). These devices have
already been in use for several years, and the setup and measurement techniques have
been described in detail elsewhere [71, 72]. Therefore, this chapter is restricted to a brief
overview on each technique and a specification of the used parameters.
3.1.1 Magnetic properties
The MPMS uses a superconducting quantum interferometric device (SQUID) to measure
the dc magnetic susceptibility χ and the isothermal magnetization M . The sample is fixed
inside a plastic straw. A motor moves the sample through the pick-up coils. The signal
is recorded using a lock-in technique. Data analysis is performed by fitting the measured
signal to the response of an ideal dipole moment. The setup is placed in a 4He cryostat,
which is provided with a 7 T magnet. The accessible temperatures range from 1.8 K to
400 K.
– 25 –
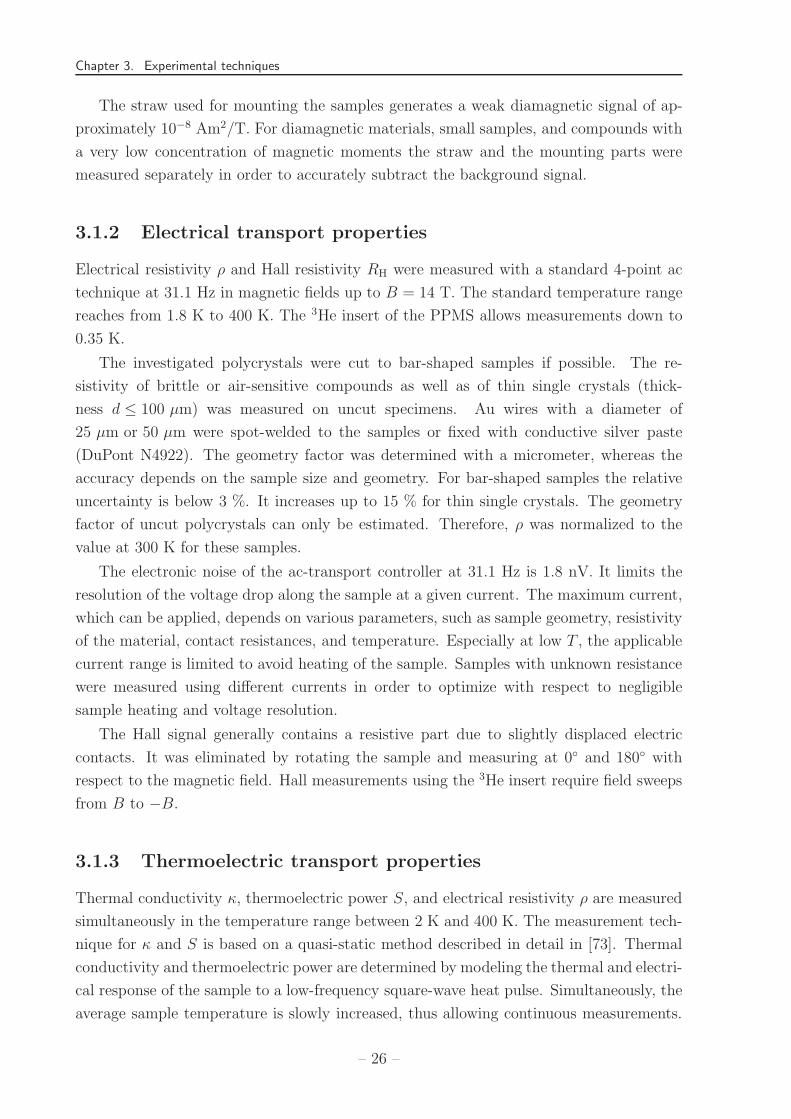
Chapter 3. Experimental techniques
The straw used for mounting the samples generates a weak diamagnetic signal of ap-
proximately 10−8 Am2/T. For diamagnetic materials, small samples, and compounds with
a very low concentration of magnetic moments the straw and the mounting parts were
measured separately in order to accurately subtract the background signal.
3.1.2 Electrical transport properties
Electrical resistivity ρ and Hall resistivity RH were measured with a standard 4-point ac
technique at 31.1 Hz in magnetic fields up to B = 14 T. The standard temperature range
reaches from 1.8 K to 400 K. The 3He insert of the PPMS allows measurements down to
0.35 K.
The investigated polycrystals were cut to bar-shaped samples if possible. The re-
sistivity of brittle or air-sensitive compounds as well as of thin single crystals (thick-
ness d ≤ 100 μm) was measured on uncut specimens. Au wires with a diameter of
25 μm or 50 μm were spot-welded to the samples or fixed with conductive silver paste
(DuPont N4922). The geometry factor was determined with a micrometer, whereas the
accuracy depends on the sample size and geometry. For bar-shaped samples the relative
uncertainty is below 3 %. It increases up to 15 % for thin single crystals. The geometry
factor of uncut polycrystals can only be estimated. Therefore, ρ was normalized to the
value at 300 K for these samples.
The electronic noise of the ac-transport controller at 31.1 Hz is 1.8 nV. It limits the
resolution of the voltage drop along the sample at a given current. The maximum current,
which can be applied, depends on various parameters, such as sample geometry, resistivity
of the material, contact resistances, and temperature. Especially at low T , the applicable
current range is limited to avoid heating of the sample. Samples with unknown resistance
were measured using different currents in order to optimize with respect to negligible
sample heating and voltage resolution.
The Hall signal generally contains a resistive part due to slightly displaced electric
contacts. It was eliminated by rotating the sample and measuring at 0◦ and 180◦ with
respect to the magnetic field. Hall measurements using the 3He insert require field sweeps
from B to −B.
3.1.3 Thermoelectric transport properties
Thermal conductivity κ, thermoelectric power S, and electrical resistivity ρ are measured
simultaneously in the temperature range between 2 K and 400 K. The measurement tech-
nique for κ and S is based on a quasi-static method described in detail in [73]. Thermal
conductivity and thermoelectric power are determined by modeling the thermal and electri-
cal response of the sample to a low-frequency square-wave heat pulse. Simultaneously, the
average sample temperature is slowly increased, thus allowing continuous measurements.
– 26 –

3.1. Measurements with commercially available systems
The resistivity is obtained by an ac method as described above. The same contacts are
used for measuring κ, S, and ρ.
The thermometer and heater shoes were attached to the sample by 4 gold-coated copper
contact pads. Generally, mounting was accomplished using silver-filled, electrically con-
ductive epoxy (EpoTek H20E from Polytec), which creates robust contacts. The bonding
can only be removed by forcing the contact pads apart and polishing the samples. For thin
and sensitive samples therefore silver conductor N4922 was used, which can be resolved in
acetone. The disadvantage of this method is that the resulting contacts are more fragile.
Therefore, mounting was carried out after screwing the thermometer and heater shoes to
the contact pads.
The heat pulse is applied by a resistance-chip heater fixed on a gold-plated copper shoe.
Two CernoxTM resistors mounted on similar shoes measure the temperature difference
along the sample. These shoes are screwed onto the contact pads on the sample. The
last pad is fixed to the coldfoot on the sample holder. The heater power was chosen in a
way that the temperature difference ΔT along the sample was at most 3 % of the average
sample temperature. Test measurements with different T gradients did not reveal any
influence of ΔT on the absolute measured values.
The measured thermal voltage is corrected for the thermopower of the manganin wires.
The thermal conductivity is calculated taking into account the radiation losses of the
sample and thermometer shoes. Nevertheless, the radiation losses affect the data above
200 K and the results are disregarded in the following. The resolution at low T is limited
due to the small heat pulses. Especially for samples with low thermopower the data quality
becomes poor below 5 K. Since the resistivity is measured simultaneously with κ and S, a
comparison with the results from electrical transport measurements provides an indication
of the contact quality. However, resistivity data shown in this thesis are mostly obtained
from electrical transport measurements.
The accuracy of thermal transport measurements with the PPMS depends on the ge-
ometry and thermoelectric properties of the sample. Using the specifications of the device,
the following uncertainties can be estimated for a typical crystal size of 5 × 1 × 1 mm3:
thermal conductivity:
T < 15 K ±5 % or 0.01 W/Km whichever is greater
15 < T < 200 K ±5 % or 0.1 W/Km whichever is greater
thermopower: ±5 % or ±0.5 μV/K whichever is greater
The measured temperatures and voltage at the hot and cold contact of the sample rep-
resent an average over the contact area. If these contacts are not small compared to the
sample size, systematic errors in the measurement may occur. Repeated measurements
on a small sample (YbRh2Si2, approximately 4 × 2 × 0.1 mm3), each with new contacts,
revealed relative deviations in S of approximately 15 % (cf. Chap. 5.2.3). The tempera-
ture dependence S(T ), however, was not affected. It is therefore assumed that the S(T )
– 27 –

Chapter 3. Experimental techniques
data are qualitatively correct, although a comparison of the absolute values for different
samples has to be done with caution.
The PPMS allows quick and easy measurements of κ and S. However, its application
is restricted to samples with appropriate geometry and thermal conductance. These lim-
itations are discussed in more detail in Sec. 3.2 in connection with a new experimental
setup for measuring thermal transport in the temperature range from 1.5 K to 250 K.
3.1.4 Specific heat
The PPMS uses a relaxation-time method to measure the specific heat in the temperature
range from 1.8 K to 400 K. The 3He insert of the PPMS allows measurements down to
350 mK. The mass of the samples was typically 10 mg. For compounds with large specific
heat at low temperatures, e.g. materials with magnetic phase transitions, smaller samples
of approximately 1 mg were used in order to reduce the measurement time. The samples
were fixed with grease Apiezon N on the saphire platform of the sample holder. The
contribution of the grease and platform to the total heat capacity was determined in a
separate measurement before mounting the sample. It becomes considerable above 10 K
and typically reaches at most 70 % of the total heat capacity at high T for a sample mass
of 10 mg.
3.2 A new setup for measuring thermal transport in
magnetic fields
3.2.1 Motivation
Investigations of the thermal conductivity κ and the thermopower S using the PPMS can
be performed on samples with appropriate geometry and thermal conductance: The size
of the thermometer and heater shoes restricts measurements to samples with a minimum
length of approximately 4 mm. In order to avoid thermal short links along the wires of the
thermometers and heater and to limit thermal diffusion times, a minimum conductance
K of the samples of 10−3 W/K is required. For a distance l between the thermopower
contacts and a sample cross section A, the thermal conductance is related to the thermal
conductivity as K = κ ·A/l. Therefore, samples with very low κ, such as clathrates, need
to have a sufficiently large cross section. Furthermore, the risk of damage arises for thin
samples, since they have to carry the mass of the thermometers and the heater. Careful
bending of the wires may reduce tensions in the sample and contacts. However, for very
thin samples of � 50 μm the mounting becomes difficult and in some cases impossible.
In order to overcome these limitations of the PPMS, the assembly of a new experimental
setup was initiated, which is optimized to measure small and thin samples and samples
with low thermal conductances. Furthermore, it was intended to use the same setup
– 28 –

3.2. A new setup for measuring thermal transport in magnetic fields
for investigations of the transverse thermal transport in magnetic fields: the (adiabatic)
Nernst effect and the thermal Hall effect. Both, the Nernst voltage and the thermal Hall
gradient are extremely small in most normal metals. The Nernst coefficient of gold is of
the order of 0.1 nV/KT [62]. In semiconductors and exotic materials somewhat larger
values are usually found: The ”giant” Nernst signal measured in 6 T on the heavy-fermion
compound CeCoIn5 reaches a maximum of approximately 1.8 μV/K around 5 K [3]. This
corresponds to a voltage of 180 nV for a longitudinal thermal gradient of 2 % of the average
sample temperature. Investigations of the thermal Hall effect in the high temperature
superconductor YBa2Cu3O7−δ showed a broad maximum around 40 K. The associated
thermal Hall gradient was of the order of 10−3 K/mm [54]. Although these numbers do
not represent the actual ’records’ in Nernst and thermal Hall effects, they serve as examples
of typical values. Hence, for investigations of the Nernst and thermal Hall coefficient, small
voltages and temperature differences have to be resolved.
Another request was the compatibility with a low temperature setup for investigations
in the mK range. For this purpose a separate assembly is used for mounting the sample,
which fits to the sample holder of an experiment for measuring thermal transport at
temperatures down to 50 mK in a 3He/4He dilution refrigerator. This allows investigations
in a large temperature range from 50 mK to 250 K without remounting the sample.
The next section describes in detail the experimental realization. Subsequently, the
calibration procedure for the thermometers, and the preparation and calibration of the
thermocouples are explained. After a brief description of the measuring procedure the
results on a standard sample are presented to demonstrate the reliability of the apparatus.
Finally the achieved measurement accuracy as well as limitations of the new setup and
possible improvements are discussed.
3.2.2 Experimental setup
The experimental setup was installed in a Spectromag dewar (Oxford Instruments). The
system consists of a nitrogen-shielded 4He cryostat with a variable temperature insert
(VTI). The temperature of the VTI may be varied between 1.4 K and 320 K. The cryostat
is provided with a split-coil magnet, which generates horizontal magnetic fields up to 7 T.
The horizontal field orientation allows for correction of transverse misalignment signals due
to a non-ideal contact geometry by rotation of the complete sample rod. This procedure is
much faster than changing the direction of the field by sweeping from positive to negative
values, especially in high magnetic fields. Furthermore, inductive heating of the sample
holder is reduced. For this purpose a rotational unit with a stepper motor was fitted to
the cryostat. The angle can be varied in steps of approximately 0.31◦. Additionally, 2
stoppers were attached, which allow direct access of two positions at a spacing of 180◦.
The sample rod provided with the cryostat includes a sample chamber with separate
brass and copper shielding. The sample chamber is closed with a conical sealing. In order
– 29 –

Chapter 3. Experimental techniques
manganin
heater
sample with
gradient heater
and thermocouple
copper
cylinder for
thermalization
Cu platform with
thermometer and
Hall sensor (on
the back)
silver
Z piece
copper
blocks
copper
frame
10 mm
Figure 3.1: A photo of the sample holder together with a schematic drawing. The platform
of the sample holder and the sample with the contacts for measuring thermal conductivity
and thermopower are shown on a larger scale.
to improve the leak tightness, silicon elastomer (CAF 1 from Rhodia Silicones) is applied
to the sealing joint. A turbomolecular pump is used to evacuate the sample chamber
during measurements. The inner diameter of the sample chamber of 26 mm and its length
of approximately 170 mm restricted the possible dimensions of the sample holder.
A photo of the sample holder with a sample mounted for measuring κ and S is shown
in the upper part of Fig. 3.1. The lower part displays a schematic drawing. The sample
holder consists of a copper cylinder for thermalization of the wires and a copper frame
with a platform, which is used as a cold bath for the sample. To determine the tempera-
ture two CernoxTM chip-resistor thermometers (CX 1050 from Lake Shore) were installed.
Sensor 1 (temperature T1) is located inside the copper cylinder in the compensated zone
of the magnet. It is used as a reference for measurements in magnetic fields. The second
thermometer (temperature T2) was placed on the platform near the sample and measures
– 30 –

3.2. A new setup for measuring thermal transport in magnetic fields
the bath temperature. A third CernoxTM thermometer was placed on the hot side of the
Ni sample during the calibration of the thermocouples (cf. Sec. 3.2.3). The temperature of
the sample holder is stabilized by means of a temperature controller (LS 340, LakeShore),
which drives a manganin-wire heater glued to the copper cylinder. The sample is fixed to
a Z-shaped piece of silver, which is then attached to the copper platform. This Z also fits
to the sample holder of the setup for measuring thermal transport at low temperatures. A
Hall sensor (BHA 921, F.W. Bell) allows the determination of the angle between sample
holder and the horizontal magnetic field. The temperature gradient along the sample is
applied by a small resistance-chip heater with a room-temperature resistance of 2 kΩ. The
released heater power is calculated from the current and the measured voltage. The heater
is thermally insulated from the sample holder via four manganin wires with a diameter
of 30 μm and a length of approximately 5 cm. This ensures that even for samples with
a typical size of 1 × 1 × 5 mm3 and a low thermal conductivity (κ > 130
κmanganin), more
than 99 % of the released heat enters the sample.
The temperature gradient along the sample as well as the thermal Hall gradient is
measured using thermocouples1. Two different types have been calibrated and tested.
Type-E thermocouples consisting of chromel (Ni90/Cr10) and constantan (Cu57/Ni43)
are relatively cheap and suitable in the temperature range above 6 K. Calibration tables
are in general roughly reproduced by type-E thermocouples, although high-accuracy mea-
surements require an individual calibration [74]. They have a very weak magnetic field
dependence of less than 3 % for B ≤ 6 T and T ≥ 7 K [75, 76]. At temperatures below
10 K, however, the sensitivity of type-E thermocouples becomes small. In particular, they
are not suited to measure the very small temperature differences expected for the ther-
mal Hall effect. For this purpose thermocouples made of chromel and gold alloyed with
0.07 % iron (AuFe0.07%) are more suitable. They exhibit relatively large thermopowers
of more than 8 μV/K down to 1.5 K. However, due to the good thermal conductivity of
the AuFe0.07%, which is more than one order of magnitude larger than that of constantan
[74, 77, 78], they are not suitable for samples with very low thermal conductance. Fur-
thermore, thermocouples prepared from different batches of AuFe0.07% wire and sometimes
even individual specimens have different thermopowers and need to be calibrated [79, 80].
Additionally, chromel-AuFe0.07% thermocouples have a much stronger field dependence
than type-E thermocouples [75]. A detailed description of the preparation and calibration
of the thermocouples is given in Sec. 3.2.3.
The outer chromel wires of the thermocouples as well as the manganin wires used for
measuring the thermal voltages of the sample are screwed to small copper blocks on the
sample holder. These copper blocks are electrically insulated, but thermally coupled to the
1In the strict sense, the thermocouples are used to measure temperature differences. The correspondingcomponents of the temperature gradient ∇T are obtained from the sample and contact geometry. However,for simplicity the terms ’temperature gradient’ and ’thermal Hall gradient’ are also used throughout thiswork to denote the temperature differences ΔT along specific directions.
– 31 –

Chapter 3. Experimental techniques
sample holder to ensure thermal equilibrium. In order to minimize thermal voltages, high-
purity copper wires are lead undisrupted from the copper blocks outside the cryostat. The
electrical connection to the feed cables of the nanovoltmeters is realized using a second
set of copper blocks inside a thermally insulated aluminum box. All thermal voltages
are measured with nanovoltmeters (NV2182, Keithley). The software, which controls the
measuring instruments during the calibration and measurement procedure, was written in
TestPoint (Keithley).
The copper frame has a number of holes, which allow to span nylon threads across the
frame. For thermally well conducting samples, the wires going from the sample to the
copper blocks may be fixed on the nylon threads using low temperature varnish (e.g. GE
C5-101 from Oxford). This permits to reduce the noise due to vibrations, especially in a
magnetic field. However, for samples with a low thermal conductance a careful estimation
of the heat flow along the sample and wires is necessary to exclude thermal short circuiting
of the sample.
To reach temperatures below 7 K, the VTI needs to be filled with liquid helium. During
the tests of the system it was not possible to reach leak tightness to superfluid He. As a
result, the high-vacuum conditions necessary to determine the thermal conductivity could
not be achieved below 7 K. However, test measurements showed that the thermopower
and consequently also the Nernst coefficient may be measured with high accuracy down
to 1.5 K (cf. Sec. 3.2.5).
3.2.3 Thermometry
Thermometer calibration
The two thermometers on the sample holder were commercially calibrated in zero magnetic
field. A comparison of T1 and T2 measured simultaneously showed that the gradient along
the sample holder is less than 0.7 % for T > 4 K. Therefore, the first thermometer may be
used as a reference for T2 in magnetic fields. Below 4 K, where the VTI is filled with liquid
He, the gradient increases up to 10 %. In this temperature range a field calibration of T2
is desirable for a precise determination of the sample temperature. A third thermometer
(resistance R3) is used for the calibration of the thermocouples. It was calibrated on the
sample platform against the thermometer in the compensated zone in zero magnetic field
between 1.47 K and 300 K. In order to reduce the temperature gradient along the sample
holder at low T , some exchange gas was left in the sample chamber. The data are typical
for CernoxTM thermometers and were fitted by a polynomial of 9th order describing lnT
as a function of ln R3. The relative deviation between fit and data is less than 0.5 % in
the whole investigated temperature range. Since the data points have been taken during
several temperature sweeps, this value also serves as an estimate for the stability of the
calibration after warming up the sample chamber to room temperature.
A field calibration of the two thermometers at the platform was performed for
– 32 –

3.2. A new setup for measuring thermal transport in magnetic fields
T < 15 K. At higher temperatures ΔT/T is expected to be less then 0.1 % in fields
up to 7 T [81, 82] and thus well below the reproducibility of the calibration of 0.5 %. The
resulting calibration curves are typical for CernoxTM thermometers and similar to those in
[82]. The deviations between the real temperatures T2,3 and the temperatures if calculated
using the zero field calibration are at most 4 % in the whole investigated temperature and
field range (T ≥ 1.5 K, B ≤ 7 T). For temperatures above 2 K (B ≤ 7 T) or alternatively
for T ≥ 1.5 K and fields B ≤ 5 T the deviation is below 1 %. A field correction is therefore
only necessary at lowest temperatures and large fields.
Temperature stabilization
Two criteria are used in order to determine the reaching of thermal equilibrium inside
the sample chamber: The standard deviation of the temperature recorded over a certain
time (1-2 minutes) as well as the drift of the average temperature of each thermometer
during that time had to fall below a certain value. Typically, the drift was demanded
to be less than 0.01 %, the standard deviation below 0.03 % of the average temperature.
This ensures thermal stability even after the application of small temperature gradients
of 0.5 % to 2 % of the average temperature. At lowest temperatures (T ≤ 7 K) the drift
was typically less than 0.05 %, the standard deviation below 0.08 % of the average tem-
perature, due to increased noise and lower absolute values.
Thermocouple preparation
The thermocouples were prepared from bare wire with a diameter of 25 μm. The length
of the outer chromel wires is determined by the experimental setup to be approximately
7 cm. The length of the AuFe0.07% and constantan wires was calculated such that at
most 1 % of the heat released into the samples flows through the thermocouple and ther-
mopower wires. Calculations were performed for LuRh2Si2 with a typical single crystal
size of 4 × 1 × 0.05 mm3. The thermal conductivity of this material was determined from
measurements in the PPMS. Due to the very small cross section of the crystals the result-
ing wire length may be taken as an upper limit for all samples investigated in this thesis.
However, for materials with very low thermal conductivity, such as clathrates, it has to be
verified for each sample, whether the heat losses along the wires are negligible. Likewise
a careful evaluation is necessary, if the thermocouple wires may be fixed on nylon threads
inside the frame. The AuFe0.07% wires were calculated to be at least 5 cm, the constantan
wires 0.5 cm long.
A photo of a chromel-AuFe0.07% thermocouple together with a schematic drawing is
shown in Fig. 3.2. The AuFe0.07% wire2 was wound to a coil with a diameter of ap-
proximately 2 mm and 6-8 turns. The ends of the coil were then spot-welded to the
outer chromel wires. Finally the connections were fixed and electrically insulated with
2specification: diameter 0.025±0.003 mm; purity 99.9+ %; elements (ppm): Ag < 50, Ca < 3, Cu < 20,Fe 700, Mg < 20, Pb < 1, Pd < 10, Pt < 10, Si 1
– 33 –

Chapter 3. Experimental techniques
AuFe wire0.07%
chromel wire
spot-weldedcontact
stycast insulation
2 mm
Figure 3.2: Photo and schematic drawing of a chromel-AuFe0.07% thermocouple
small drops of Stycast 1266 (Emerson & Cuming), which forms balls with a diameter of
0.3-0.7 mm. In case of the type-E thermocouples the inner constantan wire was used un-
bent.
Thermocouple calibration in zero field
For the calibration of the thermocouples a Ni standard sample provided with the PPMS
was attached to the platform. It consists of a long bar with three legs for mounting the
thermometers and heater in a PPMS measurement. This shape qualifies it ideally for the
calibration procedure: The legs are expected to be at a constant temperature even in the
presence of a thermal gradient along the bar. The contacts of the thermocouples and
the thermometers were placed close to each other on opposite sides of the legs. There-
fore, temperature differences between the thermocouple contacts and the thermometers
are expected to be negligible. Due to the limited space and the requirement, that none of
the wires should touch another in order to avoid thermal and electrical short links, only
three thermocouples were simultaneously calibrated up to 250 K: two made of chromel-
AuFe0.07% and one of type E. The results of the calibration in zero magnetic field are
shown in Fig. 3.3. The uncertainty of the measured thermoelectric power is typically
0.1-0.2 μV/K. Additionally, thermocouple calibration curves taken from literature [83] are
shown as a line in Fig. 3.3. In case of the type-E thermocouple the calibration curve
is well reproduced. At temperatures above 220 K, however, the measured data start to
deviate. This may be an indication of thermal radiation losses. The good agreement at
lower temperatures demonstrates the reliability of the calibration procedure.
The measured temperature dependence of the thermoelectric power of the chromel-
AuFe0.07% thermocouples differs from the literature data, although the general behavior
is very similar. Such deviations are well known for chromel-AuFe0.07% thermocouples
due to a sensitive dependence of S(T ) on inhomogeneities and the exact stoichiometry
of the AuFe0.07% alloy. Therefore, in principle, each thermocouple requires an individual
– 34 –

3.2. A new setup for measuring thermal transport in magnetic fields
Figure 3.3: Calibration curves for chromel-AuFe0.07% and type-E thermocouples in zero
magnetic field. The lines are values taken from calibration tables (see text).
calibration. Pieces of AuFe0.07% wire drawn from the same batch, however, have been
found to exhibit almost identical thermoelectric powers [80]. In accordance with this, the
two self-made chromel-AuFe0.07% thermocouples calibrated during this thesis have a very
similar S(T ) dependence (Fig. 3.3) with slightly different absolute values. Both calibration
curves were fitted with a rational function describing S as a function of ln T . The relative
deviation between the fits of both thermocouples is less than 3 % in the whole investigated
temperature range. It may therefore be supposed that all thermocouples prepared from
the corresponding batch of AuFe0.07% wire have a uniform S(T ) behavior, with small
deviations in their absolute values. Fig. 3.4 shows the results of the fitting for one of the
chromel-AuFe0.07% thermocouples (No. 1). In the inset, the relative deviation between the
fit and the data is plotted. It is typically below 1 % at elevated temperatures (T > 7 K)
and reaches at most 2.5 % for the lowest temperature of 1.5 K. These deviations reflect
the uncertainty in measuring the thermopower of 0.1-0.2 μV/K. The fitting functions
and parameters can be found in the Appendix to this thesis. The calibration curves
were reproduced within 1 % of the absolute values after warming up and remounting the
thermocouples.
Field calibration of the thermocouples
The two thermocouples from chromel-AuFe0.07% were calibrated in magnetic fields of up
to 7 T with steps of 1 T. The 4 T and 7 T curve were measured up to 100 K and 200 K,
respectively. Data at other fields were measured in the temperature range from 1.5 to 25 K.
– 35 –

Chapter 3. Experimental techniques
Figure 3.4: Calibration curves for chromel-AuFe0.07% thermocouple No. 1 in zero magnetic
field and in 7 T. The line shows the fit for B = 0. In the inset, the deviation of the data
from the fit is plotted as (S − Sfit)/Sfit vs. T .
A linear interpolation was used to estimate the thermopower at higher temperatures.
Both thermocouples exhibit a strong, nonlinear magnetic field dependence S(T, B).
Fig. 3.4 compares the results obtained on thermocouple No. 1 in 0 T and in 7 T. At low
temperatures the thermopower in 7 T is enhanced with respect to the zero-field curve by
up to 30 %. Significant deviations are found even at 200 K. Fig. 3.5 shows the relative
change of the thermopower of thermocouple No. 1 as ΔS/S = (S(B) − S(0))/S(0) in
various magnetic fields. For clarity, not all fields are shown. Both, the temperature
dependence and the absolute values of ΔS/S are similar to experimental results reported
in literature [75]. The data ΔS/S were fitted by a rational function of half order of lnT .
The fitting functions and parameters are given in the Appendix to this thesis. The results
are shown as lines in the main plot of Fig. 3.5 for the presented fields. The inset of Fig. 3.5
displays the fitting results for all magnetic fields. The thermopower changes systematically
with field and temperature. At high temperatures T > 20 K, the absolute values of ΔS/S
are relatively small. Therefore, a linear interpolation for fields below 7 T was used. At low
temperatures a large maximum is found for ΔS/S, which shifts to higher temperatures
with increasing field. For B > 3 T the height of this maximum is almost field-independent.
Very similar results for ΔS/S were obtained on thermocouple No. 2 (not shown). It is
remarkable that, although both thermocouples exhibit slightly different calibration curves
in zero field, the relative change in a magnetic field is the same within the resolution of the
– 36 –

3.2. A new setup for measuring thermal transport in magnetic fields
Figure 3.5: Deviation of the calibration in selected fields from the zero field curve for one
of the chromel-AuFe0.07% thermocouples (No. 1) as ΔS/S vs. T . The lines are a fit to the
data. The inset shows the fit results for all measured fields.
measurement. For future calibration procedures it is therefore suggested to compare the
relative change in 7 T with the presented data in order to decide, whether an individual
calibration in all fields is necessary.
A weak dependence of the calibration of chromel-AuFe0.07% thermocouples on the mag-
netic field orientation has been reported, with (S‖ − S⊥)/S < 2 % for fields up to 6 T at
T > 4 K [84]. In the presented setup, the thermocouples need to be mounted separately
for each sample. Therefore, a small error in the calibration due to the orientation with
respect to the magnetic field cannot be excluded.
3.2.4 Measurement procedure
For measurements of the thermal transport properties in magnetic fields the sample is
mounted on the silver Z with GE low-temperature varnish (C5-101, Oxford Instruments).
A piece of cigarette paper or a sapphire plate with a thickness of 0.2 mm can be used to
guarantee electrical insulation. However, this may degrade the thermal contact between
the sample and the bath. Alternatively, the sample can be mounted by soldering with
indium or using silver-filled epoxy (EpoTek H20E, Polytec). At the free end of the sample
the resistance chip heater is attached using varnish. 4 gold wires with 50 μm or 100 μm
diameter and a typical length of 2 to 4 mm are fixed with silver conductor or silver-
filled epoxy on the sample. These contacts for longitudinal and transversal transport
– 37 –

Chapter 3. Experimental techniques
properties should be placed on different sides of the sample in order to use the available
space efficiently. Bare manganin wires are then attached to the gold wires for measuring
the longitudinal and transverse thermal voltages of the sample. On the same Au wires the
thermocouples for measuring the temperature gradients are fixed with GE varnish.
All devices and measurement operations are controlled by a TestPoint program. During
the measurements, the temperature is stabilized with respect to T1 (compensated zone).
This procedure turned out more robust than stabilization of the platform temperature
T2. For measuring thermal conductivity and thermopower several temperature gradients
are generated along the sample. The maximum temperature difference between the ther-
mopower contacts that was used is about 2 % of the average sample temperature, with a
typical temperature gradient series of 0 %, 0.5 %, 1 %, 1.5 %, 2 %, 0 %. After reaching
thermal equilibrium, the heater power P , the temperature difference ΔT calculated from
the thermocouple voltage UTC and the thermal voltage of the sample Us are recorded over
a time of 1-2 minutes. The temperature stability during this measurement was usually
better than 0.03 %, the drift below 0.01 % (Sec. 3.2.3). κ and S are determined from
linear fits to the data according to:
κ = − dP
dΔT (UTC)
l
AS = − dUs
dΔT (UTC)(3.1)
Here, A and l denote the sample cross section and the distance between the thermocou-
ple contacts3. Fig. 3.6 shows an example for the measurement of one point of S and
κ. The platform temperature T2 (Fig. 3.6a), the temperature gradient along the sam-
ple ΔT (3.6b), the gradient-heater power P (3.6c) and the thermal voltage of the sample
US (3.6d) are recorded during the application of different heat pulses. Fig. 3.6e and f show
the corresponding dependencies P (ΔT ) and Us(ΔT ) together with the linear fit used for
the determination of κ and S.
The measurement principle for the thermal Hall and Nernst coefficient is similar. At a
given temperature and field, the transverse voltage Utrans and the longitudinal and trans-
verse temperature differences ΔTlong and ΔTtrans are measured for several applied heater
powers. The Nernst coefficient νa is calculated as:
νa = − dUtrans
dΔTlong
1
B
b
l(3.2)
b denotes the distance between the Nernst contacts on the sample. A calculation of the
thermal Hall coefficient requires additionally the knowledge of the longitudinal thermal
conductivity along the transverse direction κyy (cf. Eq. 2.18):
L = −dΔTtrans
dΔTlong
κyy
B(3.3)
The measurement may be repeated for different fields before changing the temperature of
the sample holder. Test measurements revealed that the resolution of the data is better
3The negative sign for S follows from the definition−→E = S∇T with
−→E = −∇U .
– 38 –

3.2. A new setup for measuring thermal transport in magnetic fields
Figure 3.6: Example of a measurement of κ and S at 10.2 K. (a)-(d) show the evolution of
the platform temperature T2, the temperature gradient along the sample ΔT , the gradient
heater power P and the thermal voltage of the sample Us with time t. The dependencies
P (ΔT ) and Us(ΔT ) together with the linear fit used for the determination of κ and S are
shown in (e) and (f).
– 39 –

Chapter 3. Experimental techniques
for temperature sweeps at constant field than for field sweeps at constant temperature.
A correction for the longitudinal misalignment signals is performed by either rotating the
sample holder or measuring at +B and −B. The more suitable procedure depends on the
size of the magnetic field and the type of sample. Since the rotation of the sample holder
generates vibrations of the wires, noise voltages are induced in a magnetic field. More-
over, for sensitive samples it may be better to measure at +B and −B in order to avoid
shocks. Presently, the correction for the magnetic field dependence of the thermometer
and thermocouple calibration curves has to be applied after the measurement.
The Seebeck and Nernst voltage of the sample measured with this setup require a
correction for the thermal voltage of the manganin wires. The thermoelectric power of
manganin is very small and does not exceed 1 μV/K in the whole investigated temperature
range [85]. Therefore, it can be neglected for all samples presented in this thesis, except
for the test measurements on the Ni standard sample (Sec. 3.2.5). For the temperature
range below 90 K the exact thermopower of the used batch of manganin wire was also
determined from a measurement of a high-Tc superconductor.
A direct determination of the average sample temperature Ts with the described setup
is not possible. Without an applied temperature gradient it may be assumed that it is
identical to that of the platform Ts = T2. In the presence of a temperature gradient, the
average sample temperature deviates from T2. For a bad thermal contact between sample
and platform, the difference Ts − T2 may be much larger than the temperature gradient
along the sample. In order to reduce the influence of sample heating on the results, the
following precautions were taken:
1. The maximum temperature gradient along the sample was generally restricted to
approximately 3 % of the platform temperature.
2. Before measuring a temperature dependence, the linearity of the thermal voltage sig-
nal Us ∝ ΔT was checked at a temperature with a strong dependence S(T ), e.g. near
a point, at which S changes sign. Any sample heating then causes a nonlinearity in
Us(ΔT ).
3. The temperature dependence of the thermopower S(T ) was calculated both from a
linear fit using all temperature gradients and using only the smallest temperature
gradient. Apart from a larger noise in the second case, both curves should fall on
top of each other. Systematic deviations indicate a significant sample heating.
3.2.5 Test measurements
In order to check the accuracy of the measuring process, a Ni standard sample provided
with the PPMS was investigated in the new setup. This sample is shaped ideally to be
measured in the PPMS. Additionally, the special form of the sample of a bar with three
legs (cf. Sec. 3.2.3) allows an exact determination of the geometrical form factor for the
– 40 –

3.2. A new setup for measuring thermal transport in magnetic fields
Figure 3.7: Temperature dependence of the thermal conductivity (a) and thermopower
(b) obtained with the PPMS and the new setup. The correction for the manganin wires
of the thermopower data measured with the new setup was done in two ways: (1) using
the data provided with the PPMS and (2) using data obtained from a measurement of a
high-Tc superconductor for T < 90 K. The inset of (b) shows the low-T data on a linear
scale.
thermal conductivity. Therefore, errors due to a non-ideal sample geometry or inappropri-
ate thermal conductance may be excluded. Thermopower and thermal conductivity data
obtained on the Ni standard with the PPMS are expected to be correct.
Fig. 3.7 compares the temperature dependence of the thermal conductivity and ther-
mopower obtained with the PPMS and the new setup. The inset of Fig. 3.7b shows the
low-T data of S(T ) on a linear scale. The determination of the thermopower (Fig. 3.7b)
requires a correction for the manganin wires. Initially, this was performed using the data
provided with the PPMS. The thermopower curve obtained with the new setup that way
(curve (1) in Fig. 3.7b) well reproduces the PPMS data in the whole investigated temper-
ature range. However, a small, almost constant difference of approximately 0.5 μV/K is
observed. This is most likely due to an inaccurate correction for the manganin wires. For
an alloy as manganin the behavior of S(T ) is expected to depend on the exact stoichiom-
etry and homogeneity of the material. Therefore, additionally a high-Tc superconductor
(YBa2Cu3O7−x) was measured. Since the intrinsic thermopower is expected to be zero
below the superconducting transition temperature of Tc = 90 K, the measured S(T ) rep-
resents the thermopower of the manganin wires. These data allow a correction for the
specific contribution of the batch of manganin wires used in the experimental setup below
– 41 –

Chapter 3. Experimental techniques
90 K. A polynomial fit is given in the Appendix to this work. The thermopower obtained
from a correction for these data fall exactly on top of the PPMS data for T > 30 K (curve
(2) in Fig. 3.7b). At low temperatures small deviations between the PPMS and the new
experiment are observed (inset of Fig. 3.7b). While the PPMS data level in at a constant
value of approximately -0.5 μV/K for T → 0 K, the data obtained with the new setup ex-
trapolate to S = 0, as expected in every material. Therefore, the thermopower measured
with the new setup is most likely more precise. Additionally, the noise is much reduced
with respect to the PPMS data. Another advantage is the enlarged measurement range at
low T : While the PPMS allows thermopower investigations above approximately 2.2 K,
the new apparatus may be used down to 1.5 K. Likewise, measurements of the Nernst
signal N , which corresponds to a transverse thermal voltage in a magnetic field, may be
performed with high accuracy.
The thermal conductivity measured with the new setup shows a qualitatively simi-
lar behavior as the data obtained with the PPMS (Fig. 3.7a). Especially at low T the
agreement is very close. However, for T > 50 K systematic deviations are observed. The
thermal conductivity determined in the new setup is reduced with respect to the PPMS
data. The deviations become larger with increasing temperature and reach up to 8 %
around 200 K. Due to the very good agreement in the thermopower curves, errors in the
calibration of the thermocouples or thermometers are excluded. Instead, it is more likely
that the deviations of the κ curves arise from heat losses along wires or due to radiation.
However, since such losses induce an apparently too large thermal conductivity, this may
not account for the reduced κ observed in the new setup. An alternative cause might be
losses in the PPMS giving rise to enhanced κ values. Nevertheless, it cannot be excluded
unambiguously that the observed deviations are due to a fault of the new setup. There-
fore, an interpretation of thermal conductivity data above 50 K has to be performed with
caution. Since the thermal conductivity is also used in the determination of the thermal
Hall coefficient (Eq. 2.18), similar limitations hold for the measurement of L.
3.2.6 Measurement accuracy
At this point, the main uncertainties in measuring thermal transport properties with the
new setup shall be summarized. Comparing these, the relevance of different error sources is
evaluated. Finally, the achievable accuracy of the data shall be discussed. In the following
u(x) is used to denote the absolute error or uncertainty of a measured value x.
temperature T2 at the sample platform
- stability of the calibration after warming up to room temperature:
u(T2)/T2 ≈ 0.5 %
- relative deviation between fit and calibration data: u(T2)/T2 ≈ 0.5 %
– 42 –

3.2. A new setup for measuring thermal transport in magnetic fields
It is concluded that in zero magnetic field the uncertainty of the temperature at
the sample platform is approximately 1 % of the absolute value. Thus, the effect
of magnetic fields on the thermometer calibration is negligible for T > 2 K, and at
T < 2 K for B < 5 T. It amounts to at most 4 % at 1.5 K and 7 T (Sec. 3.2.3).
average sample temperature Ts: As explained above, a direct determination of the
average sample temperature with the described setup is not possible. However,
checking the linearity of Us(ΔT ) in a T range with a strong S(T ) dependence allows
to reduce the influence of sample heating on the results. For the measurements
on CeNiSn, which are presented in Chap. 6, the relative uncertainty in Ts due to
heating could be estimated to be less than 2 %. Taking this as a typical value and in
consideration of the limited accuracy of the platform temperature, the uncertainty
of Ts is at most 3 %.
thermal voltages
- accuracy and resolution of the voltage U : u(U) < 10 nV
- influence of the manganin wires: Smanganin ≤ 1.5 μV/K
The manganin contribution to the Nernst signal may generally be ignored due to the
small absolute values of Smanganin and the low transverse temperature gradient. The
relevance of Smanganin for thermopower measurements depends on the thermopower
of the investigated material.
temperature gradients
- uncertainty of the thermocouple voltage: u(UTC) < 10 nV → u(ΔT ) � 1 mK
- stability of the calibration u(ΔT )/ΔT ≈ 1%
- relative deviation between fit and calibration data:
u(ΔT )/ΔT < 1 % (T > 4 K)
u(ΔT )/ΔT < 2.5 % (1.5 K < T < 4 K)
The limited accuracy of the thermal voltage induces relatively large uncertainties
for the temperature gradient at lowest T . For a gradient of 2 % along the sample
u(ΔT )/ΔT reaches at most 6.5 % at 1.5 K. However, since the deviations between fit
and calibration data mainly reflect the limited resolution of the voltage measurement
and the fitting implies an averaging, it is supposed that the real uncertainty is
smaller. Above 4 K the uncertainty is estimated to less than 3 %. In magnetic
fields, additional uncertainties arise due to a possible direction dependence of the
calibration curve.
– 43 –
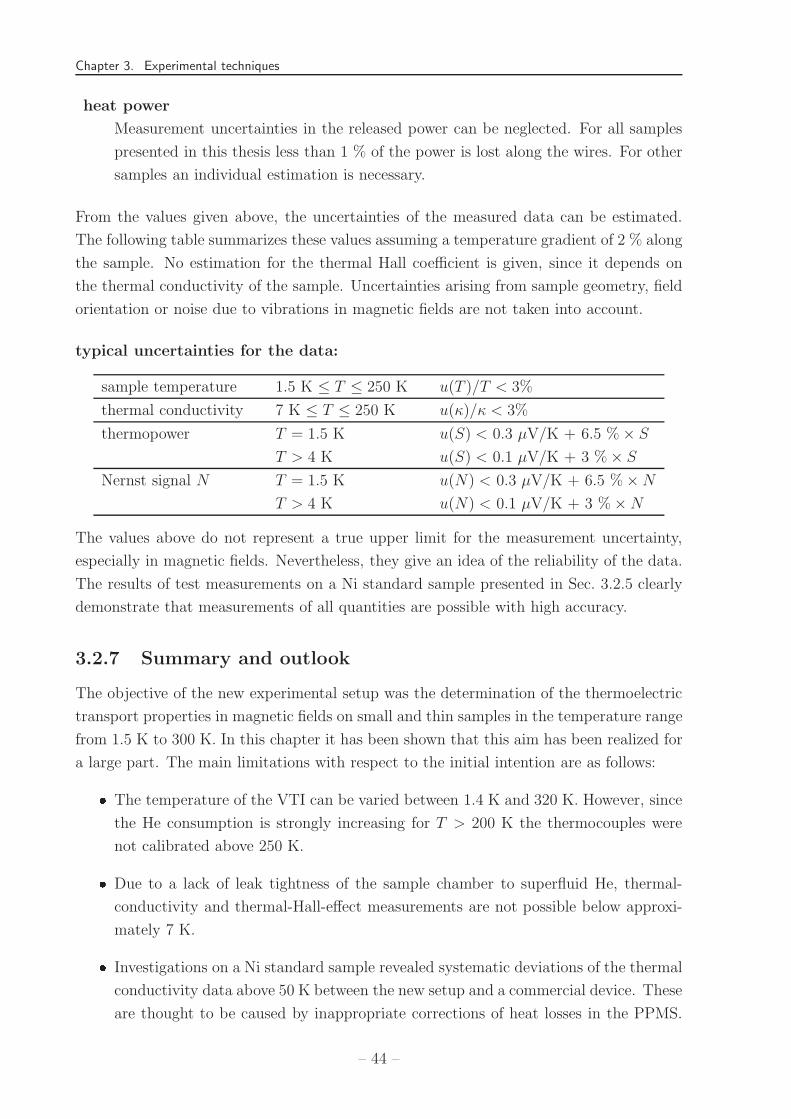
Chapter 3. Experimental techniques
heat power
Measurement uncertainties in the released power can be neglected. For all samples
presented in this thesis less than 1 % of the power is lost along the wires. For other
samples an individual estimation is necessary.
From the values given above, the uncertainties of the measured data can be estimated.
The following table summarizes these values assuming a temperature gradient of 2 % along
the sample. No estimation for the thermal Hall coefficient is given, since it depends on
the thermal conductivity of the sample. Uncertainties arising from sample geometry, field
orientation or noise due to vibrations in magnetic fields are not taken into account.
typical uncertainties for the data:
sample temperature 1.5 K ≤ T ≤ 250 K u(T )/T < 3%
thermal conductivity 7 K ≤ T ≤ 250 K u(κ)/κ < 3%
thermopower T = 1.5 K u(S) < 0.3 μV/K + 6.5 % × S
T > 4 K u(S) < 0.1 μV/K + 3 % × S
Nernst signal N T = 1.5 K u(N) < 0.3 μV/K + 6.5 % × N
T > 4 K u(N) < 0.1 μV/K + 3 % × N
The values above do not represent a true upper limit for the measurement uncertainty,
especially in magnetic fields. Nevertheless, they give an idea of the reliability of the data.
The results of test measurements on a Ni standard sample presented in Sec. 3.2.5 clearly
demonstrate that measurements of all quantities are possible with high accuracy.
3.2.7 Summary and outlook
The objective of the new experimental setup was the determination of the thermoelectric
transport properties in magnetic fields on small and thin samples in the temperature range
from 1.5 K to 300 K. In this chapter it has been shown that this aim has been realized for
a large part. The main limitations with respect to the initial intention are as follows:
� The temperature of the VTI can be varied between 1.4 K and 320 K. However, since
the He consumption is strongly increasing for T > 200 K the thermocouples were
not calibrated above 250 K.
� Due to a lack of leak tightness of the sample chamber to superfluid He, thermal-
conductivity and thermal-Hall-effect measurements are not possible below approxi-
mately 7 K.
� Investigations on a Ni standard sample revealed systematic deviations of the thermal
conductivity data above 50 K between the new setup and a commercial device. These
are thought to be caused by inappropriate corrections of heat losses in the PPMS.
– 44 –

3.2. A new setup for measuring thermal transport in magnetic fields
However, a systematic error in the determination of κ in the new setup cannot be
entirely excluded.
Despite these drawbacks, the new setup is applicable for various experimental problems.
In particular, it allows precise measurements of the thermopower on small and fragile
samples. The resolution of the data at low T has been shown to be significantly enhanced
with respect to the commercial PPMS, and the measurement range could be extended
down to 1.5 K. Moreover, investigations of the Nernst coefficient are possible with high
accuracy.
The current status of the setup allows for further developments. The main challenge
is an improvement of the leak tightness of the sample chamber at low temperatures. In
addition, the installation of a heat shield with separate temperature control would allow
to reduce radiation losses at high temperatures. Another option is the integration of a
simultaneous measurement of the electrical resistivity. Yet, already the actual state of the
setup allows for accurate and highly interesting investigations. This becomes apparent
in Chap. 6, which presents results obtained with the new setup on the thermoelectric
transport in CeNiSn, particularly thermopower and Nernst effect.
– 45 –

Chapter 3. Experimental techniques
– 46 –

Chapter 4
Cage compounds - candidates for
thermoelectric applications
Good thermoelectrics are characterized by a low lattice thermal conductivity κph and a
large thermopower S. Enhanced values of S are frequently observed in correlated rare-
earth systems (Chap. 2.2.4). Cage structures with loosely bound atoms inside the voids
have been proposed conducive to a low lattice thermal conductivity. Thus, the incor-
poration of rare-earth elements into cage structures appears a promising route to design
effective thermoelectric materials.
Over the last decade, a large number of new cage compounds, mainly clathrates [86]
and skutterudites [87], have been synthesized. However, the integration of rare-earth
elements into the structure turned out difficult. Concerning clathrates, Eu8Ga16Ge30 [88,
89] remains the only system with full occupancy of the cages by a rare-earth element.
Therefore, the search for new cage-structure types has become increasingly important.
Several Eu-containing clathrates have been newly synthesized and characterized at the
institute during the time of this work. The focus of this chapter lies on physical properties
of these compounds. After a general introduction to clathrates (Sec. 4.1), the results of
the measurements are presented and discussed with respect to the aspired thermoelectric
performance (Sec. 4.2 - 4.4). Additionally, a cage compound with skutterudite-like struc-
ture, Ce3Rh4Sn13, has been investigated (Sec. 4.5). Again, the emphasis of the discussion
is placed on the qualification for thermoelectric applications. The chapter closes with a
summary of the obtained results.
4.1 An introduction to clathrates
Clathrates are porous inclusion compounds, which consist of a host framework with large
voids and guest atoms or molecules residing inside these ’cages’. In the case of the clathrate
hydrates the network is formed by hydrogen-bonded water molecules, and the voids are
occupied by molecules or small atoms. By contrast, the inorganic clathrates exhibit a
– 47 –

Chapter 4. Cage compounds - candidates for thermoelectric applications
covalently bonded network composed by group III and IV elements with the cavities being
filled by cations [86]. In this thesis the term ’clathrate’ is generally used for inorganic
clathrates.
The increased interest in clathrates within the last years has been initiated by their
high potential with respect to technical applications. A rich variety of phenomena has been
observed in clathrates, among them (1) superconductivity, e.g. in (Na,Ba)xSi46 [90] and
Ba6Ge25 [91], (2) metal-insulator transition upon substitution x, e.g. in NaxSi136 [92, 93],
(3) energy gaps suitable for optical applications, e.g. in almost guest-free NaxSi136
(x < 0.1) [94], and (4) glass-like thermal conductivity important for thermoelectric de-
vices [95], e.g. in Sr8Ga16Ge30 [96].
Our investigations of clathrates were stimulated by the idea to combine the low lattice
thermal conductivities κph frequently realized in cage compounds with the high ther-
mopowers S characteristic for Kondo systems [1]. These two properties enter the dimen-
sionless thermoelectric figure of merit ZT , which is a measure for the effectiveness of
thermal-to-electrical energy conversion as well as for electric or Peltier cooling:
ZT =σS2T
κel + κph(4.1)
The maximum temperature difference, which can be achieved using a one-stage device is
ΔTmax =ZT 2
cold
2(4.2)
Values of ZT ≥ 1 are required for specialized technical applications, while general use of
thermoelectric instead of conventional refrigerators gets economically favorable for ZT ≥ 3
[97]. Besides κph and S the electronic transport coefficients κel and σ affect ZT . In
this context a good electrical conductivity σ is in conflict with a low total (lattice and
electronic) thermal conductivity. According to the Wiedemann-Franz relation 2.27, the
electronic part of the thermal conductivity κel is proportional to σT and thus limiting the
value of ZT , which can be obtained for a given S. In the ideal case of a negligible lattice
thermal conductivity, thermopower values exceeding 156 μV/K are necessary to obtain
ZT > 1. High Seebeck coefficients and low lattice thermal conductivities are therefore
crucial for thermoelectric applications. In the next sections, several attempts to design
new clathrates with a good thermoelectric performance are presented. The guest sites of
all investigated clathrates are partially occupied by the rare-earth element Eu. Prior to
the presentation and discussion of the data a brief overview on the structure and transport
properties of type-I clathrates, in general, is given.
4.1.1 Clathrate-I structure
At present 9 clathrate structure types are known [98]. The most common is the cubic
clathrate-I structure, which is shown in Fig. 4.1. All clathrates within this thesis are
– 48 –

4.1. An introduction to clathrates
pentagonal dodecahedron
tetracaidecahedron
guest atoms
cage atoms
Figure 4.1: Clathrate-I structure.
of this type. However, in some cases indications for a modification by the formation of
a superstructure due to complete or partial ordering of the network atoms are found.
The clathrate-I structure contains two kinds of polyhedral cages: the smaller pentagonal
dodecahedra and the larger tetracaidecahedra. Both are formed by four-fold bonded group
III and IV elements. The cages compose a space-filling network and are centered by guest
atoms or cations. There are two pentagonal dodecahedra and six tetracaidecahedra per
unit cell of the clathrate-I structure.
Different models have been proposed to describe the behavior of the cations inside
the relatively large cages. Neutron and X-ray diffraction data obtained on Sr8Ga16Ge30
and β-Eu8Ga16Ge30 are better approximated if the 6d site (guest site inside the larger
cage) is allowed to split into four off-center sites [99, 100, 89]. Atomic tunneling between
these split sites has been directly observed in Mossbauer spectroscopy and microwave
absorption experiments on β-Eu8Ga16Ge30 [101]. Indications for positional disorder of the
guest cations have also been found for other systems, e.g. Ba8Ga16Ge30 and Ba8Ga16Si30
[99, 102]. Thermal-transport and specific-heat data are frequently discussed in terms
of local vibrations (”rattling”) of the loosely bound guest atoms. In this picture, the
incoherent scattering of phonons from the guest atoms is assumed to give rise to low lattice
thermal conductivities of glass-like character. In the specific heat the local vibrations
generate an Einstein contribution with a characteristic temperature ΘE ≈ 20 − 100 K,
e.g. in β-Eu8Ga16Ge30 [89]. The electrical transport properties, on the other hand, are
expected to be not significantly affected by the ”rattling”. This concept of a ”phonon glass,
electron crystal” [103] is widely used to discuss the transport properties of clathrates. An
alternative explanation for the observed low values of κph is a high density of defects due
to the off-center displacement of guest atoms, which may generate enhanced scattering at
low temperatures [104]. Furthermore, tunneling between the split sites has been proposed
as a possible scattering mechanism for phonons [105]. Evidence for the significance of this
– 49 –

Chapter 4. Cage compounds - candidates for thermoelectric applications
process has been found from the elastic constants of β-Eu8Ga16Ge30 [106]. However, its
relevance for thermal transport properties is controversial [72].
4.1.2 Electronic properties of type-I clathrates
Many systems having clathrate-I structure can be treated as Zintl compounds. The Zintl
concept is used to understand the bonding properties of intermetallics [107]. In a Zintl
compound each element obtains a filled valence shell from a combination of charge transfer
and covalent bonding. For the clathrates of type-I structure it is assumed that the ele-
ment inside the cages donates its s electrons to the framework and is only weakly ionically
bonded to the cage. Since the network has 46 atoms or 92 covalent bonds per unit cell
(u.c.) it is supposed that compounds with a valence-electron number of 184/u.c. are par-
ticularly stable. As an example may serve Ba8Ga16Si30: It contains 8× Ba2+, 16× Ga3+,
and 30× Si4+, thus having 184 valence electrons. Various type-I clathrates of a similar
composition (II)8(III)16(IV)30 are known. However, a number of systems have a compo-
sition, which deviates from that of the ideal charge-balanced Zintl compound, such as
(Ba2+)8(Cu1+)16(P3+)30 with 182 valence electrons/u.c. [108].
The electronic properties of clathrates depend on the nature and the ratio of the
constituting elements in two ways: (1) An ideal Zintl compound is expected to show
semiconducting behavior, since all bonds are completely filled. Compositions deviating
from that of an ideal charge-balanced Zintl compound may give rise to either p- or n-type
semiconducting or even metallic behavior. In view of large thermopowers, semiconducting
behavior is favorable. Actually, semiconducting clathrates frequently exhibit enhanced
thermopower values around room temperature, e.g. Ba8Ga16Ge30 with S = 200 μV/K at
300 K [109]. (2) The degree of localization of electrons can be controlled via the chemical
composition. It influences the interactions between the magnetic moment of a rare-earth
element inside the cage and the conduction electrons spreading through the network.
In this context, a strong hybridization between the 4f and the conduction electrons is
desirable to further enhance the thermopower and to achieve large values of S below room
temperature.
Although ideal Zintl compounds are expected to show semiconducting behavior, many
clathrates with the appropriate composition behave metal-like. This may be due to off-
stoichiometry as well as to a failure of the Zintl concept [110].
4.2 K6Eu2Ga10Ge36, K6Eu2Zn5Ge41 and K6Eu2Cd5Ge41
Several clathrates of the type M8−xEuxGa16Ge30 with M denoting an alkaline-earth metal
element have been reported. Most of them crystallize in the clathrate-I structure, e.g.
Sr8Ga16Ge30 [95], Sr4Eu4Ga16Ge30 [111], Sr6Eu2Ga16Ge30 [111], β-Eu8Ga16Ge30 [88, 89],
and Ba8Ga16Ge30 [96]. In all these compounds the cages are fully occupied by divalent ions.
– 50 –

4.2. K6Eu2Ga10Ge36, K6Eu2Zn5Ge41, and K6Eu2Cd5Ge41
For the Eu-containing clathrates no correlation effects have been found. This may be an
indication for a too weak interaction between the local Eu moments and the surrounding
cages. In order to facilitate the hybridization we attempted to introduce transition metals
with expanded d orbitals into the framework. Single occupancy of all cages by europium is
extremely hard to realize in clathrates. Therefore, the two crystallographic sites inside the
cages of the clathrate-I structure were intended to be occupied by two different elements.
For the second element potassium was chosen, which is preferably monovalent and thus
might support a possible intermediate valence of the Eu. As a result three new clathrates of
type-I structure, K6Eu2Ga10Ge36, K6Eu2Zn5Ge41, and K6Eu2Cd5Ge41, were synthesized.
This chapter summarizes the findings of magnetic and electrical transport measurements
on these compounds.
4.2.1 Samples
Polycrystalline samples of K6Eu2Ga10Ge36, K6Eu2Zn5Ge41, and K6Eu2Cd5Ge41 were pre-
pared and chemically characterized at the MPI CPfS by S. Budnyk. The clathrates were
synthesized by high-frequency induction melting of the elements in closed tantalum cru-
cibles. In order to improve the purity and homogeneity of the samples the resulting
material was ground, pressed into a pellet, and annealed several times. Characterization
of the samples by X-ray powder diffraction and energy-dispersive X-ray (EDX) absorp-
tion analysis did not indicate minor phases. All three compounds crystallize in the cu-
bic clathrate-I structure with lattice parameters of a = 10.744(2) A (K6Eu2Ga10Ge36),
a = 10.744(3) A (K6Eu2Zn5Ge41) and a = 10.835(0) A (K6Eu2Cd5Ge41). Single-crystal
structure refinement revealed an ordered occupation of the guest sites. Eu is situated in
the smaller dodecahedron, while K occupies the larger tetracaidecahedral site. The sample
preparation and characterization procedure is described in detail in [112].
The obtained polycrystalline material is very sensitive to moisture and air. This re-
quired a special handling of the samples. Investigations of the electrical resistivity were
performed on polycrystals with a typical size of 1.5 x 1.5 x 3 mm3. The contacting of
the samples and mounting onto the sample holder was accomplished in argon-filled glove
boxes. The magnetic susceptibility was investigated on samples with a mass of typically
10 mg. The samples prepared for measurements were transported in closed containers
to the experimental devices and quickly moved into the systems. In order to check for
sample degradation during the investigations, the first and the last measurements were
performed under the same conditions. In a few cases the initial data were not reproduced.
The corresponding results were not used for analysis.
4.2.2 Magnetic properties
The temperature dependence of the magnetic susceptibility of the three new potas-
sic clathrates in an external magnetic field of B = 0.01 T is plotted in Fig. 4.2a.
– 51 –

Chapter 4. Cage compounds - candidates for thermoelectric applications
Figure 4.2: (a) Temperature dependence of the susceptibility, χ(T ), in an applied magnetic
field of B = 0.01 T and (b) magnetic field dependence of the magnetization, shown as
magnetic moment per Eu, m(B), for K6Eu2Ga10Ge36, K6Eu2Zn5Ge41, and K6Eu2Cd5Ge41.
K6Eu2Ga10Ge36, K6Eu2Zn5Ge41, and K6Eu2Cd5Ge41 were found to order magnetically
at TC = 3.8 K, 4.0 K, and 9.3 K, respectively. The high-temperature behavior between
50 K and 400 K of all three compounds can be approximated by a modified Curie-Weiss
law. The effective magnetic moments per Eu ion meff and the Weiss constants ΘCW derived
from least-squares fits to the data as well as other characteristic quantities are summarized
in Tab. 4.1.
The effective magnetic moments calculated from the Curie-Weiss fits are close to the
free-ion value for Eu2+ of 7.94 μB, suggesting that Eu is divalent at elevated temperatures
in all three clathrates. This is in agreement with the results of LIII X-ray absorption
spectra (XAS) measurements of the Eu [112]. At room temperature no deviations from
the divalent state were detected. The positive Weiss constants indicate that ferromagnetic
K6Eu2Ga10Ge36 K6Eu2Zn5Ge41 K6Eu2Cd5Ge41
meff (μB/Eu) 8.19 ± 0.07 8.12 ± 0.07 8.15 ± 0.06
ΘCW (K) 4.7 ± 0.5 6.2 ± 0.4 8.4 ± 0.4
TC (K) 3.8 4.0 9.3
m2K,1T (μB/Eu) 6.22 6.67 7.06
Table 4.1: Summary of the magnetic properties of K6Eu2Ga10Ge36, K6Eu2Zn5Ge41, and
K6Eu2Cd5Ge41
– 52 –

4.2. K6Eu2Ga10Ge36, K6Eu2Zn5Ge41, and K6Eu2Cd5Ge41
Figure 4.3: Calculated RKKY coupling JRKKY as a function of charge-carrier concentration
n for the three potassic clathrates. The difference between the three compounds is not
visible on this scale. For comparison, JRKKY of β-Eu8Ga16Ge30 is shown. Ferromagnetic
order (FM) is facilitated by a positive RKKY coupling, while antiferromagnetic order
(AFM) is favored by a negative JRKKY.
interactions between the Eu moments cause the magnetic ordering below 10 K. These
interactions are most likely of RKKY type, since the large Eu-Eu distances prevent direct
exchange between the f moments. Fig. 4.3 shows the calculated RKKY coupling JRKKY
(Eq. 2.3) as a function of charge-carrier concentration n for the three new clathrates.
Atoms up to a radius of 1000 A were taken into account. The sign of JRKKY is cho-
sen in such a way that ferromagnetic order is facilitated by a positive RKKY coupling,
while antiferromagnetic order is favored by negative JRKKY. For comparison, JRKKY of
β-Eu8Ga16Ge30 is shown. In the case of the potassic clathrates, ferromagnetic interactions
as suggested by the positive Weiss constants are only realized for low charge-carrier concen-
trations of less than 0.5 per unit cell, corresponding to 4×10²⁰/cm3. This finding is a first
indication for a possible semiconducting behavior in these materials. In β-Eu8Ga16Ge30,
which orders ferromagnetically at 36 K, both guest sites are filled by europium [89]. The
nearest Eu-Eu distance is significantly smaller than that of the potassic clathrates, namely
5.23 A compared to approximately 9.4 A. Consequently, in the examined charge-carrier
concentration range the absolute values of JRKKY of β-Eu8Ga16Ge30 are larger than those
of the three new clathrates. This is in agreement with the smaller magnetic ordering
temperatures found in these compounds.
A ferromagnetically ordered ground state in the new clathrates is also suggested by the
results of isothermal magnetization measurements at 2 K, which are shown in Fig. 4.2b.
– 53 –

Chapter 4. Cage compounds - candidates for thermoelectric applications
Figure 4.4: Temperature dependence of the resistivity normalized to the value at 300 K,
ρ/ρ300K, for 4 different samples of K6Eu2Zn5Ge41.
The observed behavior resembles that of soft ferromagnets. However, within the experi-
mental resolution no hysteresis was found. The magnetization of K6Eu2Cd5Ge41 in 1 T is
close to the value of 7 μB expected for a free Eu2+ moment. The corresponding values of
K6Eu2Ga10Ge36 and K6Eu2Zn5Ge41 are significantly lower (Tab. 4.1), yet, both compounds
may saturate in higher fields.
4.2.3 Electrical resistivity
The determination of the electrical resistivities of K6Eu2Ga10Ge36, K6Eu2Zn5Ge41, and
K6Eu2Cd5Ge41 turned out to be extremely difficult. Up to 4 samples were investigated
for each compound. Only for K6Eu2Cd5Ge41 reproducible data could be obtained. In the
case of K6Eu2Ga10Ge36 and K6Eu2Zn5Ge41 a strong increase of the sample resistances with
decreasing temperature was observed. As an example the results for the 4 investigated
specimens of K6Eu2Zn5Ge41 are shown in Fig. 4.4. For better comparison the data are
normalized to the value at 300 K. The resistances rapidly rise with decreasing tempera-
ture. Below a sample-dependent temperature of 10 to 130 K the voltage across the sample
exceeded the measurement range of the PPMS. At low temperatures the measured resis-
tance depends on the applied current. Such a phenomenon is typical for charge-carrier
transport through tunneling barriers. Grain boundaries inside the pressed material may
act as barriers and cause the observed high resistances. Additionally, Schottky-barrier for-
mation between the semiconducting samples and the metallic contacts, as well as chemical
reaction of the silver paint with the samples may result in very high contact resistances
– 54 –

4.2. K6Eu2Ga10Ge36, K6Eu2Zn5Ge41, and K6Eu2Cd5Ge41
Figure 4.5: Temperature dependence of the resistivity of K6Eu2Cd5Ge41 in different mag-
netic fields.
and effect the measured resistances. Further investigations are necessary in order to clearly
determine the intrinsic resistivities of K6Eu2Ga10Ge36 and K6Eu2Zn5Ge41.
The resistivity of K6Eu2Cd5Ge41 measured in magnetic fields of up to 10 T is shown in
Fig. 4.5. The temperature dependence of ρ is semiconductor-like with a weak maximum
around 7 K. When applying a magnetic field this anomaly shifts to higher temperatures.
At the same time the resistivity at low temperatures is reduced. The anomaly is probably
caused by the magnetic ordering of the compound at 9.3 K. Charge-carrier scattering on
fluctuations near a magnetic phase transition generates an extra contribution to the resis-
tivity. The shift of the anomaly to higher temperatures in an applied magnetic field is in
agreement with a ferromagnetic type of order as suggested by the results of magnetization
measurements.
Assuming Eu to be exactly divalent all three potassic clathrates can be treated as ideal
charge-balanced Zintl compounds:
(K1+)6(Eu2+)2(Ga3+)10(Ge4+)36
(K1+)6(Eu2+)2(Zn2+)5(Ge4+)41
(K1+)6(Eu2+)2(Cd2+)5(Ge4+)41
Therefore, the stoichiometric compounds are expected to show semiconducting behavior.
Deviations from the exact stoichiometry as well as from the assumed valences generate
free charge carriers. The semiconductor-like resistivity of K6Eu2Cd5Ge41 is in accordance
with a low charge carrier-density in this compound.
– 55 –

Chapter 4. Cage compounds - candidates for thermoelectric applications
4.2.4 Summary and discussion
The high-temperature susceptibilities as well as the magnetic-field dependencies of
the magnetization suggest that the three new type-I clathrates K6Eu2Ga10Ge36,
K6Eu2Zn5Ge41, and K6Eu2Cd5Ge41 undergo phase transitions to a ferromagnetically or-
dered state below 10 K. Calculations of the RKKY coupling indicate low charge-carrier
concentrations as a prerequisite for this type of ordering. This is in agreement with the
expectations from Zintl’s rule as well as with the semiconducting resistivity found for
K6Eu2Cd5Ge41. Additionally, the field shift of the anomaly in ρ supports the picture of a
ferromagnetically ordered ground state for K6Eu2Cd5Ge41.
The low charge-carrier concentrations presumed for K6Eu2Ga10Ge36, K6Eu2Zn5Ge41,
and K6Eu2Cd5Ge41 show great promise for achieving high values of the thermoelectric
figures of merit ZT . Still, further work is necessary in order to establish the anticipated
semiconducting behavior, especially for K6Eu2Ga10Ge36 and K6Eu2Zn5Ge41. The required
delicate handling of the samples complicates systematic investigations. In order to calcu-
late ZT a determination of the thermal conductivities as well as the Seebeck coefficients
of the compounds is essential. These measurements were not possible because of the small
size of the available samples.
4.3 Ba8−xEuxGe43�3 (x ≤ 0.6)
The binary Ba8Ge43�3 crystallizes in a structure close to the clathrate-I type with three
Ge atoms missing in the covalent germanium framework1 [113, 114]. Single-crystal X-ray
diffraction measurements revealed the formation of a superstructure, which is accompanied
by a doubling of the lattice constant [115]. Measurements of the electrical conductivity
displayed semiconducting behavior with a band gap of 40 meV [113]. Thus, Ba8Ge43�3 ap-
peared a promising starting material for the chemical exchange of alkaline-earth metals by
rare-earth elements in the cages with the aim of achieving good thermoelectric properties.
Furthermore, a first report on the substitution of Ba by Eu in the clathrate Ba6−xEuxGe25
stimulated these investigations [116].
4.3.1 Samples
Sample preparation, chemical characterization and structure determination were per-
formed at the MPI CPfS by R. Demchyna. The starting materials BaGe2 and EuGe2
were synthesized from stoichiometric amounts of the elements by high-frequency induction
melting in open carbon crucibles. Polycrystals with nominal compositions Ba8−xEuxGe46
(xnom = 0.5, 1) were prepared from mixtures of finely ground BaGe2, EuGe2, and Ge pow-
ders by high-frequency induction melting in open carbon crucibles. In order to suppress
1The � denotes a vacancy in the framework.
– 56 –

4.3. Ba8−xEuxGe43�3 (x ≤ 0.6)
the formation of Ba8−xEuxGe25 the resulting material was annealed at a pressure of 1 GPa
and temperatures of up to 1220 K [117].
The local composition of the obtained material was determined from EDX absorp-
tion analysis. The main phases for the samples with nominal xnom = 0.5 and xnom = 1
are Ba8−xEuxGe43�3 with x = 0.3 and x = 0.6, respectively. Both products contain
approximately 2 vol% Ge and about 1.5 vol% of an Eu-rich phase with a composition
of about 70 at% Ge, 28 at% Eu, and 3 at% Ba. The whole elemental content corre-
sponds to the nominal compositions. X-ray powder diffraction measurements yielded that
Ba8−xEuxGe43�3 (x = 0.3, 0.6) crystallizes in the cubic clathrate-I structure with lattice
parameters of a0.3 = 10.629(4) A and a0.6 = 10.645(6) A. Several weak reflections suggest
the possibility of superstructure formation as in the binary Ba8Ge43�3. Crystal-structure
refinement indicates that Eu replaces some of the Ba in the smaller cage. This is in
accordance with the ionic radius of Eu2+ being smaller than that of Ba2+. A detailed
description of the preparation and characterization process can be found in [117].
The investigated polycrystals are brittle and have a metallic luster. Individual spec-
imens used for measurements have a size of approximately 1 × 1 × 1.5 mm3 and a mass
of about 1 mg. Due to the small size and the brittleness no attempts were made to cut
well-shaped samples for resistivity measurements. As a reference the Eu-free Ba8Ge43�3
was reinvestigated.
4.3.2 Magnetic properties
The magnetic susceptibility of Ba8−xEuxGe43�3 (x = 0.3, 0.6) was measured by
W. Schnelle [117]. Since these investigations have been performed in cooperation with
the measurements of resistivity and specific heat presented below, the main results shall
be summarized.
Down to the lowest measured temperatures of 1.8 K no long-range magnetic order was
observed. For T > 50 K the susceptibilities in an applied magnetic field of 7 T can be well
described by a modified Curie-Weiss law. The effective magnetic moment obtained for the
sample with x = 0.3 is meff = 7.71μB/Eu, the Weiss constant has a value of ΘCW = −1.1 K.
For the x = 0.6 sample an effective magnetic moment of 7.93 μB/Eu is derived with ΘCW
set to zero. For the analysis the total Eu concentration of the materials being equal to
the nominal Eu content was taken into account. The effective magnetic moments of both
compositions are close to that expected for Eu2+. The small Weiss constants indicate very
weak interactions between the Eu moments, which is in agreement with the absence of
magnetic ordering in the investigated temperature range.
4.3.3 Electrical resistivity
The temperature dependence of the electrical resistivity of Ba8−xEuxGe43�3
(x = 0, 0.3, 0.6) was measured from 2 K to 300 K. Due to the non-ideal shape of the
– 57 –

Chapter 4. Cage compounds - candidates for thermoelectric applications
Figure 4.6: Electrical resistivity of Ba8−xEuxGe43�3 (x = 0, 0.3, 0.6) normalized to the
value at 300 K, ρ/ρ(300 K).
samples the geometrical form factor could only be estimated. Therefore and in order to
ease a comparison of the different compositions, the results are shown in Fig. 4.6 normal-
ized to the resistivity at 300 K, ρ(T )/ρ(300 K). For all three compositions ρ(T ) decreases
with decreasing temperature, indicating metal-like conductivity. At high T a tendency
to saturation is seen. Below approximately 10 K, ρ becomes temperature independent.
For the Eu-free sample this behavior is contrary to the results presented in [113]. The
residual resistivity ratios at 2 K, RRR = ρ(300 K)/ρ(2 K) have relatively small values of
4.0 (x = 0), 3.0 (x = 0.3) and 2.1 (x = 0.6). The estimated absolute values of ρ at 300 K
are 850 μΩcm (x = 0), 1330 μΩcm (x = 0.3), and 1280 μΩcm (x = 0.6). As an additional
feature, a small step-like anomaly in ρ(T ) of Ba8−xEuxGe43�3 (x = 0.3) is observed around
200 K. It is likely caused by a small admixture of Ba6Ge25. This material undergoes a
two-step first-order phase transition at temperatures T1 = 215 K and T2 = 280 K [118].
In Ba8−xEuxGe43�3 three atoms per formula unit are missing in the Ge network. This
involves 3 × 4 dangling bonds, which have to be saturated. The semiconducting behavior
reported in [113] was explained by an average transfer of 1.5 electrons per Ba atom.
However, the preferred valence of Ba is the divalent state, which results in an excess of
3 electrons per formula unit. Delocalization of these electrons may induce the observed
metallic conductivity. Since substitution of Ba2+ by Eu2+ does not change the number
of free charge carriers a similar behavior is expected for all compositions. At present no
definite explanation for the discrepancy between the previous results and the new data
can be given. A possible explanation are tunneling barriers at grain boundaries, which
may lead to semiconducting behavior in an otherwise metallic compound. On the other
– 58 –
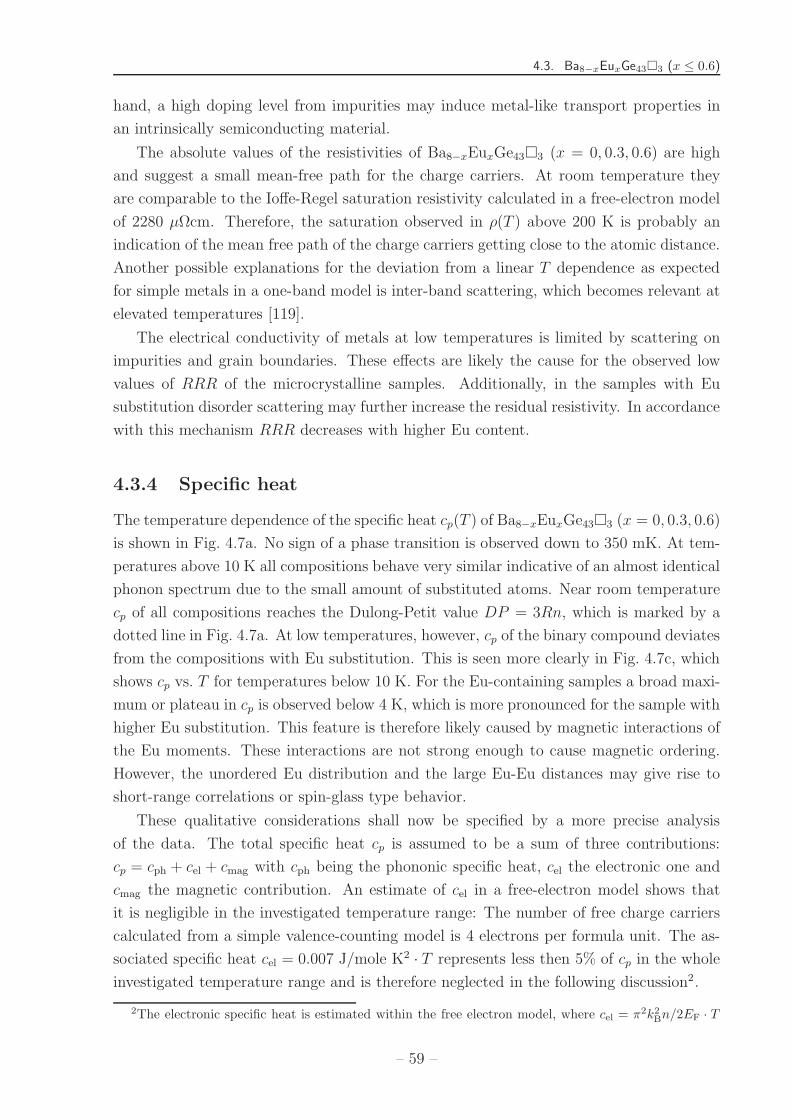
4.3. Ba8−xEuxGe43�3 (x ≤ 0.6)
hand, a high doping level from impurities may induce metal-like transport properties in
an intrinsically semiconducting material.
The absolute values of the resistivities of Ba8−xEuxGe43�3 (x = 0, 0.3, 0.6) are high
and suggest a small mean-free path for the charge carriers. At room temperature they
are comparable to the Ioffe-Regel saturation resistivity calculated in a free-electron model
of 2280 μΩcm. Therefore, the saturation observed in ρ(T ) above 200 K is probably an
indication of the mean free path of the charge carriers getting close to the atomic distance.
Another possible explanations for the deviation from a linear T dependence as expected
for simple metals in a one-band model is inter-band scattering, which becomes relevant at
elevated temperatures [119].
The electrical conductivity of metals at low temperatures is limited by scattering on
impurities and grain boundaries. These effects are likely the cause for the observed low
values of RRR of the microcrystalline samples. Additionally, in the samples with Eu
substitution disorder scattering may further increase the residual resistivity. In accordance
with this mechanism RRR decreases with higher Eu content.
4.3.4 Specific heat
The temperature dependence of the specific heat cp(T ) of Ba8−xEuxGe43�3 (x = 0, 0.3, 0.6)
is shown in Fig. 4.7a. No sign of a phase transition is observed down to 350 mK. At tem-
peratures above 10 K all compositions behave very similar indicative of an almost identical
phonon spectrum due to the small amount of substituted atoms. Near room temperature
cp of all compositions reaches the Dulong-Petit value DP = 3Rn, which is marked by a
dotted line in Fig. 4.7a. At low temperatures, however, cp of the binary compound deviates
from the compositions with Eu substitution. This is seen more clearly in Fig. 4.7c, which
shows cp vs. T for temperatures below 10 K. For the Eu-containing samples a broad maxi-
mum or plateau in cp is observed below 4 K, which is more pronounced for the sample with
higher Eu substitution. This feature is therefore likely caused by magnetic interactions of
the Eu moments. These interactions are not strong enough to cause magnetic ordering.
However, the unordered Eu distribution and the large Eu-Eu distances may give rise to
short-range correlations or spin-glass type behavior.
These qualitative considerations shall now be specified by a more precise analysis
of the data. The total specific heat cp is assumed to be a sum of three contributions:
cp = cph + cel + cmag with cph being the phononic specific heat, cel the electronic one and
cmag the magnetic contribution. An estimate of cel in a free-electron model shows that
it is negligible in the investigated temperature range: The number of free charge carriers
calculated from a simple valence-counting model is 4 electrons per formula unit. The as-
sociated specific heat cel = 0.007 J/mole K2 · T represents less then 5% of cp in the whole
investigated temperature range and is therefore neglected in the following discussion2.
2The electronic specific heat is estimated within the free electron model, where cel = π2k2Bn/2EF · T
– 59 –

Chapter 4. Cage compounds - candidates for thermoelectric applications
Figure 4.7: (a) Specific heat of Ba8−xEuxGe43�3 (x = 0, 0.3, 0.6). The line is a fit to a
sum of one Debye and two Einstein terms to the x = 0.6 data, as described in the text.
(b) The inset shows the low-temperature data on an extended scale. (c) and (d) Relative
deviation between fit and data for different fitting functions: (1) one Debye term, (2) one
Debye and one Einstein term, (3) one Debye and two Einstein terms.
From a comparison of the specific heat of the nonmagnetic binary Ba8Ge43�3 com-
pound with the Eu-containing compositions it is concluded that in zero magnetic field the
magnetic contribution is negligible above 10 K. Between 10 K and 300 K the specific heat
therefore arises predominantly from phonons and can be approximated by a sum of Debye
and Einstein terms. The results for different combinations are compared in Fig. 4.7c and
d by showing the relative deviation between fit and data. A simple Debye model as fre-
quently applied to approximate acoustic phonon modes (fit 1) only roughly describes the
data, and significant deviations are observed in the whole T range (Fig. 4.7c). Adding an
Einstein contribution in order to model the optic phonon modes yields a good description
of the data above 20 K (Fig. 4.7d). An even better approximation is obtained by adding
a second Einstein term to account for the possibility of thermal vibrations of the Eu and
Ba cations inside the cages (fit 3, Fig. 4.7d). In this type of fit the two sorts of cages
of the structure and the Ba and Eu atoms with different masses inside the smaller cage
are not treated separately in order to limit the number of free parameters. Concerning
in particular the Ba-Eu exchange, no strong variation in the corresponding Einstein tem-
peratures ΘE is expected due to the small difference in mass between Ba and Eu (137
au vs. 152 au). Since ΘE ∝ ω ∝ √1/m, the deviation is estimated to be approximately
5 %. Such small changes are within the uncertainty of the fit results (see below). The
with the Fermi energy EF = �2(3π2n)2/3/2m.
– 60 –

4.3. Ba8−xEuxGe43�3 (x ≤ 0.6)
Debye and Einstein temperatures ΘD and ΘE1,2 resulting from least-squares fits to the
data as well as the corresponding number of phonon modes of all three compositions are
summarized in Tab. 4.2. The values obtained for varying x do not differ significantly. This
finding confirms the negligible influence of the Eu substitution on the lattice vibrations.
The lower Einstein temperatures ΘE2 describing local vibrations are similar to results
obtained on other type-I clathrates, such as Ba8Ga16Ge30 (ΘE = 80 K) and Sr8Ga16Ge30
(ΘE = 79 K) [89]. The calculated cph of the x = 0.6 sample is shown as a line in Fig. 4.7a.
The differences between the fits for different x cannot be distinguished on this scale.
By subtracting the estimated cph from cp the magnetic contribution is determined. As
an example cmag of the sample with x = 0.6 is shown in Fig. 4.8a for magnetic fields up
to 9 T. For the sake of clarity not all investigated fields are plotted. Upon application of
a magnetic field the broad maximum observed in zero field shifts to higher temperatures,
while the height of this feature stays nearly constant. Such behavior is characteristic of
a Schottky contribution resulting from the Zeeman splitting of a degenerate ground-state
multiplet. The entropy per mole Eu calculated from the magnetic contribution in zero
magnetic field amounts to (1.1± 0.1) ·R ln 8 (x = 0.3) and (1.4± 0.1) ·R ln 8 (x = 0.6) at
10 K. These values are slightly higher than the magnetic entropy expected for ordering of
the 8S 72
ground-state octet of a free Eu2+. The deviations may result from uncertainties
in measuring cp as well as from the neglecting of cel and errors in the estimate of cph.
It is assumed that the observed low-temperature anomaly is caused by weak magnetic
interactions between the Eu moments, which lift the degeneracy of the ground-state octet,
but are not strong enough to cause magnetic ordering. Taking the maximum in cmag at
approximately 1.9 K as an estimate for the relevant energy scale, it is suspected that a
magnetic field of 1-2 T is strong enough to overcome these interactions. At higher B the
Zeeman splitting of the ground-state octet of the Eu2+ is dominating, thus leading to the
observed Schottky-like behavior.
With increasing B the temperature of the maximum Tmax shifts to higher T , which
corresponds to an increase in the overall splitting of the 8S 72
manyfold. A quantitative
analysis of the field dependence of cmag is not possible due to the large number of free
x = 0 x = 0.3 x = 0.6
ΘD (K) 153 ± 5 161 ± 11 155 ± 8
nD 23.5 ± 0.5 25.3 ± 0.9 23.8 ± 0.7
ΘE1 (K) 292 ± 4 321 ± 12 302 ± 7
nE1 24.8 ± 0.7 21.8 ± 1.6 23.7 ± 1.1
ΘE2 (K) 62 ± 2 60 ± 4 61 ± 3
nE2 2.7 ± 0.7 3.8 ± 1.5 3.5 ± 1.1
Table 4.2: Summary of the results of the specific-heat analysis of Ba8−xEuxGe43�3
– 61 –

Chapter 4. Cage compounds - candidates for thermoelectric applications
Figure 4.8: (a) Magnetic contribution to the specific heat cmag of Ba8−xEuxGe43�3
(x = 0.6) in different magnetic fields. (b) Field dependence of the temperature of the
maximum in cmag(T ) of Ba8−xEuxGe43�3 (x = 0.3, 0.6)
parameters for an octet state. However, for a qualitative test the field shift of Tmax may
be compared to that expected for a simple ±S spin doublet. A plot of Tmax vs. B reveals
an approximately linear dependency (Fig. 4.8b) as expected for a doublet with initial
splitting ΔT = 5.0 K and spin ±5.02
. The results for the x = 0.3 sample are ΔT = 4.0 K
and S = ±3.72
. These values are reasonable for Eu2+ with a total angular momentum
J = 7/2.
4.3.5 Summary and discussion
Ba8−xEuxGe43�3 (x = 0, 0.3, 0.6) exhibits large, metal-like resistivities. The absence of
magnetic ordering in the Eu-containing specimens is most probably due to the small
amount and random distribution of the magnetic moments in the material. The present
weak magnetic interactions only induce a Schottky-like contribution to cp at low temper-
atures.
Due to the small sample size it was impossible to measure the thermal conductivity or
thermopower of the new Ge clathrates. Indications for local vibrations obtained from an
analysis of the specific heat suggest the possibility of a low lattice thermal conductivity.
However, in consideration of the metal-like electrical resistivities, no high values of the
thermopower are expected. It is therefore supposed that the thermoelectric performance
of Ba8−xEuxGe43�3 (x ≤ 0.6) is rather poor.
– 62 –

4.4. Ba8−xEuxCu16P30 (x ≤ 2)
The disorder between Ba and Eu in the smaller cage probably prevents the development
of correlations in the material. Unfortunately, attempts to enhance the Eu content of the
samples to complete occupancy of a lattice site failed up to now. Therefore, further
investigations appear at present unpromising.
4.4 Ba8−xEuxCu16P30 (x ≤ 2)
Ba8Cu16P30 had been found to exhibit a sensitive sample dependence of the resistiv-
ity. While Dunner and Mewis reported semiconducting behavior with an energy gap
of Eg = 0.7 eV [108], Huo et al. found a metal-like temperature dependence [120]. The
difference was explained by small deviations in the stoichiometry of the samples. Semicon-
ducting behavior is expected for the ideal charge-balanced Zintl compound Ba8Cu15.5P30.5,
and the samples investigated in [108] were claimed to have this composition. The stoi-
chiometric compound Ba8Cu16P30, however, has a deficiency of 2 electrons per formula
unit with respect to the semiconducting composition. The resulting free charge carriers
were held responsible for the metallic behavior found in [120]. In this simple picture the
free charge carriers are supposed to be holes. In accordance with this expectation the
material investigated in [120] showed rare p-type conductivity. Such behavior is highly
desirable, since thermoelectric applications require ideally a combination of an n- and a
p-type material. Besides these favorable electrical transport properties Ba8Cu16P30 exhib-
ited a comparably low thermal conductivity and a high thermoelectric power leading to a
dimensionless figure of merit ZT = 0.02 at 300 K [120]. Therefore Ba8Cu16P30 seemed to
be a promising starting material for Ba - Eu substitution with the aim of improving the
thermoelectric properties.
4.4.1 Samples
The physical properties of three compositions Ba8−xEuxCu16P30 (nominal Eu concentra-
tion x = 1, 1.5, 2) have been investigated. As a reference compound for the specific heat
the Eu-free Ba8Cu16P30 was reinvestigated.
Sample preparation and characterization were performed at the MPI CPfS by S. Bud-
nyk. The clathrate materials were synthesized by solid-state reaction of stoichiometric
amounts of the elements inside sealed carbon-glass crucibles at approximately 1100 K.
The resulting crystalline mixtures were reground, pressed, annealed, and slowly cooled
to room temperature. Characterization of the material by X-ray powder diffraction and
Laue photographs confirmed the clathrate-I structure for all compositions. No minor
phases could be detected. Single-crystal structure refinement indicated that Eu is situ-
ated exclusively in the smaller, dodecahedral cage. The local composition of the obtained
material was determined by EDX absorption analysis. Initially, within the resolution of
the method to approximately x± 0.1 no deviations from the nominal stoichiometry could
– 63 –

Chapter 4. Cage compounds - candidates for thermoelectric applications
be detected. However, an analysis of the susceptibility, magnetization and specific heat
provides clear evidence for a smaller than the nominal Eu content in the investigated sam-
ples with x = 1.5, 2 (see below). EDX absorption measurements performed thereafter on
exactly the same pieces used for magnetic and specific-heat investigations at least partly
support these findings. For the specimens with nominal x = 1, 1.5, 2 a real Eu concentra-
tion of 1.05±0.07, 1.51±0.07 and 1.61±0.06 was obtained. The discrepancy between the
initial and repeated measurements as well as to the results presented below may originate
from an inhomogeneous Ba/Eu distribution within the polycrystalline material. Addi-
tionally, surface degradation might play a role. For simplicity, the nominal composition is
used throughout this chapter.
4.4.2 Magnetic properties
Magnetic susceptibility and isothermal magnetization were measured for the Eu-containing
compositions Ba8−xEuxCu16P30 (x = 1, 1.5, 2) in order to get information on the magnetic
interactions between the Eu moments. Fig. 4.9 summarizes the main experimental results.
Fig. 4.9a shows the temperature dependence of the magnetic susceptibility χ per mole Eu,
measured in an external magnetic field of 0.1 T. At low temperatures the magnetic suscep-
tibility of all samples strongly increases. Ba8−xEuxCu16P30 (x = 1, 1.5) undergo magnetic
phase transitions at 2.9 K and 3.1 K, respectively. For the sample with x = 2 no clear
transition is seen in χ vs. T . However, the derivative dχ/dT exhibits a weak minimum at
3.2 K (Fig. 4.9b). This may be an indication for the presence of a smeared transition to an
ordered state. At high temperatures all samples behave as Curie-Weiss paramagnets with
a small diamagnetic contribution: The data above 70 K can be described by a modified
Curie-Weiss law. The effective magnetic moments meff and Weiss temperatures ΘCW of
all compositions determined from least-squares fits to the data are given in Tab. 4.3 along
with other characteristic magnetic quantities introduced below. The sample with x = 1
has an effective magnetic moment close to the value expected for Eu2+ of meff = 7.94 μB,
indicating divalent Eu in this material. The effective magnetic moments for the compo-
sitions with x = 1.5 and x = 2, however, are significantly lower. Assuming divalent Eu
x 1.0 1.5 2.0
TC (K) 2.9 3.1 3.2
ΘCW (K) 1.7 ± 0.8 2.9 ± 0.5 7.9 ± 0.4
meff (μB/Eu) 7.90 ± 0.09 7.56 ± 0.09 6.97 ± 0.09
neff 0.99 ± 0.03 1.36 ± 0.04 1.54 ± 0.04
msat (μB/Eu) 7.10 ± 0.04 6.60 ± 0.04 5.56 ± 0.04
nsat 1.01 ± 0.01 1.41 ± 0.01 1.59 ± 0.01
Table 4.3: Summary of the magnetic properties of Ba8−xEuxCu16P30 (x = 1, 1.5, 2)
– 64 –

4.4. Ba8−xEuxCu16P30 (x ≤ 2)
Figure 4.9: Magnetic properties of Ba8−xEuxCu16P30 (x = 1, 1.5, 2): (a) Temperature
dependence of the magnetic susceptibility per mole Eu in an external magnetic field of
B = 0.1 T. (b) Derivative dχ/dT for the sample with x = 2. (c) Magnetic-field dependence
of the magnetization at 2 K, shown as magnetic moment per Eu, m(B). (d) Derivative
dm/dB for all three compositions in fields up to 0.4 T.
as in the case of x = 1, it is supposed that the actual Eu content neff of the x = 1.5 and
x = 2 samples is smaller than the nominal value, namely 1.36 and 1.54 per formula unit.
The resulting disorder between Eu and Ba in the smaller cage leads to a distribution of
nearest Eu-Eu distances. This may be the reason for the absence of a clear transition in
the sample with nominal x = 2.
Fig. 4.9c shows the isothermal magnetization at 2 K for all three Eu-containing compo-
sitions as magnetic moment per Eu atom. The sample with x = 1 reaches the saturation
value expected for Eu2+ of msat = 7.0 μB in fields above 3 T. The compositions with
x = 1.5 and x = 2 saturate to significantly lower values. As for the susceptibility measure-
ments this may be an indication of a reduced Eu content. The Eu concentration calculated
from the saturation moment nsat for the x = 1.5 and x = 2 samples are 1.41 and 1.59 per
formula unit, respectively. These values are in agreement with the results obtained from
the Curie-Weiss effective magnetic moments. Therefore it is concluded that the actual
– 65 –

Chapter 4. Cage compounds - candidates for thermoelectric applications
Eu content is indeed lowered compared to the nominal concentration and the full Eu2+
moment is recovered.
The m(B) curves of the samples with x = 1 and x = 1.5 exhibit a kink followed by a
steeper rise at approximately 0.14 T. It shows up as a sudden increase in the derivative
dm/dB (Fig. 4.9d). This feature probably marks a metamagnetic transition from an
antiferromagnetic to an induced paramagnetic state at higher fields. The positive Weiss
constants of the samples with x = 1 and x = 1.5 are indicative of ferromagnetic interactions
at high temperatures. However, the values of ΘCW are very small, and an antiferromagnetic
ground state may be developed. In fact, evidence for an antiferromagnetic type of ordering
is obtained from both resistivity and specific-heat investigations (see below). The ordering
temperatures of approximately 3 K found experimentally in χ(T ) correspond to an energy
scale of the magnetic interactions of μB× 0.6 T for Eu2+ moments. This is about a factor
4 larger than expected from the observed kink. Again, the sample with nominal x = 2
behaves different: no feature is seen in dm/dB. This may be caused by disorder, similar
to the absence of a clear transition in χ(T ). Another possible reason could be the stronger
ferromagnetic interactions in this material as indicated by the higher ΘCW of 7 K. The
larger Eu concentration might favor a ferromagnetic ground state for this composition.
However, this explanation can be excluded from measurements of the specific heat as is
shown below.
4.4.3 Electrical resistivity
The temperature dependence of the electrical resistivity ρ(T ) of Ba8−xEuxCu16P30 is plot-
ted in Fig. 4.10a normalized to the value at 300 K ρ(T )/ρ(T )300. The inset shows the
low-temperature data on an extended scale. All three compositions exhibit a similar tem-
perature dependence of the resistivity. The overall behavior is metal-like with a positive
dρ/dT , except for a plateau or weak maximum around 3 K (inset of Fig. 4.10a). As men-
tioned above, the investigated material has a deficiency of 2 electrons per formula unit
with respect to the ideal charge-balanced Zintl compound Ba8Cu15.5P30.5. The observed
metallic behavior is in agreement with the resulting free charge carriers. At temperatures
above 50 K charge carriers are mainly scattered on phonons. Thus, the similarity of the
temperature dependence of ρ for different Eu content x at T > 50 K provides evidence
for a uniform phonon spectrum for all compositions. This is attributed to the fact that
at most 2 out of 52 atoms per unit cell are substituted upon Ba/Eu exchange. Regarding
additionally that the ratio of the atomic masses of Ba and Eu is close to 1 (1:1.107), no
drastic changes in the phonon spectrum are expected for the investigated compositions.
The anomalies near 3 K are probably caused by scattering on magnetic fluctuations
above the phase-transition temperatures. The drop in resistivity below the magnetic
ordering temperature then is a consequence of reduced spin-disorder scattering in the
ordered state. This picture is supported by resistivity measurements in magnetic fields.
– 66 –
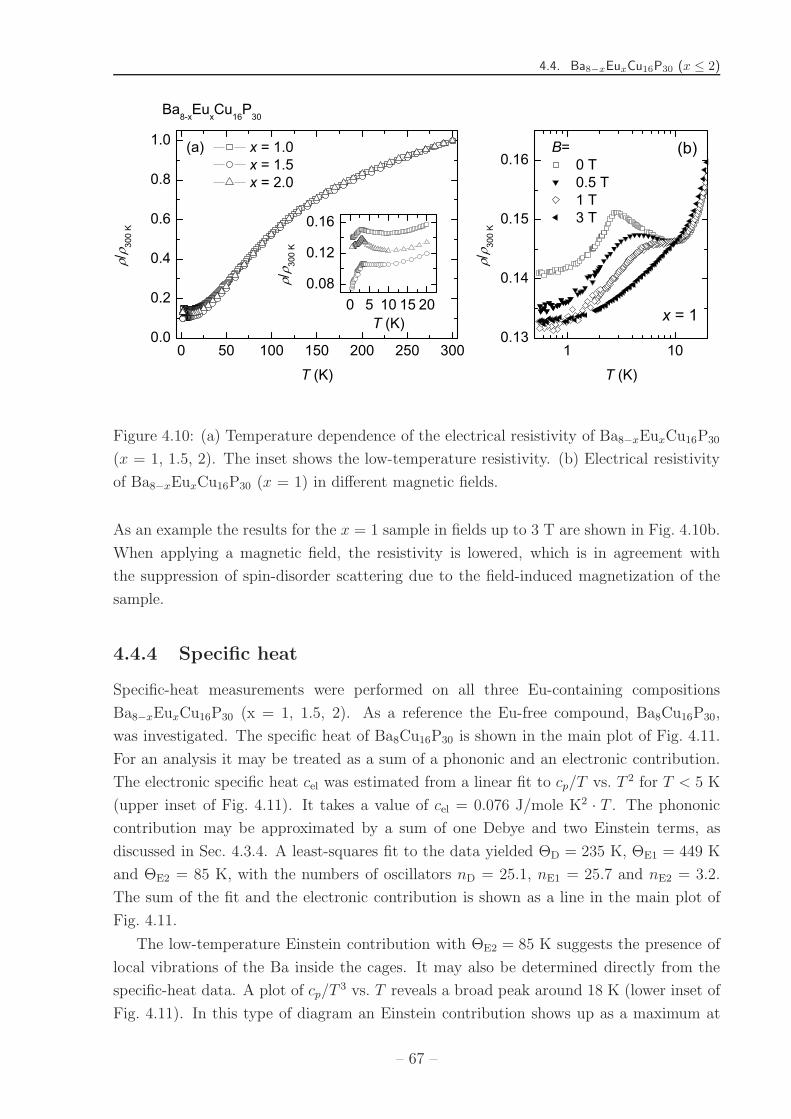
4.4. Ba8−xEuxCu16P30 (x ≤ 2)
Figure 4.10: (a) Temperature dependence of the electrical resistivity of Ba8−xEuxCu16P30
(x = 1, 1.5, 2). The inset shows the low-temperature resistivity. (b) Electrical resistivity
of Ba8−xEuxCu16P30 (x = 1) in different magnetic fields.
As an example the results for the x = 1 sample in fields up to 3 T are shown in Fig. 4.10b.
When applying a magnetic field, the resistivity is lowered, which is in agreement with
the suppression of spin-disorder scattering due to the field-induced magnetization of the
sample.
4.4.4 Specific heat
Specific-heat measurements were performed on all three Eu-containing compositions
Ba8−xEuxCu16P30 (x = 1, 1.5, 2). As a reference the Eu-free compound, Ba8Cu16P30,
was investigated. The specific heat of Ba8Cu16P30 is shown in the main plot of Fig. 4.11.
For an analysis it may be treated as a sum of a phononic and an electronic contribution.
The electronic specific heat cel was estimated from a linear fit to cp/T vs. T 2 for T < 5 K
(upper inset of Fig. 4.11). It takes a value of cel = 0.076 J/mole K2 · T . The phononic
contribution may be approximated by a sum of one Debye and two Einstein terms, as
discussed in Sec. 4.3.4. A least-squares fit to the data yielded ΘD = 235 K, ΘE1 = 449 K
and ΘE2 = 85 K, with the numbers of oscillators nD = 25.1, nE1 = 25.7 and nE2 = 3.2.
The sum of the fit and the electronic contribution is shown as a line in the main plot of
Fig. 4.11.
The low-temperature Einstein contribution with ΘE2 = 85 K suggests the presence of
local vibrations of the Ba inside the cages. It may also be determined directly from the
specific-heat data. A plot of cp/T3 vs. T reveals a broad peak around 18 K (lower inset of
Fig. 4.11). In this type of diagram an Einstein contribution shows up as a maximum at
– 67 –
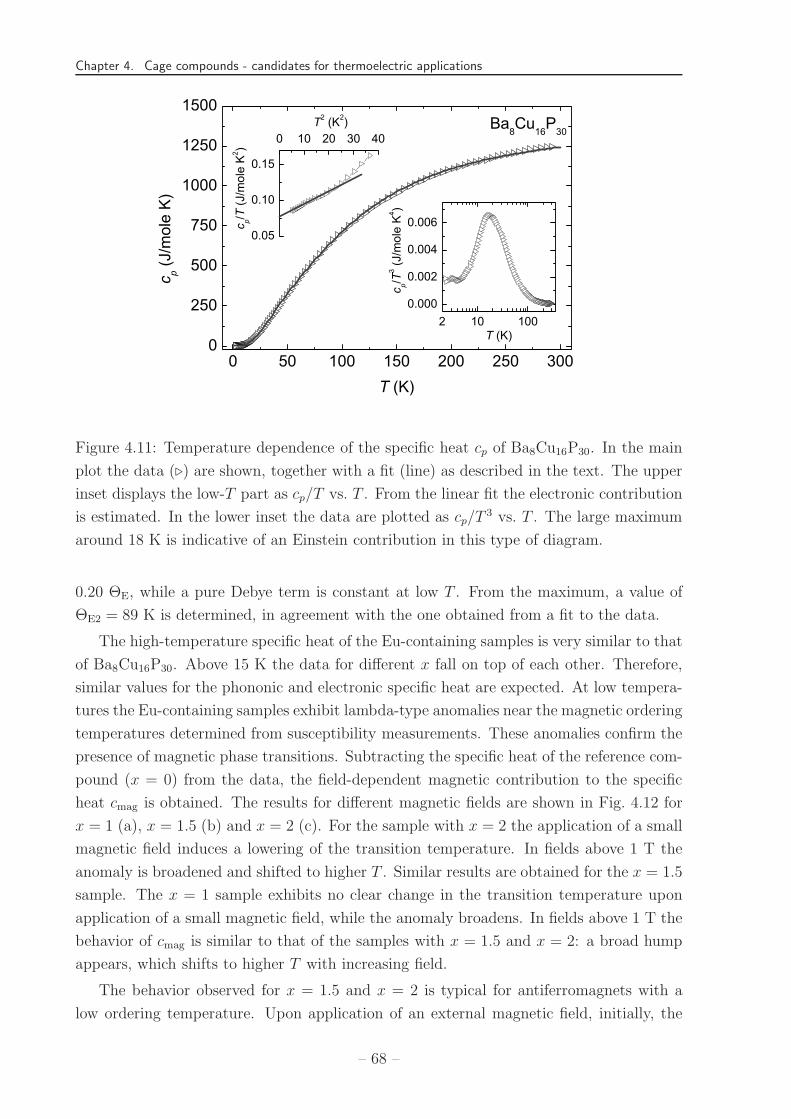
Chapter 4. Cage compounds - candidates for thermoelectric applications
Figure 4.11: Temperature dependence of the specific heat cp of Ba8Cu16P30. In the main
plot the data (�) are shown, together with a fit (line) as described in the text. The upper
inset displays the low-T part as cp/T vs. T . From the linear fit the electronic contribution
is estimated. In the lower inset the data are plotted as cp/T3 vs. T . The large maximum
around 18 K is indicative of an Einstein contribution in this type of diagram.
0.20 ΘE, while a pure Debye term is constant at low T . From the maximum, a value of
ΘE2 = 89 K is determined, in agreement with the one obtained from a fit to the data.
The high-temperature specific heat of the Eu-containing samples is very similar to that
of Ba8Cu16P30. Above 15 K the data for different x fall on top of each other. Therefore,
similar values for the phononic and electronic specific heat are expected. At low tempera-
tures the Eu-containing samples exhibit lambda-type anomalies near the magnetic ordering
temperatures determined from susceptibility measurements. These anomalies confirm the
presence of magnetic phase transitions. Subtracting the specific heat of the reference com-
pound (x = 0) from the data, the field-dependent magnetic contribution to the specific
heat cmag is obtained. The results for different magnetic fields are shown in Fig. 4.12 for
x = 1 (a), x = 1.5 (b) and x = 2 (c). For the sample with x = 2 the application of a small
magnetic field induces a lowering of the transition temperature. In fields above 1 T the
anomaly is broadened and shifted to higher T . Similar results are obtained for the x = 1.5
sample. The x = 1 sample exhibits no clear change in the transition temperature upon
application of a small magnetic field, while the anomaly broadens. In fields above 1 T the
behavior of cmag is similar to that of the samples with x = 1.5 and x = 2: a broad hump
appears, which shifts to higher T with increasing field.
The behavior observed for x = 1.5 and x = 2 is typical for antiferromagnets with a
low ordering temperature. Upon application of an external magnetic field, initially, the
– 68 –

4.4. Ba8−xEuxCu16P30 (x ≤ 2)
Figure 4.12: Magnetic contribution to the specific heat of Ba8−xEuxCu16P30 in various
magnetic fields for Eu concentrations x = 1 (a), x = 1.5 (b) and x = 2 (c).
transition temperature is reduced. At a field of the order of meffB ≈ kBTN the Zeeman
splitting overcomes the antiferromagnetic interactions, and the system is driven to an
induced paramagnetic state. In the case of Eu2+ ions with TN ≈ 3 K this is expected for
B � 0.6 T. Consistently, the Zeeman splitting of the ground-state multiplet generates a
Schottky contribution to the specific heat of all Eu-containing samples for B ≥ 1 T.
Extrapolating cmag/T to 0 K, the entropy associated with the phase transitions can
be estimated. For the sample with x = 1 approximately 92 % of the value expected for
complete ordering of Eu2+ is reached at 10 K. Therefore, it is concluded that the transition
is accompanied by complete ordering of the Eu2+ spins. The corresponding values for
the samples with x = 1.5 and x = 2 are 86 % and 70 %, respectively. The reduced
entropies are probably caused by the lower real Eu content compared to the nominal one.
From a comparison with the entropy of the x = 1 sample the true Eu concentrations are
estimated to 1.40 (x = 1.5) and 1.53 (x = 2). These values agree with those obtained
from magnetization and magnetic susceptibility (see Tab. 4.3 on page 64).
4.4.5 Summary and discussion
Polycrystals of Ba8−xEuxCu16P30 with nominal Eu concentrations x = 0, 1, 1.5, 2 have been
investigated. Both magnetic and specific-heat measurements indicate that the samples
with x = 1.5 and x = 2 have a smaller than the nominal Eu content. The real Eu
concentrations of the investigated specimens are estimated to xreal = 1.39 and xreal = 1.55,
– 69 –

Chapter 4. Cage compounds - candidates for thermoelectric applications
respectively. These values are comparable to those obtained from EDX absorption analysis
performed on the same samples, namely 1.51 ± 0.07 and 1.61 ± 0.06. Therefore, in none
of the samples full occupancy of a lattice site by a rare-earth element is realized.
Around 3 K the Eu-containing samples undergo phase transitions, most probably to
an antiferromagnetically ordered state. Due to the small Neel temperatures the samples
are driven to an induced paramagnetic state by application of a relatively weak magnetic
field. This gives rise to a kink in the magnetization M(B) of the samples with x = 1 and
x = 1.5 at approximately 0.14 T. In the specific heat the transition was observed at higher
fields. The differing values between magnetization and specific heat as well as the absence
of a clear transition in the magnetic susceptibility for the x = 2 sample are most probably
caused by Eu-Ba disorder on the 2d site inside the smaller cage.
The specific heat of the reference compound suggests the presence of local vibrations of
the guest atoms inside their cages. However, the advantageous semiconducting behavior
observed by Dunner and Mewis [108] could not be reproduced. Instead, metal-like resis-
tivities are found in all samples, as expected from the deficiency of 2 electrons per formula
unit for the stoichiometric system. Therefore, large thermopower values and consequently
a superior thermoelectric performance are not expected for the investigated samples.
4.5 A system with skutterudite-like structure:
Ce3Rh4Sn13
As mentioned in the introduction to this chapter, the search for correlated cage compounds
suitable for thermoelectric applications was initially focused on systems with clathrate
and skutterudite structure. Recently, investigations have been extended to new structural
types containing rare-earth elements.
Ce3Rh4Sn13 crystallizes in a skutterudite-like structure with two different cages [121].
Our interest in this compound was stimulated by the results of X-ray diffraction mea-
surements, which indicate local vibrations of Sn atoms inside one of the cages and sug-
gest a low lattice thermal conductivity [122]. Exploratory thermopower measurements on
Ce3Rh4Sn13 yielded comparably low S(T ) values, amounting to at most � 2 μV/K below
room temperature [122]. Nevertheless, the reported semiconducting behavior of the resis-
tivity [122] in combination with the anticipated low κph arouse our interest to scrutinize
the previous thermopower results. Furthermore, we wanted to evaluate the qualification
of this structure type for the design of thermoelectric materials.
Beside our interest in Ce3Rh4Sn13 as a possible thermoelectric, the absence of magnetic
ordering down to 2 K [122] stimulated investigations on the ground state of the compound.
The results of these measurements are briefly mentioned within this theses, in particular
where they refer to the thermoelectric performance of the system. A detailed discussion
of the low-temperature properties and ground state of Ce3Rh4Sn13 can be found in [123].
– 70 –

4.5. A system with skutterudite-like structure: Ce3Rh4Sn13
icosahedron trigonal prisms
Ce
Sn(2)
Rh
Sn(1)
(a) (b)
Figure 4.13: Crystal structure of Ce3Rh4Sn13.
4.5.1 Structure and properties
Ce3Rh4Sn13 crystallizes in the cubic Yb3Rh4Sn13 structure shown in Fig. 4.13, which is
close to the one of skutterudites [121]. It contains two different Sn sites, which were dis-
criminated by Moessbauer spectroscopy [122]. The Rh atoms are situated inside trigonal
prisms formed by six Sn(1) atoms (Fig. 4.13b). These prisms build a 3-dimensional net-
work, which contains two types of open spaces similar to the skutterudite structure. The
Sn(2) atoms occupy cages of icosahedral shape (Fig. 4.13a), while the Ce atoms fill chan-
nels running along three mutually perpendicular directions [124]. The local symmetry of
the Ce site in the structure induces a splitting of the J = 5/2 multiplet of the Ce3+ into
3 doublets, as is further discussed below.
X-ray diffraction measurements revealed high displacement parameters for the Sn(2)
position [122]. These have been claimed to indicate local vibrations of the Sn(2) atoms
inside the icosahedral cage and raised the speculation of a low phonon thermal conductivity
in Ce3Rh4Sn13. Previous investigations of the resistivity of Ce3Rh4Sn13 displayed a slight
increase from a large room-temperature value of 275 μΩcm down to 100 K [122]. A
broad maximum is attained in ρ(T ) around 100 K, followed by a minimum near 50 K
before ρ continues to rise even further towards low temperatures. As mentionend above,
thermopower measurements of Ce3Rh4Sn13 revealed a weak temperature dependence with
low absolute values of S � 2 μV/K below room temperature.
The ground state of Ce3Rh4Sn13 could not be determined from previous investigations.
No magnetic ordering had been observed down to 2 K [122]. The ground-state properties of
other compounds with the same structure differ widely. The related Ce3Ir4Sn13 undergoes
two phase transitions at 2.1 K and 0.6 K, which were attributed to antiferromagnetic
ordering [125, 126, 127, 128]. For Ce3Co4Sn13 specific-heat measurements indicate short-
range magnetic order below 0.8 K [129]. Magnetic ordering below 10 K was also reported
– 71 –

Chapter 4. Cage compounds - candidates for thermoelectric applications
for other isostructural Ce compounds, such as Ce3Os4Ge13 (T = 6.1 K) [124], Ce3Ru4Ge13
(T = 6.7 K) [124], and Ce3Pt4In13 (T = 0.95 K) [130]. These findings raised our interest
to investigate the low-temperature properties of Ce3Rh4Sn13 in order to clarify the ground
state of this material.
4.5.2 Samples
Sample preparation and structural characterization were performed by A. M. Strydom
(University of Johannesburg, South Africa). Polycrystalline Ce3Rh4Sn13 was synthesized
by arc melting of stoichiometric amounts of the elements and subsequent annealing for 2
weeks. No signs of minor phases or disorder were detected by X-ray diffraction. However,
a diamagnetic contribution to the magnetic susceptibility below 3.6 K indicates traces of
elemental Sn of < 2 %. As will become evident in the presentation and discussion of the
results, the principal features and findings on Ce3Rh4Sn13 are not affected by this impu-
rity phase. Polycrystalline La3Rh4Sn13 was also synthesized as a nonmagnetic reference
compound.
4.5.3 Results
Resistivity
The resistivity ρ(T ) of Ce3Rh4Sn13 has been measured for several samples in the temper-
ature range from 350 mK to 300 K. The inset of Fig. 4.14 shows the data obtained on the
sample with the smallest fraction of elemental Sn as determined from the change in ρ upon
applying a field of 30 mT to suppress superconductivity. Below 3.5 K data measured in
30 mT are shown, while all the data above this temperature are in zero field. Additionally,
the resistivity of the nonmagnetic reference compound La3Rh4Sn13 is plotted.
La3Rh4Sn13 exhibits metallic behavior and an intrinsic superconducting transition at
3.8 K. The shoulder in ρ(T ) around 60 K is presumably caused by interband scattering as
often observed for intermetallic compounds of d-electron metals [119]. However, consid-
ering the crystal structure with the loosely bound Sn(2) atoms, this feature may also be
an indication of enhanced scattering of charge carriers from local vibrations of the Sn(2).
The resistivity of Ce3Rh4Sn13 remains almost temperature independent at high absolute
values in qualitative agreement with the published one [122] below 200 K. A slight max-
imum is observed around 50 K. In zero magnetic field at low temperatures (T ≈ 3.5 K)
a weak kink in ρ(T ) is found, which is caused by the superconducting transition of traces
of elemental Sn. The amount of Sn estimated from the magnetic susceptibility of the
sample is in the order of 1-2 %. In a field of 30 mT the presumably intrinsic resistivity
behavior is recovered. However, it is not uncommon in cerium-based compounds to find
a high electronic density of states near the Fermi level giving rise to correlational effects,
one of which the formation of a small energy gap. The electronic transport deriving from
these effects can be very sensitive to even spurious amounts of elemental impurities [131].
– 72 –

4.5. A system with skutterudite-like structure: Ce3Rh4Sn13
Figure 4.14: Magnetic part of the resistivity ρmag of Ce3Rh4Sn13. Inset: Resistivity ρ of
Ce3Rh4Sn13 at B = 0 for T > 3.5 K and 30 mT for T < 3.5 K as well as that of the
nonmagnetic reference compound La3Rh4Sn13.
Therefore, it cannot be excluded that the absolute values of ρ(T ) of Ce3Rh4Sn13 shown
in Fig. 4.14 might to some extent be affected by the presence of a low concentration of
Sn-based impurity levels in the sample.
In the main plot of Fig. 4.14 the magnetic contribution to the resistivity ρmag(T )
is shown. For that purpose the phononic part given by the temperature-dependent
resistivity of the La compound was subtracted from the resistivity of Ce3Rh4Sn13. An
increasing ρmag upon decreasing T is deduced, resembling the incoherent Kondo behavior.
It is typical for Kondo lattices to show collective scattering effects below a few tens of
kelvin, such as coherence and a prominent decrease in ρ below a temperature T ∗ of the
order of TK. However, Ce3Rh4Sn13 does not display such a temperature dependence.
Qualitatively similar behavior has been found in the tetragonal compound CeRu4Sn6, a
low-carrier-density system [132]. A common feature in the crystal structures of CeRu4Sn6
and Ce3Rh4Sn13 is that the Ce atoms are in both cases located inside atomic cages of
surrounding atoms - a situation that is not conducive to phase-translational coherence
in the electronic transport. Instead, the low-temperature part of the resistivity of
Ce3Rh4Sn13 shows a broad maximum around 1 K. An estimate of the Kondo temperature
has been obtained from the magnetoresistance at low T with TK ≈ 2 K [123].
Magnetic susceptibility
Fig. 4.15 shows the magnetic susceptibility χ of Ce3Rh4Sn13 in external fields of B = 0.1 T
and 7 T. In order to estimate the Landau diamagnetic signal due to closed shells the
– 73 –

Chapter 4. Cage compounds - candidates for thermoelectric applications
Figure 4.15: Magnetic sucsceptibility of Ce3Rh4Sn13 measured in external fields of
B = 0.1 T and 7 T. The inset shows the inverse susceptibility for B = 0.1 T, whereas
the diamagnetic contribution χ0 has been subtracted as explained in the text.
susceptibility of La3Rh4Sn13 was measured. After subtracting the diamagnetic contribu-
tion χ0 from the susceptibility of Ce3Rh4Sn13 the data above 60 K can be described by
a Curie-Weiss law (inset of Fig. 4.15). A least-squares fit yields an effective moment of
2.67 μB per Ce, which is close to the free-ion moment expected for Ce3+ and a negative
Weiss constant ΘCW = −35 K indicating antiferromagnetic correlations. These values
are in agreement with previous results [122]. The deviations from the Curie-Weiss law at
lower T may be caused by the existence of a crystal electric field (CEF) splitting.
Specific heat
The specific heat cp of Ce3Rh4Sn13 and La3Rh4Sn13 is shown in Fig. 4.16a as cp/T vs. T .
The small anomaly in the specific heat of the Ce compound at 6.5 K is probably caused
by magnetic ordering of a foreign phase of Ce oxide [133]. From the entropy released at
the transition the amount of this phase is estimated to be less than 3 %. Therefore, it is
assumed that the effect of this impurity is confined to the temperature region very close
to 6.5 K, and entirely negligible elsewhere. Above 10 K the cp(T )/T behavior of the Ce
and La compounds is qualitatively similar. A plot of the specific heat of the La system as
cp/T3 vs. T (Fig. 4.16b) displays a maximum around 10.5 K. Such a behavior is indicative
of an Einstein contribution to cp with a characteristic temperature of ΘE = 52 K. It is
most probably caused by local modes of the Sn(2) atoms. For Ce3Rh4Sn13 the maximum
is superposed by the magnetic contribution and therefore not well resolved.
The magnetic contribution cmag to the specific heat of Ce3Rh4Sn13 is calculated by
– 74 –

4.5. A system with skutterudite-like structure: Ce3Rh4Sn13
Figure 4.16: (a) Specific heat divided by temperature cp/T vs. T of Ce3Rh4Sn13 and of the
nonmagnetic reference compound La3Rh4Sn13. Inset: Magnetic part of the specific heat
cmag/T of Ce3Rh4Sn13. The line describes a Schottky contribution of an excited doublet
lying at ΔCEF/kB = 90 K above the ground-state doublet. (b): Special presentation of
the specific-heat data of Ce3Rh4Sn13 and La3Rh4Sn13 as cp/T3 vs. T . In this type of plot
an Einstein contribution generates a maximum near 0.2 ΘE.
subtracting the specific heat of La3Rh4Sn13, which serves as a phononic background3.
The difference between the data of the Ce and the La compound for T > 10 K is
shown as cmag/T in the inset of Fig. 4.16a. It reveals a Schottky anomaly centered
around 30 K. The maximum in cmag is best described by an energy splitting ΔCEF
corresponding to ΔCEF/kB = 90 K between the ground-state doublet and an excited
doublet. The low-temperature specific heat divided by temperature of Ce3Rh4Sn13
exhibits a large maximum around 1 K (Fig. 4.16a), which is attributed to short-range
magnetic correlations [123].
Thermal transport properties
The thermopower S of Ce3Rh4Sn13, is shown in Fig. 4.17a. Although the absolute
values are somewhat larger than those previously reported [122], no large peak in the
3This prodedure, which is frequently used to determine the magnetic contribution to cp, can be appliedto Ce3Rh4Sn13 due to the small difference of the lattice parameters between the Ce and the La compound(aCe = 9.708 A vs. aLa = 9.745 A) [134]. Moreover, the atomic masses of Ce (mCe = 140.12 au) and La(mLa = 138.91 au) are very close to each other.
– 75 –

Chapter 4. Cage compounds - candidates for thermoelectric applications
Figure 4.17: (a) Thermopower S of Ce3Rh4Sn13. (b) The inset shows the low-temperature
part on a larger scale. (c) Thermal conductivity κ of Ce3Rh4Sn13. The electronic and
phononic contributions κel are κph have been obtained as explained in the text. (d) The
inset shows the ratio κph/κel on a logarithmic temperature scale.
thermopower as typically observed in Kondo systems and crucial for thermoelectric appli-
cations is found. At elevated temperatures S is positive. Around 30 K the thermopower
exhibits a shoulder, which may be caused by the CEF splitting of the Ce3+ ground state.
Since scattering from an excited level generates a positive contribution to S(T ) with a
maximum at approximately (0.3 − 0.6)ΔCEF/kB [43, 44, 41], this is in agreement with
a splitting of ΔCEF/kB = 90 K as determined from the specific heat. Below 20 K the
thermopower becomes negative and goes through a broad minimum around 5 K where
S = −3.5 μV/K (inset Fig. 4.17b).
Fig. 4.17c shows the thermal conductivity κ of Ce3Rh4Sn13. In addition, the elec-
tronic and phononic contributions, κel are κph, are plotted. κel was calculated using
the Wiedemann-Franz law (Eq. 2.27), κph was determined by subtracting the estimated
κel from the total thermal conductivity κtot. Above 10 K, κph is almost temperature-
independent. In particular, no maximum as typically observed for crystalline solids due
to umklapp scattering is found around 20 K. This is probably a result of enhanced scat-
tering from grain boundaries in the polycrystalline material. The overall values of the
thermal conductivity are relatively small and comparable to those observed in other cage
compounds, e.g. Ba6Ge25 [118] or Ba8Ga16Ge30 [135]. On the other hand, for several
clathrates significantly smaller values of κph ∼ 0.2 W/Km have been reported, e.g. for
– 76 –

4.5. A system with skutterudite-like structure: Ce3Rh4Sn13
Sr8Ga16Ge30 and β-Eu8Ga16Ge30 [96]. However, the present results for κph of Ce3Rh4Sn13
have to be discussed in comparison to the electronic thermal conductivity. Using the
Wiedemann-Franz relation (Eq. 2.27), Eq. 4.1 can be rewritten as:
ZT =S2T
L0T (1 +κph
κel)
(4.3)
A large thermoelectric figure of merit ZT is obtained for a small ratio κph/κel. Thus, the
relevant parameter turns out not the lattice thermal conductivity, but the contribution of
the lattice in comparison to that of the charge carriers. The inset Fig. 4.17d compares
the ratio κph/κel for Ce3Rh4Sn13 to that of Sr8Ga16Ge30 and β-Eu8Ga16Ge30 calculated
using the data published in Ref. [96]. Despite the significantly larger lattice thermal
conductivity of Ce3Rh4Sn13 compared to that of Sr8Ga16Ge30, the quantity κph/κel is very
similar for both compounds. By contrast, β-Eu8Ga16Ge30 exhibits a considerably smaller
ratio κph/κel, especially at low temperatures.
4.5.4 Discussion
Both resistivity as well as specific-heat measurements on the reference compound
La3Rh4Sn13 provide evidence for local vibrations of the loosely bound Sn(2) atoms in
the structure. In the specific heat an Einstein contribution with an Einstein temperature
ΘE of approximately 60 K is found. Likewise, the shoulder observed in ρ(T ) near 60 K may
be interpreted in terms of enhanced scattering of charge carriers above ΘE. These findings
are in agreement with previous results from X-ray diffraction measurements, showing large
displacement parameters for the Sn(2) position [122]. The lattice thermal conductivity of
Ce4Rh4Sn13 has been found to be relatively low and comparable to that observed in other
cage compounds. Thus, the potential of the structure type with respect to low values of
κph suggested already by the resistivity, specific heat, and X-ray diffraction measurements
is directly verified for Ce4Rh4Sn13.
Evidence for cooperative magnetic behavior in Ce4Rh4Sn13 at low temperatures stems
from magnetic measurements. The susceptibility reveals antiferromagnetic correlations
with a Weiss constant of ΘCW = −35 K. However, the Kondo screening and the associated
magnetic-moment renormalization prevents the system to order at higher temperatures. A
broad transition at 1 K with high absolute values is observed in the low-T specific heat of
Ce4Rh4Sn13 (Fig. 4.16a). The absence of a frequency dependence in the ac susceptibility
[123] excludes the possibility of spin-glass ordering. Applied magnetic fields give rise
to a shift of the maximum in cp/T to higher T . The present state of investigations into
Ce3Rh4Sn13 [123] points toward a ground state that is probably of antiferromagnetic order,
and with a transition that is broadened presumably due to disorder effects such as Ce and
Sn site exchange. In fields the Kondo screening is suppressed, which leads to a shift of
the transition temperature as the magnetic moment rises in field. At fields B ≥ 4.2 T
– 77 –

Chapter 4. Cage compounds - candidates for thermoelectric applications
the specific heat exhibits a Schottky anomaly, which marks the excitations between the
Zeeman-split ground-state levels.
At room temperature, Ce3Rh4Sn13 acts like an ordinary paramagnetic metal with the
full moment of the Ce3+ configuration. The corresponding Curie-Weiss behavior in the
susceptibility shows deviations only below 60 K. These are caused by CEF excitations.
Indeed, the specific-heat results (cf. Fig. 4.16) reveal a CEF scheme with a doublet ground
state and a first excited doublet at Δ/kB = 90 K indicated by a Schottky anomaly around
30 K. The second excited doublet cannot be resolved in the present data on Ce3Rh4Sn13.
It is believed to occur at higher temperatures. Recent neutron-scattering data revealed
CEF excitations at 9 meV and 38 meV and thus confirm this picture [136]. Features
according to the CEF splitting were also observed in thermopower and resistivity. S(T )
exhibits a shoulder structure around 30 K, which is in agreement with a CEF level ap-
proximately 90 K above the ground-state doublet. The magnetic part of the resistivity
(inset of Fig. 4.14) increases upon cooling down with a change in slope around 10 K and
a maximum resistivity at 2 K. The high-T increase is presumably caused by scattering of
the charge carriers off Ce3+ Kondo ions in a quasi-quartet state. The resistivity rise below
10 K is attributed to the Kondo effect with screening of the doublet ground state. No
coherence effects are observed in ρmag(T ), presumably due to the low Kondo temperature
of TK ≈ 2 K and the effect of disorder or the particular crystal structure, as mentioned
earlier.
The thermopower of a Kondo system typically exhibits a pronounced extremum around
the Kondo temperature. However, the minimum in S(T ) of Ce3Rh4Sn13 lies around 7 K
and at a comparably small value of Smin = −2 μV/K. This unusual behavior is probably
caused by the broadened magnetic transition around 1 K. A low-T contribution to the ther-
mopower corresponding to the 1 K peak in the specific heat could prevent the thermopower
to attain larger absolute values at T ≈ TK. It is conceivable that the superposition of both
effects is leading to the observed small minimum at slightly higher temperatures than TK.
Although the low thermopower values exclude the use of Ce4Rh4Sn13 for applications,
the low thermal conductivity values ask for further investigations on other, isostructural
compounds. This desire is also supported by a recent study on Y3Ir4Ge13. The system
exhibits a thermoelectric figure of merit ZT = 0.02 at room temperature [137], a value
comparable to what is reached in clathrate compounds at much lower T . Thus, compounds
with Yb3Rh4Sn13 structure appear a promising alternative to the primarily investigated
skutterudites and clathrates.
4.6 Summary
In this chapter three attempts to incorporate Eu inside clathrate cages to achieve large
values of the thermoelectric figure of merit have been presented. Additionally, a compound
with skutterudite-like structure has been investigated.
– 78 –

4.6. Summary
In the potassic clathrates transition-metal elements are built into the network with
the aim to enhance the hybridization between the Eu 4f states and the conduction band.
The sensitivity of the materials to air and moisture, however, complicated investigations
of the physical properties. Ba8Ge43�3 and Ba8Cu16P30 appeared good starting materials
for Ba-Eu exchange due to the reported semiconductor-like resistivities. However, the
semiconducting behavior was not reproduced in the present investigation. Furthermore,
complete occupancy of a lattice site by Eu, which is assumed crucial for correlations, could
not be realized in these systems. The resulting disorder is evident from various physical
properties.
Generally, the difficulties in synthesizing large and pure samples have complicated in-
vestigations of the physical properties of the clathrate compounds. The thermal transport
properties could not be measured for any of the presented systems due to the small sam-
ple size. However, in view of the divalent state of the Eu and the metal-like resistivities
observed for Ba8−xEuxGe43 (x ≤ 0.6) and Ba8−xEuxCu16P30 (xreal < 1.6), it may be sup-
posed that the thermoelectric performance of these materials is rather poor. As the most
promising of the investigated clathrates appear the potassic compounds. The anticipated
low charge-carrier concentrations and the semiconducting behavior of K6Eu2Cd5Ge41 to-
gether with the reduced magnetic moment in fields up to 1 T at low T motivate further
investigations.
The skutterudite-like compound Ce3Rh4Sn13 exhibits low thermopower values, which
disqualify it for thermoelectric applications. However, clear evidence for local vibrations
of the Sn(2) atoms inside their cages in combination with the low lattice thermal con-
ductivity confirm the capability of this structure type. The large magnetic resistivity
indicates the presence of correlations, which are assumed advantageous for enhanced ther-
mopower values. Thus, investigations on rare-earth systems with the same or a similar
structure appear highly desirable to evaluate the potential of this class of compounds for
applications.
– 79 –
Chapter 4. Cage compounds - candidates for thermoelectric applications
– 80 –

Chapter 5
Energy scales in systems with
localized magnetic moments
A large number of Ce and Yb systems exhibit characteristic low-temperature properties,
which are caused by the interactions between the localized 4f moments and the conduction
electrons. The Kondo effect induces a screening of the local moments, thus promoting a
nonmagnetic ground state. The RKKY interaction, on the other hand, favors magnetic
ordering of the 4f moments. The interplay between these two effects leads to a large
variety of low-temperature phenomena, as magnetic ordering, heavy-fermion behavior,
intermediate valence, non-Fermi liquid behavior, and quantum criticality (Chap. 2.1).
At intermediate temperatures (∼ 10 . . . 100 K) the properties of Ce and Yb systems
are governed by a competition of crystal-electric-field (CEF) excitations and the Kondo
interaction. A knowledge of the corresponding characteristic energy scales kBTΔCEF and
kBTK is essential for an understanding of the low-temperature properties of these com-
pounds. Both Kondo interaction and CEF excitations usually give rise to large anomalies
in the thermopower of Yb and Ce systems. S(T ) typically exhibits a maximum (Ce) or
minimum (Yb) in S(T ) around the Kondo temperature TK [39, 40, 41]. In addition, for an
excited CEF level at TΔCEF, a large positive (Ce) or negative (Yb) contribution with an
extremum at (0.3 . . . 0.6) TΔCEF is observed [43, 44, 41]. It is caused by Kondo scattering
on the ground state and thermally populated CEF levels (Chap. 2.2.4). Thermopower
investigations are therefore most appropriate for a determination of the Kondo and CEF
energy scales in these compounds.
In this chapter the thermopower of various Ce- and Yb-based heavy-fermion (HF)
systems with ThCr2Si2 crystal structure is discussed. Additionally, resistivity data ob-
tained on the same specimens are presented. The main focus lies on the determination
of the Kondo and CEF energy scales of the investigated compounds. After some general
remarks on the properties of Ce and Yb based HF systems in Sec. 5.1, the measurements
are presented. At first the Yb Kondo-lattice compounds YbRh2Si2, YbRh2(Si0.95Ge0.05)2,
and YbIr2Si2 are discussed (Sec. 5.2). Subsequently the results obtained on the di-
– 81 –
luted series Lu1−xYbxRh2Si2 are presented (Sec. 5.3). Sec. 5.4 is dedicated to the series
CexLa1−xNi2Ge2.
5.1 Ce- and Yb-based heavy-fermion systems
5.1.1 The electron-hole analogy between Ce3+ and Yb3+
The properties of Yb- and Ce-based heavy-fermion systems can be compared with the
aid of the electron-hole analogy. The 4f shell of Ce3+ in the 4f 1 configuration contains
a single electron. Yb3+ in its 4f 13 configuration, on the other hand, has one hole. In
consequence, Ce and Yb systems show contrary signs in the physical properties, which
depend on the type of charge carriers, e.g. Hall effect and thermopower. Ce-based heavy-
fermion systems generally exhibit large positive contributions to S(T ) due to Kondo effect
on the ground state and thermally populated CEF levels. By contrast, Yb systems have
large negative Kondo and CEF contributions. Likewise, the diffusion contributions1 to
S(T ) of Ce and Yb systems usually have different signs: electron-like charge carriers as
typically dominating in Ce compounds give rise to a negative diffusion thermopower Sd,
hole-like carriers as in Yb systems produce positive values of Sd.
Another implication of the electron-hole symmetry is the differing correlation between
the unit-cell volume and the Kondo and magnetic ordering temperatures for Ce and Yb
compounds. The magnetic Ce ion (Ce3+ with 4f 1 configuration) is larger than the non-
magnetic one (4f 0 Ce4+). A decrease of the unit-cell volume due to pressure or substi-
tution of an element by a smaller one (chemical pressure) therefore favors the nonmag-
netic Ce configuration and gives rise to an enhancement of TK. Such behavior was found
e.g. in CeRu2Ge2 [47] and CeCu2Ge2 [14] under pressure , and in (La1−xCex)3Al [138] and
Ce(Pt1−xNix)2Si2 [139] upon substitution. The magnetic Yb ion (4f 13 Yb3+), on the other
hand, is smaller than the nonmagnetic configuration (4f 14 Yb2+). For Yb systems a de-
creasing unit-cell volume therefore favors the magnetic ground state and generally induces
a lowering of the Kondo energy scale. This was observed e.g. for YbSi and YbCu2Si2 under
pressure [48] and Yb(Ni1−xCux)2Si2 upon substitution [49].
The electron-hole analogy provides a basis for the qualitative comparison of the prop-
erties of a large number of Ce and Yb HF compounds. However, on closer examination,
the picture gets more complicated. In fact, the application of pressure entails two mech-
anisms [140]: (1) As described above, the decrease of the lattice volume under pressure
favors the smaller rare-earth ion configuration. Whereas this effect stabilizes magnetic or-
dering of Yb systems, Ce compounds are driven towards a nonmagnetic ground state. (2)
In addition, the smaller lattice volume under pressure gives rise to an enhanced hybridiza-
tion between the 4f - and the conduction-electron states and therefore facilitates valence
fluctuations. This mechanism promotes a nonmagnetic ground state in both Ce and Yb
1In this work, the term ’diffusion contribution’ refers to light charge carriers (cf. footnote 9 on page 21).
– 82 –

5.1. Ce- and Yb-based heavy-fermion systems
systems. However, it is more pronounced in Ce compounds, since the 4f radius of Ce3+
(0.36 A) is significantly larger than that of Yb3+ (0.25 A) [141]. A comparison of the two
mechanisms reveals an important difference between Ce and Yb systems: Whereas both
effects favor a nonmagnetic ground state in Ce compounds under pressure p, they compete
in Yb systems. This observation is held responsible for the unusual pressure dependence of
TK of some Yb systems, e.g Yb2Ni2Al [140]. The temperature of the resistance maximum
of this compound, which is taken as a measure of TK, goes through a broad minimum and
then slightly increases with p [142].
As mentioned above, the differing degree of localization of the 4f shell in Yb and Ce
gives rise to a much stronger hybridization between the 4f - and conduction-electron states
in Ce systems. According to Eq. 2.10, the broadening of the 4f level Δ of Ce3+ is therefore
significantly larger than that of Yb3+ in the same lattice. Consequently, the occupancy
n4f of Ce and Yb systems with similar Kondo temperature can differ significantly. This
has also implications for the magnetism of Ce and Yb compounds. Whereas magnetic
order of Ce systems is destroyed already for tiny deviations from n4f = 1, Yb compounds
may exhibit long-range order even for n4f ∼ 0.8 [143].
The differing ionic radii of Yb3+ and Ce3+ frequently motivate a different treatment in
theoretical calculations. The pressure-induced change of the lattice volume of Ce systems
is assumed to mainly affect the hybridization strength between the 4f and the conduction
electron states Vsf [41]. In Yb systems, on the other hand, Vsf is expected to be almost
unchanged under pressure, due to the extremely small radius of the 4f shell. Instead it is
supposed that the pressure predominantly alters the binding energy of the unperturbed
4f level ε4f . According to Eq. 2.2, a change in both Vsf as well as ε4f induces a variation
of the effective coupling J and thus the Kondo energy scale.
5.1.2 Dilution of magnetic moments
Kondo-lattice compounds are characterized by an ordered arrangement of localized mag-
netic moments. This is accomplished for complete occupation of a lattice site by a moment-
carrying rare-earth (or actinide) element. For a large number of rare-earth compounds the
amount of magnetic moments can be reduced continuously to zero by partial or complete
exchange of the magnetic ions by a nonmagnetic element, e.g. in CexLa1−xCu6 [144]. This
series is driven from a dense Kondo lattice for x = 1 to a diluted Kondo system at low Ce
content. The evolution is evident from the magnetic resistivity ρmag. Partial substitution
destroys the translational symmetry and thus suppresses the onset of coherence, which is
observed for x = 1 at low temperatures. For small Ce concentrations the series behaves as
a diluted Kondo system: ρmag increases as ρmag ∝ − ln(T/C), with C being an constant,
and saturates at large residual values. In the limiting case of LaCu6 a nonmagnetic normal
metal is obtained.
Substitution of the magnetic by a nonmagnetic but isoelectronic element does, in first
– 83 –
Chapter 5. Energy scales in systems with localized magnetic moments
approximation, not alter those physical properties, which are independent of the magnetic
moment, as the phonon dispersion relation or the number of free charge carriers. Therefore,
the moment-free compound can be used as a nonmagnetic reference for the substitution
series. This allows a separation of magnetic from other contributions, e.g. to the specific
heat or the scattering rate of charge carriers and thus the resistivity. However, the chemical
substitution has additional consequences, which are not always negligible:
� The substitution is in general connected with a small change in the lattice constants
due to the different ionic radii of the magnetic and the nonmagnetic elements. This
’chemical pressure’ alters the Kondo energy scale via (1) the favoring of either the
magnetic or the nonmagnetic configuration of the initially magnetic element and
(2) a change in the hybridization between the local 4f and the conduction-electron
states (Sec. 5.1.1).
� The slight deviation from integer valence of the magnetic ion compared to the integer
value for the nonmagnetic one gives rise to a small change in the number of free charge
carriers and a shift of the Fermi level.
� The induced disorder affects the transport properties as the resistivity or thermal
conductivity.
� The difference in the atomic masses influences the lattice properties as the phonon
modes or the lattice specific heat. It is assumed negligible, if the nonmagnetic
compound used as a reference for the magnetic one contains a rare-earth element
with similar atomic mass.
For an interpretation of measured data a careful analysis on the relevance of these effects
is necessary. However, it should be mentioned that they are not always unwanted. In
particular, the change in TK of LuxYb1−xRh2Si2 upon Lu substitution is used for the
determination of the Kondo energy scale of YbRh2Si2 in this work (Sec. 5.3). Additionally,
chemical pressure is frequently employed to lower the magnetic ordering temperature of a
compound to approach a quantum critical point (QCP), e.g. in YbRh2(Si1−xGex)2 [145].
5.1.3 The ThCr2Si2 crystal structure
All systems presented in this chapter crystallize in the bodycentered tetragonal ThCr2Si2
structure, which is shown in Fig. 5.1. The unit cell contains 2 formula units. In YbRh2Si2
the Th position is occupied by Yb and the Cr site by Rh. This compound can be re-
garded as a parent compound for a number of other Yb systems of the same structural
type. YbRh2(Si1−xGex)2 is formed by partial substitution of Si by Ge. Exchange of Rh
by Ir constitutes the bodycentered modification of YbIr2Si2 (I-type). This composition
crystallizes in a second modification, which, however, is not discussed in this work. In
– 84 –
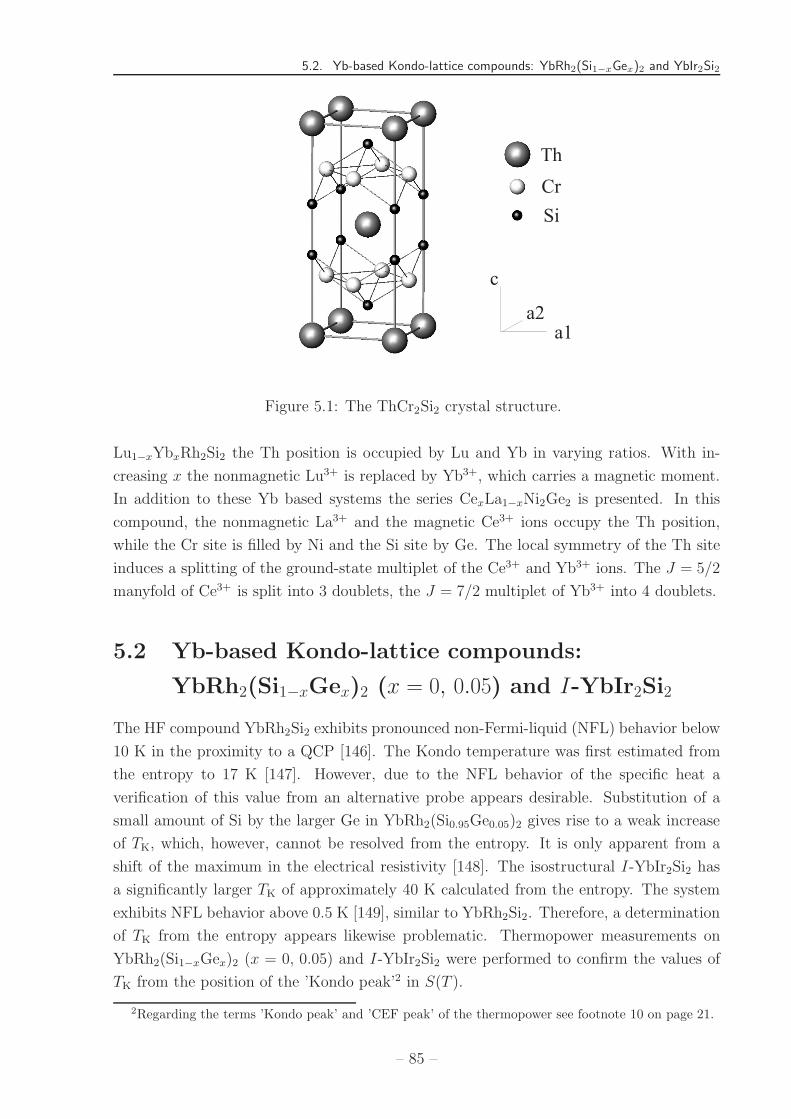
5.2. Yb-based Kondo-lattice compounds: YbRh2(Si1−xGex)2 and YbIr2Si2
c
a2
a1
Th
Cr
Si
Figure 5.1: The ThCr2Si2 crystal structure.
Lu1−xYbxRh2Si2 the Th position is occupied by Lu and Yb in varying ratios. With in-
creasing x the nonmagnetic Lu3+ is replaced by Yb3+, which carries a magnetic moment.
In addition to these Yb based systems the series CexLa1−xNi2Ge2 is presented. In this
compound, the nonmagnetic La3+ and the magnetic Ce3+ ions occupy the Th position,
while the Cr site is filled by Ni and the Si site by Ge. The local symmetry of the Th site
induces a splitting of the ground-state multiplet of the Ce3+ and Yb3+ ions. The J = 5/2
manyfold of Ce3+ is split into 3 doublets, the J = 7/2 multiplet of Yb3+ into 4 doublets.
5.2 Yb-based Kondo-lattice compounds:
YbRh2(Si1−xGex)2 (x = 0, 0.05) and I-YbIr2Si2
The HF compound YbRh2Si2 exhibits pronounced non-Fermi-liquid (NFL) behavior below
10 K in the proximity to a QCP [146]. The Kondo temperature was first estimated from
the entropy to 17 K [147]. However, due to the NFL behavior of the specific heat a
verification of this value from an alternative probe appears desirable. Substitution of a
small amount of Si by the larger Ge in YbRh2(Si0.95Ge0.05)2 gives rise to a weak increase
of TK, which, however, cannot be resolved from the entropy. It is only apparent from a
shift of the maximum in the electrical resistivity [148]. The isostructural I-YbIr2Si2 has
a significantly larger TK of approximately 40 K calculated from the entropy. The system
exhibits NFL behavior above 0.5 K [149], similar to YbRh2Si2. Therefore, a determination
of TK from the entropy appears likewise problematic. Thermopower measurements on
YbRh2(Si1−xGex)2 (x = 0, 0.05) and I-YbIr2Si2 were performed to confirm the values of
TK from the position of the ’Kondo peak’2 in S(T ).
2Regarding the terms ’Kondo peak’ and ’CEF peak’ of the thermopower see footnote 10 on page 21.
– 85 –
Chapter 5. Energy scales in systems with localized magnetic moments
5.2.1 Physical properties
At the beginning of this section, the physical properties of YbRh2Si2, YbRh2(Si0.95Ge0.05)2,
and YbIr2Si2 (I−type) are described. The focus lies on the investigated temperature range
of 2 to 300 K. Some characteristic properties of the compounds are summarized in Tab. 5.1
on page 89.
YbRh2Si2
The HF compound YbRh2Si2 has attracted considerable attention due to its unusual
low-temperature properties. It is situated very close to a magnetic instability with an
antiferromagnetic ordering temperature of TN = 70 mK [146]. The system can be driven
to a QCP at which TN → 0 by the application of a small magnetic field of 0.06 T for
B ⊥ c or 0.7 T for B ‖ c [150]. In a large temperature range above TN the properties of
YbRh2Si2 strongly deviate from the predictions of the Landau Fermi-liquid theory: For
TN < T < 10 K the resistivity shows a quasilinear temperature dependence. The electronic
contribution to the specific heat diverges as cel/T ∝ − ln(T/C) for 300 mK < T < 10 K
with C a constant [146].
The Kondo temperature of YbRh2Si2 was first estimated from the specific heat of the
system. It has been determined as twice the temperature, at which the entropy3 S reaches
half of the value released for complete ordering of a doublet state:
TK = 2 × T (S =1
2R ln 2) (5.1)
This relation is based on a calculation of the specific heat within the resonance level
model [151]. A similar result was obtained from numerical calculations of the specific heat
of a diluted spin-1/2 Kondo system using the Bethe ansatz [152]. It is frequently applied
for the determination of TK of both diluted and dense Kondo systems. Using the data pub-
lished in [146] the Kondo temperature of YbRh2Si2 was determined to be approximately
17 K [147]. This approach, however, is arguable. The specific heat of YbRh2Si2 exhibits a
temperature dependence, which strongly deviates from that calculated in Refs. [151, 152]
due to the NFL behavior of the compound. An independent determination of TK is there-
fore desirable.
The CEF level scheme of YbRh2Si2 was determined from inelastic neutron scattering.
The free-ion ground-state multiplet of the Yb3+ splits into 4 doublets at 0-200-290-500 K,
respectively [153]. The splitting manifests itself also in the specific heat of the system as
a broad hump around 60 K in the magnetic contribution cmag/T [146]. So far a definite
determination of TK from inelastic neutron-scattering experiments is not possible. The
width of the quasielastic line shows no clear saturation in the investigated temperature
range (0.8 K ≤ T ≤ 22 K), probably due to the magnetic ordering at lower T [154].
The electrical resistivity of YbRh2Si2 indicates a strong interplay between Kondo effect
and CEF excitations at elevated temperatures. ρ(T ) obtained for the current j ⊥ c is
3A tilde is used to distinguish between thermopower S and entropy S.
– 86 –

5.2. Yb-based Kondo-lattice compounds: YbRh2(Si1−xGex)2 and YbIr2Si2
Figure 5.2: Electrical resistivity normalized to the value at 300 K of YbRh2Si2,
YbRh2(Si0.95Ge0.05)2, and I-YbIr2Si2 for j ⊥ c. The arrows mark the positions of the
maxima in ρ(T ).
shown in Fig. 5.2, together with that of YbRh2(Si0.95Ge0.05)2 and I-YbIr2Si2. It exhibits a
single broad maximum around 130 K, which was attributed to combined scattering on the
ground state and thermally populated CEF levels [155]. Such behavior was theoretically
predicted for compounds, in which Kondo and CEF energy scales approach the same
order of magnitude: TΔCEF < a · TK with a ∼ 10 [156] (Chap. 2.1.3). YbRh2Si2 with a
Kondo temperature of approximately 20 K and a first excited CEF level around 200 K
therefore seems to be situated near the critical ratio TΔCEF/TK, for which the effect of
Kondo scattering on the ground state and thermally populated CEF levels can no longer
be separated in the resistivity.
Upon applying pressure the Kondo temperature of Yb systems is typically shifted to
lower T , while the CEF levels are not affected significantly. For sufficiently small values
of TK separate maxima in ρ(T ) due to Kondo effect on the ground state and thermally
populated CEF levels are expected. Such behavior has been confirmed for YbRh2Si2
from resistivity investigations under pressure. At low p, the temperature of the broad
maximum in ρ(T ) decreases with increasing p, indicating a lowering of the characteristic
temperature of the system [148]. Above 4 GPa, the single peak splits into three separate
maxima [155]. The two maxima at lower T were attributed to Kondo scattering on the
ground-state doublet with the onset of coherence and to Kondo scattering on higher CEF
levels. The origin of the third maximum remains unclear. The evolution of the positions
of the maxima in ρ(T ) under pressure was analyzed taking into account the CEF level
scheme of YbRh2Si2. The data could be well described assuming a Kondo temperature of
– 87 –

Chapter 5. Energy scales in systems with localized magnetic moments
26 K [157]. This value is larger than that obtained from the entropy of the system.
The primary aim of the thermopower investigations on YbRh2Si2 presented in this
thesis was a direct determination of the Kondo temperature of the compound from the
position of the ’Kondo peak’. However, in consideration of the strong interplay between
Kondo effect and CEF excitations apparent from the resistivity it appears questionable,
whether a separation from the ’CEF peak’ in S(T ) is actually possible.
The influence of Si-Ge substitution on the high-T properties of YbRh2Si2
Upon applying pressure, the magnetic ordering temperature of YbRh2Si2 is shifted to
higher T , as typically observed in Yb systems. A lowering of TN to 0 K in order to reach
the QCP requires a lattice expansion. This can be realized e.g. by partial substitution
of Si by the isoelectronic, larger Ge. The necessary amount of Ge was estimated to
x = (4 ± 1) at. % [158]. Single crystals of YbRh2(Si1−xGex)2 with nominal Ge content
x = 0.05 were synthesized with the objective of lowering TN to 0 K. Microprobe analysis
revealed an actual Ge content of x = 0.02± 0.01 [145]. Nevertheless, for consistency with
previous publications, the nominal Ge content is used throughout this thesis.
In agreement with the expanded lattice the antiferromagnetic ordering temperature of
YbRh2(Si0.95Ge0.05)2 is lowered to TN = (20 ± 5) mK [145]. The change in the unit-cell
volume Vuc of YbRh2(Si0.95Ge0.05)2 compared to the Ge-free system may not be resolved
from X-ray powder diffraction. However, the magnetic phase diagram matches that of
YbRh2Si2 by shifting the data by Δp = −0.17± 0.03 GPa [148]. Using the bulk modulus
of YbRh2Si2 of 189 GPa [159] the increase in Vuc has been estimated [158] to 0.14 ± 0.03 A3,
corresponding to an effective Ge content of 0.019± 0.006. This value agrees with that ob-
tained from microprobe analysis. It was therefore concluded that the influence of disorder
on the low-T properties of the compound is negligible.
At elevated temperatures the physical properties of YbRh2(Si0.95Ge0.05)2 strongly re-
semble those of YbRh2Si2. This is not surprising in view of the small amount of substituted
atoms and the isoelectronic character of Ge and Si. The influence of the lattice expansion
on the CEF splitting of the Yb3+ multiplet is expected to be negligible. The Kondo energy
scale, on the other hand, slightly increases upon Ge substitution. This is seen from the
electrical resistivity of YbRh2(Si0.95Ge0.05)2 (Fig. 5.2). The overall temperature depen-
dence is similar to that of YbRh2Si2 [148]. However, the steep increase in ρ(T ) observed
below 100 K is shifted to higher T for the Ge-containing compound. This behavior is
opposite to that of YbRh2Si2 under pressure as shown in Ref. [148]. It was attributed to a
slightly larger TK in YbRh2(Si0.95Ge0.05)2. The increase of TK upon Ge substitution could
not be resolved from the entropy of the system, probably due to the very small change
upon substitution.
On the nonmagnetic side of the QCP: YbIr2Si2
Both, YbRh2Si2 and YbRh2(Si0.95Ge0.05)2 order magnetically at low temperatures. The
isostructural I-YbIr2Si2, on the other hand, remains paramagnetic down to 40 mK [149].
– 88 –

5.2. Yb-based Kondo-lattice compounds: YbRh2(Si1−xGex)2 and YbIr2Si2
It is considered to be situated on the nonmagnetic side of the QCP and exhibits Fermi-
liquid behavior below 0.2 K. The complete exchange of Rh by Ir induces a much stronger
lattice expansion than partial substitution of Si by Ge in YbRh2(Si0.95Ge0.05)2 (Tab. 5.1)
[160]. This effect is also held responsible for the significantly enhanced Kondo scale in
I-YbIr2Si2. The Kondo temperature of the system estimated from the entropy is approx-
imately 40 K [160] and thus approximately twice the value of YbRh2Si2. In agreement
with this, the steep increase in ρ(T ) is shifted to even higher temperatures compared to
YbRh2Si2 and YbRh2(Si0.95Ge0.05)2 (cf. Fig. 5.2).
The CEF level scheme of I-YbIr2Si2 was determined from inelastic neutron scatter-
ing. The free-ion ground-state multiplet is split into four doublets at 0-210-290-420 K,
respectively [161]. Thus, the energetic positions of the two lower excited CEF levels are
almost unchanged compared to YbRh2Si2, while the highest level is at significantly lower
temperature.
5.2.2 Samples
The investigated single crystals of YbRh2Si2, YbRh2(Si0.95Ge0.05)2, and I-YbIr2Si2 were
grown from In flux in a closed Ta crucible at the MPI CPfS as described in Ref. [146].
Synthesis of the YbRh2Si2 and I-YbIr2Si2 samples was accomplished by C. Krellner. The
YbRh2(Si0.95Ge0.05)2 sample was grown by I. Zerec. No minor phases could be resolved
from X-ray powder diffraction.
The investigated YbRh2(Si0.95Ge0.05)2 single crystal was bar-shaped. By con-
trast, YbRh2Si2 and I-YbIr2Si2 grow as small platelets with a thickness of typically
50 to 100 μm. Only the largest crystals were of a size, which allows a measurement of
S(T ) with the PPMS. Therefore, in the selection of the investigated samples it was mainly
accounted for the crystal dimensions and the smoothness of the surface. As a consequence,
the resistivity ratios at 2 K are relatively small compared to the best available samples
with ρ300 K/ρ2K > 100 (Tab. 5.1). The measurements were performed within the ab plane
compound number Vuc [A3] Tcp
K [K] TΔCEF [K] ρ300 K/ρ2K
YbRh2Si2 #63106 158.645 17 0-200-290-500 10.9
#63109 11.7
YbRh2(Si0.95Ge0.05)2 #48002a 158.803× 17∗ 0-200-290-500∗ 8.8
YbIr2Si2 (I-type) #63001 159.742 40 0-210-290-420 23.2
Table 5.1: Characteristics of the investigated samples of YbRh2Si2, YbRh2(Si0.95Ge0.05)2,
and I-YbIr2Si2. The values given for TK are obtained from the entropy. (×) The unit-
cell volume of YbRh2(Si0.95Ge0.05)2 was estimated from a comparison to pressure ex-
periments on YbRh2Si2, as explained in the text. (*) The values for TK and TΔCEF of
YbRh2(Si0.95Ge0.05)2 are assumed to be unchanged compared to YbRh2Si2.
– 89 –

Chapter 5. Energy scales in systems with localized magnetic moments
of uncut crystals. Since both, the temperature gradient and the voltage drop used for the
determination of the thermopower, are measured on the same contacts, the irregular shape
is considered to be of no influence. The investigated samples are summarized in Tab. 5.1.
5.2.3 Special considerations on thermal transport measurements
with the PPMS on small samples
As pointed out in Chap. 3.1.3, accurate thermal transport measurements using the PPMS
require a minimum sample size and thermal conductance. Otherwise, thermal losses along
the heater and thermometer wires cannot be neglected. This results in too large values
for the measured thermal conductivity. Additionally, the measured temperatures and
voltage at the hot and cold contact of the sample represent an average over the contact
area. If these contacts are not small compared to the sample size, systematic errors in the
measurement may occur. These limitations stimulated the setup of the new apparatus for
investigations on small samples and samples with low thermal conductance described in
Chap. 3.2.
The samples of YbRh2Si2 and I-YbIr2Si2 as well as those of Lu1−xYbxRh2Si2 presented
in Sec. 5.3 typically have a size of 4× 1× 0.05 mm3. Thus, they are relatively small to be
measured using the thermal transport option of the PPMS. Nevertheless, since the new
experimental setup was finished only by the end of this work, thermopower investigations
have been carried out with the PPMS. In order to check for errors due to the non-ideal
sample and contact geometry, repeated measurements on the same specimen of YbRh2Si2,
but with new contacts, have been performed. Additionally, a second sample from a dif-
ferent batch was investigated. The obtained thermopower data are shown in Fig. 5.3. In
the main plot, the results of two measurements on the same sample (#63106) and on a
second sample (#63109) are depicted. Although the absolute values differ significantly,
the overall behavior of S(T ) is the same. In particular, the two data sets obtained on
the same sample (#63106) may be shifted on top of each other by scaling the first set
with a factor of 1.15 (inset of Fig. 5.3). As soon as the new experimental setup was work-
ing, sample #63109 was remeasured. The corresponding data set, which is also shown in
Fig. 5.3, well reproduces the PPMS data4. It is therefore assumed that the temperature
dependence S(T ) is not affected by the small sample size. Likewise, an influence of the
applied temperature gradient for ΔT/T ≤ 3 % on the measured S(T ) could be excluded
(not shown).
5.2.4 Results of the thermopower measurements
The thermopower of YbRh2Si2 was measured on two different samples (Fig. 5.3). Both
show the same S(T ) behavior. The thermopower exhibits a broad minimum at (83 ± 5) K
4Initially the available temperature range of the new setup was limited to T > 7 K.
– 90 –

5.2. Yb-based Kondo-lattice compounds: YbRh2(Si1−xGex)2 and YbIr2Si2
Figure 5.3: Thermopower of two different samples of YbRh2Si2. Sample #63109 was
investigated in the PPMS and using the new experimental setup. Sample #63106 was
measured twice with different contacts. The inset compares the corresponding data sets.
For this purpose, the thermopower data of the first measurement are scaled by a factor
of 1.15.
at large absolute values. Between 2 and 40 K the S(T ) dependence is almost linear
(see inset of Fig. 5.4). In particular, there is no peak or shoulder around the Kondo
temperature of approximately 20 K. Application of a magnetic field of 9 T does not affect
the thermopower (Fig. 5.4).
The observed temperature dependence S(T ) resembles the one typically found in Yb-
based valence-fluctuating systems, as e.g. YbCu2Si2 [49]. However, in XANES measure-
ments of the LIII absorption edge of the Yb ion in YbRh2Si2, no significant contribution
from Yb2+ could be resolved at 5 K. Taking into account the resolution of the method, the
valence v could be estimated to be 2.95 ≤ v ≤ 3.00 [162]. A strong intermediate-valent
character of the compound is therefore excluded. Instead, the large minimum around
83 K is likely caused by Kondo scattering from thermally populated CEF levels. Since the
position of a ’CEF peak’ in the thermopower lies typically at 0.3 to 0.6 TΔCEF [43, 44, 41],
the relevant CEF splitting is estimated to 150 - 290 K. This is of the order of the val-
ues for the first and second excited level in YbRh2Si2 as obtained from inelastic neutron
scattering (TΔCEF1−2 = 200 K, TΔCEF1−3 = 290 K). A separate observation of the highest
CEF level (TΔCEF1−4 = 500 K) at even higher temperatures is unlikely. Therefore, it is
supposed that the large thermopower minimum is caused by Kondo scattering on the full
J = 7/2 multiplet of the Yb3+. Considering the magnitude of the relevant energy scales
(E/kB ∼ 300 K), the negligible influence of a magnetic field of 9 T (E/kB ∼ 10 K) on
– 91 –

Chapter 5. Energy scales in systems with localized magnetic moments
Figure 5.4: Thermopower of YbRh2Si2 in zero field and in an applied magnetic field of
9 T. The inset shows the data for T < 60 K on a linear scale.
S(T ) is not surprising. The absence of a ’Kondo peak’ around 20 K has to be consid-
ered in view of the resistivity of YbRh2Si2, for which the interplay between Kondo effect
and CEF excitations does not allow a separate observation of scattering on the ground-
state doublet and thermally populated CEF levels at ambient pressure. Most probably,
the proximity of Kondo and CEF energy scales is also responsible for the appearance of
only a single minimum in the thermopower. In this case, a lowering of the Kondo energy
scale by pressure or chemical substitution is expected to induce a splitting of the large
thermopower minimum into two separate minima, similar to the behavior of ρ(T ) under
pressure. This consideration motivated thermopower investigations on Lu1−xYbxRh2Si2,
which are presented in Sec. 5.3.
Fig. 5.5 compares the thermopower of YbRh2Si2 to that of YbRh2(Si0.95Ge0.05)2 and
I-YbIr2Si2. To illustrate the uncertainty in the absolute values of S(T ), two different data
sets for YbRh2Si2 (# 63106) are shown. All three investigated compounds exhibit a very
similar temperature dependence S(T ) with large minima around 100 K. While the position
of the minimum is the same for YbRh2Si2 (Tmin = (83 ± 5) K) and YbRh2(Si0.95Ge0.05)2
(Tmin = (85 ± 4) K), it is shifted to significantly higher temperatures for I-YbIr2Si2
(Tmin = (114 ± 7) K). Furthermore, the measured absolute values of the thermopower
of I-YbIr2Si2 are enhanced.
The constant Tmin of YbRh2(Si1−xGex)2 (x = 0, 0.05) reflects the tiny change in the
Kondo and CEF energy scales upon Ge substitution: The influence of the lattice expansion
on the CEF splitting of the Yb3+ multiplet is expected to be negligible. The anticipated
small increase in TK cannot be resolved from the entropy of the system. It is only ap-
– 92 –

5.2. Yb-based Kondo-lattice compounds: YbRh2(Si1−xGex)2 and YbIr2Si2
Figure 5.5: Temperature dependence of the thermopower of YbRh2Si2 (#63106),
YbRh2(Si0.95Ge0.05)2, and I-YbIr2Si2. For YbRh2Si2 two data sets are shown to demon-
strate the limited reliability of the absolute values in S(T ).
parent from a weak shift of the steep increase in ρ(T ) observed below 100 K to higher
temperatures for the sample with x = 0.05. The slightly enhanced absolute values in
S(T ) of YbRh2(Si0.95Ge0.05)2 compared to the Ge-free compound may be interpreted as
an indication for a larger Kondo scale in this system. However, in view of the variation
observed in two measurements on the same sample of YbRh2Si2, it is not definitely cer-
tain that the observed enhancement for the Ge-doped sample is of significance. Thus, the
weak increase in TK upon Ge substitution suggested by resistivity investigations cannot
be resolved from the presented thermopower data, probably due to the limited accuracy
of the measurements and the determination of Tmin.
A comparison of the energy scales of I-YbIr2Si2 to those of YbRh2Si2 reveals a contro-
versial picture. The Kondo temperature of the Ir system determined from the entropy is
by a factor of 2.4 larger than that of the Rh system (Tab. 5.1). The positions of the two
lower excited CEF levels remain almost unchanged. By contrast, the highest CEF level
of the Ir system lies at a lower energy kBTΔCEF1−4 than in the Yb compound. At elevated
temperatures, at which higher CEF levels are populated with significant probability, the
characteristic energy of a HF system is given by the high-temperature Kondo scale T highK ,
which depends on both T lowK and the CEF splitting. An extension of Eq. 2.5 to Yb systems
with four doublets yields [157]:
T highK = 4
√T low
K · TΔCEF1−2 · TΔCEF1−3 · TΔCEF1−4 (5.2)
Using the values given in Tab. 5.1, a slightly larger T highK is obtained for the Ir com-
– 93 –

Chapter 5. Energy scales in systems with localized magnetic moments
pound (T highK (Ir) = 179 K) compared to that of the Rh system (T high
K (Rh) = 149 K).
This is in agreement with the observation of the minimum in S(T ) at higher T . The
ratio of the two values T highK (Ir)/T high
K (Rh)≈ 1.20 is comparable to that of the posi-
tions of the minima in the thermopower Tmin(Ir)/Tmin(Rh)≈ 1.35. An even better
agreement is obtained, if only the two lower excited CEF levels are taken into account
(T highK = 3
√T low
K · TΔCEF1−2 · TΔCEF1−3), namely 1.37 for the ratio of T highK compared to
1.35 for the ratio of Tmin. A similar tendency was observed in the analysis of the re-
sistivity of YbRh2Si2, which yielded a better agreement between the theoretical and the
experimental values for the position of the maximum, if only the two lower excited CEF
levels were taken into account [157].
In conclusion, a stronger influence of the enhanced Kondo scale in the Ir system
compared to that of the smaller CEF splitting is supposed. It cannot be definitely
excluded that the larger absolute thermopower values observed for I-YbIr2Si2 compared
to YbRh2Si2 result from the unfavorable sample and contact geometry. However, the
considerable shift of Tmin of the Ir compared to Rh system provides clear evidence for an
enhancement of the relevant energy scales in I-YbIr2Si2.
The three investigated Yb-based Kondo lattice compounds YbRh2Si2,
YbRh2(Si0.95Ge0.05)2, and I−YbIr2Si2 exhibit a similar temperature dependence of
the thermopower S(T ) with a single large minimum around 100 K. This minimum is
attributed to Kondo scattering on the full Yb3+ multiplet. The absence of a ’Kondo peak’
at lower temperatures is ascribed to the proximityy of the Kondo and CEF energy scales.
The observed deviations in S(T ), especially the position of the minimum, are attributed
predominantly to the different Kondo energy scales of the compounds.
5.3 Dilution of Yb moments in Lu1−xYbxRh2Si2
5.3.1 Introduction
The thermopower of YbRh2Si2 presented in Sec. 5.2.4 exhibits a single large minimum
around 80 K due to Kondo scattering on the full Yb3+ multiplet. Near the Kondo tem-
perature of 17 K no minimum or shoulder is visible in S(T ). This lack of a ’Kondo
peak’ was related to the closeness of Kondo and CEF energy scales. A lowering of TK
is therefore expected to induce a splitting of the single large minimum into two separate
minima, similar to the evolution of the electrical resistivity under hydrostatic pressure
[155]: At ambient pressure ρ(T ) exhibits a single maximum around 130 K. Above 4 GPa
this broad peak is split into three separate maxima. The two maxima at lower T were
attributed to Kondo scattering on the ground-state doublet with the onset of coherence
and to Kondo scattering on excited CEF levels, while the origin of the third maximum
remained unclear (Sec. 5.2.1).
– 94 –
5.3. Dilution of Yb moments in Lu1−xYbxRh2Si2
An alternative to lower the Kondo temperature is the use of chemical pressure or dop-
ing. Substitution on all crystallographic sites has been realized in YbRh2Si2, generally
with the aim of lowering the antiferromagnetic ordering temperature TN to 0 K to reach
the QCP. This, however, is connected with an increase in TK as observed in the com-
pounds presented in the last chapter, YbRh2(Si0.95Ge0.05)2 and I−YbIr2Si2, but also in
La1−xYbxRh2Si2 [163]. Therefore, these systems are not suited to observe the anticipated
separation of the large thermopower minimum into a ’Kondo peak’ and a ’CEF peak’. Re-
cently, S. Maquilon succeeded in growing single crystals of Lu1−xYbxRh2Si2 (0 ≤ x ≤ 1)
[164]. First investigations of the specific heat and electrical resistivity of the series indi-
cated a weak lowering of TK upon decreasing Yb concentration [164]. In a simple picture
this behavior may be understood from the decrease in the unit-cell volume due to the
slightly smaller radius of the Lu3+ ion compared to Yb3+, and the related preference of
the magnetic with respect to the nonmagnetic Yb configuration. The anticipated low-
ering of TK highly motivated thermopower investigations on the series, with the aim of
unambiguously clarifying the cause of the ’missing Kondo peak’ of YbRh2Si2. The sub-
stitution on the Yb site leaves, in a first approximation, the chemical environment of the
remaining Yb ions unchanged, thus reducing the influence of disorder on the magnetic
moments. Lu1−xYbxRh2Si2 therefore appeared a promising candidate for the observation
of separate anomalies due to Kondo interaction and CEF excitations in the thermopower
and the electrical resistivity at ambient pressure. In the following, measurements of S(T )
and ρ(T ) are presented, which have been performed with the objective to determine the
characteristic energy scales of YbRh2Si2.
5.3.2 Samples
The investigated single crystals of Lu1−xYbxRh2Si2 (0 ≤ x < 1) were grown from In
flux by S. Maquilon (University of California, Irvine, USA) [164]. The average (nomi-
nal) Yb content xnom of each batch was determined from susceptibility measurements and
confirmed by microprobe analysis on selected crystals. However, the resistivity measure-
ments presented below suggest a moderate variation of the Yb concentration throughout
a batch. The scaling analysis described in Sec. 5.3.3 indicates deviations from xnom of up
to 5 %. Specifically, the samples with xnom = 0.15 and xnom = 0.49 (#1)5, studied in S(T )
and ρ(T ), have an effective Yb concentration of x = 0.10 and x = 0.44, respectively. For
all other samples the nominal concentration has been confirmed, i.e. x = xnom. In the
following, the effective values x are used.
The lattice constants of the stoichiometric system LuRh2Si2 were determined by
N. Caroca-Canales from X-ray diffraction measurements on powered material. Due to
the extremely small change of the unit-cell volume Vuc of 0.41 ± 0.12 % with respect to
5Two samples with xnom = 0.49 have been investigated. #1 has been found to have an effective Ybconcentration x = 0.44, while for #2 x = xnom.
– 95 –

Chapter 5. Energy scales in systems with localized magnetic moments
YbRh2Si2, a linear dependence of Vuc(x) is assumed for the crystals with partial substitu-
tion. The tiny variation in the lattice constant is not expected to significantly influence
the relative position of the CEF levels.
Investigations of the thermopower S and the electrical resistivity ρ were performed
within the ab plane of the crystals with a typical size of 4 × 1 × 0.05 mm3.
5.3.3 Experimental results
The thermopower S(T ) of Lu1−xYbxRh2Si2 (0 ≤ x ≤ 1) is plotted semi-logarithmically in
Fig. 5.6a (x = 0.08 not shown for clarity). Fig. 5.6b displays the low-T behavior of the
same curves on a linear temperature scale. The thermopower of the reference compound
LuRh2Si2 is smaller than 1 μV/K in this T range and therefore omitted.
LuRh2Si2 exhibits a small positive thermopower as typical for normal metals with
hole-like charge carriers. By contrast, the thermopower of YbRh2Si2, which was already
presented in the last chapter, is negative in the whole investigated temperature range
3 K ≤ T ≤ 300 K, with large absolute values. It shows a single broad minimum around
80 K, as typically found in valence-fluctuating Yb compounds like YbCu2Si2 [49]. How-
ever, for the HF system YbRh2Si2 the observed behavior is attributed to a combination
of Kondo interaction and CEF effects (Sec. 5.2.4). Between 2 K and 40 K the ther-
mopower of YbRh2Si2 shows an almost linear S(T ) dependence with no indication of
a ’Kondo peak’. With decreasing Yb concentration the temperature dependence of the
thermopower changes qualitatively. The samples with x = 0.75 and x = 0.62 exhibit a
broad shoulder at low temperatures, which is seen on a linear scale (Fig. 5.6b). For Yb
concentrations of x ≤ 0.44 the thermopower minimum around 80 K clearly splits into 2
separate features. While the position of the high-temperature shoulder remains almost
concentration-independent, the low-temperature shoulder shifts to lower T with further
decreasing x. Simultaneously, the absolute values of the minimum structure at elevated
temperatures are significantly reduced. For samples with x ≤ 44 % a sign change in S(T )
appears below room temperature, which is shifted to lower T with decreasing Yb concen-
tration. This indicates a stronger relative influence of the diffusion contribution of light
charge carriers to the thermopower in these samples.
The electrical resistivity of Lu1−xYbxRh2Si2 was measured on the same samples as the
thermopower. In addition, two other specimens have been investigated, which were too
small to measure S(T ). The results of ρ(T ) are in agreement with Ref. [164]. The mag-
netic contribution ρmag was calculated by subtracting the data of the reference compound
LuRh2Si2 and a sample-dependent disorder term ρ0dis from the measured resistivity. The
results normalized to the Yb concentration are shown in Fig. 5.7a. For most samples scal-
ing of the data at elevated temperatures was achieved by using the value of the nominal
concentration. As already mentioned above, adjustment of the effective concentration was
necessary for xnom = 0.15 to x = 0.1 and for xnom = 0.49 to x = 0.44 to ensure scaling
– 96 –

5.3. Dilution of Yb moments in Lu1−xYbxRh2Si2
Figure 5.6: (a) Temperature dependence of the thermopower of Lu1−xYbxRh2Si2
(0 ≤ x ≤ 1). (b) Low-temperature behavior of S(T ) of the crystals with x > 0.
of the high-T data above 100 K. This scaling follows from the assumption that the CEF
level scheme is not affected by the Yb-Lu exchange.
The magnetic resistivity ρmag(T ) of the series reflects the evolution from a diluted to
a dense Kondo system, as e.g. demonstrated in CexLa1−xCu6 [144]. At high temperatures
T > 100 K, ρmag of all samples increases logarithmically with decreasing T . Subsequently,
samples with low Yb concentrations x ≤ 0.23 exhibit a plateau around 60 to 100 K,
– 97 –
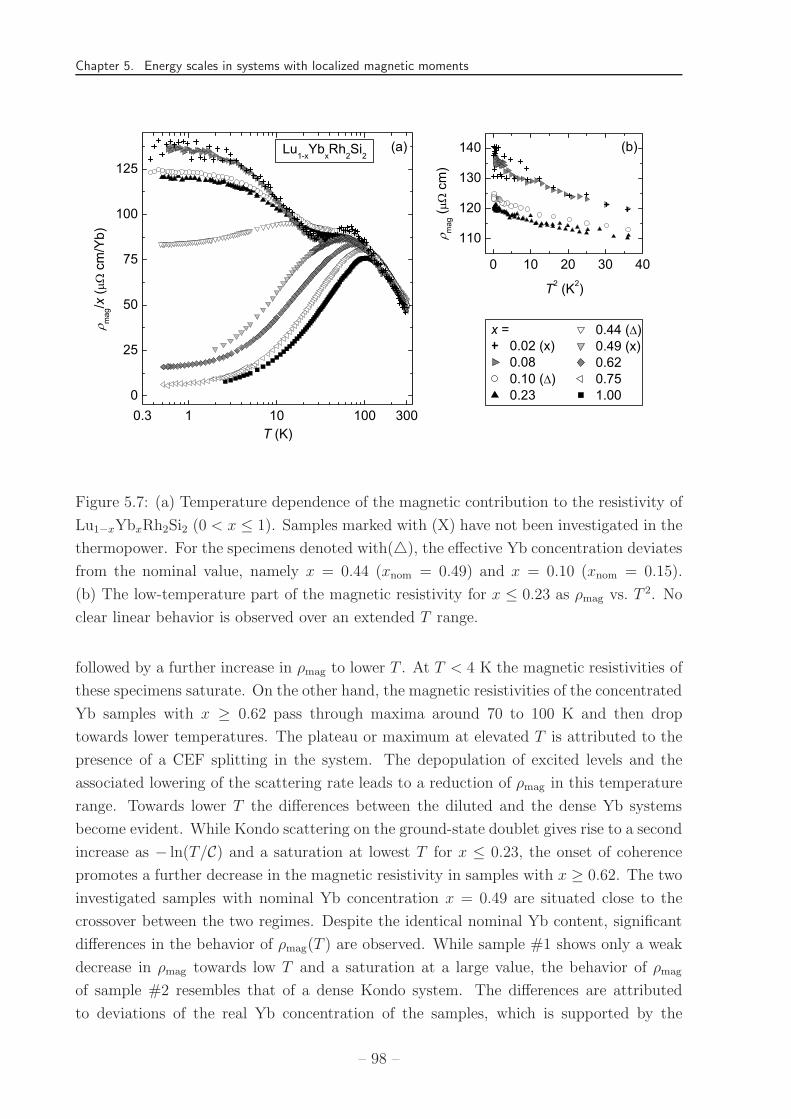
Chapter 5. Energy scales in systems with localized magnetic moments
Figure 5.7: (a) Temperature dependence of the magnetic contribution to the resistivity of
Lu1−xYbxRh2Si2 (0 < x ≤ 1). Samples marked with (X) have not been investigated in the
thermopower. For the specimens denoted with(�), the effective Yb concentration deviates
from the nominal value, namely x = 0.44 (xnom = 0.49) and x = 0.10 (xnom = 0.15).
(b) The low-temperature part of the magnetic resistivity for x ≤ 0.23 as ρmag vs. T 2. No
clear linear behavior is observed over an extended T range.
followed by a further increase in ρmag to lower T . At T < 4 K the magnetic resistivities of
these specimens saturate. On the other hand, the magnetic resistivities of the concentrated
Yb samples with x ≥ 0.62 pass through maxima around 70 to 100 K and then drop
towards lower temperatures. The plateau or maximum at elevated T is attributed to the
presence of a CEF splitting in the system. The depopulation of excited levels and the
associated lowering of the scattering rate leads to a reduction of ρmag in this temperature
range. Towards lower T the differences between the diluted and the dense Yb systems
become evident. While Kondo scattering on the ground-state doublet gives rise to a second
increase as − ln(T/C) and a saturation at lowest T for x ≤ 0.23, the onset of coherence
promotes a further decrease in the magnetic resistivity in samples with x ≥ 0.62. The two
investigated samples with nominal Yb concentration x = 0.49 are situated close to the
crossover between the two regimes. Despite the identical nominal Yb content, significant
differences in the behavior of ρmag(T ) are observed. While sample #1 shows only a weak
decrease in ρmag towards low T and a saturation at a large value, the behavior of ρmag
of sample #2 resembles that of a dense Kondo system. The differences are attributed
to deviations of the real Yb concentration of the samples, which is supported by the
– 98 –

5.3. Dilution of Yb moments in Lu1−xYbxRh2Si2
effective values xeff = 0.44 (#1) and xeff = 0.49 (#2) determined from the analysis of the
resistivity. It turns out that at intermediate Yb concentrations ρmag(T ) exhibits a sensitive
dependence on the exact stoichiometry of the specimen.
5.3.4 Energy scales
For a quantitative analysis of the thermopower the magnetic contribution, Smag, is usually
determined by use of the Gorter-Nordheim rule: Smagρmag = Sρ − Srefρref (see Eq. 2.37).
Sref and ρref are generally taken as the thermopower and (total) resistivity of the non-
magnetic reference compound. The resistivity ρref can be approximated by a sum of a
phononic contribution ρphref and a residual resistivity ρ0
ref due to impurities. It is assumed
that ρphref does not change significantly upon chemical substitution. The disorder induced
by doping, however, affects the residual resistivity, and ρ0ref has to be replaced by the
x-dependent disorder contribution ρ0dis of the alloys. Since ρ0
dis(x) cannot be determined
with high accuracy, an exact evaluation of Smag is almost impossible. For the presented
data, the overall behavior of Smag, and especially the position of the shoulders is not ex-
pected to strongly deviate from that of S. At low temperatures (T < 50 K), at which the
thermopower and the resistivity of LuRh2Si2 are small, the difference between S and Smag
is negligible. At higher temperatures, the calculation of Smag mainly implies a correction
for the diffusion thermopower of light charge carriers. Therefore, for the discussion of the
data, S ≈ Smag is analyzed.
Considering the Kondo and CEF energy scales of pure YbRh2Si2, the two shoulders
observed in the thermopower of Lu1−xYbxRh2Si2 (x < 0.5) are attributed to Kondo scat-
tering on the ground-state doublet and on thermally populated multiplet states. Thus,
the corresponding characteristic temperatures T Slow and T S
high allow an estimation of the
evolution of TK and ΔCEF upon substitution. The position of the low-T minimum in the
thermopower is usually close to the Kondo temperature of the CEF-split ground state [42],
in agreement with theoretical calculations for S = 1/2 neglecting CEF effects [39, 40]. A
recent calculation based on the single-impurity Anderson model including both, a CEF
splitting and charge fluctuations yielded a similar result [41]. It is therefore assumed that
T Slow = T S
K . The high-temperature minimum is attributed to Kondo scattering off ther-
mally populated CEF levels. Thus, it represents a characteristic temperature TCEF for the
splitting of the relevant levels6. Fig. 5.8 shows the evolution of T Slow and T S
high upon substi-
tution. They have been determined from a fit to the data between 4 and 200 K to a sum
of two negative Gaussian curves on a logarithmic temperature scale, since a determination
from the derivative dS/dT was not possible with satisfactory precision.
6 TCEF is used to denote the characteristic temperature of CEF excitations observed in a measurement,e.g. the minimum in S(T ). By contrast, TΔCEF corresponds to a splitting with energy kBTΔCEF =ΔCEF. A special energetic difference, e.g. between the ground state and second excited level is denotedas kBTΔCEF1−3 = ΔCEF1−3.
– 99 –

Chapter 5. Energy scales in systems with localized magnetic moments
Figure 5.8: Characteristic temperatures of Lu1−xYbxRh2Si2 at ambient pressure (a,b) and
of YbRh2Si2 under pressure (b). The abscissae in (b) are scaled to the same unit-cell
volume. The characteristic temperatures for S(T ) were obtained from a fit to the data as
explained in the text. The error bars represent the uncertainty of the fitting procedure.
The uncertainty in the unit-cell volume, and consequently the pressure axis in (b) is
indicated by an error bar on T ρK(p). The solid line in (b) is a linear fit to T S
low(x).
Fig. 5.8a displays T Shigh vs. effective Yb content x including the position of the single
large minimum T Smin in the thermopower of pure YbRh2Si2. In view of the substantial
uncertainty in the determination of T Shigh, the position of the high-T shoulder or minimum
in S(T ) may be regarded as temperature-independent. The mean value of 86 ± 10 K
allows an estimate of the energetic position of the relevant excited CEF levels. As in the
case of pure YbRh2Si2 (Sec. 5.2.4) the observed minimum corresponds to a splitting of
150-290 K with respect to the ground-state, in agreement with results of inelastic neutron
scattering [153]. Again, the large thermopower minimum around 80 K is attributed to
Kondo scattering on the full Yb3+ multiplet.
Fig. 5.8b shows the position of the low-T minimum T Slow = T S
K of the samples with
x < 0.5 vs. x. For higher Yb concentrations a determination of T Slow was not possible with
satisfactory precision. The data sets for low x clearly reveal an increasing T SK with rising
Yb concentration. A linear extrapolation of T Slow(x) yields a Kondo temperature of 29 K
for YbRh2Si2. The fit is shown as a solid line in Fig. 5.8b. This value is about a factor
1.5 larger than the one obtained from the entropy of the system, namely Tcp
K = 17 K
[147]. However, the model used in Ref. [147] for calculating TK based on the entropy [152]
yields a temperature dependence of cp, which deviates significantly from that of the NFL
compound YbRh2Si2. Its application to this system is therefore debateable. Furthermore,
a determination of TK from different experimental probes usually yields different values,
– 100 –

5.3. Dilution of Yb moments in Lu1−xYbxRh2Si2
however, always in the same order of magnitude. To overcome this problem, specific-heat
measurements on selected crystals with the aim of calculating TK from the entropy were
performed by S. Hartmann [165]. However, no systematic behavior of Tcp
K (x) was found.
This is most probably caused by the uncertainty in the Yb concentration. The analysis of
the data revealed a sensitive dependence of Tcp
K on the exact stoichiometry. Even a small
variation of ±1% in the Yb content gives rise to large uncertainties for Tcp
K , e.g. of ±2.4 K
for the sample with x = 0.49. Therefore, a determination of Tcp
K was not possible with the
necessary accuracy.
Another possibility to estimate the Kondo scale of a diluted Kondo system is based
on the analysis of the temperature dependence of the resistivity. At temperatures below
approximately TK the magnetic contribution is expected to behave as ρmag ∝ [1−(T/T ρK)2],
which corresponds to a linear correlation in a plot ρmag vs. T 2 Fig. 5.7b shows the low-
temperature magnetic resistivity of Lu1−xYbxRh2Si2 for Yb concentrations x ≤ 0.23 in
this type of diagram. Taking into account the considerable uncertainty in the data, no
clear linear behavior is found over an extended T range. Starting from low temperatures,
deviations from ρmag ∝ T 2 are observed for T > 4 K. Therefore it is refrained from a
determination of TK from the magnetic contribution to the resistivity of Lu1−xYbxRh2Si2.
The Lu-Yb substitution is accompanied by a change in the unit-cell volume Vuc. In
order to evaluate the relevance of this effect for the observed change in TK, a comparison
to results from experiments under pressure p is of interest. Using the bulk modulus [159]
of YbRh2Si2 of 189 GPa and assuming a linear relation of Vuc vs. x, the results from the
thermopower can be compared to investigations under pressure. The Kondo temperature
T ρK(p) of YbRh2Si2 determined from resistive pressure studies [157] is shown as a dashed
line in Fig. 5.8b, where the pressure axis is scaled to the same unit-cell volume change. It
is seen that the lowering of TK under pressure is slightly weaker than upon substitution.
This reflects the relevance of additional effects besides the variation of Vuc. Chemical
substitution induces a change in the band structure of the system, which influences the
effective coupling between the 4f and conduction electrons even at constant Vuc. However,
the relatively small difference between the evolution of TK under pressure and upon Lu
substitution underlines a dominating influence of the unit-cell volume for Lu1−xYbxRh2Si2.
This is ascribed to the unchanged chemical environment of the 4f moments as a result of
the substitution on the rare-earth ion site. Furthermore, due to the small radius of the
4f shell, Lu and Yb behave chemically very similar. The 4f electrons together with the
nucleus act as an ’effective nucleus’. Therefore, Lu-Yb substitution is expected to have a
minor influence on the band structure. Yet, the integer valence v of the Lu ions compared
to the slightly reduced value for the Yb ions (Lu3+ vs. Ybv+ with 2.95 ≤ v ≤ 3.00)[162]
might have a small effect on the charge-carrier concentration.
– 101 –

Chapter 5. Energy scales in systems with localized magnetic moments
5.3.5 Discussion
The large values usually found for the thermopower of 4f systems have been related to the
likewise enhanced electronic contributions to the specific heat. In the zero temperature
limit, the ratio S/γT of several correlated compounds takes a quasi-universal value [37].
For metals the dimensionless quantity q = NAVeS/γT with the Avogadro number NAV
and the electron charge e is close to ±1, where the sign depends on the type of charge
carriers. This relation can be derived within the Fermi-liquid theory assuming impurity
scattering as the relevant scattering process [38]. In the present system a thermopower
S ∝ T is only found for T < 5 K and x < 0.5, due to both the low Kondo temperature
of the order of 10 K and the NFL behavior of the pure system. The calculated q values
ranging from −0.63 to −0.85 are close to that expected for hole-like charge carriers of −1.
The fundamental change in the behavior of S(T ) from a single minimum at x = 1 to a
double-peak structure for small x is correlated to the lowering of TK upon decreasing Yb
concentration as confirmed by resistivity and specific heat [164] measurements. YbRh2Si2
with a Kondo temperature of approximately 20 K and a first excited CEF level around
200 K seems to be situated near the critical ratio TK/TΔCEF, at which the two minima
of Kondo scattering on ground state and thermally populated CEF levels in S(T ) merge
into a single feature. A slight reduction of TK, on the other hand, allows for a separation
of both effects.
A similar behavior is found in the magnetic contribution to the resistivity ρmag(T ) of
Lu1−xYbxRh2Si2. The similarities are best seen for the two samples with Yb concentrations
at the crossover from a single large minimum in S(T ) to two clearly separated shoulders.
Fig. 5.9 shows a comparative plot of S(T ) as well as ρmag(T ), which were determined on
the same specimens with x = 0.44 and 0.62. The curves for thermopower and magnetic
resistivity strongly resemble each other. For the sample with x = 0.44 two clearly separated
shoulders are seen in both quantities, situated at the same temperatures as indicated by
the vertical lines. By contrast, the sample with x = 0.62 exhibits a large extremum in
S(T ) and ρmag(T ) around 80 K. A weak anomaly is seen in ρmag(T ) around 20 K, which
corresponds to a very broad shoulder on a linear scale. Likewise, the thermopower exhibits
a change in slope at low T , which can be seen on a linear scale (Fig. 5.6b). However, both
features are less pronounced than in the case of the sample with x = 0.44.
It appears remarkable that the effects of Kondo scattering on the ground-state doublet
and on thermally populated CEF levels cannot be separated in S(T ) and ρ(T ) for x > 0.5,
although the corresponding energy scales differ by approximately one order of magnitude.
This observation can be understood in view of the relatively large temperature range,
which is affected by the thermal population of an excited CEF level as apparent e.g. from
the large width of a Schottky contribution to the specific heat. A significant population
of an excited CEF level and, consequently, an enhanced scattering from CEF excitations
sets in at temperatures well below the splitting of ΔCEF/kB. Thus, in Lu1−xYbxRh2Si2 for
– 102 –

5.3. Dilution of Yb moments in Lu1−xYbxRh2Si2
Figure 5.9: Comparison between thermopower and magnetic contribution to the resistivity
of Lu1−xYbxRh2Si2 for two Yb concentrations x = 0.44 and x = 0.62. The dotted lines
indicating the positions of extrema in S(T ) and ρmag(T ) are meant to be a guide to the
eye.
x > 0.5 the crossover from scattering solely on the ground-state doublet to that on the all
CEF level may not be resolved. Instead, the observed single large extremum in S(T ) and
ρ(T ) is caused by scattering on the full Yb3+ multiplet. On the other hand, in samples
with x < 0.5 the reduced Kondo scale allows a separate observation of scattering on the
ground-state doublet at low T , while thermal population of the the three excited levels
give rise to a second broad extremum at elevated temperatures.
A similar evolution of the thermopower (S)T from a single large minimum to two
separate minima has been detected e.g. for Yb(NixCu1−x)2Si2 upon substitution (chemical
pressure) [49]. The valence-fluctuating system YbCu2Si2 exhibits a single minimum in
S(T ). As the Kondo temperature is reduced by Ni substitution on the Cu site, a shoulder
appears at low T already for the lowest Ni content studied (x = 0.125). Thus, the
– 103 –

Chapter 5. Energy scales in systems with localized magnetic moments
disappearance of the low-T minimum in the thermopower of Yb(NixCu1−x)2Si2 for x = 0
is connected with a crossover to the valence-fluctuating regime [49]. A qualitatively similar
behavior has been frequently observed in Ce systems under pressure and upon substitution,
e.g. in CeRu2Ge2 [47] or Ce(NixPd1−x)2Si2 [45]. In contrast to Yb compounds, Ce based
HF systems generally exhibit maxima in S(T ) due to the preponderance of electron-like
charge carriers. Likewise, the crossover from two maxima to a single maximum is usually
taken as an indication [47, 45] that TK lies in the order of the CEF splitting and the
system enters the valence-fluctuating regime. However, in XANES measurements of the
LIII absorption edge of the Yb ion in Lu1−xYbxRh2Si2 no significant contribution from
Yb2+ could be resolved at 5 K. The valence v has been estimated to be 2.95 ≤ v ≤ 3.00
[162]. A strong intermediate-valent character is therefore excluded for the series. Thus,
Lu1−xYbxRh2Si2 appears to be a rare example, for which the two extrema in S(T ) merge,
while the system is still in the HF regime. The coalescence of both features corresponding
to TK and ΔCEF can be observed in detail in this series, since the Lu substitution induces
an extremely small change of the unit-cell volume connected with a weak lowering of TK.
5.3.6 Conclusions
The temperature dependence of the thermopower of Lu1−xYbxRh2Si2 changes qualitatively
upon substitution from a single large minimum in S(T ) for the pure Yb compound to two
well separated minima for x < 0.5. A similar evolution is found in the magnetic contri-
bution to the resistivity. This drastic change in the overall behavior of S(T ) and ρmag(T )
is ascribed to a lowering of TK upon decreasing Yb content. For high Yb concentrations
x > 0.5 the extrema of Kondo scattering on the ground state and thermally populated
CEF levels merge into one single feature. A slight reduction of TK due to the substitution
of Yb by Lu on the other hand allows for a separation of both effects in the transport
properties of the series for x < 0.5.
The evolution of the Kondo temperature upon substitution can be understood mainly
from the change in the unit-cell volume. In addition, modifications in the band structure
may be relevant. Due to the extremely small overall change in TK, Lu1−xYbxRh2Si2
displays the crossover from two minima in S(T ) to one minimum upon increasing x without
entering the valence-fluctuating regime. The Kondo temperature of YbRh2Si2 has been
estimated to TK ≈ 29 K.
5.4 A Ce-based system: CexLa1−xNi2Ge2
5.4.1 Introduction
CeNi2Ge2 is a HF compound, which exhibits NFL behavior at low temperatures [166].
Two different CEF level schemes have been suggested for the Ce3+ ion, which may not
– 104 –

5.4. A Ce-based system: CexLa1−xNi2Ge2
be distinguished from thermopower measurements. However, upon partial substitution of
Ce by La the unit-cell volume increases up to approximately 2.3 % for LaNi2Ge2. This
is accompanied by a lowering of the Kondo temperature, whereas the CEF level scheme
remains roughly unchanged. A different evolution of S(T ) upon substitution is expected
for the two proposed CEF level schemes. Thermopower investigations on CexLa1−xNi2Ge2
therefore appeared useful to verify one of the two suggestions.
Investigations of the specific heat of samples with reduced Ce content (0.1 ≤ x ≤ 0.4)
revealed a logarithmic divergence of the electronic contribution divided by temperature
as cel/T ∝ − ln(TC) [167] down to the lowest investigated temperature T = 70 mK. This
type of NFL behavior is predicted for Ce compounds with a two-channel Kondo effect, but
also for disordered systems (Chap. 2.1.5). Theoretical calculations for the multichannel
Kondo effect in Ce systems state that the sign of the thermopower depends on the number
of channels [50]: While large positive values of S are predicted for the one-channel Kondo
effect, a negative thermopower is expected in the case of two or three channels. These
predictions further stimulated thermopower investigations on CexLa1−xNi2Ge2 to decide
on the possibility of a multichannel Kondo effect at low and intermediate Ce concentration.
5.4.2 Physical properties
CeNi2Ge2 and LaNi2Ge2
The ground state of CeA2B2 compounds with ThCr2Si2 structure depends on the distance
dCe−A between the Ce and the A atoms. Systems with dCe−A > 3.25 A order magnetically,
while systems with dCe−A � 3.25 A are valence-fluctuating. CeNi2Ge2 with dCe−A ≈ 3.2 A
is situated at the border to magnetic ordering. The exact position of the system – at an an-
tiferromagnetic QCP or on the paramagnetic side – remained controversial for a long time.
No magnetic ordering has been observed down to lowest temperatures (T ≥ 30 mK) [168].
Indications for superconductivity at low T have been reported [169, 170], however, no
bulk method has been able to confirm intrinsic superconductivity [171]. Different groups
reported the onset of Fermi-liquid behavior below 0.2-0.3 K in the resistivity [172] and
specific heat [173]. A suppression of the FL phase was observed from partial substitution
of Ni by Pd [174] or Cu [175]. At large Pd/Cu concentrations antiferromagnetic ordering
was found. Altogether, these observations suggest that CeNi2Ge2 is situated in the param-
agnetic phase. By contrast, Steglich et al. reported a NFL-type magnetic contribution to
the resistivity ρmag ∝ T32 in small fields B ≤ 2 T down to 0.02 K. Likewise, investigations
on a high-quality single crystal of CeNi2Ge2 revealed NFL behavior in the electronic con-
tribution to the specific heat cel/T ∝ γ0−c ·√T and thermal volume expansion β ∝ 1/√
T
down to 0.05 K [176]. The divergence of the Gruneisen ratio Γ = Vm/κT · β/cel, where Vm
and κT are the molar volume and the isothermal compressibility, was cited as evidence
that the system is situated extremely close to an 3D itinerant antiferromagnetic QCP
[176]. It appears that the physical properties of CeNi2Ge2 at lowest temperatures exhibit
– 105 –

Chapter 5. Energy scales in systems with localized magnetic moments
a sensitive sample dependence [177]. An overview on the low-temperature properties of
CeNi2Ge2 may be found e.g. in [177, 168].
At elevated temperatures CeNi2Ge2 behaves as a dense Kondo system with CEF split-
ting. The magnetic contribution to the resistivity exhibits a broad maximum around
100 K, which was attributed to a combination of Kondo effect and CEF excitations [178].
Towards lower temperatures ρmag strongly decreases, which is an indication for the on-
set of coherence. The Kondo temperature of CeNi2Ge2 was determined from the entropy
of the system to 29 K [179]. This value was confirmed from inelastic neutron-scattering
experiments, reported in the same publication.
LaNi2Ge2 was frequently investigated as a reference compound to CeNi2Ge2. It be-
haves as a normal paramagnetic metal [179, 178]. A moderate anisotropy is observed in
the transport properties of both, CeNi2Ge2 and LaNi2Ge2 [178, 180]. The ratio of the
resistivity of CeNi2Ge2 measured along c to that perpendicular to c ranges from approxi-
mately 0.5 to 1.5 for 2 K ≤ T ≤ 300 K. Likewise, the thermopower of CeNi2Ge2 is weakly
anisotropic. However, the temperature dependence for different directions of a single crys-
tal and of polycrystals is very similar. Up to 300 K, S(T ) is positive with a shoulder around
20 K and a broad maximum at approximately 100 K [181, 182]. These two features were
interpreted as a ’Kondo peak’ from Kondo scattering on the ground-state doublet and a
’CEF peak’ from combined scattering on the ground state and thermally populated CEF
levels. The position of the shoulder is consistent with TK ≈ 30 K, while the occurrence
of a maximum around 100 K points to a CEF splitting of approximately 200 - 300 K.
The anisotropy of the material shows up in the absolute values of S(T ). The largest ther-
mopower is observed for the heat flow along the c direction, where the maximum reaches a
value of 40 μV/K. For a measurement along a the thermopower amounts to approximately
30 μV/K, while the value of the maximum obtained on a polycrystal is around 25 μV/K
[181, 182].
The published results on the CEF level scheme of CeNi2Ge2 display a controversial
picture. An analysis of high-T specific-heat data with respect to the entropy was used
for a rough estimation of the CEF level scheme [183]. The free-ion ground-state mul-
tiplet is split into three doublets with excited levels at TΔCEF1−2 = (200 − 280) K and
TΔCEF1−3 = (300 − 380) K. A different level scheme was predicted from the magnetic sus-
ceptibility χ(T ). A fit yielded an almost pure |mJ = ±12〉 ground state and excited states
|mJ = ±52〉 at 4 meV and |mJ = ±3
2〉 at 30 meV [184]. Inelastic neutron-scattering exper-
iments revealed CEF excitations at 27 meV with a full width at half maximum (FWHM)
of 24 meV [185]. The authors discuss their results in view of the susceptibility data. While
the excitation at 27 meV was attributed to the second excited level at ΔCEF1−3 ≈ 30 meV,
the level at 4 meV was claimed unobservable, since it corresponds to a forbidden transi-
tion. However, in view of the limited resolution and the broadness of the line published in
[185], the results are not contradictory to the CEF scheme proposed from the analysis of
the specific heat [186]. On the other hand, the reported specific-heat data almost exclude
– 106 –

5.4. A Ce-based system: CexLa1−xNi2Ge2
a low lying CEF level at 50 K. It should give rise to a Schottky anomaly in cp with a
maximum around 20 K and a contribution to the entropy at relatively low T . Both these
phenomena are clearly not observed. Therefore it seems more likely that the CEF level
scheme with doublets at roughly 0-250-350 K, respectively, is the correct one.
Influence of Ce-La exchange
Upon substitution of Ce by La in CexLa1−xNi2Ge2 the unit-cell volume increases from
170 A for the pure Ce system (x = 1) to 174 A for the La compound (x = 0). This lattice
expansion is expected to induce a lowering of the exchange interaction J and thus of TK
upon decreasing x. Therefore, the La substitution initially favors magnetic ordering of the
samples at low T . However, the dilution of the magnetic moments is expected to prevent
the development of long-range order for smaller Ce concentrations. In agreement with
this, no magnetic ordering was observed for the whole series down to 60 mK [168].
In contrast to TK, the CEF level scheme is supposed to be minorly affected by the
Ce-La exchange. Likewise, the lattice expansion of 2.3 % over the whole series is not
expected to affect the splitting significantly. The difference in the anticipated behavior
for TK and the CEF splitting upon substitution will be reflected in the thermopower. In
particular, for the two proposed CEF level schemes for CeNi2Ge2 a different evolution of
S(T ) upon substitution is expected: (1) Three doublets at 0-250-350 K in combination
with TK = 30 K will give rise to a ’Kondo peak’ around 30 K and a broad ’CEF peak’
around 100 K for the pure Ce system. The anticipated lowering of TK upon substitution is
expected to induce a shift of the Kondo peak to lower T , whereas the CEF peak stays at a
constant position. (2) For a CEF scheme with doublets at 0-50-350 K a similar behavior of
S(T ) is supposed for the pure Ce system. However, in this case the low-T maximum will
be caused by combined scattering on the two lower CEF levels. While a weak lowering of
TK is expected to leave the position of this peak unchanged, a strong decrease should give
rise to the formation of another maximum or shoulder in S(T ) around TK � TΔCEF1−2.
Thermopower measurements on CexLa1−xNi2Ge2 therefore appeared a promising tool to
verify one of the two proposed CEF level schemes for CeNi2Ge2.
First investigations of the specific heat of polycrystalline CexLa1−xNi2Ge2 [168] were
interpreted within the Moriya-model of spin fluctuations close to an itinerant QCP [187].
It was claimed that the series reaches a QCP for x = 0.5 [168]. On both sides of this
QCP a low-T Fermi-liquid region is situated. At higher temperatures NFL behavior was
observed for all compositions. Low-temperature cp measurements by A. Pikul performed
at the MPI CPfS on polycrystalline material suggest a slightly different picture. For large
Ce concentrations x > 0.6 the electronic contribution displays FL behavior at low tem-
peratures, indicated by a constant cel/T and in agreement with the previous experiments.
However, at small and intermediate Ce content (0.1 ≤ x ≤ 0.4) a logarithmic divergence
as cel/T ∝ − ln(T/C) is found down to the lowest investigated temperatures T ≥ 70 mK,
with C a constant. For diluted systems with x < 0.1 a tendency to saturation at low T
– 107 –

Chapter 5. Energy scales in systems with localized magnetic moments
is recovered. Thus far, no conclusive explanation for the differing cp(T ) behavior may be
given. However, in view of the sensitive sample dependence of the low-T properties of the
stoichiometric system CeNi2Ge2 it seems likely that they can be attributed to variations
in the sample quality.
Different models have been proposed, which predict NFL behavior at low T
(Chap. 2.1.5). In particular, disorder, as probably induced by the Ce-La substitution, may
give rise to a distribution of Kondo temperatures, characterized by cel/T ∝ − ln(T/C). An
alternative is the appearance of a multi-channel Kondo effect. In the case of 2 channels
and spin S = 1/2, likewise the observed low-T specific heat cel/T ∝ − ln(T/TK) is pre-
dicted [29]. Theoretical calculations of the thermopower of Ce systems with multichannel
Kondo effect revealed a sensitive dependence of the sign of S on the number of chan-
nels [50]: While large positive values of S are predicted for the one-channel Kondo effect,
a negative thermopower is expected in the case of two or three channels. These predictions
stimulated thermopower investigations on CexLa1−xNi2Ge2 to scrutinize the possibility of
a multichannel Kondo effect at low Ce concentrations.
Thermopower investigations on the series CexLa1−xNi2Ge2 were performed in connection
with low-T specific-heat measurements by A. Pikul. Simultaneously the electrical resis-
tivity was determined for all compositions to gain additional information on the transport
properties of the series. The focus of the discussion in this chapter lies on the special in-
formation obtained from the thermopower, i.e. (1) the exclusion of a multi-channel Kondo
effect for low Ce concentrations, and (2) a determination of the evolution of the Kondo
and CEF energy scales upon La substitution to verify one of the two CEF level schemes
proposed for the pure Ce system.
5.4.3 Samples
The investigated polycrystals of CexLa1−xNi2Ge2 with 0 ≤ x ≤ 0.8 were prepared and char-
acterized at the MPI CPfS by N. Caroca-Canales. Stoichiometric amounts of the elements
were melted in an arc furnace and annealed for 5 days. X-ray diffraction measurements
did not reveal foreign phases. The lattice parameters and unit-cell volume exhibit an
approximately linear dependence on the Ce concentration in accordance with [168]. This
observation confirms the presence of the nominal composition.
The polycrystalline material was cut to bar-shaped samples with an approximate size
of 1×1×6 mm3. Thermopower and resistivity were measured simultaneously in the PPMS
using the same contacts.
– 108 –

5.4. A Ce-based system: CexLa1−xNi2Ge2
Figure 5.10: Temperature dependence of the magnetic contribution to the resistivity of
CexLa1−xNi2Ge2 (0 ≤ x ≤ 0.8) normalized to the Ce content x.
5.4.4 Experimental results: Resistivity and thermopower
The magnetic contribution to the resistivity normalized to the Ce content is shown in
Fig. 5.10. It was calculated by subtraction of the data of the pure La compound7. Around
100 K all samples exhibit a broad maximum in ρmag(T ), which can be attributed to
combined scattering on the ground state and excited CEF levels. At low temperatures
ρmag displays the typical behavior of a Kondo system upon dilution of magnetic moments:
The samples with large Ce concentration exhibit a decreasing ρmag, while for low Ce
concentrations ρmag increases down to the lowest investigated temperatures. A saturation
may be seen for none of the samples, except the one with x = 0.6. This composition is at
the crossover from a diluted to a dense Kondo system.
The temperature dependence of the thermopower of CexLa1−xNi2Ge2 (0 ≤ x ≤ 0.8) is
shown in Fig. 5.11a. The pure LaNi2Ge2 has a small negative thermopower as expected for
metallic samples with electron-like charge carriers and in agreement with previous results
[181]. By contrast, all Ce-containing samples exhibit a positive thermopower at lowest
temperatures, whereas at higher T a change to negative values is observed. Generally,
the thermopower is larger for the samples with higher Ce content. This tendency is most
pronounced at elevated temperatures, where the diffusion contribution of light charge car-
riers is gaining influence. For all Ce-containing samples two well separated maxima in
7Contrary to Lu1−xYbxRh2Si2, no sample-dependent disorder term ρ0dis was subtracted. For
CexLa1−xNi2Ge2 ρ0dis is supposed to be predominantly due to scattering on grain boundaries in the
polycrystalline samples and thus independent of the Ce content. This assumption is confirmed by thesimilar behavior of ρmag(T ) for differing x at elevated temperatures, cf. Fig. 5.10.
– 109 –

Chapter 5. Energy scales in systems with localized magnetic moments
Figure 5.11: Temperature dependence of the thermopower of CexLa1−xNi2Ge2 (x ≤ 0.8).
(a) The upper graph shows the measured data S(T ). (b) In the lower diagram, the
magnetic contribution Smag(T ) calculated from the Gorter-Nordheim relation is plotted.
S(T ) are found. While the low-T maximum shifts to significantly lower temperatures
with decreasing Ce concentration, the position of the high-T maximum is much less ef-
fected by the Ce-La exchange. The separating minimum is more pronounced for lower Ce
concentrations. In particular, no indication for the appearance of an additional shoulder
or maximum at intermediate T is found. As is discussed below, this observation in connec-
tion with the shift of the low-T maximum towards relatively low temperatures excludes
the presence of an excited CEF level around 50 K in CeNi2Ge2.
– 110 –

5.4. A Ce-based system: CexLa1−xNi2Ge2
The magnetic contribution to the thermopower Smag, calculated from the Gorter-
Nordheim relation (Eq. 2.37), is plotted in Fig. 5.11b. Compared to the total thermopower
shown in Fig. 5.11a, the major deviations are found at elevated temperatures, where the
diffusion contribution becomes relevant. The thermopower curves of Smag are shifted up-
wards to positive values. At high temperatures, the magnetic contributions to S(T ) of
all samples almost fall on top of each other. In particular, the position of the high-T
maximum is roughly concentration-independent. The large absolute values found in all
samples indicate that the dilution of magnetic moments is not accompanied by a lowering
of the DOS at the Fermi level. Due to the very low thermopower of the LaNi2Ge2 below
30 K the low-temperature region of Smag is only weakly altered with respect to S(T ). The
positions of the maxima in S(T ) are used for an estimation of the Kondo and CEF energy
scales of the series (see below).
5.4.5 Discussion
In view of the large positive thermopower values observed for all Ce concentrations at low
T a two-channel Kondo effect can be excluded for CexLa1−xNi2Ge2. The NFL behavior
observed in the specific heat is more likely caused by disorder on the Ce/La site.
The moderate anisotropy found in the thermopower of single crystalline CeNi2Ge2
only shows up in the absolute values of S(T ). It is not reflected in the overall tempera-
ture dependence or position of the maxima [181, 182]. The presented data obtained on
polycrystalline CexLa1−xNi2Ge2 may therefore be used to determine the energy scales of
the series. Fig. 5.12 shows the evolution of the position of the maxima in Smag(T ), Tlow
and Thigh, vs. unit-cell volume. The Ce concentration is indicated for selected data points.
With decreasing Ce concentration the low-T minimum is smoothly shifted to significantly
lower temperatures (Fig. 5.12a). No indication for the appearance of an additional shoul-
der or maximum is found (Fig. 5.11). This observation is in strong contradiction to a CEF
level scheme for the pure Ce system with doublets at approximately 0-50-350 K. In this
case the shoulder around 20 K in the thermopower of CeNi2Ge2 would be caused by com-
bined scattering on the two lowest CEF levels. The observed shift of the low-T maximum
to Tlow ≈ 2 K for x = 0.04 without appearance of a shoulder or maximum at intermediate
T would then denote a lowering of the first excited level to approximately 10 K. Such a
strong change in the CEF level scheme upon Ce-La substitution is extremely unlikely. A
doublet around 10 K for x = 0.04 is definitely excluded from the entropy of the sample,
which was calculated from the specific-heat data measured by A. Pikul. Thus, the first
excited CEF level of CeNi2Ge2 is separated by approximately 250 K from the ground-state
doublet. The low-T maximum in the thermopower of CexLa1−xNi2Ge2 is then attributed
to Kondo scattering on the ground-state doublet, whereas the position of Tlow corresponds
approximately to TK.
The Kondo temperature of CexLa1−xNi2Ge2 determined from the thermopower of the
– 111 –

Chapter 5. Energy scales in systems with localized magnetic moments
Figure 5.12: Evolution of the position of the characteristic temperatures of
CexLa1−xNi2Ge2 with unit-cell volume. For selected data points the Ce concentration
is given in the diagrams. (a) In the left graph the evolution of the low-T maximum in
Smag(T ) is shown. For a comparison, the Kondo temperature calculated from the entropy
is plotted. Two different approaches mentioned in the text lead to different results labeled
as T 1K and T 2
K. The line is a fit to Tlow(Vuc) as described in the text. (b) The right graph
displays the position of the high-T maximum in Smag(T ) indicating TCEF.
series is strongly reduced with decreasing Ce concentration from 8 K for the sample with
x = 0.8 to approximately 2 K for x → 0 (Fig. 5.12a). Simultaneously, the lattice volume
increases by 1.9 %. A comparably strong lowering of TK upon Ce-La exchange has been
observed for CexLa1−xPd2Si2 [188]. In this series TK determined from specific heat data
decreases from 9 K (x = 1) to 2.8 K (x = 0.2) concomitant with a similar lattice expansion
of 1.9 %. By contrast, (La1−xCex)3Al [189] and CexLa1−xCu6 [144] exhibit only a weak
variation in TK over the whole concentration range. The volume dependence of TK of
CexLa1−xNi2Ge2 may be described within the compressible Kondo-lattice model for Ce
systems [190]. This model derives the volume dependence of the Kondo temperature
from the volume dependence of the antiferromagnetic exchange interaction J for a given
half-width of the conduction band D:
|J |D
=
( |J |D
)0
· exp
(−q
(V − V0)
V0
)(5.3)
The subscript 0 denotes the values for the uncompressed lattice, i.e the largest unit-cell
volume. The unit-less coefficient q may be approximated from the Slater rules and is
usually between 6 and 8 [190]. Using Eq. 2.1, the volume dependence of the Kondo
– 112 –

5.4. A Ce-based system: CexLa1−xNi2Ge2
temperature can be written as:
TK = TK0 · exp
⎛⎝1 − exp
(q (V −V0)
V0
)|N(EF)J |0
⎞⎠ (5.4)
This formula allows to describe the volume dependence of the Kondo temperature of
CexLa1−xNi2Ge2 determined from the thermopower, whereas the pure Ce system is used
as the reference. A least-squares fit to the data with a constant q = 7 yields a Kondo
temperature of TK0 = 11.4 K and a |N(EF)J |0 = 0.113 for CeNi2Ge2. The fit is shown as
a line in Fig. 5.12a.
The Kondo temperature TK = 11.4 K obtained for CeNi2Ge2 is significantly smaller
than the one reported in literature, which was calculated from the entropy (29 K [179]).
In order to clarify the cause of this difference, the Kondo temperature of CexLa1−xNi2Ge2
was also determined from the entropy. Two different criteria based on the model by
Desgranges and Schotte [152] have been applied: (1) Generally the Kondo temperature
is determined as twice the value, where the entropy reaches 0.5 R ln 2. (2) Alternatively
TK is directly obtained as the temperature, at which the entropy amounts to 0.65 R ln 2.
Both criteria yield the same value of TK(cp) for a Fermi-liquid. However, CexLa1−xNi2Ge2
exhibits NFL behavior over a large temperature range with a temperature dependence
cp(T ) that deviates significantly from the one predicted in [152]. Therefore, the described
methods allow only a rough estimation of TK(cp), and different values are obtained from
both criteria. A comparison of the results allows an estimation of the reliability of TK(cp).
The results of the entropy analysis are shown in Fig. 5.12a. Values obtained from the first
and second criteria are labeled as T 1K and T 2
K, respectively. T 2K could not be calculated for
x > 0.8 due to the limited temperature range of the available cp data.
The Kondo temperature calculated from the entropy using method (2) is close to the
one determined from the thermopower, while criteria (1) yields significantly larger values.
However, even for the pure CeNi2Ge2 a smaller T 1K(cp) compared to the one reported in
literature is obtained (19 vs. 29 K). It is not stated in Ref. [179], how TK was determined.
Nevertheless it can be concluded that the NFL behavior of the series complicates a unique
determination of TK from the specific heat of the system. Yet, the overall behavior of TK
upon substitution suggested by thermopower and specific heat is similar, with a stronger-
than-linear dependence on the unit-cell volume.
Fig. 5.12b displays the position of the high-T maximum in Smag(T ). For the sample
with x = 0.1 the value of T Shigh could not be determined from the magnetic thermopower,
due to the limited resolution of the data. Fig. 5.12b confirms that the position of the high-
T maximum is almost concentration-independent for intermediate and large Ce content
(x ≥ 0.3). However, at low Ce concentration (x < 0.3) the maximum occurs at slightly
higher T . The calculation of Smag(T ) from the Gorter-Nordheim relation corrects for the
negative diffusion contribution to the thermopower and therefore shifts the S(T ) curves at
high temperatures to more positive values. This effect is most pronounced for the samples
– 113 –

Chapter 5. Energy scales in systems with localized magnetic moments
with low Ce concentration. Thus, the increase in Thigh(Smag) towards lower x is probably
an indication for an overcompensation of the diffusion contribution due to small errors in
either the geometrical form factor or the exact stoichiometry of the samples. However, it
cannot be excluded that the CEF level scheme is weakly altered by the Ce-La exchange.
Nevertheless, taking into account the resolution of the data, Thigh(Smag) = 135± 5 K may
be regarded as almost concentration-independent. Thus, the splitting of the associated
CEF levels can be estimated to ΔCEF/kB = (270 . . . 420) K with respect to the ground-state
doublet. The high-T maximum in S(T ) is therefore attributed to combined scattering on
the full Ce3+ multiplet in agreement with the suggested CEF level scheme of 0-250-300 K.
5.4.6 Conclusions
The presented thermopower data on CexLa1−xNi2Ge2 exclude the possibility of a multi-
channel Kondo effect in the series. Instead, disorder due to Ce-La exchange appears more
likely as the origin of the NFL behavior observed in the specific heat.
Due to the NFL behavior of the series at low T , a unique calculation of TK from the
entropy is difficult. The thermopower represents an alternative probe for the determination
of TK. The evolution of both the Kondo and CEF energy scales of CexLa1−xNi2Ge2 upon
substitution has been determined from S(T ). Whereas the CEF splitting is only weakly
altered, the change in TK may be understood in the frame of the compressible Kondo
model. From these results, the presence of a CEF level around 50 K in the pure Ce
system can excluded. The CEF splitting is estimated to ΔCEF/kB = (270 . . . 420) K.
These results are in agreement with a CEF level scheme of 0-250-350 K for CeNi2Ge2.
The low and high-T maxima in S(T ) are therefore attributed to Kondo scattering on the
ground-state doublet and to combined scattering on the full Ce3+ multiplet, respectively.
5.5 Summary
In this chapter thermopower investigations have been employed to determine the Kondo
and CEF energy scales of various Ce- and Yb-based HF systems, which exhibit NFL
behavior at low T . Additionally, the possibility of a multichannel Kondo effect in
CexLa1−xNi2Ge2 has been addressed.
For the Yb Kondo-lattice compounds YbRh2(Si1−xGex)2 and YbIr2Si2 the Kondo and
CEF contributions to the thermopower could not be separated. This is attributed to the
relative proximity of the corresponding energy scales and the large temperature range,
which is affected by the population of an excited CEF level. Therefore, a direct determi-
nation of TK and TΔCEF was not possible for these systems.
The substitution of Yb by Lu in Lu1−xYbxRh2Si2 gives rise to a weak lowering of TK.
Consequently, a separation of the effects of Kondo scattering from the ground state and
thermally populated CEF levels is possible for Yb concentrations x ≤ 0.44 in both the
– 114 –

5.5. Summary
thermopower and the electrical resistivity. This allows a determination of the evolution of
TK and TΔCEF upon substitution. Whereas TK increases with increasing unit-cell volume
and Yb concentration, the CEF splitting is independent of x. The Kondo temperature of
YbRh2Si2 of TK = 29 K has been estimated from an extrapolation of the results to x = 1.
Thermopower measurements on CexLa1−xNi2Ge2 (x ≤ 0.8) exclude the presence of
a multichannel Kondo effect in the series as a cause for the observed NFL behavior.
S(T ) shows well separated contributions due to Kondo scattering on the ground state
and thermally populated CEF levels. The series exhibits a reverse dependence of TK
on the unit-cell volume compared to that of Lu1−xYbxRh2Si2. This observation is in
accordance with the electron-hole analogy between Ce3+ and Yb3+. The CEF splitting
of CexLa1−xNi2Ge2 is not affected significantly by the substitution, similar to that of
Lu1−xYbxRh2Si2. The evolution of S(T ) verifies one of the two CEF level schemes proposed
for CeNi2Ge2 in literature, namely doublets at 0-250-350 K, respectively.
In summary, thermopower investigations have proven to be a powerful tool to approach
diverse problems. They have been applied successfully to determine the Kondo and CEF
energy scales of Ce- and Yb-based HF systems. Additionally, so far unsettled questions
as the correct CEF level scheme of CeNi2Ge2 and the possibility of a multichannel Kondo
effect in CexLa1−xNi2Ge2 have been resolved.
– 115 –

Chapter 5. Energy scales in systems with localized magnetic moments
– 116 –

Chapter 6
Towards Ettingshausen cooling: The
Nernst effect in CeNiSn
6.1 Introduction
The Nernst effect is the appearance of an electric field perpendicular to a temperature gra-
dient in the presence of a magnetic field orthogonal to both of them. It was first observed
in the semimetal bismuth [58], in which the Nernst coefficient ν reaches values of 7 mV/KT
at 3.8 K [4]1. Large Nernst coefficients of the order of 350 μV/KT have also been observed
in semimetallic graphite [191]. Intrinsic semiconductors were claimed to be most suitable
for the observation of large Nernst signals and the application in thermomagnetic cooling
devices [192]. Materials such as Ge [56], GaSb [57], and Cd3P2 [193] exhibit relatively
large Nernst coefficients of ∼ 10 to 100 μV/KT. By contrast, it was generally believed
that metals have small values of ν due to the ’Sondheimer cancelation’ (Chap. 2.2.6).
The renewed interest in the Nernst effect in the past few years was initiated by the
discovery of an anomalous Nernst signal in the normal state of the high-Tc supercon-
ductors [194]. Subsequently, a ”giant Nernst signal” has also been found in other exotic
systems, generally concomitant with non-Fermi-liquid (NFL) behavior. In the Bechtgard
salts it is observed, when the field is oriented close to the magic Lebed angles [195].
PrFe4P12 exhibits a large Nernst signal in combination with semimetallic behavior in the
ordered state of possibly antiferroquadrupolar nature [196]. Likewise, in URu2Si2 the ob-
servation of an enhanced Nernst signal in the hidden-order state is connected with an
exotic, and so far unsettled type of ordering [62]. The discovery of a giant Nernst effect in
the heavy-fermion (HF) superconductor CeCoIn5 raised the question, whether large values
of ν are generic to HF systems [3]. Recently, an ambipolar Nernst effect due to electron-
like and hole-like charge carriers has been suggested to be the reason for the enhanced
signal observed in NbSb2 [64].
CeNiSn has been classified as a Kondo semiconductor or semimetal with a pseudogap
1On the notation for ν0, ν, and N see footnote 7 on page 17.
– 117 –

Chapter 6. Towards Ettingshausen cooling: The Nernst effect in CeNiSn
opening below ∼ 10 K. The specific properties of this system such as the low charge
carrier density, the presence of electron-like and hole-like quasiparticles, and their heavy
character have been claimed favorable for the development of a large Nernst coefficient.
They stimulated investigations of the transverse thermoelectric response of this compound
in magnetic fields. Since several criteria, which have been suggested a prerequisite for a
large ν, are met in CeNiSn, these investigations also appeared suitable to shed light on
the fundamental mechanisms that lead to enhanced Nernst coefficients.
Although CeNiSn has been discussed in terms of a Kondo insulator, a residual density
of states (DOS) has been found inside the pseudogap. It gives rise to a relatively low
electrical resistivity ρ compared to other correlated semiconductors such as YbB12 [197] or
SmB6 [198]. These moderate values also survive application of magnetic fields, contrary
to semimetals with low effective masses. In bismuth insulating-like behavior is induced by
magnetic fields as low as 0.1 T due to the large cyclotron frequency (see inset of Fig. 6.12 on
page 139) [4]. The relatively low resistivity of CeNiSn together with the anticipated large
Nernst signal suggests that this compound is a promising candidate for thermomagnetic
cooling.
Another open question for CeNiSn is the origin of the enhancement of the thermal
conductivity κ, which is observed below 10 K. It has has been associated with the gap
formation and is generally attributed to a larger phononic contribution due to reduced
scattering from quasiparticles [199]. Alternatively, an enhancement of the electronic con-
tribution to κ has been proposed [200, 201]. The present investigation of the transverse
thermal conductivity or thermal Hall effect has been performed to decide on the relevance
of electronic heat transport in CeNiSn.
In addition to the transverse thermoelectric coefficients, the thermopower S(T ) and
thermal conductivity κ(T ) of CeNiSn in magnetic fields have been reinvestigated. The
current thermal-transport study is the first on CeNiSn single crystals of the highest avail-
able quality above 8 K. Furthermore, it represents the first systematic investigation of
S(T ) in magnetic fields taking into account the influence of the Nernst voltage on the
thermopower signal due to a misalignment of the contacts. Therefore, the evolution of the
thermopower in magnetic fields is discussed in detail in comparison to previous results.
This chapter is organized as follows: The next section 6.2 gives a brief introduction to
thermomagnetic cooling and the relevance of the Nernst coefficient in this context. There-
after, the properties of CeNiSn are summarized with a focus on previous investigations
of the thermal conductivity and thermopower (Sec. 6.3). The applied techniques and the
investigated samples are briefly described in Sec. 6.4 in order to specify the conditions
during the experiment. Subsequently, the thermal transport data are presented and com-
pared to previous results (Sec. 6.5). A detailed discussion follows in a separate section 6.6.
The chapter closes with a summary in Sec. 6.7.
– 118 –

6.2. The Nernst effect and Ettingshausen cooling
source/hot
sink/cold
B j
cold
hotj
B
(a) (b)
Lc
Lh
Figure 6.1: Schematic drawing of a simple Ettingshausen refrigerator (a) and an exponen-
tially shaped infinite stage thermomagnetic device (b).
6.2 The Nernst effect and Ettingshausen cooling
Thermomagnetic cooling devices make use of the Ettingshausen effect, which, in a way,
is a reverse of the Nernst effect: Application of an electric current j to a material with a
magnetic field B perpendicular to j induces a temperature gradient orthogonal to j and
B. The simplest Ettingshausen refrigerator is made of a tetrahedrally shaped material
as shown in Fig. 6.1a [202]. The maximum temperature gradient, which can be achieved
with such a device, is closely related to that of a single-stage Peltier cooler (Eqs. 4.1 and
4.2):
ΔTmax =ZmagT
2cold
2(6.1)
with the thermomagnetic figure of merit ZmagT :
ZmagT =σN2T
κel + κph(6.2)
Thus, a large Nernst signal N is inevitable for thermomagnetic applications.
Peltier cooling requires a combination of two materials, ideally an n- and a p-type one,
due to the parallel flow of charge and heat currents. By contrast, Ettingshausen devices
may be built from a single substance. Therefore, multi-stage Ettingshausen refrigerators
can be constructed by simply using an adequate form of the active material [203]. For an
exponentially shaped device as depicted in Fig. 6.1b the maximum temperature difference,
which can be achieved, has been shown to be [204]:
ΔTmax = Tcold
{1 −
[Lc
Lh
](1−α)/(1+α)}
(6.3)
The exponent α = (1−ZmagT )1/2 depends on only the thermomagnetic figure of merit and
the average temperature T of the material. From Eq. 6.3 it is evident that, in the limit
of an infinitely small width at the cold end Lc, the cold-junction temperature Tcold should
– 119 –

Chapter 6. Towards Ettingshausen cooling: The Nernst effect in CeNiSn
approach 0 K even for small values of ZmagT . The practicability of such a procedure has
been verified also experimentally for an exponentially shaped Bi-Sb alloy [205]. A NdFeB
permanent magnet was used to apply a magnetic field of 0.75 T. Actually, the major
disadvantage of thermomagnetic cooling devices is the requirement of large magnetic fields.
So far, exploitation of the technology is excluded by the small efficiency of known materials
in the field range of inexpensive permanent magnets.
6.3 Properties of CeNiSn
This section summarizes the results of previous investigations on CeNiSn. The first
part 6.3.1 gives a general overview on the structure, physical properties and theoreti-
cal models. The thermal transport properties, in particular, are addressed in the second
part 6.3.2.
6.3.1 Overview
CeNiSn crystallizes in an orthorhombic structure of almost ε-TiNiSi type belonging to
the noncentrosymmetric space group Pn21a [206] as shown in Fig. 6.2. Each unit cell
contains four formula units. The structure is characterized by two-dimensional Ce-Ni-Sn
networks within the ac plane, which are stacked along the b axis (Fig. 6.2a). The Ce atoms
are surrounded by two hexagonal rings formed by Ni and Sn (Fig. 6.2a) and form zigzag
chains along a (Fig. 6.2b). Alternatively, the compound can be described as undulated
two-dimensional Ce networks in the bc plane, whereas the Ce layers are separated by two
layers of Ni and Sn (Fig. 6.2c) [207]. The stacked structure gives rise to highly anisotropic
magnetic and transport properties.
The magnetic susceptibility of CeNiSn is largest along the a axis [207]. No magnetic
ordering has been observed down to 25 mK [208]. Neutron scattering experiments revealed
the presence of complex antiferromagnetic correlations at low temperatures. Below ap-
proximately 10 K a spin-gap is formed, which, however, is well-defined only along certain
directions in k space [209]. Excitations at 2.5 meV and 4 meV have been attributed to cor-
relations of three-dimensional and quasi-one-dimensional character, respectively, whereas
the latter is arranged parallel b with the spins polarized along the easy a axis [210].
At temperatures above 10 K CeNiSn behaves like a metallic Kondo system with CEF
splitting. The Kondo temperature TK = 56 K was estimated from the entropy [211].
Inelastic neutron scattering revealed a CEF excitation around 40 meV [212]. The observa-
tion of the second CEF level expected for the Ce3+ ions is presumably hidden by a strong
phonon-related structure in the spectrum. In experiments on CeNi0.85Cu0.15Sn CEF exci-
tations have been found at 20 meV and 35 meV [213]. On account of this investigation
the existence of a CEF level around 20 meV has also been suggested for CeNiSn.
The electrical resistivity of CeNiSn along a and c increases as ρa,c ∝ − ln(T/C) in two
– 120 –

6.3. Properties of CeNiSn
c
a
b
Ni
Sn
(a) (b) (c)
c
b
a
c
ab
Ce
Figure 6.2: Crystal structure of CeNiSn.
different temperature regions around 100 K and 20 K as expected for a Kondo system in
the presence of a CEF splitting [214, 208]. Along the b axis the logarithmic increase of
ρ(T ) is observed only around 100 K. First investigations of the electrical resistivity at low
temperatures yielded an activated behavior between 3 K and 65 K, which was ascribed
to the opening of a gap in the quasiparticle DOS with Δ/kB ≈ 6 K [215]. This value is
about one order of magnitude lower than those observed in the cubic Kondo insulators,
e.g. YbB12 or SmB6. Measurements on samples of higher purity revealed a metal-like ρ(T )
below 15 K indicating the onset of coherence [216, 208]. The resistivity along a saturates
below 1.5 K. By contrast, ρb and ρc exhibit another increase below 3 K and pass through
weak maxima around 0.8 K [208].
Despite the metal-like resistivities observed in high-quality single crystals, it is generally
assumed that an anisotropic pseudogap opens in CeNiSn below approximately 10 K. The
gap formation has been observed directly by break-junction tunneling spectroscopy [217,
218]. Evidence for the opening is also obtained from the rapid decrease of the specific
heat below 6 K [219, 211] and the enhanced thermal conductivity for T < 10 K [199,
200]. However, neutron-scattering experiments revealed that the gap in the magnetic
excitation spectrum is closed along certain directions in k space [209]. Furthermore, various
experimental probes indicate a finite quasiparticle DOS at the Fermi level: The electronic
specific heat divided by temperature cel/T takes a constant value of 28 mJ/(mol K2) below
0.5 K [220]. Likewise, the metal-like resistivities observed in samples of high purity [208],
the Koringa-type behavior of the nuclear spin-lattice relaxation time T1 as T1T = const.
below 0.4 K [221], and the linear-in-T dependence of the thermal conductivity below
0.3 K [200] have been interpreted in terms of a finite DOS at EF. Various models have
been proposed for the form of the gap near EF. A V-shaped gap with a finite DOS at EF,
as sketched in Fig. 6.3, has been suggested from the analysis of cel/T [222] and T1 [219].
– 121 –

Chapter 6. Towards Ettingshausen cooling: The Nernst effect in CeNiSn
EF EF EF EF
(a) (b) (c) (d)
E E E E
Figure 6.3: Schematic DOS of CeNiSn. (a)-(c) have been proposed from NMR investiga-
tions. (a) V-shaped gap for pure CeNiSn [222]. (b) Gapless V-shaped DOS for CeNi1.01Sn
[229]. (c) Modified V-shaped DOS for CeNiSn with partial substition on the Ce or Ni
site [229]. A similar DOS has also been suggested from specific-heat measurement in
magnetic fields on pure CeNiSn [223]. (d) Twofold gap for the anisotropic hybridization
model [225].
Investigations of cp in magnetic fields have been interpreted using a modified V-shaped
gap (Fig. 6.3c)[223]. A finite DOS at EF has also been predicted from LDA calculations of
the electronic structure, which suggest the presence of two slightly overlapping bands at
EF [224, 225]. Likewise, recent ab initio calculations of the electronic structure of CeNiSn
yielded a finite DOS at EF [226]. Therefore, CeNiSn has been classified rather as a Kondo
semimetal than a semiconductor.
The pseudogap is very sensitive to pressure and magnetic fields. Resistivity measure-
ments under pressure indicate a gradual suppression of the gap, which is estimated to be
closed for p of the order of 1-3 GPa [227, 228]. Likewise, magnetic fields of approximately
10 T along the easy a axis have been found to suppress the gap formation significantly,
while fields along b and c are less effective [200, 216].
Systematic investigations on crystals synthesized with different techniques and under
varying conditions revealed a sensitive dependence of the properties of CeNiSn on the
sample quality [32, 131]. The first single crystals grown by Czochralski pulling or floating-
zone melting contained Ce2O3, CeNi2Sn2, and Ce2Ni3Sn2 as the main impurity phases. The
amount of Ce2O3 and CeNi2Sn2 could be successfully reduced below the detection limit
of 0.1 % applying a Czochralski technique under purified Ar atmosphere. Subsequent
annealing by solid-state electrotransport (SSE) [230] allowed to also lower the content
of Ce2Ni3Sn2 below 0.1 %. The sample quality mainly affects the transport properties
of CeNiSn. As mentioned above, the resistivity is more metal-like for crystals of higher
purity. Application of a magnetic field gives rise to a large negative magnetoresistance in
samples of minor quality, which is significantly reduced or even reverted to positive values
for B ‖ b or c in clean crystals [131]. Simultaneously, the Hall coefficient RH of pure
samples is enhanced [208]. The contrary behavior of ρ and RH for samples of different
purity has been attributed to the suppression of scattering between charge carriers as the
gap opens, while the large negative magnetoresistance observed in samples of lower quality
was ascribed to a strong scattering from impurities, which is suppressed by high magnetic
– 122 –

6.3. Properties of CeNiSn
fields [131].
Specific-heat investigations evidenced, that the gap structure is not particularly sensi-
tive to a small amount of impurities and foreign phases [32]. By contrast, measurements
of the nuclear spin-lattice relaxation rate on an off-stoichiometric crystal of CeNi1.01Sn
have been explained with a modification of the DOS at the Fermi level from a gapped to
a gapless V-shaped DOS (Fig. 6.3b) due to the Ni excess [229]. In the same investigation,
the effect of substitution on the Ce and Ni site has been found to differ from that of im-
purities in a way that a flat DOS is added near EF to the V-shaped structure (Fig. 6.3c).
The pseudogap has been found to be closed completely by substitution of approximately
10 % on either the Ce or the Ni site [229].
The Hall resistivity of CeNiSn is negative along all 3 crystallographic directions for
T < 3 K [219, 208]. By contrast, the thermopower along a and c is positive down to
300 mK [231, 200]. The differing sign of the thermopower and Hall resistivity at low T
points at the presence of electron-like and hole-like charge carriers [33]. Investigations of
Shubnikov-de-Haas oscillations in the ac and bc planes revealed a small but dominant part
of the Fermi surface of electron-like character [232]. The corresponding carrier concentra-
tion has been estimated to be 10−3 electrons/Ce with a quasiparticle mass of (10−20)m0.
A complete experimental determination or theoretical calculation of the Fermi surface of
CeNiSn was not accomplished so far.
Different theoretical scenarios have been proposed to account for the pseudo-gap for-
mation and the low-temperature properties of CeNiSn. Within the spin-liquid picture of
Kikoin et al. the opening of the gap is ascribed to the formation of a spin-fermionic state
through a strong coupling between heavy quasiparticles and two low-lying CEF states of
the Ce3+ ions [233]. However, this model has been found to conflict with the results of
inelastic neutron-scattering experiments [213]. A two-fluid model proposed by Kagan et
al. [234] assumes the existence of neutral spin excitations besides charge carriers. It could
in particular account for the apparent contradiction between the metal-like resistivities
and the gap observed in thermodynamic properties. Two independent theories consider
the local symmetry of the Ce3+ ions and propose a special form of the wave function of the
ground-state doublet. The anisotropic hybridization-gap model of Ikeda and Miyake [225]
reveals a vanishing hybridization between the 4f level and the conduction band along the
quantization axis z ‖ a. A twofold band gap as shown in Fig. 6.3d is formed by highly
renormalized quasiparticles near the Fermi level. Another model by Moreno and Cole-
man [201] predicts two stable states of axial and quasioctahedral symmetry. The axial one
corresponds to that proposed by Ikeda and Miyake and is expected to induce a pronounced
enhancement of the electronic thermal conductivity along a. By contrast, the quasioctahe-
dral state is connected with a modest enhancement of the electronic thermal conductivity
along b. Experiments revealed enhanced values of the total thermal conductivity along b
in agreement with the latter scenario. In this context, a separation of κ into the electronic
and phononic contribution appears highly interesting as a possible corroboration for this
– 123 –

Chapter 6. Towards Ettingshausen cooling: The Nernst effect in CeNiSn
theory.
In summary, the orthorhombic system CeNiSn has been classified as a semimetal with
a low charge-carrier concentration. The opening of an anisotropic pseudogap below 10 K
has been confirmed from various experimental probes. Magnetic fields of the order of
10 T along the easy a axis suppress the gap formation significantly, while fields along b
and c are less effective. The transport properties of CeNiSn are driven by different types
of charge carriers. Particularly the electrical resistivity exhibits a sensitive dependence
on the sample quality, while thermodynamic quantities are less affected by impurities.
Various models have been proposed to explain the low-T properties and the gap formation
of CeNiSn.
6.3.2 Thermal transport in CeNiSn
The thermal transport properties of CeNiSn have been studied extensively on samples of
different quality. Tab. 6.1 summarizes the reported results together with the preparation
technique and the purity of the investigated crystals.
Thermal conductivity
The thermal conductivity data on CeNiSn that is available from the literature display
varying temperature dependencies and absolute values [214, 231, 199, 200]. However, the
differences for samples of unequal quality are not as pronounced as in ρ(T ), and some
common features can be noted: The thermal conductivity is consistently largest when
measured along b. Below 10 K, κb is generally enhanced, giving rise to a plateau or
maximum around 4 K. The lowest values of the thermal conductivity are observed either
along a [214, 200] or along c [231, 199]. The enhancement of κa and κc below 10 K
is less pronounced than that of κb. An estimate of the electronic contribution to the
thermal conductivity from the Wiedemann-Franz law suggests that κel is negligible above
1 K [214, 200].
The enhanced κ values at low temperatures are attributed to the opening of the pseu-
dogap. In agreement with this, κ is strongly suppressed by application of a magnetic field
along the a axis [199, 200]. Two different scenarios have been proposed to account for the
observed behavior [199]: (1) The freezing of free charge carriers as the gap opens lowers
the phonon-electron scattering rate. The related increase of the phonon mean free path
gives rise to an enhanced lattice thermal conductivity. (2) Alternatively, the enhancement
in κ may result from a larger electronic contribution due to an increase of the electron
relaxation time as the gap opens. Such an effect is held responsible for the enhancement in
κ below the superconducting transition temperatures in the cuprates [238]. An enhanced
electronic thermal conductivity has also been predicted within the gap-anisotropic model
by Moreno and Coleman [201]. However, in view of the estimated negligible electronic
contribution, this scenario implies a strong violation of the Wiedemann-Franz law as the
– 124 –

6.3. Properties of CeNiSn
crystal preparation impurity content thermoelectric references
number technique Ce2O2 – CeNi2Sn2 – transport
Ce2Ni3Sn2 [%]
#1 Czochralski 1.2 – 2.5 – 0.2 S(T ) [32]
#2 floating zone 0.5 – 0.5 – 0.2 κ(T ), S(T ) [231]
#4 Czochralski < 0.1 – < 0.1 – 0.2 S(T ) [131, 235]
#5 Czochralski < 0.1 – < 0.1 – 0.1 κ(T ), S(T ), N(T ) this work
SSE
#8 Czochralski quality similar to #5 κ(T ), S(T ) [200, 236]
SSE
#9 Czochralski quality similar to #4 κ(T ) [199]
unknown Czochralski κ(T ) [214]
unknown unknown S(T ) [219]
unknown Czochralski S(T ) [237]
Table 6.1: Summary of the preparation technique and quality of the CeNiSn single crystals
with reported thermal transport properties. The quality of #1 to #5 is given according
to [131]. The crystals treated by the SSE (solid-state electrotransport) technique (#5 and
#8) are those characterized by the lowest electrical resistivities and the clearest indication
for the onset of coherence.
gap opens. Therefore it is generally assumed that the enhanced κ values are due to phonon
thermal transport.
Thermopower
The high-temperature thermopower of CeNiSn displays the typical behavior of a Ce system
with CEF splitting. Above 10 K S(T ) measured along all three crystallographic directions
is positive and exhibits maxima or shoulders around 20 K and 100 K [32, 237, 219]. They
can be attributed to Kondo scattering from the ground-state doublet and the full Ce3+
multiplet. Additionally, it was speculated [200] that the anomalies found around 20 K
are partly due to a paramagnon-drag contribution from quasi-one-dimensional antiferro-
magnetic correlations observed in inelastic neutron-scattering experiments [209, 210]. The
absolute values of S(T ) exhibit a moderate sample dependence, whereas no systematic
variation with the sample purity is observed.
The low-temperature thermopower of CeNiSn depends sensitively on the direction of
the heat flow and on the sample quality. Generally, the absolute values of S are enhanced
as the gap opens. While the thermopowers measured along a (Sa) and c (Sc) remain
consistently positive down to 300 mK in zero magnetic field, Sb changes to negative values
in some samples. Furthermore, the absolute values of S(T ) display a strong sample de-
pendence. Investigations performed in the group of Nakamoto and Takabatake [219, 32]
– 125 –

Chapter 6. Towards Ettingshausen cooling: The Nernst effect in CeNiSn
revealed positive thermopowers along all crystallographic directions with maxima around
3 K. The largest values of up to 50 μV/K were observed along the a axis. Maxima in Sa
and Sc around 2-3 K have also been found by Hiess et al. [231] with Smaxa ≈ 80 μV/K and
Smaxc ≈ 60 μV/K. Likewise, measurements reported by Sakurai et al. [237] yielded maxima
at 3 K of 65 μV/K and 45 μV/K along a and c, respectively. In the same investigation,
Sb was found to exhibit a negative minimum at 4 K reaching -5 μV/K. Differing results
were obtained by Paschen et al. [200] in an investigation on high-quality single crystals of
#8 purified by the SSE technique. While Sa shows a large maximum of 45 μV/K at 4 K,
similar to other studies, Sb and Sc did not exceed 10 μV/K.
The large values and sharp features in S(T ) at low temperatures have been attributed
to the opening of the gap with a residual DOS and a fine structure near the Fermi level
[231, 32, 237]. In agreement with this assumption, application of a magnetic field of 8 T
along the easy a axis has been found to induce a significant lowering of the absolute values
in Sa and Sc at low T [231]. However, Paschen et al. reported an increase for Sb and Sc in
magnetic fields at low T . This observation was interpreted in terms of a redistribution in
k space of the charge-carrier density giving rise to the residual DOS [200].
6.4 Experimental details
6.4.1 Samples
As mentioned above, the properties of CeNiSn depend sensitively on the sample quality.
The samples investigated in this work are of the highest available purity. They originate
from the single crystal #5 prepared in the group of T. Takabatake (Hiroshima University,
Japan). It was grown using the Czochralski technique under a purified argon atmosphere
and subsequently annealed by solid-state electrotransport (SSE) [230]. The synthesis and
characterization of crystal #5 is described in detail in Ref. [131]. Three samples were cut
by spark erosion to tetrahedra of approximately 0.8 × 4 × 4 mm3, whereas the edges are
oriented along the three crystallographic directions. The shortest dimension corresponds
to the c, b, and a axis for samples No. 1,2, and 3, respectively.
Samples of type #5 exhibit metal-like resistivities at low temperatures [131]. No ther-
mal transport data are available from literature. However, the low-temperature ther-
mopower and thermal conductivity of single crystal #8, which was prepared with the
same technique as #5, have been investigated in magnetic fields up to 8 T [200].
A complete determination of the transverse thermoelectric transport coefficients of an
orthorhombic system requires the measurement for 6 different orientations of the heat
current q and the magnetic field B (e.g. q ‖ a with B ‖ b and B ‖ c). Furthermore, the
longitudinal coefficients can be determined for B ‖ q. Within this work, two orientations
are studied: The thermoelectric transport properties of sample No. 3 have been investi-
gated for q ‖ b and B along the easy a axis. For this field orientation the gap formation is
– 126 –

6.5. Results
expected to be suppressed considerably in 7 T. Additionally, the thermopower and Nernst
coefficient measured by P. Sun on sample No. 1 will be discussed. This crystal was mea-
sured likewise for q ‖ b, while B was applied along c. In this configuration the Nernst
signal is measured along a, the direction with the largest thermopower values at low T in
crystals of similar quality (#8) [200].
6.4.2 Experimental techniques
The thermoelectric transport properties of CeNiSn have been investigated using the new
experimental setup described in Chap. 3.2. Additionally, electrical resistivity and Hall
effect were measured using the same contacts in the PPMS.
The large thermal conductivities of CeNiSn at low T require a good thermal contact
between the samples and the bath. Mounting with conductive silver paste (DuPont N4922)
or low-temperature varnish did not produce satisfactory contacts. Therefore, the crystals
were soldered with indium onto a silver Z and than installed to the sample holder. The
thermocouples and manganine wires for measuring the longitudinal and transverse tem-
perature gradients and voltages were fixed on Au wires with a diameter of 100 μ attached
to the samples with silver-filled epoxy (EpoTek H20E from Polytec).
Test measurements to determine the maximum applicable temperature gradient with-
out significant sample heating were performed around 8 K. In this T region the opening
of the gap gives rise to a strong temperature dependence of S(T ). As a result of these test
measurements the T gradients were restricted to 0.8 % (No. 3) and 2.0 % (No. 1) of the
absolute temperature. The sample heating was estimated to at most 2 %. Furthermore,
thermopower data obtained using a smaller maximum gradient as explained in Chap. 3.2.4
were found to be identical within the resolution of the measurement.
In order to eliminate contributions from the Nernst signal to the thermopower due to a
misalignment of the contacts, S(T, B) was determined from the average of measurements
in +B and −B.
6.5 Results
In this section the data are presented and compared to those reported in the literature. A
detailed discussion follows in Sec. 6.6.
6.5.1 Thermal conductivity and thermal Hall coefficient
The zero-field thermal conductivity along b measured on sample No. 3 is shown in the inset
of Fig. 6.4. It exhibits a temperature dependence similar to that reported in [199], which
was determined on a single crystal of high purity but without SSE treatment (#9, similar
quality as #4 in Ref. [131]). The close agreement between the two data sets supports
– 127 –

Chapter 6. Towards Ettingshausen cooling: The Nernst effect in CeNiSn
Figure 6.4: Thermal conductivity of CeNiSn #5, No. 3 measured in different magnetic
fields for q ‖ b and B ‖ a. The inset shows the zero-field data.
the assumption that the electronic thermal conductivity, which is expected to depend
sensitively on the sample quality, is negligible in the investigated temperature range. The
weak upturn below 9 K due to the opening of the gap confirms the precise orientation of
the sample with q ‖ b, since κa and κc exhibit only a shoulder or plateau.
The evolution of κb in magnetic fields B ‖ a up to 7 T is shown in the main plot of
Fig. 6.4. Generally, the gap formation is prevented by a field parallel a of the order of
10 T, while fields along b and c are less effective. Consistently, the upturn below 9 K is
gradually suppressed. The reduction amounts to 22 % at 7 K in 7 T. Again, the evolution
of κb for B ‖ a is very similar to that reported in [199] for a crystal of type #9.
The transverse temperature gradient measured in zero magnetic field on sample No. 3
was found to be below 2.0 % of the longitudinal one. This confirms the precise positioning
of the contacts used for the measurement of the transverse thermoelectric coefficients. The
thermal Hall gradient induced by application of magnetic fields of up to 7 T perpendicular
to the heat current could not be resolved within the accuracy of the experimental setup.
It is estimated to be at most 1.8 % of the longitudinal temperature gradient at 1.5 K and
7 T. A large thermal Hall effect in CeNiSn can therefore be excluded for the investigated
orientation.
6.5.2 Thermopower
The zero-field thermopower measured along b of CeNiSn is shown in the inset of Fig. 6.5.
The data sets obtained on two different samples, No. 3 and No. 1, agree in the whole
– 128 –

6.5. Results
Figure 6.5: Thermopower of CeNiSn #5, No. 3 measured in different magnetic fields for
q ‖ b and B ‖ a. Exemplary error bars indicate the uncertainty of the data at low T and
high B. Above 4 K the uncertainty is typically less than 1 μV/K. The inset compares the
zero-field data to those obtained on sample No. 1.
investigated temperature range. Above 10 K Sb exhibits a similar temperature depen-
dence as that reported in literature for a high-purity single crystal without SSE treatment
(#4) [32]. Sb(T ) is positive with maxima at 20 K and 100 K. The high-temperature
maximum is attributed to Kondo scattering from thermally populated CEF levels. The
maximum around 20 K due to Kondo scattering on the ground-state doublet is assumed
to mark the onset of coherence. A contribution from paramagnon drag was also suggested
as a possible origin for the low-T maximum [200].
The low-temperature data of Sb(T ) reported in literature suggest a strong sample de-
pendence. In the present investigation Sb(T ) changes sign at 8 K and goes through a
large negative minimum of −30 μV/K around 3.5 K. This value represents the largest
negative S ever observed for a CeNiSn sample. Below 1.7 K the thermopower assumes
again positive values. A similar temperature dependence has been observed in samples
grown by a Czochralski technique without SSE treatment (type unknown) [237]. These
samples exhibit a negative Sb between 2.5 and 7 K, however, of significantly smaller ab-
solute values. The minimum at 4 K reaches at most -6 μV/K. By contrast, investigations
on single crystals of similar quality (#8) as those presented here yielded a reverse tem-
perature dependence Sb(T ) with a change from negative to positive values around 8 K, a
maximum of 8 μV/K around 3.5 K and a crossover to negative Sb below 1.9 K [200]2.
2Careful checks have been performed in order to rule out the possibility of an error in sign for the
– 129 –

Chapter 6. Towards Ettingshausen cooling: The Nernst effect in CeNiSn
Figure 6.6: Field dependence of the minimum temperature in Sb(T ), Tmin, and the ther-
mopower value at Tmin, Smin, for different directions of B. The dashed lines are meant
to be a guide to the eye. Additionally, in the left plot the energy gap determined from
break-junction tunneling spectroscopy on polycrystalline CeNiSn taken from Ref. [239] is
shown. The error bars given for Smin represent the scattering of the data around Tmin.
The effect of a magnetic field along a on the low-T thermopower Sb is shown in the
main plot of Fig. 6.5. The minimum at 3.5 K clearly shifts to lower temperatures with
increasing B. For small fields B ≤ 4 T the absolute values at the minimum |Smin| are
enhanced. In 7 T a weak lowering of |Smin| is observed, which, however, is of the order
of the uncertainty in the data. Application of a magnetic field along c gives rise to a
similar evolution of S(T ) (not shown). Compared to the situation B ‖ a, the shift of the
minimum is less pronounced and no lowering of |Smin| is observed up to 7 T. The relevance
of the field orientation for the minimum in Sb(T ) is illustrated in Fig. 6.6. The left plot,
Fig. 6.6a, shows the field dependence of Tmin for B ‖ a, c. It clearly reveals that the shift
of the minimum is more pronounced for B ‖ a. A linear extrapolation of Tmin(B ‖ a) to
zero temperature yields a critical field of 14 T. This value is comparable to the energy-
gap quenching field along a of 18 T determined from the magnetoresistance of type #4
crystals [240]. Therefore, it is supposed that the shift of the minimum is related to the
closing of the gap in magnetic fields. This conclusion is supported by a comparison of
Tmin(B) to the field dependence of the energy gap ΔE determined from break junction
tunneling spectroscopy on polycrystalline CeNiSn [239]. ΔE(B) can be approximately
present investigation. A mistake can be excluded due to (1) the positive thermopower values at hightemperature, which are consistent with all reported data, (2) the observation of a similar behavior forboth investigated samples, and (3) a test measurement in the PPMS, which yielded the same sign.
– 130 –

6.5. Results
scaled to Tmin(B) by a factor of 0.2 K/meV (Fig. 6.6a). Fig. 6.6b shows the evolution
of the thermopower value at the minimum for B ‖ a, c. While |Smin| is enhanced in low
fields, a saturation and subsequently a reduction is observed at higher B. Again, the
effect of a field along a is more pronounced than that of B ‖ c. It is suspected that the
minimum value for both orientations is further reduced in higher B as the minimum shifts
to lower T .
6.5.3 Nernst coefficient
The Nernst coefficient of CeNiSn was measured for the heat current q ‖ b and different
orientations of the magnetic field: (1) νcb was determined on sample No. 3 along c for
B ‖ a. (2) νab was measured on sample No. 1 along a for B ‖ c. The results for selected
fields are shown in Fig. 6.7 as the total Nernst signal N vs. T and normalized to the field,
as ν(T ) (insets).
Owing to the design of the experimental setup, the measured transverse voltage cor-
responds to the adiabatic Nernst signal. The adiabatic Nernst coefficient νa is connected
to the normal one, νn, via the thermal Hall effect according to Eq. 2.21. In consideration
of the small thermal Hall gradient of less than 1.8 % of the longitudinal one in 7 T the
difference between νn and νa is expected to be small. It can be estimated using Eq. 2.18
and assuming Sa,c < 80 μV/K to at most 0.2 μV/KT. In the following it is therefore
assumed that ν ≡ νn = νa.
Above 10 K the Nernst signals are small for both orientations. At lower T the absolute
values |νcb| and |νab| strongly increase, whereas they are of similar magnitude. In small
magnetic fields B ≤ 2 T, νcb and νab go through minima of approximately -15 μV/KT
around 2 K. For νcb this minimum is also observed in higher fields up to 7 T, whereas
the magnitude is field independent within the resolution of the experiment (inset of 6.7a).
By contrast, the minimum of νab is apparently shifted to lower temperatures in higher
B. While the 3 T and 5.5 T curves still show a tendency to saturation at lowest T , the
absolute Nernst signal measured in 7 T increases down to 1.5 K (6.7b).
The strong increase of the absolute values of νab and νcb below 8 K can be associated
to the gap opening in this temperature range. A low charge-carrier density is assumed
crucial for the development of a large Nernst signal. The observed enhancement of |νab|and |νcb| appears coherent with this picture. In this context, however, the field dependence
of the minimum in νab and νcb is surprising. The energy gap of CeNiSn is most sensitive
to fields along the easy a axis [200, 216]. Consequently, physical properties related to the
gap opening, as the enhanced κ values, are easily manipulated by application of a field
along a, while fields along b and c are less effective. In the present investigation, however,
the Nernst coefficient νcb, measured for B ‖ a is field independent. The minimum in νab,
determined for B ‖ c, on the other hand, is shifted to lower T in magnetic fields B > 2 T.
This point is addressed again in Sec. 6.6.3.
– 131 –

Chapter 6. Towards Ettingshausen cooling: The Nernst effect in CeNiSn
Figure 6.7: Nernst signal N (main plots) and Nernst coefficient ν (insets) of CeNiSn for
q ‖ b and different field orientations: (a) B ‖ a and Nernst voltage measured along c, (b)
B ‖ c and Nernst voltage measured along a. The uncertainty of the data is significantly
larger in (a) compared to (b) due to the smaller maximum temperature gradient along the
sample.
– 132 –
6.6. Discussion
6.6 Discussion
6.6.1 The thermal Hall gradient
A determination of the electronic thermal conductivity κelxx of CeNiSn is not possible from
the data obtained in the present investigation. The calculation of κelxx from the transverse
thermal conductivity κyx requires additional knowledge on the relevant relaxation times,
e.g. the field dependence of the thermal Hall signal [54], which could not be resolved.
The situation is even more complex for CeNiSn due to the presence of different types of
charge carriers. The contributions from electrons and holes to the Hall resistivity and
thermal Hall gradient partially compensate each other, whereas the total thermoelectric
transport coefficients depend in a complicated way on the mobilities and charge-carrier
densities. Thus, even an estimate of the electronic contribution to the thermal conductivity
of CeNiSn and consequently a confirmation or disproof of one of the theoretical scenarios
proposed by Ikeda and Miyake [225] or Moreno and Coleman [201] turns out impossible3.
6.6.2 The thermopower and the gap formation
The strong sample dependence of S(T ) has been related to the differing purity of the
investigated crystals [200]. However, based on the presented data, two other effects have
to be taken into account. Firstly, in view of the sensitive direction dependence of S(T ) it
cannot be excluded that tiny misalignments during the measurements are responsible for
at least part of the reported variations. The negative values of Sb observed around 3 K in
the present investigation could be easily diminished by a small contribution from the huge
positive Sa and Sc of up to 70 μV/K expected in the same temperature range. In this con-
text, the close agreement between the two measurements on different samples as well as the
observed large magnitude of Sb demonstrate the quality of the presented data. Secondly,
the large negative Nernst signal of up to -110 μV/K in 7 T can contribute to the ther-
mopower voltage, if the contacts are not ideally aligned. In the present investigation, this
effect was already appreciable in 2 T as demonstrated in Fig. 6.8. Below 8 K the measured
thermopower curves Smeas(T ) for positive and negative field differ significantly (Fig. 6.8a).
The in-field antisymmetric contribution 12ΔSmeas = 1
2[Smeas(+2T) − Smeas(−2T)] exhibits
a temperature dependence similar to that of the Nernst signal in 2 T and can be scaled
to it by a factor of 8 (Fig. 6.8b). This corresponds to a misorientation of the contacts by
only 7◦. For the presented data this effect has been corrected for by averaging between
Smeas(+B) and Smeas(−B). It is generally not stated in literature, whether such a precau-
tion has been taken. Thus, the reported thermopower data in magnetic fields for B ⊥ q
3The small magnitude of the transverse temperature gradient compared to the longitudinal one does notnecessarily imply a small electronic thermal conductivity. In the high-Tc superconductor YBa2Cu3O7−δ
the ratio (∇T )y/(∇T )x = κxy/κxx was found to be of the order of 1 % [54]. However, κelxx amounts up to
25 % of the total thermal conductivity in small magnetic fields.
– 133 –

Chapter 6. Towards Ettingshausen cooling: The Nernst effect in CeNiSn
Figure 6.8: (a) Example of measured thermopower curves Smeas(T ) for CeNiSn in +2 T and
−2 T. (b) The in-field antisymmetric contribution 12ΔSmeas in comparison to the Nernst
signal N in 2 T. 12ΔSmeas can be scaled to N by a factor of 8.
need to be treated with caution. In particular, the drastic and non-monotonous change in
Sb around 2 K reported for crystals of similar quality as those investigated here (#8) [200]
might be at least to some extent influenced by the huge Nernst voltage in this temperature
range.
The large increase of the absolute thermopower values observed in CeNiSn below 10 K
has been related to the opening of the gap [231, 32, 237]. The observation, that application
of a magnetic field of 8 T along the easy a axis gives rise to a significant lowering of the
absolute values of Sa at low T [231], has been taken as a confirmation of this picture.
By contrast, low-T measurements by Paschen et al. revealed an increase for Sb and Sc
in magnetic fields along a of 4 T (Sb,c) and 8 T (Sc). This was interpreted in terms of a
redistribution in k space of the charge-carrier density giving rise to the residual DOS [200].
So far, all reports of the thermopower in magnetic fields concentrated on either S(B) at
constant T [237] or on S(T ) at constant B [231, 200], whereas the only investigated fields
are 4 T and 8 T. Additionally, none of the previous investigations considered the possibility
of a Nernst contribution as explained above. Therefore, the current study represents the
first investigation, which allows to follow in detail the evolution of the thermopower along
b in magnetic fields up to 7 T explicitly taking into account the Nernst signal.
Application of magnetic fields along a and c has been found to give rise to a systematic
shift of the thermopower minimum around 2 K to lower temperatures (cf. Fig. 6.6a). The
estimated critical field along a of 14 T as well as the stronger effect of B ‖ a compared to
B ‖ c confirms that the minimum is related to the gap formation in CeNiSn. Additionally,
– 134 –

6.6. Discussion
increasingB
EEF
N(E)
E
N(E) 0
-1
-2
-3
-4
0 1 2 3 4
(a) (b) (c)
B (a.u.)
(dln
N/dE
) E(a
.u.)
F
increasingB
EEF
N(E)
E
N(E) 0
-1
-2
-3
-4
0 1 2 3 4
(a) (b) (c)
B (a.u.)
(dln
N/dE
) E(a
.u.)
F(d
lnN
/dE
) E(a
.u.)
F
Figure 6.9: (a) Schematic DOS of CeNiSn in magnetic fields according to Ref. [223]. (b)
Enhanced view of the region around EF for different fields. (c) Field dependence of the
derivative of the DOS at EF.
it is observed that the absolute values |Smin| at the minimum increase for fields B < 4 T
(Fig. 6.6b). However, if the large magnitude of |S(T )| at low T is due to the gap formation,
it appears surprising that the suppression of the gap in magnetic fields leads to a further
enhancement of |Smin|. Apparently, application of a magnetic field does not only prevent
the gap formation but also influences the residual DOS inside the gap. A similar effect has
been found from specific-heat investigations on CeNiSn [223]. Application of a magnetic
field B ‖ a entails an enhancement of cp at low T . This observation has been interpreted
within a simple model assuming Zeeman splitting of the modified V-shaped DOS shown
in Fig. 6.3c. An illustration, how the same mechanism can give rise to an enhancement
of |S| at low B is depicted in Fig. 6.9: Application of a magnetic field will induce a shift
of the sub-bands for the spin-up and spin-down states to different energetic directions,
as shown for an arbitrary field in Fig. 6.9a. Thus, the resulting total DOS around the
gap structure depends sensitively on the field magnitude (Fig. 6.9b). If the Fermi level
is situated slightly off the symmetry line of the gap structure, the slope of the DOS at
EF becomes B dependent (Fig. 6.9c). Within this simplified picture, the absolute values
of the thermopower S ∝ T (∂ ln N(ε)/∂ε)EF(Eq. 2.33) will increase in small magnetic
fields and decrease for higher B. It is admitted, that the sketched behavior is much
too simple to explain in detail the behavior of S(T ) observed for CeNiSn in magnetic
fields. In particular, the measured zero-field thermopower attains large negative values,
and the calculated cascaded field dependence at constant T derived from 6.9c insufficiently
reproduces the behavior of Smin(B), which in addition is obtained at slightly varying T .
Despite these shortcomings, the presented picture demonstrates that the increase in |S| is
not fundamentally contradictory to the suppression of the gap in magnetic fields. Zeeman
splitting appears a possible and simple mechanism to understand the observed behavior.
It seems likely that a realistic band structure and the allowance for thermal broadening
– 135 –

Chapter 6. Towards Ettingshausen cooling: The Nernst effect in CeNiSn
enables a more sophisticated description of the data. In conclusion, the minimum in
Sb(T ) around 2.5 K is attributed to the gap formation and the observed field dependence
is related to the suppression of the gap in magnetic fields.
6.6.3 The Nernst effect and potential thermomagnetic cooling
The large Nernst coefficient of correlated systems has been frequently compared to the Hall
angle, e.g. for PrFe4P12 [196] and URu2Si2 [62]. This approach is based on the fact that
under certain assumptions the Nernst coefficient can be related directly to the Hall angle
according to Eq. 2.41 (Chap. 2.2.6). However, Eq. 2.41 does not hold for systems with
anisotropic transport properties or with more than one band at EF such as CeNiSn. In the
case of two types of charge carriers the limitations are easily illustrated: For an electrical
current electrons and holes generally move to opposite directions. Thus, in an applied
magnetic field the Lorentz force deflects them to the same side and the contributions
to the Hall voltage partially or completely compensate each other. By contrast, for a
heat current electrons and holes can move in the same direction. In such a case they
are deflected to opposite sides by a magnetic field, and the respective contributions add
to a total Nernst voltage. The differing relative contribution of different types of charge
carriers to the Hall and Nernst effect is easily visible for CeNiSn. Fig. 6.10 shows the
Hall resistivity RH of CeNiSn measured for j ‖ b and B ‖ a using the same contacts as
during the measurement of the corresponding thermoelectric transport coefficients. At low
temperatures T < 5 K the absolute Hall resistance significantly increases. This reflects the
reduction of the charge-carrier concentration as the gap opens. However, a comparison to
the Nernst coefficient for the same configuration (inset of Fig. 6.7a) reveals two significant
differences. While ν is negative in the whole investigated temperature and field range,
RH changes sign around 5 K. Furthermore, the Nernst coefficient is only weakly field-
dependent up to 7 T. By contrast, the Hall resistivity is already significantly reduced in
4 T. The differing temperature and field dependence of ν and RH clearly demonstrates
that Eq. 2.41 is not applicable to CeNiSn.
Different mechanisms have been proposed as a possible origin of large Nernst coeffi-
cients, several of which are relevant for CeNiSn:
� A low charge-carrier concentration is held responsible for the huge values of ν realized
in elemental Bi [70].
� An ambipolar Nernst effect from a combination of electron-like and hole-like charge
carries gives rise to a moderate enhancement of ν around 20 K in NbSe2 [64].
� The formation of heavy quasiparticles and the associated low Fermi energy is gen-
erally assumed advantageous for the development of large Nernst signals [241].
� The proximity to a QCP has been discussed as a reason for the large Nernst signal
in CeCoIn5 [3].
– 136 –

6.6. Discussion
Figure 6.10: Hall resistivity of CeNiSn measured for j ‖ b and B ‖ a using the same
contacts as during the measurement of the thermoelectric transport coefficients.
Thus, the large Nernst coefficient observed in CeNiSn appears consistent with the low
charge-carrier concentration of the system, the enhanced effective mass and the presence
of different types of charge carriers at low T . However, the relative relevance of each of
these properties for the huge magnitude of ν is not directly evident. It can be evaluated
considering the temperature dependence of the Nernst coefficient. A rapid increase of
|ν| is observed below 10 K, approximately the temperature of the gap formation. By
contrast, the Kondo temperature of 56 K [211] suggests an enhancement of the effective
mass already at higher T . Actually, a significant increase of the electronic specific heat to
about 0.1 J/mole K2 due to the formation of the Kondo-resonance peak4 has been found
around 20 K [242]. Therefore, the large Nernst coefficient of CeNiSn for T � 10 K cannot
be related directly and exclusively to the mass enhancement. Still, a large effective mass
is assumed favorable for the occurrence of enhanced values of ν. A rough estimate for the
Nernst coefficient yields ν ∝ 1/EF [4]. Therefore, large values of m∗ ∝ 1/EF are expected
to further increase ν. However, for CeNiSn the lowering of the charge-carrier density
as the gap opens appears considerably more important. In this context, the weak field
dependence of the Nernst coefficient is surprising. Although a field of 7 T along the a axis is
believed to suppress the pseudogap formation significantly, the Nernst coefficient changes
only slightly up to 7 T. Furthermore, the effect of magnetic fields is more pronounced for
B ‖ c. This observation can be understood similarly to the enhancement of S in small
4The phononic contribution cph estimated from the specific heat of LaNiSn amounts to approximately0.26 J/mole K2 at 20 K and thus exceeds the electronic contribution cel by a factor of 2 to 3. Therefore,the apparent enhancement of cel can hardly be completely ascribed to uncertainties in the estimate of cph.
– 137 –

Chapter 6. Towards Ettingshausen cooling: The Nernst effect in CeNiSn
CeNiSn
T (K)
Figure 6.11: Magnitude of the Nernst coefficient of CeNiSn for q ‖ b and B ‖ a in
comparison to what is found in a number of other systems as taken from [4].
magnetic fields. Evidently, the absolute values of a thermal voltage cannot be related
directly and exclusively to the pseudogap size. Other parameters as the residual DOS and
the band structure around EF have to be taken into account to evaluate the behavior in
a magnetic field. The weak field dependence of the Nernst coefficient and likewise the
increase of |S| in small B are therefore not inconsistent with the presumed fundamental
relevance of the gap formation for the huge values of |ν| and |S| below 10 K.
The predominant importance of semimetallic behavior for a large Nernst coefficient
as induced in CeNiSn by the pseudogap formation has been suggested previously based
on a comparison of different compounds [4]. Fig. 6.11 taken from Ref. [4] compares the
magnitude of ν for various systems with enhanced ν. In addition, the results obtained
on CeNiSn in the present investigation for q ‖ b and B ‖ a are plotted. The by far
largest values of ν are observed in semimetallic Bi. Likewise, a huge Nernst coefficient is
found for PrFe4P12 [196] and URu2Si2 [62]. The emergence of large values of ν in these
systems has been attributed to the opening of a gap associated with an exotic type of
ordering [4]. By contrast, the ”simple” HF metals CeCoIn5 [3] and CeRu2Si2 [243] exhibit
significantly lower Nernst coefficients. Thus, the heavy mass of the charge carriers appears
in general of minor relevance for the observation of a large ν. The ”enhanced” bipolar
Nernst coefficient of NbSe2 is even smaller. The results obtained on CeNiSn are in line
with this picture. ν strongly increases below the gap-formation temperature and reaches
a magnitude comparable to that of PrFe4P12 and URu2Si2. Thus, Fig. 6.11 confirms the
importance of the gap formation for the development of a large Nernst coefficient.
Although the heavy character of the quasiparticles appears of minor relevance for
– 138 –

6.6. Discussion
B = 0.1 T// bixectrix
BiB = 0
10 1000.2 1 T(K)
100
10
1
��
�(
cm
)
Figure 6.12: Resistivity of CeNiSn measured for j ‖ b and B ‖ a using the same contacts
as during the measurement of the thermoelectric transport coefficients. The inset shows
the resistivity of bismuth in zero field and 0.1 T taken from Ref. [4].
the large Nernst coefficient of CeNiSn, it becomes important in the context of possible
thermomagnetic cooling. As pointed out in the introduction to this chapter (Sec. 6.1), the
heavy mass and consequently small cyclotron frequency is favorable for a low electrical
resistivity in magnetic fields. Fig. 6.12 exemplarily shows the resistivity of CeNiSn for
j ‖ b in magnetic fields B ‖ a obtained on the same contacts as the thermoelectric
transport coefficients for this configuration. Application of a magnetic field gives rise to
a moderate lowering of ρ. By contrast, for bismuth insulating-like behavior is induced
by magnetic fields as low as 0.1 T due to low effective mass of the charge carriers and
the large cyclotron frequency (inset of Fig. 6.12) [4]. Since ρ enters the thermomagnetic
figure of merit ZmagT as ρ ∝ (ZmagT )−1, insulating behavior degrades the thermomagnetic
performance of a material. This is illustrated by Fig. 6.13 taken from Ref. [4], which
compares the Nernst signal and thermomagnetic figure of merit of Bi and PrFe4P12 at
1.2 K. In addition, the results for CeNiSn at 2 K obtained in the present investigation
for q ‖ b and B ‖ a are shown5. Bismuth exhibits by far the largest Nernst signal in
magnetic fields up to 12 T (Fig. 6.13a). However, the thermomagnetic figure of merit
is relatively small due to the large resistance induced by magnetic fields (Fig. 6.13b)
and the good thermal conductivity of the material. PrFe4P12, on the other hand, has
a significantly lower Nernst signal. Nevertheless, the large effective mass and resulting
5For the calculation of ZmagT the thermal conductivity has been taken from [200] and linearly inter-polated for different fields.
– 139 –

Chapter 6. Towards Ettingshausen cooling: The Nernst effect in CeNiSn
T = 1.2 K(a)
PrFe P4 12
Bi
CeNiSn ( = 2 K)T
CeNiSn ( = 2 K)T
PrFe P4 12
N(
V/K
)�
(/
NT
)�
�2
1000
100
10
0.1
0.01
1x10
-4
-3
1x10
0.1 1 10
B(T)
(b)
Figure 6.13: The Nernst signal (a) and the thermomagnetic figure of merit (b) of CeNiSn
at 2 K (q ‖ b, B ‖ a) in comparison to that of Bi and PrFe4P12 at 1.2 K according to [4].
moderate resistivities in magnetic fields give rise to a considerably larger ZmagT . It is even
more enhanced by the low thermal conductivity attributed to the cage structure of the
skutterudite compound. Above 5 T, as the magnetic ordering of PrFe4P12 is suppressed,
the Nernst signal and thermomagnetic figure of merit drop drastically. CeNiSn exhibits
a comparatively large Nernst coefficient (Fig. 6.11), which, however, is significantly lower
than that of Bi. The major advantage of CeNiSn is the large magnetic field required to
close the pseudogap. The Nernst signal at 2 K rises almost linearly for fields up to 7 T and
probably beyond (Fig. 6.13a). It overcomes that of PrFe4P12 around 3.5 T. Nevertheless,
due to the good thermal conductivity of CeNiSn, which is approximately one order of
magnitude larger than that of PrFe4P12, the thermomagnetic figure of merit is rather
poor (Fig. 6.13b). It reaches a value of only 0.03 around 7 T, which is insufficient for
thermoelectric devices. Furthermore, a prerequisite of magnetic fields as large as 7 T is
unfavorable for applications.
In summary, CeNiSn exhibits a large Nernst coefficient at low temperatures due to
the formation of a pseudogap below 10 K. The enhanced effective mass of the charge
carriers prevents the crossover to insulating behavior in magnetic fields. Both, the large
Nernst signal and the moderate electrical resistivity are favorable for thermomagnetic
applications. However, due to the good thermal conductivity, the thermomagnetic figure
of merit of CeNiSn is far too small for practical devices. Nevertheless, the presented
investigations of CeNiSn underline the potential of strongly correlated semiconductors
with low thermal conductivities for thermomagnetic applications.
– 140 –

6.7. Conclusions
6.7 Conclusions
The thermoelectric transport properties of high-quality single-crystalline CeNiSn have
been investigated between 1.5 K and 180 K for the heat current q ‖ b and magnetic fields
up to 7 T along a and c. CeNiSn is known to exhibit a strong direction dependence
of the thermal conductivity and thermopower. In the current investigation, the precise
orientation of the contacts on the investigated samples is evident from the close agreement
of the thermopower data for two different samples and the thermal conductivity data,
which exhibit a weak upturn below 9 K. Furthermore, this study represents the first
one taking into account explicitly the effect of the transverse signal on the measured
longitudinal data due to a non-ideal contact geometry. Based on the data, the large
variation in the reported thermopower data on CeNiSn is attributed at least partially to
tiny misalignments of the samples and to a contribution from the large Nernst signal to
the thermopower.
The thermal conductivity has been found to be very similar to previous results. The
thermal Hall gradient could not be resolved within the experimental resolution. Therefore,
an estimate of the electronic contribution to the thermal conductivity and consequently
a decision on the origin of the enhanced thermal conductivity below 9 K is not possible.
The investigated components of the thermopower tensor have been found to be strongly
influenced by the pseudogap formation. Both, the thermopower Sb(T ) and the Nernst
coefficient exhibit large negative values below 7 K. While ν(T, B) is weakly field dependent,
the evolution of the thermopower in magnetic fields reflects the gradual suppression of the
gap.
The thermomagnetic performance of CeNiSn is rather poor, mainly due to the large
thermal conductivity of the system. Nevertheless, the moderate resistivity in magnetic
fields and the large Nernst signal realized in this strongly correlated semiconductor show
basic promise for this class of compounds as potential Ettingshausen coolers.
– 141 –

Chapter 6. Towards Ettingshausen cooling: The Nernst effect in CeNiSn
– 142 –

Chapter 7
Summary
This work focused on the thermoelectric transport properties of rare-earth compounds.
Various Ce, Eu, and Yb systems have been studied with respect to both potential appli-
cations and fundamental questions.
Correlated cage compounds have been proposed to be promising for thermoelectric
refrigeration. In this work several newly synthesized clathrates were studied. However,
the incorporation of rare-earth elements into the caged structure remains difficult. In the
case of Ba8−xEuxGe43�3 and Ba8−xEuxCu16P30 no complete occupancy of a lattice site by
Eu could be achieved. The resulting Ba/Eu disorder is seen in various physical properties.
The small sample size obviated measurements of the thermoelectric transport properties.
However, the metal-like resistivities suggest a low thermopower for the investigated sam-
ples. The potassic clathrates K6Eu2Ga10Ge36, K6Eu2Zn5Ge41, and K6Eu2Cd5Ge41 appear
to be more promising in terms of possible applications. In these systems the smaller
cage of the clathrate-I structure is completely occupied by Eu. Magnetic measurements
suggest the possibility of a reduced magnetic moment and a low charge-carrier concen-
tration at low temperatures. In combination with the semiconductor-like resistivity of
K6Eu2Cd5Ge41 these observations could probably motivate further investigations. The
sensitivity to moisture and air, however, is disadvantageous for the handling of the ma-
terial. Altogether, none of the new clathrates turned out very promising with regard
to thermoelectric applications. In particular, the synthesis of clean and stoichiometric
clathrate materials with full occupancy of the cages by a rare-earth element remains chal-
lenging. To overcome these difficulties, the search for correlated cage compounds recently
focused on new structural types. In this work the skutterudite-like compound Ce3Rh4Sn13
has been presented. A report of high displacement parameters for the Sn(2) position sug-
gested a low lattice thermal conductivity for this structure type. The present specific-heat
and resistivity measurements on the nonmagnetic reference compound La3Rh4Sn13 clearly
substantiate the existence of local vibrations of the Sn(2) atoms. Furthermore, thermal
transport measurements on Ce3Rh4Sn13 confirmed the expected low thermal conductivity
for this system. An application of the compound as a thermoelectric material is excluded
– 143 –

Chapter 7. Summary
due to the low thermopower. Despite a large magnetic contribution to the resistivity, which
is indicative of electronic correlations, no enhanced values are observed in S(T ) around
the Kondo temperature TK = 2 K. It is suggested that the magnetic ordering at lower T
precludes a large thermopower near TK. Thus the present study supports the capability
of the Ce3Rh4Sn13 structure type. Investigations on isostructural rare-earth systems are
needed to closer explore the potential of this class of compounds for applications.
Another important topic of this work was the determination of the Kondo and CEF
energy scales of various Ce- and Yb-based heavy-Fermion (HF) systems by means of
thermopower measurements. For these materials Kondo interaction and CEF excitations
usually give rise to large anomalies in S(T ). In the case of the Yb Kondo-lattice com-
pounds YbRh2(Si1−xGex)2 and YbIr2Si2 the Kondo and CEF energy scales could not be
separated, presumably due to their relative vicinity. This assumption was confirmed from
investigations on Lu1−xYbxRh2Si2. The substitution of Yb by Lu is accompanied by a
weak lowering of TK. For Yb concentrations x ≤ 0.44 a separation of the effects of Kondo
scattering from the ground state and thermally populated CEF levels in S(T ) is possi-
ble. A similar effect was observed for the magnetic contribution to the resistivity. The
thermopower data were used to determine the evolution of Kondo and CEF energy scales
upon substitution. While the CEF splitting is independent of x, TK increases with Yb
concentration. An extrapolation of the results to x = 1 yields a Kondo temperature of
TK = 29 K for YbRh2Si2. A second substitution series, which has been investigated using
thermopower measurements, is CexLa1−xNi2Ge2 (x ≤ 0.8). For this system S(T ) shows
well separated contributions due to Kondo scattering on the ground state and thermally
populated CEF levels. The large positive thermopower values at low T exclude the pres-
ence of a multichannel Kondo effect in the series as a cause for the observed NFL behavior.
The evolution of the thermopower curves upon substitution is in accordance with only one
of the two CEF level schemes proposed for CeNi2Ge2, namely doublets at 0-250-350 K.
The splitting is only weakly altered by the Ce/La exchange. The observed lowering of
TK with decreasing Ce content can be understood from the lattice expansion in the frame
of the compressible Kondo model. Thus, thermopower investigations have been applied
successfully to determine the Kondo and CEF energy scales of Ce- and Yb-based HF sys-
tems. They have proven a suitable complement to specific-heat and neutron-scattering
experiments, which is of particular importance for compounds, which exhibit pronounced
NFL behavior at low T .
Kondo semimetals, such as CeNiSn, have been claimed to be promising materials for
thermomagnetic refrigeration. In this work, measurements of the thermal conductivity,
thermopower, Nernst coefficient and thermal Hall effect of CeNiSn have been presented.
These investigations were performed in a new home-made apparatus, which was installed
during this work. The setup was optimized to measure the afore mentioned thermomag-
netic transport properties on small samples and samples with a low thermal conductance.
The thermopower and Nernst coefficient can be determined between 1.5 and 250 K in
– 144 –

fields up to 7 T. Investigations of the thermal conductivity and thermal Hall effect are
presently restricted to the temperature range above 7 K. The reliability of the new setup
was demonstrated by measurements on a Ni standard sample. These investigations veri-
fied the significantly enhanced resolution of the data compared to the commercial PPMS.
The high quality of the data proved valuable for the thermomagnetic transport study
performed on CeNiSn with the heat current applied along b. Thermal conductivity mea-
surements yielded similar results as previous investigations. The thermal Hall gradient
could not be resolved within the experimental resolution. A strong thermal Hall effect
is therefore excluded for the investigated orientation of CeNiSn. The thermopower of
CeNiSn is known to be highly anisotropic. The close agreement of the zero-field data for
Sb obtained on two samples therefore confirmed the precise orientation of the investigated
crystals. The magnetic field dependence of Sb was studied for B ‖ a and c, whereas the
Nernst contribution to the thermopower signal arising from a misalignment of the con-
tacts was eliminated. This in-field antisymmetric signal turned out to be considerable for
B � 2 T. The reported variation in the thermopower data of CeNiSn is therefore sug-
gested to partly arise from slightly misplaced contacts and small deviations from the exact
orientation. The present investigation represents the first systematic study of the field
dependence of Sb with B ‖ a, c. The evolution of the thermopower in magnetic fields was
found to reflect the gradual suppression of the gap. A large negative Nernst coefficient
amounting to −15 μV/KT around 2 K was found for CeNiSn. The Nernst signal in 7 T
for B ‖ a gets close to the value of 156 μV/K required for thermomagnetic applications.
However, due to the large thermal conductivity of the system, the thermomagnetic figure
of merit was found to be rather low. Nevertheless, the large Nernst signal of CeNiSn
in combination with the moderate resistivity in magnetic fields confirms the potential of
strongly correlated semiconductors for Ettingshausen refrigeration.
Thermolectric transport investigations have been used to study several classes of rare-earth
systems. Cage compounds with a low thermal conductivity and large thermopower due
to strong electronic correlations appear promising materials for the use in low-T Peltier
coolers. Correlated semimetals with a large Nernst coefficient arising from the formation
of a gap or pseudogap at the Fermi level show great promise for the application in ther-
momagnetic refrigeration. Furthermore, thermopower investigations were proved to be
suitable method to study the energy scales in Yb- and Ce-based HF systems close to a
quantum critical point.
– 145 –

Chapter 7. Summary
– 146 –

Appendix A
Thermocouple calibration and
manganine correction curves
A.1 Chromel-AuFe0.07% thermocouples
The thermocouple calibration data from 1.5 to 250 K in zero magnetic field (B = 0) was
fitted by a rational function describing S as a function of ln T :
S =B0 + B1 ln T + B2(ln T )2 + B3(ln T )3
1 + C1 lnT + C2(lnT )2 + C3(ln T )3(A.1)
The parameters obtained for the two Chromel-AuFe0.07% thermocouples are as follows:
. .
parameter No. 1 No. 2
B0 6.97521295226327 6.81212388828934B1 -0.0857583226083834 -0.340644593614428B2 -1.44597661968485 -1.28768502689732B3 0.290305765437944 0.268614733462200C1 -0.531256061958305 -0.564153806129804C2 0.0707177057556117 0.0873119800394437C3 0.00237546867112441 0.000171246108325248
. .
A field calibration of the thermocouples was performed from 1 T to 7 T in steps of 1 T.
The thermopower in 7 T was determined from 1.5 to 200 K. In smaller fields the ther-
mopower was measured in a limited temperature range. For the determination of the
calibration curves a linear extrapolation between adjacent fields was used. The change of
the thermopower in magnetic fields ΔSB = S(B) − S(0) was fitted by a rational function
of√
ln T :
ΔSB =B0 + B1(ln T )0.5 + B2(ln T )1 + B3(ln T )1.5
1 + C1(ln T )0.5 + C2(ln T )1 + C3(lnT )1.5 + C4(ln T )2(A.2)
The parameters obtained for the two Chromel-AuFe0.07% thermocouples in different fields
are as follows:
– 147 –

Appendix A. Thermocouple calibration and manganine correction curves
field parameter No. 1 No. 2
B = 1 T B0 -25.2647977122461 -17.7472717154464B1 12.0067868513277 11.1490374291513B2 3.82776583019236 1.08899986147772B3 0.0 0.0C1 -109.996313078836 -72.2506431494731C2 173.604581822759 108.846550426179C3 -81.07763567786525 -47.0526828774310C4 0.0 0.0
B = 2 T B0 1.00196881386218 1.44862776142777B1 -0.0802532049060835 -0.245147355906702B2 -0.674008480169659 -0.853421153760902B3 0.199488430585232 0.261653391664939C1 -0.868298265118022 0.0779539292421923C2 -0.328281578565358 -1.95052672211952C3 0.559277957274084 1.51092472092050C4 -0.0808394699722772 -0.249684589587515
B = 3 T B0 -0.111334489733906 2.47522645781055B1 2.80246396331096 0.238632400377822B2 -2.62455328800703 -1.52329157976912B3 0.575873271116607 0.259729333811356C1 -1.89114935278391 0.374854447901890C2 2.20506826234895 -0.661585658075346C3 -1.52383144006155 -0.784551515941243C4 0.463342948734636 0.654818261315505
B = 4 T B0 92.1075652923269 70.6475109596300B1 -400.822213731168 -334.280027670894B2 317.084875471888 269.322749492821B3 -65.1064325017720 -55.8258674648034C1 -129.217596488868 -121.495913694813C2 179.796859988989 167.910300195043C3 -73.0949727849689 -66.9908950854905C4 2.26026365420435 1.91535930225499
B = 5 T B0 -0.604686418582230 0.755539348605029B1 4.76852640431147 -0.149624419187520B2 -2.52481839684255 3.11952494394471B3 -0.0924149331645879 -2.00339614424158C1 0.385578601838240 0.842000487422302C2 -0.547438865701404 0.621487967676717C3 -1.12719220254739 -3.46761653959990C4 0.815945315781805 1.76628851893218
– 148 –

A.2. Chromel-Constantan thermocouple
field parameter No. 1 No. 2
B = 6 T B0 -0.652525584962259 -418.318306511198B1 1.72001201609224 1167.90463039347B2 0.429650862521162 -358.264813564651B3 -0.728093710349081 -111.895443512281C1 -2.32506276712048 887.922716033754C2 3.76081811514229 -1106.18924266406C3 -3.20283152135679 264.750133801079C4 1.02338489839065 75.3912096724370
B = 7 T B0 -99.3357053364413 -99.2671567251699B1 185.677876321917 181.881392604865B2 -23.7163434011766 -22.2343173236130B3 -30.2179339248238 -29.8190709088895C1 33.7204477481197 35.1897356224711C2 12.7493421619087 7.78156568822804C3 -66.0468209979983 -61.1400420895380C4 31.1406937449798 29.4234958236086
. .
A.2 Chromel-Constantan thermocouple
The thermocouple calibration data between 7 and 250 K was fitted by a polynomial of 8th
order describing S as a function of ln T :
S = C0 + C1 ln T + C2(ln T )2 + C3(ln T )3 + C4(ln T )4 +
+ C5(ln T )5 + C6(ln T )6 + C7(lnT )7 + C8(ln T )8 (A.3)
.
parameter value
C0 -108.2931C1 279.1288C2 -307.7748C3 190.2665C4 -71.8006C5 16.9315C6 -2.4380C7 0.1962C8 -0.0068
.
– 149 –
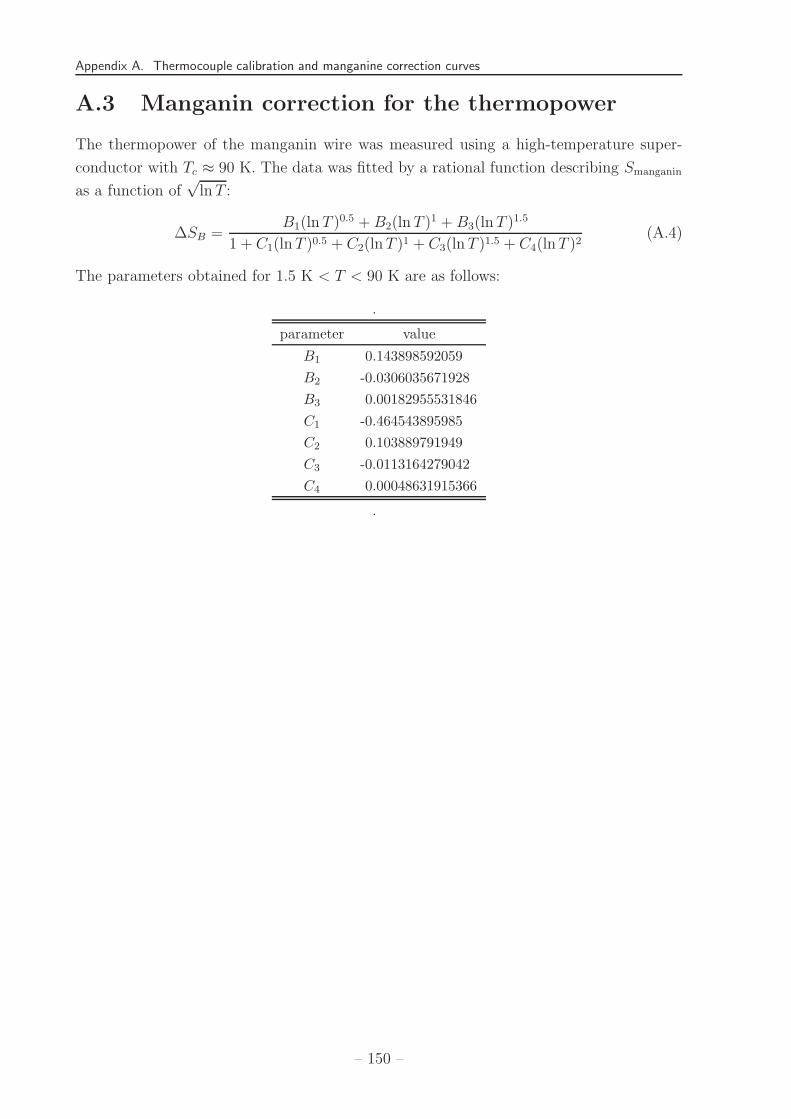
Appendix A. Thermocouple calibration and manganine correction curves
A.3 Manganin correction for the thermopower
The thermopower of the manganin wire was measured using a high-temperature super-
conductor with Tc ≈ 90 K. The data was fitted by a rational function describing Smanganin
as a function of√
ln T :
ΔSB =B1(ln T )0.5 + B2(ln T )1 + B3(ln T )1.5
1 + C1(ln T )0.5 + C2(ln T )1 + C3(ln T )1.5 + C4(lnT )2(A.4)
The parameters obtained for 1.5 K < T < 90 K are as follows:
.
parameter value
B1 0.143898592059B2 -0.0306035671928B3 0.00182955531846C1 -0.464543895985C2 0.103889791949C3 -0.0113164279042C4 0.00048631915366
.
– 150 –

Bibliography
[1] S. Paschen. Thermoelectric aspects of strongly correlated electron systems. In: Ther-
moelectrics handbook: macro to nano (Chapter 15). D. M. Rowe, ed., CRC Press,
Taylor & Francis Group, Boca Raton, FL, 2006.
[2] J. Sommerlatte, K. Nielsch, and H. Bottner. Thermoelektrische Multitalente. Physik
Journal, 6(5):35, 2007.
[3] R. Bel, K. Behnia, Y. Nakajima, K. Izawa, Y. Matsuda, H. Shishido, R. Settai, and
Y. Onuki. Giant Nernst effect in CeCoIn5. Phys. Rev. Lett., 92(21):217002, 2004.
[4] K. Behnia, M.-A. Measson, and Y. Kopelevich. Nernst effect in semimetals: The
effective mass and figure of merit. Phys. Rev. Lett., 98:076603, 2007.
[5] A. Abragam and B. Bleaney. Electron Paramagnetic Resonance of Transition Ions.
Dover Publications, Inc., New York, 1986.
[6] J. A. Mydosh. Spin glasses: An experimental introduction. Taylor & Francis, London,
1993.
[7] S. Sullow, M. C. Aronson, B. D. Rainford, and P. Haen. Doniach phase diagram, re-
visited: From ferromagnet to Fermi liquid in pressurized CeRu2Ge2. Phys. Rev. Lett.,
82(14):2963, 1999.
[8] S. Doniach. The Kondo lattice and weak antiferromagnetism. Physica B, 91:231,
1977.
[9] M. Ocko, D. Drobac, B. Buschinger, C. Geibel, and F. Steglich. Transport properties
of the CexLa1−xCu2.05Si2 heavy-fermion alloy system. Phys. Rev. B, 64:195106, 2001.
[10] J. Plessel. Hochdruckuntersuchungen an Yb-Kondo-Gitter-Systemen in der Nahe
einer magnetischen Instabilitat. PhD thesis, University of Koln, 2002.
[11] A. C. Hewson. The Kondo problem to heavy fermions. Cambridge Univ. Press,
Cambridge, 1993.
– 151 –

Bibliography
[12] A. Fukuda, Y. Nakanuma, J. Sakurai, A. Mitsuda, Y. Isikawa, F. Ishikawa, T. Goto,
and T. Yamamoto. Application of Doniach diagram on valence transition in
EuCu2(SixGe1−x)2. J. Phys. Soc. Jap., 72(12):3189, 2003.
[13] G. Knebel, M. Brando, J. Hemberger, M. Nicklas, W. Trinkl, and A. Loidl. Magnetic,
calorimetric, and transport properties of Ce(Pd1−xNix)2Ge2 and CeNi2(Ge1−ySiy)2.
Phys. Rev. B, 59(19):12390, 1999.
[14] D. Jaccard, K. Behnia, and J. Sierro. Pressure induced heavy fermion superconduc-
tivity of cecu2ge2. Phys. Lett. A, 163:435, 1992.
[15] K. Hanzawa, K. Yamada, and K. Yosida. Orbital degeneracy effect on the dense
Kondo state in real systems. J. Magn. Magn. Mater., 47-48:357, 1985.
[16] B. Cornut and B. Coqblin. Influence of the crystalline field on the Kondo effect of
alloys and compounds with Ce impurities. Phys. Rev. B, 5(11):4541, 1972.
[17] P. Wachter and G. Travaglini. Intermediate valence and the hybridization model: A
study on SmB6, ”gold” SmS and YbB12. J. Magn. Magn. Mater., 47-48:423, 1985.
[18] J. C. Garland and R. Bowers. Evidence for electron-electron scattering in the low-
temperature resistivity of simple metals. Phys. Rev. Lett., 21(14):1007, 1968.
[19] E. Bauer and R. Hauser. Highly correlated electron systems: The Kondo problem
to heavy fermions. A script for a lecture given at the Vienna Technical University,
Austria, summer semester 2003.
[20] E. Miranda, V. Dobrosavljevic, and G. Kotliar. Kondo disorder: a possible route
towards non-Fermi-liquid behaviour. J. Phys.: Condens. Matter, 8:9871, 1996.
[21] R. B. Griffiths. Nonanalytic behavior above the critical point in a random Ising
ferromagnet. Phys. Rev. Lett., 23(1):17, 1969.
[22] A. H. Castro Neto, G. Castilla, and B. A. Jones. Non-Fermi liquid behavior and
Griffiths phase in f -electron compounds. Phys. Rev. Lett., 81(16):3531, 1998.
[23] J. A.Hertz. Quantum critical phenomena. Phys. Rev. B, 14(3):1165, 1976.
[24] A. J. Millis. Effect of a nonzero temperature on quantum critical points in itinerant
fermion systems. Phys. Rev. B, 48(10):7183, 1993.
[25] Q. Si, S. Rabello, K. Ingersent, and J. L. Smith. Locally critical quantum phase
transitions in strongly correlated metals. Nature, 413:804, 2001.
[26] P. Coleman, C. Pepin, Q. Si, and R. Ramazashvili. Locally critical quantum phase
transitions in strongly correlated metals. J. Phys.: Condens. Matter, 13:R723, 2001.
– 152 –

Bibliography
[27] G. R. Stewart. Non-Fermi-liquid behavior in d- and f-electron metals.
Rev. Mod. Phys., 73:797, 2001.
[28] D. L. Cox and A. Zawadowski. Exotic Kondo effects in metals: Magnetic ions in a
crystalline electric field and tunneling centers. Adv. Phys., 47:599, 1998.
[29] P. Nozieres and A. Blandin. Kondo effect in real metals. J. Physique, 41:193, 1980.
[30] H. v. Lohneysen. Fermi-Flussigkeiten aus stark korrelierten Elektronen. Phys. Bl.,
51:941, 1995.
[31] G. Aeppli and Z. Fisk. Kondo insulators. Comments Cond. Mat. Phys., 16(3):155,
1992.
[32] G. Nakamoto, T. Takabatake, Y. Bando, H. Fujii, K. Izawa, T. Suzuki, T. Fujita,
A. Minami, I. Oguro, L. T. Tai, and A. A. Menovsky. Effect of impurity phases on
the anisotropic transport properties of CeNiSn. Physica B, 206&207:840, 1995.
[33] T. Takabatake, F. Iga, T. Yoshino, Y. Echizen, K. Katoh, K. Kobayashi, M. Higa,
N. Shimizu, Y. Bando, G. Nakamoto, H. Fujii, K. Izawa, T. Suzuki, T. Fujita,
M. Sera, M. Hiroi, K. Maezawa, S. Mock, H. v. Lohneysen, A. Bruckl, K. Neumaier,
and K. Andres. Ce- and Yb-based Kondo semiconductors. J. Magn. Magn. Mater.,
177-181:277, 1998.
[34] L. Onsager. Reciprocal relations in irreversible processes. I. Phys. Rev., 37:405,
1931.
[35] R. Berman. Thermal Conduction in Solids. Oxford University Press, Oxford, 1976.
[36] F. J. Blatt, P. A. Schroeder, C. L. Foiles, and D. Greig. Thermoelectric Power of
Metals. Plenum Press, New York, 1976.
[37] K. Behnia, D. Jaccard, and J. Flouquet. On the thermoelectricity of correlated
electrons in the zero-temperature limit. J. Phys.: Condens. Matter, 16:5187, 2004.
[38] K. Miyake and H. Kohno. Theory of quasi-universal ratio of Seebeck coefficient
to specific heat in zero-temperature limit in correlated metals. J. Phys. Soc. Jpn.,
74(1):254, 2005.
[39] N. E. Bickers, D. L. Cox, and J. W. Wilkins. Self-consistent large-N expansion for
normal-state properties of dilute magnetic alloys. Phys. Rev. B, 36(4):2036, 1987.
[40] G. D. Mahan. Seebeck coefficient for the Anderson model. Phys. Rev. B,
56(18):11833, 1997.
[41] V. Zlatic and R. Monnier. Theory of the thermoelectricity of intermetallic com-
pounds with Ce or Yb ions. Phys. Rev. B, 71:165109, 2005.
– 153 –

Bibliography
[42] D. Huo, J. Sakurai, T. Kuwai, T. Mizushima, and Y. Isikawa. Heavy fermion be-
havior in Ce(NixPd1−x)2Si2. J. Appl. Phys., 89(11):7634, 2001.
[43] A. K. Bhattacharjee and B. Coqblin. Thermoelectric power of compounds with
cerium: Influence of the crystalline field on the Kondo effect. Phys. Rev. B,
13(8):3441, 1976.
[44] S. Maekawa, S. Kashiba, M. Tachiki, and S. Takahashi. Thermopower in Ce Kondo
systems. J. Phys. Soc. Jap., 55(9):3194, 1986.
[45] D. Huo, J. Sakurai, O. Maruyama, T. Kuwai, and Y. Isikawa. Transport properties
of Ce(NixPd1−x)2Si2. J. Magn. Magn. Mater., 226-230:202, 2001.
[46] H. Wilhelm, D. Jaccard, V. Zlatic, R. Monnier, B. Delley, and B. Coqblin. High-
pressure transport properties of CeRu2Ge2. J. Phys.: Condens. Matter, 17:S823,
2005.
[47] H. Wilhelm and D. Jaccard. Probing the phase diagram of CeRu2Ge2 by ther-
mopower at high pressure. Phys. Rev. B, 69:214408, 2004.
[48] K. Alami-Yadri, D. Jaccard, and D. Andreica. Thermopower of Yb heavy fermion
compounds at high pressure. J. Low Temp. Phys., 114(1/2):135, 1999.
[49] D. Andreica, K. Alami-Yadri, D. Jaccard, A. Amato, and A. Schenck. Transport
properties and μSR spectroscopy of Yb(NixCu1−x)2Si2. Physica B, 259-261:144, 1999.
[50] T.-S. Kim and D. L. Cox. Theory of one-channel versus multichannel Kondo effects
for Ce3+ impurities. Phys. Rev. Lett., 75(8):1622, 1995.
[51] I. M. Tsidilkovskii. Thermomagnetic Effects in Semiconductors. Infosearch, London,
1962.
[52] D. R. Lovett and D. W. G. Ballentyne. The Righi-Leduc effect in cadmium arsenide.
Brit. J. Appl. Phys., 18:1399, 1967.
[53] B. Zeini, A. Freimuth, B. Buchner, R. Gross, A. P. Kampf, M. Klaser, and G. Muller-
Vogt. Righi-Leduc effect in Y- and Bi-based high-Tc superconductors. Physica C,
317-318:325, 1999.
[54] B. Zeini, A. Freimuth, B. Buchner, R. Gross, A. P. Kampf, M. Klaser, and G. Muller-
Vogt. Separation of quasiparticle and phononic heat currents in YBa2Cu3O7−δ.
Phys. Rev. Lett., 82(10):2175, 1999.
[55] E. K. Sichel and B. Serin. The Righi-Leduc effect in superconductors. J. Low
Temp. Phys., 24(1/2):145, 1976.
– 154 –

Bibliography
[56] H. Mette, W. W. Gartner, and C. Loscoe. Nernst and Ettingshausen effects in
germanium between 300 and 750◦K. Phys. Rev., 115(3):537, 1959.
[57] S. J. Silverman, R. O. Carlson, and H. Ehrenreich. Nernst effect in n-type GaSb.
J. Appl. Phys., 34(3):456, 1963.
[58] A. V. Ettingshausen and W. Nernst. Ueber das Auftreten electromotorischer Krafte
in Metallplatten, welche von einem Warmestrome durchflossen werden und sich im
magnetischen Felde befinden. Wied. Ann., 29:343, 1886.
[59] E. H. Sondheimer. The theory of the galvanomagnetic and thermomagnetic effects
in metals. Proc. Roy. Soc. (London) A, 193:484, 1948.
[60] J. Clayhold. Nernst effect in anisotropic metals. Phys. Rev. B, 54(9):6103, 1996.
[61] V. Oganesyan and I. Ussishkin. Nernst effect, quasiparticles, and d-density waves in
cuprates. Phys. Rev. B, 70:054503, 2004.
[62] R. Bel, H. Jin, K. Behnia, J. Flouquet, and P. Lejay. Thermoelectricity of URu2Si2:
Giant Nernst effect in the hidden-order state. Phys. Rev. B, 70:220501, 2004.
[63] R. Suryanarayanan, V. Gasumyants, and N. Ageev. Giant Nernst effect in
La0.88MnO3 and La0.7Ca0.3MnO3. J. Magn. Magn. Mater., 211:226, 2000.
[64] R. Bel, K. Behnia, and H. Berger. Ambipolar Nernst effect in NbSe2.
Phys. Rev. Lett., 91(6):066602, 2003.
[65] T. T. M. Palstra, B. Batlogg, L. F. Schneemeyer, and J. V. Waszczak. Transport
entropy of vortex motion in YBa2Cu3O7. Phys. Rev. Lett., 64(25):3090, 1990.
[66] S. J. Hagen, C. J. Lobb, R. L. Greene, M. G. Forrester, and J. Talvacchio. Flux-flow
Nernst effect in epitaxial YBa2Cu3O7. Phys. Rev. B, 42(10):6777, 1990.
[67] H.-C. Ri, R. Gross, F. Gollnik, A. Beck, R. P. Huebener, P. Wagner, and
H. Adrian. Nernst, Seebeck and Hall effects in the mixed state of YBa2Cu3O7−δ
and Bi2Sr2CaCu2O8+x thin films: A comparative study. Phys. Rev. B, 50(5):3312,
1994.
[68] Y. Wang, Z. A. Xu, T. Kakeshita, S. Uchida, S. Ono, Y. Ando, and N. P. Ong. Onset
of the vortexlike Nernst signal above Tc in La2−xSrxCuO4 and Bi2Sr2−yLayCuO6.
Phys. Rev. B, 64:224519, 2001.
[69] H. Nakamura, N. Hatano, and R. Shirasaki. Quantum Nernst effect. Solid State
Commun., 135:510, 2005.
[70] K. Behnia, M.-A. Measson, and Y. Kopelevich. Oscillating Nernst-Ettingshausen
effect in Bismuth across the quantum limit. Phys. Rev. Lett., 98:166602, 2007.
– 155 –

Bibliography
[71] M. Deppe. Einkristallzuchtung und Untersuchung der magnetischen Eigenschaften
des Schwere-Fermion-Systems CeCu2(Si1−xGex)2. PhD thesis, Techn. Univ. of Dres-
den, 2004.
[72] A. Bentien. Transport and magnetic properties of rare-earth containing clathrates
and clathrate-like compounds. PhD thesis, Techn. Univ. of Dresden, 2004.
[73] O. Maldonado. Pulse method for simultaneous measurement of electric thermopower
and heat conductivity at low temperatures. Cryogenics, 32(10):908, 1992.
[74] J. G. Hust, R. L. Powell, and L. L. Sparks. Methods for cryogenic thermocouple ther-
mometry. In: Temperature. Its Measurement and Control in Science and Industry
(Vol. 4). Instrument Society of America, Pittsburgh, pp. 1525-1535, 1972.
[75] A. von Middendorff. Thermocouples at low temperatures in high magnetic fields.
Cryogenics, 11(4):318, 1971.
[76] A. V. Inyushkin, K. Leicht, and P. Esquinazi. Magnetic field dependence of the
sensitivity of a type E (chromel-constantan) thermocouple. Cryogenics, 38(3):299,
1998.
[77] D. R. Lide, editor. CRC Handbook of Chemistry and Physics. CRC Press LLC, pp.
193-195, 1997.
[78] B. Sundqvist. Thermal diffusivity and thermal conductivity of Chromel, Alumel,
and Constantan in the range 100-450 K. J. Appl. Phys., 72(2):539, 1992.
[79] R. Berman and D. J. Huntley. Dilute gold-iron alloys as thermocouple material for
low temperature heat conductivity measurements. Cryogenics, 3:70, 1963.
[80] R. L. Rosenbaum. Some properties of gold-iron thermocouple wire. Rev. Sci. Instr.,
39(6):890, 1968.
[81] G. Heine and W. Lang. Magnetoresistance of the new ceramic ”Cernox” thermometer
from 4.2 K to 300 K in magnetic fields up to 13 T. Cryogenics, 38(4):377, 1997.
[82] B. L. Brandt, D. W. Liu, and L. G. Rubin. Low temperature thermometry in high
magnetic fields. VII. CernoxTM sensors to 32 T. Rev. Sci. Instr., 70(1):104, 1999.
[83] The thermocouple calibration curves have been taken from www.lakeshore.com. Lake
Shore Cryotronics Inc.
[84] T. Knittel. Thermoelectric power dependence of a gold-iron alloy wire on the mag-
netic field orientation. Cryogenics, 13(6):370, 1973.
[85] K. D. D. Rathnayaka. Thermoelectric power of manganin. J. Phys. E: Sci. Instrum.,
18:380, 1985.
– 156 –

Bibliography
[86] G. S. Nolas, G. A. Slack, and S. B. Schujman. Semiconductor clathrates: A phonon
glass electron crystal material with potential for thermoelectric applications. Semi-
conductors & Semimetals, 69:255, 2001.
[87] B. C. Sales, D. Mandrus, and R. K. Williams. Filled skutterudite antimonides: A
new class of thermoelectric materials. Science, 272:1325, 1996.
[88] G. S. Nolas and C. A. Kendziora. Raman scattering study of Ge and Sn compounds
with type-I clathrate hydrate crystal structure. Phys. Rev. B, 62(11):7157, 2000.
[89] S. Paschen, W. Carrillo-Cabrera, A. Bentien, V. H. Tran, M. Baenitz, Yu. Grin, and
F. Steglich. Structural, transport, magnetic, and thermal properties of Eu8Ga16Ge30.
Phys. Rev. B, 64:214404, 2001.
[90] H. Kawaji, H. Horie, S. Yamanaka, and M. Ishikawa. Superconductivity in the silicon
clathrate compound (Na,Ba)xSi46. Phys. Rev. Lett., 74(8):1427, 1995.
[91] F. M. Grosche, H. Q. Yuan, W. Carrillo-Cabrera, S. Paschen, C. Langhammer,
F. Kromer, G. Sparn, M. Baenitz, Yu. Grin, and F. Steglich. Superconductivity in
the filled cage compounds Ba6Ge25 and Ba4Na2Ge25. Phys. Rev. Lett., 87(24):247003,
2001.
[92] C. Cros, M. Pouchard, and P. Hagenmuller. Sur une nouvelle famille de clathrates
mineraux isotypes des hydrates de gaz et de liquides. Interpretation des resultats
obtenus. J. Solid State Chem., 2:570, 1970.
[93] J. D. Dunitz, V. Schomaker, and K. N. Trueblood. Interpretation of atomic dis-
placement parameters from diffraction studies of crystals. J. Phys. Chem., 92:856,
1988.
[94] J. Gryko, P. F. McMillan, R. F. Marzke, G. K. Ramachandran, D. Patton, S. K.
Deb, and O. F. Sankey. Low-density framework form of crystalline silicon with a
wide optical band gap. Phys. Rev. B, 62(12):R7707, 2000.
[95] G. S. Nolas, J. L. Cohn, G. A. Slack, and S. B. Schujman. Semiconducting Ge
clathrates: Promising candidates for thermoelectric applications. Appl. Phys. Lett.,
73(2):178, 1998.
[96] B. C. Sales, B. C. Chakoumakos, R. Jin, J. R. Thompson, and D. Mandrus. Struc-
tural, magnetic, thermal, and transport properties of X8Ga16Ge30 (X = Eu, Sr, Ba)
single crystals. Phys. Rev. B, 63:245113, 2001.
[97] B. C. Sales. Smaller is cooler. Science, 295:1248, 2002.
– 157 –

Bibliography
[98] Ya. Mudryk, P. Rogl, C. Paul, S. Berger, E. Bauer, G. Hilscher, C. Godart, H. Noel,
A. Saccone, and R. Ferro. Crystal chemistry and thermoelectric properties of
clathrates with rare-earth substitution. Physica B, 328:44, 2003.
[99] A. Bentien, A. E. C. Palmqvist, J. D. Bryan, S. Latturner, G. D. Stucky, L. Furenlid,
and B. B. Iversen. Experimental charge densities of semiconducting cage structures
containing alkaline earth guest atoms. Angw. Chem. Int. Ed., 39(20):3613, 2000.
[100] B. C. Chakoumakos, B. C. Sales, D. G. Mandrus, and G. S. Nolas. Structural
disorder and thermal conductivity of the semiconducting clathrate Sr8Ga16Ge30. J.
Alloys Compd., 296:80, 2000.
[101] R. P. Hermann, V. Keppens, P. Bonville, G. S. Nolas, F. Grandjean, G. J. Long,
H. M. Christen, B. C. Chakoumakos, B. C. Sales, and D. Mandrus. Direct ex-
perimental evidence for atomic tunneling of europium in crystalline Eu8Ga16Ge30.
Phys. Rev. Lett., 97:017401, 2006.
[102] A. Bentien, B. B. Iversen, J. D. Bryan, G. D. Stucky, A. E. C. Palmqvist, A. J.
Schultz, and R. W. Henning. Maximum entropy method analysis of thermal motion
and disorder in thermoelectric clathrate Ba8Ga16Si30. J. Appl. Phys., 91(9):5694,
2002.
[103] G. A. Slack. New materials and performance limits for thermoelectric cooling. In:
CRC Handbook of thermoelectrics (Chapter 34). D. M. Rowe, ed., CRC Press, Taylor
& Francis Group, Boca Raton, FL, 1995.
[104] F. Bridges and L. Downward. Possible mechanism for achieving glass-like thermal
conductivities in crystals with off-center atoms. Phys. Rev. B, 70:140201(R), 2004.
[105] I. Zerec, V. Keppens, M. A. McGuire, D. Mandrus, B. C. Sales, and P. Thalmeier.
Four-well tunneling states and elastic response of clathrates. Phys. Rev. Lett.,
92(18):185502, 2004.
[106] I. Zerec and P. Thalmeier. Tunneling states in Eu8Ga16Ge30. Physica B, 359-361:208,
2005.
[107] H. Schafer. On the problem of polar intermetallic compounds: The stimulation of
E. Zintl’s work for the modern chemistry of intermetallics. Ann. Rev. Mater. Sci.,
15:1, 1985.
[108] J. Dunner and A. Mewis. Ba8Cu16P30 - eine neue ternare Variante des Clathrat
I-Strukturtyps. Z. anorg. allg. Chem., 621:191, 1995.
[109] K. Umeo, M. A. Avila, T. Sakata, K. Suekuni, and T. Takabatake. Probing glasslike
excitations in single-crystalline Sr8Ga16Ge30 by specific heat and thermal conductiv-
ity. J. Phys. Soc. Jpn., 74(8):2145, 2005.
– 158 –

Bibliography
[110] S. Paschen, V. Pacheco, A. Sanchez, W. Carrillo-Cabrera, M. Baenitz, B. B. Iversen,
Yu. Grin, and F. Steglich. Are type-I clathrates Zintl phases and ’phonon glasses
and electron single crystals’. Physica B, 328:39, 2003.
[111] Y. Zhang, P. L. Lee, G. S. Nolas, and A. P. Wilkinson. Gallium distribution in the
clathrates Sr8Ga16Ge30 and Sr4Eu4Ga16Ge30 by resonant diffraction. Appl. Phys.
Lett., 80(16):2931, 2002.
[112] S. Paschen, S. Budnyk, U. Kohler, Yu. Prots, K. Hiebl, F. Steglich, and Yu. Grin.
New type-I clathrates with ordered Eu distribution. Physica B, 383:89, 2006.
[113] R. F. W. Herrmann, K. Tanigaki, T. Kawaguchi, S. Kuroshima, and O. Zhou. Elec-
tronic structure of Si and Ge gold-doped clathrates. Phys. Rev. B, 60(19):13245,
1999.
[114] W. Carillo-Cabrera, J. Curda, K. Peters, S. Paschen, M. Baenitz, Yu. Grin, and
H. G. von Schnering. Crystal structure of the defect clatrate-I, Ba8Ge43. Z. Kristal-
logr. NCS, 215:321, 2000.
[115] W. Carrillo-Cabrera, S. Budnyk, Yu. Prots, and Yu. Grin. Ba8Ge43 revisited: a
2a′ × 2a′ × 2a′ superstructure of the clathrate-I type with full vacancy ordering. Z.
Anorg. Allg. Chem., 630:2267, 2004.
[116] W. Carillo-Cabrera, R. Cardoso Gil, S. Paschen, and Yu. Grin. Crystal structure
of barium europium germanide, Ba6−xEuxGe25 (x = 0.6), a chiral clathrate. Z.
Kristallogr. NCS, 218:397, 2003.
[117] R. Demchyna, U. Kohler, Yu. Prots, W. Schnelle, M. Baenitz, U. Burkhardt,
S. Paschen, and U. Schwarz. High-pressure synthesis and physical properties of
the europium-substituted barium clathrate Ba8−xEuxGe43�3 (x ≤ 0.6). Z. Anorg.
Allg. Chem., 632:73, 2006.
[118] S. Paschen, V. H. Tran, M. Baenitz, W. Carrillo-Cabrera, Yu. Grin, and
F. Steglich. Clathrate Ba6Ge25: Thermodynamic, magnetic, and transport prop-
erties. Phys. Rev. B, 65:134435, 2002.
[119] M. Calandra and O. Gunnarsson. Electrical resistivity at large temperatures: Sat-
uration and lack thereof. Phys. Rev. B, 66:205105, 2002.
[120] D. Huo, T. Sasakawa, Y. Muro, and T. Takabatake. Thermoelectric properties of a
clathrate compound Ba8Cu16P30. Appl. Phys. Lett., 82(16):2640, 2003.
[121] J. P. Remeika, G. P. Espinosa, A. S. Cooper, H. Barz, J. M. Rowell, D. B. McWhan,
J. M. Vandenberg, D. E. Moncton, Z. Fisk, L. D. Woolf, H. C. Hamaker, M. B.
Maple, G. Shirane, and W. Thomlinson. A new familiy of ternary intermetallic
superconducting/magnetic stannides. Solid State Commun., 34:923, 1980.
– 159 –

Bibliography
[122] D. Niepmann, R. Pottgen, K. M. Poduska, F. J. DiSalvo, H. Trill, and B. D. Mosel.
Structure and properties of the stannides CeAuSn, Ce3Rh4Sn13, and Ce3Ir4Sn13.
Z. Naturforsch., 56b:1, 2001.
[123] U. Kohler, A. P. Pikul, N. Oeschler, T. Westerkamp, A. M. Strydom, and F. Steglich.
Low-temperature study of the strongly correlated compound Ce3Rh4Sn13. J. Phys.:
Condens. Matter, 19:386207, 2007.
[124] C. U. Segre, H. F. Braun, and K. Yvon. Properties of Y3Ru4Ge13 and isotypic
compounds. Ternary Superconductors, page 243, 1981.
[125] H. Sato, T. Fukuhara, S. Iwakawa, Y. Aoki, I. Sakamoto, S. Takayanagi, and
N. Wada. Magnetic and transport properties of RE3Ir4Sn13. Physica B, 186-188:630,
1993.
[126] S. Takayanagi, H. Sato, T. Fukuhara, and N. Wada. Two magnetic transitions in
Ce3Ir4Sn13. Physica B, 199&200:49, 1994.
[127] C. Israel, E. M. Bittar, O. E. Aguero, R. R. Urbano, C. Rettori, I. Torriani, P. G.
Pagliuso, N. O. Moreno, J. D. Thompson, M. F. Hundley, J. L. Sarrao, and H. A.
Borges. Crystal structure and low-temperature physical properties of R3M4Sn13 (R
= Ce, La; M = Ir, Co) intermetallics. Physica B, 359-361:251, 2005.
[128] C. Nagoshi, H. Sugawara, Y. Aoki, S. Sakai, M. Kohgi, H. Sato, T. Onimaru,
and T. Sakakibara. Anomalous phase transitions in the heavy fermion compound
Ce3Ir4Sn13. Physica B, 359-361:248, 2005.
[129] A. L. Cornelius, A. D. Christianson, J. L. Lawrence, V. Fritsch, E. D. Bauer, J. L.
Sarrao, J. D. Thompson, and P. G. Pagliuso. Observation of field-induced single
impurity behavior in the heavy fermion compound Ce3Co4Sn13. Physica B, 378-
380:113, 2006.
[130] M. F. Hundley, J. L. Sarrao, J. D. Thompson, R. Movshovich, M. Jaime, C. Petrovic,
and Z. Fisk. Unusual Kondo behavior in the indium-rich heavy-fermion antiferro-
magnet Ce3Pt4In13. Phys. Rev. B, 65:024401, 2001.
[131] G. Nakamoto, T. Takabatake, H. Fujii, A. Minami, K. Maezawa, I. Oguro, and A. A.
Menovsky. Crystal growth and characterization of the Kondo semimetal CeNiSn.
J. Phys. Soc. Jpn., 64(12):4834, 1995.
[132] A. M. Strydom, Z. Guo, S. Paschen, R. Viennois, and F. Steglich. Electronic prop-
erties of semiconducting CeRu4Sn6. Physica B, 359-361:293, 2005.
[133] J. G. Sereni. Low temperature behaviors of cerium compounds. Heat capacity of bi-
nary and related intermetallics. In: Handbook on the Physics and Chemistry of Rare
– 160 –

Bibliography
Earths (Vol. XV, Chap. 98). K. A. Gschneider Jr. and L. Eyring, eds., Amsterdam:
North-Holland, 1991.
[134] S. Miraglia, J. L. Hodeau, M. Marezio, C. Laviron, M. Ghedira, and G. P. Espinosa.
Nature of the structural distortion and of the chemical bonding in SnM3Rh4Sn12 (M
= La-Gd, Yb, Ca, Sr, and Th). J. Solid State Chem., 63:358, 1986.
[135] A. Bentien, M. Christensen, J. D. Bryan, A. Sanchez, S. Paschen, F. Steglich,
G. D. Stucky, and B. B. Iversen. Thermal conductivity of thermoelectric clathrates.
Phys. Rev. B, 69:045107, 2004.
[136] D. T. Adroja, A. M. Strydom, A. P. Murani, W. A. Kockelmann, and A. Fraile.
Crystal field excitations in the cubic compound Ce3Rh4Sn13. Physica B, 403:898,
2008.
[137] A. M. Strydom. Thermal and transport properties of the cubic semimetal Y3Ir4Ge13:
on the metallic border of thermoelectric merit. J. Phys.: Condens. Matter,
19:386205, 2007.
[138] A. N. Medina, D. P. Rojas, F. G. Gandra, W. R. Azanha, and L. P. Cardoso. Change
of the Kondo regime in CePd2Al3 induced by chemical substitution: Verification of
the Doniach diagram. Phys. Rev. B, 59(13):8738, 1999.
[139] F. C. Ragel and P. de V. du Plessis. Transition from dense Kondo to the intermediate-
valence regime in the Ce(Pt1−xNix)2Si2 alloys. J. Phys.: Condens. Matter, 16:2647,
2004.
[140] A. V. Goltsev and M. M. Abd-Elmeguid. Origin of the pressure dependence of
the Kondo temperature in Ce- and Yb-based heavy-fermion compounds. J. Phys.:
Condens. Matter, 17:S813, 2005.
[141] J. T. Waber and D. T. Cromer. Orbital radii of atoms and ions. J. Chem. Phys.,
42(12):4116, 1965.
[142] H. Winkelmann, M. M. Abd-Elmeguid, H. Micklitz, J. P. Sanchez, C. Geibel, and
F. Steglich. Pressure-induced local moment magnetism in the nonmagnetic heavy
fermion compound Yb2Ni2Al. Phys. Rev. Lett., 81(22):4947, 1998.
[143] G. Knebel, R. Boursier, E. Hassinger, G. Lapertot, P. G. Niklowitz, A. Pourret,
B. Salce, J. P. Sanchez, I. Sheikin, P. Bonville, H. Harima, and J. Flouquet. Local-
ization of 4f state in YbRh2Si2 under magnetic field and high pressure: Comparison
with CeRh2Si2. J. Phys. Soc. Jpn., 75(11):114709, 2006.
[144] Y. Onuki and T. Komatsubara. Heavy fermion state in CeCu6. J. Magn. Magn.
Mater., 63&64:281, 1987.
– 161 –

Bibliography
[145] J. Custers, P. Gegenwart, H. Wilhelm, K. Neumaier, Y. Tokiwa, O. Trovarelli,
C. Geibel, F. Steglich, C. Pepin, and P. Coleman. The break-up of heavy electrons
at a quantum critical point. Nature, 424(6948):524, 2003.
[146] O. Trovarelli, C. Geibel, S. Mederle, C. Langhammer, F. M. Grosche, P. Gegenwart,
M. Lang, G. Sparn, and F. Steglich. YbRh2Si2: Pronounced non-Fermi-liquid effects
above a low-lying magnetic phase transition. Phys. Rev. Lett., 85(3):626, 2000.
[147] J. Ferstl. From Magnetic Order to Intermediate Valence. PhD thesis, Techn. Univ.
of Dresden, 2007.
[148] S. Mederle, R. Borth, C. Geibel, F. M. Grosche, G. Sparn, O. Trovarelli, and
F. Steglich. An unconventional metallic state in YbRh2(Si1−xGex)2 – a high pressure
study. J. Phys.: Condens. Matter, 14:10731, 2002.
[149] Z. Hossain, C. Geibel, T. Radu, Y. Tokiwa, F. Weickert, C. Krellner, H. Jeevan,
P. Gegenwart, and F. Steglich. Low-temperature properties of the heavy fermion
system YbIr2Si2. Physica B, 378-380:74, 2006.
[150] P. Gegenwart, J. Custers, C. Geibel, K. Neumaier, T. Tayama, K. Tenya,
O. Trovarelli, and F. Steglich. Magnetic-field induced quantum critical point in
YbRh2Si2. Phys. Rev. Lett., 89(5):056402, 2002.
[151] K. D. Schotte and U. Schotte. Interpretation of Kondo experiments in a magnetic
field. Phys. Lett. A, 55(1):38, 1975.
[152] H.-U. Desgranges and K. D. Schotte. Specific heat of the Kondo model. Phys. Lett. A,
91(5):240, 1982.
[153] O. Stockert, M. M. Koza, J. Ferstl, A. P. Murani, C. Geibel, and F. Steglich. Crys-
talline electric field excitations of the non-Fermi-liquid YbRh2Si2. Physica B, 378-
380:157, 2006.
[154] O. Stockert, M. M. Koza, J. Ferstl, C. Geibel, and F. Steglich. Low-energy spin
fluctuations in the non-Fermi-liquid compound YbRh2Si2. Sci. Technol. Adv. Mater.,
8(5):371, 2007.
[155] G. Dionicio, H. Wilhelm, G. Sparn, J. Ferstl, C. Geibel, and F. Steglich. Electrical
resistivity of YbRh2Si2 at high pressure. Physica B, 359-361:50, 2005.
[156] Y. Lassailly, A. K. Bhattacharjee, and B. Coqblin. Low-temperature resistivity and
magnetoresistivity of cerium compounds. Phys. Rev. B, 31(11):7424, 1985.
[157] G. A. Dionicio. Electrical resistivity of YbRh2Si2 and EuT2Ge2 (T = Co, Cu) at
extreme conditions of pressure and temperature. PhD thesis, Techn. Univ. of Dresden,
2006.
– 162 –

Bibliography
[158] S. Mederle-Hoffmeister. Der Einfluß von Druck und Substitution auf die Physik
der Schwere-Fermionen-Systeme (UTh)Be13 und YbRh2(SiGe)2. PhD thesis, Techn.
Univ. of Dresden, 2003.
[159] J. Plessel, M. M. Abd-Elmeguid, J. P. Sanchez, G. Knebel, C. Geibel, O. Trovarelli,
and F. Steglich. Unusual behavior of the low-moment magnetic ground state of
YbRh2Si2 under high pressure. Phys. Rev. B, 67:180403(R), 2003.
[160] Z. Hossain, C. Geibel, F. Weickert, T. Radu, Y. Tokiwa, H. Jeevan, P. Gegenwart,
and F. Steglich. Yb-based heavy-fermion metal situated close to a quantum critical
point. Phys. Rev. B, 72:094411, 2005.
[161] A. Hiess, O. Stockert, M. M. Koza, Z. Hossain, and C. Geibel. Magnetisation
dynamics of YbIr2Si2. Physica B, 378-380:748, 2006.
[162] U. Burkhard. Private communication. 2007.
[163] J. Ferstl, C. Geibel, F. Weickert, P. Gegenwart, T. Radu, T. Luhmann, and
F. Steglich. Tuning YbRh2Si2 to a non-magnetic state by La-doping. Physica B,
359-361:26, 2005.
[164] S. Maquilon and Z. Fisk. Private communication. 2005.
[165] S. Hartmann. Private communication. 2006.
[166] P. Gegenwart, F. Kromer, M. Lang, G. Sparn, C. Geibel, and F. Steglich. Non-Fermi-
liquid effects at ambient pressure in a stoichiometric heavy-fermion compound with
very low disorder: CeNi2Ge2. Phys. Rev. Lett., 82(6):1293, 1999.
[167] A. Pikul. Private communication. 2005.
[168] S. Korner. Auftreten von Nicht-Fermi-Flussigkeitsverhalten in den Schwere-
Fermionen-Systemen UCu5−xPdx und Ce1−xLaxNi2Ge2. PhD thesis, University of
Augsburg, 2000.
[169] F. M. Grosche, P. Agarwal, S. R. Julian, N. J. Wilson, R. K. W. Haselwimmer,
S. J. S. Lister, N. D. Mathur, F. V. Carter, S. S. Saxena, and G. G. Lonzarich.
Anomalous low temperature states in CeNi2Ge2. arXiv:cond-mat, page 9812133,
1998.
[170] P. Gegenwart, P. Hinze, C. Geibel, M. Lang, and F. Steglich. Incipient superconduc-
tivity and NFL behavior in off-stoichiometric Ce1+xNi2+yGe2+z polycrystals. Physica
B, 281&282:5, 2000.
– 163 –

Bibliography
[171] S. Kawasaki, T. Sada, T. Miyoshi, H. Kotegawa, H. Mukuda, Y. Kitaoka, T. C.
Kobayashi, T. Fukuhara, K. Maezawa, K. M. Itoh, and E. E. Haller. Evicence for
unconventional superconducting fluctuations in heavy-fermion compound CeNi2Ge2.
J. Phys. Soc. Jpn., 75(4):043702, 2006.
[172] S. R. Julian, C. Pfleiderer, F. M. Grosche, N. D. Mathur, G. J. McMullan, A. J.
Diver, I. R. Walker, and G. G. Lonzarich. The normal states of magnetic d and f
transition metals. J. Phys.: Condens. Matter, 8:9675, 1996.
[173] S. Koerner, E.-W. Scheidt, T. Schreiner, K. Heuser, and G. R. Stewart. Crossover
to Fermi-Liquid behavior at lowest temperatures in pure CeNi2Ge2. J. Low
Temp. Phys., 119:147, 2000.
[174] G. Knebel, M. Brando, J. Hemberger, M. Nicklas, W. Trinkl, and A. Loidl. Magnetic,
calorimetric, and transport properties of Ce(Pd1−xNix)2Ge2 and CeNi2(Ge1−ySiy)2.
Phys. Rev. B, 59(19):12390, 1999.
[175] F. Steglich, P. Gegenwart, C. Geibel, R. Helfrich, P. Hellmann, M. Lang, A. Link,
R. Modler, G. Sparn, N. Buttgen, and A. Loidl. New observations concerning mag-
netism and superconductivity in heavy-fermion metals. Physica B, 223&224:1, 1996.
[176] R. Kuchler, N. Oeschler, P. Gegenwart, T. Cichorek, K. Neumaier, O. Tegus,
C. Geibel, J. A. Mydosh, F. Steglich, L. Zhu, and Q. Si. Divergence of the Gruneisen
Ratio at Quantum Critical Points in Heavy Fermion Metals. Phys. Rev. Lett.,
91(6):066405, 2003.
[177] R. Kuchler. Thermische Ausdehnung und divergierendes Gruneisenverhaltnis in
Schwere-Fermionen-Systemen. PhD thesis, Techn. Univ. of Dresden, 2005.
[178] T. Fukuhara, K. Maezawa, H. Ohkuni, J. Sakurai, and H. Sato. Anisotropic trans-
port and magnetic properties of CeNi2Ge2. J. Magn. Magn. Mater., 140-144:889,
1995.
[179] G. Knopp, A. Loidl, R. Caspary, U. Gottwick, C. D. Bredl, H. Spille, F. Steglich,
and A. P. Murani. Specific heat, resistivity and neutron scattering studies in the
Kondo lattice CeNi2Ge2. J. Magn. Magn. Mater., 74:341, 1988.
[180] T. Fukuhara, K. Maezawa, H. Ohkuni, J. Sakurai, H. Sato, H. Azuma, K. Sugiyama,
Y. Onuki, and K. Kindo. Metamagnetic behavior of the heavy-fermion compound
CeNi2Ge2. J. Phys. Soc. Jpn., 65(6):1559, 1996.
[181] H. Schneider, Z. Kletowski, F. Oster, and D. Wohlleben. Transport properties of
single crystals of CeCu2Si2 and CeNi2Ge2. Solid State Commun., 48(12):1093, 1983.
– 164 –

Bibliography
[182] T. Kuwai, P. Sun, T. Sugihara, H. Suzuki, M. Takeuchi, T. Mizushima, A. Mitsuda,
Y. Isikawa, and T. Fukuhara. Thermoelectric properties of Ce(Ni,Pd)2Ge2 at low
temperatures below 1 K. Physica B, 378-380:146, 2006.
[183] T. Kuwai, M. Takeuchi, T. Tsuchiya, Y. Isikawa, and T. Fukuhara. Specific heat of
CeNi2Ge2 in wide-range of temperatures. J. Magn. Magn. Mater., 272-276:68, 2004.
[184] These results are cited in [185].
[185] C. D. Frost, B. D. Rainford, F. V. Carter, and S. S. Saxena. Inelastic neutron
scattering study of CeNi2Ge2. Physica B, 276-278:290, 2000.
[186] O. Stockert. Private communication. 2007.
[187] T. Moriya and T. Takimoto. Anomalous properties around magnetic instability in
heavy electron systems. J. Phys. Soc. Jpn., 64:960, 1995.
[188] M. J. Besnus, A. Braghta, and A. Meyer. Kondo behavior in magnetic (Ce-
La)Pd2Si2. Z. Phys. B – Condensed Matter, 83:207, 1991.
[189] A. N. Medina, M. A. Hayashi, L. P. Cardoso, S. Gama, and F. G. Gandra. Ef-
fect of volume variation on the properties of the Kondo system (La1−xCex)3Al .
Phys. Rev. B, 57(10):5900, 1998.
[190] M. Lavagna, C. Lacroix, and M. Cyrot. The γ −α transition in cerium compounds.
J. Phys. F: Met. Phys., 13:1007, 1983.
[191] J. J. Mills, R. A. Morant, and D. A. Wright. Thermomagnetic effects in pyrolytic
graphite. Brit. J. Appl. Phys., 16:479, 1965.
[192] M. R. El-Saden. Theory of the Ettingshausen cooler. J. Appl. Phys., 33(5):1800,
1962.
[193] F. A. P. Blom and J. W. Burg. Some thermomagnetic transport effects of Cd3P2.
J. Phys. Chem. Solids, 38:19, 1977.
[194] Z. A. Xu, N. P. Ong, Y. Wang, T. Kakeshita, and S. Uchida. Vortex-like excitations
and the onset of superconducting phase fluctuation in underdoped La2−xSrxCuO4.
Nature, 406:486, 2000.
[195] W. Wu, I. J. Lee, and P. M. Chaikin. Giant Nernst effect and lock-in currents at
magic angles in (TMTSF)2PF6. Phys. Rev. Lett., 91(5):056601, 2003.
[196] A. Pourret, K. Behnia, D. Kikuchi, Y. Aoki, H. Sugawara, and H. Sato.
Drastic change in transport of entropy with quadrupolar ordering in PrFe4P12.
Phys. Rev. Lett., 96:176402, 2006.
– 165 –

Bibliography
[197] F. Iga, N. Shimizu, and T. Takabatake. Single crystal growth and physical properties
of Kondo insulator YbB12. J. Magn. Magn. Mater., 177-181:337, 1998.
[198] J. W. Allen, B. Batlogg, and P. Wachter. Large low-temperature Hall effect and
resistivity in mixed-valent SmB6. Phys. Rev. B, 20(12):4807, 1979.
[199] M. Sera, N. Kobayashi, T. Yoshino, K. Kobayashi, T. Takabatake, G. Nakamoto,
and H. Fujii. Anisotropic pseudogap in CeNiSn and CeRhSb studied by a thermal-
conductivity measurement. Phys. Rev. B, 55(10):6421, 1997.
[200] S. Paschen, B. Wand, G. Sparn, F. Steglich, Y. Echizen, and T. Takabatake.
Thermal-transport properties of CeNiSn. Phys. Rev. B, 62(22):14912, 2000.
[201] J. Moreno and P. Coleman. Gap-anisotropic model for the narrow-gap Kondo insu-
lators. Phys. Rev. Lett., 84(2):342, 2000.
[202] G. S. Nolas, J. Sharp, and H. J. Goldsmid. Thermoelectrics: Basic principles and
new materials developments. Springer Series in Materials Science Vol. 45, Springer-
Verlag Berlin, 2001.
[203] B. J. O’Brien and C. S. Wallace. Ettingshausen effect and thermomagnetic cooling.
J. Appl. Phys., 29(7):1010, 1958.
[204] T. C. Harman, J. M. Honig., S. Fischler, A. E. Paladino, and M. J. Button. Oriented
single-crystal bismuth Nernst-Ettingshausen refrigerators. Appl. Phys. Lett., 4(4):77,
1964.
[205] K. Scholz, P. Jandl, U. Birkholz, and Z. M. Dashevskii. Infinite stage Ettingshausen
cooling in Bi-Sb alloys. J. Appl. Phys., 75(10):5406, 1994.
[206] I. Higashi, K. Kobayashi, T. Takabatake, and M. Kasaya. The crystal structure of
CeTSn (T ≡ Ni, Pd and Pt). J. Alloys Compd., 193:300, 1993.
[207] T. Takabatake, F. Teshima, H. Fujii, S. Nishigori, T. Suzuki, T. Fujita, Y. Yam-
aguchi, S. Sakurai, and D. Jaccard. Formation of an anisotropic energy gap in the
valence-fluctuating system CeNiSn. Phys. Rev. B, 41(13):9607, 1990.
[208] T. Takabatake, G. Nakamoto, T. Yoshino, H. Fujii, K. Izawa, S. Nishigori,
H. Goshima, T. Suzuki, T. Fujita, K. Maezawa, T. Hiraoka, Y. Okayama, I. Oguro,
A. A. Menovsky, K. Neumaier, A. Bruckl, and K. Andres. Localization effects of
kondo semimetals CeNiSn and CeRhSb. Physica B, 223&224:413, 1996.
[209] T. E. Mason, G. Aeppli, A. P. Ramirez, K. N. Clausen, C. Broholm, N. Stucheli,
E. Bucher, and T. T. M. Palstra. Spin gap and antiferromagnetic correlations in the
Kondo insulator CeNiSn. Phys. Rev. Lett., 69(3):490, 1992.
– 166 –

Bibliography
[210] H. Kadowaki, T. Sato, H. Yoshizawa, T. Ekino, T. Takabatake, H. Fujii, L. P.
Regnault, and Y. Isikawa. Quasi-one-dimensional antiferromagnetic correlations in
the Kondo semiconductor CeNiSn. J. Phys. Soc. Jpn., 63(6):2074, 1994.
[211] S. Nishigori, T. Suzuki, T. Fujita, H. Tanaka, T. Takabatake, and H. Fujii. Specific
heat study on the energy gap state in CeRhSb and CeNiSn. Physica B, 199&200:473,
1994.
[212] J.-G. Park, D. T. Adroja, K. A. McEwen, Y. J. Bi, and J. Kulda. Crystal field
excitation of single crystal CeNiSn. Physica B, 259-261:288, 1999.
[213] J.-Y. So, S.-J. Oh, J.-G. Park, D. T. Adroja, K. A. McEwen, and T. Takabatake.
Inelastic neutron scattering studies of doped CeNiSn and CeRhSb: Crystal-field
excitations and origin of the pseudogap. Phys. Rev. B, 71:214441, 2005.
[214] Y. Isikawa, K. Mori, Y. Ogiso, K. Oyabe, and K. Sato. Thermal conductivity of
CeNiSn single crystals. J. Phys. Soc. Jpn., 60(8):2514, 1991.
[215] T. Takabatake, Y. Nakazawa, and M. Ishikawa. Gap formation in a valence fluctu-
ation system of CeNiSn. Jap. J. Appl. Phys. Suppl., 26(3):547, 1987.
[216] T. Takabatake, M. Nagasawa, H. Fujii, G. Kido, M. Nohara, S. Nishigori, T. Suzuki,
T. Fujita, R. Helfrich, U. Ahlheim, K. Fraas, C. Geibel, and F. Steglich. Anisotropic
suppression of the energy gap in CeNiSn by high magnetic fields. Phys. Rev. B,
45(10):5740, 1992.
[217] T. Ekino, T. Takabatake, H. Tanaka, and H. Fujii. Tunneling evidence for the
quasiparticle gap in Kondo semiconductors CeNiSn and CeNiSb. Phys. Rev. Lett.,
75(23):4262, 1995.
[218] T. Ekino, T. Takabatake, H. Tanaka, and H. Fujii. Tunneling measurements of the
energy gap in CeRhSb and CeNiSn. Physica B, 206&207:837, 1995.
[219] T. Takabatake, G. Nakamoto, H. Tanaka, Y. Bando, H. Fujii, S. Nishigori,
H. Goshima, T. Suzuki, T. Fujita, I. Oguro, T. Hiraoka, and S. K. Malik. Coherence
Kondo gap in CeNiSn and CeRhSb. Physica B, 199&200:457, 1994.
[220] A. Bruckl, K. Neumaier, Ch. Probst, K. Andres, S. J. Flaschin, A. Kratzer,
G. M. Kalvius, and T. Takabatake. Disorder-induced heavy fermion behaviour in
CeNi1−xCuxSn-alloys. Physica B, 240:199, 1997.
[221] K. Nakamura, Y. Kitaoka, K. Asayama, T. Takabatake, H. Tanaka, and H. Fu-
jii. Low-energy excitation in Kondo semiconductors CeNiSn and CeRhSb.
J. Phys. Soc. Jpn., 63(2):433, 1994.
– 167 –

Bibliography
[222] M. Kyogaku, Y. Kitaoka, H. Nakamura, K. Asayama, T. Takabatake, F. Teshima,
and H. Fujii. NMR investigations of energy gap formation in the valence fluctuating
compound CeNiSn. J. Phys. Soc. Jpn., 59(5):1728, 1990.
[223] K. Izawa, T. Suzuki, M. Kitamura, T. Fujita, G. Nakamoto, T. Takabatake, and
H. Fujii. Effect of high magnetic field on gap formation in CeNiSn. Physica B,
230-232:670, 1997.
[224] P. S. Riseborough. Heavy fermion semiconductors. Advances in Physics, 49(3):257,
2000.
[225] H. Ikeda and K. Miyake. A theory of anisotropic semiconductor of heavy fermions.
J. Phys. Soc. Jpn., 65(6):1769, 1996.
[226] A. Aburto and E. Orgaz. Ab initio structural and electronic investigation of magnetic
RNiSn (R = La, Ce, Pr, Nd) intermetallics and their hydrides. Phys. Rev. B,
75:045130, 2007.
[227] M. Kurisu, T. Takabatake, and H. Fujiwara. Gap suppression in CeNiSn under
hydrostatic pressure. Solid State Commun., 68(7):595, 1988.
[228] F. G. Aliev, V. V. Moshchalkov, M. K. Zalyalyutdinov, G. I. Pak, R. V. Scolozdra,
P. A. Alekseev, V. N. Lazukov, and I. P. Sadikov. Gap formation in CeNiSn at low
temperatures. Physica B, 163:358, 1990.
[229] K. Nakamura, Y. Kitaoka, K. Asayama, T. Takabatake, G. Nakamoto, H. Tanaka,
and H. Fujii. Impurity and doping effects on the pseudoenergy gap in CeNiSn: A
Sn NMR study. Phys. Rev. B, 53(10):6385, 1996.
[230] K. Maezawa, Y. Saito, and S. Wakabayashi. Electrical resistivity of erbium purified
by solid-state electro-transport method. Jpn. J. Appl. Phys., 24(1):28, 1985.
[231] A. Hiess, C. Geibel, G. Sparn, C. D. Bredl, F. Steglich, T. Takabatake, and H. Fujii.
Transport properties of CeNiSn at low temperatures and in high magnetic fields.
Physica B, 199&200:437, 1994.
[232] T. Terashima, C. Terakura, S. Uji, H. Aoki, Y. Echizen, and T. Takabatake. Re-
sistivity, Hall effect, and Shubnikov-de Haas oscillations in CeNiSn. Phys. Rev. B,
66:075127, 2002.
[233] K. A. Kikoin, M. N. Kiselev, A. S. Mishchenko, and A. de Visser. Thermodynamics of
CeNiSn at low temperatures and in weak magnetic fields. Phys. Rev. B, 59(23):15070,
1999.
– 168 –

[234] Yu. Kagan, K. A. Kikoin, and A. S. Mishchenko. Interplay between heavy fermions
and crystal-field excitation in Kondo lattices: Low-temperature thermodynamics
and inelastic neutron scattering spectra of CeNiSn. Phys. Rev. B, 55(18):12348,
1997.
[235] T. Takabatake, T. Sasakawa, J. Kitagawa, T. Suemitsu, Y. Echizen, K. Umeo,
M. Sera, and Y. Bando. Thermoelectric properties of Ce-based Kondo semimet-
als and semiconductors. Physica B, 328:53, 2003.
[236] B. Wand. Untersuchungen zum Transport und zur spezifischen Warme an elektron-
isch hochkorrelierten Systemen. PhD thesis, Techn. Univ. of Darmstadt, 1998.
[237] J. Sakurai, Y. Takamatsu, T. Kuwai, Y. Isikaw, K. Mori, T. Fukuhara, and
K. Maezawa. Thermopower of CeNiSn under a magnetic field. Physica B,
206&207:834, 1995.
[238] K. Krishana, J. M. Harris, and N. P. Ong. Quasiparticle mean free path
in YBa2Cu3O7 measured by the thermal Hall conductivity. Phys. Rev. Lett.,
75(19):3529, 1996.
[239] T. Ekino, T. Takabatake, and H. Fujii. Break-junction measurements of CeNiSn
under magnetic fields. Physica B, 230-232:635, 1997.
[240] K. Sugiyama, K. Kindo, G. Nakamoto, T. Takabatake, and H. Fujii. Field induced
quenching of the energy gap in single crystal CeNiSn. J. Phys. Soc. Jpn., 67(7):2455,
1998.
[241] K. Behnia, R. Bel, A. Pourret, K. Izawa, J. Flouquet, Y. Nakajima, Y. Matsuda,
D. Kikuchi, Y. Aoki, H. Sugawara, and H. Sato. Giant Nernst effect in heavy-electron
metals. J. Magn. Magn. Mater., 310:446, 2007.
[242] K. Izawa, T. Suzuki, M. Kitamura, T. Fujita, T. Takabatake, G. Nakamoto, H. Fujii,
and K. Maezawa. The origin of magnetic filed dependence of specific heat in single-
crystalline CeNiSn. J. Phys. Soc. Jpn., 65(10):3119, 1996.
[243] I. Sheikin, H. Jin, R. Bel, K. Behnia, C. Proust, J. Flouquet, Y. Matsuda, D. Aoki,
and Y. Onuki. Evidence for a new magnetic field scale in CeCoIn5. Phys. Rev. Lett.,
96:077207, 2006.
– 169 –

Appendix A. Bibliography
– 170 –

List of publications
part of this work has been published:
� R. Demchyna, U. Kohler, Yu Prots, W. Schnelle, M. Baenitz, U. Burkhardt,
S. Paschen, and U. Schwarz;
High-pressure synthesis and physical properties of the europium-substituted barium
clathrate Ba8−xEuxGe43�3 (x ≤ 0.6).
Z. Anorg. Allg. Chem. 632, 73 (2006).
� S. Hartmann, U. Kohler, N. Oeschler, S. Paschen, C. Krellner, C. Geibel, and
F. Steglich;
Thermal transport properties of the heavy-fermion compound YbRh2(Si1−xGex)2.
Physica B 378-380, 70 (2006).
� U. Kohler, R. Demchyna, S. Paschen, U. Schwarz, and F. Steglich;
Schottky anomaly in the low-temperature specific heat of Ba8−xEuxGe43�3
(x ≤ 0.6).
Physica B 378-380, 263 (2006).
� S. Paschen, S. Budnyk, U. Kohler, Yu. Prots, K. Hiebl, F. Steglich, and Yu. Grin;
New type-I clathrates with ordered Eu distribution.
Physica B 383, 89 (2006).
� U. Kohler, A. P. Pikul, N. Oeschler, T. Westerkamp, A. M. Strydom, and F. Steglich;
Low-temperature study of the strongly correlated compound Ce3Rh4Sn13.
J. Phys.: Condens. Matter 19, 386207 (2007).
� U. Kohler, N. Oeschler, F. Steglich, S. Maquilon, and Z. Fisk;
Energy scales of Lu1−xYbxRh2Si2 by means of thermopower investigations.
Phys. Rev. B 77, 104412 (2008).
� U. Kohler, N. Oeschler, T. Takabatake, S. Paschen, and F. Steglich;
Field dependence of the thermopower of CeNiSn.
submitted to: J. Phys.: Conf. Series (2008).
– 171 –

– 172 –

Acknowledgements
At this point I would like to thank those numerous people who supported this work and me
during the last 4 years. The diversity of the problems addressed in this thesis is reflected
in a large number of cooperations on samples, measurements, and discussions.
First of all, I thank Prof. Dr. Frank Steglich, who gave me the opportunity to perform
this work in his group at the Max Planck Institute for Chemical Physics of Solids. I am
especially grateful for his support, encouragement, and interest during the whole time.
I am much indebted to my supervisors: Prof. Dr. Silke Paschen supported me during
the first one and a half years at the institute, but also kept interest in this work after
her departure to Vienna Technical University, Austria. I am especially grateful for her
suggestions concerning the setup of the new cryostat and for discussions on the clathrate
systems and CeNiSn. I would also like to thank Dr. Michael Baenitz for supervision of
this work for several months thereafter. He provided assistance with valuable comments,
particularly on the Ce3Rh4Sn13 compound. Finally I am grateful to Dr. Niels Oeschler,
who supervised this work for more than 2 years and untill the end. I would like to thank
for many discussions, which helped me to gain insight into the physics of heavy-fermion
compounds. Specially I also appreciated his rapid and careful revision of this thesis.
I thank Prof. Dr. Michael Loewenhaupt and Prof. Dr. Andre M. Strydom for preparing
the 2nd and 3rd report of this thesis.
I would like to thank Dr. Anders Bentien, Dr. Julia Ferstl, and Dr. Adriana Sanchez
Lotero, who introduced me to the PPMS and MPMS devices. I am also very grateful to
Christoph Klausnitzer. He kindly rendered assistance, whenever one of these devices was
not working as it should do.
The setup of a new apparatus generally entails a large number of problems. In solv-
ing these I significantly relied on assistance from other people. I am very grateful to
Dr. Michael Nicklas and Dr. Oliver Stockert, who frequently visited my lab and had
plenty advice on all kinds of difficulties. Furthermore, I am indebted to Robert Borth and
Dr. Thomas Luhmann for active help in setting up the experiment. Finally, I want to
thank the electronic and mechanic workshops of the institute, who prepared the sample
holder and numerous other components of the setup.
The clathrate compounds presented in this work have been investigated in cooperation
with the Chemical Metals Science group of the MPI CPfS. I am grateful to Prof. Dr. Yuri
Grin for the surrender of the samples and some valuable discussions on synthesis and
– 173 –

chemical characterization. I would like to thank the chemists Dr. Serhij Budnyk and
Dr. Roman Demchyna, who synthesized the clathrate samples and performed the chemical
characterization. I also want to acknowledge Dr. Walter Schnelle for measurements of the
magnetic susceptibility on the Ba8−xEuxGe43�3 samples and many suggestions on the
clathrate data.
The Ce3Rh4Sn13 and La3Rh4Sn13 samples were prepared by Prof. Dr. Andre M. Stry-
dom (Johannisburg University, South Africa). I am very grateful to him, not only for
providing the samples, but also for many discussions on the experimental results. I would
like to thank Dr. Adam Pikul, who spent a lot of time measuring the low-temperature spe-
cific heat of Ce3Rh4Sn13. Likewise I am grateful to Tanja Westerkamp for measurements
of the ac susceptibility of the compound.
I am deeply indebted to the members of the Materials Development Group of
the institute, particularly to Nubia Caroca-Canales, Cornelius Krellner, and Dr. Ivica
Zerec, who provided me with very clean samples of YbRh2(Si1−xGex)2, I-YbIr2Si2, and
Ce1−xLaxNi2Ge2. I am also especially grateful to Dr. Christoph Geibel for many discus-
sions on the thermopower of these systems and a constant interest in all parts of this work.
I am much obliged to Dr. Samuel Maquilon and Prof. Dr. Zachary Fisk (University
of California, Irvine, USA) for providing the LuxYb1−xRh2Si2 samples, which enabled me
to solve the ”problem of the missing thermopower peak” on YbRh2Si2. I exceptionally
appreciated the cooperation with Prof. Veljko Zlatic (Institute of Physics, Zagreb, Croatia)
on the same series. I am very grateful for his hospitality during my stay at his institute
and for many fruitful discussions on the thermopower of HF systems and the physics of
rare-earth compounds in general. In this context I also want to acknowledge financial
support by Cost action P16.
For the CeNiSn single crystals I am obliged to Prof. Dr. Toshiro Takabatake (Hiroshima
University, Japan). The thermal transport measurements have been partly performed in
cooperation with Dr. Peijie Sun. I am very grateful for his admission to use these data in
this work.
Further thanks go to Stefanie Hartmann, who shared the office with me. She was
always prepared for stimulating discussions on any topic and never afraid to express the
most distant or queer idea. Her encouragement, companionship, and support during the
last 4 years was invaluable for me.
The pleasant atmosphere during group meetings, lunch time, coffee breaks, and in-
stitutes parties was largely constituted by many present and former colleagues. Espe-
cially I would like to mention Julia Arndt, Eva-Maria Bruning, Michael Baenitz, Gabriel
Dionicio, Jan-Guido Donath, Julia Ferstl, Sven Friedemann, Hirale S. Jeevan, Christoph
Klausnitzer, Constanze Lamprecht, Monika Macovei, Katrin Meier, Michael Nicklas, Heike
Rave, Oliver Stockert, and Steffen Wirth.
This manuscript has been carefully revised by my sister Maria Sckolnick. I am very
grateful for many suggestions, comments and recommendations to improve the English.
– 174 –

Versicherung
Hiermit versichere ich, daß ich die vorliegende Arbeit ohne unzulassige Hilfe Dritter und
ohne Benutzung anderer als der angegebenen Hilfsmittel angefertigt habe; die aus fremden
Quellen direkt oder indirekt ubernommenen Gedanken sind als solche kenntlich gemacht.
Die Arbeit wurde bisher weder im Inland noch im Ausland in gleicher oder ahnlicher Form
einer anderen Prufungsbehorde vorgelegt.
Die vorliegende Dissertation wurde am Max-Planck-Institut fur Chemische Physik fes-
ter Stoffe in Dresden unter der wissenschaftlichen Betreuung von Herrn Prof. Dr. Frank
Steglich, Frau Prof. Dr. Silke Paschen, Herrn Dr. Michael Baenitz und Herrn Dr. Niels
Oeschler angefertigt.
Ich erkenne die Promotionsordnung der Technischen Universitat Dresden an.
Dresden, 17.12.2007