thermoelastic properties of (mg0.64fe0.36)o ferropericlase based
TRANSCRIPT
Physics of the Earth and Planetary Interiors 151 (2005) 163–176
Thermoelastic properties of (Mg0.64Fe0.36)O ferropericlase basedon in situ X-ray diffraction to 26.7 GPa and 2173 K
Wim van Westrenena,b,∗, Jie Lic,b, Yingwei Feib, Mark R. Frankd,b, Holger Hellwigc,b,Tetsu Komabayashie, Kenji Mibef,b, William G. Minarikg,b, James A. Van Ormanh,b,
Heather C. Watsoni,b, Ken-ichi Funakoshij, Max W. Schmidta
a Institut fur Mineralogie und Petrographie, Sonneggstrasse 5, ETH-Zentrum, CH 8092 Z¨urich, Switzerlandb Geophysical Laboratory, Carnegie Institution of Washington, 5251 Broad Branch Rd NW, Washington, DC 20015, USA
c Department of Geology, University of Illinois, Urbana Champaign, 245 Natural History Bldg, 1301 W Green St, Urbana, IL 61801, USAd Department of Geology and Environmental Geosciences, Northern Illinois University, Davis Hall 312, Normal Rd, DeKalb, IL 60115, USA
e Department of Earth and Planetary Sciences, Tokyo Institute of Technology, 2-12-1 Ookayama, Meguro-ku, Tokyo 152-8551, Japanf Earthquake Research Institute, University of Tokyo, 1-1-1 Yayoi, Bunkyo-ku, Tokyo 113-0032, Japan
g Department of Earth and Planetary Sciences, McGill University, 3450 University St, Montreal H3A 2A7, Canadah Department of Geological Sciences, Case Western Reserve University, 112 AW Smith Building, 10900 Euclid Avenue,
Cleveland, OH 44106, USAi Department of Earth and Environmental Sciences, Rensselaer Polytechnic Institute, Troy, NY 12180-3590, USA
j SPring-8/JASRI, 1-1-1 Kouto, Mikazuki-cho, Sayo-gun, Hyogo 679-5198, Japan
Received 25 October 2004; received in revised form 7 February 2005; accepted 1 March 2005
treon X-rayublishedsOS. EOS
calnts of the
terdam,
Abstract
We present 53 in situ measurements of the unit-cell volume (V) of polycrystalline (Mg0.64Fe0.36)O ferropericlase (FP) asimultaneous high pressures (P) and temperatures (T) up to P= 26.7 GPa andT= 2173 K, including pressure–temperatuconditions at the top of Earth’s lower mantle. FP volumes were determined through in situ energy-dispersive synchrotrdiffraction in a multi-anvil press, using gold and MgO as pressure markers. Our data, combined with 112 previously pP–V–Tmeasurements for the same FP sample, were fitted to high-temperature Birch-Murnaghan and Mie-Gruneisen equationof state (EOS). Experimental data are reproduced accurately, with a standard deviation lower than 0.31 GPa for both Ecalculations show that the thermal expansion andP–T derivatives of the bulk modulus of this iron-rich FP are virtually identito those of pure MgO to pressures >55 GPa and temperatures of 3000 K. This result is confirmed by measureme
∗ Corresponding author. Present address: Faculty of Earth and Life Sciences, Vrije Universiteit, De Boelelaan 1085, 1081 HV AmsThe Netherlands. Tel.: +31 20 598 7279; fax: +31 20 646 2457.
E-mail address:[email protected] (W. van Westrenen).
0031-9201/$ – see front matter © 2005 Elsevier B.V. All rights reserved.doi:10.1016/j.pepi.2005.03.001
164 W. van Westrenen et al. / Physics of the Earth and Planetary Interiors 151 (2005) 163–176
normalised unit-cell volumes for FP and MgO at identical simultaneous highP–T conditions, which are identical to within 0.6per cent relative to 26.7 GPa and 2173 K. The pressure and temperature derivatives of the bulk modulus, and thermal expansionare concluded to be independent of iron content across the range of plausible FP compositions in Earth’s lower mantle.© 2005 Elsevier B.V. All rights reserved.
Keywords:Equation of state; Ferropericlase; X-ray diffraction
1. Introduction
The Earth’s lower mantle is thought to consist pre-dominantly of a mixture of Mg–Fe silicate perovskite(MgxFe1−x)SiO3, ferropericlase (MgyFe1−y)O, andCa-rich silicate perovskite (CaSiO3) (e.g., Irifune,1994; Wood, 2000). Making accurate measurementsof the thermodynamic properties of these phases at thehigh temperatures (T) and pressures (P) prevalent in thelower mantle is experimentally challenging at present.Instead, equations of state (EOS) are used to extrapolatethermodynamic properties measured at lower pressuresand temperatures to lower mantle conditions. EOSlink pressure and temperature to a mineral’s unit-cellvolume, allowing computation of density profiles in thelower mantle. Comparing these with density profiles in-ferred from seismology provides constraints on temper-ature and/or lower mantle composition (e.g.,Stixrudeet al., 1992; Wang et al., 1994; Jackson, 1998; da Silvaet al., 2000; Marton and Cohen, 2002; Deschampsand Trampert, 2004). Here, we present new data con-
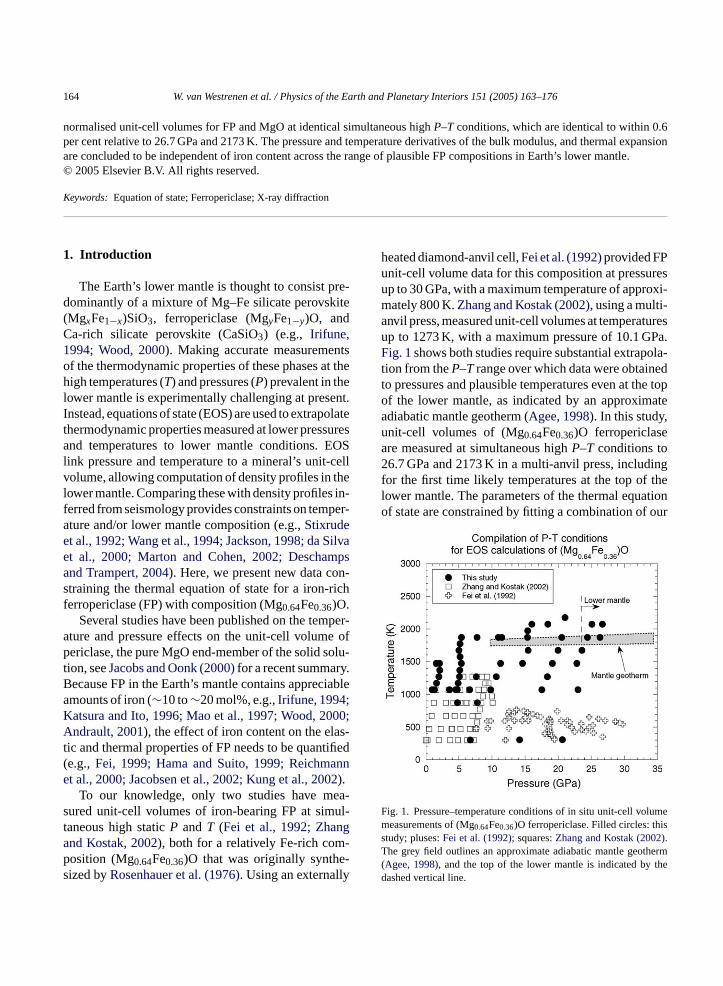
heated diamond-anvil cell,Fei et al. (1992)provided FPunit-cell volume data for this composition at pressuresup to 30 GPa, with a maximum temperature of approxi-mately 800 K.Zhang and Kostak (2002), using a multi-anvil press, measured unit-cell volumes at temperaturesup to 1273 K, with a maximum pressure of 10.1 GPa.Fig. 1shows both studies require substantial extrapola-tion from theP–T range over which data were obtainedto pressures and plausible temperatures even at the topof the lower mantle, as indicated by an approximateadiabatic mantle geotherm (Agee, 1998). In this study,unit-cell volumes of (Mg0.64Fe0.36)O ferropericlaseare measured at simultaneous highP–T conditions to26.7 GPa and 2173 K in a multi-anvil press, includingfor the first time likely temperatures at the top of thelower mantle. The parameters of the thermal equationof state are constrained by fitting a combination of our
straining the thermal equation of state for a iron-richferropericlase (FP) with composition (Mg0.64Fe0.36)O.
Several studies have been published on the temper-ature and pressure effects on the unit-cell volume ofpericlase, the pure MgO end-member of the solid solu-tion, seeJacobs and Oonk (2000)for a recent summary.Because FP in the Earth’s mantle contains appreciable
amounts of iron (∼10 to∼20 mol%, e.g.,Irifune, 1994;K 00;A s-t ified( anne 02ea-s ul-t ga -p -s y
F lumem iss )T herm( thed
atsura and Ito, 1996; Mao et al., 1997; Wood, 20ndrault, 2001), the effect of iron content on the ela
ic and thermal properties of FP needs to be quante.g., Fei, 1999; Hama and Suito, 1999; Reichmt al., 2000; Jacobsen et al., 2002; Kung et al., 20).
To our knowledge, only two studies have mured unit-cell volumes of iron-bearing FP at simaneous high staticP andT (Fei et al., 1992; Zhannd Kostak, 2002), both for a relatively Fe-rich comosition (Mg0.64Fe0.36)O that was originally syntheized byRosenhauer et al. (1976). Using an externall
ig. 1. Pressure–temperature conditions of in situ unit-cell voeasurements of (Mg0.64Fe0.36)O ferropericlase. Filled circles: th
tudy; pluses:Fei et al. (1992); squares:Zhang and Kostak (2002.he grey field outlines an approximate adiabatic mantle geot
Agee, 1998), and the top of the lower mantle is indicated byashed vertical line.
W. van Westrenen et al. / Physics of the Earth and Planetary Interiors 151 (2005) 163–176 165
data and the two prior studies ofFei et al. (1992)andZhang and Kostak (2002), to provide improved con-straints on possible variations in the elastic and thermalproperties of FP as a function of iron content in FP.
2. Methods
2.1. Experimental methods
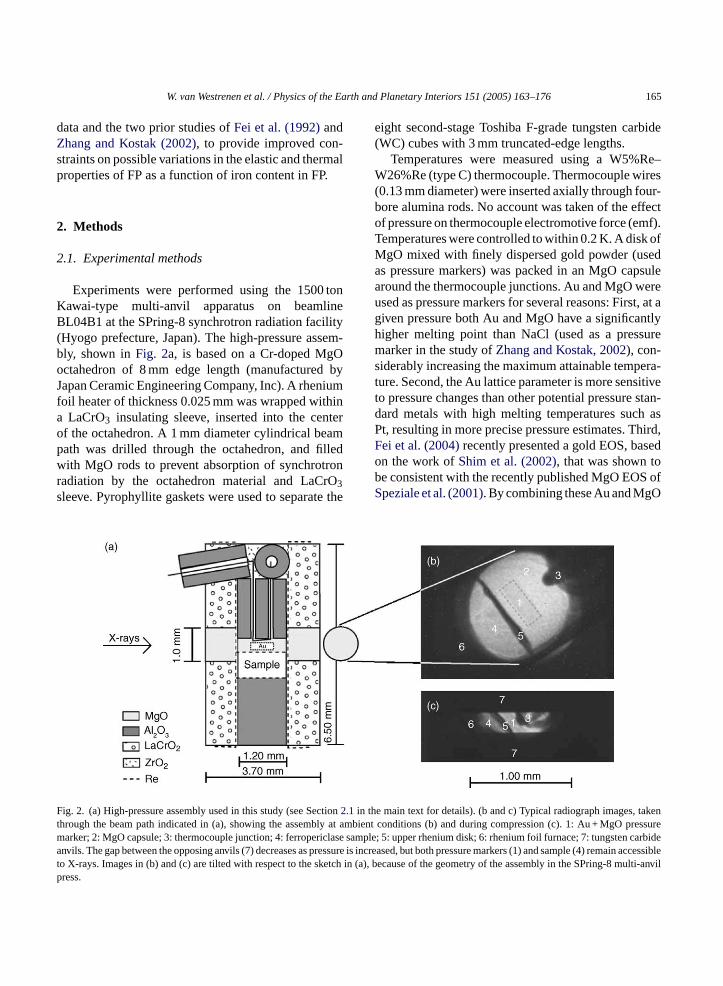
Experiments were performed using the 1500 tonKawai-type multi-anvil apparatus on beamlineBL04B1 at the SPring-8 synchrotron radiation facility(Hyogo prefecture, Japan). The high-pressure assem-bly, shown inFig. 2a, is based on a Cr-doped MgOoctahedron of 8 mm edge length (manufactured byJapan Ceramic Engineering Company, Inc). A rheniumfoil heater of thickness 0.025 mm was wrapped withina LaCrO3 insulating sleeve, inserted into the centerof the octahedron. A 1 mm diameter cylindrical beampath was drilled through the octahedron, and filledwith MgO rods to prevent absorption of synchrotronradiation by the octahedron material and LaCrO3sleeve. Pyrophyllite gaskets were used to separate the
eight second-stage Toshiba F-grade tungsten carbide(WC) cubes with 3 mm truncated-edge lengths.
Temperatures were measured using a W5%Re–W26%Re (type C) thermocouple. Thermocouple wires(0.13 mm diameter) were inserted axially through four-bore alumina rods. No account was taken of the effectof pressure on thermocouple electromotive force (emf).Temperatures were controlled to within 0.2 K. A disk ofMgO mixed with finely dispersed gold powder (usedas pressure markers) was packed in an MgO capsulearound the thermocouple junctions. Au and MgO wereused as pressure markers for several reasons: First, at agiven pressure both Au and MgO have a significantlyhigher melting point than NaCl (used as a pressuremarker in the study ofZhang and Kostak, 2002), con-siderably increasing the maximum attainable tempera-ture. Second, the Au lattice parameter is more sensitiveto pressure changes than other potential pressure stan-dard metals with high melting temperatures such asPt, resulting in more precise pressure estimates. Third,Fei et al. (2004)recently presented a gold EOS, basedon the work ofShim et al. (2002), that was shown tobe consistent with the recently published MgO EOS ofSpeziale et al. (2001). By combining these Au and MgO
F ction.1 in th akent y at am O pressurem lase s en carbidea ressure ain accessiblet etch in multi-anvilp
ig. 2. (a) High-pressure assembly used in this study (see Se2hrough the beam path indicated in (a), showing the assemblarker; 2: MgO capsule; 3: thermocouple junction; 4: ferropericnvils. The gap between the opposing anvils (7) decreases as p
o X-rays. Images in (b) and (c) are tilted with respect to the skress.
e main text for details). (b and c) Typical radiograph images, tbient conditions (b) and during compression (c). 1: Au + Mg
ample; 5: upper rhenium disk; 6: rhenium foil furnace; 7: tungstis increased, but both pressure markers (1) and sample (4) rem
(a), because of the geometry of the assembly in the SPring-8
166 W. van Westrenen et al. / Physics of the Earth and Planetary Interiors 151 (2005) 163–176
EOS it should therefore be possible to obtain consistentresults for the FP EOS. Finally, a direct comparisonof measured unit-cell volumes of pure MgO and FPat identical pressure–temperature conditions can shedmore light on the question of whether or not the thermo-elastic properties (P–Tdependence of the bulk modulusand thermal expansion) of FP vary significantly withiron content.
Finely ground polycrystalline FP was packed in di-rect contact with the Re heater and separated from pres-sure markers and alumina end cap by two 0.064 mmthick Re disks.Fig. 2 shows images of a typical ex-periment at room pressure (Fig. 2a and b) and highpressure (Fig. 2c). The thermocouple junction, pres-sure marker, Re disk and sample are radiographicallyimaged through the gap between the WC anvils, andthrough the MgO-filled holes drilled into the sidesof the octahedron. At all times, FP samples were lo-cated within approximately 400�m of the thermocou-ple junction, i.e., within the measured hot spot for thisassembly (1 mm in length along the Re furnace axis,seevan Westrenen et al., 2003).
Experiments were pressurized at room temperature,before heating to the maximum desired temperature.X-ray diffraction patterns were mostly obtained dur-ing cooling from the highest temperature to minimizenon-hydrostatic effects. Typically, a total of 10–15 minwere spent at each temperature to collect X-ray diffrac-tion patterns. After quenching to room temperature,the pressure was increased again before the next se-r thes sev-e ightd
2
ob-t ses-s singe th-oI of5 es-s ageoa ith aG ne.
For all three sessions, energy calibrations for thedetector were based on the detector channel positionsof approximately 20 K� and K� peaks of known en-ergies in the range 8–85 keV, and four high-energy� radiation peaks between 81 and 122 keV from ra-dioactive sources. Residuals of linear fits to the datashow no systematic variation with channel number,and quadratic fits did not improve calibrations signif-icantly. The detector 2θ angle was calibrated beforeeach experiment by fitting both Au (3 peaks) and MgO(2–3 peaks) diffraction patterns at ambient pressure andtemperature conditions, and was found to be constantwithin error for each of the three sessions. At everyP–T point, Au or MgO, and FP diffraction patternswere obtained, and the XRayAna program availableat the beamline was used to calculate lattice parame-ters. Au and MgO lattice parameters were convertedto pressures using theFei et al. (2004)andSpezialeet al. (2001)thermal equations of state for Au and MgO,respectively.
Major element compositions of the starting materialand selected run products were determined on polishedassembly cross-sections with a JEOL 8900 electron mi-croprobe at the Geophysical Laboratory, using a fo-cused beam with an accelerating voltage of 15 kV anda beam current of 15 nA. Counting times were 30 s onboth peak and background. Zabargad olivine (for Mg,Fe, Si) and almandine (for Al) were used as calibrationstandards.
3
3
re-q ringt e ofA les,a FPa 3N ra-t byrMe bot-t plea
ies of measurements. Diffraction patterns fromample and pressure markers were taken alongral isotherms between 300 and 2173 K, at up to eifferent pressures for each temperature (Fig. 1).
.2. Analytical methods
Lattice parameters for Au, MgO and FP wereained in situ during three separate experimentalions covering the period April 2002–June 2003 unergy-dispersive synchrotron X-ray diffraction meds similar to those described byIrifune et al. (1998).
ncoming white X-rays were collimated to a size0�m× 200�m, and positioned over either the prure marker or sample region using a radiograph imn a CCD camera lowered into the beam path (Fig. 2bnd c). The diffracted beam was then detected we solid state detector placed in the horizontal pla
. Results
.1. Ferropericlase composition
Meaningful interpretation of our measurementsuires sample composition to remain constant du
he experiments. A first concern was the presencl2O3 assembly parts in proximity to the FP samps significant amounts of Al are known to dissolve int high temperatures (e.g.,van Westrenen et al., 200).otwithstanding the very high maximum tempe
ures, the aluminium content of samples confinedhenium disks and heater is universally low (Table 1).aximum Al concentrations (up to 0.20 wt.% Al2O3 in
xperiment S813) were found near the edges of theom rhenium disk, far removed from the central samrea where in situ measurements were made.
W. van Westrenen et al. / Physics of the Earth and Planetary Interiors 151 (2005) 163–176 167
Table 1Ferropericlase compositions (oxide wt.%) determined by electron microprobea,b
Run Tmax (K) Capsule Al2O3 Al2O3 (max) FeO MgO Total Average stoichiometry
Starting material – – b.d. b.d. 50.0(3) 49.9(2) 99.9(3) Mg0.64Fe0.36OS806 1873 Re disks 0.03(1) 0.06 50.2(8) 49.6(8) 100.0(4) Mg0.64Fe0.36OS813 2073 Re disks 0.11(8) 0.20 49.6(8) 50.1(8) 100.0(5) Mg0.64Fe0.36O
a b.d.: below detection limit.b Numbers in brackets are 1σ errors in last digit.
A second concern was possible sample oxidationat elevated temperature, leading to increased Fe3+ andvacancy concentrations. All iron-bearing FP samplescontain some Fe3+, either interstitially or in regular Felattice sites, charge-balanced mainly by cation vacan-cies (e.g.,Reichmann et al., 2000; Jacobsen et al., 2002;O’Neill et al., 2003). Rosenhauer et al. (1976)reportapproximately 3.6 atomic per cent of our starting ma-terial’s Fe is trivalent. This is consistent with modelsfor the fraction of trivalent iron in FP in the presenceof metallic Fe as a function of FP composition (e.g.,Hilbrandt and Martin, 1998; O’Neill et al., 2003; Junget al., 2004).
The oxygen fugacity (fO2) during our experimentswas not buffered, but our in situ measurements providelower and, more importantly, upper bounds. The intrin-sic oxygen fugacity (fO2) of the starting material wasclose to that of the Fe–(Fe,Mg)O buffer. No Fe peakswere identified in any in situ diffraction patterns, andno metallic iron was found in any run products. Fe lossto the Re heater can also be excluded, as electron mi-croprobe analyses (Table 1) show that the Fe/Mg ratioof the samples after experimentation is within error ofthe starting material ratio. ThefO2 therefore never fellbelow the Fe–(Fe,Mg)O buffer. This is consistent withthe fact that the assembly parts surrounding the sample(Fig. 2a), in particular the Re furnace, favour more oxi-dising conditions. The particular assembly used wouldtend to increasefO2 towards that of the Re-ReO2 buffer,positioned 5–7 log units above the Fe–(Fe,Mg)O buffer(s ody-ne ldh tem-p
ac-t the
experiments, however, proves that such high oxygenfugacities were never reached. Magnetite should haveformed at most temperatures reached in this study ifthe oxygen fugacity had been buffered by the Re-ReO2equilibrium. From these observations we estimatethat thefO2 of our FP samples likely exceeded thefO2 of the Fe–(Fe,Mg)O buffer by a maximum of 3log units. At the temperatures reached in this study,this increasedfO2 would lead to an increase in thepercentage of total iron that is trivalent from 3.6 at.%to a maximum of 14 at.%, translating into a FP Fe3+
content change from 1.3 at.% to a maximum of 5 at.%for our particular FP composition.Jacobsen et al.(2002)recently showed that changes in FP Fe3+ con-tent of this order have no measurable effect on elasticproperties, so we consider this change in compositioninsignificant.
3.2. Lattice parameters
The number of resolvable peaks for sample andpressure markers varies due to overlaps with rhenium(from the upper rhenium disk bounding the sample)and preferred orientation of Au at high temperatures,both of which change as a function ofP andT (andtime in the case of preferred orientation). One to four‘clean’ Au or MgO pressure marker peaks could beused for each pressure determination, and one to sixpeaks for the calculation of (Mg0.64Fe0.36)O unit-cellvolumes (V). Peak positions were determined usingG eret tticep ttingb surem
as-s e de-t ters
Pownceby and O’Neill, 1994). If the fO2 of our FPamples reached this buffer at any stage, thermamic models of the Mg–Fe–O system (e.g.,Jungt al., 2004) show that over 80% of all iron in FP shouave become trivalent at the highest experimentaleratures.
The absence of magnetite from both X-ray diffrion patterns during, and run products after
aussian peak fitting, and for all instances whhe number of clean peaks exceeded one, laarameters were determined by least-squares fiased on a cubic unit cell for sample and presarkers.Table 2lists calculated lattice parameters and
ociated errors for all three phases, and pressurerminations obtained from these lattice parame
168 W. van Westrenen et al. / Physics of the Earth and Planetary Interiors 151 (2005) 163–176
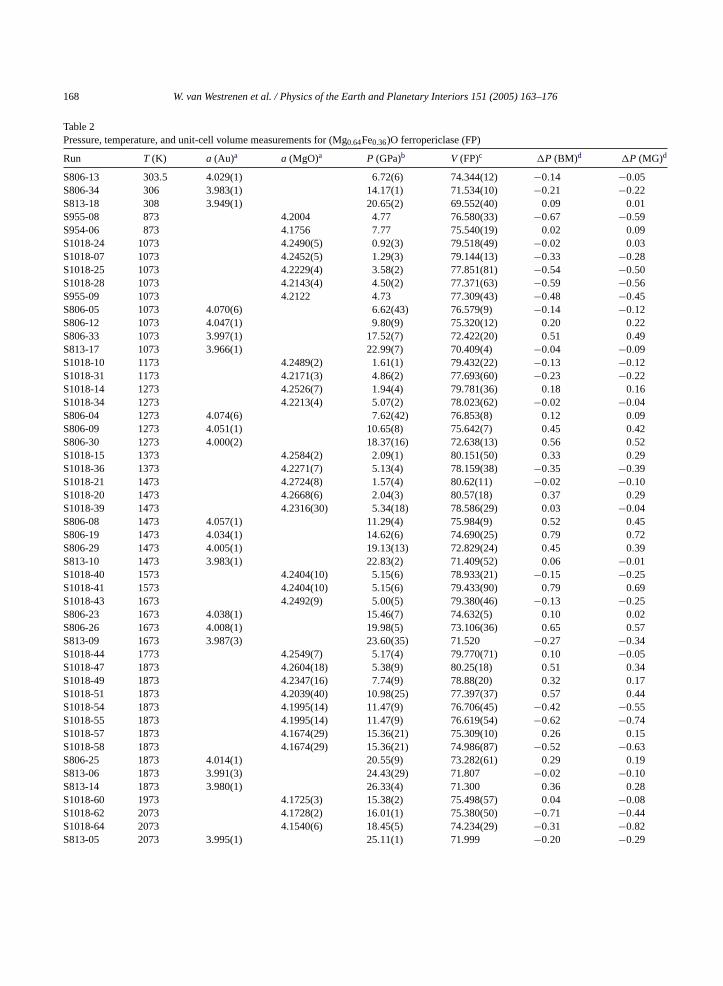
Table 2Pressure, temperature, and unit-cell volume measurements for (Mg0.64Fe0.36)O ferropericlase (FP)
Run T (K) a (Au)a a (MgO)a P (GPa)b V (FP)c �P (BM)d �P (MG)d
S806-13 303.5 4.029(1) 6.72(6) 74.344(12) −0.14 −0.05S806-34 306 3.983(1) 14.17(1) 71.534(10) −0.21 −0.22S813-18 308 3.949(1) 20.65(2) 69.552(40) 0.09 0.01S955-08 873 4.2004 4.77 76.580(33) −0.67 −0.59S954-06 873 4.1756 7.77 75.540(19) 0.02 0.09S1018-24 1073 4.2490(5) 0.92(3) 79.518(49) −0.02 0.03S1018-07 1073 4.2452(5) 1.29(3) 79.144(13) −0.33 −0.28S1018-25 1073 4.2229(4) 3.58(2) 77.851(81) −0.54 −0.50S1018-28 1073 4.2143(4) 4.50(2) 77.371(63) −0.59 −0.56S955-09 1073 4.2122 4.73 77.309(43) −0.48 −0.45S806-05 1073 4.070(6) 6.62(43) 76.579(9) −0.14 −0.12S806-12 1073 4.047(1) 9.80(9) 75.320(12) 0.20 0.22S806-33 1073 3.997(1) 17.52(7) 72.422(20) 0.51 0.49S813-17 1073 3.966(1) 22.99(7) 70.409(4) −0.04 −0.09S1018-10 1173 4.2489(2) 1.61(1) 79.432(22) −0.13 −0.12S1018-31 1173 4.2171(3) 4.86(2) 77.693(60) −0.23 −0.22S1018-14 1273 4.2526(7) 1.94(4) 79.781(36) 0.18 0.16S1018-34 1273 4.2213(4) 5.07(2) 78.023(62) −0.02 −0.04S806-04 1273 4.074(6) 7.62(42) 76.853(8) 0.12 0.09S806-09 1273 4.051(1) 10.65(8) 75.642(7) 0.45 0.42S806-30 1273 4.000(2) 18.37(16) 72.638(13) 0.56 0.52S1018-15 1373 4.2584(2) 2.09(1) 80.151(50) 0.33 0.29S1018-36 1373 4.2271(7) 5.13(4) 78.159(38) −0.35 −0.39S1018-21 1473 4.2724(8) 1.57(4) 80.62(11) −0.02 −0.10S1018-20 1473 4.2668(6) 2.04(3) 80.57(18) 0.37 0.29S1018-39 1473 4.2316(30) 5.34(18) 78.586(29) 0.03 −0.04S806-08 1473 4.057(1) 11.29(4) 75.984(9) 0.52 0.45S806-19 1473 4.034(1) 14.62(6) 74.690(25) 0.79 0.72S806-29 1473 4.005(1) 19.13(13) 72.829(24) 0.45 0.39S813-10 1473 3.983(1) 22.83(2) 71.409(52) 0.06 −0.01S1018-40 1573 4.2404(10) 5.15(6) 78.933(21) −0.15 −0.25S1018-41 1573 4.2404(10) 5.15(6) 79.433(90) 0.79 0.69S1018-43 1673 4.2492(9) 5.00(5) 79.380(46) −0.13 −0.25S806-23 1673 4.038(1) 15.46(7) 74.632(5) 0.10 0.02S806-26 1673 4.008(1) 19.98(5) 73.106(36) 0.65 0.57S813-09 1673 3.987(3) 23.60(35) 71.520 −0.27 −0.34S1018-44 1773 4.2549(7) 5.17(4) 79.770(71) 0.10 −0.05S1018-47 1873 4.2604(18) 5.38(9) 80.25(18) 0.51 0.34S1018-49 1873 4.2347(16) 7.74(9) 78.88(20) 0.32 0.17S1018-51 1873 4.2039(40) 10.98(25) 77.397(37) 0.57 0.44S1018-54 1873 4.1995(14) 11.47(9) 76.706(45) −0.42 −0.55S1018-55 1873 4.1995(14) 11.47(9) 76.619(54) −0.62 −0.74S1018-57 1873 4.1674(29) 15.36(21) 75.309(10) 0.26 0.15S1018-58 1873 4.1674(29) 15.36(21) 74.986(87) −0.52 −0.63S806-25 1873 4.014(1) 20.55(9) 73.282(61) 0.29 0.19S813-06 1873 3.991(3) 24.43(29) 71.807 −0.02 −0.10S813-14 1873 3.980(1) 26.33(4) 71.300 0.36 0.28S1018-60 1973 4.1725(3) 15.38(2) 75.498(57) 0.04 −0.08S1018-62 2073 4.1728(2) 16.01(1) 75.380(50) −0.71 −0.44S1018-64 2073 4.1540(6) 18.45(5) 74.234(29) −0.31 −0.82S813-05 2073 3.995(1) 25.11(1) 71.999 −0.20 −0.29
W. van Westrenen et al. / Physics of the Earth and Planetary Interiors 151 (2005) 163–176 169
Table 2 (Continued)
Run T (K) a (Au)a a (MgO)a P (GPa)b V (FP)c �P (BM)d �P (MG)d
S813-13 2073 3.986(1) 26.68(7) 71.658 0.36 0.28S1018-69 2173 4.1401(2) 21.03(1) 73.59(34) −0.53 −0.63
a Lattice parametersa (in A) for pressure markers Au and MgO. Numbers in brackets are 1σ error in last digit. No errors reported formeasurements based on a single X-ray diffraction peak position.
b Pressure (in GPa) calculated from Au EOS ofFei et al. (2004)and MgO EOS ofSpeziale et al. (2001). Numbers in brackets are 1σ error inlast digit, derived from propagation of errors in lattice parametersa.
c Measured unit-cell volumeV (in A3) for ferropericlase (FP). Numbers between brackets are 1σ error in last digit. No errors reported formeasurements based on a single X-ray diffraction peak position.
d �P (in GPa) denotes difference between measuredP andP calculated for givenT and FP unit-cellV using the FP Birch-Murnaghan (BM)and Mie-Gruneisen (MG) EOS parameters fromTable 3.
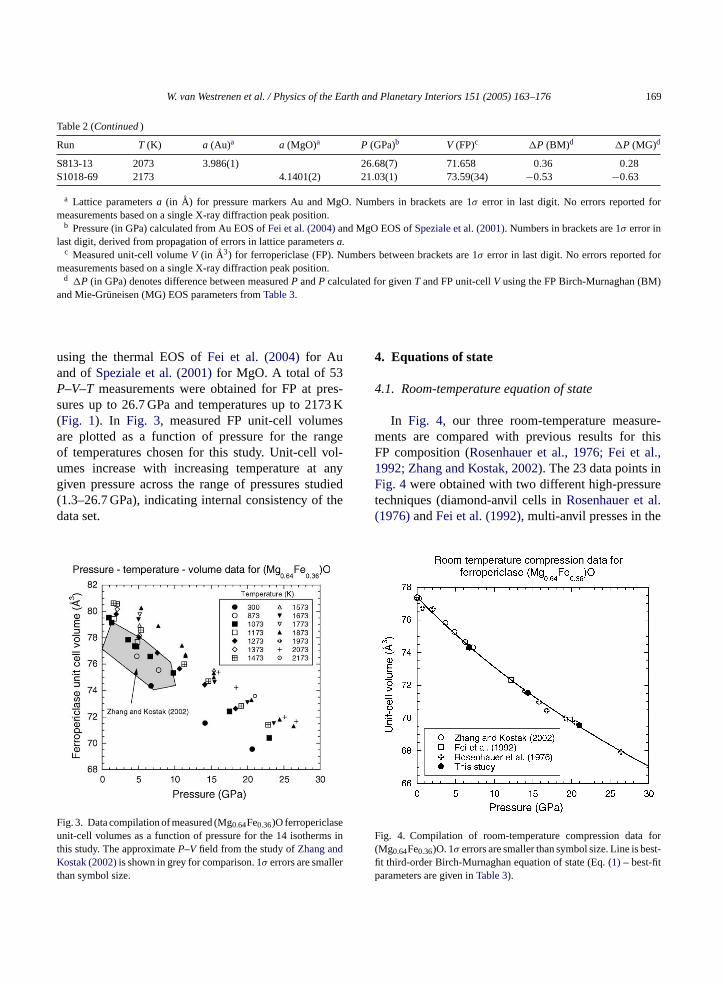
using the thermal EOS ofFei et al. (2004)for Auand ofSpeziale et al. (2001)for MgO. A total of 53P–V–T measurements were obtained for FP at pres-sures up to 26.7 GPa and temperatures up to 2173 K(Fig. 1). In Fig. 3, measured FP unit-cell volumesare plotted as a function of pressure for the rangeof temperatures chosen for this study. Unit-cell vol-umes increase with increasing temperature at anygiven pressure across the range of pressures studied(1.3–26.7 GPa), indicating internal consistency of thedata set.
F eu s intK rt
4. Equations of state
4.1. Room-temperature equation of state
In Fig. 4, our three room-temperature measure-ments are compared with previous results for thisFP composition (Rosenhauer et al., 1976; Fei et al.,1992; Zhang and Kostak, 2002). The 23 data points inFig. 4 were obtained with two different high-pressuretechniques (diamond-anvil cells inRosenhauer et al.(1976)andFei et al. (1992), multi-anvil presses in the
F for( est-fip
ig. 3. Data compilation of measured (Mg0.64Fe0.36)O ferropericlasnit-cell volumes as a function of pressure for the 14 isotherm
his study. The approximateP–V field from the study ofZhang andostak (2002)is shown in grey for comparison. 1σ errors are smalle
han symbol size.
ig. 4. Compilation of room-temperature compression dataMg0.64Fe0.36)O. 1σ errors are smaller than symbol size. Line is bt third-order Birch-Murnaghan equation of state (Eq.(1) – best-fitarameters are given inTable 3).
170 W. van Westrenen et al. / Physics of the Earth and Planetary Interiors 151 (2005) 163–176
other two studies) and two different pressure mark-ers (Au in this study andFei et al. (1992), NaCl inthe case ofRosenhauer et al. (1976)and Zhang andKostak (2002)). All data can be fit satisfactorily with athird-order Birch-Murnaghan equation of state (Birch,1947),
P(V, 300 K) = 3KT0f (1 + 2f )5/2
×(
1 + 3
2(K′
0 − 4.0)f
), (1)
whereV is the unit-cell volume,V0 is the unit-cell vol-ume at zero pressure,KT0 is the isothermal bulk mod-ulus at zero pressure,K′
0 is its pressure derivative, andf, the Eulerian strain, is defined as
f = 1
2
((V0
V
)2/3
− 1
). (2)
A non-linear least-squares fit (using EOSFIT softwaredeveloped by R. Angel, described inAngel, 2000)givesV0 = 77.438± 0.029A3, KT0 = 154± 3 GPa, andK′
0 = 4.0± 0.4 (Table 3, errors given are 1σ). These pa-rameters are within 2σ of previous analyses of room-temperature data (Rosenhauer et al., 1976; Fei et al.,1992; Zhang and Kostak, 2002).
4.2. High-temperature equations of state
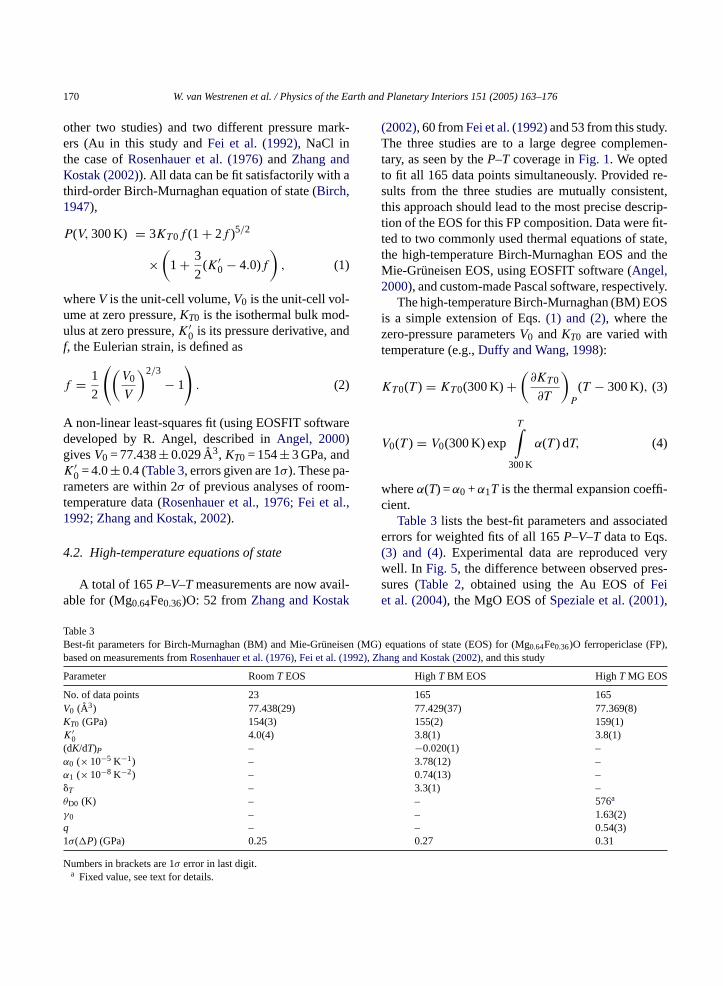
A total of 165P–V–Tmeasurements are now avail-a k
(2002), 60 fromFei et al. (1992)and 53 from this study.The three studies are to a large degree complemen-tary, as seen by theP–T coverage inFig. 1. We optedto fit all 165 data points simultaneously. Provided re-sults from the three studies are mutually consistent,this approach should lead to the most precise descrip-tion of the EOS for this FP composition. Data were fit-ted to two commonly used thermal equations of state,the high-temperature Birch-Murnaghan EOS and theMie-Gruneisen EOS, using EOSFIT software (Angel,2000), and custom-made Pascal software, respectively.
The high-temperature Birch-Murnaghan (BM) EOSis a simple extension of Eqs.(1) and (2), where thezero-pressure parametersV0 andKT0 are varied withtemperature (e.g.,Duffy and Wang, 1998):
KT0(T ) = KT0(300 K)+(
∂KT0
∂T
)P
(T − 300 K), (3)
V0(T ) = V0(300 K) exp
T∫300 K
α(T ) dT, (4)
whereα(T) =α0 +α1T is the thermal expansion coeffi-cient.
Table 3lists the best-fit parameters and associatederrors for weighted fits of all 165P–V–T data to Eqs.(3) and (4). Experimental data are reproduced verywell. In Fig. 5, the difference between observed pres-sures (Table 2, obtained using the Au EOS ofFeie )
TB n (MG ),b 992), Zh
P
NVKK
(α
α
�
θ
γ
q1
N
ble for (Mg0.64Fe0.36)O: 52 fromZhang and Kosta
able 3est-fit parameters for Birch-Murnaghan (BM) and Mie-Gruneiseased on measurements fromRosenhauer et al. (1976), Fei et al. (1
arameter RoomTEOS
o. of data points 23
0 (A3) 77.438(29)
T0 (GPa) 154(3)′0 4.0(4)
dK/dT)P –
0 (× 10−5 K−1) –
1 (× 10−8 K−2) –
T –
D0 (K) –
0 ––
σ(�P) (GPa) 0.25
umbers in brackets are 1σ error in last digit.a Fixed value, see text for details.
t al. (2004), the MgO EOS ofSpeziale et al. (2001,
) equations of state (EOS) for (Mg0.64Fe0.36)O ferropericlase (FPang and Kostak (2002), and this study
HighTBM EOS HighTMG EOS
165 16577.429(37) 77.369(8)155(2) 159(1)
3.8(1) 3.8(1)−0.020(1) –3.78(12) –0.74(13) –3.3(1) –– 576a
– 1.63(2)– 0.54(3)0.27 0.31
W. van Westrenen et al. / Physics of the Earth and Planetary Interiors 151 (2005) 163–176 171
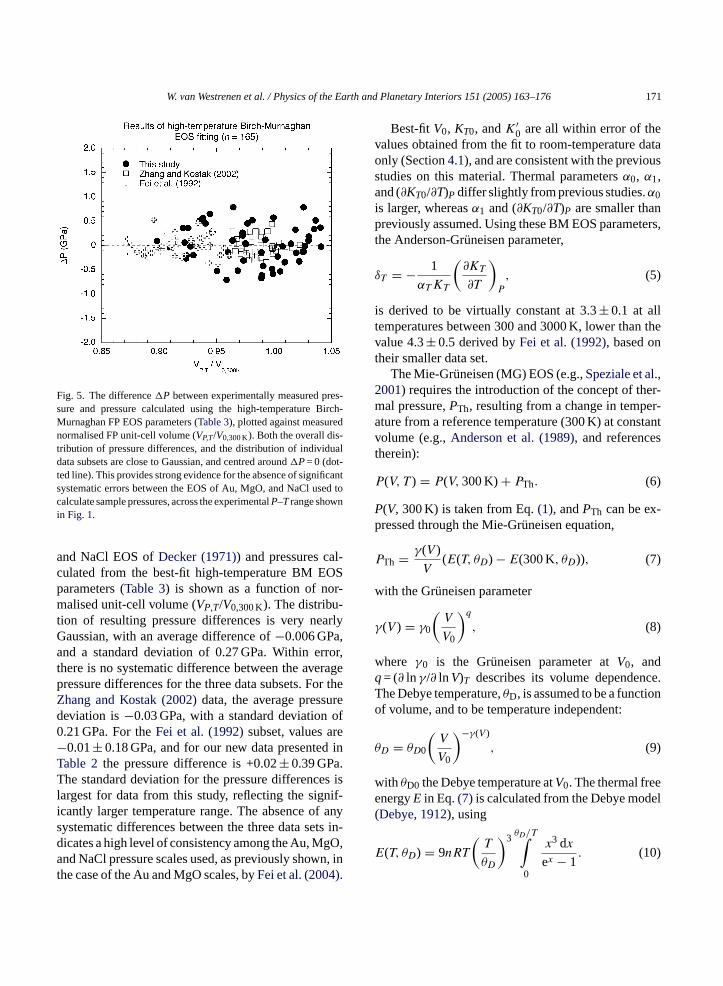
Fig. 5. The difference�P between experimentally measured pres-sure and pressure calculated using the high-temperature Birch-Murnaghan FP EOS parameters (Table 3), plotted against measurednormalised FP unit-cell volume (VP,T/V0,300 K). Both the overall dis-tribution of pressure differences, and the distribution of individualdata subsets are close to Gaussian, and centred around�P= 0 (dot-ted line). This provides strong evidence for the absence of significantsystematic errors between the EOS of Au, MgO, and NaCl used tocalculate sample pressures, across the experimentalP–T range shownin Fig. 1.
and NaCl EOS ofDecker (1971)) and pressures cal-culated from the best-fit high-temperature BM EOSparameters (Table 3) is shown as a function of nor-malised unit-cell volume (VP,T/V0,300 K). The distribu-tion of resulting pressure differences is very nearlyGaussian, with an average difference of−0.006 GPa,and a standard deviation of 0.27 GPa. Within error,there is no systematic difference between the averagepressure differences for the three data subsets. For theZhang and Kostak (2002)data, the average pressuredeviation is−0.03 GPa, with a standard deviation of0.21 GPa. For theFei et al. (1992)subset, values are−0.01± 0.18 GPa, and for our new data presented inTable 2the pressure difference is +0.02± 0.39 GPa.The standard deviation for the pressure differences islargest for data from this study, reflecting the signif-icantly larger temperature range. The absence of anysystematic differences between the three data sets in-dicates a high level of consistency among the Au, MgO,and NaCl pressure scales used, as previously shown, inthe case of the Au and MgO scales, byFei et al. (2004).
Best-fitV0, KT0, andK′0 are all within error of the
values obtained from the fit to room-temperature dataonly (Section4.1), and are consistent with the previousstudies on this material. Thermal parametersα0, α1,and (∂KT0/∂T)Pdiffer slightly from previous studies.α0is larger, whereasα1 and (∂KT0/∂T)P are smaller thanpreviously assumed. Using these BM EOS parameters,the Anderson-Gruneisen parameter,
δT = − 1
αT KT
(∂KT
∂T
)P
, (5)
is derived to be virtually constant at 3.3± 0.1 at alltemperatures between 300 and 3000 K, lower than thevalue 4.3± 0.5 derived byFei et al. (1992), based ontheir smaller data set.
The Mie-Gruneisen (MG) EOS (e.g.,Speziale et al.,2001) requires the introduction of the concept of ther-mal pressure,PTh, resulting from a change in temper-ature from a reference temperature (300 K) at constantvolume (e.g.,Anderson et al. (1989), and referencestherein):
P(V, T ) = P(V, 300 K)+ PTh. (6)
P(V, 300 K) is taken from Eq.(1), andPTh can be ex-pressed through the Mie-Gruneisen equation,
PTh = γ(V )
V(E(T, θD) − E(300 K, θD)), (7)
w ¨
γ
wq ce.T ono
θ
w ee el(
E
ith the Gruneisen parameter
(V ) = γ0
(V
V0
)q
, (8)
here γ0 is the Gruneisen parameter atV0, and= (∂ ln γ/∂ lnV)T describes its volume dependenhe Debye temperature,θD, is assumed to be a functif volume, and to be temperature independent:
D = θD0
(V
V0
)−γ(V )
, (9)
ith θD0 the Debye temperature atV0. The thermal frenergyE in Eq.(7) is calculated from the Debye modDebye, 1912), using
(T, θD) = 9nRT
(T
θD
)3 θD/T∫0
x3 dx
ex − 1. (10)
172 W. van Westrenen et al. / Physics of the Earth and Planetary Interiors 151 (2005) 163–176
Notwithstanding the large number of availableP–V–Tdata, simultaneous least-squares fitting of all parame-ters (V0, KT0, K′
0, q, γ0, andθD0) produced physicallyunrealistic results (among them, a Debye temperaturebelow 60 K), because of strong correlations betweenthe individual fit parametersq, �0, andθD0. Follow-ing Speziale et al. (2001), we opted to fix the FP Debyetemperature,θD0. θD0 can be derived from calorimetricdata, from spectroscopic data, or from acoustic velocitymeasurements. For iron-free MgO, the first two meth-ods result inθD0 values in the range 743–762 K. In theMgO EOS ofSpeziale et al. (2001)θD0 was fixed to773 K, from the calorimetric data ofWatanabe (1982).Debye temperatures for pure MgO derived from acous-tic measurements, however, are approximately 200 Khigher (Anderson, 1998).
To our knowledge, neither calorimetric nor spectro-scopic data are available for (Mg0.64Fe0.36)O. To de-termine aθD0 that is consistent with the value of 773 Kfor pure MgO assumed bySpeziale et al. (2001), wetherefore comparedθD0 values calculated from acous-tic measurements, which were recently made for thecomplete range of compositions from MgO to FeO(Jacobsen et al., 2002). Acoustic θD0 values can becalculated using
θD0 = h
k
(3NAρ
4πµ
)1/3
vm (11)
whereh is Planck’s constant,k is Bolzmann’s constant,Nab
w aveva den-stvetθ
p n-d , andr sed,
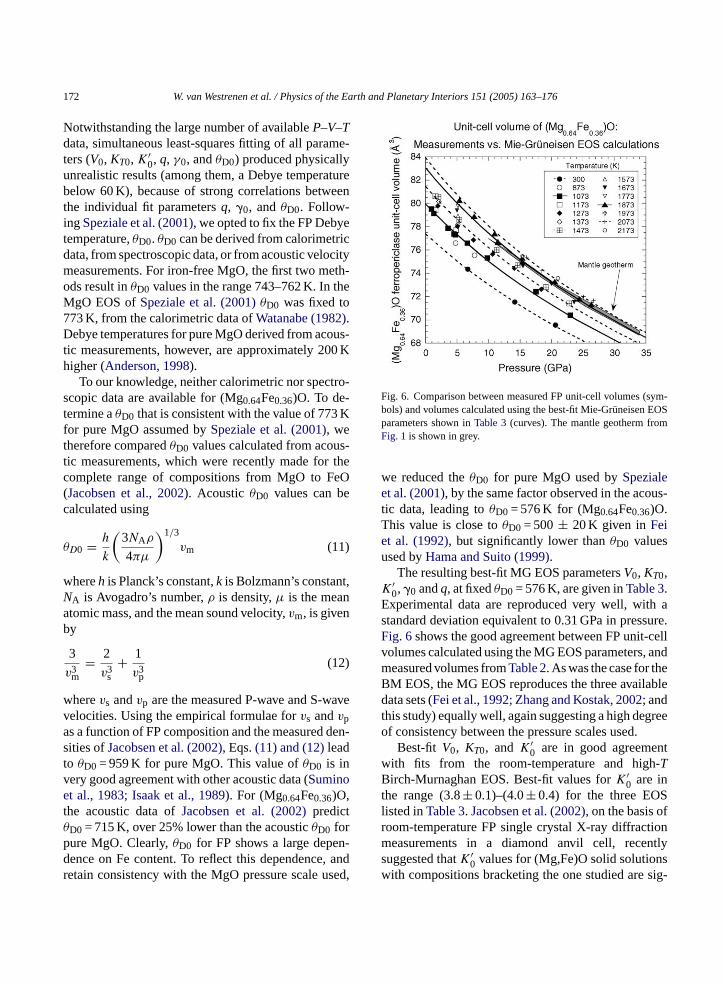
Fig. 6. Comparison between measured FP unit-cell volumes (sym-bols) and volumes calculated using the best-fit Mie-Gruneisen EOSparameters shown inTable 3(curves). The mantle geotherm fromFig. 1 is shown in grey.
we reduced theθD0 for pure MgO used bySpezialeet al. (2001), by the same factor observed in the acous-tic data, leading toθD0 = 576 K for (Mg0.64Fe0.36)O.This value is close toθD0 = 500 ± 20 K given inFeiet al. (1992), but significantly lower thanθD0 valuesused byHama and Suito (1999).
The resulting best-fit MG EOS parametersV0, KT0,K′
0, �0 andq, at fixedθD0 = 576 K, are given inTable 3.Experimental data are reproduced very well, with astandard deviation equivalent to 0.31 GPa in pressure.Fig. 6shows the good agreement between FP unit-cellvolumes calculated using the MG EOS parameters, andmeasured volumes fromTable 2. As was the case for theBM EOS, the MG EOS reproduces the three availabledata sets (Fei et al., 1992; Zhang and Kostak, 2002; andthis study) equally well, again suggesting a high degreeof consistency between the pressure scales used.
Best-fit V0, KT0, and K′0 are in good agreement
with fits from the room-temperature and high-TBirch-Murnaghan EOS. Best-fit values forK′
0 are inthe range (3.8± 0.1)–(4.0± 0.4) for the three EOSlisted inTable 3. Jacobsen et al. (2002), on the basis ofroom-temperature FP single crystal X-ray diffractionmeasurements in a diamond anvil cell, recentlysuggested thatK′
0 values for (Mg,Fe)O solid solutionswith compositions bracketing the one studied are sig-
A is Avogadro’s number,ρ is density,µ is the meantomic mass, and the mean sound velocity,vm, is giveny
3
v3m
= 2
v3s
+ 1
v3p
(12)
herevs andvp are the measured P-wave and S-welocities. Using the empirical formulae forvs andvps a function of FP composition and the measuredities ofJacobsen et al. (2002), Eqs.(11) and (12)leado θD0 = 959 K for pure MgO. This value ofθD0 is inery good agreement with other acoustic data (Suminot al., 1983; Isaak et al., 1989). For (Mg0.64Fe0.36)O,
he acoustic data ofJacobsen et al. (2002)predictD0 = 715 K, over 25% lower than the acousticθD0 forure MgO. Clearly,θD0 for FP shows a large depeence on Fe content. To reflect this dependenceetain consistency with the MgO pressure scale u
W. van Westrenen et al. / Physics of the Earth and Planetary Interiors 151 (2005) 163–176 173
nificantly higher (5.5± 0.1). Our results are not com-patible with this elevatedK′
0. A room-temperature BMEOS fit with K′
0 set to 5.5 yieldsKT0 = 142± 3 GPa,significantly lower than previously published FP bulkmoduli, and lower than any of the fits shown inTable 3.A possible explanation for this discrepancy is the rela-tively smaller pressure range covered byJacobsen et al.(2002), which has been observed previously to lead tohigher fit values ofK′
0 (e.g.,Brown, 1999). Additionalstudies will be required to resolve these issues.
The best-fit Gruneisen parameterγ0 = 1.63± 0.02,slightly higher than the value of 1.50± 0.05 derived byFei et al. (1992). Theq value is 0.54± 0.03, which iswithin the range given byFei et al. (1992). We notethatP–V–Tmeasurements provide tight constraints ontheaveragevalue ofγ(V) (Eq. (8)) across the volumerange covered by the data (e.g.,Jackson, 1998), ratherthan onγ0 itself. It is therefore possible that differentcombinations ofγ0 andq, that lead to similar values ofγ(V) in Eq.(8), provide equally good fits to theP–V–Tdata.
5. Discussion
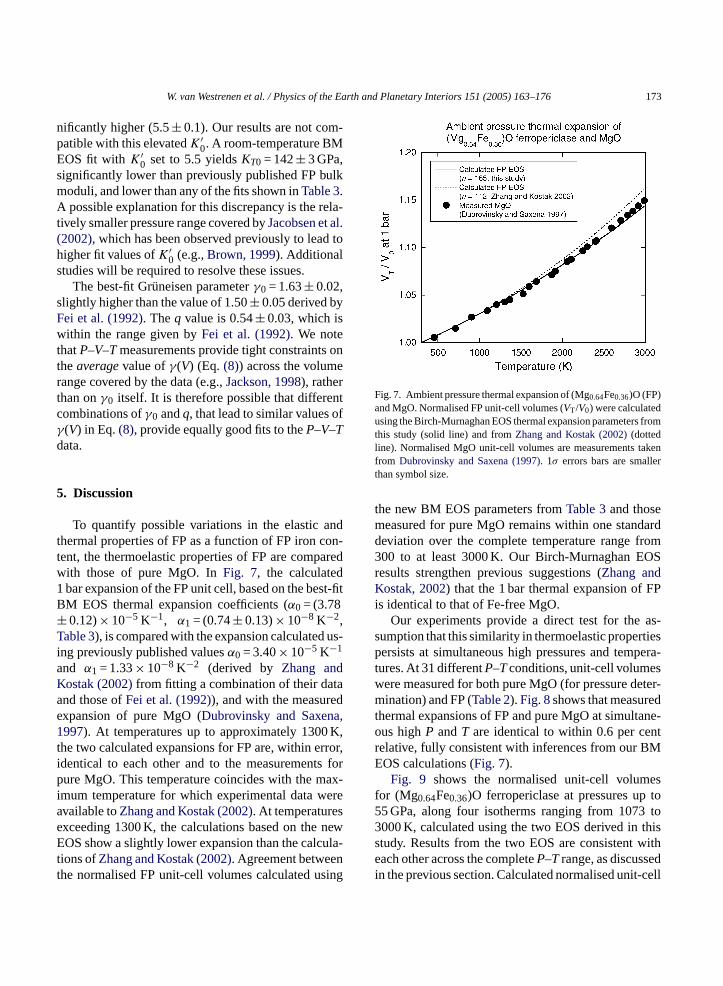
To quantify possible variations in the elastic andthermal properties of FP as a function of FP iron con-tent, the thermoelastic properties of FP are comparedwith those of pure MgO. InFig. 7, the calculated1 bar expansion of the FP unit cell, based on the best-fitB±T us-iaK taa de a,1 K,t rror,i s forp ax-i erea se newE ula-t nt sing
Fig. 7. Ambient pressure thermal expansion of (Mg0.64Fe0.36)O (FP)and MgO. Normalised FP unit-cell volumes (VT/V0) were calculatedusing the Birch-Murnaghan EOS thermal expansion parameters fromthis study (solid line) and fromZhang and Kostak (2002)(dottedline). Normalised MgO unit-cell volumes are measurements takenfrom Dubrovinsky and Saxena (1997). 1σ errors bars are smallerthan symbol size.
the new BM EOS parameters fromTable 3and thosemeasured for pure MgO remains within one standarddeviation over the complete temperature range from300 to at least 3000 K. Our Birch-Murnaghan EOSresults strengthen previous suggestions (Zhang andKostak, 2002) that the 1 bar thermal expansion of FPis identical to that of Fe-free MgO.
Our experiments provide a direct test for the as-sumption that this similarity in thermoelastic propertiespersists at simultaneous high pressures and tempera-tures. At 31 differentP–Tconditions, unit-cell volumeswere measured for both pure MgO (for pressure deter-mination) and FP (Table 2). Fig. 8shows that measuredthermal expansions of FP and pure MgO at simultane-ous highP andT are identical to within 0.6 per centrelative, fully consistent with inferences from our BMEOS calculations (Fig. 7).
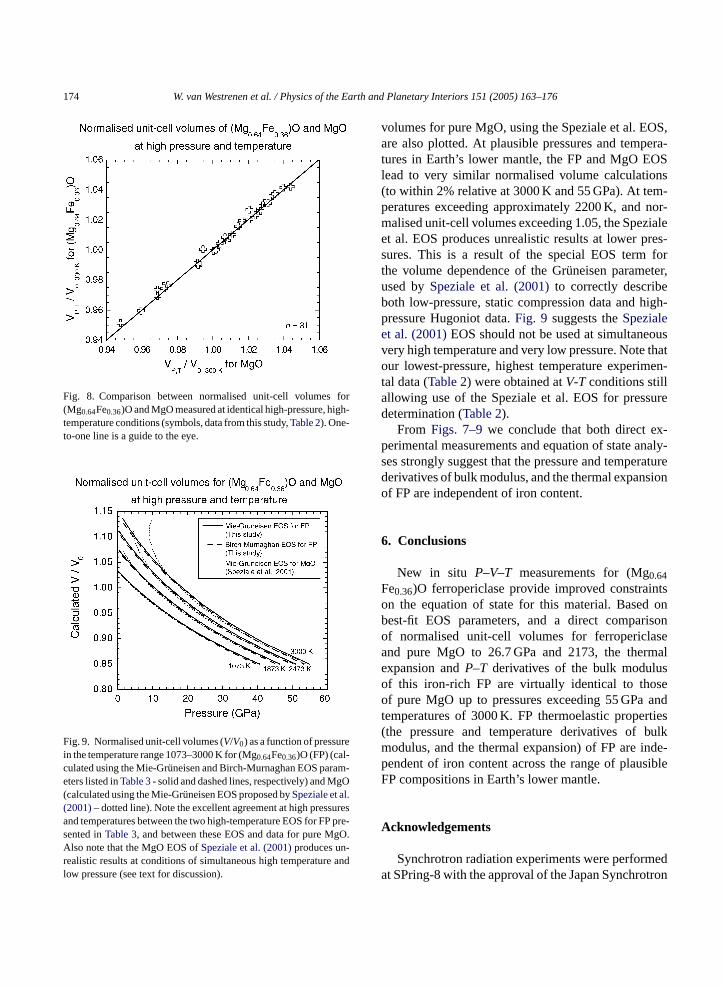
Fig. 9 shows the normalised unit-cell volumesfor (Mg0.64Fe0.36)O ferropericlase at pressures up to55 GPa, along four isotherms ranging from 1073 to3000 K, calculated using the two EOS derived in thisstudy. Results from the two EOS are consistent witheach other across the completeP–T range, as discussedin the previous section. Calculated normalised unit-cell
M EOS thermal expansion coefficients (α0 = (3.780.12)× 10−5 K−1, α1 = (0.74± 0.13)× 10−8 K−2,
able 3), is compared with the expansion calculatedng previously published valuesα0 = 3.40× 10⁻⁵ K−1
nd α1 = 1.33× 10⁻⁸ K−2 (derived by Zhang andostak (2002)from fitting a combination of their dand those ofFei et al. (1992)), and with the measurexpansion of pure MgO (Dubrovinsky and Saxen997). At temperatures up to approximately 1300
he two calculated expansions for FP are, within edentical to each other and to the measurementure MgO. This temperature coincides with the m
mum temperature for which experimental data wvailable toZhang and Kostak (2002). At temperaturexceeding 1300 K, the calculations based on theOS show a slightly lower expansion than the calc
ions ofZhang and Kostak (2002). Agreement betweehe normalised FP unit-cell volumes calculated u
174 W. van Westrenen et al. / Physics of the Earth and Planetary Interiors 151 (2005) 163–176
Fig. 8. Comparison between normalised unit-cell volumes for(Mg0.64Fe0.36)O and MgO measured at identical high-pressure, high-temperature conditions (symbols, data from this study,Table 2). One-to-one line is a guide to the eye.
Fig. 9. Normalised unit-cell volumes (V/V0) as a function of pressurein the temperature range 1073–3000 K for (Mg0.64Fe0.36)O (FP) (cal-culated using the Mie-Gruneisen and Birch-Murnaghan EOS param-eters listed inTable 3- solid and dashed lines, respectively) and MgO(calculated using the Mie-Gruneisen EOS proposed bySpeziale et al.(2001)– dotted line). Note the excellent agreement at high pressuresand temperatures between the two high-temperature EOS for FP pre-sented inTable 3, and between these EOS and data for pure MgO.Also note that the MgO EOS ofSpeziale et al. (2001)produces un-realistic results at conditions of simultaneous high temperature andlow pressure (see text for discussion).
volumes for pure MgO, using the Speziale et al. EOS,are also plotted. At plausible pressures and tempera-tures in Earth’s lower mantle, the FP and MgO EOSlead to very similar normalised volume calculations(to within 2% relative at 3000 K and 55 GPa). At tem-peratures exceeding approximately 2200 K, and nor-malised unit-cell volumes exceeding 1.05, the Spezialeet al. EOS produces unrealistic results at lower pres-sures. This is a result of the special EOS term forthe volume dependence of the Gruneisen parameter,used bySpeziale et al. (2001)to correctly describeboth low-pressure, static compression data and high-pressure Hugoniot data.Fig. 9 suggests theSpezialeet al. (2001)EOS should not be used at simultaneousvery high temperature and very low pressure. Note thatour lowest-pressure, highest temperature experimen-tal data (Table 2) were obtained atV-T conditions stillallowing use of the Speziale et al. EOS for pressuredetermination (Table 2).
From Figs. 7–9we conclude that both direct ex-perimental measurements and equation of state analy-ses strongly suggest that the pressure and temperaturederivatives of bulk modulus, and the thermal expansionof FP are independent of iron content.
6. Conclusions
New in situ P–V–T measurements for (Mg0.64Fe0.36)O ferropericlase provide improved constraintso onb isono sea rmale so seo andt rties( bulkm nde-p sibleF
A
eda tron
n the equation of state for this material. Basedest-fit EOS parameters, and a direct comparf normalised unit-cell volumes for ferropericland pure MgO to 26.7 GPa and 2173, the thexpansion andP–T derivatives of the bulk moduluf this iron-rich FP are virtually identical to thof pure MgO up to pressures exceeding 55 GPa
emperatures of 3000 K. FP thermoelastic propethe pressure and temperature derivatives ofodulus, and the thermal expansion) of FP are iendent of iron content across the range of plauP compositions in Earth’s lower mantle.
cknowledgements
Synchrotron radiation experiments were performt SPring-8 with the approval of the Japan Synchro
W. van Westrenen et al. / Physics of the Earth and Planetary Interiors 151 (2005) 163–176 175
Radiation Research Institute (JASRI) (Proposal Nos.2001B0487-ND-np, 2002A0485-ND2-np, 2003A-0053-CD2-np, and 2003A0094-ND2-np). This projectwas made possible through financial support fromthe Carnegie Institution of Washington, NSF (grantEAR9873577 to YF, grant EAR0074189 to JVO),and the Swiss National Science Foundation (grant2100-066903 to MWS). We thank Kouto Plaza forproviding nutrition during our beam time, and FraukjeBrouwer and six anonymi for their knowledgeableand constructive reviews that lead to significantimprovements in this manuscript.
References
Agee, C.B., 1998. Phase transformations and seismic structure in theupper mantle and transition zone. In: Hemley, R.J. (Ed.), Ultra-high pressure mineralogy: Physics and chemistry of the Earth’sdeep interior. Reviews in Mineralogy, 37. Mineralogical Societyof America, Washington, DC, pp. 65–203.
Anderson, O.L., 1998. Thermoelastic properties of MgSiO3 per-ovskite using the Debye approach. Am. Mineralogist 83,23–35.
Anderson, O.L., Isaak, D.G., Yamamoto, S., 1989. Anharmonicityand the equation of state for gold. J. Appl. Phys. 65, 1534–1543.
Andrault, D., 2001. Evaluation of (Mg,Fe) partitioning between sili-cate perovskite and magnesiowustite up to 120 GPa and 2300 K.J. Geophys. Res. 106, 2079–2087.
Angel, R.J., 2000. Equations of state. In: Hazen, R.M., Downs, R.T.(Eds.), High-Temperature and High-Pressure Crystal Chemistry.Mineralogical Society of America/Geochemical Society, Wash-
B . 71,
B s. 86,
d rato,ntle:arth
D r
D KCl,
D refer-t. 222,
D per-hys.
D qua-iner-s in
Mineralogy, 37. Mineralogical Society of America, Washington,DC, pp. 425–457.
Fei, Y., 1999. Effects of temperature and composition on the bulkmodulus of (Mg,Fe)O. Am. Mineralogist 84, 272–276.
Fei, Y., Li, J., Hirose, K., Minarik, W., Van Orman, J., Sanloup, C.,van Westrenen, W., Komabayashi, T., Funakoshi, K.-i., 2004.A critical evaluation of pressure scales at high temperatures byin situ X-ray diffraction measurements. Phys. Earth PlanetaryInteriors 143–144, 515–526.
Fei, Y., Mao, H.-K., Shu, J., Hu, J., 1992.P–V–T Equation of stateof magnesiowustite (Mg0.6Fe0.4)O. Phys. Chem. Minerals 18,416–422.
Hama, J., Suito, K., 1999. Thermoelastic properties of periclaseand magnesiowustite under high pressure and high temperature.Phys. Earth Planetary Interiors 114, 165–179.
Hilbrandt, N., Martin, M., 1998. High temperature point defect equi-libria in iron-doped MgO: An in situ Fe–K XANES study on thevalence and site distribution of iron in (Mg1−xFex)O. Berichteder Bunsen-Gesellschaft fur Physikalische Chemie 102, 1747–1759.
Irifune, T., 1994. Absence of an aluminous phase in the upper partof the Earth’s lower mantle. Nature 370, 131–133.
Irifune, T., Nishiyama, N., Kuroda, K., Inoue, T., Isshiki, M., Ut-sumi, W., Funakoshi, K.-i., Urakawa, S., Uchida, T., Katsura, T.,Ohtaka, O., 1998. The postspinel phase boundary in Mg2SiO4
determined by in situ X-ray diffraction. Science 279, 1698–1700.Isaak, D.G., Anderson, O.L., Goto, T., 1989. Measured elastic moduli
of single-crystal MgO up to 1800 K. Phys. Chem. Minerals 16,704–713.
Jackson, I., 1998. Elasticity, composition and temperature of theEarth’s lower mantle: a reappraisal. Geophys. J. Int. 134,291–311.
Jacobs, M.H.G., Oonk, H.A.J., 2000. A new equation of state basedon Grover, Getting and Kennedy’s empirical relation betweenvolume and bulk modulus. The high-pressure thermodynamics
J S.J.,anden-
ry. J.
J dy-. J.
K be-3,
K 002.re:ech-
M en-278,
M com-
ington, DC, pp. 35–59.irch, F., 1947. Finite elastic strain of cubic crystals. Phys. Rev
809–824.rown, J.M., 1999. The NaCl pressure standard. J. Appl. Phy
5801–5808.a Silva, C.R.S., Wentzcovitch, R.M., Patel, A., Price, G.D., Ka
S.I., 2000. The composition and geotherm of the lower maconstraints from the elasticity of silicate perovskite. Phys. EPlanetary Interiors 118, 103–109.
ebye, P., 1912. Zur Theorie der spezifischen Warmen. Annalen dePhysik 39, 789–840.
ecker, D.L., 1971. High-pressure equation of state for NaCl,and CsCl. J. Appl. Phys. 42, 3239–3244.
eschamps, F., Trampert, J., 2004. Towards a lower mantleence temperature and composition. Earth Planetary Sci. Let161–175.
ubrovinsky, L.S., Saxena, S.K., 1997. Thermal expansion oficlase (MgO) and tungsten (W) to melting temperatures. PChem. Minerals 24, 547–550.
uffy, T.S., Wang, Y., 1998. Pressure–volume–temperature etions of state. In: Hemley, R.J. (Ed.), Ultrahigh-pressure malogy: physics and chemistry of Earth’s deep interior. Review
of MgO. Phys. Chem. Chem. Phys. 2, 2641–2646.acobsen, S.D., Reichmann, H.-J., Spetzler, H.A., Mackwell,
Smyth, J.R., Angel, R.J., McCammon, C.A., 2002. Structureelasticity of single crystal (Mg,Fe)O and a new method of gerating shear waves for gigahertz ultrasonic interferometGeophys. Res. 107, 2, doi:10.1029/2001JB000490.
ung, I.-O., Decterov, S.A., Pelton, A.D., 2004. Critical thermonamic evaluation and optimization of the Fe–Mg–O systemPhys. Chem. Solids 65, 1683–1695.
atsura, T., Ito, E., 1996. Determination of Fe–Mg partitioningtween perovskite and magnesiowustite. Geophys. Res. Lett. 22005–2008.
ung, J., Li, B., Weidner, D.J., Zhang, J., Liebermann, R.C., 2Elasticity of (Mg0.83,Fe0.17)O ferropericlase at high pressuultrasonic measurements in conjunction with X-radiation tniques. Earth Planetary Sci. Lett. 203, 557–566.
ao, H.-K., Shen, G., Hemley, R.J., 1997. Multivariate depdence of Fe–Mg partitioning in the lower mantle. Science2098–2100.
arton, F.C., Cohen, R.E., 2002. Constraints on lower mantleposition from molecular dynamics simulations of MgSiO3 per-ovskite. Phys. Earth Planetary Interiors 134, 239–252.
176 W. van Westrenen et al. / Physics of the Earth and Planetary Interiors 151 (2005) 163–176
O’Neill, H.St.C., Pownceby, M.I., McCammon, C.A., 2003. Themagnesiowustite: iron equilibrium and its implications for theactivity-composition relations of (Mg,Fe)2SiO4 olivine solid so-lutions. Contr. Mineral. Petrol. 146, 308–325.
Pownceby, M.I., O’Neill, H.St.C., 1994. Thermodynamic data fromredox reactions at high-temperatures. 4. Calibration of theRe–ReO2 oxygen buffer from emf and NiO + Ni-Pd redox sensormeasurements. Chem. Geol. 118, 130–137.
Reichmann, H.-J., Jacobsen, S.D., Mackwell, S.J., McCammon,C.A., 2000. Sound wave velocities and elastic constants for mag-nesiowustite using Gigahertz interferometry. Geophys. Res. Lett.27, 799–802.
Rosenhauer, M., Mao, H.-K., Woermann, E., 1976. Compressibilityof magnesiowustite (Fe0.4Mg0.6)O to 264 kbar. Carnegie Institu-tion of Washington Year Book 75, 513–515.
Shim, S.-H., Duffy, T.S., Kenichi, T., 2002. Equation of state of goldand its application to the phase boundaries near 660 km depth inEarth’s mantle. Earth Planetary Sci. Lett. 203, 729–739.
Speziale, S., Zha, C.-S., Duffy, T.S., Hemley, R.J., Mao, H., 2001.Quasi-hydrostatic compression of magnesium oxide to 52 GPa:Implications for the pressure–volume–temperature equation ofstate. J. Geophys. Res. 106, 515–528.
Stixrude, L., Hemley, R.J., Fei, Y., Mao, H.-K., 1992. Ther-moelasticity of silicate perovskite and magnesiowustite and
stratification of the Earth’s mantle. Science 257, 1099–1101.
Sumino, Y., Anderson, O.L., Suzuki, I., 1983. Temperature coeffi-cients of elastic constants of single crystal MgO between 80 and1300 K. Phys. Chem. Minerals 9, 38–47.
van Westrenen, W., Van Orman, J., Watson, H., Fei, Y., Watson,E.B., 2003. Assessment of temperature gradient in multi-anvilassemblies using spinel layer growth kinetics. Geochem. Geo-phys. Geosyst. 4 (4), doi:10.1029/2002GC000474.
Wang, Y., Weidner, D.J., Liebermann, R.C., Zhao, Y., 1994. Thermalequation of state of (Mg,Fe)SiO3 perovskite and constraints oncomposition of the lower mantle. Phys. Earth Planetary Interiors83, 13–40.
Watanabe, H., 1982. Thermochemical properties of synthetic highpressure compounds relevant to Earth’s mantle. In: Akimoto, S.,Manghnani, M.H. (Eds.), High Pressure Research in Geophysics.Advances in Earth and Planetary Science, 12. Center for Aca-demic Publishing, Tokyo, pp. 441.
Wood, B.J., 2000. Phase transformations and partitioning relationsin peridotite under lower mantle conditions. Earth Planetary Sci.Lett. 174, 341–354.
Zhang, J., Kostak, P.J., 2002. Thermal equation of state of magne-siowustite (Mg0.6Fe0.4)O. Phys. Earth Planetary Interiors 129,301–311.