thermodynamic studies of osmotic flows...
TRANSCRIPT

TKK Dissertations 69Espoo 2007
THERMODYNAMIC STUDIES OF OSMOTIC FLOWS AND THEIR APPLICATION TO ENERGY CONVERSION SYSTEMSDoctoral Dissertation
Helsinki University of TechnologyDepartment of Mechanical EngineeringLaboratory of Applied Thermodynamics
Ari Seppälä

TKK Dissertations 69Espoo 2007
Dissertation for the degree of Doctor of Science in Technology to be presented with due permission of the Department of Mechanical Engineering for public examination and debate in Auditorium K216 at Helsinki University of Technology (Espoo, Finland) on the 26th of May, 2007, at 12 noon.
Helsinki University of TechnologyDepartment of Mechanical EngineeringLaboratory of Applied Thermodynamics
Teknillinen korkeakouluKonetekniikan osastoSovelletun termodynamiikan laboratorio
Ari Seppälä
THERMODYNAMIC STUDIES OF OSMOTIC FLOWS AND THEIR APPLICATION TO ENERGY CONVERSION SYSTEMSDoctoral Dissertation

Distribution:Helsinki University of TechnologyDepartment of Mechanical EngineeringLaboratory of Applied ThermodynamicsP.O. Box 4400FI - 02015 TKKFINLANDURL: http://www.termo.hut.fi/Tel. +358-9-451 3581Fax +358-9-455 3724E-mail: [email protected]
© 2007 Ari Seppälä
ISBN 978-951-22-8774-1ISBN 978-951-22-8775-8 (PDF)ISSN 1795-2239ISSN 1795-4584 (PDF) URL: http://lib.tkk.fi/Diss/2007/isbn9789512287758/
TKK-DISS-2295
Multiprint OyEspoo 2007
AB
HELSINKI UNIVERSITY OF TECHNOLOGY P. O. BOX 1000, FI-02015 TKK http://www.tkk.fi
ABSTRACT OF DOCTORAL DISSERTATION
Author Ari Seppälä
Name of the dissertation Thermodynamic studies of osmotic flows and their application to energy conversion systems
Date of manuscript November 2, 2006 Date of the dissertation May 26, 2007
Monograph x Article dissertation (summary + original articles)
Department Mechanical Engineering Laboratory Applied Thermodynamics Field of research Thermodynamics, Mass Transfer Opponents Prof. Riitta Keiski and Prof. Simo Liukkonen Supervisor prof. Markku Lampinen (Instructor) prof. Markku Lampinen
Abstract
The thermodynamics of osmotic flows and different ways in which they have been applied to energy conversion are studied.
A transport model for a solution flow inside a hollow cylindrical osmotic fibre was derived. With this model, a thermodynamic 1st and
2nd Law osmotic energy converter optimisation was performed. The study illustrates the possibilities of the optimisation of membrane
modules where the streams are conducted to flow inside narrow cavities. As a result, it is shown that many important optimal operation
parameters of osmotic power generation systems can be detected. Furthermore, it is shown that the position of local minimum entropy
generation rate can be found in the flow of a solution inside an osmotic hollow fibre.
An alternative osmotic energy converter working cyclically is also studied. Such a system would use osmosis to increase the pressure of a
solution placed in a closed vessel. After a suitable loading time, part of the pressurised solution is released into a turbine and the pressurising
of the vessel starts again.
The external and internal concentration boundary layers appearing in the osmotic phenomenon are analysed. This analysis includes
supplements to the solution of laminar flow between one permeable and one non-permeable wall. On the basis of this analysis and on
experiments, two non-linear alternatives to the traditional linear transport equations for osmotic water flow are suggested. Furthermore, the
common opinion that the concentration accumulation inside the support structure (so-called internal polarisation) of an asymmetric
membrane is the main reason for the non-linear behaviour frequently found in osmotic flow experiments was found to be questionable.
A Second Law efficiency equation for an osmotic membrane is derived. This equation provides an estimation of acceptable solute leakage
through the membrane. It is also found that for the membrane to perform in a thermodynamically efficient way, the dimensionless product of
the osmotic flux and diffusion resistance of the support structure should be small, usually below unity. Otherwise, the support structure of the
membrane will cause significant destruction of the available power.
Keywords osmosis, osmotic power generation, mass transfer, entropy generation, fluid mechanics ISBN (printed) 978-951-22-8774-1 ISSN (printed) 1795-2239
ISBN (pdf) 978-951-22-8775-8 ISSN (pdf) 1795-4584
ISBN (others) Number of pages 47 p.+ articles 94 p.
Publisher Helsinki University of Technology, Dept. of Mech. Eng., Lab. of Applied Thermodynamics
Print distribution Laboratory of Applied Thermodynamics
x The dissertation can be read at http://lib.tkk.fi/Diss/2007/isbn9789512287758/


AB
TEKNILLINEN KORKEAKOULU PL 1000, 02015 TKK http://www.tkk.fi
VÄITÖSKIRJAN TIIVISTELMÄ
Tekijä Ari Seppälä
Väitöskirjan nimi
Osmoosin termodynamiikka ja sen sovellutukset energian muuntoprosesseissa
Käsikirjoituksen jättämispäivämäärä 2.11.2006 Väitöstilaisuuden ajankohta 26.05.2007
Monografia x Yhdistelmäväitöskirja (yhteenveto + erillisartikkelit)
Osasto Konetekniikka Laboratorio Sovellettu termodynamiikka Tutkimusala Termodynamiikka ja aineensiirto-oppi Vastaväittäjä(t) Prof. Riitta Keiski ja Prof. Simo Liukkonen Työn valvoja Prof. Markku Lampinen (Työn ohjaaja) Prof. Markku Lampinen Tiivistelmä
Työssä on tutkittu osmoottisten virtausten termodynamiikkaa sekä eri menetelmiä, joilla osmoosi-ilmiötä voidaan hyödyntää energianmuuntoprosesseissa. Sylinterimäisen onton kuidun sisällä virtaavalle liuokselle on johdettu aineensiirtomalli. Kuidun seinämät muodostuvat osmoosikalvosta. Mallia on käytetty termodynamiikan 1. ja 2. pääsääntöön perustuvaan osmoosivoimalan optimointiin, jonka tuloksena voidaan määrittää systeemin monen tärkeän parametrin optimaalinen arvo. Lisäksi voidaan osoittaa, että osmoosin avulla kasvavassa virtauksessa syntyy paikallinen entropian generoitumisen minimi tiettyyn kohtaan virtausta. Työssä on lisäksi esitetty ja analysoitu perusperiaate syklimäisesti toimivalle osmoottiselle energianmuuntimelle. Tällainen systeemi käyttää osmoosi-ilmiötä liuoksen paineen kasvattamiseen suljetun säiliön sisällä. Osa paineistetusta liuoksesta johdetaan turbiinin, jonka jälkeen säiliön paineistus käynnistyy uudelleen. Työssä määritettiin kalvon ulkopuolelle sekä tukikerrokseen osmoosivirtauksen yhteydessä syntyvät konsentraatiorajakerrokset. Tähän analyysiin liittyen esitetään täydennyksiä Navier-Stokes liikemääräyhtälöihin perustuvalle nopeus- ja painejakaumien ratkaisulle tapauksessa, jossa ainetta virtaa laminaarisesti kahden seinämän välissä. Toinen seinämä on ainetta läpäisevä ja toinen läpäisemätön. Mittauksiin ja rajakerrosanalyysiin pohjautuen esitetään kaksi uutta epälineaarista yhtälöä vaihtoehtona traditionaalisille lineaarisille osmoottisille kuljetusyhtälöille. Lisäksi kirjallisuudessa yleisesti esitetty mielipide rajakerrosten merkityksestä tärkeimpänä selittävänä tekijänä osmoosivirtauksen epälineaariselle käyttäytymiselle havaittiin kyseenalaiseksi, ainakin epäsymmetristen kalvojen osalta. Osmoosikalvoille johdettiin matemaattinen lauseke termodynamiikan 2. pääsäännön mukaiselle hyötysuhteelle. Yhtälön avulla voidaan arvioida kuinka suuri liuenneen aineen vuoto voidaan kalvolle sallia, jotta kalvo vielä toimisi tehokkaasti. Tutkimuksessa havaittiin lisäksi, että termodynaamisessa mielessä tehokkaan toiminnan kannalta on tärkeää, että osmoottisen vedenvirtausnopeuden ja kalvon tukikerroksen diffuusiovastuksen tulo on alhainen. Tämän dimensiottoman tulon arvon tulee yleensä saada arvoja alle 1. Muussa tapauksessa kalvon tukikerros hävittää merkittävän osan hyödynnettävissä olevasta tehosta.
Asiasanat osmoosi, energian muuntaminen, aineensiirto, entropian generointi, virtausmekaniikka
ISBN (painettu) 978-951-22-8774-1 ISSN (painettu) 1795-2239
ISBN (pdf) 978-951-22-8775-8 ISSN (pdf) 1795-4584
ISBN (muut) Sivumäärä 47 s.+ julkaisut 94 s.
Julkaisija Teknillinen korkeakoulu, Konetekniikan osasto, Sovelletun termodynamiikan laboratorio
Painetun väitöskirjan jakelu Sovelletun termodynamiikan laboratorio
x Luettavissa verkossa osoitteessa http://lib.tkk.fi/Diss/ isbn9789512287758/


PREFACE This work was carried out during the years 1998-2002 and 2006 at the Laboratory of Applied Thermodynamics of Helsinki University of Technology (HUT). The study was funded by National Technology Agency of Finland (Tekes), European Commission and K.V. Lindholms stiftelse. All financers are acknowledged. I would like to express my gratitude to my supervisor, Prof. Markku J. Lampinen. His wide knowledge and understanding of various branches of physics, chemistry, and mathematics has helped me greatly with the work. I would also like to thank him for his inspiring teaching on the post-graduate courses, as well as for his excellent textbooks. The Laboratory Manager, Lic.Sc. Kari Saari, has given me invaluable help with experimental problems. Docent Mamdouh El Haj Assad and Mr. Voitto W. Kotiaho, both from HUT, are to be thanked for several fruitful discussions on thermodynamics and co-operation with the research. I am also grateful to Professor William J. Koros (Georgia Institute of Technology, Editor-in-Chief of J.Membr.Sci.) for his encouragement and constructive comments concerning Paper IV. Mr. Jukka-Pekka Pentinsaari and Prof. Petri Varsta, the Head of the Mechanical Department of HUT, have also given important encouragement and support in the completion of this thesis. I also wish to thank Mr. Veijo Kivipelto for his professional work in the construction of the measurement device. My wife Sari and my sons Pyry and Aarni are the key background supporters whose influence has been enormous and who have had to tolerate my instability at home caused by this thesis. Finally, the reviewers of Papers I, III, and V of this thesis and all the other people who have encouraged me or given useful advice are acknowledged. I wish to warmly thank all the above persons. Espoo, September 2006 Ari Seppälä

8
CONTENTS PREFACE…………………………………………………………………………...……..7 NOMENCLATURE…………………………………………………………………..…...9 LIST OF PUBLICATIONS…………………………………………………………….…12 1. INTRODUCTION……………………………………………………………………….…13 2. THERMODYNAMICS OF OSMOSIS ……………………………………………………......14
2.1 Osmotic pressure of a liquid solution………………………………………....14 2.2 Absorption of heat during osmotic process…………………………………..18 2.3 Technical applications based on osmosis……………………………………..19 2.4 Energy conversion by osmosis………………………………………………..20
2.4.1 Maximum obtainable power from mixing species………………………....20 2.4.2 Different concepts of osmotic energy converters……………………….….21
3. OSMOTIC TRANSPORT OF SPECIES……………………………………………………….23
3.1 Boundary layers……………………………………………………………….25 3.1.1 Concentration and velocity profiles external to the membrane…………….25 3.1.2 Transport inside the support structure……………………………………...26
3.2 Transport of species through the skin…………………………………………27
4. THERMODYNAMIC ANALYSES OF OSMOTIC FLOWS AND THEIR APPLICATION TO POWER GENERATION……………………………………………………………………………….29
4.1 Model for a solution flow inside hollow cylindrical osmotic fibre and the optimising of pressure-retarded osmosis power generation systems (Paper I) ...29
4.1.1 Flow of a solution inside hollow cylindrical fibres whose walls behave like osmotic membranes…………………………………………29 4.1.2 First Law optimisation of the net power of osmosis energy converters…...31 4.1.3 Second Law optimisation …………………………………………………32 4.1.4 The minimum of local entropy generation in an osmotically increasing solution flow process………………………………………………………33
4.2 A cyclically operating osmotic energy converter (Paper II)………………….34 4.3 Solution for the velocity and pressure distribution for laminar flow inside a two-dimensional channel where one wall is permeable (Paper III)…...…….36 4.4 Osmotic flow through a membrane (Paper IV)……………………………….39
4.4.1 Non-linear transport models for osmotic water flux………………..39 4.4.2 Transport of solute through membranes…………………………….41
4.5 Second Law efficiency of osmotic membrane (Paper V)……………………..41 5. DISCUSSION AND CONCLUSIONS……………………………………………………...…43 REFERENCES …………………………………………………………………………………………...….44 APPENDIX I: ERRATA IN PAPERS I, III, AND IV…………...………………….....…47

9
NOMENCLATURE a activity A transport coefficient for the membrane, m/sPa A surface area, m2 A1, A2, A3.. constants Aw, Bw transport coefficients for solvent, mol/m2s As, Bs transport coefficients for solute, mol/m2s A,,B,,C,,D processes b external force, N/kg c total concentration mol/m3 ci concentration of species i, mol/m3 D binary diffusion coefficient, m2/s D* diffusion coefficient, m2/s Deff effective diffusion coefficient, m2/s f power destruction ratio F free energy of the interface, J g gravitational acceleration, m/s2 G Gibbs energy, J h height, m h molar specific enthalpy, J/mol
.H enthalpy flux, W/m2 j diffusion flux, kg/m2s J molar flux, mol/m2s k polytropic exponent kb gas consant, Nm/K kp permeability, m2 L lenght, m
filtL filtration coefficient, m/sPa
reflL reflection coefficient m molality, mol/kg M molar mass, kg/mol n number of molecules, mol n mass flow relative to stationary co-ordinates, kg/m2s N molar flow, mol/s p pressure, Pa P power, W or W/m2
rp dimensionless pressure .
Q heat flux, W or W/m2 r ratio between solvent flux and solute flux r radial co-ordinate, m ro fibre radius, m R universal gas constant (Paper I), J/molK Rdiff diffusion resistance of the support structure, s/m Rf resistance for flow Ns ℜ universal gas constant, J/molK

10
Re Reynolds number s molar specific entropy, J/molK S entropy, J/K t time, s T temperature, K u velocity vector, m/s v mass average velocity, m/s vw permeating flux, m/s
.V volume flow, m3/s
perm
''V.
permeating flux (Paper I), m/s
W work, J W channel width (Paper III), m x co-ordinate, m x molar fraction y co-ordinate, m z co-ordinate, m Greek letters and other symbols α isobaric coefficient of volume expansion, 1/K α coefficient in slip coefficient (Paper III) γ isobaric coefficient of volume expansion (Paper V), 1/K Γ driving force of flows, N/m2 ε Second Law efficiency for an osmotic power plant η dynamic viscosity (Chapters 1-5), N/sm2
η
Second Law efficiency for an osmotic membrane
pumpη efficiency of the pump
turbη efficiency of the turbine κ isothermal compressibility, 1/Pa
λ dimensionless co-ordinate µ chemical potential, J/mol µ dynamic viscosity (Papers I-IV), N/sm2 ν kinematic viscosity, m2/s
iν (T,p) molar specific volume of species i, m3/mol
iν (T,p,xi) partial volume of species i in a solution, m3/mol ξ transport coefficient π osmotic pressure (osmotic potential) , Pa π = 3.14159… Π dimensionless term ρ density, kg/m3 σ rate of entropy generation, W/K (W/Km2 in Paper V)
'''σ local rate of entropy generation, W/Km3 τ tortuosity
±ϕϕ, activity coefficients Φ dimensionless transport coefficient

11
Ψ ratio between power and entropy generation, K ω solute permeability, mol/Ns Ω dynamical osmotic potential, N/m2 φ , ∅ porosity ∇ gradient ∂ partial differential
λℑ external force perpendicular to the membranes, N/m3 Θ dimensionless slip coefficient
Subscripts and superscripts BS basic system c converter fw fresh water g gas H high concentration side IS improved system L low concentration side m, mean mean value opt optimal perm permeating ref reference s solute or surface ss solute at the surface turb turbine w wall when attached with velocity or Reynolds number, otherwise solvent 0 initial or reference value

12
LIST OF PUBLICATIONS This thesis consists of a review of the following five studies, which are subsequently referred to as Papers I - V: I. Seppälä A, Lampinen MJ. 1999. Thermodynamic optimising of pressure-retarded osmosis power generation systems. Journal of Membrane Science 161: 115-138. II. Seppälä A., Lampinen MJ, Kotiaho W. 2001. A new concept for an osmotic energy converter. International Journal of Energy Research 25 (15): 1359-1379. III. Seppälä A. Some improvements to the approximate analytical solution of the problem of laminar flow between permeable and impermeable wall. 2001. Acta Polytechnica Scandinavica (Mechanical Engineering Series) 152: 1 - 21. IV. Seppälä A, Lampinen MJ. 2004. On the non-linearity of osmotic flow. Experimental Thermal and Fluid Science 28: 283-296. V. Seppälä A, El Haj Assad M. 2003. Effect of the solute leakage on the thermodynamical performance of an osmotic membrane. Journal of Non-Equilibrium Thermodynamics 28(3): 269-278.

13
1. INTRODUCTION Energy can be converted into a useful form by letting miscible fluids of different compositions mix with each other. A major natural source for such a process is the earth’s river and ocean water resources. For example, mixing 1m3/s of river water and 1 m3/s of ocean water could theoretically supply 1.6 MW of power. It has been estimated that e.g. the Mississippi river alone yields a 4 GW theoretical potential for power production (Norman 1974), if only 10% of the river flow is utilised. This process of mixing river and ocean water would provide renewable, permanent, and practically waste-free power production. An alternative source is provided by concentrated industrial brines. Despite the great potential, energy conversion from mixing species is not yet an economically viable energy conversion method. In general, the production of power from mixing solutions of different compositions could be based on e.g. the vapour pressure differences (Olsson et al. 1979), the ionic differences of solutions (see e.g. the reverse electrodialysis studies of Pattle (1954) or Weinstein and Leitz (1976)), on density differences, on the temperature changes in mixing, or on the application of selective osmotic membranes. This latter alternative, and the osmotic phenomenon, are the main topics of this thesis. The energy conversion method utilising osmotic membranes is often called pressure-retarded osmosis power generation1. Probably the most important device in present-day osmotic energy converter concepts is the membrane module, which consists of a large number of membranes providing a large membrane surface area. The performance of the membranes and the module is crucial for efficient energy conversion. Sections 2 and 3 present the background to Papers I-V. In Section 2, a review of one of the key concepts of osmosis, osmotic pressure, is presented. Furthermore, the potential of the mixing process for power production is discussed and the basic principles of current concepts of osmotic energy conversion systems are presented. In Section 3, the background for the transport of species controlled by osmotic membranes is presented. Section 4 is devoted to the results of Papers I-V. In Paper I, a transport model for a solution flow inside a hollow cylindrical osmotic fibre is developed. With this model a thermodynamic 1st and 2nd Law optimisation of an osmotic energy converter was performed and, furthermore, the local production rate of entropy in a solution flowing inside the hollow fibre was examined. The analysis of an alternative way to extract the available energy from mixing species, based on the cyclical pressurisation of a solution, is performed in Paper II. Paper III includes supplements to the solution of laminar flow between one permeable and one non-permeable wall. This solution can be applied e.g. when concentration distribution external to the flat sheet membrane is being estimated. Careful estimation of this distribution is important for the study of the performance of the selective layer of the membrane and the performance of membrane modules.
1 In the engineering literature, the osmotic flow of solvent through a selective membrane from a diluted solution to a concentrated, pressurised solution ( 0p >∆ ) is often called pressure-retarded osmosis. Thus, in pressure-retarded osmosis, the solvent moves naturally from low pressure to high pressure. This is the same phenomenon that occurs in nature and in the natural sciences it is called osmosis. In the engineering literature, a distinction is often made between pressure-retarded osmosis and direct osmosis. The latter is a term used for experiments and applications with a trans-membrane pressure difference of practically zero ( 0p ≈∆ ). Direct osmosis is alternatively called forward osmosis.

14
The osmotic water flux through the selective layer of a membrane is conventionally estimated by linear equations. By experiments and by calculation of the external and internal concentration boundary layers, two alternative non-linear transport equations for osmotic water flow are suggested in Paper IV. Furthermore, the common view that the concentration accumulation inside the support structure of the membrane (so-called internal polarisation) is the main reason for the non-linear behaviour frequently found in osmotic flow experiments was found to be questionable. Paper V consists of a Second Law efficiency analysis of an osmotic membrane. The equations derived permit the examination of how selective the membrane should be, as well as the role of the support structure in the destruction of available energy. 2. THERMODYNAMICS OF OSMOSIS Osmosis can be considered as a natural mixing process in which two solutions of different compositions are separated from each other with a membrane. The osmotic membrane allows one or some of the components of the solution (hereafter referred to either as solvent or as water) to permeate spontaneously at a considerably higher rate than the others (hereafter referred to as solute). Therefore, the movement that performs the mixing of the solutions is mainly caused by the "one-way traffic" of the solvent. This permits the spontaneous transport of the solvent in an unusual way. It can move from a low-pressure solution through a membrane to a high-pressure solution, as long as the chemical potential of the solvent remains higher on the low-pressure side than on the high-pressure side. 2.1 Osmotic pressure of a liquid solution In an osmotic system, as illustrated in Fig. 1, pure solvent is separated from a solution of the solvent and dissolved solute by an ideal semipermeable membrane. The ideal membrane completely blocks the movement of the solute but allows the transmission of the solvent. The solution compartment is rigid and the pure solvent is in free contact with the environment at a pressure p0. In equilibrium, the temperature of the pure solvent and Figure 1equilibri
pu po
ideal semi-permeablemembrane. Ideal osmotic sysum. Js = trans-memb
re water pure water po
solutionp
JwJs = 0
temran
rigid wall
a) before equilibrium (non-equilibrium ae solute flux and Jw = trans-membrane solve
solution p
Jw= 0Js = 0
π=− opp
π<− opps Jw ≠ 0) and b) in nt flux.

15
solution will be the same, but the pressure of the solution will be higher than the pressure of the pure solvent. The equilibrium pressure difference is called osmotic pressure, or osmotic potential, which is denoted by the symbol π . In equilibrium, the chemical potential of the solvent wµ is equal on both sides of the semipermeable membrane:
solventpurew
solutionw µ=µ . (1)
The chemical potential of the solvent w in a solution can be expressed as
( ) ∫ ν+ℜ+µ=µp
p
www0www
0
dp)p,T()x,p,T(alnT)p,T()x,p,T( (2)
or alternatively as
( ) ∫ ν+ℜ+µ=µp
p
www0w0www
o
dp)x,p,T()x,p,T(alnT)p,T()x,p,T( , (3)
where ℜ is the universal gas constant, wν (T,p) the molar specific volume of pure solvent,
wν (T,p,xw) the partial volume of solvent in a solution, xw the mole fraction of solvent, aw the activity of solvent and )p,T( 0wµ the chemical potential of a pure solvent at pressure p0 and temperature T. For the pure solvent
1a solvent purew = . (4)
Hence, the equilibrium condition for the solvent is, applying Eq. (1) and either Eq.(2) or Eq. (3),
0dp)aln(Tsolutionp
p
wsolutionw
0
=ν+ℜ ∫ . (5)
In Eq. (5), the definition of solvent activity solution
wa in solution and the definition of wν depends on which of Equations (2) or (3) we apply. If we apply Eq. (2), then
)p,T(ww ν=ν and )x,p,T(aa wwsolutionw = . If, instead, we apply Eq. (3), then
)x,p,T( www ν=ν and )x,p,T(aa w0wsolutionw = . Usually, wν is considered as
independent of pressure in the integration of Eq. (5). We then get the result of the osmotic pressure as
solutionw
w
alnTνℜ
−=π , (6)

16
where we have denoted the equilibrium pressure difference over the membrane psolution - p0 as the osmotic pressure π . By using the osmotic coefficient from Platfor (1979), we can calculate from Eq. (6) that at e.g. 25 oC for a 6 mol/kg NaCl-water solution π = 381 bar. Similarly at 25 oC for a 6 mol/kg CaCl2-water solution we get π = 1301 bar. The osmotic pressure of ocean water at 25 oC is about 23 bar, corresponding to the salt molality 0.5 mol/kg. Let us consider the evolution of solution pressure in the situation shown in Fig. 1. This evolution of pressure is illustrated in Fig. 2 for the case where both the solution pressure and the pure water pressure are initially at pressure po. If the solution and pure water are separated from each other by an ideal membrane, the pressure in the rigid compartment of Fig. 1 will, as described previously, increase until the pressure difference corresponds to the osmotic pressure. If the solute flux 0J s ≠ , i.e. the membrane is not ideal, the maximum obtainable solution pressure difference will be below the osmotic pressure. When the solution reaches the maximum pressure, equilibrium between the solutions on both sides of the leaking membrane does not exist: even though the water flux tends first to approach zero, the solute continues to penetrate from the right-hand compartment of Fig. 1 to the left, causing continuous dilution of the right-hand compartment. The osmotic pressure of the solution in the right-hand compartment decreases and the water slowly Figure 2. Time evolution of solution pressure (p) in a rigid container. Oneconstructed of an osmotic membrane that separates the solution from initmembrane with minor solute leakage t3>>t2, the time t1 for reachingdepends strongly on the characteristics of the membrane (water permeabon the experimental set-up (ratio between solution volume and surface areof mixing etc.). A typical value for t1 can range in experiments from mSection 4.2, we analyse a system where t1 can be less than a second.
∞time
membrane with small solute leakage
ideal membrane (no solute leakage) op+π
p
po
t1 t2 t30
wall of the container is ially pure solvent. For a the maximum pressure ility and selectivity) and a of the membrane, rate inutes to a few days. In

17
starts moving back from the right-hand compartment into the left-hand one. This movement from right to left continues until equilibrium, where both the pressure and concentration of the compartments are identical, is reached. In the literature of the thermodynamics of solutions, alternatives to the osmotic potential expressed in Eq.(6) appear. In Table 1, a selection (not complete) of different equations is presented. Although widely accepted, Eq. (6) has also been criticised by Hammel (1979), who pointed out that the equation is not a thermodynamic statement because of the obscure concept of activity. He developed a new model (not presented in this thesis), according to which the osmotic potential of a solution equals the so-called enhanced solvent tension. Lewis (1908) proposed an equation takes into account the compressibility ( κ ) of the solvent by assuming a linear relationship between the molar volume and pressure:
ww
2 xlnT½νℜ
−=κπ−π . (7)
Table 1. Some proposed equations for osmotic potential. For ionic solutions concentration cs is calculated for the total number of dissolved ions. Equation for osmotic potential
ww
alnTνℜ
−=π Basic equation for real, non-compressible solution.
( )...Ac1Tc ss ++ℜ=π Alternative equation for non-ideal, non-compressible solution. A is an osmotic virial coefficient.
Tcsℜ=π Van't Hoff equation for ideal dilute solution.
ww
2 xlnT½νℜ
−=κπ−π Lewis's formula for ideal solution with a linear relationship between the molar volume of solvent and pressure. Constant compressibility ( κ ) of solvent assumed.
ν
ℜκ+
κ−
=π0w
walnT1ln1
Equation for real solution that allows non-linear relationship with the molar volume of solvent and pressure. Constant compressibility ( κ ) of solvent assumed and 0wν is defined at pressure po.
This equation appears only seldom in the literature. Eq. (8) offers yet another alternative, where the solution is real and the compressibility effect is taken into account:
ν
ℜκ+
κ−
=π0w
solutionwalnT
1ln1 . (8)
This equation is developed in this work and it is briefly derived and discussed below. The isothermal compressibility is defined as
18
TT p
ln
p1
∂
∂−=
∂
∂−=κ ww
w
vv
v . (9)
If we consider κ as constant and integrate Eq. (9) at a fixed temperature, we get
[ ])pp(exp o−κ−= w0w vv , (10) where w0v is defined at pressure p0. Substituting this in the equilibrium condition Eq. (5) and performing the integration yields to Eq. (8). Applying L'Hospital's rule, the following limit holds:
b)b1ln(0
lim=
κκ+
→κ. (11)
By realising that vw in Eq. (6) is considered independent of pressure (i.e. we can set in Eq. (6): w0w vv = ), it can easily be verified from the above limit that Eq. (6) is a special case
0→κ of Eq. (8). The relative difference of Eq.(6) compared to Eq.(8) is
)(11
)()()(
diff8.Eq8.Eq
6.Eq8.Eq )( 8.Eqeκπ−
−=π
π−π=
κπ−
. (12)
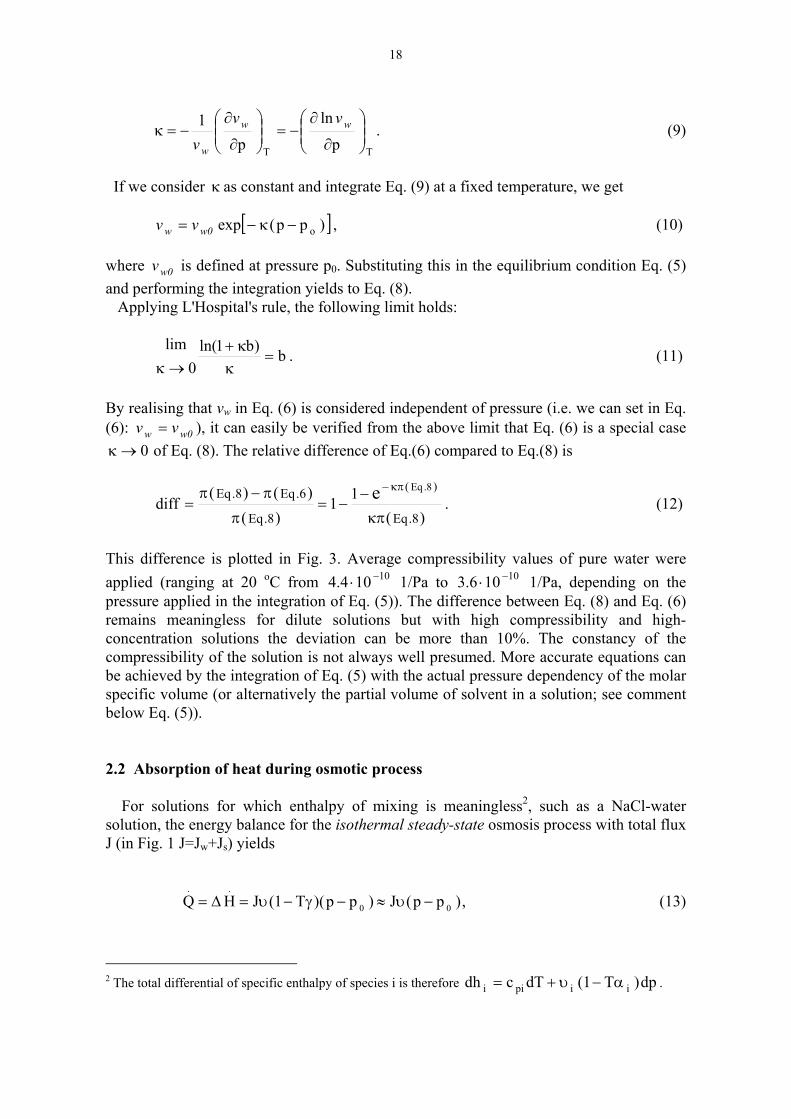
This difference is plotted in Fig. 3. Average compressibility values of pure water were applied (ranging at 20 oC from 10104.4 −⋅ 1/Pa to 10106.3 −⋅ 1/Pa, depending on the pressure applied in the integration of Eq. (5)). The difference between Eq. (8) and Eq. (6) remains meaningless for dilute solutions but with high compressibility and high-concentration solutions the deviation can be more than 10%. The constancy of the compressibility of the solution is not always well presumed. More accurate equations can be achieved by the integration of Eq. (5) with the actual pressure dependency of the molar specific volume (or alternatively the partial volume of solvent in a solution; see comment below Eq. (5)). 2.2 Absorption of heat during osmotic process For solutions for which enthalpy of mixing is meaningless2, such as a NaCl-water solution, the energy balance for the isothermal steady-state osmosis process with total flux J (in Fig. 1 J=Jw+Js) yields
,)pp(J )pp)(T1(JHQ 00
..−υ≈−γ−υ=∆= (13)
2 The total differential of specific enthalpy of species i is therefore dp)T1(dTcdh iipii α−υ+= .

19
Figure 3. Difference in osmotic pressure between equation for zero compressibility of solvent (Eq. (6)) and equation for constant compressibility (Eq.(8)). The osmotic pressure on the x-axis corresponds to the value estimated from Eq.(8).
where .
H is the enthalpy flux of the mixture, .
Q the net heat flux to the membrane, p the solution pressure, po the pressure of pure solvent, and γ the isobaric coefficient of volume expansion. Thus, in the sense of energy conversion, the spontaneous movement of water or solvent from low pressure po into high pressure p is fulfilled by absorbing heat from the environment. 2.3 Technical applications based on osmosis 'No physical phenomenon has any greater import in biology than does osmosis'. This is how F. Eugene Yates (1979), the editor of the American Journal of Physiology, praises the significance of osmosis in living systems in opening a forum on osmosis. The role of osmosis in the present-day technical sciences is very different to the one it has in the biological sciences: there are only a few applications based on this phenomenon and so far their importance has been very limited. The most useful application at the present time is probably osmometry, which is widely used for the determination of molar masses of
osmotic pressure (bar)
difference(%)
100 101 102 103
10-3
10-2
10-1
100
101
12x 10-10 1/
Pa
pure water
1 x10⁻¹⁰ 1/
Pa
κ =
κ =

20
macromolecules (Atkins (1998)). Other suggested applications are, for example, in power production, the controlled release of drugs by an implantable osmotic pump, food processing, the concentration of landfill leachate, reclaiming wastewater for potable reuse in life support systems (e.g. for long-term human missions in space) and wastewater pre-treatment. A recent literature review on suggested osmotic applications is presented by Cath et al. (2006). 2.4 Energy conversion by osmosis 2.4.1 Maximum obtainable power from mixing of species Energy can be converted into a usable form by mixing miscible fluids of different composition. The most commonly studied method is based on osmosis. Energy conversion can be alternatively based, e.g., on the vapour pressure difference between the solution and pure solvent (Olsson et al. (1979)), on the heat of mixing, density changes during mixing, or on ionic differences (see e.g. the reverse electrodialysis studies of Pattle (1954) or Weinstein and Leitz (1976)). When seawater and river water are mixed, the enthalpy of mixing is almost zero. Thus, the heat resulting from mixing is not an appropriate source in this case. Density changes are also relatively small. According to the laws of thermodynamics, if the mixing occurs at a constant pressure and at a constant temperature, the maximum work supplied by an energy converter is the change in the Gibbs energy (G) between the initial unmixed state (A) and final mixed state (B)
)B(G)A(GWmax −= . (14) The Gibbs energy of a mixture can be expressed as a sum of its components (i)
ii
inG µ= ∑ . (15)
Let us consider npw moles of pure water and a water-NaCl solution containing nw moles of water and ns moles of NaCl, all at pressure po and at temperature T. The chemical potential of species i can then be expressed according to Eq. (2)
ioii alnT)p,T( ℜ+µ=µ , (16) where for pure water apw = 1. The maximum obtainable work can be found by combining Eqs. (14)-(16). The result is
)B(,wpw)B(,s
)A(,ss
)B(,w
)A(,wwmax alnTn
a
alnTn
a
alnTnW ℜ−ℜ+ℜ= . (17)

21
If the NaCl-water solution is considered as a real solution, then the activity of NaCl is given as
2
osa
ϕ= ± m
ms (18)
and the activity of water as
www xa ϕ= , (19)
where sm is the molality, om =1 mol/kg , ϕ is the activity coefficient, and x the molar fraction. The maximum work calculated from Eq. (17), when 1 m3 of pure water is mixed into a NaCl solution (varying solution volume and molality), is presented in Fig. 4. The activity coefficient ±ϕ is estimated according to Ensor and Anderson (1973) and wϕ from osmotic coefficient data provided by Platfor (1979). The density of the NaCl-water solution is estimated from Krumgalz and Progerelsky (1996). As an example we see in Fig. 4 that when 1 m3 of pure water is mixed with the same amount of NaCl solution of molality 0.5 mol/kg (close to the salinity of ocean water), as much as 1.6 MJ of work is theoretically obtainable (i.e. 1.6 MW theoretical power is obtainable when 1 m3/s of pure water is mixed with 1 m3/s of ocean water). Equally, when 1 m3 of pure water is poured to and mixed with the ocean, the maximum obtainable work is 2.3 MJ. The ocean is then considered as an infinite NaCl-water solution storage. 2.4.2 Different concepts of osmotic energy converters A simplified osmotic energy converter operating in a steady state is illustrated in Fig.5. The key components are the membrane module, pressurising system, pumps and turbine (+generator, not illustrated). The fresh water and pressurised solution are conducted into different compartments separated by the membranes of the osmotic membrane module. The membrane module provides a large membrane surface area compared to the volume of the module. Inside the module, the fresh water at low pressure can naturally move, because of osmosis, through the membrane into the pressurised solution - the membranes work as energy converters that transform the concentration difference between the two solutions into pressure (by absorbing heat from the environment, as described in Section 2.2). The module may consist of tubular fibre membranes, flat sheet membranes, or spiral wound membranes.

22
Figure 4. Available work in mixing 1m3 pure water with varying molality and volume of NaCl-water solution at T = 298.15 K. In the simplified system presented in Fig. 5 (named basic systems in Paper I), the pressurising of the solution is performed by a pump, but it can be done much more efficiently by a pressure exchanger (illustrated as a two-tank system and named an improved system in Paper I), as was found by Loab et al. (1990) and in Paper I of this thesis. The solute leakage penetrating the membrane and the dilution of the solution cause a diminution of the driving force for osmosis, i.e. they reduce the osmotic pressure difference over the membrane as the solution passes the membrane module. As the membrane module is open for flow, as a result of frictional pressure losses, the solution pressure is lower at the outlet of the module than at the inlet. Finally, the solution flow is conducted to the turbine. Because of the increased solution flow, it is possible under certain circumstances to achieve more power from the turbine than is needed for pumping the solution. The search for optimal operating parameters and the optimal membrane module configuration is based on an optimal balance between the reduction of the osmotic
mol/kg
kJ
10-2 10-1 100
101
102
103
104
10 litre
100 kitre
1 m3
10 m3
infinite

23
&V &V,
p ,fw −
≈
∆
0 0π
112o ),pp(p,VV π∆−=∆+ &&
010 ,p,V π&
10o ,p,VV π∆+ &&
turbine
pump
osmotic module
Fresh water:
0,0pp,fwV =π≈&
semipermeable membranes
Pin
Pout
000 ,p,V π&
V&∆
Figure 5. A simplified concept for an osmotic energy converter operating in a steady state. fw =
fresh water,.
V = volume flow (m3/s), P= power , p =pressure. pressure difference and the reduction of the hydrostatic pressure. For instance, if the velocity of the solution entering the module is increased, the reduction of the osmotic pressure difference will decrease as a result of the enhanced mass transfer at the membrane surface. This will increase the permeating osmotic flux and affect the net power positively. However, the negative impact of increasing the velocity of the solution is that there are increased pressure losses, which diminish the net power. An interesting alternative system is a submarine hydro-electro-osmotic power plant proposed by Reali (1981). In this system the river water is conducted to a hydroelectric power plant submerged in the sea, the theoretical optimum depth of the plant being 110 m below sea level. The post-turbine river water is removed to the seawater, which is under hydrostatic pressure, by osmotic membranes. Another alternative could be an osmotic energy converter working cyclically, as presented in Paper II of this thesis. Such a system would use osmosis to increase the pressure of a solution placed in a closed vessel. After a suitable loading time, part of the pressurised solution is released into a turbine and the pressurising of the vessel starts again. The solution must be replaced by a new one after a certain number of loadings because it is diluted during each loading process. We shall discuss this alternative method in more detail in Section 4.2. 3. OSMOTIC TRANSPORT OF SPECIES For the analysis of the transport properties of a membrane, at least three or four main regions appear where transport must be separately considered. The first two regions are the fluids both sides of the membrane (fluids external to the membrane). The other regions

24
arise from the membrane. Most commercial membranes are asymmetric, and are composed of two main regions, the selective layer and the support structure. The selective layer, the skin, allows the solvent to permeate through the membrane much more easily than the solute. In technically prepared membranes the thickness of the skin can be e.g. of order 100 nm but in membranes in nature the skin is basically only a two-molecule-thick bilayer (Robertson (1983)). The support structure of an asymmetric membrane is considerably thicker than the skin and gives support for the skin to enable it to sustain pressure differences. In theoretical models, the support layer is usually assumed to be composed of non-selective porous material. The support layer may be composed of different kinds of sub-layers. To obtain knowledge on the performance of the skin one must obtain information about the conditions at the skin surface, i.e. at Positions 2 and 3 at Fig. 6. However, measurements are usually made from the external bulk fluids rather than from values at the skin surface. It would be particularly difficult to perform measurements at the boundary of the skin and the support structure. Therefore, e.g. the estimation of the concentration at the skin surfaces must be theoretically estimated from the measured bulk values of the external fluids. Figure 6. Membrane with a selective layer (skin) and support structure. τ ,∅ and z∆ are the tortuosity, porosity, and the thickness of the support structure, respectively.
low concentration of dissolved substances
support structure
skin
1 2 3
Jw, vw
J
s
z ∆
τ ∅
high concentration of dissolved substances
z
1 3 p p >
Js

25
3.1. Boundary layers 3.1.1 Concentration and velocity profiles external to the membrane To solve the concentration distribution external to the membrane the following equations for the continuity of the solution, for momentum in laminar flow, and for continuity of solute (s) are solved:
0=⋅∇ u (20)
ubu 2pdtd
∇η+∇−ρ=ρ (21)
s2*
s cDc ∇=∇•u . (22) In addition, suitable boundary conditions that relate the measurements to Eqs. (20)-(22) are needed. In Eqs. (20)-(22) we have denoted u as the velocity vector and b as the external force field. We have assumed that the dynamic viscosity η , density ρ , and diffusion coefficient5 D* are constant and that chemical reactions do not occur. Alternatively, we could try to estimate concentrations at Positions 1 and 3 in Fig. 6, based on suitable mass transfer correlation equations. However, during the research of Paper IV reliable correlations for osmosis were searched for but not found in the literature. Some correlations that are suggested in the earlier literature for the estimation of external concentration boundary layers existing as a result of reverse osmosis were compared with the solutions of Eqs. (20)-(22). As a result (details are not reported), considerable differences between the solutions of these two methods were observed. As Eqs. (20)-(22) are based on more fundamental physics than the correlative equations, all the boundary layer or polarisation estimations in this thesis are based on Eqs. (20)-(22) or on simplified forms of Eqs. (20)-(22). Solute cannot permeate through an ideal semi-permeable membrane. If, furthermore, the solution with the lower solute concentration is pure water or pure solvent, no concentration boundary layers develop inside the pure water. In this case, concentration boundary layers do not exist inside the support structure, if the brine or the solution is placed on the skin side of the membrane as in Fig. 6. 5 The diffusion coefficient can be written in the form D
M
MD w* = , where D = binary diffusion
coefficient and M = molar mass of solution and Mw = molar mass of solvent. If the solution is dilute in
solute s, then DD* ≈ . The deviation between D* and binary diffusion coefficient D arises from the
differences in definitions of velocity applied in fluid mechanics (mass average velocity) and in diffusive phenomenon (molar average velocity).

26
3.1.2 Transport inside the support structure The thickness of the support structure of the membrane is usually much less than the membranes' length and width. Because of this fact and because the main gradients are in the direction of the normal of the membrane surface, the transport of species inside the support structure, as well as inside the skin, can usually be approximated as one-dimensional - the only important direction being to the normal of the surface. Another customary assumption is that the pressure changes only slightly inside the support structure. This change is assumed to be so small that it can be disregarded in analyses. The pressure difference between the solutions is thus assumed to equal the pressure difference between the skin surfaces. With the above assumptions and with minor modifications Eqs. (20)-(22) are also valid for the porous support structure. For instance, the one-dimensional velocity component v normal to the surface is replaced by the velocity
vv w ∅= (23) and the diffusion coefficient is replaced with the effective diffusion coefficient
*eff DD
τ∅
= , (24)
where ∅ and τ are the porosity and tortuosity of the porous material, which are often taken as constants. Note that vw is in units m3/(sm2
surface) and that the subscript w means ‘wall’ when attached with velocity vw or with Reynolds number Rew, but ‘solvent’ or ‘water’ with all other symbols. In one-dimensional cartesian co-ordinates we get from Eq. (20) the fact that the velocity v and thus also the vw is constant. Eq. (22) then yields
0dz
dcDvc
dzd s
effws =
− . (25)
By noticing that the term in parentheses equals the molar flux of solute, i.e.
dz
dcDvcJ s
effwss −= , (26)
and by integrating this from )zz(cc 0s1s == to )zzz(cc 0s2s ∆+== we get
diffRwve
w
s1s
w
s2s
vJc
vJc
−+= , (27)
where
effDz
diffR ∆= is the diffusion resistance. We can use these equations for estimation
of the concentration and thus for the osmotic pressure at Position 2 of Figure 6 when the concentration at Position 1 is estimated, e.g. from the solution of Eqs. (20)-(22).

27
3.2 Transport of species through the skin The typical behaviour of osmotic water flow through a large variety of biological membranes (see e.g. Diamond (1966), Brodsky and Schilb (1965), Bentley (1961), Rich et al. (1966), Dainty and Hope (1964), Lau et al. (1979), Tedgui and Lever (1984)) and synthetic membranes (e.g. Lee et al. (1981), Mehta (1982), Ludwig et al. (2002)) has been found to be non-linear in respect of the change in apparent osmotic pressure difference over the membrane (see Fig. 7). The apparent osmotic pressure difference is estimated from the bulk concentrations of the external solutions instead of the true difference between skin surfaces (between Points 2 and 3 in Fig. 6).
Figure 7. Example of a typical apparent behaviour of osmotic water flow (vw) through an asymmetric cellulose acetate membrane (Ludwig et. al (2002)). Osmotic pressure difference is evaluated from the bulk solutions. The analysis of membranes and, especially, membrane modules which consist of a large number of membranes is rather often based on apparent values, disregarding all concentration boundary layers. Membrane characteristics based on such analysis depend strongly on the hydrodynamic conditions applied in the test and therefore they do not quantitatively describe the membrane properties but instead they may give qualitative information that enables us to compare different membranes with each other. Despite the fact that the apparent behaviour of osmotic water flow is frequently found to be non-linear in respect of the concentration difference, it has been suggested that its true behaviour is still linear. The apparent non-linear performance is usually explained by the concentration boundary layers in fluids adjacent to the membrane, by solute accumulation (polarisation) inside the porous substructure of the membrane (Mehta and Loeb (1978), Lee et al. (1981)), or by the mutual effect of several serial membranes (Kedem and Katchalsky (1963)).

28
It has frequently been assumed that when all boundary layers have been correctly accounted for, the true response of the actual selective layer (skin) to increasing solute concentration and pressure would cause a linear relationship according to the following type of relation:
[ ]pLLv reflfiltw ∆−π∆= , (28)
where 23 π−π=π∆ and 23 ppp −=∆ . The subscripts 2 and 3 refer everywhere in this section to the positions given in Fig. 6. This linear equation for osmotic flow and reverse osmosis flow can be derived e.g. by the linear theory of non-equilibrium thermodynamics (Kedem and Katchalsky (1958) or Katchalsky and Curran (1965)). According to this theory, wv is the total volume flow per membrane surface area. The reflection coefficient reflL depends on both the properties of the membrane and solute and for membranes with zero solute leakage reflL =1. filtL is the filtration coefficient of the membrane, or it can also be called the water permeability if the total volume flow is approximately the same as the volume flow of water. The corresponding equation for the molar flux of the solute is written according to linear non-equilibrium thermodynamics as
wss vc)1(J ξ−+π∆ω−= , (29)
where 23 π−π=π∆ , ω is the solute permeability, 2
ccc 3s2s
s+
= is the average solute
concentration, and ξ is an additional coefficient. According to the Onsager reciprocal equations ξ = reflL (e.g. Katchalsky and Curran (1965)). However, if experimental evidence shows that ξ ≠ reflL , this does not prove that the Onsager relations fail. More likely, it shows that the assumptions used in derivation of model Eqs. (28)-(29) have been inappropriate. Instead of Eq. (29), in osmosis and reverse osmosis studies the solute flux is often written as a simplified formula
ss cBJ ∆−= (30)
where 2s3ss ccc −=∆ and B is an alternative solute permeation coefficient. According to Eq. (29), the solute flux depends on the pressure difference via Eq. (28). Eq. (30), however, states the independence of the solute flux from the pressure difference. Some previous transport models for membranes consider the skin to be composed of very narrow open paths where the combination of the driving force (usually proportional to the gradient of osmotic pressure) and the flow friction controls the osmotic flow (see e.g. Katchalsky and Curran (1965)). Some other models require that no open paths exist; the species dissolve into the skin material and diffuse through it (see e.g. Cussler (1997)).

29
Previously, some non-linear models have been suggested too. Massaldi and Borzi (1982) proposed that cavitation and partial clogging could explain the non-linearities. Fuls et al. (1992), on the other hand, suggested that the membrane could compact not only as a result of the pressure applied, but also because of the osmotic potential (i.e. resulting from the dissolved substances) causing a reduction in the permeability of the membrane. Diamond (1966) has proposed the following equation for the apparent behaviour of osmotic flow:
( )LH
LHw
cc2
A
ccJ
+Φ
+
−= (31)
where cH and cL are bulk solute concentrations on both sides of the membrane and A and Φ are transport coefficients. Diamond found this equation to fit well to the experiments performed with a rabbit’s gall-bladder when the hydrostatic pressure difference was absent. In Paper IV alternative transport models for skin are presented. We shall discuss these models in more detail in Section 4.4. 4. THERMODYNAMIC ANALYSES OF OSMOTIC FLOWS AND THEIR APPLICATION TO POWER GENERATION 4.1 Model for a solution flow inside a hollow cylindrical osmotic fibre and optimising pressure-retarded osmosis power generation systems (Paper I) 4.1.1. Flow of a solution inside hollow cylindrical fibres whose walls behave like osmotic membranes A formula for estimating the velocity and pressure of solution flow inside a hollow cylindrical fibre membrane increasing as a result of osmosis is derived in Paper I. The flow situation is illustrated in Fig. 8. The membrane is assumed to be highly selective, and thus the solute flux through the membrane is disregarded. However, the concentration distribution inside the hollow section caused by the osmotic water movement still needs to be solved and the model takes this phenomenon into account. The flow is considered to be laminar. As one of the boundary conditions, the linear form of osmotic flux, Eq. (28), is applied. In the appendix of Paper II this fibre model is derived for the non-linear osmotic equation proposed in Paper IV.

30
fibre wall
osmotic flux through membrane wall (flux diminishes in increasing z-co-ordinate)
z
r
fresh water flow, 0c,pp s0 ≈≈
fresh water flow,
0c,pp s0 ≈≈
0ssss
s0
s
0meanmean
c)z(cp)z(p
v)z(v;0z
<
<
>>
)z,r(v z
0ss
0s
0mean
cpv
;0z =
Figure 8. The hollow cylindrical fibre membrane system. The velocity inside the hollow cylindrical fibre was found to follow the equation
−=
2
0z r
r1)z(G)(v z,r (32)
where r and z are the radial and axial co-ordinates, respectively, and r0 is the inner radius of the fibre. With given boundary conditions at the inlet of the fibre, the function G(z) and the pressure at the fibre surface (ps) are solved numerically from the following scheme:
( )
−+=
η−=
)(G
)(Gp)(pAA
dz)(dG
r)(G4
dz
)z(dp
z
zzz
z
0s21
20
s
(33)
where p0 is the constant pressure outside the fibre and the constants A1 and A2 are
0
0ss
0meanreflfilt
1 r
cTvLL8A
ℜ= ,
0
filt2 r
L4A −= ,
r0
solution
fresh water

31
where 0meanv is the mean velocity at the inlet of the fibre and 0
ssc the solute concentration at the surface of the fibre at the inlet. If the concentration and pressure at the inlet of the fibre are considered as independent of the radial co-ordinate, then 0
ssc and 0sp represent
inlet bulk values. Eq. (33) takes into account the solute concentration change at the surface of the fibre. This concentration can be found from
)(G
vc2)z(c)z,rr(c
z
0mean
0ss
ss0s === (34)
In forward or direct osmosis the hydrostatic pressure difference between the solution and fresh water can be considered negligible ( 0)z(p)z(p 0s ≈− ). The following analytical solution for the axial velocity was found:
20mean1
2
0z v4zA2r
r1)z,r(v +
−= . (35)
Integrating the velocity profile over the cross-sectional area of the fibre, we get the mean volume flow meanV& . For direct or forward osmosis we get from Eq. (35)
20mean
120mean v
2
zArV +π=& . (36)
4.1.2. First Law optimisation of the net power of osmosis energy converters Eqs. (32)-(34) were applied for the study of the performance of an osmotic energy converter without a pressure exchanger (named the basic system (BS) in Paper I) and for a study of the performance of a converter with a pressure exchanger (named the improved system (IS) in Paper I). These osmosis power generation systems operate at a steady-state, as described in Section 2.4.2. As a result, it was shown that optimal values, which correspond to maximum power output, of initial pressure difference across the membrane ( 0
0s
o ppp −=∆ ), initial volume flow of brine ( 0meanv ), and fibre length (L) can be
determined. If pressure losses, dilution of solution, solute leakage through the membrane and the efficiencies of the energy conversion machines are neglected, an exact result for the optimal pressure difference over the membrane is half of the osmotic pressure difference
2/p π∆=∆ . (37)
In Paper I, it was shown that the optimisation of net power can be a more complicated process than setting 2/p π∆=∆ : for BS, the optimal p∆ is, for example, sensitive to the efficiency of the pump. For IS, the optimal p∆ was found to be close to that of the simple approximation 2/p π∆=∆ . However, for that system the approximation is strictly

32
speaking valid only if the initial mean volume flow of the solution and fibre length are also simultaneously optimised. If we set an arbitrary value, for instance, to initial volume flow, the optimal initial pressure difference will deviate to a greater or lesser extent from
2/π∆ . It was also found that the pressure exchanger will considerably improve the performance of the converters (Fig. 9).
0 10 20 30 40 50 60 70
0.1
1
10
100
Pmaximum/A = Lfilt(∆π eff)2/4
IS and BS: η turb = η pump = 1 IS: η turb = 0.9, η pump = 0.8 IS: η turb = 0.7, η pump = 0.6 BS: η turb = 0.9, η pump = 0.8 BS: η turb = 0.7, η pump = 0.6
max
imum
pow
er p
er s
urfa
ce
area
of f
ibre
(W/m
2 )
initial effective osmotic pressure difference (bar)
Figure 9. The maximum power divided by the surface area of the fibre. The ratio becomes independent of the radius of the fibre. The dashed curve corresponds to ideal power (= π∆=π∆π∆ relfeff
2efffilt L where,4/L ) when pressure loss, solute leakage, dilution of the
solution, and the efficiencies η are neglected. The following constant parameter values were used: Lfilt = 10-11 m/sPa, η = 0.000855 Ns/m2. BS = basic system without pressure exchanger, IS = system with pressure exchanger. 4.1.3 Second Law optimisation In Paper I, BS was also optimised in such a way that the ratio
σ=Ψ
P (38)
between the net power production P and entropy generation σ reached a maximum value. Some results were calculated for a Second Law efficiency
TPPσ+
=ε (39)

33
as well. The maximizing of the function Ψ did not result in an unequivocal optimal point in respect to initial mean velocity, pressure, and fibre length, as did the optimisation of net power. With some additional definitions, the optimisation of BS in respect toΨ became achievable. From a comparison between the optimisation of P and Ψ it was found that the optimisation of P results in net power values about twice as high as with optimising Ψ . This was found to be true for all realistic (achievable today) efficiencies of the pump and turbine.
The optimisation of IS failed because no maximum value forΨ in respect to fibre length was found. Instead, Ψ increases in a rather linear way when the fibre length decreases to even unrealistically small values. If IS is to be optimised in respect to Ψ , additional losses appearing outside the fibre module should be included in the study. Such losses could be e.g. the power demand of pumping the brine from the ocean to the pressure exchanger. 4.1.4 The minimum of local entropy generation in an osmotically increasing solution flow process On the basis of the transport model presented in Section 4.1.1, it was found that the local entropy generation rate '''σ always results in a minimum value at a certain fibre length
'''minL σ− .
When started with arbitrary values of 0meanv and ∆p0 , this optimal position ( '''minL σ− ) was
not found to have any dependency on the respective position ( PmaxL − ) where power generation results in the maximum value. However, if we calculate the σ ' ' ' with initial values of 0
Popt,meanv − and∆popt P−0 , which resulted in optimising P, the local minimum was
always found to settle at a position further than the corresponding value of PmaxL − (see Fig. 10). If both efficiencies ηturb and ηpump are set as unity, the value of '''minL σ− will settle about 9% further than PmaxL − for both BS and IS. As the efficiencies decrease, the corresponding difference increases; for instance, if ηturb = 0.9 and ηpump = 0.8, the difference is about 12% for BS and about 30% for IS. The parameters were varied in these calculations between: ∆πeff
0 5 -70 bar, r0= 10 - 250 µm, Lfilt = 10-13 - 10-10 m/sPa. It remained uncertain how this local minimum can be exploited in the optimising
processes or what physical significance it offers to the osmotic process. A literature search did not reveal that similar phenomenon had been reported for other kinds of processes

34
Figure 10. The optimum length PmaxL − of the fibre when power P is maximised is shorter than the optimum length '''minL σ− resulting in a minimum of local entropy generation if values of
vmean opt Po
, − and∆popt P−0 , which resulted in optimising P, are used. For instance, with the
parameters Lfilt = 10-11 m/sPa, η = 0.000855 Ns/m2, ηturb = 0.9, ηpump =0.8, ro = 50 mµ , and
π∆relfL = 20 bar, we get for IS: vmean opt Po
, − =0.08 m/s and ∆popt P−0 =10 bar, which corresponds
to PmaxL − = 0.54 m and '''minL σ− = 0.70 m. 4.2 A cyclically operating osmotic energy converter (Paper II) An alternative possibility for an osmotic energy conversion system was presented in Paper II. This concept is illustrated in Fig.11 and it is based on the osmotic pressurising of a solution placed into a rigid closed space. After the solution has been sufficiently pressurised by osmosis, part of it is released to the turbine. The rest of the solution will be either re-pressurised or changed to "intact" solution and then pressurised again. This kind of system would work in a large number of short cycles instead of the continuous performance of the conventional concepts of osmosis energy converters, such as those studied in Paper I. Placing gas in contact with the solution will prolong the cycle time considerably and probably reduce losses occurring as a result of releases. However, the power gained from idealised processes was found to be higher if no gas is present. An example of the calculated performance of the pressurising process without the presence of gas is illustrated in Figure 12. In Fig. 12b the average power during one cycle as a function of pressurising time is plotted. For each chosen initial parameter (solute concentration, membrane surface area, solution volume etc.), there is a corresponding point of time for the release to result in a maximum average power (maximum positions of each curve in Fig. 12b). The corresponding optimum pressure deviates from the equilibrium pressure, i.e. from the maximum value that the pressure approaches in time. The maximum values of pressure and power depicted in Figures 12a and 12b become independent of the chosen membrane surface area and solution volume values. Volume and surface area only influence the time taken to reach maximum values.
z
PmaxL −
)1(L
pumpturb
'''min=ηη
σ−
)1(L
pumpturb
'''min<ηη
σ− 0

35
membrane
)t(p),t(V 2& 0p),t(V&
power out (P)
solution reservoir
fresh water reservoir
P0
solution
gas or solution
fresh water
energy converter
exhaust solution
module
Figure 11. The pressurising concept for an osmotic energy converter. .
V = volume flow, P= power , p =pressure. The pressurising osmotic power generation system (POS) was compared with continuous flow systems such as those presented in Fig. 5 and in Paper I. It was suggested that the pressurising system would yield more power than the continuously operating system. On the other hand, comparison between the systems is difficult as different kinds of losses are disregarded. For instance, disregarding solute flux may have a different effect for different concepts. Furthermore, the power needed for replacing the solution is excluded from the study of POS, as are the pressure losses in unloading caused by the movement of solution from the tank to the turbine. Thus, the study presented in Paper II more likely serves as a sketch or guideline of how the pressurising system would operate rather than as a source of accurate performance values or as a final comparison between the different systems.

36
0.00 0.05 0.10 0.15 0.20 0.25 0.30 0.35 0.40 0.45 0.50 0.55 0.60 0.65 0.70 0.7502468
1012141618202224262830323436
cs0 = 200 mol/m3
cs0 = 500 mol/m3
cs0 = 800 mol/m3
cs0 = 1100 mol/m3
cs0 = 1400 mol/m3
cs0 = 2000 mol/m3
pres
sure
(bar
)
time (s)
0.00 0.05 0.10 0.15 0.20 0.25 0.30 0.35 0.40 0.45 0.50 0.55 0.60 0.65 0.70 0.750
100
200
300
400
500
600
700
800
cs0 = 200 mol/m3
cs0 = 500 mol/m3
cs0 = 800 mol/m3
cs0 = 1100 mol/m3
cs0 = 1400 mol/m3
cs0 = 2000 mol/m3
aver
age
pow
er p
er
mem
bran
e ar
ea (m
W/m
2 )
pressurising time (s)
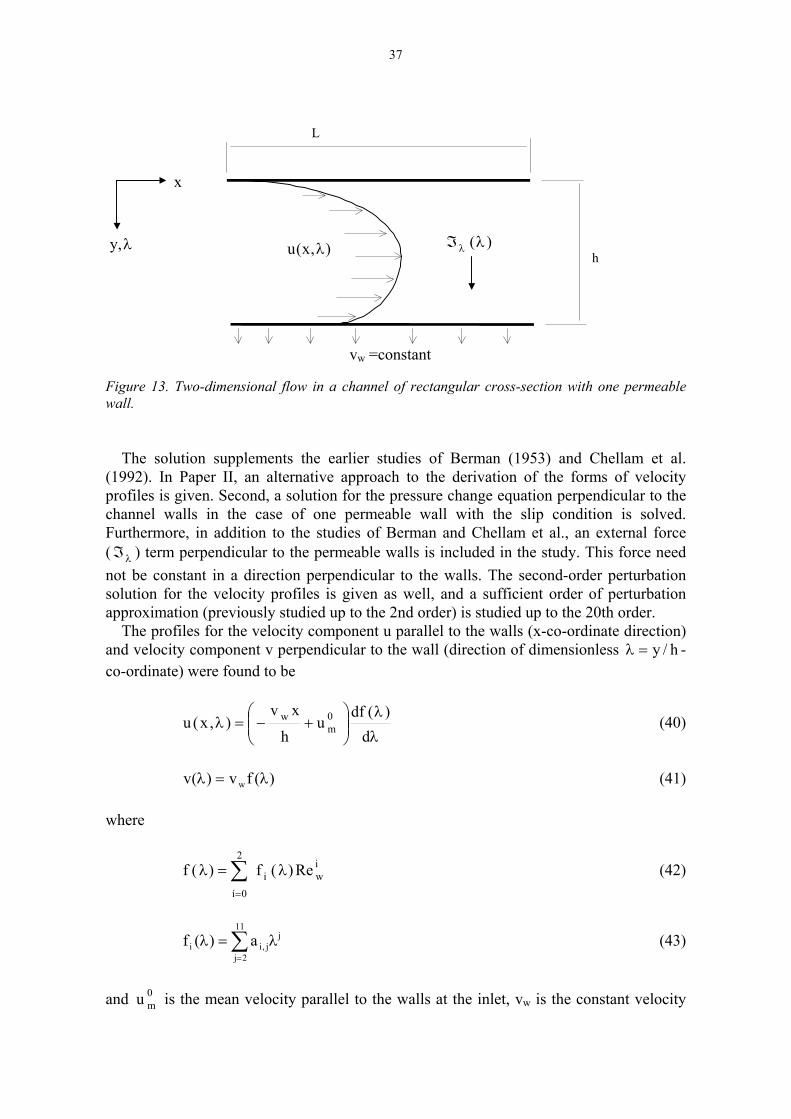
Figure 12. a) The evolution of pressure in time for varying initial solute concentrations (cs0). No gas appears in the module b) Corresponding average power per unit of surface area of the membrane as a function of pressurising time (instant of time when pressurised solution is released into turbine). 4.3. Solution for the velocity and pressure distribution for laminar flow inside a two-dimensional channel where one wall is permeable (Paper III) In Paper III, starting from the Navier-Stokes equations, a perturbation solution for laminar steady state incompressible flow between permeable and impermeable walls is given (see Fig. 13). A slip condition at the permeable wall is applied. The viscosity and the permeate flux (vw) through the porous wall are assumed to be constant.
37
vw =constant
),x(u λλ,y
x
L
h )(λℑλ
Figure 13. Two-dimensional flow in a channel of rectangular cross-section with one permeable wall. The solution supplements the earlier studies of Berman (1953) and Chellam et al. (1992). In Paper II, an alternative approach to the derivation of the forms of velocity profiles is given. Second, a solution for the pressure change equation perpendicular to the channel walls in the case of one permeable wall with the slip condition is solved. Furthermore, in addition to the studies of Berman and Chellam et al., an external force ( λℑ ) term perpendicular to the permeable walls is included in the study. This force need not be constant in a direction perpendicular to the walls. The second-order perturbation solution for the velocity profiles is given as well, and a sufficient order of perturbation approximation (previously studied up to the 2nd order) is studied up to the 20th order. The profiles for the velocity component u parallel to the walls (x-co-ordinate direction) and velocity component v perpendicular to the wall (direction of dimensionless h/y=λ -co-ordinate) were found to be
λ
λ
+−=λ
d)(df
uh
xv),x(u 0
mw (40)
)(fv)(v w λ=λ (41)
where
iwi
2
0í
Re)(f)(f λ=λ ∑=
(42)
∑=
λ=λ11
2j
jj,ii a)(f (43)
and 0
mu is the mean velocity parallel to the walls at the inlet, vw is the constant velocity

38
permeating through a porous wall, and h is the distance between the walls. The wall Reynolds number is defined as
ν=
hvRe w
w , (44)
where ν is the kinematic viscosity of the fluid. The superscripts i and j in Eqs. (42)-(43) denote power, while the subscript i is an index denoting the order of perturbation and the subscript j is another index. The coefficients ai,j are presented in Paper III. The pressure change in the x-direction resulted in
−
µ=λ−λ
h2
xvxu
h
k),0(p),x(p
2w0
m200 (45)
and in the λ -direction
∑∫=
λ
λλ λ−λρ−λℑ=λ−λ
14
1i
i0
ii
2w0 )(dvdh),x(p),x(p
0
(46)
where λℑ is an external force perpendicular to the membranes and µ is dynamic viscosity.
λℑ is independent of the x-co-ordinate but it can vary in the λ -direction. The values of the constants k and di are given in Paper III. If the external force is gravitation, it was shown in Paper III that the pressure difference between the permeate wall and solid wall is usually governed by gravity. The effect caused by the permeate flux is usually minute. The study is limited to small absolute values of Reynolds wall numbers, defined in Eq. (44). This means that, for a given fluid, the product between the permeating velocity wv through the porous wall and the distance between the walls h must be sufficiently small. However, the perturbation treatment of Paper III does not limit the magnitude of the flow parallel to the walls. Thus, the theory can describe considerable changes in flow velocities in the x-direction if the flow is initially diminutive or the walls are long enough. It was found that for wall Reynolds numbers Rew <<1, the first-order perturbation approximation is sufficient. For values Rew<<0.01 even the zero-order approximation can be applied. If Rew values close to unity are being studied, the second-order perturbation solution may be needed. The results can be utilised, for example, in mass transfer problems such as estimating the concentration profiles of solution flow inside a channel with a rectangular cross-section affected by the flux through a membrane. Such a case appeared e.g. in the study of Paper IV.

39
4.4 Osmotic flow through a membrane (Paper IV) The osmotic transport of species through asymmetric cellulose acetate membranes was evaluated in Paper IV by experiments, together with the calculation of concentration distribution in adjacent fluids and inside the support structure of the membrane. In a pre-study several other types of synthetic membranes were tested but their performance under osmotic conditions was so poor that only the reported membranes were chosen for further examination. Contrary to the suggestions in previous literature, it was found that the concentration accumulation inside the support structures (internal polarisation) cannot completely explain the apparent non-linear behaviour frequently found in experiments. The traditional one-, two-, and even three-coefficient linear transport models were found to be unsatisfactory for the estimation of osmotic water transport through the selective layer of the studied membranes. Two new transport models were suggested. The new transport equations are a result of a dimensional analysis applying more or less intuitively chosen test functions. The measured osmotic water fluxes and the measured solute fluxes were fitted to several models by the least squares method. The estimation of the concentration boundary layers in fluids external to the membrane was solved from the solute continuity Eq. (22) applying velocity profiles Eqs. (40)-(43). Concentration distribution inside the support structure was estimated from Eq. (27). 4.4.1 Non-linear transport models for osmotic water flux According to the analysis, the following two equations were proposed for water transport Jw (mol/m2s) through the selective layer:
( ) ( )2/1rw
2/1sww pBxAJ ∆−∆= (47)
s
rwsww x1
pBxAJ
Φ+∆−∆
= (48)
where xs is the molar fraction of the solute, sx the average molar fraction of the solute between the skin surfaces, Aw, Bw, Φ are transport coefficients, ∆ is the difference between the skin positions 3 and 2 (see Fig. 6), and the dimensionless pressure is
Tcp
p r ℜ= (49)
where ℜ is the universal gas constant, c the total concentration of the solution, and T the absolute temperature. The term Tcℜ appearing in Eq. (49) should not be confused with the Van't Hoff equation for osmotic pressure Tcsℜ=π , where cs denotes the concentration of dissolved solute. Both Equations (47) and (48) fitted to the results (based on measurements and the theoretical estimation of the external and internal concentration distribution) considerably better than traditional linear one-, two-, and three-coefficient equations.

40
If the temperature and total concentration are kept as constants, the variables pr and xs in Eqs. (47)-(48) can be transformed into osmotic pressure ( Tcsℜ=π ) and hydrostatic pressure (p), respectively. Eqs. (47)-(48) then yield
πΦ+
∆−π∆=
'1
pBAJ
'w
'w
w (50)
and
( ) ( )2/1'w
2/1'ww pBAJ ∆−π∆= (51)
However, one should note that Eq. (51) is dimensionally incorrect as the square root is taken from dimensional variables. Eq. (50) can be transformed into the form
πΦ+
∆−π∆
='1
pB
AB
J'w
'w'
w
w (52)
In the experiments of Paper IV, strictly speaking, the measured values correspond to the values of vw rather than to Jw. Thus, by multiplying both sides of the above equation by the specific volume of the solution (ν ) we get
( )pLLv reflfiltw ∆−π∆= , (53)
where
πΦ+ℜ
ν=
πΦ+
ν=
Tc
B
'1
BL w
'w
filt (54)
w
w'w
'w
reflB
A
B
AL == . (55)
Eq. (53) is similar to the linear flux equation (28). The difference between these equations arises from the coefficient Lfilt, which is independent of concentration in Eq. (28), but depends on the average solute concentration between the skin surfaces in Eq. (53). Equation (48) is actually a more general expression of Eq. (31), proposed for rabbits’ gall bladders by Diamond (1966). It also brings to mind the equation derived by Jonsson and Boesen (1975) under subject of reverse osmosis.

41
4.4.2 Transport of solute through membranes The solute flux Js was instead found to depend almost linearly on the pressure difference and on molar fraction differences over the selective layer of the membrane when the following two-coefficient transport equation was applied:
[ ]rssss pBxAJ ∆+∆−= , (56) where As and Bs are the transport coefficients and 2s3ss xxx −=∆ , 2r3rr ppp −=∆ . However, the common assumption that the solute flux depends only on the concentration difference and not on the pressure difference (Bs = 0) was found to be inappropriate for the membranes studied. 4.5 Second Law efficiency of osmotic membrane (Paper V) The following equation for the Second Law efficiency of an osmotic membrane was derived in Paper V:
,
r
)aln(Tp
w
s
ν
∆ℜ−π∆
∆=η (57)
where the osmotic potential π follows the expression given in Eq. (6). This efficiency can be interpreted either as the efficiency of the selective layer or as the efficiency of the complete membrane (see Fig. 14b for the asymmetric membrane structure). In the first case, ∆ is taken over the selective layer (Positions 3 and 2) and in the latter case, over total membrane thickness (Positions 3 and 1). This efficiency does not depend on any transport models or on the actual magnitudes of the fluxes, but instead on the ratio
s
w
J
Jr = (58)
between the molar flux of the solvent and solute. The ratio r gets negative values in osmosis. The maximum Second Law efficiency is achieved when r approaches (minus) infinity. The result is
. pmax π∆
∆=η (59)
Equation (57) can be used to find the magnitude of solute leakage that can be accepted for optimally performing osmotic membranes. An example calculation of Eq. (57) is illustrated in Fig. 14a. From this figure we can realise that, in order to obtain high performance, the membrane should be highly selective. On the other hand, the membrane does not need to be completely semi-permeable: the efficiency does not increase in

42
practice when the ratio of solvent to solute flux r is more than 10 000:1.
100 1000 10000 100000 10000000
5
10
15
20
25
30
35
40
45
50
π1(2) = 1 bar
π1(2) = 5 bar
π1(2) = 0.1 bar
effic
ienc
y (%
)
-r = -Jwater/Jsalt a) b) Figure 14 a) Efficiency of the skin as a function of the water flux - solute flux ratio (r=Jw/Js)). The following parameter values were used: bar 24ocean3 =π=π , 1323 pppp −≈− =10 bar, T= 298 K. The symbol )2(1π means that the osmotic pressure can be estimated either from Position 1
or 2. In the former case the results correspond to the efficiency of the total membrane and in the latter case to the efficiency of the skin. b) The membrane structure. The ratio f between the power destruction inside the support structure of an asymmetric membrane and the power destruction inside the complete membrane was also examined in Paper V. This ratio was given as a formula
.
T
)pp(r
a
alnr
a
aln
a
alnr
a
aln
f31
3w
1w
3s
1s
2w
1w
2s
1s
ℜ
−ν+
+
+
= (60)
As the purpose of the support structure is to give mechanical support to the selective layer and as it is not involved in the actual osmotic process, we want to avoid entropy
Jw, vw
z∆
sJ
1 3
skin
z
2
support structure
∅
τ

43
generation inside the support as far as possible and thus to reach low values for f. The example calculation presented in Paper V showed that the amount of power lost inside the support structure is sensitive to the product vwRdiff (vw is the flow velocity inside the support structure and Rdiff the diffusion resistance of the support structure), so that when vwRdiff increases above unity the fraction f results in high values. Only with extremely high values of the flux ratio r can the entropy production ratio f reach reasonably low values in such a case. However, in order to achieve high power from the osmotic energy converters presented in the literature so far, the velocity vw must be high. Thus, this Second Law study also underlines the need for a low value for Rdiff. 5. DISCUSSION AND CONCLUSIONS Several aspects of the thermodynamics of the osmotic phenomenon and its application to energy conversion have been studied in this thesis. The studies include a solution flow model for hollow fibres, thermodynamic optimisations of osmotic power generation systems, analysis of the concentration boundary layers (polarisation) external and internal to the membrane, and evaluations of the thermodynamic and mass transport performance of the osmotic membranes. The transport model for hollow cylindrical osmotic fibres was applied for estimating theoretically the performance of osmotic energy converters. The study illustrates the possibilities of the optimisation of membrane modules for flows in narrow channels. As a result, it was shown that many important parameters of osmotic power generation systems based on fibres can be optimised. Qualitatively similar results (number of optimised parameters) should also be available for other membrane geometries than cylindrical fibres. The fibre model is simplified. A more detailed model of the fibre flow would include e.g. the solute flux through a membrane. Then, the modelling of the support structure, as well as the hydrodynamics and mass transport of the fresh water, also becomes necessary, as does the spacing of the membranes. It is very possible that in such a case other parameters such as the fibre radius, packing density of the fibres, inlet velocity of fresh water, and inlet pressure of fresh water will also become reachable for optimisation. It was also found that the local entropy generation inside the hollow osmotic fibre reaches its minimum value in respect to the axial co-ordinate. One question that is left open is the placing of the skin. Should it be placed at the inner (may be difficult to manufacture) or at the outer (as in current reverse osmosis fibres) surface of the fibre and should the brine flow across the inner or outer part of the fibre? The spacing of the brine and skin at the outer surface sounds promising as the skin surface area is then higher and from experiments it is apparent that the osmotic flux through the membranes is, in most cases, higher when the brine is towards the skin than when the brine is towards the support structure. Contrary to the common belief, with the careful estimation of concentration boundary layers external and internal to the membranes, it was found that the concentration polarisation assumption cannot completely explain the non-linear behaviour in osmotic flow through asymmetric cellulose acetate osmosis membranes. Instead, the water flow through the selective layer of the membrane was found to behave non-linearly, at least in respect to the concentration difference for the membranes under study. Two transport equations for water flux Jw are suggested: ( ) ( )½
rw½
sww pBxAJ ∆−∆= and

44
s
rwsww x1
pBxAJ
Φ+∆−∆
= , where xs is the molar fraction solute, pr the dimensionless
pressure, and Aw, Bw and Φ are the transport coefficients. The apparent osmotic behaviour of several different types of biological and synthetic membranes has previously been found to be similar to that of the membranes studied here. It is therefore suggested that the non-linear phenomenon in osmotic water flux through different types of skin materials could be much more general than hitherto presumed. However, one should keep in mind that the nature of non-linear findings of this thesis is global. Thus, the results do not prove that the local linear force-flux relationship fail. A method for the estimation of acceptable solute leakage of the membrane was created by deriving a Second Law efficiency. It was also found that for the thermodynamic performance of the membrane to be efficient, the product of the osmotic flux and diffusion resistance of the support structure should be small, usually below unity. Otherwise, the support structure of the membrane will cause significant destruction of the available power. Despite the high theoretical potential arising from the mixing of species of different compositions, the performance of present-day real osmosis energy converters will be too inefficient for economical utilisation. The key problem is the too-minute water flux permeating through the present-day membranes, compared to the high costs of the membranes. Emphasis should be placed on the question of how to improve the performance of the membranes and research into alternative ways to extract the available energy of the mixing process. REFERENCES Atkins P. 1998. Physical Chemistry. 6th edition: p.180, Freeman, New York. Bentley PJ. 1961. Directional differences in the permeability to water of the isolated urinary bladder of the toad, Bufo Marinus. Journal of Endocrinology 22:95-100. Berman AS. 1953. Laminar flow in channels with porous walls. Journal of Applied Physics 24(9):1232-1235. Brodsky WA, Schilb T. 1965.Osmotic properties of isolated turtle bladder. American Journal of Physiology 208:46-57. Cath TY, Childress AE, Elimelech M. 2006. Forward osmosis: Principles, applications, and recent developments. Journal of Membrane Science, 281:70-87 Chellam S, Wiesner MR, Dawson C. 1992. Slip at a uniformly porous boundary: effect on fluid flow and mass transfer. Journal of Engineering Mathematics 26:481-492. Cussler EL. Diffusion – Mass Transfer in Fluid Systems. 1997. Cambridge University Press. Cambridge. Dainty J, Hope B. 1964. The water permeability of Chara Australis. Australian Journal of Biological Sciences 79: 102-111. Diamond JR. 1966. Non-linear osmosis. Journal of Physiology 183:58-82.

45
Ensor DD, Anderson HL. 1973. Heats of dilution of NaCl: temperature dependence. Journal of Chemical and Engineering Data 18(2):205-212. Fuls PF, Dell MP, Pearson IA. 1992 : Non-linear flow through compressible membranes and its relation to osmotic pressure. Journal of Membrane Science 66:37-43. Hammel HT. 1979. Forum on osmosis I. Osmosis: diminished solvent activity or enhanced solvent tension?. American Journal of Physiology 237:R95-R107. Jonsson G, Boesen CE. 1975. Water and solute transport through cellulose acetate reverse osmosis membranes. Desalination 17:145-165. Katchalsky A, Curran PF. 1965. Nonequilibrium thermodynamics in biophysics, Harvard University Press, Cambridge. Kedem O, Katchalsky A. 1958. Thermodynamical analysis of permeability of biological membranes to non-electrolytes, Biochimica et Biophysica Acta 27:229-246. Kedem O, Katchalsky A. 1963. Permeability of composite membranes. Part 3 -series array of elements. Trans. Faraday Soc 59:1941-1953. Krumgalz BS, Pogorelsky R, Pitzer K.S. 1996. Volumetric properties of single aqueous electrolytes from zero to saturation concentration at 298.15 oK represented by Pitzer's ion-interaction equations, J.Phys.Chem.Ref.Data 25(2):663-689. Lau YT, Parsons RH, Brady RJ, Feeney GA. 1979. Water movement across split frog skin. Biochimica et Biophysica Acta 551:448-451. Lee KL, Baker RW, Lonsdale HK. 1981. Membranes for power generation by pressure-retarded osmosis. Journal of Membrane Science 8:141-171. Lewis GN. 1908. The osmotic pressure of concentrated solutions, and the laws of perfect solution. J.Am.Chem.Soc. 30:668-683. Loeb S, Honda T, Reali M. 1990. Comparative mechanical efficiency of several plant configurations using a pressure-retarded osmosis energy converter. Journal of Membrane Science 51:323-335. Ludwig W, Seppälä A, Lampinen MJ. 2002. Experimental study of the osmotic behaviour of reverse osmosis membranes for different NaCl solutions and hydrostatic pressure differences. Experimental Thermal and Fluid Science 26:963-969. Massaldi HA, Borzi CH. 1982. Non-ideal phenomena in osmotic flow through selective membranes. Journal of Membrane Science 12:87-99. Mehta GD. 1982. Further results on the performance on present-day osmotic membranes in various osmotic regions. Journal of Membrane Science 10:3-19. Mehta GD, Loeb S. 1978. Short-communication- Internal polarisation in the porous substructures of a semi-permeable membrane under pressure-retarded osmosis. Journal of Membrane Science 4: 261-265.

46
Norman, RS. 1974. Water salination: A source of energy. Science 186:350:352. Olsson M, Wick GL, Isaacs JD. 1979. Salinity gradient power: utilizing vapour pressure differences. Science 206:452-454. Pattle RE. 1954. Production of electric power by mixing fresh and salt water in the hydroelectric pile. Nature 174 (2):660. Platfor RF. 1979. Experimental methods, in Activity coefficients in electrolyte solutions vol. I (ed. R.M. Pytkowicz). CRC Press. Reali M. 1981. Submarine hydro-electro-osmotic power plants for an efficient exploiting of salinity gradients. Energy 6:227-231. Rich GT, Sha’afi A, Romualdez A, Solomon AK. 1966. Effect of osmolality on the hydraulic permeability coefficient of red cells. Journal of General Physiology 52:941-954. Robertson RN. 1983. The lively membranes. p.7. Cambridge University Press, Cambridge. Tedgui A, Lever MJ. 1984. Filtration through damaged and undamaged rabbit thoracic aorta. American Journal of Physiology 247:H784-H791. Weinstein JN, Leitz FB. 1976. Electric power from differences in salinity: the dialytic battery. Science 191:557-559. Yates FE. 1979. Introducing a forum on osmosis. American Journal of Physiology 6:R93.

ISBN 978-951-22-8774-1ISBN 978-951-22-8775-8 (PDF)ISSN 1795-2239ISSN 1795-4584 (PDF)