thermodynamic properties of fluorinated alcohols ... · thermodynamic properties of fluorinated...
TRANSCRIPT

I
Thermodynamic Properties of Fluorinated Alcohols:
Experimental, Molecular Dynamics Simulation and GC-
SAFT-VR Predictions
Gonçalo Miguel Carvalho da Silva
Thesis to obtain a Masters degree in
Chemical Engineering
Supervisors:
Prof. Dr. Eduardo Jorge Morilla Filipe
Prof. Dr. Clare McCabe
Examination Committee
Chairperson: Prof. Dr. Carlos Manuel Faria de Barros Henriques
Supervisor: Prof. Dr. Eduardo Morilla Filipe
Member of the Commitee: Luís Filipe Guerreiro Martins
September 2015

II

III
Acknowledgements
I wish to show my sincere appreciation to those who assisted me on the way to complete this
thesis.
First of all, to my supervisor Prof. Dr. Eduardo Jorge Morilla Filipe for getting me involved
and interested in this research area and also for the wisdom, insights, teachings, comments,
encouragement and dedication; his help was vital to achieve the goals of this thesis.
Furthermore, to Prof. Dr. Clare McCabe and Prof. Dr. Peter Cummings, along with their
respective groups’ researchers, who welcomed me at MUMS in Nashville, and from whom I
learned a lot about modelling, simulation and group work. Also, to Dr. Pedro Morgado, for the
teachings on both experimental and simulation levels, expertise, suggestions, and patience,
from whom I learned an enormous amount and counted on when I had any doubts or problems.
I would also like to thank my nuclear family and close friends who always showed they
believed in my capabilities, for the support and encouraging words along the way.

IV
Resumo
A pressão de vapor de quatro 1H,1H-perfluoroálcoois líquidos (CF3(CF2)n(CH2)OH, n = 1, 2,
3, 4), frequentemente denominados álcoois fluorotelómeros ímpares, foi medida em função da
temperatura entre 278K e 328K. As densidades dos líquidos foram medidas numa gama de
temperatura de 278K a 353K. As entalpias molares de vaporização foram calculadas a partir
dos dados experimentais. Os resultados foram comparados com dados da literatura para outros
perfluoroálcoois assim como com os álcoois hidrogenados equivalentes. Os resultados foram
modelados usando simulações de dinâmica molecular e a equação de estado GC-SAFT-VR.

V
Abstract
The vapour pressure of four liquid 1H,1H-perfluoroalcohols (CF3(CF2)n(CH2)OH, n = 1, 2, 3,
4), often called odd-fluorotelomer alcohols, was measured as a function of temperature
between 278K and 328K. Liquid densities were also measured for a temperature range between
278K and 353K. Molar enthalpies of vaporization were calculated from the experimental data.
The results were compared with data from the literature for other perfluoroalcohols as well as
the equivalent hydrogenated alcohols. The results were modelled using molecular dynamics
simulations and the GC-SAFT-VR equation of state.

VI
Contents
Acknowledgements ............................................................................................................................. III
Resumo ................................................................................................................................................. IV
Abstract ................................................................................................................................................. V
List of Tables ..................................................................................................................................... VII
List of Figures .................................................................................................................................... VII
Nomenclature ................................................................................................................................... VIII
1 - Introduction ..................................................................................................................................... 1
2 - Experimental Techniques ............................................................................................................... 2
2.1 - Purification and Characterization .......................................................................................... 2
2.2 - Vapour Pressure Measurements ............................................................................................. 2
2.3 - Density Measurements ............................................................................................................. 2
3 - Theoretical Introduction and Application ..................................................................................... 3
3.1 - GC-SAFT-VR Theory and Molecular Model ........................................................................ 3
3.2 - Molecular Dynamics Simulations ............................................................................................ 6
4 - Results and Discussion .................................................................................................................... 7
4.1 - Vapour Pressures and Enthalpies of Vaporization ............................................................... 7
4.2 - Liquid Densities and Thermal Expansion Coefficients ....................................................... 12
5 - Conclusions..................................................................................................................................... 17
6 - Bibliography ................................................................................................................................... 18

VII
List of Tables
Table 1 – GC-SAFT-VR parameters ...................................................................................................... 5
Table 2. Experimental vapour pressures for 2:1, 3:1, 4:1 and 5:1 FTOH ............................................... 7
Table 3. Constants for the Antoine equation. .......................................................................................... 8
Table 4. Molar enthalpies of vaporization of 1H,1H-perfluoroalcohols. .............................................. 10
Table 5. Densities for 2:1, 3:1, 4:1 and 5:1 FTOH at atmospheric pressure. ........................................ 12
Table 6. Coefficients for equation 14.................................................................................................... 13
Table 7. Experimental and simulated liquid densities at 298.15 K and thermal expansion coefficients.
.............................................................................................................................................................. 13
List of Figures
Figure 1. Experimental vapour pressures for 2:1 (), 3:1(), 4:1() and 5:1 FTOH(); GC-SAFT-
VR predictions (lines). ............................................................................................................................ 7
Figure 2. Logarithmic representation of the vapour pressures with 1/T for: 2:1 FTOH, this work ()
and Meeks and Goldfarb18 (); 3:1 FTOH, this work (), Meeks and Goldfarb18 (). The lines are
linear (Clausius-Clapeyron) fits to our experimental results. ................................................................. 9
Figure 3. Molar enthalpies of vaporization for the FTOH family as a function of chain length; () this
work; () J. Costa et al.2; () Meeks and Goldfarb18. ........................................................................ 10
Figure 4. Molar enthalpy of vaporization of 2:1 FTOH, 3:1 FTOH, 4:1 FTOH and 5:1 FTOH from
experiment (), simulations () and GC-SAFT-VR predictions (). ................................................. 11
Figure 5. Comparison of the enthalpy of vaporization for fluorotelomer () and hydrogenated
alcohols (). ......................................................................................................................................... 11
Figure 6. Experimental liquid densities for 2:1 (,blue), 3:1(,red), 4:1(,green) and 5:1
FTOH(,purple), GC-SAFT-VR predictions (lines) and Simulation results (X). ................................ 12
Figure 7. Thermal expansion coefficient vs chain length. .................................................................... 14
Figure 8. Average number of hydrogen bonds per molecule vs chain length for: FTOH from this work
() and from [ref] with OPLS-AA (), hydrogenated alcohols with TraPPE21 () and OPLS-UA20
() force fields. .................................................................................................................................... 15
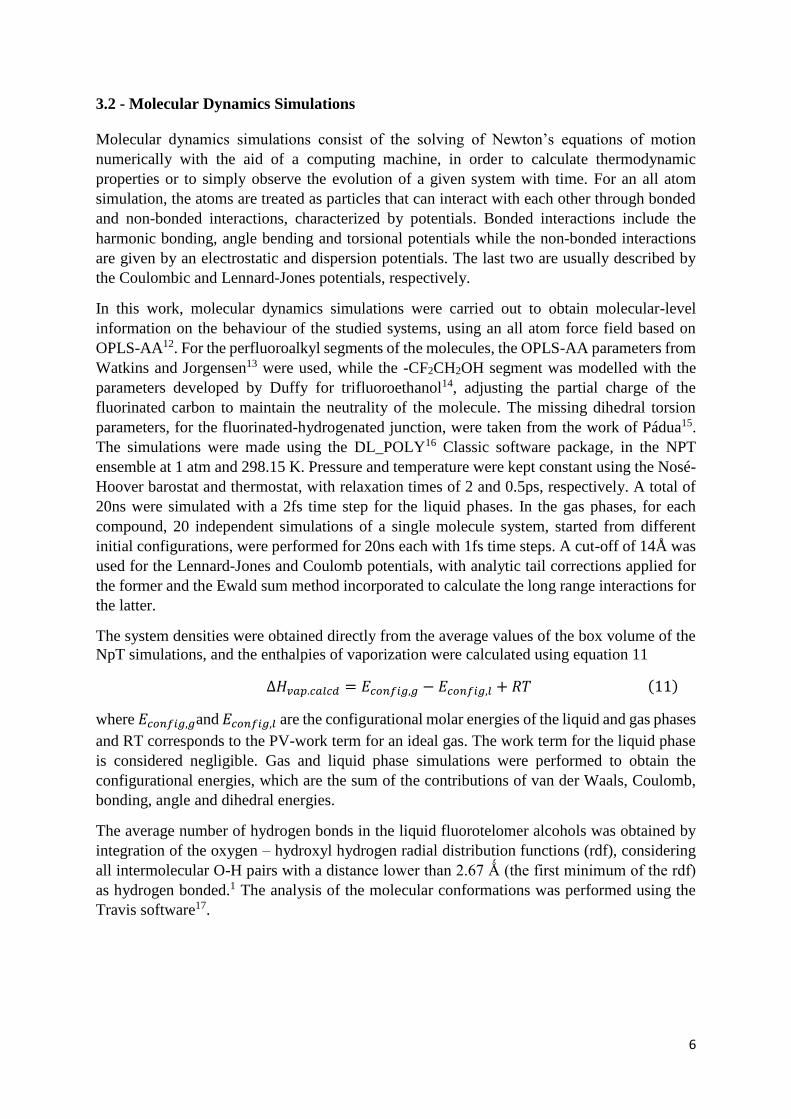
Figure 9. Dihedral distribution function around the C-O bond. ............................................................ 16

VIII
Nomenclature
2:1 FTOH – 1H,1H-perfluoropropan-1-ol
3:1 FTOH – 1H,1H-perfluorobutan-1-ol
4:1 FTOH – 1H,1H-perfluoropentan-1-ol
5:1 FTOH – 1H,1H-perfluoroheptan-1-ol
A – Helmholtz free energyA, B, C -
Antoine equation constants
a1, a2 - first and second order perturbation
terms for the monomeric excess Helmholtz
free energy
AA – All Atom model
AAD – Average Absolute Deviation
c3, c2, c1, c0 – Density fitting constants
CAS - Chemical Abstracts Service registry
number
ddf – dihedral distribution function
Econfig – Configuration Energy
EoS – Equation of State
FTOH - Fluorotelomer Alcohol
g(σ) – Radial distribution function
GC – Group Contribution
HB – Hydrogen Bonding
Hvap – Enthalpy of vaporization
K – Bonding volume between association
sites
kB – Boltzmann constant
mi – Functional group chain length
n – Number of components
N – Number of molecules
𝑛𝑘′ – Number of types of functional groups
in component k
𝑛𝑠′ – Number of sites on a given functional
group
NMR – Nuclear Magnetic Resonance
OPLS - Optimized Potentials for Liquid
Simulations force field
P, p – Pressure
PID - Proportional-integral-derivative
controller
R – Ideal gas constant
SAFT – Statistical Associating Fluid
Theory
SW – Square-Well
T – Temperature
TPT1 – Wertheim’s first-order
perturbation theory
UA – United Atom model
V – Volume
VR – Variable Range
X – Fraction of associated sites not bonded
xk – Mole fraction
y(σ) – Background correlation function

IX
Subscripts
a – Index for association sites
i, j – Index for functional group parameters
k, l – Index for molecular parameters
g – Gas state
l – Liquid state
exp – Experimental data
calc – Calculated data
lit – Data retrieved from literature
Superscripts
ideal – Ideal contribution
mono – monomer-monomer contribution
chain – chain contribution
assoc – association contribution
Greek Symbols
σ – Segment diameter
𝜀𝑖,𝑖𝐻𝐵 – Energy between association sites
𝜀𝑖,𝑖 – Square-well potential depth
λii – Square-well potential range
ρk – Number density
ρ – Mass density
Λ – de Broglie wavelength
νki – Number of each type of functional
group
α – Thermal expansion coefficient
ξij – Cross interaction parameter
γij – Cross interaction parameter

1
1 - Introduction
Highly fluorinated compounds have become important substances, both from the industrial and
fundamental points of view. Fluorinated alcohols in particular, find application in numerous
commercial products from textile protection agents and fire-fighting foams, to detergents,
paints, and as precursors in the production of fluorinated polymers.
Fluorotelomer alcohols are linear highly fluorinated molecules possessing a terminal OH
group, with the general formula, CF3(CF2)n(CH2)mOH (n+1:m FTOH). This molecular
structure results in an enhanced amphiphilic character compared to hydrogenated alcohols, as
fluorinated chains are known to be more hydrophobic than their hydrogenated analogues.
Fluorotelomers can be divided in two major groups: odd FTOH for m=1 and even FTOH for
m=2. In an effort to understand and model these molecules, experimental properties such as
vapour pressure and densities were measured and enthalpies of vaporization calculated.
This work is part of a project in which experimental measurements, molecular simulation
techniques and theoretical calculations, have been simultaneously used to elucidate the
properties of fluorinated substances and their mixtures. Using this approach, diffusion
coefficients have recently been reported of fluorinated alcohols in aqueous solutions1. The
behaviour of mixtures of fluorinated and hydrogenated alcohols has also been described. These
mixtures display a very complex behaviour when compared with mixtures of hydrogenated
alcohols and mixtures of alkanes and perfluoroalkanes. The excess volumes are large and
positive (unlike those of mixtures of hydrogenated alchools) while the excess enthalpies are
large and negative (contrasting with those of mixtures of alkanes and perfluoroalkanes)1. This
peculiar behaviour results from a balance between the weak dispersion forces between the
hydrogenated and fluorinated groups and a preferential hydrogen bond between the
hydrogenated and the fluorinated alcohols.
Following this line of work, we now present new experimental data for the vapour pressures
and liquid densities of four liquid 1H,1H-perfluoroalcohols (CF3(CF2)nCH2OH, n = 1, 2, 3, 4)
as a function of temperature. Molar enthalpies of vaporization were calculated from the
experimental data and the results compared with data from the literature for other
perfluoroalcohols as well as their equivalent hydrogenated alcohols. Vapour pressure
measurements had been previously reported for the longer chain (CF3(CF2)nCH2OH, n=5-9)
even fluorotelomers2, but for the short chain studied in this work, experimental data has not
been reported or is of insufficient accuracy. Molecular dynamics simulations were performed
in order to obtain a molecular level insight into the experimental results. Experimental molar
enthalpies of vaporization and densities were used to validate the force field used in the
molecular dynamics simulations. Additionally, the GC-SAFT-VR equation was used to predict
the experimental results. Excellent agreement has been found between the theoretical
predictions and the experimental results.

2
2 - Experimental Techniques
2.1 - Purification and Characterization
1H,1H-perfluoropropan-1-ol (2:1 FTOH, CAS number:422-05-9), 1H,1H-perfluorobutan-1-ol
(3:1 FTOH, CAS number:375-01-9), 1H,1H-perfluoropentan-1-ol (4:1 FTOH, CAS
number:355-28-2) and 1H,1H-perfluorohexan-1-ol (5:1 FTOH, CAS number:423-46-1) were
purchased from Apollo Scientific Ltd; a 98% purity was indicated for all the alcohols except
perfluoropentanol, for which a 97% purity was claimed. Prior to their use, the compounds
were dried with VWR Prolabo 4A molecular sieves to a maximum water content of 500 ppm
(analysed by Karl-Fischer coulometry) and their purity was confirmed by 1H and 19F NMR
spectroscopy.
2.2 - Vapour Pressure Measurements
The vapour pressure of the fluoroalcohols was measured in the 278 to 328K temperature range,
with the exception of the 3:1 FTOH that was measured from 298 to 328K. The measurements
were made using a static apparatus previously described3, which consists of a spherical glass
cell connected to a vacuum line and to a pressure transducer. The cell is immersed in a
thermostatic water bath controlled by a Hart Scientific 2100 PID temperature controller. The
temperature of the liquid was measured using a calibrated Pt100 temperature sensor connected
to a Keithley 2000 6½ digital multimeter, with an absolute uncertainty of 0.05K. The
temperature stability and uniformity during a measurement is estimated to be better than 0.01
K. The pressure was measured with a Paroscientific Series 1000 quartz absolute pressure
transducer connected to a Paroscientific model 715 display unit. The pressure sensor is capable
of measuring up to 100 psia (0.69MPa), with an accuracy of 0.0001% and has an automatic
temperature compensation system. While measuring, the connecting line between the glass cell
and the pressure transducer was kept at a higher temperature than the bath’s in order to avoid
condensation of the vapour.
The liquids were submitted to freezing in liquid nitrogen, vacuum pumping and melting cycles
to degas them. The samples were further purged to the vacuum line for a few seconds while
agitating the liquid. The procedure was repeated until the vapour pressure was reproducible,
confirming that no volatile species were present. The temperature was then changed and the
pressure recorded after stabilization. Measurements were made in paths of increasing and
decreasing temperature, in order to reduce the possibilities of systematic error.
2.3 - Density Measurements
The liquid densities of the fluoroalcohols were measured in an Anton Paar DMA 5000
vibrating-tube densimeter. The instrument was calibrated with water (distilled, purified with a
Mili-Q 185 plus water purification system, and freshly boiled) and air at 20.000 °C, taking into
account atmospheric pressure. The calibration was checked with water over the whole range of
operating temperatures, and the maximum deviation from literature values was found to be less
than 0.00002 g.cm-3. The density of air was verified at the beginning of each series of
measurements to ensure the cleanliness of the measurement cell.

3
3 - Theoretical Introduction and Application
3.1 - GC-SAFT-VR Theory and Molecular Model
The GC-SAFT-VR equation combines the SAFT-VR4 equation with a group contribution
(GC)5 approach that allows for the description of chains built up from segments of different
size and/or energy of interaction. This approach allows for the location of the functional groups
and association sites within a molecule to be specified, enabling the heterogeneity in molecular
structure to be captured within a SAFT model.
In the approach, molecules are described by tangentially bonded segments in which each type
of segment represents a functional group present in the molecule5, 6. The segments representing
each functional group interact via a square well potential, which can be described by
(1)
where uki,lj represents the interaction between a functional group of type i present in molecule
k with a functional group of type j in molecule l, is the segment diameter, is the depth of
the square well, is the potential range, and r is the distance between the two groups. The
unlike size and energy interactions can be obtained from the Lorentz-Berthelot combining rules
expressed by
(2)
(3)
and the unlike potential range is given by,
(4)
The GC-SAFT-VR equation of state is written in terms of the total Helmholtz free energy,
expressed as a sum of four separate contributions:
𝐴
𝑁𝐾𝐵𝑇=
𝐴𝑖𝑑𝑒𝑎𝑙
𝑁𝐾𝐵𝑇+
𝐴𝑚𝑜𝑛𝑜
𝑁𝐾𝐵𝑇+
𝐴𝑐ℎ𝑎𝑖𝑛
𝑁𝐾𝐵𝑇+
𝐴𝑎𝑠𝑠𝑜𝑐
𝑁𝐾𝐵𝑇 (5)
where N is the total number of molecules in the system, T is the temperature, and kB is the
Boltzmann constant. In equation 5, Aideal is the ideal free energy, Amono is the contribution to
the free energy due to the monomer segments, Achain is the contribution due to the formation of
bonds between monomer segments, and Aassoc is the contribution due to association. Since the
theory has been presented previously5, 7 only a brief overview of the main expressions are
provided below.
The ideal Helmholtz free energy, Aideal, is given by

4
𝐴𝑖𝑑𝑒𝑎𝑙
𝑁𝐾𝐵𝑇= ∑ 𝑥𝑘 ln 𝜌𝑘𝛬𝑘
3 − 1
𝑛
𝑘=1
(6)
where n is the number of compounds, 𝜌𝑘 the molecular number density of component k, 𝑥𝑘 the
mole fraction of component k and 𝛬𝑘 the thermal de Broglie wavelength.
The monomer free energy, Amono, is given by a second order high temperature expansion using
Barker and Henderson perturbation theory for mixtures8
𝐴𝑚𝑜𝑛𝑜
𝑁𝐾𝐵𝑇= ∑ ∑ 𝑥𝑘 𝜈𝑘𝑖𝑚𝑖 𝑎𝑀
𝑛𝑘′
𝑖=1
𝑛
𝑘=1
= ∑ ∑ 𝑥𝑘 𝜈𝑘𝑖𝑚𝑖 (𝑎𝐻𝑆 +𝑎1
𝐾𝐵𝑇
𝑛𝑘′
𝑖=1
𝑛
𝑘=1
+𝑎2
(𝐾𝐵𝑇)2) (7)
where 𝑛𝑘′ is the number of functional groups for component k, 𝜈𝑘𝑖 the number of type i
functional groups existent in component k, 𝑚𝑖 the functional group chain length and 𝑎𝑀 the
excess Helmholtz free energy per monomer segment, which is given by the sum of the hard
sphere free energy,𝑎𝐻𝑆, with the first-order, 𝑎1, and second-order, 𝑎2, perturbation terms
associated with the dispersion interactions given by the square-well potential.
The Helmholtz free energy due to the formation of a hetersegmented square-well (SW) chain
molecule is given by
𝐴𝑐ℎ𝑎𝑖𝑛
𝑁𝐾𝐵𝑇= − ∑ 𝑥𝑘 ∑ ln 𝑦𝑘𝑖,𝑘𝑗
𝑆𝑊 (𝜎𝑘𝑖,𝑘𝑗)
𝑛𝑘′
𝑖𝑗
𝑛
𝑘=1
(8)
where the second sum corresponds to the bonding between monomers within the chain k. The
last term of the equation is related to the radial distribution function, 𝑔𝑘𝑖,𝑘𝑗𝑆𝑊 (𝜎𝑘𝑖,𝑘𝑗) by
𝑦𝑘𝑖,𝑘𝑗𝑆𝑊 (𝜎𝑘𝑖,𝑘𝑗) = exp (−
𝜀𝑘𝑖,𝑘𝑗
𝐾𝐵𝑇) 𝑔𝑘𝑖,𝑘𝑗
𝑆𝑊 (𝜎𝑘𝑖,𝑘𝑗) (9)
where 𝜎𝑘𝑖,𝑘𝑗 and 𝜀𝑘𝑖,𝑘𝑗 are the diameter and well-depth calculated using the Lorentz-Berthelot
combining rules.
Finally, the contribution due to association9, (Aassoc), interactions between sites on different
functional groups that form the molecules of interest is expressed as
𝐴𝑎𝑠𝑠𝑜𝑐
𝑁𝐾𝐵𝑇= ∑ 𝑥𝑘 ∑ 𝜈𝑘𝑖
𝑛𝑘′
𝑖=1
𝑛
𝑘=1
∑ 𝑛𝑖𝑎
𝑛𝑠′
𝑎=1
(ln 𝑋𝑘𝑖𝑎 +1 − 𝑋𝑘𝑖𝑎
2) (10)
where 𝑎 is the association site type, 𝑛𝑠′ is the number of association sites and 𝑋𝑘𝑖𝑎 represents
the non-bonded fractions.
At this point, it is important to note that in the usual homonuclear model of SAFT the
contribution to the free energy due to bonding at separate sites are independent, and as such,
the location of sites on a molecule is arbitrary; the sites are in actuality averaged over the whole
molecule. However, in the GC-SAFT-VR equation, because of the hetero-segmented chain
model used, the location of the association sites can be specified on a given functional group
and hence their position within the model chain defined10.

5
With the Helmholtz free energy defined, thermodynamic properties such as pressure,
temperature, and chemical potential, can then be obtained using standard thermodynamic
relationships.
In this work, the liquids have been modeled using the GC-SAFT-VR equation implementing a
totally predictive approach. The fluoroalcohols, with formula CF3(CF2)nCH2OH, are comprised
of the CF3, CF2, CH2, and terminal OH groups. The parameters, number of spherical segments
forming the chains, the square-well parameters ε, σ, and λ, the association parameters, and the
binary interaction parameters that mediate the strength of the cross interactions were all taken
previous GC-SAFT-VR work5, 9, 11 where the parameters were determined by fitting to
experimental vapor pressure and saturated liquid density data for molecules containing the
groups of interest. Specifically, the alkanes were used to determine CH2 parameters,
perfluoroalkanes and perfluoroalkylalkanes the CF3 and CF2 parameters, and finally the
alcohols were used to determine the parameters for the terminal OH group. Utilizing this
approach, the GC-SAFT-VR theory is used to successfully predict, without any reliance on
experimental data, the thermodynamic properties of the fluoroalcohol molecules. To calculate
properties using the GC-SAFT-VR EoS for a pure compound with 1 type of association
functional group, 6 types of parameters (𝑚𝑖, 𝜎𝑖𝑖, 𝜀𝑖𝑖, 𝜆𝑖𝑖, 𝜀𝑖,𝑖𝐻𝐵, 𝐾𝑖,𝑖
𝐻𝐵) are required and are shown
on table 1. 𝜀𝑖,𝑖𝐻𝐵 and 𝐾𝑖,𝑖
𝐻𝐵𝑎re two of the inputs for the calculation of the associative term of the
Helmholtz free energy, in this case for the hydrogen bonding (HB) associative type.
𝜀𝑖,𝑖𝐻𝐵represents the energy between association sites while 𝐾𝑖,𝑖
𝐻𝐵 represents the volume available
for hydrogen bonding. The number of association sites for the terminal OH groups was set as
3 on account of the 2 non-bonding electron pairs and the electron deficient hydrogen atom.
Table 1 – GC-SAFT-VR parameters
Group 𝑚𝑖 𝜎𝑖𝑖 (Å) 𝜀𝑖𝑖/𝑘𝐵 (𝐾) 𝜆𝑖𝑖 𝜀𝑖,𝑖𝐻𝐵/𝑘𝐵 (𝐾) 𝐾𝑖,𝑖
𝐻𝐵(Å3)
OH (terminal) 0.176 5.299 534.805 1.495 2797 0.16014
CH2 0.333 4.041 237.230 1.667 - -
CF2 0.37 4.345 218.87 1.641 - -
CF3 0.685 4.618 315.56 1.321 - -
The binary interaction parameters that mediate the strength of the cross interactions between
CH2 and CF2 groups (ξij = 1.1 and γij = 0.86) were also taken from McCabe’s previous works.
6
3.2 - Molecular Dynamics Simulations
Molecular dynamics simulations consist of the solving of Newton’s equations of motion
numerically with the aid of a computing machine, in order to calculate thermodynamic
properties or to simply observe the evolution of a given system with time. For an all atom
simulation, the atoms are treated as particles that can interact with each other through bonded
and non-bonded interactions, characterized by potentials. Bonded interactions include the
harmonic bonding, angle bending and torsional potentials while the non-bonded interactions
are given by an electrostatic and dispersion potentials. The last two are usually described by
the Coulombic and Lennard-Jones potentials, respectively.
In this work, molecular dynamics simulations were carried out to obtain molecular-level
information on the behaviour of the studied systems, using an all atom force field based on
OPLS-AA12. For the perfluoroalkyl segments of the molecules, the OPLS-AA parameters from
Watkins and Jorgensen13 were used, while the -CF2CH2OH segment was modelled with the
parameters developed by Duffy for trifluoroethanol14, adjusting the partial charge of the
fluorinated carbon to maintain the neutrality of the molecule. The missing dihedral torsion
parameters, for the fluorinated-hydrogenated junction, were taken from the work of Pádua15.
The simulations were made using the DL_POLY16 Classic software package, in the NPT
ensemble at 1 atm and 298.15 K. Pressure and temperature were kept constant using the Nosé-
Hoover barostat and thermostat, with relaxation times of 2 and 0.5ps, respectively. A total of
20ns were simulated with a 2fs time step for the liquid phases. In the gas phases, for each
compound, 20 independent simulations of a single molecule system, started from different
initial configurations, were performed for 20ns each with 1fs time steps. A cut-off of 14Å was
used for the Lennard-Jones and Coulomb potentials, with analytic tail corrections applied for
the former and the Ewald sum method incorporated to calculate the long range interactions for
the latter.
The system densities were obtained directly from the average values of the box volume of the
NpT simulations, and the enthalpies of vaporization were calculated using equation 11
∆𝐻𝑣𝑎𝑝.𝑐𝑎𝑙𝑐𝑑 = 𝐸𝑐𝑜𝑛𝑓𝑖𝑔,𝑔 − 𝐸𝑐𝑜𝑛𝑓𝑖𝑔,𝑙 + 𝑅𝑇 (11)
where 𝐸𝑐𝑜𝑛𝑓𝑖𝑔,𝑔and 𝐸𝑐𝑜𝑛𝑓𝑖𝑔,𝑙 are the configurational molar energies of the liquid and gas phases
and RT corresponds to the PV-work term for an ideal gas. The work term for the liquid phase
is considered negligible. Gas and liquid phase simulations were performed to obtain the
configurational energies, which are the sum of the contributions of van der Waals, Coulomb,
bonding, angle and dihedral energies.
The average number of hydrogen bonds in the liquid fluorotelomer alcohols was obtained by
integration of the oxygen – hydroxyl hydrogen radial distribution functions (rdf), considering
all intermolecular O-H pairs with a distance lower than 2.67 Ǻ (the first minimum of the rdf)
as hydrogen bonded.1 The analysis of the molecular conformations was performed using the
Travis software17.

7
4 - Results and Discussion
4.1 - Vapour Pressures and Enthalpies of Vaporization
The experimental vapour pressures as a function of temperature of the studied FTOH are
reported in Table 2 and plotted in Figure 1.
Table 2. Experimental vapour pressures for 2:1, 3:1, 4:1 and 5:1 FTOH
2:1 FTOH 3:1 FTOH 4:1 FTOH 5:1 FTOH
T (K) Pvap (kPa) T (K) Pvap (kPa) T (K) Pvap (kPa) T (K) Pvap (kPa)
298.08 6.2055 278.14 0.7213 278.14 0.2236 278.14 0.0688
303.05 8.4158 283.10 1.0470 283.10 0.3363 283.10 0.1098
308.04 11.3058 288.08 1.4954 288.07 0.5020 288.08 0.1712
313.01 14.9656 293.08 2.1173 293.06 0.7329 293.08 0.2615
317.98 19.5864 298.10 2.9653 298.09 1.0700 298.13 0.3944
322.96 25.4116 303.07 4.0862 303.10 1.5312 303.10 0.5819
327.93 32.4857 308.04 5.5515 308.06 2.1523 308.06 0.8405
313.03 7.4728 313.02 2.9794 313.01 1.2052
317.98 9.9047 317.98 4.0707 317.98 1.7082
322.95 13.1446 322.99 5.4963 322.93 2.3494
327.91 17.2579 327.95 7.3149 327.93 3.2499
Figure 1. Experimental vapour pressures for 2:1 (), 3:1(), 4:1() and 5:1 FTOH(); GC-
SAFT-VR predictions (lines).
-4
-3
-2
-1
0
1
2
3
4
2,9E-03 3,1E-03 3,3E-03 3,5E-03 3,7E-03
ln (
P/kP
a)
1/T (K-1)

8
The experimental results were correlated with the Antoine equation
ln(𝑝/𝑘𝑃𝑎) = 𝐴 −𝐵
(𝑇/𝐾) + 𝐶 (12)
where p is the vapour pressure, T is the temperature and A, B and C are Antoine’s adjustable
constants. The obtained constants reproduce the vapour pressure data within the experimental
uncertainty and are presented in Table 3, along with the root mean square deviation (RMSD)
of the fit and the average percent deviation which is defined as:
(13)
where n is the number of experimental points.
Table 3. Constants for the Antoine equation.
The measured vapour pressures for 2:1FTOH and 3:1FTOH are compared with data from the
literature in figure 2. In this work we have measured the vapour pressure of 2:1 FTOH between
298 K and 328 K, complementing the data of Meeks and Goldfarb18 at a lower temperature
range, between 273 K and 298 K. As can be seen, both data sets compare favourably. As for
3:1 FTOH, however, the vapour pressure now reported is much lower than that of Meeks and
Goldfarb18. The relative differences can be as high as 100%, obviously much higher than the
uncertainties of both data sets. It is thus very unlikely that such a discrepancy is due to
experimental error and suggests the existence of a volatile impurity in the sample of Meeks and
Goldfarb18. The temperature dependence is also very different for both data sets and, as will be
shown, that of Meeks and Goldfarb18 is not consistent with those observed for the other
substances in the FTOH family.
Compound A B C RMSD kPa) p/p (%)
2:1 FTOH 15.439 2931.877 -82.748 0.015 0.1
3:1 FTOH 18.821 4808.731 -26.973 0.035 0.2
4:1 FTOH 16.278 3608.616 -75.398 0.004 0.5
5:1 FTOH 25.162 8615.885 31.895 0.042 1.7

9
Figure 2. Logarithmic representation of the vapour pressures with 1/T for: 2:1 FTOH, this work
() and Meeks and Goldfarb18 (); 3:1 FTOH, this work (), Meeks and Goldfarb18 (). The
lines are linear (Clausius-Clapeyron) fits to our experimental results.
The GC-SAFT-VR predictions for the vapour pressure of the fluoroalcohols are compared with
the experimental data in figure 1. As can be seen, the theory is able to reproduce the vapour
pressure in close agreement with the experimental results. It should be emphasized that the
theoretical results are pure predictions, as none of the model parameters was fitted to the
experimental data.
The enthalpies of vaporization of the studied FTOH were estimated from the vapour pressure
data using the Clausius-Clapeyron equation, assuming that the enthalpy of vaporization is
constant in the measured temperature range and that the vapour phase behaves as an ideal gas.
This should be a reasonable approximation since the measured pressures are very low. The
calculated enthalpies of vaporization are reported in table 4 and plotted in figure 3. Also shown
in figure 3 are the enthalpies of vaporization from the literature2, 18 for 1:1 FTOH, 2:1 FTOH,
3:1 FTOH and for longer chain alcohols from 6:1 FTOH to 10:1 FTOH. As can be seen, the
vaporization enthalpy for the FTOH family increases almost linearly with chain length,
displaying an average increment of 4.8 kJ per each additional CF2 group. The vaporization
enthalpy of 2:1 FTOH of Meeks and Goldfarb18 is 4% higher than the value now reported. It
can also be seen that the vaporization enthalpy of 3:1 FTOH deviates from the linear correlation
and is 11% higher than our value. We interpret this deviation as a further confirmation that the
vapour pressure data of Meeks and Goldfarb18 for 3:1 FTOH is inaccurate, probably due to the
presence of a volatile impurity.
-1
0
1
2
3
4
0,003 0,0032 0,0034 0,0036
ln (
p/k
Pa)
1/T (K-1)

10
Table 4. Molar enthalpies of vaporization of 1H,1H-perfluoroalcohols.
Figure 3. Molar enthalpies of vaporization for the FTOH family as a function of chain length;
() this work; () J. Costa et al.2; () Meeks and Goldfarb18.
The enthalpies of vaporization obtained from the simulations and GC-SAFT-VR calculations
are also reported in table 4 and compared with the experimental results in figure 4. As can be
seen, the simulations are able to reproduce the experimentally observed trend, increasing with
molecular weight, but overestimate the vaporization enthalpies by 4 to 10%, which can be
considered quite good. The GC-SAFT-VR approach was also used in a purely predictive
manner to calculate the enthalpies of vaporization using the Clausius-Clapeyron equation with
the vapour pressure results in the 278 K to 328 K temperature range. The GC-SAFT-VR EoS
is also able to reproduce the enthalpies of vaporization with very good agreement, with
deviations of no more than 4%.
40
50
60
70
80
90
2 3 4 5 6 7 8 9 10 11 12
∆𝐻
vap
/ kJ
.mo
l-1
# Carbons
Compound T / K Hvap,exp / kJ mol-1 Hvap,SAFT / kJ
mol-1
Hvap,sim / kJ
mol-1 Hvap,lit / kJ mol-1
1:1 FTOH 285.7 - - - 44.518
2:1 FTOH 313.01 45.1±0.2 46.5 47.1±1.2* 46.9 (284.8K)18
3:1 FTOH 303.04 48.3±0.1 49.6 53.2±1.0* 43.5 (285.6K)18
4:1 FTOH 303.05 53.5±0.2 53.2 59.0±0.8* -
5:1 FTOH 303.05 59.1±0.2 57.0 61.9±0.8* -
6:1 FTOH 298.15 - - - 64.62
7:1 FTOH 298.15 - - - 68.42
8:1 FTOH 298.15 - - - 72.42
9:1 FTOH 298.15 - - - 80.52
10:1 FTOH 298.15 - - - 84.42
*Calculated at 298.15 K.

11
Figure 4. Molar enthalpy of vaporization of 2:1 FTOH, 3:1 FTOH, 4:1 FTOH and 5:1 FTOH
from experiment (), simulations () and GC-SAFT-VR predictions ().
Finally, the enthalpies of vaporization of the fluorinated alcohols are compared with those of
their hydrogenated counterparts in figure 5. As can be seen, for hydrogenated alcohols the
enthalpies of vaporization are higher and also follow a linear trend with approximately the
same slope as the fluorinated ones. The lower vaporization enthalpies observed for the
fluorinated alcohols are consistent with the hypothesis that these compounds display a slightly
lesser degree of hydrogen bonding than their hydrogenated counterparts, which gives the liquid
phase a lower cohesiveness. Moreover, the intramolecular gauche interactions between the
positively charged hydroxyl H and the electronegative fluorine atoms may stabilize these
molecules in the gas phase19, also contributing to a smaller enthalpy of vaporization.
Figure 5. Comparison of the enthalpy of vaporization for fluorotelomer () and hydrogenated
alcohols ().
40
45
50
55
60
65
2 3 4 5 6 7
∆𝐻
vap
/ kJ
.mo
l-1
# Carbons
40
50
60
70
80
90
2 3 4 5 6 7 8 9 10 11 12
𝐻
vap
/ kJ
.mo
l-1
#Carbons

12
4.2 - Liquid Densities and Thermal Expansion Coefficients
The experimental liquid densities for 2:1, 3:1, 4:1 and 5:1 FTOH are collected in table 5 at 5 K
intervals, in the 278 K - 353 K temperature range, and plotted in figure 6.
Table 5. Densities for 2:1, 3:1, 4:1 and 5:1 FTOH at atmospheric pressure.
2:1 FTOH 3:1 FTOH 4:1 FTOH 5:1 FTOH
T (K) (g.cm-3) T (K) (g.cm-3) T (K) (g.cm-3) T (K) (g.cm-3)
278.156 1.542779 278.155 1.633587 278.150 1.689575 278.151 1.746400
283.147 1.533693 283.148 1.624226 283.149 1.680180 283.148 1.737071
288.146 1.524473 288.147 1.614728 288.147 1.670671 288.147 1.727618
293.146 1.515119 293.147 1.605106 293.148 1.661048 293.149 1.718063
298.146 1.505629 298.146 1.595340 298.149 1.651303 298.148 1.708376
303.147 1.495975 303.148 1.585414 303.148 1.641419 303.148 1.698566
308.146 1.486147 308.146 1.575323 308.148 1.631401 308.149 1.688624
313.145 1.476122 313.145 1.565049 313.148 1.621228 313.148 1.678543
318.147 1.465891 318.147 1.554576 318.149 1.610899 318.148 1.668318
323.145 1.455434 323.145 1.543907 323.148 1.600404 323.148 1.657947
328.146 1.444737 328.146 1.533018 328.148 1.589737 328.149 1.647416
333.144 1.433788 333.145 1.521908 333.148 1.578896 333.148 1.636724
338.144 1.422580 338.144 1.510567 338.148 1.567872 338.148 1.625880
343.149 1.411103 343.145 1.498990 343.148 1.556652 343.148 1.614863
348.146 1.399338 348.145 1.487165 348.150 1.545153 348.149 1.603675
353.145 1.387286 353.145 1.475083 353.146 1.533524
Figure 6. Experimental liquid densities for 2:1 (,blue), 3:1(,red), 4:1(,green) and 5:1
FTOH(,purple), GC-SAFT-VR predictions (lines) and Simulation results (X).
1,3
1,4
1,5
1,6
1,7
1,8
270 290 310 330 350
/
g.cm
-3
T (K)

13
Third degree polynomial equations were fitted to the experimental densities in the measured
temperature range. The fitting constants are recorded in table 6.
𝜌(𝑔. 𝑐𝑚−3) = 𝑐3𝑇3 + 𝑐2𝑇2 + 𝑐1𝑇 + 𝑐0 (14)
Table 6. Coefficients for equation 14.
Compound c3 c2 c1 c0
2:1 FTOH -1.913547E-08 -1.825856E-06 -1.787961E-03 1.551769
3:1 FTOH -1.419722E-08 -2.102733E-06 -1.838069E-03 1.642826
4:1 FTOH -1.122842E-08 -1.792072E-06 -1.851884E-03 1.698887
5:1 FTOH -6.976345E-09 -2.023707E-06 -1.835124E-03 1.755626
The liquid densities obtained by molecular dynamics at 298.15 K are compared with the
experimental data in table 7 and in figure 6. The simulations are able to predict the density with
deviations of less than 2% to the experimental results, which are well within the density
deviations obtained in the original OPLS-AA work12. This result, together with the fairly good
estimates obtained for the vaporization enthalpies, validates the molecular model used in the
simulations.
The GC-SAFT-VR predictions for the liquid density of the fluoroalcohols are compared with
the experimental data in figure 6. The theoretical predictions can be considered very good,
specially if it is taken into account that no fitting parameters were introduced in the calculations.
Again it should be realised that a better agreement could be achieved if specific binary
interaction parameters were adjusted for each substance. This however, is not the purpose of
the present work.
Table 7. Experimental and simulated liquid densities at 298.15 K and thermal expansion
coefficients.
Substance exp (g.cm-3) sim (g.cm-3) (K-1).103
2:1 FTOH 1.505624 1.502 1.40
3:1 FTOH 1.595328 1.603 1.35
4:1 FTOH 1.651294 1.679 1.28
5:1 FTOH 1.708357 1.730 1.21(T=313.15K)

14
Finally, in figure 7 the thermal expansion coefficients, , obtained from the temperature
dependence of the experimental liquid densities, are plotted as a function of chain length. This
dependency was fitted with a cubic polynomial function and the expansion coefficient was
obtained from the average of the derivatives at each data point, considering the correspondent
temperature as the mean of the interval. As could be expected, decreases with the increase in
the chain length.
Figure 7. Thermal expansion coefficient vs chain length.
1,20
1,25
1,30
1,35
1,40
1,45
2 3 4 5 6 7
α(K
-1).
10
3
# Carbons

15
4.4 - Molecular Simulations
The average number of hydrogen bonds per fluorotelomer alcohol molecule (nHB) was obtained
from the molecular dynamics trajectories. These results are represented in figure 8, along with
the results for ethanol, butanol and trifluoroethanol from another work of our group20, using
the OPLS-AA forcefield, and simulation results from the literature for methanol and ethanol
using OPLS-UA21 and for ethanol to hexanol using TraPPE22. For the hydrogenated alcohols,
as can be seen, it is not possible to discern a clear tendency for the average number of hydrogen
bonds; however, it is interesting to note that whenever a direct comparison can be made, the
results essentially agree despite the different molecular models used and the slightly different
criteria used for identifying hydrogen bonds. The fluorinated alcohols, however, seem to
present an increasing number of hydrogen bonds as the chain grows, but always remaining
below the values for the alkanols. This lower number of hydrogen bonds in the liquid phase
may contribute to the also lower enthalpies of vaporization observed.
Figure 8. Average number of hydrogen bonds per molecule vs chain length for: FTOH from
this work () and from reference 20 with OPLS-AA (), hydrogenated alcohols with
TraPPE22 () and OPLS-UA21 () force fields.
The conformational equilibrium of the studied fluoroalcohols, specifically the probability
distribution around the rotation of the carbon-oxygen bond, was also obtained from the
simulations for the liquid and the gas phases. This probability distribution, denominated
dihedral distribution function (ddf), is shown in figure 9 in a symmetric representation where
180 degrees corresponds to the fully trans conformation, with the hydroxyl hydrogen pointing
away from the rest of the molecule and 0 degrees is the opposite configuration, with the
hydroxyl hydrogen pointing towards the second carbon atom. It can be seen that the ddf are
similar for all the fluoroalcohols and that in the gas phase it consists of a single peak, centered
around 70 degrees, which corresponds to a gauche conformer; outside this peak, the probability
of finding a given conformer is very low. In the liquid phase, the gauche-like peak shifts to
higher angles, centering now around 90 degrees, and there is now a significant probability of
1,5
1,6
1,7
1,8
1,9
2
0 1 2 3 4 5 6 7
nH
B
# Carbons
FTOH's
OPLS-AA
Trappe
OPLS-UA
16
finding transoid conformers, with dihedral angles close to 180 degrees. This conformational
equilibrium shift is determined by the intermolecular interactions, since the higher dihedral
angles favour the formation of intermolecular hydrogen bonds by H-donation. In the gas phase,
however, the gauche conformations increase the intramolecular electrostatic interactions
between the hydroxil hydrogen and the negatively charged fluorine atoms of the alcohol chain,
lowering the energy of the molecule in the vapour. This kind of interaction does not exist in
the fully hydrogenated alcohols, and certainly contributes to the lower enthalpy of vaporization
observed in the studied fluorinated alcohols.
Figure 9. Dihedral distribution function around the C-O bond.
0 30 60 90 120 150 180
±θ (CCOH)
F3OH_liq
F4OH_liq
F5OH_liq
F6OH_liq
F3OH_gas
F4OH_gas
F5OH_gas
F6OH_gas

17
5 - Conclusions
The vapour pressure of 1H,1H-perfluoroalcohols (CF3(CF2)n(CH2)OH, n = 1, 2, 3, 4) was
measured in the temperature range between 278 K and 328 K. A comparison of the vapour
pressures with previous literature18 results showed good agreement for 2:1 FTOH but a very
significant discrepancy of for 3:1 FTOH, leading to the conclusion that the sample used by
Meeks and Goldfarb18 might have contained volatile impurities. Enthalpies of vaporization
were calculated from the experimental data and a linear dependency with chain length was
observed for the odd fluorotelomer alcohols family, much like the dependency for alkanols and
with roughly the same slope, while comparatively lower in absolute value. An explanation for
these lower enthalpies of vaporization is a lower degree of intermolecular hydrogen bonding
which contributes to a lower aggregation of the liquid molecules.
The results were interpreted with the GC-SAFT-VR5 EoS using a purely predictive approach
and a very good agreement for the vapour pressures and enthalpies of vaporization was
obtained. Liquid density curves were also obtained with this EoS with a good degree of
agreement.
Molecular dynamics simulations were performed using the OPLS-AA12 force field and used to
calculate properties such as enthalpies of vaporization and room temperature densities. The
results showed a satisfactory compliance with the experimental results, particularly for the
liquid densities whose deviations are of the same order as the ones of the original OPLS-AA
work. Further analysis of the simulation results showed that the number of hydrogen bonds
seems to increase with chain length while always remaining lower than that observed for the
hydrogenated counterparts, which may contribute to the lower enthalpy of vaporization
observed for the fluorinated alcohols. The dihedral distribution functions (ddf) were also
obtained around the C-O bond from the simulation data and showed a similar results for all the
fluoroalcohols studied. A comparison between the liquid and gas phase dihedral distribution
functions, however, presented significant differences as a single peak at 70o was obtained for
the gas phase, corresponding to the gauche conformation, while for the liquid phase, the first
peak is at 90o, corresponding to a gauche-like conformation but with a much broader possibility
of conformations available for higher angles. The gauche conformation between the hydroxyl
positive hydrogen and the partially negative fluorines of the gas phase molecules that leads to
an overall lower enthalpy further supports the lower enthalpies of vaporization obtained for the
fluorinated alcohols when compared to the hydrogenated ones.

18
6 - Bibliography
(1) P. Duarte, M. Silva, D. Rodrigues, P. Morgado, L.F. Martins, E.J. Filipe, Liquid mixtures
involving hydrogenated and fluorinated chains: (p, rho, T, x) surface of (ethanol + 2,2,2-
trifluoroethanol), experimental and simulation, The journal of physical chemistry. B, 117
(2013) 9709-9717.
(2) J.C.S. Costa, M. Fulem, B. Schröder, J.A.P. Coutinho, M.J.S. Monte, L.M.N.B.F. Santos,
Evidence of an odd–even effect on the thermodynamic parameters of odd fluorotelomer
alcohols, The Journal of Chemical Thermodynamics, 54 (2012) 171-178.
(3) A.M.A. Dias, C.M.B. Gonçalves, A.I. Caço, L.M.N.B.F. Santos, M.M. Piñeiro, L.F. Vega,
J.A.P. Coutinho, I.M. Marrucho, Densities and Vapor Pressures of Highly Fluorinated
Compounds, Journal of Chemical & Engineering Data, 50 (2005) 1328-1333.
(4) A. Gil-Villegas, A. Galindo, P.J. Whitehead, G. Jackson, A.N. Burgess, Statistical
associating fluid theory for chain molecules with attractive potentials of variable range, Journal
of Chemical Physics, 106 (1997) 4168-4186.
(5) Y. Peng, K.D. Goff, M.C. dos Ramos, C. McCabe, Developing a predictive group-
contribution-based SAFT-VR equation of state, Fluid Phase Equilibria, 277 (2009) 131-144.
(6) C. McCabe, G. Jackson, SAFT-VR modelling of the phase equilibrium of long-chain n-
alkanes, Physical Chemistry Chemical Physics, 1 (1999) 2057-2064.
(7) Y. Peng, H. Zhao, C. McCabe, On the thermodynamics of diblock chain fluids from
simulation and heteronuclear statistical associating fluid theory for potentials of variable range,
Molecular Physics, 104 (2006) 571-586.
(8) P.J. Leonard, D. Henderson, J.A. Barker Perturbation theory and liquid mixtures,
Transactions of the Faraday Society, 66 (1970) 2439-2452.
(9) M.C. dos Ramos, J.D. Haley, J.R. Westwood, C. McCabe, Extending the GC-SAFT-VR
approach to associating functional groups: Alcohols, aldehydes, amines and carboxylic acids,
Fluid Phase Equilibria, 306 (2011) 97-111.
(10) A. Gil-Villegas, A. Galindo, P.J. Whitehead, S.J. Mills, G. Jackson, A.N. Burgess,
Statistical associating fluid theory for chain molecules with attractive potentials of variable
range, The Journal of Chemical Physics, 106 (1997) 4168-4186.
(11) M.C.d.R. Jessica D. Haley, and Clare McCabe, Predicting the Phase Behavior of
Fluorinated Organic Molecules Using the GC-SAFT-VR Equation of State, In Preparation,
(2015).
(12) W.L. Jorgensen, D.S. Maxwell, J. Tirado-Rives, Development and Testing of the OPLS
All-Atom Force Field on Conformational Energetics and Properties of Organic Liquids,
Journal of the American Chemical Society, 118 (1996) 11225-11236.

19
(13) E.K. Watkins, W.L. Jorgensen, Perfluoroalkanes: Conformational Analysis and Liquid-
State Properties from ab Initio and Monte Carlo Calculations, The Journal of Physical
Chemistry A, 105 (2001) 4118-4125.
(14) E.M. Duffy, Ph.D. Thesis, Yale University, (1994).
(15) A.A.H. Pádua, Torsion Energy Profiles and Force Fields Derived from Ab Initio
Calculations for Simulations of Hydrocarbon−Fluorocarbon Diblocks and
Perfluoroalkylbromides, The Journal of Physical Chemistry A, 106 (2002) 10116-10123.
(16) W. Smith, T.R. Forester, Todorov, I.T., The DL_POLY Classic User Manual Version 1.9,
Daresbury Laboratory, United Kingdom, (2012).
(17) M. Brehm, B. Kirchner, TRAVIS - A Free Analyzer and Visualizer for Monte Carlo and
Molecular Dynamics Trajectories, Journal of Chemical Information and Modeling, 51 (2011)
2007-2023.
(18) A.C. Meeks, I.J. Goldfarb, Vapor pressure of fluoroalcohols, Journal of Chemical &
Engineering Data, 12 (1967) 196-196.
(19) R.A. Cormanich, R. Rittner, M.P. Freitas, M. Buhl, The seeming lack of CFHO
intramolecular hydrogen bonds in linear aliphatic fluoroalcohols in solution, Physical
Chemistry Chemical Physics, 16 (2014) 19212-19217.
(20) Submitted to J. Phys. Chem. B.
(21) J.A. Padró, L. Saiz, E. Guàrdia, Hydrogen bonding in liquid alcohols: a computer
simulation study, Journal of Molecular Structure, 416 (1997) 243-248.
(22) M. Tomšič, A. Jamnik, G. Fritz-Popovski, O. Glatter, L. Vlček, Structural Properties of
Pure Simple Alcohols from Ethanol, Propanol, Butanol, Pentanol, to Hexanol: Comparing
Monte Carlo Simulations with Experimental SAXS Data, The Journal of Physical Chemistry
B, 111 (2007) 1738-1751.