thermodynamic aspects of selective complexation of heavy...
TRANSCRIPT
Thermodynamic aspects of selective complexation
of heavy metal ions of environmental interest: fundamentals and applications.
Elena Peralta Salvador
TESI DE DOCTORAT EN QUIMICA En cotutela con l’Università degli studi di Udine
Dirigida per: Prof. Marilena Tolazzi Prof. Manuel Valiente
Departament de Química Facultat de Ciències
2012
2
Memòria presentada per aspirar al grau
de Doctor en Química per Elena Peralta Salvador
Elena Peralta Salvador
Vist i plau
Prof. Marilena Tolazzi Prof. Manuel Valiente
Bellaterra, Març 2012
3
Acknowledgments I would like to thank the persons of the Thermodynamic Group of the University of Udine:
Prof. Marilena Tolazzi for her supervision and helping considerations during my PhD
studies, Dr. Andrea Melchior, Dr. Davide Menotti and Dr. Pierluigi Polese for their
assistance and friendly support during my time at Udine.
I would like to thank the persons from Grup de Tècniques de Separació en Química (Group
of Separation Techniques in Chemistry), GTS, of the Universitat Autònoma de Barcelona
(Autonomous University of Barcelona): Prof. Manuel Valiente for his guidance and support
during my time at GTS and all colleagues working at GTS during last three years for their
friendship and help.
I would also like to thank Prof. Claudio Tavagnacco, University of Trieste.
I also thank Friuli Venezia Giulia Region for financial support at the project “ECOMETA”
which was partially carried out during this thesis.

4
5
Table of contents
LIST OF ABBREVIATIONS ................................................................... 9
LIST OF FIGURES ................................................................................ 11
LIST OF TABLES .................................................................................. 13
ABSTRACT ............................................................................................ 15
RIASSUNTO ........................................................................................... 19
RESUMEN .............................................................................................. 23
1. INTRODUCTION ............................................................................ 27
1.1. METAL TOXICITY ............................................................................... 27 1.2. METHODS OF EXTRACTION FROM AQUEOUS SOLUTIONS ................... 29 1.3. SCOPE OF THE THESIS ......................................................................... 31
2. THERMODYNAMICS AND EXTRACTION OF HEAVY
METAL COMPLEXES WITH THIOETHERS ............................. 34
2.1. SOLUTION THERMODYNAMICS ....................................................................... 34 2.1.1. Introduction ........................................................................................... 34
2.1.1.1. Effect of the solvent ................................................................................. 35 2.1.1.2. Crown thioethers .................................................................................... 37
2.1.2. Experimental .......................................................................................... 39 2.1.2.1. Chemicals ............................................................................................... 39 2.1.2.2. Potentiometry ......................................................................................... 39
2.1.2.3. Calorimetriy ........................................................................................... 41
2.1.2.4. Polarography.......................................................................................... 44
2.1.2.5. Theoretical calculations .......................................................................... 49
2.1.3. Results and discussion............................................................................ 50 2.1.3.1. 1,4,7-trithiacyclononane (9AneS3)........................................................... 50
2.1.3.2. Origin of the selectivity of 9AneS3 ........................................................... 54
2.1.3.3. Diethyl sulfide (Et2S) .............................................................................. 58
6
2.1.3.4. 1,4,7,10-tetrathiacyclododecane (12AneS4) ............................................. 59
2.1.3.5. 1,4,8,11-tetrathiacyclotetradecane (14AneS4) .......................................... 61
2.1.3.6. Dimethylsulfoxide as solvent ................................................................... 63
2.2. STUDIES AND APPLICATIONS OF HG AND 9ANES3 COMPLEX FORMATION
USING LIQUID-LIQUID DISTRIBUTION PROCESSES .......................................... 66 2.2.1. Introduction ........................................................................................... 66
2.2.2. Experimental .......................................................................................... 68 2.2.2.1. Chemicals ............................................................................................... 68
2.2.2.2. Liquid-liquid extraction ........................................................................... 68
2.2.2.3. Analytical test to verify the formation and stability of aqueous Hg(II)-
9AneS3 complex ...................................................................................... 70
2.2.2.4. Adsorption on cellulose and polyurethane sponge .................................... 70
2.2.2.5. Analytical methods to determine metal concentration ............................... 71
2.2.2.5.1. Determination with EDTA. Back titration .......................................... 71 2.2.2.5.2. Inductively coupled plasma mass spectrometry (ICP-MS) ................... 72
2.2.2.5.3. Field Portable X-ray Fluorescence (FP-XRF) .................................... 74
2.2.3. Results and discussion............................................................................ 76 2.2.3.1. Liquid-liquid extraction ........................................................................... 76
2.2.3.1.1. Effect of the Solvent selected.............................................................. 77
2.2.3.1.2. Effect of pH....................................................................................... 78
2.2.3.1.3. Effect of Temperature ........................................................................ 79
2.2.3.1.4. Effect of concentration of Hg and 9AneS3 .......................................... 79
2.2.3.2. Determination of complex formation constants in aqueous solution from
two phases experimental data .................................................................. 81
2.2.3.3. Application of the Hg(II)-9AneS3 complexes to the determination of small
amounts of Hg(II). Use of selective adsorption on cellulose and
polyethylene sponge ................................................................................ 82
3. CONSTANTS OF FORMATION OF LANTHANIDE WITH
BTPA IN AN..................................................................................... 84
3.1. INTRODUCTION .............................................................................................. 84 3.2. EXPERIMENTAL .............................................................................................. 87
3.2.1. Chemicals .............................................................................................. 87

7
3.2.2. Absorption spectrophotometry ................................................................ 87
3.3. RESULTS AND DISCUSSION .............................................................................. 89
4. CONCLUSIONS .............................................................................. 93
BIBLIOGRAPHY ................................................................................... 96

8

9
List of abbreviations
Wavelength
∆E Potential variation
∆G0 Standard Gibbs free energy
∆H0 Standard Enthalpy
∆Hsv Enthalpy of solvation
∆Htr Enthalpy of transfer
∆S0 Standard Entropy
12AneS4 1,4,7,10-tetrathiacyclododecane
14AneS4 1,4,8,11-tetrathiacyclotetradecane
9AneS3 1,4,7-trithacyclononane
AN Acetonitrile
An(III) or An3+ Trivanlent actanides
BTPA 6,6’-bis[bis(2-pyridylmethyl)aminimethyl]-2,2’-bipyridine
CAg Concentration of silver
CE Counter electrode
CL Concentration of ligand
CM Concentration of metal
CS Cellulose sponge
D Distribution coefficient
Dexp, Dcalc Experimental and calculated distribution coefficient, respectively
DFT Density functional theory
DL, DC Diffusion coefficients of the free ligand and complex, respectively
DMF N, N-dimethylformamide
DMSO Dimethyl sulfoxide
Dox, Dred Diffusion coefficients for Ox and Red, respectively
E Cell potential
E(%) Metal extraction
E0 Standard redox potential
10
E1/2 Half-wave potential
EDTA Ethylenediaminetetraacetic acid
ELM Emulsion liquid membrane
Et2S Dietyl sulfide
FM Formation coefficient for metal
FP-XRF Field Portable X-ray Fluorescence
HFSLM Hollow fiber liquid membrane
HSAB Hard soft acid base theory
i Electric current
ICP-MS Inductively coupled plasma mass spectrometry
iL or id Limiting diffusion current
K or β Formation constant or stability constant
L Ligand
LL Liquid-liquid extraction
Ln(III) or Ln3+ Trivanlent lanthanides
M Metal ion
NMR Nuclear magnetic resonance spectroscopy
PS Polyurethane sponge
r-1 Inverse of the ionic radius
RE Reference electrode
SCE Saturated calomel electrode
SLM Solid liquid membrane
TEAP Tetraethylammonium perchlorate (NEt4ClO4)
THAM Tris(hydroxymethyl)aminomethane
TPA Tris[(2-pyridyl)methyl]amine
UV-VIS Ultraviolet–visible spectroscopy
WE Working electrode
ε Dielectric constant
ε Molar absorption coefficient

11
List of figures
Figure 1 Linear and macrocyclic thioethers ...................................................................... 38
Figure 2 Potentiometric titration instrument (left).Scheme of the reaction cell (right) ........ 40
Figure 3 Tronac model 87-558 precision calorimeter. ....................................................... 42
Figure 4 Design of titration isoperibol solution calorimeter reaction vessel. ...................... 43
Figure 5 Assembly of the cell ......................................................................................... 45
Figure 6 Polarographic wave .......................................................................................... 46
Figure 7 Competitive potentiometric titration for 9AneS3 (2.63·10-2 M). Concentration
of metals are Ag(I) = 2.92·10-3 M (without the presence of competing metal),
Ag(I) = 1.5·10-3 M (with the presence of competing metal) and Zn(II) and
Cd(II) = 8·10-3 M in AN. ................................................................................. 50
Figure 8 Polarographic waves in absence of ligand (background) (left) and in presence
of 9AneS3 (1.2·10-3 M) (right) in AN............................................................... 51
Figure 9 Plot of log ([L]/2) vs. E1/2 for 9AneS3 with the best fit interpolation line in AN. . 52
Figure 10 Calorimetric titration for 9AneS3 (2.63·10-2 M) with all metal (3·10- 3 M) in
AN.................................................................................................................. 53
Figure 11 Representation of the calculated enthalpy by the coordination of 9AneS3. ........ 55
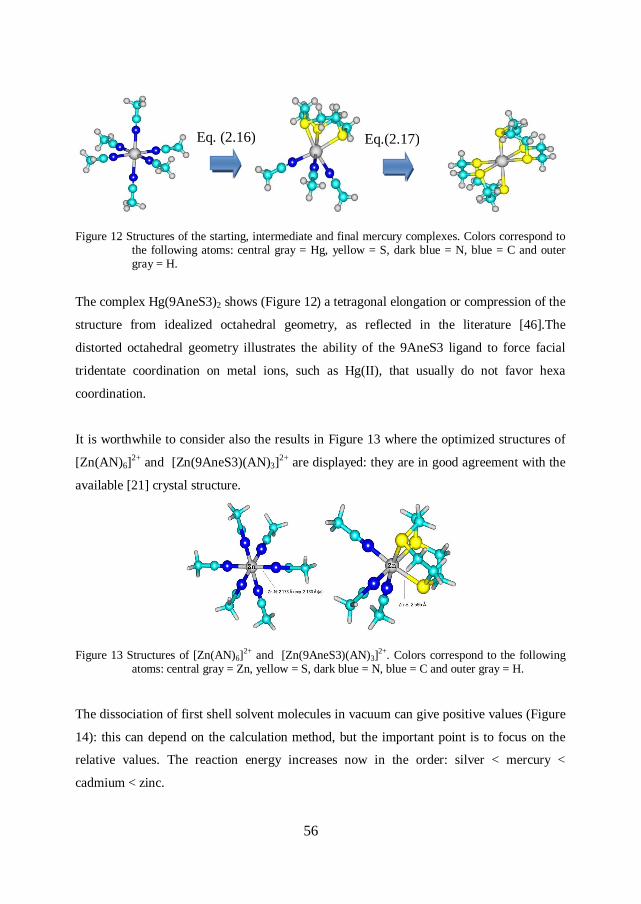
Figure 12 Structures of the starting, intermediate and final mercury complexes. Colors
correspond to the following atoms: central gray = Hg, yellow = S, dark blue
= N, blue = C and outer gray = H. .................................................................... 56
Figure 13 Structures of [Zn(AN)6]2+ and [Zn(9AneS3)(AN)3]2+. Colors correspond to
the following atoms: central gray = Zn, yellow = S, dark blue = N, blue = C
and outer gray = H. ......................................................................................... 56
Figure 14 Energies of reactions 2.16 and 2.17 in vacuum including dissociation of first
shell solvent molecules .................................................................................... 57
Figure 15 Energies of reactions 2.16 and 2.17 with the “bulk” solvent effect modeled as
polarizable continuum. .................................................................................... 57
Figure 16 Calorimetric titration for Et2S (6·10-2 M) with Ag(I) and Hg(II) (5·10-3 M) in
AN.................................................................................................................. 59
12
Figure 17 Competitive potentiometric titration for 12AneS4 (1.25·10-3 M).
Concentration of metals are Ag(I) = 2.52·10-3 M (without the presence of
competing metal), Ag(I) = 1·10-3 M (with the presence of competing metal)
and Zn(II) and Cd(II) = 4·10-4 M in AN. .......................................................... 60
Figure 18 Calorimetric titration for Hg(II) and Ag(I) (2·10-3 M) with 14AneS4
(1.68·10-2 M) in AN......................................................................................... 62
Figure 19 Calorimetric titration for Ag(I) (5·10-3 M) and Hg(II) (5·10-3 M) with the
ligands reported (6·10-2 M) in DMSO. ............................................................. 64
Figure 20 Representation of the calculated enthalpy by combined coordination/solvation
energetic for 9AneS3 in DMSO. ...................................................................... 65
Figure 21 Idealized scheme of operation of liquid-liquid extraction .................................. 68
Figure 22 Scheme the process of Liquid-Liquid Extraction. FO: organic phase. FA:
aqueous phase. ................................................................................................ 69
Figure 23 X-ray fluorescence (FP-XRF), Alpha model 6500 ......................................... 75
Figure 24 Effect of pH in the % formation. ...................................................................... 78
Figure 25 Plot of the % formation of mercury vs. the ratio CL/CM ..................................... 80
Figure 26 N-donor heteroaromatic ligands potentially interesting for Ln(III)
extraction and/or as sensitizers for luminescence applications. .................... 86
Figure 27 Molar absorption coefficient spectrum of BTPA and NdBTPA3+. ................ 90
Figure 28 Example of titration of BTPA solution [3.5·10-5 M] with Nd(III) triflate
solution [1.6·10-4 M] in AN. .......................................................................... 90
Figure 29 Pot of logb vs. r-1 of titration BTPA solution [3.5·10-5 M] with of Nd(III)
triflate solution [1.6·10-4 M] in AN. .............................................................. 91

13
List of tables
Table 1 The thermodynamic data for 9AneS3 in AN. ....................................................... 54
Table 2 The thermodynamic data for Et2S in AN.............................................................. 58
Table 3 The thermodynamic data for 12AneS4 in AN. ..................................................... 60
Table 4 The thermodynamic data for 14AneS4 in AN. ..................................................... 62
Table 5 The thermodynamic data for Ag(I) with the ligands reported in DMSO. ............... 63
Table 6 The thermodynamic data for Hg(II) with the ligands reported in DMSO. ............. 64
Table 7 Instrumental operating conditions. ICP-MS ThermoElemental Pq ExCell. ...... 73
Table 8 Summary of masses employed and polyatomic and isobaric interferences
observed. ........................................................................................................ 74
Table 9 Formation percentage for Hg (1.5 mM and 3 mM) in hexane and dodecane. ........ 77
Table 10 Stability constant of the Hg-9AneS3 complex in water and DMSO. ................... 82
Table 11 Hg values (ppm) obtained with FP-XRF and the pre-concentration degree in
two types of sponges: CS (Cellulose), PS (Polyurethane). “Background”
sponges were not impregnated with 9AneS3. ................................................... 83
Table 12 Logβ and standard deviations values for the LnBTPA3+ complex in AN ............. 92

14

15
Abstract
Metal ion and lanthanide recognition is of fundamental importance to many areas of
chemistry and biochemistry but the factors underlying the stability and selectivity of a
given ligand/receptor are often not of straightforward interpretation. Recognition process
may depend on a series of factors that include the nature of the donor atoms and their
spatial arrangement, the backbone structure of the ligand and its rigidity, the eventual
formation of chelate rings of variable size.
Thermodynamics and extraction of heavy metal complexes with thioethers
Metal - sulphur bond is a fundamental interaction in biochemical systems and in selective
separation applications for the heavy and precious metals extraction from liquid phase. For
example, numerous macrocyclic structures containing sulphur donor atoms (thiols,
thioethers, thioureas…) have been employed as selective extractants in a range of solvent
extraction and bulk membrane transport studies.
In this section, we present the first thermodynamic investigation concerning the complex
formation by several linear and macrocyclic thioethers and the Zn(II), Cd(II), and Hg(II)
ions in organic solvents, such as acetonitrile (AN) and dimethyl sulfoxide (DMSO). Our
main aim is to test their potential as efficient complexing agents and selective extractants
for environmentally important metal ions and rationalize the recognition process in media
which present relatively low dielectric constants and are less structured than water.
Solution thermodynamics
The stability constants are evaluated by potentiometry using Ag(I) as competitive ion. In
the case of mercury, calorimetric titrations evidence that stability constants are extremely
high, and for this reason, they have been determined by means of polarography. Titration
calorimetry has been used to determine the reaction enthalpy (H°) and to calculate the
entropic term (TS°) allowing the definition of the picture of the complexation

16
thermodynamics. The results show a higher selectivity for Hg, with respect to other metals,
of all the ligands studied in A, whereas this selectivity is lowered in DMSO.
Experimental and theoretical gas phase studies are often useful to interpret at molecular
level the thermodynamics of complex formation. In this framework, solution results are
compared with gas-phase DFT study on the interaction of 9AneS3 (see pag. 38, Figure 1).
Metal solvation has been studied by considering the dissociation of acetonitrile molecules
upon ligand coordination. We also checked the effect of introducing continuum solvent
model to include the polarization due to the bulk solvent. Results indicate how the observed
ligand affinity is a balance of binding and solvent dissociation process.
Application in process for the extraction of Hg with 9AneS
The complex formation between the thioether derivative macrocycle 9AneS3 and Hg(II)
has been studied by Liquid-liquid distribution technique.
The experiments have been carried out by contacting hexane solutions of 9AneS3 and
aqueous Hg(NO3)2. The results showed the distribution of 9aneS3 between the organic and
aqueous phase. Therefore, aqueous insoluble 9AneS3 becomes soluble in presence of
aqueous Hg(II) because of corresponding aqueous soluble Hg(II)-9AneS3 complex
formation. The analysis of data with LETAGROP-DISTR program has shown the
formation of 1:2 and in less extent 1:3 Hg(II):9AneS3 aqueous complexes.
On the other hand, a pre-concentration system including a 9AneS3 impregnated cellulose
and polyurethane sponge uses field portable XRF technique which allows the determination
of mercury concentration. The results show that the treated cellulose sponge can provide
more than one order of magnitude (40 to 50 fold) on Hg concentration with respect to the
untreated sponge.

17
Ln(III) complex formation with an heterocyclic N-donor ligand
One of the approaches to obtaining highly emissive complexes is to employ flexible
macrocyclic ligands capable of forming a suitable cavity for lanthanide ions and effectively
eliminating solvent molecules from the first coordination sphere. This is important in the
field of luminescence, which is extensively studied for the lanthanides. For this reason,
formation constants for a series of lanthanide and the flexible BTPA (N-donor) (see pag.
86, Figure 26) as complexing agent were determined in AN.

18
19
Riassunto
Il riconoscimento di ioni metallici e lantanidi è di fondamentale importanza in molti settori
della chimica e della biochimica, tuttavia i fattori alla base della stabilità e selettività di un
legante o recettore specifico sono spesso di non semplice interpretazione. Il processo di
riconoscimento può dipendere da vari fattori quali la natura degli atomi donatori e la loro
disposizione spaziale, la struttura principale e la rigidità del legante e l'eventuale
formazione di chelati con anelli di diverse dimensioni.
Termodinamica ed estrazione di complessi di metalli pesanti con tioeteri
Il legame metal - zolfo è una interazione fondamentale nei sistemi biochimici e di
separazione selettiva nelle applicazioni per l'estrazione di metalli pesanti e metalli preziosi
dalla fase liquida. Ad esempio, numerose strutture macrocicliche contenenti atomi donatori
di zolfo (tioli, tioeteri, tiouree, ecc) sono stati usati come estraenti selettivi in una ampia
gamma di estrazione con solvente e studi di trasporto attraverso di membrane.
Questa sezione presenta uno studio innovativo sulla termodinamica di formazione del
complesso per diverse tioeteri lineari e macrociclico con Zn(II), Cd(II), Hg(II) in solventi
organici quali acetonitrile (AN) e dimetilsolfossido (DMSO). Il nostro obiettivo principale
è quello di testare il loro potenziale come efficaci agenti complessanti e estraenti selettivi di
ioni metallici di rilevanza ambientale e ottimizzare il processo di riconoscimento in un
mezzo che ha una costante dielettrica relativamente bassa e che è meno strutturato rispetto
all'acqua.
Termodinamica in soluzione
I valori delle costanti di stabilità sono ottenuti per potenziometria utilizzando Ag(I) come
ione competitivo. Nel caso di mercurio, le titolazioni calorimetrica mostrano che le costanti
di stabilità sono molto elevate, e quindi, sono stati determinati con la polarografia. La
titolazione calorimetrica è stata usata per determinare l'entalpia di reazione (H°), che
20
permette di calcolare il termine entropico (TSo), termini che definiscono la termodinamica
della formazione di complessi. I risultati mostrano una maggiore selettività per il Hg,
rispetto ad altri metalli, di tutti i leganti studiati in AN, mentre che tale selettività si abbassa
in DMSO.
Gli studi teorici in fase gas sono spesso utili per interpretare a livello molecolare la
termodinamica di formazione di complessi. In questo contesto, i risultati in soluzione sono
confrontati con l’studio in fase gas (DFT) dell'interazione di 9AneS3 (si veda p. 38, Figura
1). La solvatazione del metallo è stata studiata considerando la dissociazione delle molecole
di acetonitrile inseguito al coordinamento del ligante. Inoltre è stato introdotto il modello
solvente continuo per includere la polarizzazione dovuta alla massa del solvente. I risultati
indicano come l'affinità del legante osservata sia il risultato di un equilibrio tra il processo
di formazione del legame di coordinazione e quello di dissociazione del solvente.
Applicazione del processi di estrazione del mercurio con 9AneS3
La formazione di complessi tra il macrociclo tioetere (9AneS3) e il Hg(II) è stato studiato
utilizzando la distribuzione del liquido-liquido.
Gli esperimenti sono stati condotti contattando una soluzione di esano contenente 9AneS3 e
una soluzione acquosa contenente Hg(NO3)2. I risultati hanno mostrato la distribuzione del
9AneS3 tra le fasi acquosa e organica. Pertanto, una soluzione di 9AneS3 insolubile diventa
solubile in presenza di una soluzione acquosa di Hg(II), in quanto corrisponde alla
formazione di complessi Hg(II)-9AneS3, solubile in acqua. L'analisi dei dati con il
programma LETAGROP-DISTR hanno dimostrato la formazione di complessi acquosi 1:2
e in minor misura, 1:3 di Hg(II):9AneS3.
Inoltre, è stato sviluppato un sistema di pre-concentrazione di metalli utilizzando una
spugna di cellulosa o poliuretano impregnata con 9AneS3 e successivamente è stata
utilizzata la tecnica di “field portable XRF” (FP-XRF), la quale permette la determinazione
della concentrazione di mercurio. I risultati mostrano che la spugna cellulosa trattata può

21
aumentare di più di un ordine di grandezza (da 40 a 50 volte) la concentrazione Hg rispetto
alla spugna non trattata.
Formazione di complessi di Ln (III) con un legante eterociclo N-donatore
Un approccio per ottenere complessi che emittono altamente nel UV-visble è impiegare
leganti macrociclici flessibili in grado di formare una cavità adatta ed efficace per ioni
lantanidi eliminando molecole di solvente dalla prima sfera di coordinazione. Questo è
importante nel campo della luminescenza, che è ampiamente applicato nello studio dei
lantanidi. A questo scopo è quindi di interesse studiare la stabilità in AN di una serie di
lantanidi con un legante donatore all’ozoto, (si veda p. 86, Figura 26) come agente
complessante.

22
23
Resumen
El reconocimiento de iones metálicos y de lantánidos es de fundamental importancia en
muchas áreas de química y bioquímica, pero los factores en base a la estabilidad y la
selectividad de un determinado ligando a menudo son de difícil interpretación. Los proceso
de reconocimiento puede depender de una serie de factores que incluyen la naturaleza de
los átomos donadores y su disposición espacial, la estructura principal y rigidez del ligando
y la eventual formación de quelatos con anillos de tamaño variable.
Termodinámica y extracción de complejos de metales pesados con tioéteres
El enlace metal - azufre es una interacción fundamental en los sistemas bioquímicos y en
aplicaciones de separación selectiva para la extracción de metales pesados y metales
preciosos de la fase líquida. Por ejemplo, numerosas estructuras macrocíclicas que
contienen átomos donadores de azufre (tioles, tioéteres, tioureas, etc) han sido empleados
como extractantes selectivos en una amplia gama de extracción por solventes y estudios de
transporte a través de membranas.
En esta sección, se presenta un estudio innovador sobre la termodinámica de la formación
de complejos por varios tioéteres lineales y macrocíclicos con Zn(II), Cd(II) y Hg(II) en
disolventes orgánicos, tales como acetonitrilo (AN) y dimetil sulfóxido (DMSO). Nuestro
principal objetivo es poner a prueba su potencial como agentes complejantes y eficientes
extractantes selectivos de iones metálicos de importancia ambiental y optimizar el proceso
de reconocimiento en un medio que tiene una constante dieléctrica relativamente baja y
menos estructurado que el agua.
Termodinámica en solución
Los valores de las constantes de estabilidad son obtenidos mediante potenciometría
utilizando Ag(I) como ion competitivo. En el caso del mercurio, las valoraciones
calorimétricas muestran que las constantes de estabilidad son muy altas, y por esta razón, se

24
han determinado con la polarografía. La valoración calorimétrica ha sido utilizado para
determinar la entalpía de reacción (H°), la cual permite calcular el término entrópico
(TSo), términos que definen de la termodinámica de formación de complejos. Los
resultados muestran una mayor selectividad para el Hg, respecto a otros metales, de todos
los ligandos estudiados en la AN, mientras que esta selectividad se reduce en DMSO.
Los estudios teóricos en fase gas son a menudo útiles para interpretar a nivel molecular la
termodinámica de la formación de complejos. En este marco, los resultados en solución se
comparan con el estudio en fase gaseosa (DFT) de la interacción de 9AneS3 (ver pág. 38,
Figura 1). La solvatación del metal ha sido estudiado teniendo en cuenta la disociación de
las moléculas de acetonitrilo y la coordinación del ligando. También ha sido introducido el
modelo disolvente continuo para incluir la polarización debido a la masa del disolvente.
Los resultados indican cómo la afinidad del ligando observada sea el resultado entre el
proceso de formación del enlace de coordinación y el proceso de disociación del solvente.
Aplicación de procesos para la extracción de mercurio con 9AneS3
La formación de complejos entre el tioéter macrocíclico (9AneS3) y el Hg(II) ha sido
estudiada mediante la técnica de distribución líquido-líquido.
Los experimentos se han llevado a cabo poniendo en contacto una soluciones de hexano
conteniendo 9AneS3 y una solución acuosa conteniendo Hg(NO3)2. Los resultados
mostraron la distribución de 9AneS3 entre las fases acuosa y orgánica. Por lo tanto, una
solución insoluble de 9AneS3 se vuelve soluble en presencia de una solución acuosa de
Hg(II) correspondiendo a la formación de complejos Hg(II)-9AneS3, solubles en agua. El
análisis de los datos con el programa LETAGROP-DISTR han demostrado la formación de
complejos acuosos 1:2 y en menor medida, 1:3 de Hg (II):9AneS3.
Por otro lado, ha sido desarrollado un sistema de pre-concentración de metales utilizando
una esponja de celulosa o poliuretano impregnada con 9AneS3 y sucesivamente ha sido
utilizada la técnica de “field portable XRF” (FP-XRF), la cual permite la determinación de
25
la concentración de mercurio. Los resultados muestran que la esponja de celulosa tratada
puede aumentar en más de un orden de magnitud (de 40 a 50 veces) la concentración de Hg
en relación con la esponja no tratada.
Formación de complejos de Ln (III) con un ligando heterocíclico N-donador
Uno de los enfoques para la obtención de complejos que emiten altamente en el UV-visible
es emplear ligandos macrocíclicos flexibles capaces de formar una cavidad adecuada y
eficaz para los iones lantánidos eliminando las moléculas del disolvente de la primera
esfera de coordinación. Esto es importante en el campo de la luminiscencia, que está
ampliamente estudiada para los lantánidos. Por esta razón, se determinaron en AN las
constantes de formación para una serie de los lantánidos y la BTPA (N-donador) (ver pag.
86, Figura 26) como agente complejante.

26

27
1. Introduction
1.1. Metal toxicity
The toxicity of heavy metals released by a series of productive activities is widely
recognized, and therefore the removal from wastewater or the recovery of
materials/contaminated water are issues of great importance. The study of the formation of
heavy metal complexes for the recognition and separation is a topical issue which is
reflected in numerous publications in international journals on fundamental and applied
aspects.
Cadmium, copper, lead, mercury, nickel are considered the most hazardous heavy metals
and have been used for centuries in a great number of industrial applications. Sources of
these metals include mining, agriculture, fossil fuels, metallurgical, chemical and electronic
industries, the manufacture and disposal of batteries, paints/pigments, polymers and
printing materials [1]. Their release into the environment is a problem of great importance
for their adverse effects on the living systems, thus the limitation emission in the
environment and the recovery of contaminated areas are particularly important issues today
[2, 3].
Hg [4-6] and Cd [7-9] show a strong affinity for ligands such as phosphates, cysteinyl and
histidyl side chains of proteins, purines, pteridines, and porphyrins. Hence, these elements
can interact with a large number of biochemical sites: all inhibit a large number of enzymes
having functional sulfhydryl groups and affect the conformation of nucleic acids.
Furthermore these metals are able to disrupt the pathways of oxidative phosphorylation,
although in each instance the precise response depends upon the individual properties of the
metal.
Hg(II) and organic mercurials interact with -SH and S-S groups of proteins in a multitude
of systems, and the consequences for structure and function of proteins have been reviewed

28
thoroughly. Therefore, the biochemical basis of toxicological effects of Hg and its
derivatives are generally sought through mercury-sulfur interactions [4, 5].
On the other hand, the stability constants of the Zn complexes are greater than those of Cd
when nitrogen and oxygen-containing groups serve as ligands, but Cd binds more firmly to
free sulfur groups. Thus Cd(II) and Zn(II) ions can compete for uptake into various cells
and binding to intracellular sites and Cd can displace Zn in a number of biological
processes [9]. For example, zinc and cadmium metabolism are related to competitive
binding to metallothionein, a low-molecular-weight protein that is involved in the transport
and storage of these essential metals (Zn, Cu) [10].
However, from another point of view, the metal ion binding in response to the excessive
uptake of metal ions (such as Pb, Cd, and Hg) is a way used by living organisms to protect
themselves. For example, the sequestration of these ions by both phytochelatins in plants
[11] (they are able to synthesize enzymatically these peptides, which have a high cysteine
content) and metallothioneins can play a role in the detoxification of these non-essential
metals, prevalently through the coordination of the sulfur atom in the cysteine side-chain
[12].
Also Ag(I) has come to prominence for environmental concerns. It is being widely used in
metallurgy (alloys) and medicine [13, 14]. Silver nanoparticles are widely used in
antibacterial/antifungal agents in biotechnology and bioengineering, textile engineering,
water treatment and catalysis [15, 16]. This widespread use of Silver has recently produced
some concern about its dispersion in the environment. In fact, recent studies about
interactions of silver with essential nutrients, such as Se, Cu, vitamin E and B12, has
focused attention also on its potential toxicity [17, 18].
Therefore, the adverse effects of these metal ions for the living organisms have been the
motivation for a wide number of experimental [19] and theoretical studies [20-22].
29
In the last decades, also the increased public exposure to the family of lanthanide metals
opens as well the problem of their removal. The biologic importance of the lanthanide ions
is because of their similarity to Ca2+ ions. All lanthanides show a marked bioinorganic
similarity to Ca2+ ion, with near equivalence of ionic radii, but with a higher charge density
[23, 24]. The lanthanides, display Lewis acid properties which make them useful in the
hydrolytic cleavage of phosphor-diester bonds of DNA which, otherwise, is extremely
resistant to hydrolysis; cleavage of DNA is an essential step in developing gene therapy
[25].
Lanthanides are also used in many applications as electroluminescent devices [26], in lasers
[26], catalysis [27] and medicine [23] and their solution chemistry is relevant for the
nuclear waste reprocessing since they are an important fraction of nuclear waste which
should be separated from actinides in the treatment. The Ln3+ ions show very similar
chemical properties to the actinides (III) (An3+). For this reason, in the design of nitrogen
polydentate ligands, L, for application in the field of liquid–liquid extraction and separation
of trivalent actinides An(III) from trivalent lanthanides Ln(III) for nuclear waste
management, one important goal is to study the mechanism of complexation leading to LnL
and AnL complex formation and the thermodynamic properties of these complexes in
solution [25].
1.2. Methods of extraction from aqueous solutions
For decades the chemical research studied systems for the recognition of heavy metals in
order to develop methodologies for selective identification and separation. For example, the
design of high-performance adsorbents for environmental clean-up of Hg(II) is highly
required, since the acute toxicity for inorganic mercury is very low (from 5 in crustaceous
to 800 g/L in fish) [28], its bioaccumulation in living organisms is high and that its
elimination from organisms is difficult.
The basis of these processes is to mobilize the metal in an aqueous phase and concentrate it
in a readily treatable phase for the recovery. These two-phase systems are of diverse nature:
30
the most common involves the transport of metal through a liquid phase (organic)
immiscible with water, or through a solid phase [29]. The liquid-liquid technique (LL) [30]
involves an immiscible mixture of water and an organic solvent where the metal ion is
dissolved in the aqueous layer and the extractant in the organic layer. Another technique
refers to the use of liquid membranes that consists on an organic immiscible solvent (the
liquid membrane) separating two aqueous phases (the source and receiving phases). For
example, the bulk liquid membranes [31], where the organic phase is in direct contact with
two aqueous phases in the same container; and emulsion liquid membrane (ELM) [32]
where a water-in-oil-in-water system is produced by the use of appropriate emulsifier
produces very thin globular membranes of a large surface area per unit source phase
volume, which enhances the transport rate of this membrane. Liquid membranes can be
found in the micro-porous of polymeric membranes (SLM) [33, 34], where a porous
polymeric membrane, impregnated with the organic liquid and carrier, is set in between the
corresponding source and receiving aqueous phases. When the polymeric membrane takes
the format of a hollow fiber then, the system enhances the surface contact and provides a
faster way to separate and concentrate the target elements (HFSLM) [35, 36].
In addition, to obtain favorable results in the mentioned solvent extraction processes it is
essential to identifying a compound that has the ability to coordinate one metal selectively
and to facilitate transport though the extractant phase. The thermodynamic stability of the
metal ion complexes in a given medium is a measure of this selectivity, depending mainly
on the geometry and flexibility of the ligand and nature of the donor groups. Therefore, the
affinity of a ligand towards a particular metal ion can be determined experimentally from
thermodynamic formation constants of the related ligand-metal complex.
In general, such features (acid base properties, structural, constraints, complementarity
between the metal ion and the ring cavity) should be evaluated to predict preferential
recognition. As mentioned, the affinity of a ligand for a metal ion is determined by the
thermodynamic stability constants of formation of ligand-metal complex. The formation
constants of a ligand selective for a specific metal use to be orders of magnitude higher than
31
those competitors. In this way, although the presence of concentrations of competitors can
be much higher, a selective ligand will bind and transport only the target ion.
The choice of a ligand selective for a given ion is based essentially on Pearson’s hard soft
acid base theory (HSAB) [37]. Hard acids and hard bases tend to have the following
characteristics: small atomic/ionic radius; high oxidation state; low polarizability; high
electronegativity. Soft acids and soft bases tend to have: large atomic/ionic radius; low
oxidation state; high polarizability; low electronegativity. Subsequently, the theory has
been presented by Pearson and Parr in a more quantitative way (based on Density
Functional Theory) [38]. DFT provides an excellent framework, yielding structural
information and a number of chemical reactivity indices about ligands and their metal
complexes, and gives results of quality comparable to those obtainable by correlated ab
initio calculations [39].
On the basis of this theory, ions classified as hard (e.g. lanthanides(III), actinides, Al(III),
Fe(III), alkali metal ions) give strong complexes with hard ligands like O-donors
(carboxylates, carbonyls..) and N-donors (amines). Soft metals (Hg(II), Pt(II), Pb(II), Ag(I),
…) form strong complexes with soft ligands like S donors (e.g. tiols, tioethers). Therefore,
the design of a selective chelating ligand based on this classification is of capital
importance. Structural features of the chelator also contribute to the stability of the complex
and the selectivity for a given metal: the chelation type (size of the ring), the match between
the size of the metal ion and the cavity (for macrocyclic ligands), the steric impediments of
the complex formed.
1.3. Scope of the thesis
From the introduction section it clearly emerges that thermodynamics of metal-ligand
formation is a key factor for the interaction with both biological and synthetic ligands. This
fact reveals the detailed description of the metal ligand interaction to be fundamental both
to understand the biological effects of these metal ions and to develop efficient methods for
metal separation.
32
Taking into account the background described, the first objective of the present thesis is to
carry out a thermodynamic study of the interaction of a series of sulfur-containing ligands
(linear and cyclic thioethers) (see Figure 1) with heavy metals (Ag, Cd, Hg) which can be
interesting both for a deeper understanding of the interactions with bio-ligands and for the
development of extraction processes from solutions. This will proceed through the
assessment of the thermodynamic parameters of formation of the complexes between a
series of thioethers and the heavy metals in organic solvents using experimental techniques
such as thermodynamic, electrochemical and theoretical methods.
In this context, some data exist on structures or NMR characterization of heavy metal
compounds with sulfur containing ligands [40, 41], less numerous are those regarding their
stability. The work has been extended also to the study of complexation of the essential
Zn2+ ion, in order to compare the coordination properties of soft and hard d10 metal ions
toward the sulphur donors.
Taking advantage of the obtained knowledge, tests of the two-phase separation systems
have been carried out using various configurations already described (ligand, phase
extractant and support).
Specific objectives:
Thermodynamic characterization of chemical affinity of a series of linear and
cyclic thioethers in non aqueous solvents (acetonitrile and dimethyl sulfoxide)
using calorimetric and potentiometric techniques and correlation with the structure
and solvation of the heavy metals.
Determination of thermodynamic parameters and redox properties of mercury
complexes using electrochemical techniques.
Determination of metal complexes formation by using two phase equilibrium
systems.

33
Development of analytical applications of the studied metal complexes by using
appropriate supports to facilitate selective metal adsorption, i.e., cellulose and
polyurethane impregnated sponges for selective separation and pre-concentration
of mercury.
The second objective of this thesis, is the study of the complex formation of lanthanides
with N-donor chelants (TPA and BTPA) (see pag. 86, Figure 26) and the determination of
the stability constant values and their variation along the series. This is motivated by the
fact that heteroaromatic N-donor ligands have been previously proposed as extractants (see
pag. 86, Figure 26, BTP derivatives, terpy) in nuclear waste reprocessing and also for the
potentially interesting luminescence properties of Ln3+ complexes with this ligand in
solution. Despite these potential interesting applications there is a limited number of
thermodynamic studies of complex formation of lanthanides with heteroaromatic N-donor
ligands.

34
2. Thermodynamics and extraction of heavy metal complexes with
thioethers
2.1. Solution thermodynamics
2.1.1. Introduction
Cations can exert strong attractive action towards negatively charged or polar groups of
ligands. This leads to the formation of a covalent bond between the ligand and the metal
ion.
In the coordinate covalent bond formed in the complex, the metal ion is the acceptor of
electron pairs, while the ligand acts donating electron pairs to establish the bond.
mMa+ (acceptor) + nLb- (donor) [MmLn](a-b) (complex) (2.1)
In eq. (2.1) if b = 0 the ligand is neutral. If in eq. (2.1) m = 1 the complex is called
mononuclear. Therefore, the formation of complex can be explained by the acid-base
theory of Lewis. Thus, the central ion is an acceptor of electron pair or Lewis acid and each
ligand a donor of electrons pairs or Lewis base.
The stability of a complex is quantitatively defined from the formation constant (K) for
reaction (2.1). This constant is expressed by the equation (2.2) (charges omitted):
[ ][ ] [ ]
m nm n
M LKM L
(2.2)
More complete information for the thermodynamic characterization of a complex can be
obtained from the thermodynamic parameters associated with the formation constant, that

35
is, the change of standard Gibbs free energy (G°), enthalpy (H°) and entropy (S°) for
the reaction considered.
The formation constant for any reaction is related to the corresponding free-erengy changer
by the expression (2.3):
Go = - RT lnK = Ho - TSo (2.3)
Where R is the gas constant (R = 8.31 J·mol-1·K-1) and T is temperature in Kelvin.
The corresponding change of entropy (S°) is obtained (eq. 2.3) by the G° and the
enthalpy change of complex formation, which is best measured calorimetrically.
Analysis of K into their component heat and entropy terms is essential to the ful
understanding of the many factors (such as the size, shape, and electronic structure of
central group and the ligand, the temperature, and the composition of the solvent)
which influence the stability of a complex [42, 43].
2.1.1.1. Effect of the solvent
An important property of a solvent is its dielectric constant that can be considered as a
measure of neutralization when ions interact with a solute or opposed ionic substances. The
smaller the dielectric constant, the greater the attractive forces between the opposite solute
ions, and consequently, in solvents with low dielectric constant (less than 15) the
interactions between ions have a wider space and they are mostly associated. The
concentration of ions in solution is negligible compared to the other molecules in solution.
In solvents of high dielectric constant (), ionic bonds are broken completely and the ion
pairs are fully dissociated. This happens in water ( = 78.36) and, in general, in solvents
with > 40 [44] .
The reaction medium is an important factor determining the nature and stability of the
species formed due to the contribution of the solvation/desolvation processes to the

36
thermodynamic parameters. In solution, we can consider this as a competitive reaction
between solvation desolvation of the metal ion and of the ligand and the formation of the
complex. In fact, under the hypothesis of complete dissociation of the metal salt in a given
solvent, the reaction (2.1) involves the solvated metal cation as reagent and can be
rewritten:
m[MSi]a+ + nLb- [M(Sj)Ln](a-b) +(i-j) S (2.4)
(S = solvent molecule)
It is straightforward to understand that the strength of the metal-solvent bond is accounted
in the energetic balance which determines the values of the thermodynamic parameters of
reaction. A factor which does not emerges from reaction (2.4), but is present in the
experimental situation, is that also the ligand interacts with solvent with relatively weak
interactions (coulombic, dipolar, van der Waals, H-bonding). In vacuum, this competitive
process is absent and an absolute affinity of a ligand for a metal ion can be measured (or
calculated). For example the so-called “anomalous order” of the basicity scale of amines in
water (i.e., NH3 < primary < secondary > tertiary), is in contrast with the order found
experimentally in gas phase and expected for the inductive contributions of the substituents
(tertiary > secondary > primary > NH3). This effect, also observed for the formation of
complexes with several ions (e.g. Ag+), is explained of the basis of the interaction of
amines with water molecules through hydrogen bonding [45].
Reaction (2.4) is helpful for interpreting the fact that metal complexes with the same ligand
in different solvents can have logK values differing of several orders of magnitude and
markedly different enthalpy values (even of opposite sign). When comparing two metal
ions also selectivity of the same ligand can change in different media.
At the moment, most of the literature on thermodynamics of metal complexes in solution to
characterize the carrier has been focused on aqueous solutions, while little has been studied
in organic solvents, although representing a more similar environment (low dielectric

37
constant, absence of protonation equilibrium, possible ionic associations) in which the
metal exists in the organic phase of extraction processes. For this reason, this first chapter
presents the study focused on determining the thermodynamic properties of the complexes
formed between heavy metals and S-donor ligands using acetonitrile (AN), a low dielectric
constant medium ( = 35.94) [44]. In addition, the study has also been extended to the more
coordinating solvent dimethyl sulfoxide (DMSO, = 46.45) [44].
2.1.1.2. Crown thioethers
As previously discussed in the general introduction, sulfur is an ubiquitous element of
particular environmental and biochemical importance with many vital functions in proteins
and enzymes.
The employment of polythioethers for the complexation of Hg(II) and other toxic or
precious soft metal ions is based upon their known high affinity for mercury since they are
soft ligand donors according to the HSAB theory [37, 46]. Thiacrown ligands (and their
derivatives) could be utilized as selective complexing agents for the removal and transport
of heavy metal ions as demonstrated in by Baumann and coworkers [47] who prepared a
pentathiacrown that was attached to a polystyrene polymer able to remove Hg(II) up to
99% or higher. In addition to the removal of Hg(II) in wastewater remediation applications,
another important and relevant use of mercury coordination chemistry with macrocyclic
ligands is the detection and quantitative measurement of the heavy metal ion itself, for
example by fluorescence measurements [48].
Although acyclic thioethers are not very good binders, crown thioethers are important
ligands, especially for late transition metals. The properties of crown thioethers have been
attributed to assumed conformational preferences, largely based on X-ray studies of the
ligands and their complexes in the solid state [2, 46, 49].
The functional ability of the crown compounds is generally based on the cavity size of a
ring, the molecular structure, the number and the nature of donor atoms (in case that the
38
thioether group is not the only one present in the ligand scaffold). With increasing
dimension of the crown ether the flexibility can be an important factor in determining the
selectivity for a given metal ion. For example, it has been pointed out [46] that in the solid
state thiacrown ethers have the ability to force rare geometries on the heavy metal ion
(Hg2+) [46]. For example, square planar (S4), square pyramidal (S5), and octahedral (S6)
geometries have been reported, that contrast the more common four-coordinate tetrahedral
and two-coordinate linear geometries typically seen for Hg(II) complexes [46].
Ligands containing thioether groups show a considerable increase in complexation stability
with soft metal ions such as Ag+ and Hg2+ ions in solution [50-52], but there is a lack of
systematic quantitative thermodynamic data on this type of complexes. Especially
interesting comparisons should be possible between the monovalent d10 acceptor Ag(I),
with very soft character, and the divalent very soft Hg(II) or borderline Cd(II).
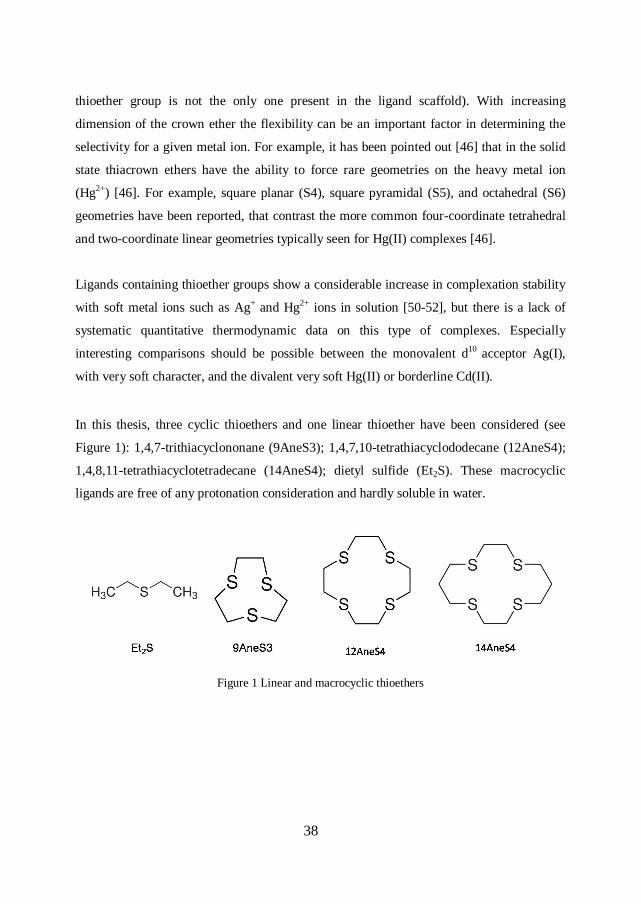
In this thesis, three cyclic thioethers and one linear thioether have been considered (see
Figure 1): 1,4,7-trithiacyclononane (9AneS3); 1,4,7,10-tetrathiacyclododecane (12AneS4);
1,4,8,11-tetrathiacyclotetradecane (14AneS4); dietyl sulfide (Et2S). These macrocyclic
ligands are free of any protonation consideration and hardly soluble in water.
Figure 1 Linear and macrocyclic thioethers

39
2.1.2. Experimental
2.1.2.1. Chemicals
Zn(II) and Cd(II) anhydrous perchlorates to be used in AN were prepared according to the
described procedures [53]. Also Zn(ClO4)2·6DMSO and Cd(ClO4)2·6DMSO were prepared
as previously described [53]. Anhydrous mercury perchlorate was obtained from
HgClO4·3H2O (Aldrich) by drying at 30°C for 1 week under vacuum in presence of P2O5.
Anhydrous silver perchlorate was obtained from AgClO4·H2O (Aldrich) as described [53].
The thioether ligands (Aldrich) were previously dried. The solvents, AN (Sigma-Aldrich
>99%) and DMSO (Aldrich 99%) [54] were purified by distillation. Successively, solvents
were transferred in a glove box and stored in presence of molecular sieves.
Perchlorate stock solutions of Zn(II), Cd(II), Hg(II) (and Ag(I)) ions and thioethers ligands
were prepared by dissolving in anhydrous degassed DMSO or AN weighed amounts of the
adducts (or of the anhydrous AgClO4) and their concentrations were checked by titration
with EDTA [55], with the exception of mercury, which has been determined by weighing.
Concentrations calculated by weight were quite reliable since for Cd and Zn perchlorates
the value determined by EDTA titration and weighting were nearly the same. The
background salt (NEt4ClO4) was prepared according to the described procedures [53].
All standard solutions were prepared and stored in a MB Braun 150 glove box under a
controlled atmosphere containing less than 1 ppm of water and less than 1 ppm of oxygen.
The water content in the solutions, typically 1-10 ppm, was determined by a Metrohm 684
KF Coulometer.
2.1.2.2. Potentiometry
The potentiometric titration technique was used to determine the stability constant of
complex formation with silver (I) (as perchlorate) in AN. The potentiometric titration is a
technique, where the voltage change across the analyte, typically an electrolyte solution is

40
measured. Emf of the cell depends on the concentration of the electrolytes with which the
electrodes are in contact. As the concentration of analyte changes, the emf of the cell also
changes correspondingly. Thus the potentiometric titration involves the measurement of
emf between an indicator electrode and a reference electrode, with the addition of titrant
(Figure 2).
The potentiometric titrations were performed with an automatic burette. All titrations were
carried out in constant ionic strength, with an electrolyte solution of 0.1 M Et4NClO4 and
working under nitrogen atmosphere at 298.15K. The solution was allowed to reach the
equilibrium within 90 seconds after each addition of titrant. The automatic titrator was
connected to a computer, which controlled the addition of titrant.
Figure 2 Potentiometric titration instrument (left).Scheme of the reaction cell (right)
The following cell (2.5) has been employed for the determination of the stability constants
of Ag+ complexes, equipped with a reference electrode (Ag/AgCl) and a silver indicator
electrode.
퐴푔 퐶 ,퐶 ,퐶 ‖퐴푔퐶푙푂 (0.1푀)|퐴푔 (2.5)

41
Where, CAg , CL, CM, are the concentrations of silver, ligand and metal competitor in AN
solution in the cell. When the stability constants with Ag+ were determined, the competitor
metal ion M was absent.
For the determination of the stability constants with Zn2+ and Cd2+ the “competitive
method” [42] has been employed using Ag+ as competitor. This method requires that the
stability constants of a given ligand with the competitor are already known by previous
experiments. Then, a solution containing the cation (Zn2+, Cd2+) and the competitor was
titrated with the ligand solution and the emf was recorded. Computer data fitting, using the
program Hyperquad [56], allows to determine the stability constants of the studied cations.
In the case of Hg(II), competitive potentiometric titration using Ag(I) could not be carried
out, because of a concomitant redox reaction occurring in solution. For this reason, the
stability constants were determined by polarography (see section 2.1.2.4). This last
methods was chosen as calorimetric and UV-Vis experiments evidenced a very high
stability for Hg-thioethers systems in AN.
2.1.2.3. Calorimetriy
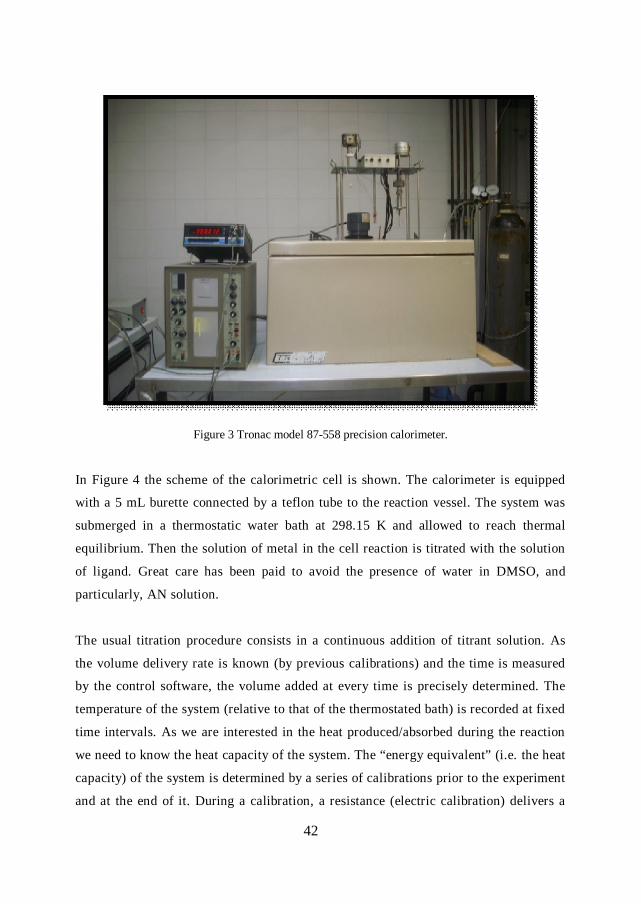
A Tronac model 87-558 precision calorimeter (Figure 3) was employed to measure heat
exchange for the reaction in order to calculate enthalpy values (∆Ho) and entropy terms
(∆So) from equation (2.3). The calorimeter consists of the following parts: a jacket or
bath, which surrounds the calorimeter and whose temperature is kept constant
throughout the measurement process; a contact thermometer to adjust the bath
temperature; an auxiliary heater that supplies power to the bath, two agitators one for
bath and one for cell; a heating pad which supplies power to the cell; a Dewar flask
containing the substance in question and a burette containing the titrant.
42
Figure 3 Tronac model 87-558 precision calorimeter.
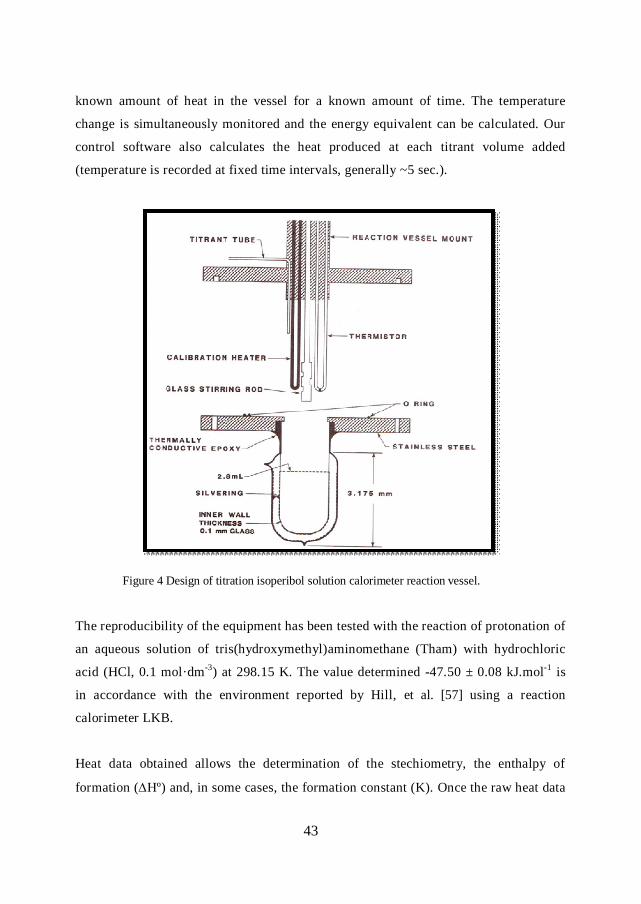
In Figure 4 the scheme of the calorimetric cell is shown. The calorimeter is equipped
with a 5 mL burette connected by a teflon tube to the reaction vessel. The system was
submerged in a thermostatic water bath at 298.15 K and allowed to reach thermal
equilibrium. Then the solution of metal in the cell reaction is titrated with the solution
of ligand. Great care has been paid to avoid the presence of water in DMSO, and
particularly, AN solution.
The usual titration procedure consists in a continuous addition of titrant solution. As
the volume delivery rate is known (by previous calibrations) and the time is measured
by the control software, the volume added at every time is precisely determined. The
temperature of the system (relative to that of the thermostated bath) is recorded at fixed
time intervals. As we are interested in the heat produced/absorbed during the reaction
we need to know the heat capacity of the system. The “energy equivalent” (i.e. the heat
capacity) of the system is determined by a series of calibrations prior to the experiment
and at the end of it. During a calibration, a resistance (electric calibration) delivers a
43
known amount of heat in the vessel for a known amount of time. The temperature
change is simultaneously monitored and the energy equivalent can be calculated. Our
control software also calculates the heat produced at each titrant volume added
(temperature is recorded at fixed time intervals, generally ~5 sec.).
Figure 4 Design of titration isoperibol solution calorimeter reaction vessel.
The reproducibility of the equipment has been tested with the reaction of protonation of
an aqueous solution of tris(hydroxymethyl)aminomethane (Tham) with hydrochloric
acid (HCl, 0.1 mol·dm-3) at 298.15 K. The value determined -47.50 ± 0.08 kJ.mol-1 is
in accordance with the environment reported by Hill, et al. [57] using a reaction
calorimeter LKB.
Heat data obtained allows the determination of the stechiometry, the enthalpy of
formation (Hº) and, in some cases, the formation constant (K). Once the raw heat data
44
were collected, the enthalpy calculations were performed using the program
HyperDeltaH [58]. In general, standard enthalpy of complexation were calculated using
fixed values of logK (previously determined by potentiometry of polarography).
2.1.2.4. Polarography
To verify the formation of complexes between the ligands L and the ion Hg2+
polarography has been used, that is an electrochemical technique where a potential
linearly variable in time is applied to a dropping mercury electrode while the
developing current is measured. This technique allows to obtain same important
parameters of the redox processes between the species in solution and the electrode
surface as the number of involved electrons, the stoichiometry of the reactions and the
approximated value of E°. In fact, if the diffusion coefficients of the reduced and
oxidized species are similar, E° = E1/2 (see equation (2.6)), where E1/2 is the potential
value when the current is half of its limiting value.
The working electrode is a dropping mercury electrode that is formed by a head of Hg
20 to 100 cm high connected to a glass capillary with a cross section of a few tenths of
mm. The mercury was previously purified by repeated washing with dilute HNO3 and
H2O, drying and reduced-pressure tri-distillation.
The calibration was done using salts of Cd2+ as standard and the reduction reaction
Cd2+ + 2e- → Cd (amalgam). The resulting polarographic wave is sigmoidal in shape as
predicted by theory for many cations as Cd2+ in water and in the presence of strong
supporting electrolytes. In the present case the Cd2+ salt was added to a solution
containing NaClO4 0.1 M at 25 °C and shows E1/2 = -0.63 V vs. SCE: the polarographic
analysis of the obtained wave gives exactly 2e- reduction.
The polarographic measurements were performed in a thermostated jacked cell with
five necks holding three electrodes: (Figure 5)

45
1) reference electrode (RE): Ag|AgNO3 (0.01 M in acetonitrile), TEAP (0.1 M); the
electrode was separated by the solution by a vycor frit to avoid ion contamination.
2) counter electrode (CE): Pt wire directly dipped in the solution.
3) working electrode (WE): dropping mercury electrode, AMEL 460/30”.
A knocker of 1 s assures the reproducibility of drop life time.
Figure 5 Assembly of the cell
The circuit is controlled by a potentiostat that allows the potential variation between
WE and RE, but switches the current between WE and CE. In this way no current flows
between WE and RE and so there is no potential drop between them (RI, Ohm's law).
The potential of the working electrode is expected not be influenced by the resistance
of the solution that is generally high in non aqueous solvents as AN.
Vapplied = V on the electrode - IR potential drop (due to the resistance of the solvent and
the flowing currency that is not constant).
If RI = 0 then Vapplied = V on the electrode surface.

46
Figure 6 Polarographic wave
The polarography allows the investigation both of reductions and oxidations of
electroactive species in solution. The obtained signals have a classical sigmoidal form
as it is reported in Figure 6 where a reduction process is considered. At the increasing of
WE potential towards more negative values, a cathodic current develops whose height
increases with the variation of V up to a maximum limiting value and then becomes
constant. The condition of limiting current is due to the fact that the reduction rate is
due to two chained phenomena: 1) the electron transfer between electrode surface and
species in solution through the electrical interface and 2) the diffusion of the consumed
species from the bulk of solution to electrode surface. Generally the diffusion is the
rate determining step of the all process. When such condition is reached the current is
called limiting diffusion current iL or id.
In the case studied in this work, the WE potential is varied from negative to more
positive values (anodic sense) in order to see the developing of anodic current signals
due to the oxidation of species in solution. In this case, the polarographic wave for the
oxidation is expressed by the equation (2.6).
47
퐸 = 퐸 +푅푇2퐹 푙푛
푖푑 − 푖푖
퐷퐷 (2.6)
The experiment was always done in the following procedure. The solvent was acetonitrile
(3 mL) which has been freshly distilled and then stored on molecular sieves.
Tetraethylammonium perchlorate (NEt4ClO4), at a concentration 0.1 M, was added as
supporting electrolyte: its presence is necessary to maintain a constant ionic strength
and to minimize migration of charge species: in this way diffusion is the only force that
the species in solution feel. The potential scans were carried out at a scan rate of 5 mV/s
in the operating range, dropping time of 1 s, in nitrogen atmosphere (bubbling N2 for 10
min) and at room temperature, approximately 25 ºC. The background was always recorded
and in these conditions the signal of the bielectronic oxidation of the mercury (2.7) with a
positive potential is seen.
Hg → Hg2+ + 2e- (2.7)
Also a second oxidation reaction develops and is attributed to equation:
2Hg → Hg22+ + 2e- (2.8)
When there is no ligand in solution the ratio of concentrations of Hg22+/Hg2+ = 120/1. When
the ligands were present the species formed are mainly [HgLx]2+ [59]. In a typical
experiment a weighed quantity of ligand was added to the solution. In a polarographic
measure, we observe the formation of polarographic oxidation wave, which is described by
the equation (2.9).
Hg + xL [HgLx]2+ + 2e- (2.9)
Where L is the ligand and x is the stoichiometric coefficient.

48
The relationship between the half-wave potential of the process and the stability constant
(2.10).
퐾 =[퐻푔퐿 ]
[퐻푔 ][퐿] (2.10)
is expressed as:
퐸 = 퐸 −푅푇2퐹 푙푛퐾 +
푅푇2퐹 푙푛
2( ) 퐷푥[퐿]( ) 퐷
(2.11)
Where E° is the formal potential of the couple Hg/Hg2+ vs. the reference electrode (+0.572),
DL and DC are the diffusion coefficients of the free ligand and the complex, respectively
[60-62].
According to the equation (2.11) you can determine the constant of complex formation.
However, the following points should be underlined:
when E1/2 depends on the concentration, the stoichiometry of the reaction is 1:2
and the formation constants obtained from the following equation:
퐸 = 퐸 −푅푇2퐹 푙푛퐾 + 푙푛
[퐿]2
( )
(2.12)
where x = 2 and Eo = +0.572
when E1/2 does not depend on the concentration, the stoichiometry of the reaction
is 1:1 and the formation constants obtained from the following equation:
퐸 = 퐸 −푅푇2퐹 푙푛퐾 (2.13)
where x = 1 and E° = +0.572
49
2.1.2.5. Theoretical calculations
Experimental and theoretical gas phase studies are often useful to interpret at molecular
level the thermodynamics of complex formation. The reaction of M2+ ions with 9AneS3
and Et2S has been studied by means of DFT calculations using three different functionals.
Geometry optimizations carried out in vacuum using a 6-31+G(d) basis set for all atoms (H,
C, N and S) except the metal ion. The metal ions were described by the quasi-relativistic
Stuttgart-Dresden pseudopotential and the relative basis set. Stationary points were
characterized by vibrational mode analysis. The reliability of the results has been checked
by comparing calculated structures to experimental counterparts. All calculations were
performed with Gaussian09 program [63].

50
2.1.3. Results and discussion
The thermodynamic study of the complexes formed between thioether ligands and heavy
metals (Ag(I), Zn(II), Cd(II) and Hg(II)) were carried out through the techniques explained
in the section 3.1.2.
2.1.3.1. 1,4,7-trithiacyclononane (9AneS3)
The 9AneS3 (Figure 1) is the smaller cyclic thioether with three S-donor atoms (tridentate).
This has been the most widely investigated because of its good solubility in AN along with
the fact that (as it will be described later) it is the only able to from stable complexes with
all the metals considered in this work.
Figure 7 shows the potentiometric curves in form of potential variation (ΔE = (Emeas–
Einitial)) vs. the ratio of the concentrations of ligand to metal (CL/CM).
Figure 7 Competitive potentiometric titration for 9AneS3 (2.63·10-2 M). Concentration of metals are Ag(I) = 1.5·10-3 M (without the presence of competing metal), Ag(I) = 1.5·10-3 M (with the presence of competing metal) and Zn(II) and Cd(II) = 8·10-3 M in AN.
0
50
100
150
200
250
0,00 0,50 1,00 1,50 2,00 2,50 3,00 3,50
∆E (m
V)
CL/CM
AgZnCd

51
The curves represent the potential, which is related to the concentration of ion sensitive to
the electrode through the well known Nernst equation [42]. Therefore, a lower curve
indicates a higher concentration of free Ag(I) showing the formation of stable 9AneS3
complexes with the ion in competition. This is observed for the two metals (Zn(II) and
Cd(II)) being more evident in the case of Cd(II), with which more competition and
therefore more stable complexes are indicated.
As an example, Figure 8 shows the polarograms of background signal corresponding to the
bielectronic oxidation of mercury (2.8) in absence of 9AneS3, and the polarographic wave
resulting from the reaction (2.9) which the formation of the Hg-9AneS3 complex occurs. In
presence of 9AneS3 a change in the E1/2 to negative values is appreciated.
Figure 8 Polarographic waves in absence of ligand (background) (left) and in presence of 9AneS3
(1.2·10-3 M) (right) in AN.
52
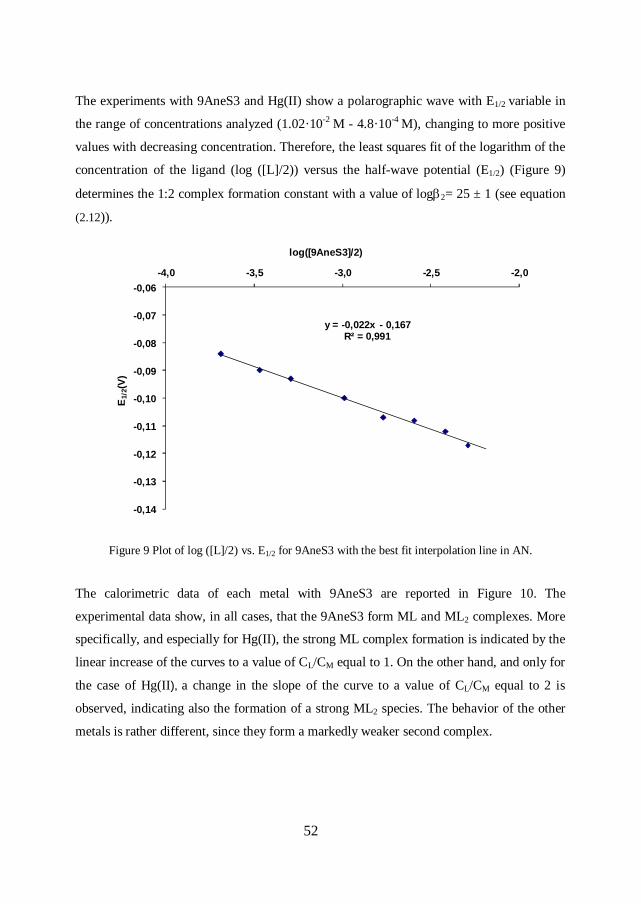
The experiments with 9AneS3 and Hg(II) show a polarographic wave with E1/2 variable in
the range of concentrations analyzed (1.02·10-2 M - 4.8·10-4 M), changing to more positive
values with decreasing concentration. Therefore, the least squares fit of the logarithm of the
concentration of the ligand (log ([L]/2)) versus the half-wave potential (E1/2) (Figure 9)
determines the 1:2 complex formation constant with a value of log2= 25 ± 1 (see equation
(2.12)).
Figure 9 Plot of log ([L]/2) vs. E1/2 for 9AneS3 with the best fit interpolation line in AN.
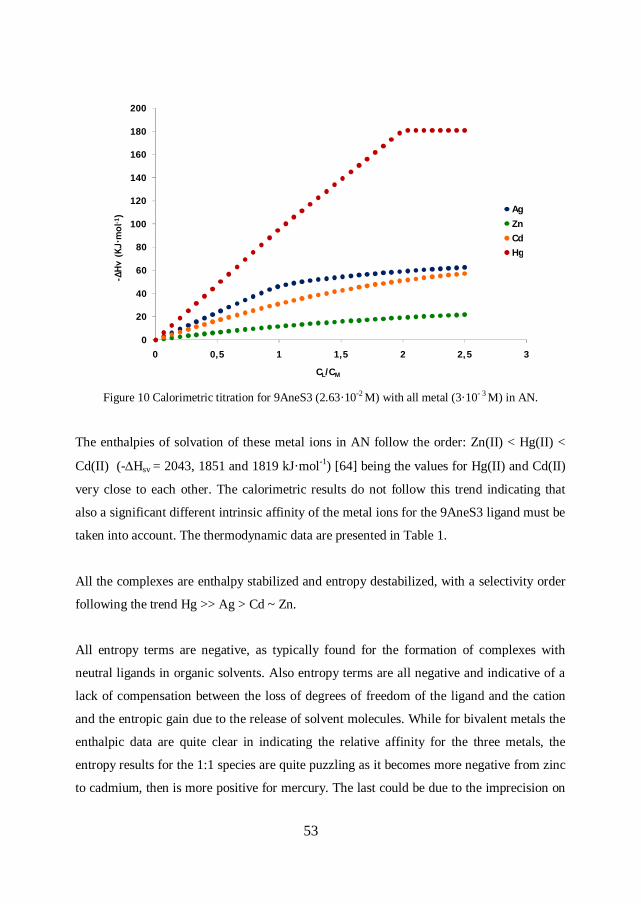
The calorimetric data of each metal with 9AneS3 are reported in Figure 10. The
experimental data show, in all cases, that the 9AneS3 form ML and ML2 complexes. More
specifically, and especially for Hg(II), the strong ML complex formation is indicated by the
linear increase of the curves to a value of CL/CM equal to 1. On the other hand, and only for
the case of Hg(II), a change in the slope of the curve to a value of CL/CM equal to 2 is
observed, indicating also the formation of a strong ML2 species. The behavior of the other
metals is rather different, since they form a markedly weaker second complex.
y = -0,022x - 0,167R² = 0,991
-0,14
-0,13
-0,12
-0,11
-0,10
-0,09
-0,08
-0,07
-0,06-4,0 -3,5 -3,0 -2,5 -2,0
E 1/2
(V)
log([9AneS3]/2)
53
Figure 10 Calorimetric titration for 9AneS3 (2.63·10-2 M) with all metal (3·10- 3 M) in AN.
The enthalpies of solvation of these metal ions in AN follow the order: Zn(II) < Hg(II) <
Cd(II) (-Hsv = 2043, 1851 and 1819 kJ·mol-1) [64] being the values for Hg(II) and Cd(II)
very close to each other. The calorimetric results do not follow this trend indicating that
also a significant different intrinsic affinity of the metal ions for the 9AneS3 ligand must be
taken into account. The thermodynamic data are presented in Table 1.
All the complexes are enthalpy stabilized and entropy destabilized, with a selectivity order
following the trend Hg >> Ag > Cd ~ Zn.
All entropy terms are negative, as typically found for the formation of complexes with
neutral ligands in organic solvents. Also entropy terms are all negative and indicative of a
lack of compensation between the loss of degrees of freedom of the ligand and the cation
and the entropic gain due to the release of solvent molecules. While for bivalent metals the
enthalpic data are quite clear in indicating the relative affinity for the three metals, the
entropy results for the 1:1 species are quite puzzling as it becomes more negative from zinc
to cadmium, then is more positive for mercury. The last could be due to the imprecision on
0
20
40
60
80
100
120
140
160
180
200
0 0,5 1 1,5 2 2,5 3
-∆H
v (K
J·m
ol-1
)
CL/CM
AgZnCdHg

54
the logβ1 of Hg(II) complex which has been only estimated on the basis of calorimetric data
and of the value of logβ2 determined by polarography.
Table 1 The thermodynamic data for 9AneS3 in AN.
log β -ΔGº
(kJ/mol)
-ΔHº
(kJ/mol)
TΔSº
(kJ/mol)
Ag(9AneS3)+ 5.89 (±0.01) 33.6 (±0.1) 48 (±1) -14.4
Ag(9AneS3)2+ 8.88 (±0.01) 50.7 (±0.1) 79 (±3) -28.3
Zn(9AneS3)2+ 3.10 (±0.01) 17.7 (±0.1) 26 (±2) -8.3
Zn(9AneS3)22+ 5.38 (±0.04) 30.7 (±0.2) 49 (±5) -18.3
Cd(9AneS3)2+ 3.66 (±0.03) 20.9 (±0.2) 44 (±1) -23.1
Cd(9AneS3)22+ 6.80 (±0.06) 38.8 (±0.3) 77 (±2) -38.2
Hg(9AneS3)2+ 16* 92* 96 (±2) -4
Hg(9AneS3)22+ 25 (±1) 143 (±6) 181 (±3) -38
* Estimated value from calorimetric data.
2.1.3.2. Origin of the selectivity of 9AneS3
Due to the structural simplicity of the ligand and the availability of a complete set of
thermodynamic data for the formation of complexes with 9AneS3, a complementary
theoretical study of the complexation has been also carried out in order to investigate on the
possible reasons of the ligand selectivity.
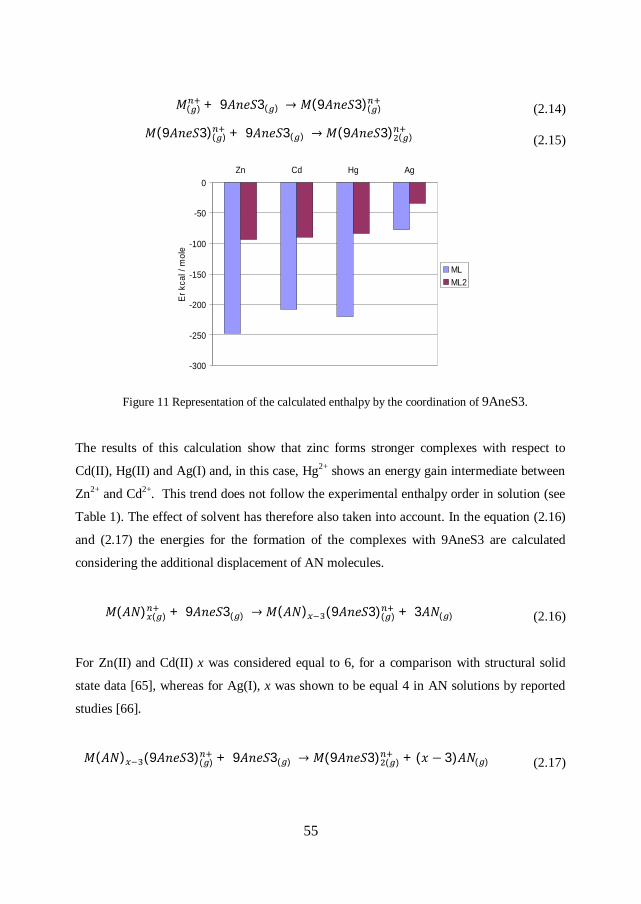
In Figure 11 are reported the calculated enthalpy changes for coordination of 1 and 2
molecules of 9AneS3 in gas phase (no solvent effect), as described in the reactions (2.14)
and (2.15).
55
푀( ) + 9퐴푛푒푆3( ) → 푀(9퐴푛푒푆3)( ) (2.14)
푀(9퐴푛푒푆3)( ) + 9퐴푛푒푆3( ) → 푀(9퐴푛푒푆3) ( ) (2.15)
Figure 11 Representation of the calculated enthalpy by the coordination of 9AneS3.
The results of this calculation show that zinc forms stronger complexes with respect to
Cd(II), Hg(II) and Ag(I) and, in this case, Hg2+ shows an energy gain intermediate between
Zn2+ and Cd2+. This trend does not follow the experimental enthalpy order in solution (see
Table 1). The effect of solvent has therefore also taken into account. In the equation (2.16)
and (2.17) the energies for the formation of the complexes with 9AneS3 are calculated
considering the additional displacement of AN molecules.
푀(퐴푁) ( ) + 9퐴푛푒푆3( ) → 푀(퐴푁) (9퐴푛푒푆3)( ) + 3퐴푁( ) (2.16)
For Zn(II) and Cd(II) x was considered equal to 6, for a comparison with structural solid
state data [65], whereas for Ag(I), x was shown to be equal 4 in AN solutions by reported
studies [66].
푀(퐴푁) (9퐴푛푒푆3)( ) + 9퐴푛푒푆3( ) → 푀(9퐴푛푒푆3) ( ) + (푥 − 3)퐴푁( ) (2.17)
-300
-250
-200
-150
-100
-50
0Zn Cd Hg Ag
Er k
cal /
mol
e
MLML2
56
Figure 12 Structures of the starting, intermediate and final mercury complexes. Colors correspond to the following atoms: central gray = Hg, yellow = S, dark blue = N, blue = C and outer gray = H.
The complex Hg(9AneS3)2 shows (Figure 12) a tetragonal elongation or compression of the
structure from idealized octahedral geometry, as reflected in the literature [46].The
distorted octahedral geometry illustrates the ability of the 9AneS3 ligand to force facial
tridentate coordination on metal ions, such as Hg(II), that usually do not favor hexa
coordination.
It is worthwhile to consider also the results in Figure 13 where the optimized structures of
[Zn(AN)6]2+ and [Zn(9AneS3)(AN)3]2+ are displayed: they are in good agreement with the
available [21] crystal structure.
Figure 13 Structures of [Zn(AN)6]2+ and [Zn(9AneS3)(AN)3]2+. Colors correspond to the following atoms: central gray = Zn, yellow = S, dark blue = N, blue = C and outer gray = H.
The dissociation of first shell solvent molecules in vacuum can give positive values (Figure
14): this can depend on the calculation method, but the important point is to focus on the
relative values. The reaction energy increases now in the order: silver < mercury <
cadmium < zinc.
Eq.(2.17) Eq. (2.16)
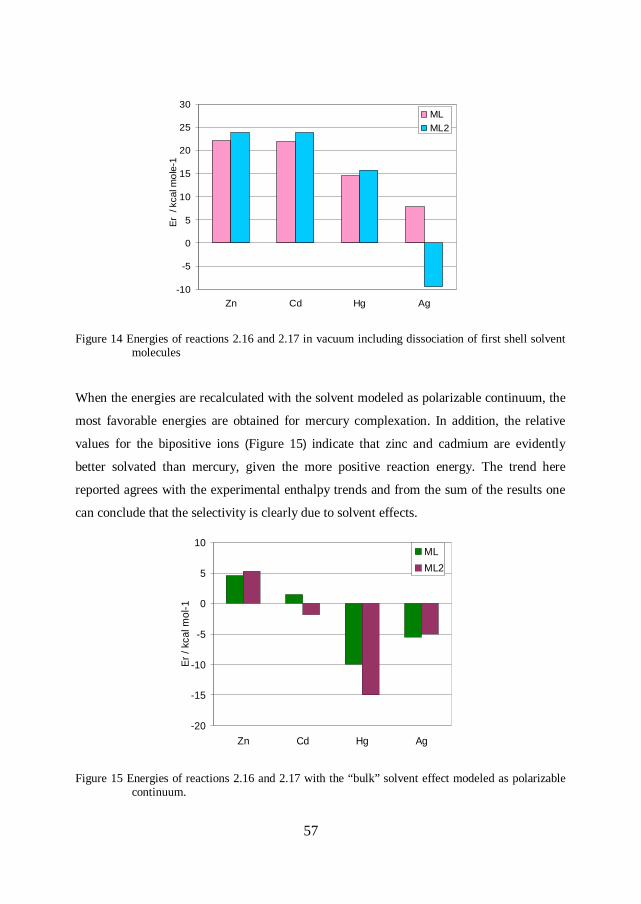
57
Figure 14 Energies of reactions 2.16 and 2.17 in vacuum including dissociation of first shell solvent molecules
When the energies are recalculated with the solvent modeled as polarizable continuum, the
most favorable energies are obtained for mercury complexation. In addition, the relative
values for the bipositive ions (Figure 15) indicate that zinc and cadmium are evidently
better solvated than mercury, given the more positive reaction energy. The trend here
reported agrees with the experimental enthalpy trends and from the sum of the results one
can conclude that the selectivity is clearly due to solvent effects.
Figure 15 Energies of reactions 2.16 and 2.17 with the “bulk” solvent effect modeled as polarizable continuum.
-10
-5
0
5
10
15
20
25
30
Zn Cd Hg Ag
Er
/ kca
l mol
e-1
MLML2
-20
-15
-10
-5
0
5
10
Zn Cd Hg Ag
Er /
kcal
mol
-1
MLML2
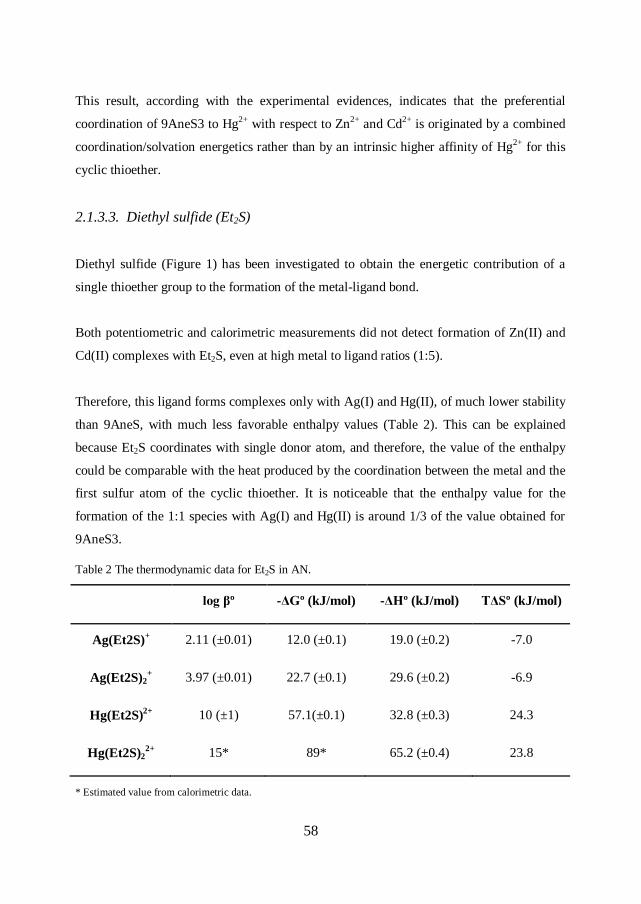
58
This result, according with the experimental evidences, indicates that the preferential
coordination of 9AneS3 to Hg2+ with respect to Zn2+ and Cd2+ is originated by a combined
coordination/solvation energetics rather than by an intrinsic higher affinity of Hg2+ for this
cyclic thioether.
2.1.3.3. Diethyl sulfide (Et2S)
Diethyl sulfide (Figure 1) has been investigated to obtain the energetic contribution of a
single thioether group to the formation of the metal-ligand bond.
Both potentiometric and calorimetric measurements did not detect formation of Zn(II) and
Cd(II) complexes with Et2S, even at high metal to ligand ratios (1:5).
Therefore, this ligand forms complexes only with Ag(I) and Hg(II), of much lower stability
than 9AneS, with much less favorable enthalpy values (Table 2). This can be explained
because Et2S coordinates with single donor atom, and therefore, the value of the enthalpy
could be comparable with the heat produced by the coordination between the metal and the
first sulfur atom of the cyclic thioether. It is noticeable that the enthalpy value for the
formation of the 1:1 species with Ag(I) and Hg(II) is around 1/3 of the value obtained for
9AneS3.
Table 2 The thermodynamic data for Et2S in AN.
log βº -ΔGº (kJ/mol) -ΔHº (kJ/mol) TΔSº (kJ/mol)
Ag(Et2S)+ 2.11 (±0.01) 12.0 (±0.1) 19.0 (±0.2) -7.0
Ag(Et2S)2+ 3.97 (±0.01) 22.7 (±0.1) 29.6 (±0.2) -6.9
Hg(Et2S)2+ 10 (±1) 57.1(±0.1) 32.8 (±0.3) 24.3
Hg(Et2S)22+ 15* 89* 65.2 (±0.4) 23.8
* Estimated value from calorimetric data.
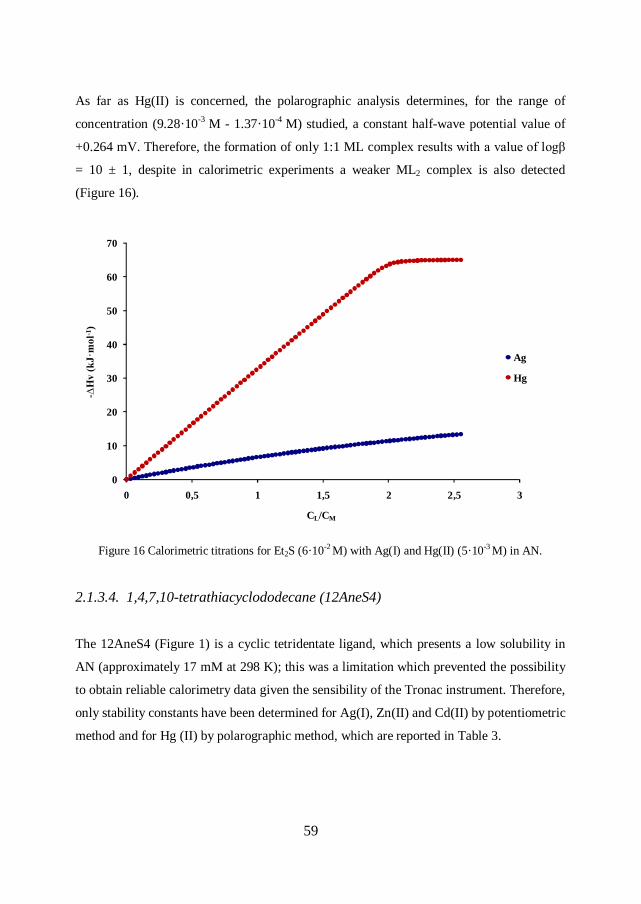
59
As far as Hg(II) is concerned, the polarographic analysis determines, for the range of
concentration (9.28·10-3 M - 1.37·10-4 M) studied, a constant half-wave potential value of
+0.264 mV. Therefore, the formation of only 1:1 ML complex results with a value of logβ
= 10 ± 1, despite in calorimetric experiments a weaker ML2 complex is also detected
(Figure 16).
Figure 16 Calorimetric titrations for Et2S (6·10-2 M) with Ag(I) and Hg(II) (5·10-3 M) in AN.
2.1.3.4. 1,4,7,10-tetrathiacyclododecane (12AneS4)
The 12AneS4 (Figure 1) is a cyclic tetridentate ligand, which presents a low solubility in
AN (approximately 17 mM at 298 K); this was a limitation which prevented the possibility
to obtain reliable calorimetry data given the sensibility of the Tronac instrument. Therefore,
only stability constants have been determined for Ag(I), Zn(II) and Cd(II) by potentiometric
method and for Hg (II) by polarographic method, which are reported in Table 3.
0
10
20
30
40
50
60
70
0 0,5 1 1,5 2 2,5 3
-∆H
v (k
J·m
ol-1
)
CL/CM
Ag
Hg

60
Table 3 The thermodynamic data for 12AneS4 in AN.
log β -ΔGº (kJ/mol)
Ag(12AneS4)+ 6.07 (±0.01) 34.63 (±0.03)
Zn(12AneS4)2+ 3.12 (±0.01) 17.83 (±0.08)
Cd(12AneS4)2+ 3.00 (±0.04) 17.1 (±0.2)
Cd(12AneS4)22+ 6.69 (±0.01) 38.21 (±0.04)
Hg(12AneS4)2+ 15.6 (±0.3) 89.0 (±0.1)
The competitive potentiometric titration data, reported in Figure 17, show that the 12AneS4
forms complexes with all metal studied.
Figure 17 Competitive potentiometric titration for 12AneS4 (1.25·10-3 M). Concentration of metals are Ag(I) = 1·10-3 M (without the presence of competing metal), Ag(I) = 1·10-3 M (with the presence of competing metal) and Zn(II) and Cd(II) = 4·10-3 M in AN.
0
20
40
60
80
100
120
140
160
180
0 0,5 1 1,5 2 2,5 3
DE
CL/CM
AgZnCd
61
Anyway, the minimization of data, show that the best fit was achieved when the formation
of a single complex 1:1 is considered for Ag(I) and Zn(II), with a stability comparable to
the respective tridentate ligand complex. This could indicate that in these ML complexes
the quatridentate ligand is coordinated with only three of the S-donor atoms.
However, for Cd(II), formation of two complexes (ML and ML2) has been observed. This
may be due to the ionic size cadmium which is larger, and therefore allows the coordination
of a second ligand molecule. Again, the values of the stability constants are similar to those
obtained for 9AneS3.
The results for Hg (II) with this ligand, are based only on the polarographic data, for the
reasons discussed above. The results of the polarograms show, for the range of
concentration (1.01·10-2 M – 2.51·10-4 M) studied, a constant half-wave potential value of
+0.121 mV. Therefore, the formation of ML complex with a value of logβ= 15.6 ± 0.3 is
indicated. Again the ligand is much more selective for Hg(II), the value of the constant
being similar to the estimated value for ML formation with 9AneS3 this may be due to
several factors such as a non complete binding or to a non-optimal fit of the cation in the
ligand structure.
2.1.3.5. 1,4,8,11-tetrathiacyclotetradecane (14AneS4)
The 14AneS4 (Figure 1) is a tetradentate S-donor ligand with a larger ring cavity with
respect to the other ligands presented above.
The experimental data show that Zn(II) and Cd(II) complexes are not formed with
14AneS4. The whole of thermodynamic data obtained for Ag(I) and Hg(II) are reported in
Table 4.

62
Table 4 The thermodynamic data for 14AneS4 in AN.
log β -ΔGº (kJ/mol) -ΔHº (kJ/mol) TΔSº (kJ/mol)
Ag(14AneS4)+ 3.82 (±0.02) 21.8 (±0.1) 57 (±2) -35.2
Hg(14AneS4)2+ 15.8 (±0.6) 90 (±0.1) 88 (±2) 2
Hg(14AneS4)22+ 21* 121* 116 (±3) 5
* Estimated value from calorimetric data.
In the case of Hg(II) the polarographic analysis determines, for the range of concentration
(1.19·10-3 M - 1.85·10-4 M) studied, a constant half-wave potential value of +0.115 mV.
Therefore, the formation of ML complex with a value of logβ = 15.8 ± 0.6 is evaluated,
despite in calorimetric experiments is also appreciated the ML2 complex formation with a
smaller constant, logK2 = 5.2 (Figure 18).
Figure 18 Calorimetric titrations for Hg(II) and Ag(I) (2·10-3 M) with 14AneS4 (1.68·10-2 M) in AN.
0
20
40
60
80
100
120
140
0 0,5 1 1,5 2 2,5
-∆hv
(kJ·
mol
-1)
CL/CM
Hg
Ag
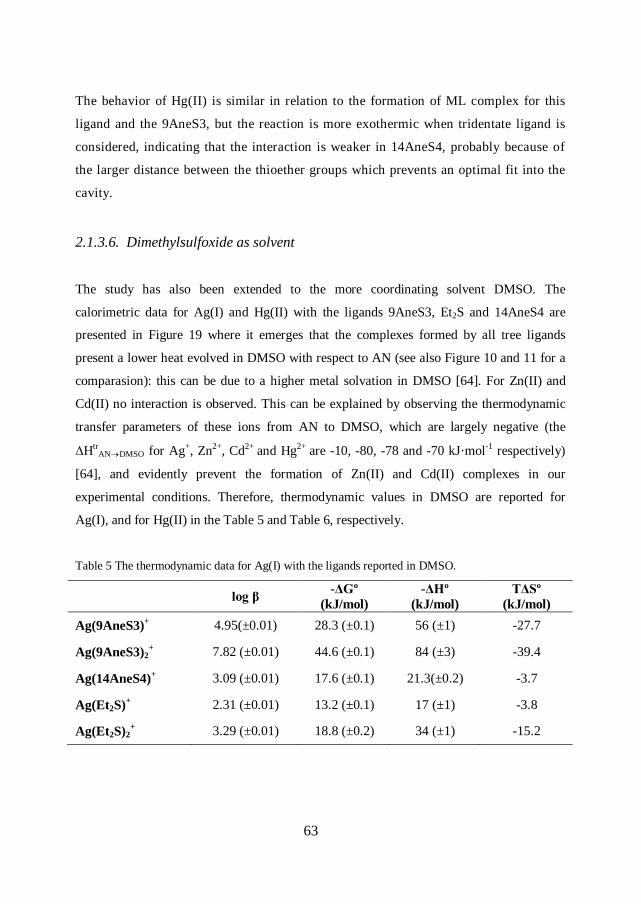
63
The behavior of Hg(II) is similar in relation to the formation of ML complex for this
ligand and the 9AneS3, but the reaction is more exothermic when tridentate ligand is
considered, indicating that the interaction is weaker in 14AneS4, probably because of
the larger distance between the thioether groups which prevents an optimal fit into the
cavity.
2.1.3.6. Dimethylsulfoxide as solvent
The study has also been extended to the more coordinating solvent DMSO. The
calorimetric data for Ag(I) and Hg(II) with the ligands 9AneS3, Et2S and 14AneS4 are
presented in Figure 19 where it emerges that the complexes formed by all tree ligands
present a lower heat evolved in DMSO with respect to AN (see also Figure 10 and 11 for a
comparasion): this can be due to a higher metal solvation in DMSO [64]. For Zn(II) and
Cd(II) no interaction is observed. This can be explained by observing the thermodynamic
transfer parameters of these ions from AN to DMSO, which are largely negative (the
∆HtrANDMSO for Ag+, Zn2+, Cd2+ and Hg2+ are -10, -80, -78 and -70 kJ·mol-1 respectively)
[64], and evidently prevent the formation of Zn(II) and Cd(II) complexes in our
experimental conditions. Therefore, thermodynamic values in DMSO are reported for
Ag(I), and for Hg(II) in the Table 5 and Table 6, respectively.
Table 5 The thermodynamic data for Ag(I) with the ligands reported in DMSO.
log β -ΔGº (kJ/mol)
-ΔHº (kJ/mol)
TΔSº (kJ/mol)
Ag(9AneS3)+ 4.95(±0.01) 28.3 (±0.1) 56 (±1) -27.7
Ag(9AneS3)2+ 7.82 (±0.01) 44.6 (±0.1) 84 (±3) -39.4
Ag(14AneS4)+ 3.09 (±0.01) 17.6 (±0.1) 21.3(±0.2) -3.7
Ag(Et2S)+ 2.31 (±0.01) 13.2 (±0.1) 17 (±1) -3.8
Ag(Et2S)2+ 3.29 (±0.01) 18.8 (±0.2) 34 (±1) -15.2

64
Table 6 The thermodynamic data for Hg(II) with the ligands reported in DMSO.
log β -ΔGº (kJ/mol) -ΔHº (kJ/mol) TΔSº (kJ/mol)
Hg(9AneS3)2+ 5.7 (±0.3) 33 (±1) 39 (±1) -6
Hg(9AneS3)22+ 9.9 (±0.3) 55 (±1) 77 (±2) -22
Hg(14AneS4)2+ 3.5 (±0.3) 20 (±1) 9.0 (±0.1) 11
Hg(14AneS4)22+ 5.6 (±0.3) 32 (±1) 11.3 (±0.1) 20.7
Hg(Et2S)2+ 2.3 (±0.3) 13 (±1) 17(±1) -4
Hg(Et2S)22+ 3.3 (±0.3) 19 (±1) 42 (±1) -23
Figure 19 Calorimetric titrations for Ag(I) (5·10-3 M) and Hg(II) (5·10-3 M) with the ligands reported (6·10-2 M) in DMSO.
Only for Hg in DMSO (Table 6), both logβ and enthalpy values were obtained from
calorimetric data. In the case of 14AneS4, a positive entropy can be appreciated. This can
be because the 14AneS4 has a larger ring, therefore the second donor atom is coordinated
with more difficulty by the increase in the length of the chain. In other words, the loss of
molecules by the metal desolvation is probably greater than the number of S-donors to
0
20
40
60
80
0 0,5 1 1,5 2 2,5 3
-∆H
v (K
J·m
ol-1
)
CL/CM
Ag + 9AneS3
Ag + 14AneS4
Ag + Et2S
Hg + 9AneS3
Hg + 14AneS4
Hg + Et2S
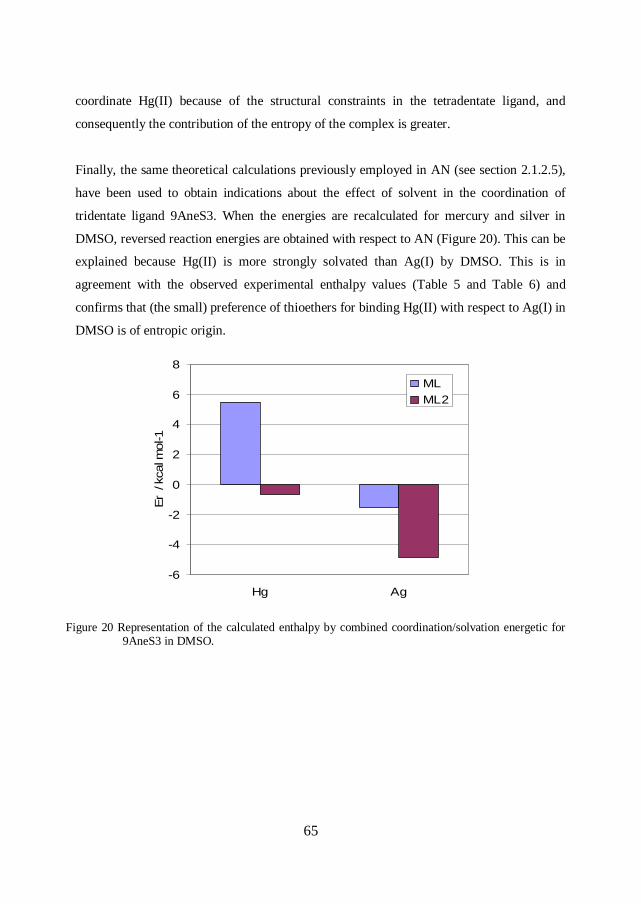
65
coordinate Hg(II) because of the structural constraints in the tetradentate ligand, and
consequently the contribution of the entropy of the complex is greater.
Finally, the same theoretical calculations previously employed in AN (see section 2.1.2.5),
have been used to obtain indications about the effect of solvent in the coordination of
tridentate ligand 9AneS3. When the energies are recalculated for mercury and silver in
DMSO, reversed reaction energies are obtained with respect to AN (Figure 20). This can be
explained because Hg(II) is more strongly solvated than Ag(I) by DMSO. This is in
agreement with the observed experimental enthalpy values (Table 5 and Table 6) and
confirms that (the small) preference of thioethers for binding Hg(II) with respect to Ag(I) in
DMSO is of entropic origin.
Figure 20 Representation of the calculated enthalpy by combined coordination/solvation energetic for 9AneS3 in DMSO.
-6
-4
-2
0
2
4
6
8
Hg Ag
Er
/ kca
l mol
-1
MLML2

66
2.2. Studies and applications of Hg and 9AneS3 complex formation using
liquid-Liquid Distribution Processes
2.2.1. Introduction
Separation processes are used in many industrials activities. For many companies, these
processes involve the production of specific materials. On the other hand, in the
environmental field, the principal objective of the separation process is the recovery,
disposal and/or treatment of certain pollutants. For reasons considered above, it is known
the separation processes to have great economic and social impact.
There are multiple separation techniques taking into account that the separation process can
be divided into equilibrium processes (evaporation, desorption, adsorption, ion exchange,
solvent extraction, reverse osmosis, etc...) processes controlled by the speed (thermal
diffusion, diffusion gas, dialysis, electrophoresis, reverse osmosis, etc..) and mechanical
separation processes (filtration, sedimentation, centrifugation, precipitation, etc.) [29].
Solvent extraction has become a very powerful method of separation for various reasons, in
particular, it is very simple, rapid, selective and sensitive. This method does not need
sophisticated instrumentation and can use a good array of ligands with a variety of
functional groups containing donor elements, i.e, to extract metal ions. Solvent extraction
of metals is dominated by formation of metal compounds.
During the past decades, much attention has been paid to chemical separation techniques
and the selective determination of heavy metals by solvent extraction. The removal of these
trace heavy metal ions is reported by several solvent extraction methods [67, 68].
Specifically, the assay of mercury compounds has been a challenging problem, not only due
to their widespread agricultural and industrial use, but also because of their hazardous
effects on human health, as explained in section 1.1. For this reason, the development of
new procedures for selective separation and removal of mercury for environmental
remediation has remained an important objective [69] In this context, related studies of

67
liquid-liquid systems have been carried out in the present thesis including thermodynamic
characterization and analytical applications of mercury by pre-concentration using
adsorption on particular solid support.

68
2.2.2. Experimental
2.2.2.1. Chemicals
Nitrate stock solutions of Zn(II), Cd(II), Hg(II) ions were prepared by dissolving in water
weighed amounts of the adducts and their concentrations were checked by back titration
with EDTA. The stock solutions of 9AneS3 were prepared by dissolving in organic solvent
(dodecane and hexane).
2.2.2.2. Liquid-liquid extraction
In an operation of liquid-liquid extraction the solvent A containing the components to
separate, called feed, is put in contact with a solvent B immiscible with A. Figure 21
shows a diagram of the currents involved in the operation. The solution of B with the
components separated is called extract. The solution of A after the extraction is called
refined. Eventually, the refined phase can be concentrated and recycled for successive
extractions in order to eliminate the residual components to separate.
Figure 21 Idealized scheme of operation of liquid-liquid extraction
This simple type of extraction is very useful to study the different parameters that
influence the separation process. Some of these are: pH, analyte concentration, the
concentration of extractant, temperature, effect of co-solvents.
EXTRACTION
FEED (Solvent A + component)
EXTRACT (Solvent B + componenet)
SOLVENT (Solvent B)
REFINED (Solvent A)
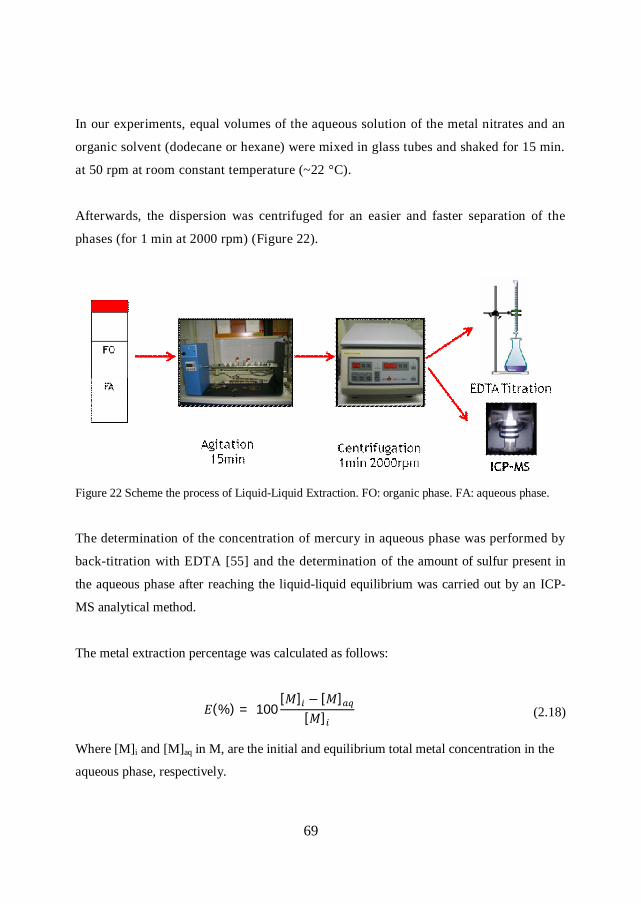
69
In our experiments, equal volumes of the aqueous solution of the metal nitrates and an
organic solvent (dodecane or hexane) were mixed in glass tubes and shaked for 15 min.
at 50 rpm at room constant temperature (~22 °C).
Afterwards, the dispersion was centrifuged for an easier and faster separation of the
phases (for 1 min at 2000 rpm) (Figure 22).
Figure 22 Scheme the process of Liquid-Liquid Extraction. FO: organic phase. FA: aqueous phase.
The determination of the concentration of mercury in aqueous phase was performed by
back-titration with EDTA [55] and the determination of the amount of sulfur present in
the aqueous phase after reaching the liquid-liquid equilibrium was carried out by an ICP-
MS analytical method.
The metal extraction percentage was calculated as follows:
퐸(%) = 100[푀] − [푀]
[푀] (2.18)
Where [M]i and [M]aq in M, are the initial and equilibrium total metal concentration in the
aqueous phase, respectively.
70
2.2.2.3. Analytical test to verify the formation and stability of aqueous Hg(II)-
9AneS3 complex
In order to verify both the formation and stability of Hg(II)-9AneS3 complex in aqueous
solution, the following test were carried out:
Test 1. Few mg of 9AneS3 was deposit in two vials. In one, 5 mL of water were
added and 5 mL of a solution of Hg(NO3)2 were added to the other one. Then the
two solutions were sonicated. The results showed that the 9AneS3 of the vial
containing only water had not been dissolved, while the 9AneS3 of the vial
containing a solution of Hg(NO3)2 had completely dissolved, indicating thus the
possible formation of Hg(II)-9AneS3 complexes.
Test 2. An aqueous solution containing only Hg(II) was agitated with a hexane
solution of 9AneS3. After equilibrium, the aqueous solution was analyzed by
using the method of back titration with EDTA that determined a portion of the
initial Hg(II) which corresponds to the aqueous Hg(II) non complexed by 9AneS3
ligand.
Test 3. Finally, H2O2 was added to the dissolved sample obtained from Test 2 in
order to break the complex formed between Hg and 9AneS3. A posterior EDTA
back titration revealed all Hg(II) to be non complexed, verifying thus the
corresponding destruction of the previously formed complex.
2.2.2.4. Adsorption on cellulose and polyurethane sponge
The goal is to impregnate the sponge with the ligand and after passing a solution
containing the metal. This technique allows concentrating the sample and allows
determining the concentration of metal by XRF easily.
71
The experiment proceeded as follows:
1. Cleaning of the sponge with 20 mL of water and 10 mL of hexane.
2. Drying the sponge to constant weight in the oven.
3. Measuring the metal content of the sponge with FP-XRF.
4. Impregnation of the sponge with 20 mL of a 0,251 mM solution of 9AneS3.
The sponge is placed in a 10 mL syringe and 5mL are taken each time.
5. Drying the sponge to constant weight in the oven.
6. Measuring the metal content of the sponge with FP-XRF.
7. Following the impregnation at procedure 4, using in this case 20 mL of
Hg(NO3)2 solution (0,03 mM).
8. Drying in a desiccator to constant weight.
9. Measuring the metal content of the sponge with FP-XRF.
2.2.2.5. Analytical methods to determine metal concentration
2.2.2.5.1. Determination with EDTA. Back titration
The back titration is useful for analysis of cations that form very stable complexes with
EDTA and for which there is available an adequate indicator [55]. The back titration
involves adding to the sample a known amount of EDTA. Subsequently, the excess of
EDTA is titrated with a solution of ZnCl2, using hexamine buffer at pH = 6 and
Xylenol Orange as indicator. In our case, the concentration of mercury before and after
the liquid-liquid extraction has been determined by this method. This is possible because
the HgEDTA complex is more stable (logβ1 = 21.5) [70] than the ZnEDTA complex (logβ1
= 16,26) [71] to avoid displacement of the Hg(II) ion and free EDTA is only complexed.
Corresponding process equations (charges omitted) are:
퐻푔+ 퐸퐷푇퐴 → 퐻푔퐸퐷푇퐴+ 퐸퐷푇퐴( ) (2.19)
퐸퐷푇퐴( ) + 푍푛 → 푍푛퐸퐷푇퐴 (2.20)
72
2.2.2.5.2. Inductively coupled plasma mass spectrometry (ICP-MS)
The radiofrequency generator of solid state of the ExCell PQ model [72] operates at
27.12 MHz and can generate a minimum power of 2000 W. Normally, neutralization is
carried out using a concentric nebulizer (Meinhard). The spray chamber is conical ball
impact a Peltier cooled to a temperature of 4 ºC, controlled by software. The diameter
of injector is 1.5 mm. The diameters of the sampling cone and skimmer, made of Ni, is
1 and 0.7 mm respectively.
At pressures of 6x10⁻⁷ mbar, the flow of ions is guided through the lens system
optimized for a potential series, targeted to the quadrupole, where the ions are
discriminated by electric and magnetic field generated in the region bounded by the
quadrupole reconstructed using molybdenum. Once discriminated, the ions are directed
toward the detector. This detector is composed by a system of discrete dynodes
electron multiplication. The dynodes are inside a glass tube of 1 mm internal diameter,
with an inert coating and operation similar to a photomultiplier tube. The combination
of the team autosampler and peristaltic pump is governed by the Plasmalab ® software
(version 1.5)
The liquid samples introduced into the instrument must contain, as a rule, less than
0.2% of dissolved solids for minimized the deposition on the cones (sampling and
skimmer) that includes the interface between the torch and the lens system. Otherwise,
the obturation of the passage of ions through these cones will be favored. On the other
hand, the use of organic solvents requires adjustment of the conditions for maintaining
the plasma. Finally, the acidity of the samples should be limited to 2% (HNO3 and
HCl) and 1% H2SO4, since higher contents can erode the interface.
The calibration is performed using standards prepared from monoelemental and
commercial multielement stock solutions using matrices resulting from the treatment of
the samples for the matrix adjustment. Different internal standards for correction of
instrumental and matrix effects were used, with Li and Sc for low mass, Y, In, Rh or

73
Ga for intermediate mass and Bi or Tl for high mass [73]. In our case, we have used an
internal standard with Rh, In, Ga (5 ppb of each). The majority of selected isotopes
analytes of interest are free of polyatomic isobaric. The analytical determinations were
performed in triplicate including blank procedure, reagents and containers.
The quality of calibration has been verified using external control samples, evaluating
both the calibration and reproducibility of the samples. Instrumental parameters and the
masses used for each element selected characteristics are shown in Table 7 and Table 8
respectively.
Table 7 Instrumental operating conditions. ICP-MS ThermoElemental Pq ExCell.
PARAMETER VALUE
Generator power 1350 W
Generator frequency 27.15 MHz
Integration time 120 s
Ar flow (plasma) 13-15 L·min-1
Ar flow (auxiliary) 0.90-0.95 L·min-1
Nebulizer flow 0.85-0.95 L·min-1
Peristaltic pump flow 2 mL·min-1
Acquisition time 35-55 s
Wash time 85-65 s (HNO3 1%)
mode Peak jump y scan
Mass channels 10
sweeps 100
Time for mass 10000 s
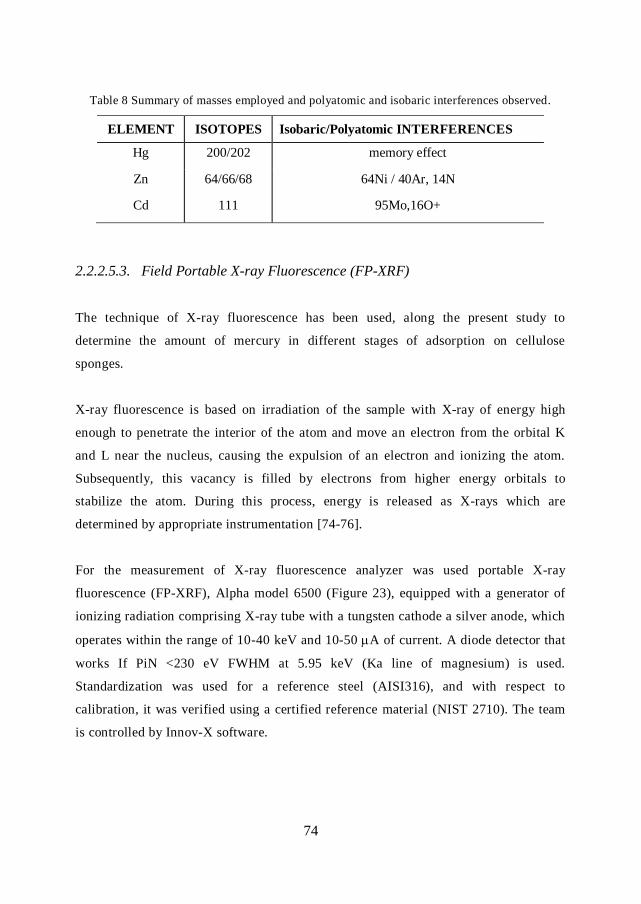
74
Table 8 Summary of masses employed and polyatomic and isobaric interferences observed.
ELEMENT ISOTOPES Isobaric/Polyatomic INTERFERENCES
Hg 200/202 memory effect
Zn 64/66/68 64Ni / 40Ar, 14N
Cd 111 95Mo,16O+
2.2.2.5.3. Field Portable X-ray Fluorescence (FP-XRF)
The technique of X-ray fluorescence has been used, along the present study to
determine the amount of mercury in different stages of adsorption on cellulose
sponges.
X-ray fluorescence is based on irradiation of the sample with X-ray of energy high
enough to penetrate the interior of the atom and move an electron from the orbital K
and L near the nucleus, causing the expulsion of an electron and ionizing the atom.
Subsequently, this vacancy is filled by electrons from higher energy orbitals to
stabilize the atom. During this process, energy is released as X-rays which are
determined by appropriate instrumentation [74-76].
For the measurement of X-ray fluorescence analyzer was used portable X-ray
fluorescence (FP-XRF), Alpha model 6500 (Figure 23), equipped with a generator of
ionizing radiation comprising X-ray tube with a tungsten cathode a silver anode, which
operates within the range of 10-40 keV and 10-50 A of current. A diode detector that
works If PiN <230 eV FWHM at 5.95 keV (Ka line of magnesium) is used.
Standardization was used for a reference steel (AISI316), and with respect to
calibration, it was verified using a certified reference material (NIST 2710). The team
is controlled by Innov-X software.
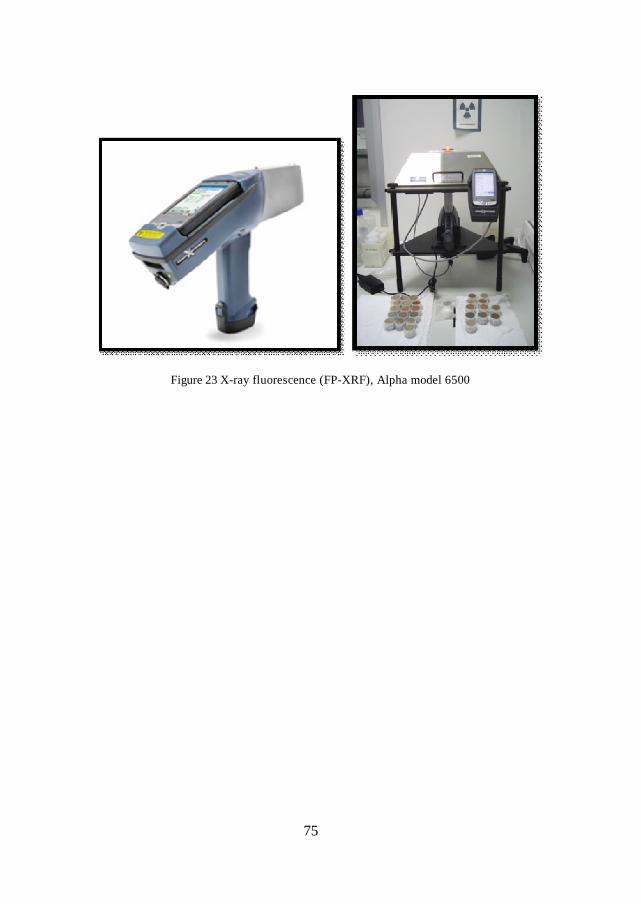
75
Figure 23 X-ray fluorescence (FP-XRF), Alpha model 6500

76
2.2.3. Results and discussion
2.2.3.1. Liquid-liquid extraction
This thesis presents the study of the complex formation between mercury ions in aqueous
phase and the macrocycle 9AneS3 dissolved in hexane as complexing agent. The
motivations of this study have been widely explained in section 1.
As detailed in the experimental section (2.2.2) the formation of Hg(II)-9AneS3 stable
complexes in aqueous solution was verified. This fact produces the extraction of the related
amount of the ligand 9AneS3 from the organic to the aqueous phase. Thus, in this case, the
distribution process between the two phases corresponds to the ligand 9AneS3.
Therefore, the equilibrium reaction of the process occurring can be expressed as:
퐻푔( ) + 푛9퐴푛푒푆3( ) 퐻푔(9퐴푛푒푆3) ( ) (2.21)
Therefore and to express the experimental data, we use the term formation percentage
corresponding to the complexation of mercury in aqueous phase.
The distribution coefficient of the ligand (D) is defined by:
퐷 =[퐿]( )
[퐿]( )=
[퐻푔(9퐴푛푒푆3) ]( )
[9푠푛푒푆3]( ) (2.22)
where [L](aq) and [L](org) (where [L](org) = [L]tot - [L](aq)) are the total concentration of ligand
in aqueous and organic phase, respectively.
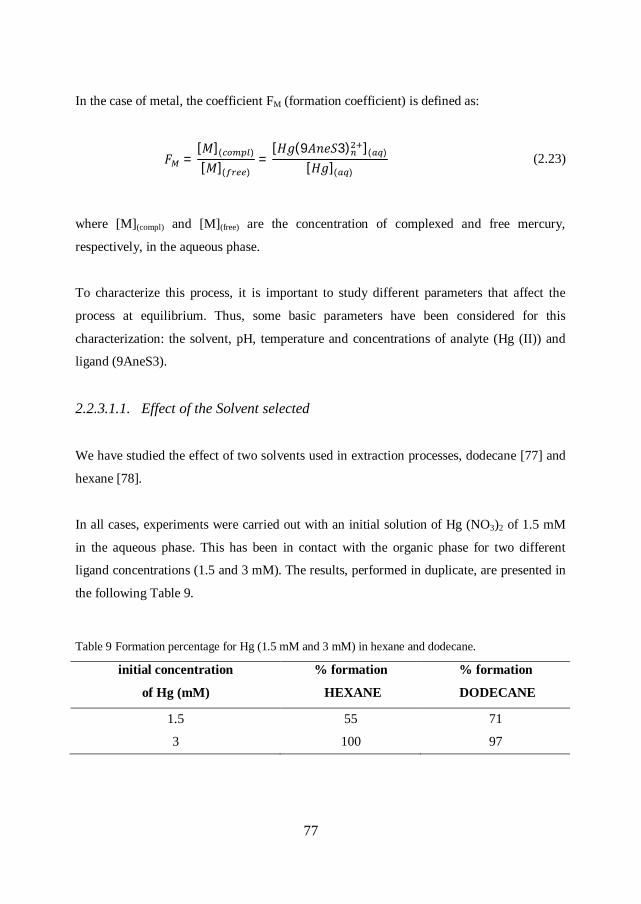
77
In the case of metal, the coefficient FM (formation coefficient) is defined as:
퐹 =[푀]( )
[푀]( )=
[퐻푔(9퐴푛푒푆3) ]( )
[퐻푔]( ) (2.23)
where [M](compl) and [M](free) are the concentration of complexed and free mercury,
respectively, in the aqueous phase.
To characterize this process, it is important to study different parameters that affect the
process at equilibrium. Thus, some basic parameters have been considered for this
characterization: the solvent, pH, temperature and concentrations of analyte (Hg (II)) and
ligand (9AneS3).
2.2.3.1.1. Effect of the Solvent selected
We have studied the effect of two solvents used in extraction processes, dodecane [77] and
hexane [78].
In all cases, experiments were carried out with an initial solution of Hg (NO3)2 of 1.5 mM
in the aqueous phase. This has been in contact with the organic phase for two different
ligand concentrations (1.5 and 3 mM). The results, performed in duplicate, are presented in
the following Table 9.
Table 9 Formation percentage for Hg (1.5 mM and 3 mM) in hexane and dodecane.
initial concentration
of Hg (mM)
% formation
HEXANE
% formation
DODECANE
1.5 55 71
3 100 97
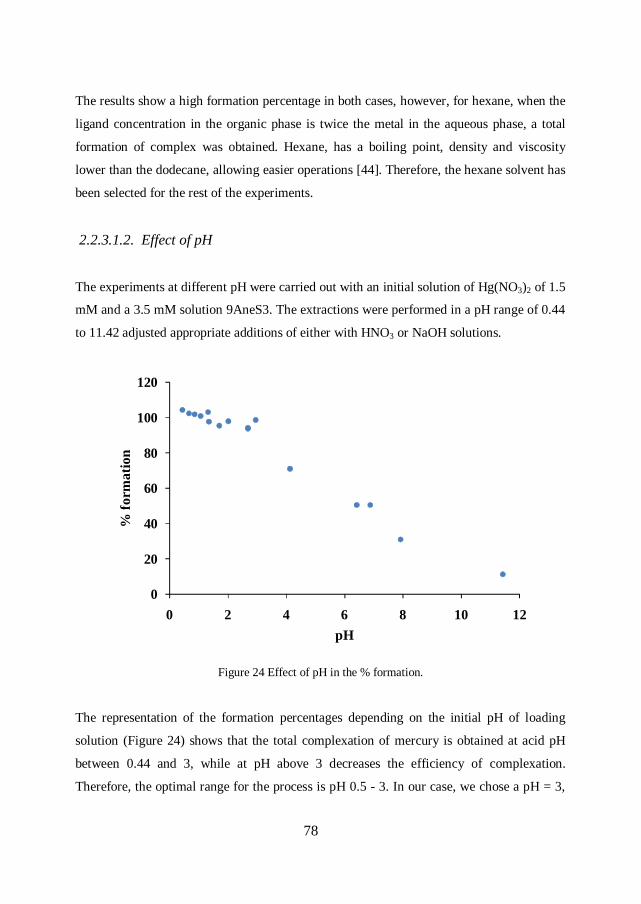
78
The results show a high formation percentage in both cases, however, for hexane, when the
ligand concentration in the organic phase is twice the metal in the aqueous phase, a total
formation of complex was obtained. Hexane, has a boiling point, density and viscosity
lower than the dodecane, allowing easier operations [44]. Therefore, the hexane solvent has
been selected for the rest of the experiments.
2.2.3.1.2. Effect of pH
The experiments at different pH were carried out with an initial solution of Hg(NO3)2 of 1.5
mM and a 3.5 mM solution 9AneS3. The extractions were performed in a pH range of 0.44
to 11.42 adjusted appropriate additions of either with HNO3 or NaOH solutions.
Figure 24 Effect of pH in the % formation.
The representation of the formation percentages depending on the initial pH of loading
solution (Figure 24) shows that the total complexation of mercury is obtained at acid pH
between 0.44 and 3, while at pH above 3 decreases the efficiency of complexation.
Therefore, the optimal range for the process is pH 0.5 - 3. In our case, we chose a pH = 3,
0
20
40
60
80
100
120
0 2 4 6 8 10 12
% fo
rmat
ion
pH
79
because in the working conditions the concentration of mercury nitrate salt has a pH ≈ 3
without need to be further modification.
The observed decrease with pH of the Hg(II)-9AneS3 complex formation can be interpreted
by the related hydrolysis of Hg(II). Thus, competition of OH- ions with 9AneS3 hinders the
related complex formation
2.2.3.1.3. Effect of Temperature
Experiments at different temperatures were performed in an incubator that can regulate the
temperature between 25 and 49 oC. Two replicates were prepared at three temperatures: 25,
40 and 49 oC. Both initial concentrations of mercury and 9AneS3 were 1.5 mM. In these
initial conditions and at room temperature (20-22 °C) complex formation resulted to be
57%.
The results shows the temperature does not affect the complexation of mercury with
9AneS3 within the studied range 25-49 oC. This may suggest that associated formation
enthalpy for this complex is low.
2.2.3.1.4. Effect of concentration of Hg and 9AneS3
A series of experiments were conducted. First, by varying the concentration of 9AneS3 in
hexane with an excess of mercury in the aqueous phase over the 9AneS3 concentration. In
this case, three sets of extractions were carried out with initial concentrations of Hg(NO3)2:
0.7 mM, 1 mM and 1.5 mM respectively. For the different extractions metal concentrations,
the ligand 9AneS3 concentration was varied as 0.49 mM, 1.00 mM, 1.49 mM, 2.02 mM,
2.54 mM, 3.03 mM and 3.51 mM in hexane. In the case of the Hg(NO3)2 concentration of
1.5 mM, the 9AneS3 range was extended to 6 mM, 10 mM, 15 mM and 20 mM.
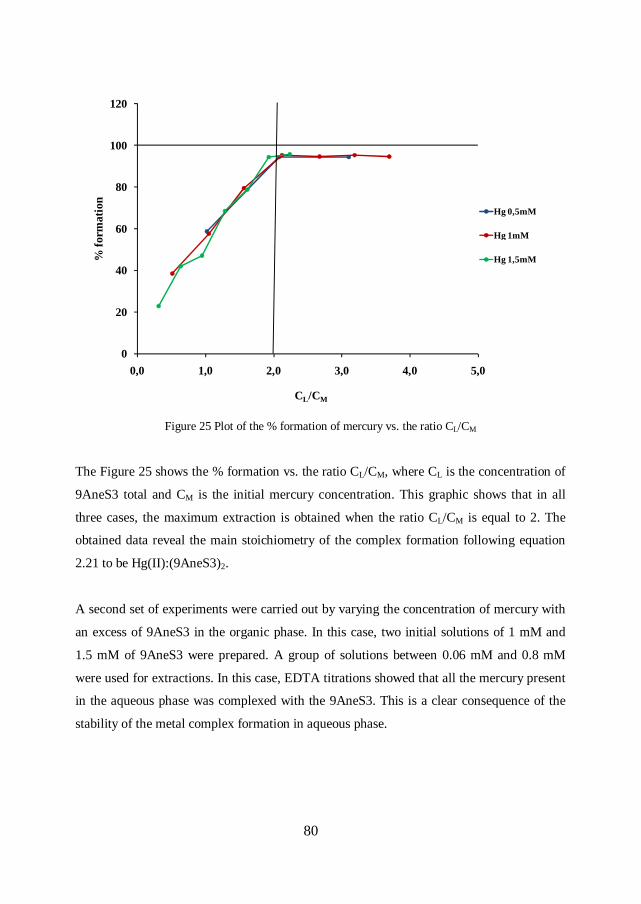
80
Figure 25 Plot of the % formation of mercury vs. the ratio CL/CM
The Figure 25 shows the % formation vs. the ratio CL/CM, where CL is the concentration of
9AneS3 total and CM is the initial mercury concentration. This graphic shows that in all
three cases, the maximum extraction is obtained when the ratio CL/CM is equal to 2. The
obtained data reveal the main stoichiometry of the complex formation following equation
2.21 to be Hg(II):(9AneS3)2.
A second set of experiments were carried out by varying the concentration of mercury with
an excess of 9AneS3 in the organic phase. In this case, two initial solutions of 1 mM and
1.5 mM of 9AneS3 were prepared. A group of solutions between 0.06 mM and 0.8 mM
were used for extractions. In this case, EDTA titrations showed that all the mercury present
in the aqueous phase was complexed with the 9AneS3. This is a clear consequence of the
stability of the metal complex formation in aqueous phase.
0
20
40
60
80
100
120
0,0 1,0 2,0 3,0 4,0 5,0
% fo
rmat
ion
CL/CM
Hg 0,5mM
Hg 1mM
Hg 1,5mM
81
In order to carry out a more accurate identification of the formed metal complexes and to
quantify the related stability of the species formed, a numerical treatment of the
experimental data was carried out by using the LETAGROP-DISTR program. In this
concern and to directly ascertain the observed distribution of the ligand 9AneS3,
determination of the amount of sulfur present in the aqueous phase after reaching the
liquid-liquid equilibrium was carried out by an ICP-MS analytical method. Thus,
quantitative distribution of 9AneS3 in the aqueous phase was attained.
2.2.3.2. Determination of complex formation constants in aqueous solution from
two phases experimental data
Analysis of the experimental data obtained in the distribution equilibrium studies were
evaluated using the computer program LETAGROP-DISTR [79]. This program searches
for the best equilibrium constant that minimized the error squares sum, defined by:
푈 = 푙표푔퐷 − 푙표푔퐷 (2.24)
Where Dexp is the distribution coefficient determined experimentally and Dcalc is the value
calculated by the program. This program also calculates the standard deviation (logD)
defined by:
휎(푙표푔퐷) =푈푁 (2.25)
Where NP is the number of experimental points.
Analysis of solvent extraction data by LETAGROP-DISTR have shown the formation of
1:2 and in less extent 1:3 of Hg(II):9AneS3 aqueous complexes.
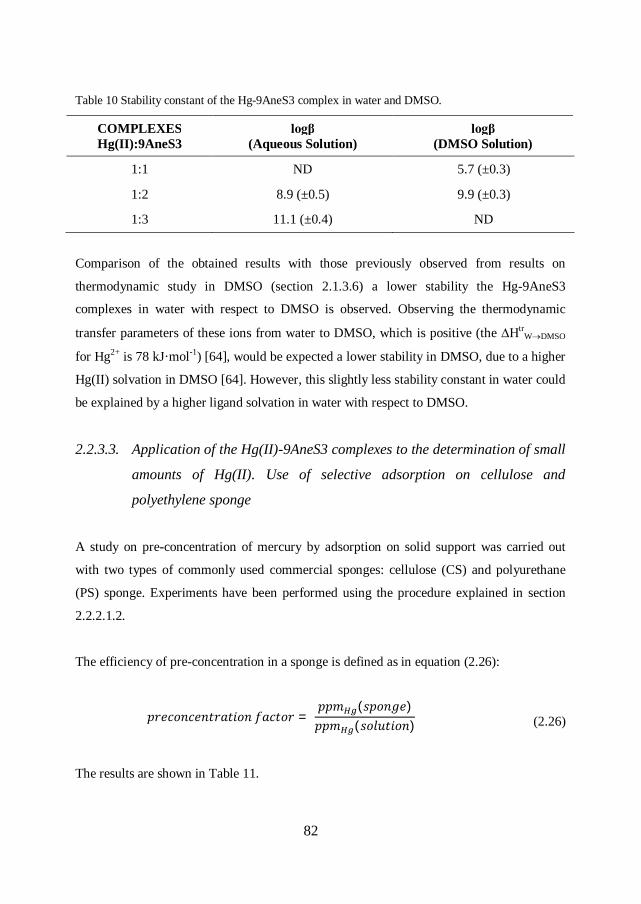
82
Table 10 Stability constant of the Hg-9AneS3 complex in water and DMSO.
COMPLEXES Hg(II):9AneS3
logβ (Aqueous Solution)
logβ (DMSO Solution)
1:1 ND 5.7 (±0.3)
1:2 8.9 (±0.5) 9.9 (±0.3)
1:3 11.1 (±0.4) ND
Comparison of the obtained results with those previously observed from results on
thermodynamic study in DMSO (section 2.1.3.6) a lower stability the Hg-9AneS3
complexes in water with respect to DMSO is observed. Observing the thermodynamic
transfer parameters of these ions from water to DMSO, which is positive (the ∆HtrWDMSO
for Hg2+ is 78 kJ·mol-1) [64], would be expected a lower stability in DMSO, due to a higher
Hg(II) solvation in DMSO [64]. However, this slightly less stability constant in water could
be explained by a higher ligand solvation in water with respect to DMSO.
2.2.3.3. Application of the Hg(II)-9AneS3 complexes to the determination of small
amounts of Hg(II). Use of selective adsorption on cellulose and
polyethylene sponge
A study on pre-concentration of mercury by adsorption on solid support was carried out
with two types of commonly used commercial sponges: cellulose (CS) and polyurethane
(PS) sponge. Experiments have been performed using the procedure explained in section
2.2.2.1.2.
The efficiency of pre-concentration in a sponge is defined as in equation (2.26):
푝푟푒푐표푛푐푒푛푡푟푎푡푖표푛 푓푎푐푡표푟 = 푝푝푚 (푠푝표푛푔푒)푝푝푚 (푠표푙푢푡푖표푛) (2.26)
The results are shown in Table 11.
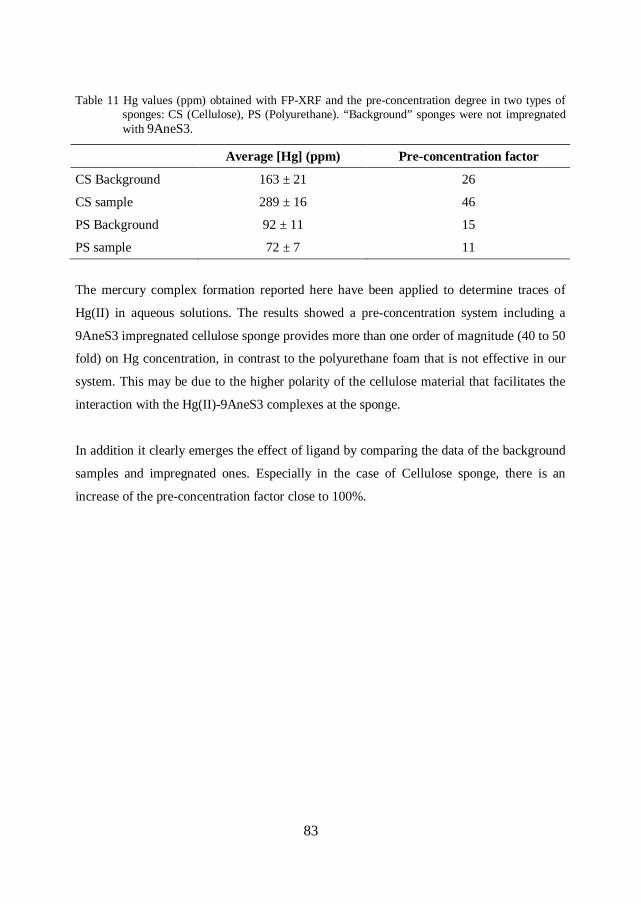
83
Table 11 Hg values (ppm) obtained with FP-XRF and the pre-concentration degree in two types of sponges: CS (Cellulose), PS (Polyurethane). “Background” sponges were not impregnated with 9AneS3.
Average [Hg] (ppm) Pre-concentration factor
CS Background 163 ± 21 26
CS sample 289 ± 16 46
PS Background 92 ± 11 15
PS sample 72 ± 7 11
The mercury complex formation reported here have been applied to determine traces of
Hg(II) in aqueous solutions. The results showed a pre-concentration system including a
9AneS3 impregnated cellulose sponge provides more than one order of magnitude (40 to 50
fold) on Hg concentration, in contrast to the polyurethane foam that is not effective in our
system. This may be due to the higher polarity of the cellulose material that facilitates the
interaction with the Hg(II)-9AneS3 complexes at the sponge.
In addition it clearly emerges the effect of ligand by comparing the data of the background
samples and impregnated ones. Especially in the case of Cellulose sponge, there is an
increase of the pre-concentration factor close to 100%.
84
3. Constants of formation of lanthanide with BTPA in AN
3.1. Introduction
Lanthanide compounds have been extensively used in the last decades as luminescent
chemosensors, for medical diagnostics and optical cell imaging, contrast reagents for
magnetic resonance imaging, shift reagents for NMR spectroscopy, as well as for
applications in fundamental and applied science such as organic synthesis, bioorganic
chemistry, catalysis. These applications were favoured by the increased knowledge of
fundamental properties (electronic, spectroscopic, thermodynamic, magnetic,
structural) of the elements, achieved as a consequence of the rapid development of
academic studies on the lanthanide coordination chemistry during the last three
decades. In addition, Ln3+ show chemical properties very similar to those of
actinides(III) (An3+). This chemical similitude is a challenging problem in the
separation of An3+ from excess of Ln3+ in the nuclear waste treatments [80].
As common property the trivalent lanthanide ions [81] are hard species. Hardness
increases somewhat with higher atomic number. Moving from left to right across the
period (increasing atomic number), the radius of each Ln3+ ion steadily decreases. This
is referred to as 'lanthanide contraction'. They are typical hard Lewis acids and the
bonding in their complexes is electrostatic and non-directional. As a result, steric
factors govern the coordination geometry of lanthanide complexes. Coordination
numbers are generally high (greater than 6, usually 8 or 9 or as high as 12) and
coordination geometries are often irregular. Low coordination numbers can be achieved
with very bulky ligands [82].
The unusual spectroscopic properties of the Ln(III) cations results from shielding of the
4f orbitals by the filled 5s2 and 5p6 sub-shells. For example, each of the elements have
very characteristic and very narrow emission bands, mostly in the visible and near
infrared range. Additionally, these f-f transitions are parity (and sometimes also spin)
forbidden, resulting in very long lived excited states, with typical luminescence

85
lifetimes on the micro- to millisecond timescale. These long lifetimes facilitate 'time-
gated' emission experiments which result in drastic improvement in signal to noise
ratios compared with more traditional steady-state measurements by removing short
lived (eg. protein) emission and scattered excitation.
Unfortunately, as consequence of the parity forbidden nature of the 4f transitions, the
direct absorption of Ln(III) cations is only very weak, and they hence have very low
molar absorption coefficients which limits their practical usage. In order to circumvent
these low extinction coefficients, the luminescent metal ion can be chelated to a
chromophore-containing group which functions as an 'antenna,' absorbing incident light
then transferring this excitation to the metal ion, which can then deactivate by
undergoing its typical luminescent emission. In addition to directing energy to the
metal, chelation also serves to exclude solvent molecules from the first coordination
sphere, which is essential to avoid quenching of the lanthanide luminescence through
non-radiative decay via vibronic coupling to vibrational states of O-H and N-H bonds,
and also to provide stable metal complexes.
Aza-aromatic bases are widely used in lanthanide coordination chemistry for improving
the kinetic stability and photophysical properties of the complexes [83]. In that case,
the nitrogen ligand acts as a chromophore which permits effective sensitisation of the
lanthanide-centred luminescence.
Some interest for Ln(III) complex formation with heteroaromatic ligands emerged in
recent years for the selective complexation of An(III) over Ln(III) by organic
molecules, as it seems to be promising for the partitioning of minor actinides from
lanthanides, which remains a difficult task in the reprocessing of nuclear wastes
because of the close analogies between the chemical properties of these trivalent ions.
Examples of ligands studied in recent years are reported in Figure 26 terpyridine
(Terpy) derivatives, BTP-family and tripodal ligands (TPA, TPZA) [83]. Due to the
generally low solubility of these compounds in water most studies are carried out in
organic solvent or mixtures. Despite this widespread interest, very little is known about
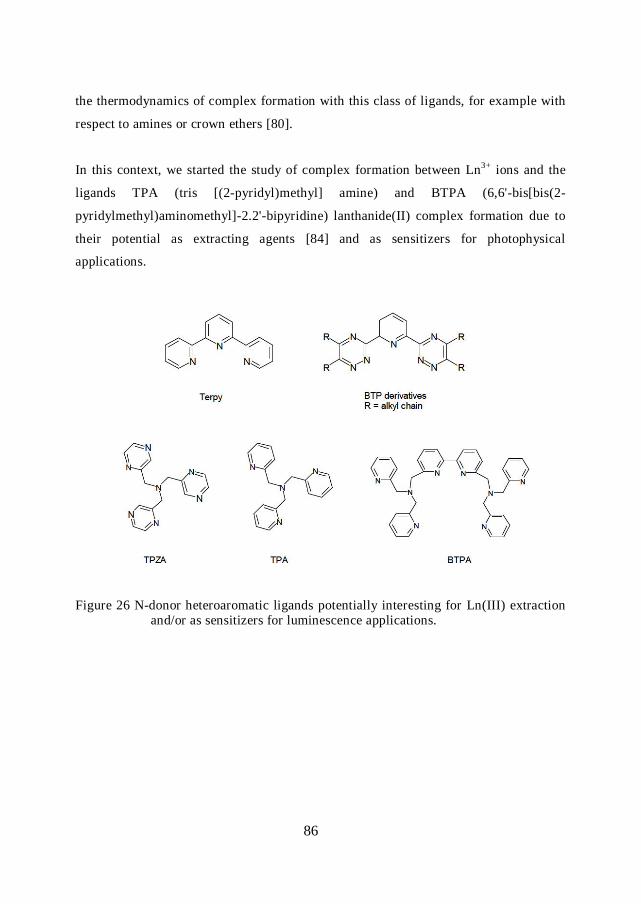
86
the thermodynamics of complex formation with this class of ligands, for example with
respect to amines or crown ethers [80].
In this context, we started the study of complex formation between Ln3+ ions and the
ligands TPA (tris [(2-pyridyl)methyl] amine) and BTPA (6,6'-bis[bis(2-
pyridylmethyl)aminomethyl]-2.2'-bipyridine) lanthanide(II) complex formation due to
their potential as extracting agents [84] and as sensitizers for photophysical
applications.
Figure 26 N-donor heteroaromatic ligands potentially interesting for Ln(III) extraction and/or as sensitizers for luminescence applications.
87
3.2. Experimental
3.2.1. Chemicals
Adducts of lanthanide triflate Ln(CF3SO3)3 were purchased from Sigma Aldrich and dried
under vacuum at 90 °C for 2 weeks in presence of P2O5. TPA was prepared according to the
described procedure [85]. The BTPA ligand [86] has been received from prof. A. Døssing
of Copenhagen University. Acetonitrile (Sigma-Aldrich >99%) ware purified by distillation
and stored in glove box in presence of molecular sieves [54]. Triflate stock solutions of
Ln3+ (Ln = La, Pr, Nd, Eu, Gd, Tb, Ho, Er, Tm, Yb and Lu) ions and BTPA ligand were
prepared by dissolving in anhydrous degassed AN and stored in a glove box under
rigorously anhydrous conditions (see section 2.1.2.1).
Only the heavy (Dy-Lu) lanthanide triflates are soluble (S>150 mM) in strictly
anhydrous conditions in AN, while the solubility of the lighter triflates decreases
greatly as the atomic weight of the lanthanide decreases [87]. These latter salts are
moderately soluble when the water-to-lanthanide(III) concentration ratios are relatively
high but their solubilities decrease drastically as water is removed from the solution.
We verified that heavier lanthanides have low solubility in AN as only stock solutions
of Ln(III) triflates with concentrations 0.8 < CLn < 2.5 mM for La-Nd.
3.2.2. Absorption spectrophotometry
The stability constant for the complexes formed between Ln3+ ion and BTPA were
determined UV-VIS by titrations. Due to the high molar absorption coefficient (ε290 =
15303 dm3·mol-1·cm-1, ε268 = 1528 dm3·mol-1·cm-1) (Figure 27) we worked at BTPA
concentrations <0.05 mM. In addition, at these concentrations, lanthanide triflates are
surely completely dissociated as reported in ref [88].

88
The electronic spectra were recorded with a Varian Cary 50 Spectrophotometer directly
inside the glove box using optic fiber probes and a quartz cuvette with a pathlength of
1 cm.
In a typical experiment, a total of 1 mL of Ln3+ solution (additions of 0.1 or 0.05 mL)
is added to 2.5 mL of BTPA solution. The ligand BTPA (2.5·10-5 M < CBTPA < 5.0·10-5
M) has been titrated with Ln3+ solution at least twice. The spectral range 250-400 nm
has been recorded after each addition with a scan rate 120 nm/min and data interval of
2 nm. The stability constants calculations were performed using the program HypSpec.
[56]
A preliminary test where TPA ligand (0.1 mM) was titrated with a solution of Lu3+ ion (2
mM) showed that there is no significant change in the initial spectrum. Therefore, we
concluded that at these low concentrations the complex is not sufficiently stable to be
formed in a significative amount. Further work is in progress on this topic.

89
3.3. Results and discussion
In order to study the formation of complexes between Ln(III) ions and a N-donor
ligand like BTPA or TPA in AN it is necessary to work in strict anhydrous conditions.
They, in fact, are preferentially solvated by water even in AN containing small
quantities of water [87]. The presence of water is less problematic in other aprotic
solvents like DMSO or DMF (N,N-dimethylformamide), but preliminary experiments
showed that no complex formation occurs in these media. Evidently, Ln(III) ions are
strongly solvated and the formation of a stable species does not occur at the accessible
experimental conditions (due to the solubility of the ligand). This strong solvent effect
can be well understood if the equilibrium in eq. (2.16) is considered: if the solvent
molecules are tightly bound to the metal ion, the N-donor ligand is not able to compete
with them for the coordination sites.
In anhydrous AN, it has been demonstrated that Ln(trif)3 salts are completely
dissociated at concentrations lower than 5·10−5 M [88]. For this reason, the titration for
each lanthanide has been carried out at the lowest Ln(II) concentration possible and
avoiding the presence of undissociated salt in solution. This concentration range is
however optimal for spectrophotometric titrations as the spectra of BTPA and of its
complexes is quite high (Figure 27). In addition, to avoid ion association, no ionic
medium was used.
As an example in Figure 28 are reported the spectral changes relative to the titration of
BTPA (3.5·10-5 M) with Nd3+ (1.6·10-4 M). The absorption spectrum of BTPA consists
of several bands, the maximum at 290 nm is attributed to the bipyridine chromophore
and those at 262 and 268 nm to pyridine chromophores [89]. As the titration
progresses, increasing the concentration of lanthanide, and therefore the amount of
complex formed, a new band appears at higher wavelengths (with a maximum at 320
nm).

90
Figure 27 Molar absorption coefficient spectrum of BTPA and NdBTPA3+.
Figure 28 Example of titration of BTPA solution [3.5·10-5 M] with Nd(III) triflate solution [1.6·10-4 M] in AN.
0
2000
4000
6000
8000
10000
12000
14000
16000
18000
250 270 290 310 330 350 370 390
ε
(nm)
BTPANdBTPA
0
0,1
0,2
0,3
0,4
0,5
0,6
250 270 290 310 330 350 370 390
A
(nm)
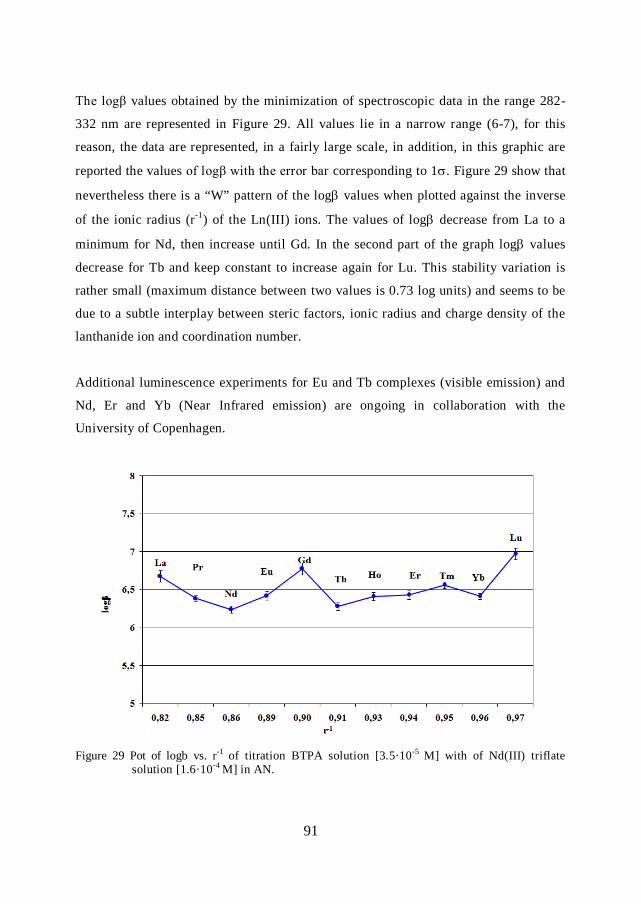
91
The logβ values obtained by the minimization of spectroscopic data in the range 282-
332 nm are represented in Figure 29. All values lie in a narrow range (6-7), for this
reason, the data are represented, in a fairly large scale, in addition, in this graphic are
reported the values of logβ with the error bar corresponding to 1. Figure 29 show that
nevertheless there is a “W” pattern of the log values when plotted against the inverse
of the ionic radius (r-1) of the Ln(III) ions. The values of log decrease from La to a
minimum for Nd, then increase until Gd. In the second part of the graph log values
decrease for Tb and keep constant to increase again for Lu. This stability variation is
rather small (maximum distance between two values is 0.73 log units) and seems to be
due to a subtle interplay between steric factors, ionic radius and charge density of the
lanthanide ion and coordination number.
Additional luminescence experiments for Eu and Tb complexes (visible emission) and
Nd, Er and Yb (Near Infrared emission) are ongoing in collaboration with the
University of Copenhagen.
Figure 29 Pot of logb vs. r-1 of titration BTPA solution [3.5·10-5 M] with of Nd(III) triflate
solution [1.6·10-4 M] in AN.

92
Table 12 Logβ and standard deviations values for the LnBTPA3+ complex in AN
Ln(III) logβ 1ߪ
La 6.68 0.08
Pr 6.38 0.04
Nd 6.24 0.05
Eu 6.42 0.06
Gd 6.78 0.08
Tb 6.28 0.05
Ho 6.41 0.05
Er 6.43 0.06
Tm 6.56 0.04
Yb 6.41 0.04
Lu 6.97 0.07

93
4. Conclusions
Considering the objectives stated in section 1.3 of this thesis and the studies carried
out, the results obtained are a contribution to the comprehension of thermodynamics of
complexation of metal cations relevant for extraction and pre-concentration processes.
First, a thermodynamic study of complex formation between a set of linear and cyclic
thioethers with heavy metals (Ag(II), Zn(II), Cd(II) and Hg(II) has been carried out.
The results of these studies indicate that:
The linear and cyclic thioethers give strong soft-soft interaction with Hg(II)
resulting in highly enthalpy stabilized complexes in AN. A marked selectivity
with respect to the soft ion Ag(I) ion is found. With respect to Zn(II) and
Cd(II), only formation complex with 9AneS3 and 12AneS4 has been observed,
being always much less stable than those formed with Hg(II) and Ag(I).
The polarographic measurements show the formation of complexes (1:1)
between the mercury and all ligands, except 9AneS3, which is observed in
complex formation (1:2) under the conditions of the work.
In DMSO the stability of the complexes formed by the two metal ions are
closer and more exothermic for Ag(I). In any case a decrease in stability is
observed with respect to AN. In addition, no formation of complexes with
Zn(II) and Cd(II) is observed.
Theoretical calculations show that the high selectivity of 9AneS3 for Hg(II) in
AN is originated by a combined coordination/solvation energetics rather than
by an intrinsic higher affinity of Hg(II) for 9AneS3. Also the effects of
different solvation media, AN and DMSO, are correctly reproduced.
94
Secondly, the Hg(II)-9AneS3 complexes have been characterized by liquid-liquid
distribution processed. In addition, application of the related results to analytical
determinations have been carried out by pre-concentration experiments via adsorption
sponge supports. The main results were:
Preliminary studies of the parameters that affect the extraction processes
summarize the following conclusions:
No transfer of Hg(II) is observed to organic phase when using 9Anes3
as extractant, rather the formation of metal complexes in aqueous
solution is found;
The optimum pH range for complex formation is between 0.5 to 3.
The temperature does not affect these liquid-liquid processes.
The experiments by varying of Hg concentrations and 9AneS3 have
shown that total Hg(II) complex formation occurs when the ratio
CL/CM is equal or over 2, indicating the preferent complex
stoichiometry Hg:9AneS3 of 1:2.
On the other hand, these studies have shown that complex formation occurs in
the aqueous phase. This is important information that has allowed to determine
the formation constants of Hg-9AneS3 complexes in water, observing a
preferent 1:2 complex and, in less extent the complex 1:3.
The values obtained for the formation constants of Hg-9AneS3 complexes by
the liquid-liquid distribution studies correlate with those obtained by other
techniques used in the present thesis.
The use of cellulose common sponge as adsorbent support, impregnated with a
solution of the 9AneS3 in hexane, highly increases the pre-concentration of
mercury with respect to the untreated sponge. In addition, it has been shown
95
that for Hg(II) pre-concentration, common cellulose sponge is more efficient
than the polyurethane sponge.
Finally, the study regarding to the formation of complexes between lanthanides and
BTPA indicate that:
The preliminary studies for the determination of formation constants of
lanthanide-complex BTPA by UV-Vis spectroscopy show that all lanthanides
present a narrow log1 range (6-7), indicating a poor selectivity for different
lanthanides. However, log1 values present an interesting “W” shaped trend
which is likely due to a subtle interplay of steric, solvational and electronic
factors.

96
Bibliography
1. P. Holmes, K. A. F. James, L. S. Levy, Sci. Total Environ., 408 (2009) 171-182.
2. G. J. Grant, M. E. Botros, J. S. Hassler, D. E. Janzen, C. A. Grapperhaus, M. G. O'Toole, D. G. Vanderveer, Polyhedron, 27 (2008) 3097-3104.
3. M. L. Helm, C. M. Combs, D. G. Vanderveer, G. J. Grant, Inorg. Chim. Acta, 338 (2002) 182-188.
4. V. Mah, F. Jalilehvand, J. Biol. Inorg. Chem., 13 (2008) 541-553.
5. F. M. Rubino, M. Pitton, G. Brambilla, A. Colombi, J. Mass. Spectrom., 41 (2006) 1578-1593.
6. G. A. Neville, T. Drakenberg, Can. J. Chem., 52 (1974) 616-622.
7. V. Mah, F. Jalilehvand, J. Biol. Inorg. Chem., 15 (2010) 441-458.
8. A. Hartwig, M. Asmuss, H. Blessing, S. Hoffmann, G. Jahnke, S. Khandelwal, A. Pelzer, A. Burkle, Food. Chem. Toxicol., 40 (2002) 1179-1184.
9. M. M. Brzoska, J. Moniuszko-Jakoniuk, Food. Chem. Toxicol., 39 (2001) 967-980.
10. C. A. Blindauer, J. Biol. Inorg. Chem., 16 (2011) 1011-1024.
11. W. E. Rauser, Annu. Rev. Biochem., 59 (1990) 61-86.
12. M. J. Stillman, Coordin. Chem. Rev., 144 (1995) 461-511.
13. M. Shamsipur, M. H. Mashhadizadeh, Sep. Purif. Technol., 20 (2000) 147-153.
14. M. Shamsipur, O. R. Hashemi, V. Lippolis, J. Mater. Sci., 282 (2006) 322-327.
15. J. R. Morones, J. L. Elechiguerra, A. Camacho, K. Holt, J. B. Kouri, J. T. Ramirez, M. J. Yacaman, Nanotechnology, 16 (2005) 2346-2353.
16. Z. J. Jiang, C. Y. Liu, L. W. Sun, J. Phys. Chem. B, 109 (2005) 1730-1735.
17. A. Bianchini, K. C. Bowles, C. J. Brauner, J. W. Gorsuch, J. R. Kramer, C. M. Wood, Environ. Toxicol. Chem., 21 (2002) 1294-1300.

97
18. P. L. Drake, K. J. Hazelwood, Ann. Occup. Hyg., 49 (2005) 575-585.
19. P. Nagajyoti, K. Lee, T. Sreekanth, V, Environ. Chem. Lett., 8 (2010) 199-216.
20. X. Li, R. Z. Liao, W. Zhou, G. Chen, Phys. Chem. Chem. Phys., 12 (2010) 3961-3971.
21. M. Belcastro, T. Marino, N. Russo, M. Toscano, J. Inorg. Biochem., 103 (2009) 50-57.
22. M. Belcastro, T. Marino, N. Russo, M. Toscano, J. Mass. Spectrom., 40 (2005) 300-306.
23. S. P. Fricker, Chem. Soc. Rev., 35 (2006) 524-533.
24. P. Babula, V. Adam, R. Opatrilova, J. Zehnalek, L. Havel, R. Kizek, Environ. Chem. Lett., 6 (2008) 189-213.
25. H. Ilkhani, M. R. Ganjali, M. Arvand, M. S. Hejazi, F. Azimi, P. Norouzi, Int. J. Biol. Macromol., 49 (2011) 1117-1123.
26. J. Rocha, L. D. Carlos, F. A. Almeida Paz, D. Ananias, Chem. Soc. Rev., 40 (2011) 926-940.
27. J. F. Carpentier, S. M. Guillaume, E. Kirillov, Y. Sarazin, C. R. Chim., 13 (2010) 608-625.
28. S. A. El-Safty, J. Mater. Sci., 44 (2009) 6764-6774.
29. D. M. Roundhill, Extraction of metals from soils and waters, Kluwer Academic/Plenum Publishers, United States, 2001.
30. K. Saito, I. Taninaka, Y. Yamamoto, S. Murakami, A. Muromatsu, Talanta, 51 (2000) 913-919.
31. A. Nezhadali, N. Rabani, Chinese Chem. Lett., 22 (2011) 88-92.
32. A. L. Ahmad, A. Kusumastuti, C. J. C. Derek, B. S. Ooi, Chem. Eng. J., 171 (2011) 870-882.
33. M. Shamsipur, G. Azimi, M. H. Mashhadizadeh, S. S. Madaeni, Anal. Sci., 17 (2001) 491-494.
98
34. P. K. Mohapatra, D. S. Lakshmi, D. Mohan, V. K. Manchanda, J. Mater. Sci., 232 (2004) 133-139.
35. N. S. Rathore, J. V. Sonawane, A. Kumar, A. K. Venugopalan, R. K. Singh, D. D. Bajpai, J. P. Shukla, J. Mater. Sci., 189 (2001) 119-128.
36. R. Gueell, E. Antico, V. Salvado, C. Fontas, Sep. Purif. Technol., 62 (2008) 389-393.
37. R. G. Pearson, J. Am. Chem. Soc., 85 (1963) 3533-3539.
38. R. G. Parr, R. G. Pearson, J. Am. Chem. Soc., 105 (1983) 7512-7516.
39. Msrtell A. E., Hancock R. D., Metal Complexes in Aqueous Solutions. 1996, Plenum Press, New York.
40. M. L. Helm, L. L. Hill, J. P. Lee, D. G. Van Derveer, G. J. Grant, Dalton Trans., (2006) 3534-3543.
41. M. L. Helm, G. P. Helton, D. G. Vanderveer, G. J. Grant, Inorg. Chem., 44 (2005) 5696-5705.
42. F. J. C. Rossotti, H. Rossotti, The determination of stability constants: and other equilibrium constants in solution, McGraw-Hill, USA, 1961.
43. P. Atkins, J. D. Paula, Atkins' Physical Chemistry, W H Freeman & Co, United States, 2006.
44. Y. Marcus, The properties of solvents, John Wiley and Sons Australia, United Kingdom, 1998.
45. P. Di Bernardo, A. Melchior, R. Portanova, M. Tolazzi, P. L. Zanonato, Coordin. Chem. Rev., 252 (2008) 1270-1285.
46. G. J. Grant, Structure and Bonding, 120 (2006) 107-141.
47. F. Baumann, G. Reynolds, Chem. Commun., (1998) 1637-1638.
48. M. Mameli, V. Lippolis, C. Caltagirone, J. Luis Capelo, O. Nieto Faza, C. Lodeiro, Inorg. Chem., 49 (2010) 8276-8286.
49. M. L. Helm, D. G. Vanderveer, G. J. Grant, J. Chem. Crystallogr., 33 (2003) 625-630.
99
50. J. Ishikawa, H. Sakamoto, M. Nakamura, K. Doi, H. Wada, J. Chem. Soc. , Dalton Trans., (1999) 191-199.
51. M. R. Ganjali, A. Rouhollahi, A. R. Mardan, M. Shamsipur, J. Chem. Soc. , Faraday Trans., 94 (1998) 1959-1962.
52. R. Alberto, W. Nef, A. Smith, T. A. Kaden, M. Neuburger, M. Zehnder, A. Frey, U. Abram, P. A. Schubiger, Inorg. Chem., 35 (1996) 3420-3427.
53. C. Comuzzi, M. Grespan, A. Melchior, R. Portanova, M. Tolazzi, Eur. J. Inorg. Chem., (2001) 3087-3094.
54. A. Cassol, P. Di Bernardo, P. Zanonato, R. Portanova, M. Tolazzi, J. Chem. Soc. , Dalton Trans., (1987) 657-659.
55. A. I. Vogel, G. H. Jeffery, Vogel's textbook of quantitative chemical analysis, Longman Scientific & Technical, England, 1989.
56. P. Gans, A. Sabatini, A. Vacca, Talanta, 43 (1996) 1739-1753.
57. J. O. Hill, G. Öjelund, I. Wadsö, J. Chem. Thermodyn., 1 (1969) 111-116.
58. P. Gans, A. Sabatini, A. Vacca, J. Solution Chem., 37 (2008) 467-476.
59. J.Heyrovsky, J.Kuta, Polarography, Academic Press, New York 1966.
60. A. I. Vedernikov, E. N. Ushakov, L. G. Kuz'mina, A. V. Churakov, Y. A. Strelenko, M. Wörner, A. M. Braun, J. A. K. Howard, M. V. Alfimov, S. P. Gromov, J. Phys. Org. Chem., 23 (2010) 195-206.
61. R. P. Zelinski, B. W. Turnquest, E. C. Martin, J. Am. Chem. Soc., 73 (1951) 5521-5523.
62. D. A. Rappoport, W. Z. Hassid, J. Am. Chem. Soc., 73 (1951) 5524-5525.
63. M. J. Frisch, G. W. Trucks, H. B. Schlegel et al., GAUSSIAN 09, Revision A.1, Gaussian, Inc., Wallingford, CT, 2009.
64. S. Ahrland, Pure Appl. Chem., 62 (1990) 2077-2082.
65. O. Akkus, A. Decken, C. Knapp, J. Passmore, J. Chem. Crystallogr., 36 (2006) 321-329.
100
66. Y. Tsutsui, K. Sugimoto, H. Wasada, Y. Inada, S. Funahashi, J. Phys. Chem. A, 101 (1997) 2900-2905.
67. D. M. Roundhill, I. B. Solangi, S. Memon, M. I. Bhanger, M. Yilmaz, Pak. J. Anal. Environ. Chem., 10 (2009) 1-13.
68. F. Fu, Q. Wang, J. Environ. Manag., 92 (2011) 407-418.
69. T. F. Baumann, J. G. Reynolds, G. A. Fox, React. Funct. Polym., 44 (2000) 111-120.
70. C. A. Sharrad, L. Grondahl, L. R. Gahan, J. Chem. Soc. , Dalton Trans., (2001) 2937-2942.
71. T. Suzuki, D. Tiwari, A. Hioki, Anal. Sci., 23 (2007) 1215-1220.
72. Manual VGPQ Excell Traning Manual, 1998. ThermoOptek, Windsford, UK
73. F. Vanhaecke, H. Vanhoe, R. Dams, C. Vandecasteele, Talanta, 39 (1992) 737-742.
74. Manual. Innov-X systems Alpha seriesTM X-Ray fluorescence spectrometers, Innov-X Systems Inc., Woburn, MA, USA, 2005.
75. D. A. Skoog, J. J. Leary, C. A. Blasco, Anáílisis instrumental, McGraw-Hill, 1994.
76. Arnold Klute, Methods of soil analysis, Part 1: Physical and microbiological properties, Agronomy Serie nº9, USA, 1986.
77. C. Fontes, C. Palet, V. Salvador, M. Hidalgo, J. Mater. Sci., 178 (2000) 131-139.
78. M. Oleinikova, C. González, M. Valiente, M. Muñoz, Polyhedron, 18 (1999) 3353-3359.
79. D.H. Liem, Acta Chem. Sacand, 25, 1521 (1971)
80. P. Di Bernardo, A. Melchior, M. Tolazzi, P. L. Zanonato, Coordin. Chem. Rev., 256 (2012) 328-351.
81. A. Braibanti, V. Carunchio, I complessi metallici in soluzione. Reattività ed equilibri, metodologie, applicazioni, Aracne, 1999.
82. D. Parker, R. S. Dickins, H. Puschmann, C. Crossland, J. A. K. Howard, Chem. Rev., 102 (2002) 1977-2010.

101
83. G. Ionova, C. Rabbe, R. Guillaumont, S. Ionov, C. Madic, J. C. Krupa, D. Guillaneux, New J. Chem., 26 (2002) 234-242.
84. R. Wietzke, M. Mazzanti, J. M. Latour, J. Pecaut, P. Y. Cordier, C. Madic, Inorg. Chem., 37 (1998) 6690-6697.
85. G. Anderegg, F. Wenk, Helv. Chim. Acta, 50 (1967) 2330-2332.
86. A. Dossing, A. Hazell, H. Toftlund, Acta. Chem. Scand., 50 (1996) 95-101.
87. P. Di Bernardo, G. R. Choppin, R. Portanova, P. L. Zanonato, Inorg. Chim. Acta, 207 (1993) 85-91.
88. A. F. D. de Namor, S. Chahine, O. Jafou, K. Baron, J. Coord. Chem., 56 (2003) 1245-1255.
89. A. Dossing, H. Toftlund, A. Hazell, J. Bourassa, P. C. Ford, J. Chem. Soc. , Dalton Trans., (1997) 335-339.