thermochemical heat storage for concentrated …/67531/metadc... · phase ii final report for the...
TRANSCRIPT

GA–C27137
THERMOCHEMICAL HEAT STORAGE FOR CONCENTRATED SOLAR POWER
THERMOCHEMICAL SYSTEM REACTOR DESIGN FOR THERMAL ENERGY STORAGE
Phase II Final Report for the period September 30, 2008 through April 30, 2011
by PROJECT STAFF
Prepared for the U.S. Department of Energy under DE-FG36-08GO18145
DATE PUBLISHED: OCTOBER 2011

DISCLAIMER
This report was prepared as an account of work sponsored by an agency of the United States Government. Neither the United States Government nor any agency thereof, nor any of their employees, makes any warranty, express or implied, or assumes any legal liability or responsibility for the accuracy, completeness, or usefulness of any information, apparatus, product, or process disclosed, or represents that its use would not infringe privately owned rights. Reference herein to any specific commercial product, process, or service by trade name, trademark, manufacturer, or otherwise, does not necessarily constitute or imply its endorsement, recommendation, or favoring by the United States Government or any agency thereof. The views and opinions of authors expressed herein do not necessarily state or reflect those of the United States Government or any agency thereof.

GA–C27137
THERMOCHEMICAL HEAT STORAGE FOR CONCENTRATED SOLAR POWER
THERMOCHEMICAL SYSTEM REACTOR DESIGN FOR THERMAL ENERGY STORAGE
Phase II Final Report for the period September 30, 2008 through April 30, 2011
by PROJECT STAFF
Prepared for the U.S. Department of Energy under DE-FG36-08GO18145
GENERAL ATOMICS PROJECT 30314 DATE PUBLISHED: OCTOBER 2011


B. Wong Thermochemical Heat Storage for Concentrated Solar Power, Thermochemical System Reactor Design for Thermal Energy Storage, Phase II Final Report for the period September 30, 2008 through April 30, 2011
General Atomics Report GA–C27137 iii
EXECUTIVE SUMMARY
Thermal energy storage (TES) is an integral part of a concentrated solar power (CSP) system. It enables plant operator to generate electricity beyond on sun hours and supply power to the grid to meet peak demand. Current CSP sensible heat storage systems employ molten salts as both the heat transfer fluid and the heat storage media. These systems have an upper operating tempera-ture limit of around 400°C. Future TES systems are expected to operate at temperatures between 600°C–1000°C for higher thermal efficiencies which should result in lower electricity cost.
To meet future operating temperature and electricity cost requirements, a TES concept utilizing thermochemical cycles (TCs) based on multivalent solid oxides was proposed. The system employs a pair of reduction and oxidation (REDOX) reactions to store and release heat. In the storage step, hot air from the solar receiver is used to reduce the oxidation state of an oxide cation, e.g. Fe3+ to Fe2+. Heat energy is thus stored as chemical bonds and the oxide is “charged”. To discharge the stored energy, the reduced oxide is re-oxidized in air and heat is released. Air is used as both the heat transfer fluid and reactant and no storage of fluid is needed. This project investigated the engineering and economic feasibility of this proposed TES concept. The DOE storage cost and LCOE targets are $15/kWh and $0.09/kWh respectively.
Sixteen pure oxides cycles were identified through thermodynamics calculations and literature information. Data showed the kinetics of re-oxidation of the various oxides to be a key barrier to implementing the proposed concept. A down selection was carried out based on operating temperature, materials costs and preliminary laboratory measurements. Cobalt oxide, manganese oxide and barium oxide were selected for developmental studies to improve their REDOX reaction kinetics.
A novel approach utilizing mixed oxides to improve the REDOX kinetics of the selected oxides was proposed. It partially replaces some of the primary oxide cations with selected secondary cations. This causes a lattice charge imbalance and increases the anion vacancy density. Such vacancies enhance the ionic mass transport and lead to faster re-oxidation. Re-oxidation fraction of Mn3O4 Mn2O3 and CoO Co3O4 was improved by up to 16 fold through the addition of a secondary oxide. However, no improvement was obtained in barium based mixed oxides. In addition to enhancing the short term re-oxidation kinetics, it was found that the use of mixed oxides also help to stabilize or even improve the TES properties after long term thermal cycling. Part of this improvement could be attributed to a reduced grain size in the mixed oxides. Based on the measurement results, manganese-iron, cobalt-aluminum and cobalt-iron mixed oxides have been proposed for future engineering scale demonstration.
Using the cobalt and manganese mixed oxides, we were able to demonstrate charge and discharge of the TES media in both a bench top fixed bed and a rotary kiln-moving bed reactor. Operations of the fixed bed configuration are straight forward but require a large mass flow rate

Thermochemical Heat Storage for Concentrated Solar Power, B. Wong Thermochemical System Reactor Design for Thermal Energy Storage, Phase II Final Report for the period September 30, 2008 through April 30, 2011
iv General Atomics Report GA–C27137
and higher fluid temperature for charging. The rotary kiln makes direct solar irradiation possible and provides significantly better heat transfer but design to transport the TES oxide in and out of the reactor will need to be defined. The final reactor and system design will have to be based on the economics of the CSP plant. A materials compatibility study was also conducted and it identified Inconel 625 as a suitable high temperature engineering material to construct a reactor holding either cobalt or manganese mixed oxides.
To assess the economics of such a CSP plant, a pack bed reactor model was established as a baseline. Measured cobalt-aluminum oxide reaction kinetics were applied to the model and the influences of bed properties and process parameters on the overall system design were investigated. The optimal TES system design was found to be a network of eight fixed bed reactors at 18.75 MWth each with charge and discharge temperatures between 1200°C and 600°C, which provides a constant output temperature of 900°C. The charge and discharge time are 8 hours each respectively. This design was integrated into a process flowsheet of a CSP plant and the system’s economics were determined using AspenPlus and NREL’s solar advisory model. Storage cost is very sensitive to materials cost and was calculated to be based around $40/kWh for cobalt based mixed oxide. It can potentially decrease to $10/kWh based on reduced materials cost on a bulk scale. The corresponding calculated LCOE was between $0.22–0.30/kW-h. The high LCOE is a result of the high charging temperature required in this first design and the cost of cobalt oxide. It is expected that a moving bed reactor using manganese oxide will significantly improve the economics of the proposed concept.
In conclusion, the project has demonstrated the engineering feasibility of using a multivalent solid oxide for TES applications. Preliminary system design and process pathways have been defined. A system based on manganese oxide and a rotary kiln has the potential to meet the DOE economic targets.

B. Wong Thermochemical Heat Storage for Concentrated Solar Power, Thermochemical System Reactor Design for Thermal Energy Storage, Phase II Final Report for the period September 30, 2008 through April 30, 2011
General Atomics Report GA–C27137 v
TABLE OF CONTENTS
EXECUTIVE SUMMARY iii
1. INTRODUCTION 1
1.1 Technical Reports 3
1.2. List of Presentations 4
1.3. List of Publications 4
2. METAL OXIDE SYSTEM SURVEY AND DOWN SELECT 5
2.1 REDOX Oxide Systems Evaluation using HSC Chemistry 5
2.2 Literature Survey on Pure and Mixed Oxide Systems 8
2.2.1 Manganese Oxide 8
2.2.2 Cobalt Oxide 8
2.2.3 Iron Oxides 8
2.2.4 Lead Oxide 9
2.2.5 Antimony Oxide 9
2.2.6 Vanadium Oxide 9
2.2.7 Barium Oxide 9
2.2.8 Copper Oxide 10
2.3 Mixed Metal Oxides 10
2.4 Perovskite Oxides 11
3 CHARACTERIZATION OF TES OXIDE CANDIDATES 13
3.1 Characterization Test Systems 13
3.1.1 Thermogravimetric Analysis 13
3.1.2 Thermal Cyclic System 13
3.1.3 Fixed Bed TES Oxide Test Set Up 14
3.1.4 Rotary Kiln TES Oxide Test System 15
3.2 Pure Oxide Characterization 16
3.2.1 Manganese Oxide 16
3.2.2 Cobalt Oxide 17
3.2.3 Copper Oxide 21
3.2.4 Antimony Oxide 21
3.2.5 Lead Oxide 24
3.2.6 Barium Oxide 24
3.3 Pure Oxide Down Select 24
4 MIXED OXIDE REACTION KINETICS IMPROVEMENT 27
4.1 Mixed Oxide Development 27
4.2.1 Manganese Oxide 28

Thermochemical Heat Storage for Concentrated Solar Power, B. Wong Thermochemical System Reactor Design for Thermal Energy Storage, Phase II Final Report for the period September 30, 2008 through April 30, 2011
vi General Atomics Report GA–C27137
4.2.2 Cobalt Oxides 31
4.2.3 Barium Mixed Oxides 36
5 MATERIALS COMPATIBILITY STUDIES SUMMARY 37
6 KINETICS DATA MEASUREMENT AND PRELIMINARY REACTOR MODELING 39
6.1 Kinetics Data Measurements 39
6.2 Reactor Modeling 41
7 TES SYSTEM ECONOMICS 49
7.1 Oxide Based TES System Flowsheet Evaluation and Economics 49
7.1.1 Oxide Cycle Process Flowsheet 49
7.1.2 Methods for Flowsheet Analysis 50
7.1.3 Costing Example using Cobalt Oxide 53
7.1.4 Recommendations for Future Economic Improvements 56
7.2 Closed Cycle Economics Assessment 56
8 SUMMARY 59
8.1 Project Impact 61
APPENDIX A: PROGRESS REPORT FROM GERMAN AEROSPACE CENTER 65
LIST OF FIGURES
1.1 Process flow diagram schematic of the baseline solid oxide based TES concept 2
1.2 Block diagram showing the key project activities 2
2.1 Periodic table showing oxide of elements that have been evaluated with HSC software
5
2.2 Phase stability diagrams of cobalt oxide-air and nickel oxide-air at ambient pressure
6
2.3 Raw material cost for TES using various oxides 7
3.1 TGA plot of Co3O4 oxide that was heated and cooled at a rate of 1°C/min 14
3.2 Thermal cyclic test system for solid oxides 14
3.3 Set up of an xide packed bed system 15
3.4 Solar rotary kiln reactor 15
3.5 TGA plots of a MnO2 sample cycle between 300°C and 600°C 16
3.6 TGA plot of a MnO2 sample heated up to 1100°C and cooled down in air 17
3.7 TGA plots of a Co3O4 sample heated up to 1100°C and cooled down in air 17
3.8 Co3O4 dissociation and re-oxidation fractions as a function of temperature for heating rates
18
3.9 The temperature profile of a cobalt oxide packed bed system during REDOX reaction
19

B. Wong Thermochemical Heat Storage for Concentrated Solar Power, Thermochemical System Reactor Design for Thermal Energy Storage, Phase II Final Report for the period September 30, 2008 through April 30, 2011
General Atomics Report GA–C27137 vii
3.10 The effect of reduction and re-oxidation temperatures on magnitude of heat release upon re-oxidation of a Co3O4 packed bed
19
3.11 Morphological evolution of a Co3O4 specimen that was cycled between 700°C and 900°C
20
3.12 XRD spectrum of cobalt oxide powder after 500 thermal REDOX cycles 22
3.13 EDX spectrum of Co3O4 powder before and after 500 thermal REDOX cycles 22
3.14 TGA plots of CuO samples heated up to 1100°C and 1200°C and cooled down in air
23
3.15 TGA plot of a Sb2O5 sample heated up to 600°C and cooled down in air 23
3.16 TGA plot of a PbO sample heated up to 650°C and cooled down in air 23
3.17 TGA plots of BaO undergoing one and three thermal cycles 24
4.1 Effect of various secondary oxide additions on Mn3O4 Mn2O3 re-oxidation fraction
28
4.2 Effect of Fe2O3 additions on Mn3O4 Mn2O3 re-oxidation fraction 28
4.3 Temperature profiles of a MnO2-10%Fe2O3 packed bed within a charging and discharging cycle
29
4.4 Microstructures of manganese-mixed oxide in the as-processed and post thermal cycling states
30
4.5 TGA plots of pure manganese oxide and MnO2-15%Fe2O3 samples that underwent 500 thermal cycles
30
4.6 Normalized reduction fraction and relative TES capacity of various manganese-iron mixed oxides
31
4.7 The effect of Al2O3, Cr2O3 and Fe2O3 additions on CoO Co3O4 re-oxidation 32
4.8 Microstructures of pure cobalt, cobalt-iron and cobalt-aluminum mixed oxides before and after 500 thermal cycles
33
4.9 TGA plot of Co3O4 -5%Al2O3 and Co3O4 -23.2%Fe2O3 samples that underwent 500 thermal cycles
34
4.10 Normalized reduction fraction and relative TES capacity of pure cobalt oxide and various cobalt-aluminum mixed oxides
34
4.11 Normalized reduction fraction and relative TES capacity of various cobalt-iron mixed oxides
34
4.12 Normalized reduction fraction and relative TES capacity of various cobalt-chromium mixed oxides
35
4.13 Oxygen concentration and rotary kiln temperature profile 35
4.14 TGA plot for a BaO-10%NiO mixed oxide 36
5.1 An Inconel 625 coupon and a Hastelloy C276 coupon 37
6.1 Effect of heating rate on the reduction and isothermal temperature on the re-oxidation of Co3O4-5%Al2O3 mixed oxides
40
6.2 Arrenhenius plot for Co3O4-5%Al2O3 reduction and re-oxidation reactions 40
6.3 d /dT plots for Co3O4-5%Al2O3 reduction at a heating rate of 10°C/min 41
6.4 The reactor concept with indirect heat transfer and its input and output parameters 42
6.5 Influence of thermal conductivity of solid particles on conversion and outlet 42

Thermochemical Heat Storage for Concentrated Solar Power, B. Wong Thermochemical System Reactor Design for Thermal Energy Storage, Phase II Final Report for the period September 30, 2008 through April 30, 2011
viii General Atomics Report GA–C27137
temperatures
6.6 Influence of pre-exponential factor on conversion and outlet temperatures 43
6.7 Compression work charge 44
6.8 Influence of power level on compression work during discharge 45
6.9 Calculated power and parasitic losses during charging and discharging 45
6.10 Influence of reaction and mass flow rates on reactor performance during the discharging process
46
7.1 Oxide based TES System Flowsheet Configuration 49
7.2 Solar Insulation Variation by Month in Daggett, California (SAM database) 52
7.3 LCOE for oxide-based TES plants 52
7.4 TES costs for oxide-based TES plants 53
7.5 Major components of the oxide TES cycle flowsheet, as represented in Aspen Plus®
54
7.6 SAM output for DLR packed-bed design 55
LIST OF TABLES
1.1 List of General Atomics technical reports 3
2.1 Metal oxide systems applicable to TES based on thermodynamics considerations 6
2.2 Potential TES oxide candidates 7
3.1 Effect of cooling rates on re-oxidation fraction of CoO Co3O4 18
3.2 Effect of TGA cooling rate on CoO Co3O4 re-oxidation for as-received Co3O4 21
4.1 Effect of annealing time on Mn3O4 re-oxidation in a MnO2-5%Fe2O3 samples 27
4.2 Maximum CoO Co3O4 re-oxidation fraction for various cobalt mixed oxides 32
5.1 Summary of materials compatibility test results for various TES solid oxides 38
6.1 Activation energies and the pre-exponential factors calculated for pure Co3O4 and Co3O4-5%Al2O3 using TGA measurement data
40
6.2 Baseline packed bed properties used for reactor modeling 42
6.3 Process parameters and bed properties used for TES reactor modeling 43
6.4 Design parameters for a 1200 MWth TES system 45
7.1 Cobalt oxide TES cost summary 54

B. Wong Thermochemical Heat Storage for Concentrated Solar Power, Thermochemical System Reactor Design for Thermal Energy Storage, Phase II Final Report for the period September 30, 2008 through April 30, 2011
General Atomics Report GA–C27137 1
1. INTRODUCTION
Solid oxide based thermochemical cycles (TCs) have been investigated for use in high den-sity solar Thermal Energy Storage (TES) applications. Heat storage and retrieval are accom-plished via reduction and subsequent re-oxidation (REDOX) of solid metal oxides e.g. Co3O4 (s)
CoO (s) + O 2 (g). The baseline system concept utilizes a packed bed reactor for charging and discharging of TES oxide. During on sun hours hot air form the solar cavity flows through the fixed oxide bed and heats the TES oxide to above the equilibrium transition temperature (Fig. 1.1). The oxide undergoes a reduction and is thus “charged”. For heat recovery or “discharge”, cool air is introduced into the reactor and oxidizes the reduced oxide. Heat is released and the temperature of the flowing air is raised. The outlet air temperature remains at or near the transition temperature during both day and night operations. The REDOX reactions can also be carried out in a moving bed reactor in which TES oxide flows in and out of the solar reactor. In this case, heating of the oxide can be accomplished via direct solar irradiation result-ing in more efficient heat transfer. The proposed TES concept utilizes air as both the heat trans-fer fluid and the reactant. Storage of air is not necessary and such a system is classified as “open”. Similar TES REDOX reactions can also be carried out with carbon dioxide or water based systems. In those cases, the working gases require storage and are thus termed “closed”.
There are a number of advantages in using an open loop oxide based TC to store solar heat energy:
• Heat can be stored indefinitely in chemical bonds
• Heat storage capacity (kJ/kg) is high compared to sensible heat storage
• Heat is released at a constant temperature which provides a constant heat source. A TC can be selected to match the required turbine operating temperature
• Air is used as both the heat transfer medium and reactant. No corrosive fluid or high temperature solid needs to be handled. Only solid oxides need to be stored and there is no need to compress gases for storage
• Minimal environmental effect for most oxide cycles This project’s goal is to identify, assess and develop TCs that are applicable to the proposed
“open” loop concept and demonstrate the technology’s economic and engineering feasibility and advantages when integrated with a solar power plant. DOE’s storage cost and LCOE targets are $15/kWh and $0.09/kWh respectively. Three phases were planned for this project two of which have been completed. A block diagram showing the main project tasks is shown in Fig. 1.2. In Phase I, a survey of potentially applicable oxide systems was carried out. The metal-air thermodynamic phase equilibria for pure solid metal oxides were established via HSC chemistry software. A preliminary down select of applicable TCs based on equilibrium temperature and

Thermochemical Heat Storage for Concentrated Solar Power, B. Wong Thermochemical System Reactor Design for Thermal Energy Storage, Phase II Final Report for the period September 30, 2008 through April 30, 2011
2 General Atomics Report GA–C27137
calculated storage cost was carried out. A literature survey on the REDOX behavior of the remaining oxide systems and their mixed oxides was conducted. Experimental measurements on the REDOX properties of some of the candidate oxides were also carried out in parallel. Based on all the available data, a final down select was performed and it identified manganese oxide, cobalt oxide and barium oxide as potential TES candidates for further development in Phase II.
Fig. 1.1. Process flow diagram schematic of the baseline solid oxide based TES concept.
Fig. 1.2. Block diagram showing the key project activities.

B. Wong Thermochemical Heat Storage for Concentrated Solar Power, Thermochemical System Reactor Design for Thermal Energy Storage, Phase II Final Report for the period September 30, 2008 through April 30, 2011
General Atomics Report GA–C27137 3
Phase II addressed two key areas: (i) the sluggish oxide re-oxidation kinetics of the three pure oxides and (ii) reactor design, system integration and economics. The team was able to successfully enhance the short and long term reaction kinetics of cobalt and manganese based oxides through the incorporation of secondary oxides. The mixed oxides enable higher oxygen mass transfer in addition to limiting oxide grain growth under prototypical operating conditions. For reactor design, a model was developed based on experimental measured kinetics. Reactor dimension, mass flow rate and process boundary conditions were derived based on the required power level. The charge and discharge was modeled in detail and the results were applied to calculate the economics of the overall system. Materials compatibility tests were conducted to identify materials that can be used to construct a bench top test model. Key highlights of the project are presented in the following sections. Details can be found in various GA reports listed in Table 1.1.
1.1. TECHNICAL REPORTS
Table 1.1 List of General Atomics Technical Reports
GA Report No.
Title
Date
GA-C26524 Quarterly Report
JUN2009 2Q
SEP2009 3Q
DEC2009 4Q
MAR2010 1Q
JUN2010 2Q
SEP2010 3Q
DEC2010 4Q
MAR2011 1Q
GA–C26617 Survey on Multivalent Metal Oxides Applicable to Thermal Heat Storage
NOVEMBER 2009
GA–C26695 Promising Thermochemical Cycles for Thermochemical Heat Storage Down Select
MARCH 2010
GA–C26699 Evaluation of MnO2 REDOX Cycle for Thermal Energy Storage
MARCH 2010
GA-C26645 Milestone Report on the Experimental Evaluation Protocol for Solid Oxides Based Thermochemical Cycle
FEBRUARY 2010
GA–C27022 Oxide-Based Thermal Energy Storage JANUARY 2011
GA-C27024 Construction Materials Compatibility with Solid Oxide-Based Thermal Energy Storage
FEBRUARY 2011
GA-C27055 Solid Oxide-Based Thermochemical Cycles Applicable to Thermal Heat Storage for Temperatures between 450°C–700°C and 700°C–900°C
APRIL 2011

Thermochemical Heat Storage for Concentrated Solar Power, B. Wong Thermochemical System Reactor Design for Thermal Energy Storage, Phase II Final Report for the period September 30, 2008 through April 30, 2011
4 General Atomics Report GA–C27137
1.2. LIST OF PRESENTATIONS
Lloyd Brown, “Multivalent Metal Oxides for Thermochemical Energy Storage,” Poster Presentation at 14th Annual Solarpaces Conference, 2009, Berlin, Germany.
Bunsen Wong, “Thermochemical Heat Storage for Concentrated Solar Power,” Oral Presentation at the DOE CSP Project Review, 2010 Albuquerque, New Mexico.
Bunsen Wong, “Oxide Based Thermochemical Heat Storage,” Oral Presentation at the 15th Annual Solarpaces Conference, 2010 Perpignan, France.
Bunsen Wong, “Thermochemical Heat Storage for Concentrated Solar Power Based on Multivalent Metal Oxides,” Oral Presentation at the DOE CSP Project Review, 2011 Golden, Colorado.
Robert Buckingham, “Metal Oxide Based Thermochemical Energy Storage for Concentrated Solar Power – Thermodynamics and Parasitic Loads for Packed Bed Reactors,” Poster Presentation at the 16th Annual Solarpaces Conference, 2011, Granada, Spain.
1.3. LIST OF PUBLICATIONS
Bunsen Wong, Lloyd Brown, Franziska Schaube, Rainer Tamme and Christian Sattler, “Oxide Based Thermochemical Heat Storage,” Proceedings of 15th Annual Solarpaces Conference, Perpignan, France.
Robert Buckingham, Bunsen Wong, Lloyd Brown, Christian Sattler, Franziska Schaube and, Antje Woerner, “Metal Oxide Based Thermochemical Energy Storage for Concentrated Solar Power – Thermodynamics and Parasitic Loads for Packed Bed Reactors,” Proceedings of 16th Annual Solarpaces Conference, Granada, Spain.
Martina Neises, Stefania Tescari, Lamark de Oliveira, Martin Roeb, Christian Sattler and Bunsen Wong, “Solar-Heated Rotary Kiln for Thermochemical Energy Storage,” submitted to the International Journal of Energy Research.

B. Wong Thermochemical Heat Storage for Concentrated Solar Power, Thermochemical System Reactor Design for Thermal Energy Storage, Phase II Final Report for the period September 30, 2008 through April 30, 2011
General Atomics Report GA–C27137 5
2. METAL OXIDE SYSTEM SURVEY AND DOWN SELECT
2.1. REDOX OXIDE SYSTEMS EVALUATION USING HSC CHEMISTRY
HSC Chemical Reaction and Equilibrium Software was used to calculate the equilibrium thermodynamics of all solid oxide – air systems. HSC is designed for various kinds of chemical reactions and equilibrium calculations as well as process simulation. In this study, nominal air (79%N2-21%O2) at atmospheric pressure was used as the carrier gas. A total of 74 different pure solid oxide systems were evaluated and they are highlighted in Fig. 2.1.
Fig. 2.1 Periodic table showing oxide of elements (marked in yellow) that have been evaluated with HSC software.
Figure 2.2 shows examples of the HSC calculation results. A Co3O4 CoO REDOX transition takes place at an equilibrium temperature of 890°C is illustrated in the cobalt oxide-air phase stability diagram [Fig. 2.2(a)]. The enthalpy of this reaction is 202 kJ/mole (844 kJ/kg) of Co3O4. Oxides with similar sharp transition can be used for TES as they can absorb and release heat within a very narrow temperature range. This can be compared with the phase stability diagram nickel oxide-air system [Fig. 2.2(b)]. There is no REDOX transition so the system is not suitable for TES. Details of all calculation results can be found in General Atomics report GA-A20323.

Thermochemical Heat Storage for Concentrated Solar Power, B. Wong Thermochemical System Reactor Design for Thermal Energy Storage, Phase II Final Report for the period September 30, 2008 through April 30, 2011
6 General Atomics Report GA–C27137
Fig. 2.2. Phase stability diagrams for the (a) cobalt oxide-air and (b) nickel-oxide air at ambient pressure. Air is the carrier gas.
The HSC effort yielded a total of 16 pure oxide TES candidates. Lanthanide and actinide oxides that showed useful TES characteristics were not included as their use is not practical. Table 2.1 lists the enthalpy and the heat storage density associated with the oxide candidates.
Table 2.1 Metal Oxide Systems Applicable to TES Based on Thermodynamics Considerations
Reaction Temperature
(°C)
H (kJ/mole
oxide)
Storage Density (kJ/kg)
Cr5O12 2.5Cr2O3 + 2.25O2 110 126.0 279
2Li2O2 2Li2O + O2 150 68.2 1483
2Mg2O 2MgO + O2 205 21.8 505
2PbO2 2PbO + O2 405 62.8 262
2PtO2 2PtO + O2 420 62.8 277
2Sb2O5 2Sb2O4 + O2 515 92.5 286
4MnO2 2Mn2O3 + O2 530 41.8 481
6UO3 6U3O8 + O2 670 35.2 123
2BaO2 2BaO + O2 885 72.5 474
2Co3O4 6CoO + O2 890 202.5 844
Rh2O3 Rh2O + O2 970 249.2 981
6Mn2O3 4Mn3O4 + O2 1000 31.9 202
4CuO 2Cu2O + O2 1120 64.5 811
6Fe2O3 4Fe3O4 + O2 1400 79.2 496
2V2O5 2V2O4 + O2 1560 180.7 993
2Mn3O4 6MnO + O2 1700 194.6 850

B. Wong Thermochemical Heat Storage for Concentrated Solar Power, Thermochemical System Reactor Design for Thermal Energy Storage, Phase II Final Report for the period September 30, 2008 through April 30, 2011
General Atomics Report GA–C27137 7
The equilibrium reaction temperatures of Cr5O12, Li2O2 and Mg2O are below 250°C. At these temperatures, REDOX reaction kinetics are slow and heat recovery is inefficient. Hence, they are removed from consideration. Figure 2.3 shows the estimated TES raw materials costs for the remaining 13 oxide candidates calculated based on their theoretical reaction enthalpies (this estimation did not take into account the sensible heat of the oxide). The materials costs ($/kg) were derived using published internet values so they may be higher than the actual cost in bulk. Results showed PtO2, Rh2O3 and UO3 are too expensive for use with the present TES concept as material costs alone are two orders of magnitude above the DOE target of $15/kWh. They were eliminated from future deliberation. A total of 10 potential candidates remained and they are classified based on their equilibrium temperatures in Table 2.2.
Fig. 2.3 Raw material cost for TES using various oxides.
Table 2.2 Potential TES Oxide Candidates
Temperature TES Oxide Candidates
350°C<T<700°C MnO2, Sb2O5
700°C<T<900°C Co3O4, BaO, Mn2O3
900°C<T<1100°C CuO
1100°C<T Fe2O3 , Mn3O4, V2O5

Thermochemical Heat Storage for Concentrated Solar Power, B. Wong Thermochemical System Reactor Design for Thermal Energy Storage, Phase II Final Report for the period September 30, 2008 through April 30, 2011
8 General Atomics Report GA–C27137
2.2. LITERATURE SURVEY ON PURE AND MIXED OXIDE SYSTEMS
A literature survey on the REDOX characteristics of the pure oxides listed in Table 2.2 and their mixed systems was carried out. Complete details of this survey can be found in General Atomics report GA-C26617. A summary is provided in the following sections.
2.2.1. Manganese Oxides
The manganese-oxygen system has four different stable oxides: MnO2 Mn2O3 Mn3O4 MnO. The three REDOX reactions can all be used for TES but since the equilibrium
temperature of the Mn3O4 MnO transition is too high, 1700°C, it is not considered in this project. The reduction of all manganese oxides takes place readily and the reversibility of Mn2O3
Mn3O4 and Mn3O4 MnO REDOX reactions have been demonstrated at ambient pressure. No re-oxidation of Mn2O3 into MnO2 at ambient pressure has been observed but the literature reports that reaction may require a pure oxygen gas pressure of 3000 bar. Various intermediate oxides have been observed in the MnO2 Mn2O3 decomposition process and their existence is related to the oxide preparation method. The absence of MnO2 Mn2O3 re-oxidation may be related to the existence of such intermediate phases. Manganese oxide particle size also plays an important role on the re-oxidation process. High surface area, i.e. fine grain size, reduces the re-oxidation temperature of Mn3O4. In summary, the manganese oxide systems have many attributes that enable for them to be considered for TES media.
2.2.2. Cobalt Oxide
The cobalt oxide system has only one transition: Co3O4, a spinel, decomposes into CoO at temperatures around 890°C and above in air [Fig. 2.2(a)]. The REDOX reactions are readily reversible and reaction kinetics were shown to be controlled primarily by heat transfer and diffusion. The Co3O4 CoO system is well-suited for use in the proposed TES concept. Previous worked showed larger CoO particles could not be fully re-oxidized at low re-oxidation temperatures due to a surface Co3O4 layer acting as a barrier. In addition, REDOX performance was shown to decrease with cycling. Thus, the long term REDOX performance of cobalt oxide will need to be addressed.
2.2.3. Iron Oxides
The iron oxygen system has two known REDOX transitions: Fe2O3 Fe3O4 and Fe3O4 FeO. The equilibrium temperature for Fe3O4 FeO decomposition in air is above 2000°C so this reaction is not considered within the framework of the present project. Fe2O3 (hematite) and Fe3O4 (magnetite) are among the most common materials on earth and their reactions are very well characterized and the reversibility of this transition has been documented. Reduction of Fe2O3 Fe3O4 begins to take place at temperatures above 1200°C. Re-oxidation proceeds also at a rapid rate but high moisture content has been shown to retard this process. The key problem associated with this transition is the formation of transformation stress induced porosity and

B. Wong Thermochemical Heat Storage for Concentrated Solar Power, Thermochemical System Reactor Design for Thermal Energy Storage, Phase II Final Report for the period September 30, 2008 through April 30, 2011
General Atomics Report GA–C27137 9
cracks during the reduction step. This leads to a severe attrition problem and makes this system not suitable for TES.
2.2.4. Lead Oxide
Lead oxide is another attractive TES candidate as it is a low cost material. HSC calculation results showed only two stable lead oxide phases: PbO2 PbO. However, a survey of literature revealed many intermediate Pb-O phases as the presence of impurities and lattice strain led to the formation of various lead oxide intermediates. Depending on sample history, the transition temperatures and nature of Pb-O phases would vary. Formation of intermediate oxides means heat is not released in a narrow temperature range but is discharged continuously as the reduced lead oxide goes through the different oxidation states. Such heat release mechanism is not ideal for the proposed TES concept which works best with a narrow temperature output range.
2.2.5. Antimony Oxide
HSC Chemistry showed only one transition in the antimony air-oxide system: Sb2O5 Sb2O4. On the other hand, the literature review showed the most common antimony oxide is a metastable Sb2O3. The transitions between Sb2O3, Sb2O4 and Sb2O5 are relatively complicated due to the thermal instability of Sb2O5 and the volatility of Sb2O3. Decomposition of Sb2O5 into Sb2O4 has been demonstrated whereas re-oxidation in air has not. Thus, it is doubtful whether pure antimony oxide can be used for TES.
2.2.6. Vanadium Oxide
HSC calculation results showed a V2O5 V2O4 (VO2) transition in the vanadium oxide-air phase stability diagram. Upon review, literature data showed an additional higher temperature transition between VO2 V2O3. A number of other intermediate oxide phases such as V3O5 , V4O7 and V6O13 etc have been identified repeatedly. The reduction kinetics in air may be slow as full V2O5 V2O3 conversion in an inert gas environment took 5 hours to complete. Exposure of V2O3 to air has been shown to promote oxidation to VO2 but the re-oxidation kinetics with respect to the re-oxidation temperature range were not known. Similar to lead oxide, the presence of many intermediate phases makes vanadium oxide not very suitable for TES use.
2.2.7. Barium Oxide
Only BaO and BaO2 are present in the barium oxide – air system as modeled by HSC Chemistry. The use of the BaO2 BaO REDOX transition as a chemical heat storage mechanism had been explored previously. The REDOX reactions were shown to be reversible but the conversion fraction decreased as the barium oxide went through additional cycling. This was due to the formation of a BaO2 ash layer on the surface of BaO particles during re-oxidation, similar to what was observed in cobalt oxide. The thickness of this layer formed an oxygen diffusion barrier around the BaO particles and slowed down re-oxidation. To make barium oxide

Thermochemical Heat Storage for Concentrated Solar Power, B. Wong Thermochemical System Reactor Design for Thermal Energy Storage, Phase II Final Report for the period September 30, 2008 through April 30, 2011
10 General Atomics Report GA–C27137
usable for TES, stable high diffusion paths are needed to ensure complete reversibility of this transition.
2.2.8. Copper Oxide
Both HSC chemistry and literature data showed only a CuO Cu2O transition in the copper oxide-air system. Reduction in air takes place at temperature close to a 1000°C. Since the melt-ing point of Cu2O is at 1232°C, the proximity between transition temperature and melting point could pose problems to the physical operation of the TES system since grain coarsening will be extensive. Literature data showed re-oxidation of Cu2O can take place at a temperature signifi-cantly lower than equilibrium transition. This capacity will provide flexibility in the design and operation of the TES system. Hence, copper oxide is a potential TES candidate.
2.3. MIXED METAL OXIDES
There are two types of mixed oxide REDOX reactions: (i) solid-solid and (ii) solid solution. In the first type, the two oxides form a single phase oxide after the reaction:
Mn2O3 + 2Fe2O3 2MnFe2O4 + O2
Such system is not practical for TES as thermal cycling of oxides will result in material attrition. In the latter, cations take up different lattice sites in an oxide matrix and the mixed oxide undergoes REDOX similar to a pure oxide. e.g.:
Co2NiO4 Co2NiO3 + O2
Such systems are applicable for TES and the selection and amount of the secondary cation is essential. In such mixed oxides, a primary metal cation is replaced by a secondary cation in the oxide lattice. The replacement can be stoichiometric, e.g. substitution of Co by Ni in Co3O4 to form Co2NiO4, or partial, e.g. doping of Co3O4 with Fe2O3. It has been shown that FeNiCoO4 does not decompose in contrast to Co2NiO4. This is due to the locations of cations in the spinel oxide structure. The original substitution of Co by Ni resulted in a local charge imbalance because both Co3+ and Ni2+ have a strong preference for octahedral sites in the spinel structure. Hence, when Ni2+ replaces Co3+ the resulting Co2+[ Ni2+Co3+]O4 oxide has one positive charge unallocated. This imbalance forces the creation of oxygen anion vacancies which enhances the REDOX process. On the other hand, Fe3+ replaces Co2+ in the tetrahedral site and resulted in a neutral lattice with sluggish kinetics.
This effect of charge imbalance on kinetics was demonstrated in pure oxides in which a small amount of secondary metal oxide was dissolved (doped). Doping reduces the phase transition temperatures based on the thermodynamics. This was confirmed by the additions Co3O4 into Mn3O4 and Mn2O3 into Fe2O3 etc. The doping cations in the primary lattice leads to an increase in the concentration of the anionic (oxygen) vacancies. They act as active centers for the

B. Wong Thermochemical Heat Storage for Concentrated Solar Power, Thermochemical System Reactor Design for Thermal Energy Storage, Phase II Final Report for the period September 30, 2008 through April 30, 2011
General Atomics Report GA–C27137 11
chemisorption of oxygen and subsequent oxidation. The effectiveness will depend on the valence state and ionic radii of the dissolved secondary cations. Such additions have been shown to increase the reactivity between CoO and oxygen and reduce the Co3O4 decomposition temperature. Similar approaches have been used to modify lead and vanadium oxides. Hence, the replacements of cations have the capacity to modify the REDOX reaction kinetics.
2.4. PEROVSKITE OXIDES
The third type of oxide that was found to be applicable to TES is those based on the perovskite structure. These are usually rare-earth/transition metal mixed oxides and an example of a perovskite oxidation reaction is La2CoO4.0 + x/2 O2 La2CoO4 + x. Perovskites have extremely high oxygen transport at room temperature due to their large, open unit cells and the existence of extended defects. Diffusion coefficients along these defects can be 6-8 orders of magnitude higher than bulk materials. Many perovskite oxides have been developed for use as solid oxide fuel cell materials because of their high oxygen permeability. Replacement of rare earth and transition metal cations further creates oxygen vacancies which in turn enhance both conductivity of the oxide and the REDOX kinetics. These oxygen vacancies act as absorption sites for the re-oxidation of the perovskite. Even though perovskites have the desirable properties for TES media, they required extensive processing and their use in an application that requires large quantities of materials is uncertain.


B. Wong Thermochemical Heat Storage for Concentrated Solar Power, Thermochemical System Reactor Design for Thermal Energy Storage, Phase II Final Report for the period September 30, 2008 through April 30, 2011
General Atomics Report GA–C27137 13
3. CHARACTERIZATION OF TES OXIDE CANDIDATES
To assess the suitability of various oxide candidates for TES application, various measure-ments and characterization techniques were employed to examine the oxides’ short and long term REDOX reaction properties and process induced structural modifications. The data helped define the thermodynamics and the kinetics of pure and mixed oxides and the suitability of the oxides for long term application. Four different test systems were used for the measurements. They are (i) Thermogravimetric Analyzer (TGA), (ii) Thermal Cyclic System, (iii) Bench Top Packed Bed Reactor and (iv) Rotary Kiln Reactor. X-ray diffraction and scanning electron microscopy were employed for structural characterizations. Details of the measurement tech-niques and results can be found in General Atomics report GA-C26645. Highlights of the results are contained in the following sections.
3.1. CHARACTERIZATION TEST SYSTEMS
3.1.1. Thermogravimetric Analysis (TGA)
TGA measures reaction characteristics as a function of temperatures, heat and cooling rates and carrier gas content while using a very small amount of sample material. The specimen’s weight change, heat absorption and release and variation in the carrier gas composition are measured simultaneously. The resulting data is used to determine the kinetics of both reduction (charging) and re-oxidation (discharging) reactions. TGA is a fast and convenient tool to determine whether an oxide candidate has suitable TES characteristics.
Figure 3.1 shows the TGA plot of a Co3O4 sample subjected to heating and cooling at a rate of 1°C/min. Air was used as the carrier gas. As Co3O4 was heated above the equilibrium temperature, the endothermic reduction reaction (Co3O4 CoO + O2) took place resulting in a weight loss due to oxygen release. The sample is “charged”. As the sample cooled below the equilibrium temperature, it was oxidized by oxygen in an exothermic reaction and released the stored energy. Consequently, weight that was lost during reduction was recovered. The intake and release of thermal heat are marked by the endo- and exothermic peaks in the heat flow curve. This plot illustrates the required TGA characteristics of a TES medium.
3.1.2. Thermal Cyclic System
Literature review indicated that long term REDOX performance is a critical issue for solid oxide based TES. In view of this, a thermal cyclic system was constructed to help assess the long term REDOX characteristics of TES oxide candidates. Test samples were cycled through the transition temperature as the sample carrier moved in and out of the tube furnace (Fig. 3.2). TGA studies were then carried out to determine REDOX characteristics of cycled samples. The system was also used to test compatibility between TES oxide candidates and various construction materials. Coupons were embedded in selected oxides for these tests.

Thermochemical Heat Storage for Concentrated Solar Power, B. Wong Thermochemical System Reactor Design for Thermal Energy Storage, Phase II Final Report for the period September 30, 2008 through April 30, 2011
14 General Atomics Report GA–C27137
Fig. 3.1. TGA plot of Co3O4 oxide that was heated and cooled at a rate of 1°C/min. Air is the carrier gas.
Fig. 3.2. (a) Thermal cyclic test system for solid oxides and (b) system temperature profile
3.1.3. Fixed Bed TES Oxide Test Set Up
The baseline TES concept employs a packed bed reactor for both charging and discharging of the solid oxide. Thus, candidate oxides need to demonstrate the REODX characteristics in a fixed bed to verify this concept. To accomplish this, a simple packed bed test system was set up in the laboratory (Fig. 3.3). The oxide bed was packed inside a quartz tube. A multi-zone thermocouple was embedded along the bed axis to monitor temperature profile changes during REDOX.

B. Wong Thermochemical Heat Storage for Concentrated Solar Power, Thermochemical System Reactor Design for Thermal Energy Storage, Phase II Final Report for the period September 30, 2008 through April 30, 2011
General Atomics Report GA–C27137 15
Fig. 3.3. Set up of an oxide packed bed system operating at atmospheric pressure.
3.1.4. Rotary Kiln TES Oxide Test System
A rotary kiln directly irradiated by concentrated solar radiation was used to demonstrate solid oxide REDOX in a moving bed reactor. A secondary concentrator in front of the rotary kiln is used to direct the incoming solar irradiation into the reaction chamber and provides high process temperature (Fig. 3.4). A quartz window located at the entrance plane of the secondary concen-trator seals the kiln from the environment and enables the adjustment of gas compositions inside the chamber. Within the chamber the solar beam expands and irradiates the chamber wall surface and the metal oxide powder within. The re-direction and concentration of solar radiation onto the rotary kiln is carried out by a solar furnace. The energy required for metal oxide reduction is provided by the solar furnace which can provide a solar concentration of up to 5000 times.
Fig. 3.4. (a) Schematic and (b) actual set up of the solar rotary kiln reactor that will be used for demonstration.

Thermochemical Heat Storage for Concentrated Solar Power, B. Wong Thermochemical System Reactor Design for Thermal Energy Storage, Phase II Final Report for the period September 30, 2008 through April 30, 2011
16 General Atomics Report GA–C27137
The reaction chamber of the rotary kiln is made with silicon carbide which has good thermal conductivity. To reduce heat losses and minimize thermal stresses, the chamber is isolated with ceramic fibre plates. The entire kiln is enclosed in a metal housing and can be rotated on motor driven rollers [Fig. 3.4(b)]. The rotational speed can be varied to up to 6 RPM.
3.2. PURE OXIDE CHARACTERIZATION
Preliminary characterization of pure solid oxide candidates listed in Table 2.2 was carried out using the various test systems. Measurement data was used to identify the short comings of various oxides and to carry out a down select of the potential candidates for further developmental.
3.2.1. Manganese Oxide
The two manganese oxide transitions of interest are MnO2 Mn2O3 and Mn2O3 Mn3O4. TGA measurements showed decomposition of MnO2 and Mn2O3 took place readily when the oxide was heated above the equilibrium temperature. In contrast, re-oxidation did not proceed as easily upon cooling. There is no observable re-oxidation of Mn2O3 into MnO2 after the first reduction cycle [Fig. 3.5(a)]. Cyclic TGA measurements revealed extremely minor weight gains and losses thereafter [Fig. 3.5(b)]. This indicates that re-oxidation took place in only a very small fraction of the oxide. Surface analysis with XPS showed evidence of Mn2+ cations on the surface of Mn2O3 oxide particles. Hence, the observed weight gain in Fig. 3.5(b) could be the result of oxidation on Mn2O3 grain surfaces to form MnO2. This suggests surface re-oxidation formed a barrier that prevented further reaction underneath similar to what was observed in pure cobalt and barium oxides. Once this layer formed, further oxygen diffusion into the lattice was stopped thus arresting Mn2O3 MnO2 re-oxidation. A potential solution is to modify the surface structure to create stable oxygen diffusion paths for re-oxidation to continue.
Fig. 3.5. TGA plots of a MnO2 sample cycle between 300°C and 600°C.

B. Wong Thermochemical Heat Storage for Concentrated Solar Power, Thermochemical System Reactor Design for Thermal Energy Storage, Phase II Final Report for the period September 30, 2008 through April 30, 2011
General Atomics Report GA–C27137 17
The re-oxidation of Mn3O4 into Mn2O3 did proceed on a large scale but was slow (Fig. 3.6). A re-oxidation of 6% was recorded which was significantly less than cobalt oxide measured under similar conditions (see Fig. 3.7). The results showed the manganese oxide re-oxidation kinetics were slow and they must be enhanced if the manganese oxides were to be employed as a workable TES oxide.
Fig. 3.6. TGA plot of a MnO2 sample heated up to 1100°C and cooled down in air.
Fig. 3.7. (a) TGA plots of a Co3O4 sample heated up to 1100°C and cooled down in air. (b) the corresponding mass spectrometer signal of the carrier gas.
3.2.2. Cobalt Oxide
TGA measurements of cobalt oxide showed Co3O4 CoO REDOX reactions took place readily. An endothermic valley, sample weight loss and oxygen release marked the decomposi-tion of Co3O4 at around 860°C [Fig. 3.7(a)]. The reaction rate depends on the furnace heating rate but was complete well before the furnace reached 1000°C (Fig. 3.8). Upon cooling, re-oxidation took place accompanied by an exothermic peak, sample weight gain and oxygen up-take in the mass spectroscopy oxygen signal. The incomplete re-oxidation is due to the fast cool-ing rate (Table 3.1) which shows the importance of faster kinetics in such systems. The results

Thermochemical Heat Storage for Concentrated Solar Power, B. Wong Thermochemical System Reactor Design for Thermal Energy Storage, Phase II Final Report for the period September 30, 2008 through April 30, 2011
18 General Atomics Report GA–C27137
showed that cobalt oxide is a viable TES candidate but pathways to improve the re-oxidation kinetics of pure cobalt oxide must be explored.
Fig. 3.8. Co3O4 (a) dissociation and (b) re-oxidation fractions as a function of temperature for heating rates between 1°C–30°C/min.
Table 3.1 Effect of Cooling Rates on Re-oxidation Fraction of CoO Co3O4
Cooling Rate (°C/min) Re-Oxidation %
1 94.6%
10 92.4%
30 69.0% Since cobalt oxide was shown to be capable of undergoing full REDOX, it was used to verify
the baseline packed bed TES concept in the laboratory and to study the discharge characteristics of a packed bed. Figure 3.9 shows the temperature profile of a cobalt oxide bed during one cycle of charge and discharge. The bed was reduced in nitrogen at 850°C and then cooled down to temperatures between 500°C to 700°C for re-oxidation. Once the bed had equilibrated at the lower re-oxidation temperature, the carrier gas was switched from nitrogen to air. The bed temperature began to rise as soon as air was introduced, prompted by the oxidation of CoO into Co3O4. The peak temperature, which represents the reaction front, travelled down the bed as the reaction proceeds through the oxide. The discharge took less than 2 hours and the bed temperature returned to the baseline once oxidation was complete. The amount of heat released was characterized by the integrated peak area. Results showed the total heat release to be a function of reduction and re-oxidation temperatures. Heat release leveled off with reduction temperature as complete reduction was achieved at around 900°C [Fig. 3.10(a)]. Higher reduction temperatures posed no additional benefits whereas at too low a reduction temperature e.g. 850°C, not all the oxide was reduced. This led to less stored energy and a lower total heat output during re-oxidation. Heat release was also measured as a function of re-oxidation temperature [Fig. 3.10(b)]. At the lower re-oxidation temperatures, the slower reaction kinetics led to slower heat release. Given a constant heat loss, the rise in bed temperature was less, which led to an apparently smaller total heat output. These experiments demonstrated that a packed bed

B. Wong Thermochemical Heat Storage for Concentrated Solar Power, Thermochemical System Reactor Design for Thermal Energy Storage, Phase II Final Report for the period September 30, 2008 through April 30, 2011
General Atomics Report GA–C27137 19
TES reactor is feasible. The reduction and re-oxidation temperatures for the packed bed reactor will need to be carefully chosen in order to maximize the TES capacity of the system.
Fig. 3.9. The temperature profile of a cobalt oxide packed bed system during REDOX reaction. Heat is produced upon introduction of air and re-oxidation.
Fig. 3.10. The effect of (a) reduction (charging) and (b) re-oxidation (discharging) temperatures on magnitude of heat release (peak area) upon re-oxidation of a Co3O4 packed bed.
The effect of thermal cycling on the REDOX characteristics of cobalt oxide was investigated. Samples were cycled between 700°C and 900°C for a total of 500 cycles. Figure 3.11 shows the progression in the oxide’s microstructure as a function of thermal cycling. Significant grain growth took place during the first 50 cycles as a fivefold increase in grain size was observed. Further cycling, up to 500 cycles, resulted in more gradual increase in grain size. Re-oxidation, as measured by the TGA, was found to have improved despite the larger grains. Table 3.2 compares the re-oxidation fraction for the as-received sample and one that underwent 500 thermal REDOX cycles. The results were in contrast to the expected behavior, that a larger grain size reduces oxygen mass transport and leads to lower reaction kinetics. This cycled sample was characterized in an attempt to understand the reason for this improvement. XRD spectrum showed only Co3O4 diffraction peaks (Fig. 3.12); thus no secondary phase formed as a result of

Thermochemical Heat Storage for Concentrated Solar Power, B. Wong Thermochemical System Reactor Design for Thermal Energy Storage, Phase II Final Report for the period September 30, 2008 through April 30, 2011
20 General Atomics Report GA–C27137
Fig. 3.11. Morphological evolution of a Co3O4 specimen that was cycled between 700°C and 900°C.

B. Wong Thermochemical Heat Storage for Concentrated Solar Power, Thermochemical System Reactor Design for Thermal Energy Storage, Phase II Final Report for the period September 30, 2008 through April 30, 2011
General Atomics Report GA–C27137 21
Table 3.2 Effect of TGA Cooling Rate on CoO Co3O4 Re-oxidation for as-Received Co3O4
and a Sample that has Undergone 500 Thermal Cycles
Cooling Rate (°C/min)
Re-Oxidation (1st cycle)
Re-Oxidation (501st cycle)
1 94.6% 100%*
10 92.3% 99.2%*
30 59.0% 93.7%*
10 92.3% 70.7%
*Sample with 0.5% Cr
Fig. 3.12. XRD spectrum of cobalt oxide powder after 500 thermal REDOX cycles.
thermal cycling. The EDX spectra for an as-received and a cycled sample are shown in Fig. 3.13. A small amount of Cr (~0.5 at. %) was found in the latter. The added Cr must have originated from the cladding of the thermocouple embedded within the Co3O4 powder. The increase in re-oxidation was probably due to the mixed oxide doping effect discussed earlier. A repeated thermal cycling run showed the re-oxidation fraction decreased to around 70% in a sample which no chromium was detected. This shows that mixed oxide is an effective approach to enhance the re-oxidation of TES oxide.
3.2.3. Copper Oxide
Copper oxides underwent the CuO Cu2O REDOX reactions in air readily [Fig. 3.14(a)]. The REDOX behavior as measured by TGA is similar to that of Co3O4. An endothermic reduction reaction takes place during heat up followed by re-oxidation of the sample upon cooling. Post experimental observations showed the oxide sample has undergone sintering. This is due to the fact that the melting point of Cu2O is only about 100°C above the maximum reaction temperature 1100°C. When the oxide was heated to a slightly higher temperature, the

Thermochemical Heat Storage for Concentrated Solar Power, B. Wong Thermochemical System Reactor Design for Thermal Energy Storage, Phase II Final Report for the period September 30, 2008 through April 30, 2011
22 General Atomics Report GA–C27137
observed re-oxidation fraction was reduced [Fig. 3.14(b)]. This was because some of the oxide had melted and re-solidified. This greatly reduced the surface area available for the re-oxidation. It is impractical to operate a TES system when the equilibrium transition is so close to the melting point. Hence, copper oxide is not an appropriate TES oxide candidate.
Fig. 3.13. EDX spectrum of Co3O4 powder (a) before and (b) after 500 thermal REDOX cycles.
Fig. 3.14. TGA plots of CuO samples heated up to (a) 1100°C and (b) 1200°C and cooled down in air.

B. Wong Thermochemical Heat Storage for Concentrated Solar Power, Thermochemical System Reactor Design for Thermal Energy Storage, Phase II Final Report for the period September 30, 2008 through April 30, 2011
General Atomics Report GA–C27137 23
3.2.4. Antimony Oxide
TG analysis of Sb2O5 samples showed a gradual weight loss beginning at 100°C upon heating which could be a result of moisture evaporation (Fig. 3.15). However, this weight loss continued until 500°C indicating another reaction taking place in addition to evaporation. The total sample weight loss was 4.5%, which is close to the expected weight reduction (4.9%) for the Sb2O5 Sb2O4 transition. Upon cooling, there was no sample weight gain indicating that no re-oxidation was taking place. Similar behavior was observed in multiple samples at different heating and cooling rates. Since the reduction transition was not sharp and re-oxidation did not take place, antimony oxide is not a suitable TES candidate.
Fig. 3.15. TGA plot of a Sb2O5 sample heated up to 600°C and cooled down in air.
3.2.5. Lead Oxide
When PbO was studied with TGA (Fig. 3.16), a sample weight loss was registered at around 260°C. This is unexpected as formation of all other lead oxide variants from PbO involves a weight gain. The decrease is about 0.3% which may simply be a result of degassing. Upon cooling, no re-oxidation could be detected as there was no weight gain in the specimen. This is most likely due to a combination of the slow kinetics and the existence of intermediate phases which made the REDOX transitions sluggish. Hence, PbO is not a suitable TES medium.
3.2.6. Barium Oxide
Barium oxide exhibited fast REDOX reactions during TG measurements. Figure 3.17(a) shows an oxidation-reduction cycle starting with the reduced BaO. Upon heating in air, it oxidized quickly and formed BaO2. When the sample temperature reached around 600°C, reduction began to take place and BaO was reformed. Upon cooling, the re-oxidation fraction is significantly less that the first cycle. Repeated TGA thermal cycling showed the re-oxidation fraction remained low [Fig. 3.17(b)]. This could be due to morphological changes that affect the

Thermochemical Heat Storage for Concentrated Solar Power, B. Wong Thermochemical System Reactor Design for Thermal Energy Storage, Phase II Final Report for the period September 30, 2008 through April 30, 2011
24 General Atomics Report GA–C27137
oxygen mass transfer. The use of barium based mixed oxides may be able to rectify this behavior. Hence, BaO was considered a potential TES candidate.
Fig. 3.16. TGA plot of a PbO sample heated up to 650°C and cooled down in air.
Fig. 3.17 TGA plots of BaO undergoing (a) one and (b) three thermal cycles.
3.3. Pure Oxide Down Select
A preliminary down select was carried out based on REDOX transition temperatures and materials costs and the list of potential TES oxide candidates was narrowed down to seven (Table 2.3). Among those Fe2O3 was eliminated due to attrition issues. The REDOX reactions of the remaining candidates were characterized in the laboratory. All oxides underwent reduction readily. Among them cobalt oxide demonstrated complete REDOX, storing and releasing heat in the process. Cobalt oxide was used as a model system to validate the proposed thermochemical heat storage concept in a packed bed reactor. Re-oxidation of the other six oxides did not go to completion due to slower reaction kinetics. Mn3O4 and BaO did re-oxidize, but the fraction was low. Kinetics improvements are needed in order for them to be usable. CuO showed good REDOX characteristics, but the low melting point of the reduced oxide makes this system

B. Wong Thermochemical Heat Storage for Concentrated Solar Power, Thermochemical System Reactor Design for Thermal Energy Storage, Phase II Final Report for the period September 30, 2008 through April 30, 2011
General Atomics Report GA–C27137 25
impractical. For transitions that were known to have intermediate phases i.e. MnO2 Mn2O3, V2O5 V2O4, Sb2O5 Sb2O4, no re-oxidation was observed. In the case of Mn2O3, it was proposed that surface re-oxidation retarded the reaction. The tendency for intermediate oxide formation in these systems must have acted to broaden the phase transition, which makes these oxide systems not suitable. Using preliminary experimental data and economic analyses, the project selected Co3O4, BaO2 and Mn2O3 oxides for further developmental studies.


B. Wong Thermochemical Heat Storage for Concentrated Solar Power, Thermochemical System Reactor Design for Thermal Energy Storage, Phase II Final Report for the period September 30, 2008 through April 30, 2011
General Atomics Report GA–C27137 27
4. MIXED OXIDE REACTION KINETICS IMPROVEMENT
Co3O4, Mn3O4 and BaO2 were selected for further development. Measurement results showed their re-oxidation kinetics would need to be increased for them to be used as TES media. The approach applied was to incorporate selected secondary oxides into the primary oxide so the primary cation is partially replaced by a secondary cation of different size and oxidation state. The lattice strain and charge imbalance created by the substitution should lead to an increase in vacancy density. Consequently, an enhancement in oxygen mass transfer through the lattice can be obtained giving rise to improved re-oxidation. Such an approach has been shown to increase electrical conductivity in ceramics. The following sections provide the key findings and results of the mixed oxide development process. More complete details on the various aspects of this work can be found in General Atomics reports GA-C27022 and GA-C27055.
4.1. MIXED OXIDE DEVELOPMENT
Mixed oxides can be produced via either mechanical alloying or wet chemistry methods. For large scale production, the former option is more straight forward to implement, thus it was chosen for our current development effort so large batches for future demonstration can be easily made. The mixing procedures that were developed are as follows:
1. Primary oxide (e.g. Co3O4) and secondary oxide powders (e.g. Fe2O3) with predetermined fractions were transferred into a polyimide container.
2. Tungsten carbide or stainless steel pellets were added to the powder mixture to boost mechanical mixing. The total powder to pellet weight ratio is 3:1.
3. The container was then placed on a roller for 100 hours for the powders to mix. 4. The mixed powder was annealed in air at 900°C for 100 hours or more. The reproducibility of the mixing procedure was verified. Different samples of MnO2-
5%Fe2O3 were made using the above procedure. The samples have essentially identical TGA curves and their re-oxidation fraction was between 34 and 36% respectively. The effect of annealing time was also studied using the same MnO2-5%Fe2O3 composition. An increase in annealing time from 100 to 275 hours did not lead to any increase in re-oxidation (Table 4.1). This indicates that an annealing time of 100 is sufficient to homogenize the MnO2-Fe2O3 mixed oxides.
Table 4.1 Effect of Annealing Time on Mn3O4 Re-oxidation in a MnO2-5%Fe2O3 Samples
Annealing (hr) Re-oxidation (%)
100 34.0
150 34.2
275 34.0

Thermochemical Heat Storage for Concentrated Solar Power, B. Wong Thermochemical System Reactor Design for Thermal Energy Storage, Phase II Final Report for the period September 30, 2008 through April 30, 2011
28 General Atomics Report GA–C27137
4.2.1. Manganese Oxide
A number of transition metal oxides have been incorporated into manganese oxide. It was found that iron oxide was most effective in enhancing Mn3O4 Mn2O3 re-oxidation kinetics. The re-oxidation fraction increased by almost 20 fold (6% to 100%) when iron oxide was added (Fig. 4.1). The optimal composition was found to be around 10 at% (MnO2-10%Fe2O3) (Fig. 4.2). Multiple specimens centered on this composition had been made and they all had a re-oxidation fraction between 90 to 100%. However, long term REDOX performance must be taken into account when choosing the final optimal composition.
Fig. 4.1 Effect of various secondary oxide additions on Mn3O4 Mn2O3 re-oxidation fraction. Data *measured at a cooling rate of 10°C/min in air.
Fig. 4.2. Effect of Fe2O3 additions on Mn3O4 Mn2O3 re-oxidation fraction. The charge-discharge characteristic of MnO2-10%Fe2O3 in the packed bed was investigated
using the set up described in Chapter 3. The equilibrium transition temperature is around 950°C. The oxide was reduced in nitrogen and the temperature was lowered to the re-oxidation temperature. Re-oxidation began as soon as air replaced the nitrogen as the carrier gas. Bed temperature rose as the reaction front traveled down the bed, as shown in Fig. 4.3, similar to what was observed with a pure cobalt oxide packed bed. However, it took almost 8 hours to complete the discharge, which indicates the kinetics are slower than cobalt oxide. Whether this is sufficient for the manganese-iron oxide to function in a TES reactor i.e. charging and discharging

B. Wong Thermochemical Heat Storage for Concentrated Solar Power, Thermochemical System Reactor Design for Thermal Energy Storage, Phase II Final Report for the period September 30, 2008 through April 30, 2011
General Atomics Report GA–C27137 29
in 8 and 16 hours respectively, will be determined by applying the measured kinetics to a reactor model.
Fig. 4.3. Temperature profiles of a MnO2-10%Fe2O3 packed bed within a charging and discharging cycle.
To assess the long term REDOX performance of manganese-iron mixed oxides, samples with various iron oxide compositions were put through 500 thermal cycles in the cyclic system. The physical structures of the post cycled specimens are shown in Fig. 4.4. When the iron oxide content is too low, a dense sintered structure resulted after cycling, similar to what had been observed in pure manganese oxide. For samples with 10 and 15% Fe2O3, re-crystallization had taken place and the overall grain size had actually reduced.
REDOX characteristics for cycled pure and mixed manganese oxides specimens were studied with TGA. A cycled pure manganese oxide underwent the Mn2O3 Mn3O4 reduction but very little re-oxidation was observed in the first TGA run (Fig. 4.5). The absence of re-oxidation is due to slow kinetics caused by the sintered grain structure. A subsequent repeat run showed very little reduction due to incomplete re-oxidation from the first run. On the other hand, the REDOX fraction, especially the magnitude of weight reduction, of a MnO2-15%Fe2O3 specimen improved during thermal cycling [Fig. 4.5(b)]. This can be attributed to iron oxide additions which increased oxygen diffusivity and controlled the grain size. To compare the REDOX properties of various samples, relative TES capacity and normalized reduction were established to determine the effectiveness of the oxide additions and effect of thermal cycling.
Normalized Reducation=% measured weight loss
% theoretical weight loss
Relative TES Capacity = % re-oxidation weight gain( ) X Normalized weight loss( )

Thermochemical Heat Storage for Concentrated Solar Power, B. Wong Thermochemical System Reactor Design for Thermal Energy Storage, Phase II Final Report for the period September 30, 2008 through April 30, 2011
30 General Atomics Report GA–C27137
Fig. 4.4 Microstructures of manganese-mixed oxide in the as-processed and post thermal cycling states.
Fig. 4.5. TGA plots of (a) pure manganese oxide and (b) MnO2-15%Fe2O3 samples that underwent 500 thermal cycles.

B. Wong Thermochemical Heat Storage for Concentrated Solar Power, Thermochemical System Reactor Design for Thermal Energy Storage, Phase II Final Report for the period September 30, 2008 through April 30, 2011
General Atomics Report GA–C27137 31
The effect of thermal cycling on these two parameters for manganese-iron mixed oxides of different compositions is shown in Fig. 4.6. Both values increased with thermal cycling i.e. the REODX properties of manganese-iron mixed oxides had actually improved. In samples with 15 and 20%Fe2O3, normalized reduction had increased to over 90% which is higher than that measured in a pure virgin manganese oxide sample. This enhancement could be partially due to a finer grain size. From these results, the optimal short and long term REDOX performance can be obtained at an iron oxide composition of about 15%. In all the manganese mixed oxides TGA runs, no weight increase was observed under 500°C, thus no Mn2O3 MnO2 re-oxidation took place. Hence, the use of mixed oxides was not able to advance this reaction and MnO2 can be eliminated from further consideration.
Fig. 4.6 (a) Normalized reduction fraction and (b) relative TES capacity of various manganese-iron mixed oxides.
4.2.2. Cobalt Oxide
The re-oxidation kinetics of cobalt oxide were improved through the incorporation of secondary oxides. It was found that Al2O3, Cr2O3, Fe2O3 additions were all effective in boosting the re-oxidation fraction in the as processed samples compared to pure cobalt oxide (Fig. 4.7). However, as the secondary oxide fraction increased, the magnitude of weight reduction decreased. This is because some of the active cobalt cations were replaced by inactive secondary cations. Hence, to maintain the mixed oxide’s TES capacity, the amount of secondary oxide needs to be minimized. Table 4.2 lists the respective secondary oxide composition which gave the maximum re-oxidation fractions. The most favorable composition based solely on re-oxidation is 5 at. %Al but one must consider the long term REDOX performance before settling on an optimal composition.

Thermochemical Heat Storage for Concentrated Solar Power, B. Wong Thermochemical System Reactor Design for Thermal Energy Storage, Phase II Final Report for the period September 30, 2008 through April 30, 2011
32 General Atomics Report GA–C27137
Fig. 4.7. The effect of (a) Al2O3, (b) Cr2O3 and (c) Fe2O3 additions on CoO Co3O4 re-oxidation.
Table 4.2 Maximum CoO Co3O4 Re-oxidation Fraction for
Various Cobalt Mixed Oxides
Mixed Co-Oxide Re-oxidation*
5.0%Al2O3 100%
23.2%Fe2O3 81%
5.6%Cr2O3 84%
none 36%
*Measured at a cooling rate of 30°C/min in air.
Cobalt based mixed oxide samples were subjected to 500 thermal cycles. The microstructures of selected samples are shown in Fig. 4.8. The main noticeable difference is the grain size of the mixed oxides. Secondary oxide additions helped to limit grain growth. In addition, mixed cobalt oxides exhibited less electrostatic charging in the SEM. This indicated that their conductivities were higher which stemmed from increase defect density.

B. Wong Thermochemical Heat Storage for Concentrated Solar Power, Thermochemical System Reactor Design for Thermal Energy Storage, Phase II Final Report for the period September 30, 2008 through April 30, 2011
General Atomics Report GA–C27137 33
Fig. 4.8. Microstructures of pure cobalt, cobalt-iron and cobalt-aluminum mixed oxides before and after 500 thermal cycles.
The TGA plot of a Co3O4 -5%Al2O3 mixed oxide sample revealed an improvement in
REDOX properties after cycling [Fig. 4.9(a)]. Similar to that observed in the manganese-iron mixed oxides, the magnitude of reduction had increased after thermal cycling. However, this improvement is in contrast to pure cobalt oxide and other cobalt-aluminum mixed oxide samples which all experienced a reduction in both normalized reduction fraction and relative TES capacity after thermal cycling (Fig. 4.10). The results showed that the cobalt-aluminum oxide composition needs to remain in a tight composition range for optimal short and long term REDOX performance. Similar post thermal cycling reduction was observed in some cobalt-iron and cobalt-chromium mixed oxide samples (Figs. 4.11 and 4.12). An exception is the mixed oxide sample with 23.2%%Fe2O3. The REDOX properties as measured by TGA were very stable throughout the thermal cycling process [Fig. 4.9(b)]. The cycled samples of Co3O4-5%Al2O3 and
Co3O4-23.2%Fe2O3 have similar REDOX performance and TES capacity of almost 60%. Given

Thermochemical Heat Storage for Concentrated Solar Power, B. Wong Thermochemical System Reactor Design for Thermal Energy Storage, Phase II Final Report for the period September 30, 2008 through April 30, 2011
34 General Atomics Report GA–C27137
the stable REDOX properties of Co3O4-23.2%Fe2O3, it is certainly a better choice for baseline bench top demonstration testing if the measured data is confirmed. Using Fe2O3 has an added advantage in that the high iron oxide content reduces the fraction of the more expensive cobalt oxide. This will decrease the overall storage and LCOE costs.
Fig. 4.9. TGA plot of (a) Co3O4 -5%Al2O3 and (b) Co3O4 -23.2%Fe2O3 samples that underwent 500 thermal cycles.
Fig. 4.10. (a) Normalized reduction fraction and (b) relative TES capacity of pure cobalt oxide and various cobalt-aluminum mixed oxides.
Fig. 4.11. (a) Normalized reduction fraction and (b) relative TES capacity of various cobalt-iron mixed oxides.

B. Wong Thermochemical Heat Storage for Concentrated Solar Power, Thermochemical System Reactor Design for Thermal Energy Storage, Phase II Final Report for the period September 30, 2008 through April 30, 2011
General Atomics Report GA–C27137 35
Fig. 4.12. (a) Normalized reduction fraction and (b) relative TES capacity of various cobalt-chromium mixed oxides.
The REDOX stability of Co3O4-5%Al2O3 oxide was also tested in the rotary kiln reactor described in Section 3.3.4. Figure 4.13(a) shows the temperature and oxygen concentration within the reactor during multiple REDOX operations in one test. A complete reduction and re-oxidation cycle took essentially 50 minutes, which is significantly faster than the bench top packed bed. This is due to a much higher heat transfer rate in a moving bed reactor. Figure 4.13(b) shows the variation in measured oxygen signal over a period of 6 days (30 runs). The oxygen concentration was used to determine the degree of oxide reduction with respect to theoretical. The REDOX capacity of cobalt-aluminum oxide ranged between 45 to 50% of the theoretical value and it did not decline with cycling. This shows that the mixed oxide property is stable and the rotary kiln is a viable approach to carry out the charge and discharge of TES oxide. Details of this work will be published in a paper by DLR.
Fig. 4.13. (a) Oxygen concentration and rotary kiln temperature profile during repeated runs in one day. (b) Specific amount of oxygen and the conversion during oxide reduction.

Thermochemical Heat Storage for Concentrated Solar Power, B. Wong Thermochemical System Reactor Design for Thermal Energy Storage, Phase II Final Report for the period September 30, 2008 through April 30, 2011
36 General Atomics Report GA–C27137
4.2.3. Barium Mixed Oxides
A number of secondary oxides were mixed with barium oxide in an attempt to improve the REDOX properties, especially after the first thermal cycle. Additions included NiO, TiO2, Fe2O3,
SnO and ZnO. Furthermore, commercially available BaTiO3 and BaCuOx mixed oxides were also tested. Unlike manganese and cobalt oxides, the incorporation of a secondary oxide did not lead to any improvement in the REDOX properties and stability. Figure 4.14 shows a typical TGA curve for the as processed barium based mixed oxides. The sample underwent reduction but the re-oxidation fraction is very low. This could be related to the chemical stability of barium oxide. Hence, this family of oxides is not suitable for TES.
Fig. 4.14. TGA plot for a BaO-10%NiO mixed oxide.

B. Wong Thermochemical Heat Storage for Concentrated Solar Power, Thermochemical System Reactor Design for Thermal Energy Storage, Phase II Final Report for the period September 30, 2008 through April 30, 2011
General Atomics Report GA–C27137 37
5. MATERIALS COMPATIBILITY STUDIES SUMMARY
To integrate the TES concept into a solar plant, the reactor that holds the solid oxide will need to be constructed using proper engineering materials. In addition to containment, this will enable the reactor to operate at above ambient pressure. This reduces the volume of heat transfer fluid that needs to be cycled through the system and can also lead to faster re-oxidation due to higher oxygen partial pressure.
The compatibility of common high temperature construction materials with manganese-iron and cobalt-aluminum mixed oxides was investigated using the thermal cyclic test systems. Coupons of selected materials were subjected to thermal cycling while they were in contact with the two oxides. This simulated the prototypical TES operating conditions and a total of 500 thermal test cycles were carried out. Details of the test results can be found in General Atomics report GA-C27024.
Reactions have been observed between the metal samples and the oxides, and they varied from simple discoloration to severe dissolution (Fig. 5.1). Sample-oxide interactions can be broken down into four different categories. First are those that show a great deal of reaction, resulting in severe dissolution, spalling or an extremely rough sample surface. The second group includes samples that have reaction induced relatively rough surfaces which also caused cracks on the surface. The third group of materials also showed surface roughening but no cracks were found. The last group is those that developed minor interaction related surface roughness with no cracks. All the samples that were tested exhibited reaction with the oxides, but the extent varied. Table 5.1 summarizes that compatibility between the selected candidates and the two oxides. Only Inconel 625 is compatible with both mixed oxides. It can thus be used to construct a packed bed reactor for bench top testing when the results are re-confirmed.
Fig. 5.1. (a) An Inconel 625 coupon and (b) a Hastelloy C276 coupon that were embedded in MnO2-10%Fe2O3. and Co3O4-5%Al2O3 respectively during thermal cyclic testing.

Thermochemical Heat Storage for Concentrated Solar Power, B. Wong Thermochemical System Reactor Design for Thermal Energy Storage, Phase II Final Report for the period September 30, 2008 through April 30, 2011
38 General Atomics Report GA–C27137
Table 5.1 Summary of Materials Compatibility Test Results
for Various TES Solid Oxides
Alloy MnO2-10%Fe2O3 Co3O4-5%Al2O3
SS 321 Fair Poor
SS 309 Fair Poor
SS 4340 Poor -
253 MA Poor Fair
Inconel 718 Fair Fair
9Cr- 1Mo Poor Poor
800H Fair Fair
Inconel 600 Fair Fair
Inconel 625 Excellent Good
Hastelloy B3 Good Poor
Hastelloy C276 Good Poor
Poor: moderate to serve dissolution.
Fair: very rough surface or surface cracks observed (not suitable
for pressure vessel use).
Good: rough surface but no surface cracks found.
Excellent: relatively smooth surface with minimal reaction and no
cracks.

B. Wong Thermochemical Heat Storage for Concentrated Solar Power, Thermochemical System Reactor Design for Thermal Energy Storage, Phase II Final Report for the period September 30, 2008 through April 30, 2011
General Atomics Report GA–C27137 39
6. KINETICS DATA MEASUREMENT AND PRELIMINARY REACTOR MODELING
To assess the performance of a solid oxide packed bed TES reactor, a reactor model was established. The model can determine the influences of various materials and process parameters on charging and discharging of the reactor. The first step in the process was to derive reaction rate equations based on measured oxide kinetics using TGA. These equations were then applied to the reactor model with preset boundary conditions. The performance of the reactor can then be investigated and a system design can be derived. Details of the kinetics measurements and modeling work can be found in Appendix A of this report and General Atomics report GA-C26524-MAR2010 1Q.
6.1. KINETICS DATA MEASUREMENTS
TGA data was used to determine rate equations that govern the REDOX reactions kinetics. The results can then be used to define the mechanism based on the Avarami-Erofeev solid gas reaction model:
d /dt = A * exp(Ea/RT) * f( ) (6-1)
: decomposition/re-oxidation fraction
f( ): correction factor– reaction mechanism related
A: pre-exponential kinetics
Ea: activation energy By fitting the measured fraction changes at different heating and cooling rates to the rate
equation, the activation energy, the kinetics and the reduction reaction mechanisms can be determined. An example is shown in Fig. 6.1(a) which shows the decomposition fraction of cobalt oxide as a function of temperatures for four different heating rates. An Arrhenius plot was then obtained from the data set [Fig. 6.2(a)]. The slope of the line is Ea/R and the pre-exponential kinetics factor, A, can then be calculated. Similarly, by measuring the re-oxidation rate at various isothermal temperatures [Fig. 6.1(a)], the pre-exponential factor and the activation energy for re-oxidation can be derived from the corresponding Arrhenius plot [Fig. 6.2(b)]. It was found that the activation energy of the reduction step decreases as a result of iron oxide additions (Table 6.1). As expected, activation energy for the re-oxidation is significantly lower but the pre-exponential is also much smaller.
To determine the reaction mechanisms, d /dT plots for different f( ) functions were calculated and compared with the measured data (Fig. 6.3). The most probable controlling mechanism can be decided based on least square fit between the measured and the modeled data

Thermochemical Heat Storage for Concentrated Solar Power, B. Wong Thermochemical System Reactor Design for Thermal Energy Storage, Phase II Final Report for the period September 30, 2008 through April 30, 2011
40 General Atomics Report GA–C27137
set. It was concluded that both the reduction and re-oxidation process fits best with a 3D nucleation shrinking core model i.e. oxygen diffuses uniformly in and out of the matrix during oxidation and reduction. Hence, the improvement of mass transfer in the system is essential.
Fig. 6.1. Effect of (a) heating rate on the reduction and (b) isothermal temperature on the re-oxidation of Co3O4-5%Al2O3 mixed oxides.
Fig. 6.2. Arrenhenius plot for Co3O4-5%Al2O3 (a) reduction and (b) re-oxidation reactions.
Table 6.1 Activation Energies and the Pre-exponential Factors Calculated for
Pure Co3O4 and Co3O4-5%Al2O3 using TGA Measurement Data
Pure Co3O4 ( Dissociation)
w/ 5%Al2O3
(Dissociation) w/ 5%Al2O3
(Re-oxidation)
Ea (kJ/mole) 960 731 165
A (s-1) 1.98E+39 1.01E+28 1.26E+09

B. Wong Thermochemical Heat Storage for Concentrated Solar Power, Thermochemical System Reactor Design for Thermal Energy Storage, Phase II Final Report for the period September 30, 2008 through April 30, 2011
General Atomics Report GA–C27137 41
Fig. 6.3. d /dT plots for Co3O4-5%Al2O3 reduction at a heating rate of 10°C/min.
6.2. REACTOR MODELING
For a thermochemical heat storage system utilizing a fixed bed reactor, the reactor design is a main concern. The final design has to provide an appropriate outlet air temperature and a specific power level. These are controlled by a numbers of operating parameters and inherent oxide properties. To arrive at an optimal fixed bed reactor design, it is best to study the sensitivity of oxide bed charge and discharge to the various input parameters using a reactor model (Fig. 6.4). The present fixed bed model incorporates a system of 1D partial differential equations coupled with preset initial and boundary conditions. These equations were solved numerically using Finite Element Methods (FEM) that are contained in the software COMSOL Multiphysics®. The results provided a spatial evolution of temperature, pressure and solid density within the fixed bed reactor over time. By applying the measured kinetics of pure cobalt and cobalt aluminum mixed oxides, the most effective reactor and system designs were defined. Their limitations and specific requirements were studied. The primary baseline process design targets an eight hour charge time and up to sixteen hours of discharge. The model investigated how various factors would affect this baseline assumption.
Using the established model, sensitivities of bed charging as a function of bed thermal conductivity and pre-exponential factor were studied. The baseline TES oxide properties values used are listed in Table 6.2. Full conversion was achieved within eight hours when the baseline conductivity and pre-exponential factor of 1 W/mK and A=1.98·1039 1/s were applied (Figs. 6.5 and 6.6). The outlet temperature was almost constant at the targeted design point of 890°C throughout the charging process and only started to increase after around 5 hours at around 60% conversion. Increasing the pre-exponential and the thermal conductivity resulted in a slight improvement. On the other hand, a decrease of both parameters led to a much longer charging period and charging could not be completed within the 8 hours window. Another

Thermochemical Heat Storage for Concentrated Solar Power, B. Wong Thermochemical System Reactor Design for Thermal Energy Storage, Phase II Final Report for the period September 30, 2008 through April 30, 2011
42 General Atomics Report GA–C27137
Fig. 6.4 The reactor concept with indirect heat transfer and its input and output parameters.
Table 6.2 Baseline Packed Bed Properties used for Reactor Modeling
Properties Values
Density at end of discharge, ss 6070 kg/m3
Density at end of charge, s0 5667 kg/m3
Porosity, b 0.5
Porosity, p 0.4
Specific heat, cpR 628+0.12*Ts J/kgK
Specific heat, cpO 328.6+0.55*Ts J/kgK
Particle thermal conductivity, s 1 W/mK
Reaction heat of formation, H 844 kJ/kgCo3O4
Reactor Dimension Ø 7.4 m, L=5 m
Reactor Capacity 186 MWh reaction
Pressure Drop Pin: 2.3 bar, Pout: 1 bar
Fig. 6.5 Influence of thermal conductivity of solid particles on (a) conversion and (b) outlet temperatures.

B. Wong Thermochemical Heat Storage for Concentrated Solar Power, Thermochemical System Reactor Design for Thermal Energy Storage, Phase II Final Report for the period September 30, 2008 through April 30, 2011
General Atomics Report GA–C27137 43
Fig. 6.6 Influence of pre-exponential factor on (a) conversion and (b) outlet temperatures.
consequence of a lower thermal conductivity is its effect on the heat transfer coefficient and the heat transport to the fluid during re-oxidation. The transfer slowed down and the outlet tempera-ture could not rise to the design target. Similarly, if the reaction rates were low, the reaction zone would be extended and outlet temperature would drop once this zone reached it. The results showed that with the assumed bed properties derived from measured kinetics and literature data, a promising power and temperature level could be achieved for the proposed system.
To study the efficiency of the charge/discharge process, new boundary conditions based on prototypical operations to minimize pressure drop were applied (Table 6.2). The bed properties used in the calculations are shown in Table 6.3. The goal is to identify conditions that limit the parasitic compression work (Pcth/Pth ) to 20% of the system output. The effects of particle size, number of reactors and the inlet air temperature were studied.
Table 6.3 Process Parameters and Bed Properties used for TES Reactor Modeling
Capacity Bed properties Boundary conditions Power
1200 MWhth Fixed bed ε > 0.5 d p< 0.1 m
Pin,d: 0.95-0.9 bar Pin,r: 1 bar Tin,d: 1200°C-950°C Tin,r: 600°C
Pd = 150 MWth Pr = 75-600 MWth
Pcth/Pth < 20%
Figure 6.7 shows the effect of particle size and inlet temperature on parasitic load for a charging period of 8 hours. When the particle diameter is small, e.g. 1 cm, more than 20 reactors are needed for the parasitic load to stay below the 20% threshold. For large particles, only 10 or less tanks are needed to acquire the 1200 MWhth thermal capacity needed (sensible heat was included in the calculations). In addition, a higher inlet temperature decreases the number of

Thermochemical Heat Storage for Concentrated Solar Power, B. Wong Thermochemical System Reactor Design for Thermal Energy Storage, Phase II Final Report for the period September 30, 2008 through April 30, 2011
44 General Atomics Report GA–C27137
tanks required due to the lower required mass flow rate per tank. Based on these data, an inlet temperature of 1200°C during charge is used. A design of 8 tanks (150 MWth each) with a height of 4.45 m and diameter of 8.9 m containing metal oxide spheres of 3 cm particles is proposed for such storage system. The calculated losses due to the pressure drop are ~13% if 1200 MWhth are transferred within 8 hours.
Fig. 6.7. Compression work during charge: Co3O4+ H 3 CoO+0.5 O2. (a) Influence of particle diameter and (b) inlet temperature.
For discharging, the power level needs to be adjusted according to electricity generation
requirement. For example, at a power level of 150 MWth a discharge time of 8 hours is available. Similarly for a 16 hours discharge, the power output can only be at 75 MWth. The compression work for an eight tank system at different power output is shown in Fig. 6.8. For a required power level of 37.5 MWth or 75 MWth the parasitic losses exceed the requested 20%. Decreasing the inlet temperature (<600°C) or increasing the number of tanks is necessary to keep losses below the threshold. However, taking into account the charging requirements, it was determined that an 8 hours discharge time with a power output level of 18.75 MWth is optimal. The baseline design for a 1200 MWth TES system is listed in Table 6.4.
The overall capacity of this design depends on the sensible storage of the solid which was estimated at ~10%/100 K. Hence, the capacity varies between 120 (no sensible storage) and 190 MWhth ( Tsolid=600 K). The reactor operation is as follows: After the discharging, the bed is at 600°C. Hot air enters the reactor at 1200°C and is cooled to the equilibrium temperature of 900°C while charging the bed. At the completion of charging, the entire bed is heated up to the air inlet temperature of 1200°C. During the discharging process the air enters the storage system at 600°C and is heated up to the equilibrium temperature of 900°C. After the discharging process the solid temperature is again at 600°C. The effect of this process on the parasitic load is shown in Fig. 6.9. The demand of PC,th/Pth<20% can only be met during the first four hours of the charging process. When integrated an eight hours period, the parasitic work is 18% even though the transient ratio as high as 28% was seen. For discharging, PC,th/Pth stays below 20% for the

B. Wong Thermochemical Heat Storage for Concentrated Solar Power, Thermochemical System Reactor Design for Thermal Energy Storage, Phase II Final Report for the period September 30, 2008 through April 30, 2011
General Atomics Report GA–C27137 45
entire 8 hour period. A fixed bed with 3 cm particles shows promising performance in terms of temperature, power level and pressure drop, but particle sizes smaller than 3 cm are not acceptable in this fixed bed design with regard to the pressure drop.
Fig. 6.8 Influence of power level on compression work during discharge.
Table 6.4 Design Parameters for a 1200 MWth TES System
Geometry, Capacity Bed Properties Boundary Conditions Power, Mass Flow
8x (Ø 8.9 m, H=4.45 m)
8x 504 tCo3O4
8x ~120-180 MWhth
b=0.5, p=0.4
dp=0.03 m
Pout,d: 0.91 bar
Pout,r: 0.91 bar
Tin,d: 1200°C
Tin,r: 600°C
8x Pd = 18.75 MWth
8x Pr = 18.75 MWth
8x mair,d =56.4 kg/s
8x mair,r =54.6 kg/s
Fig. 6.9. Calculated power and parasitic losses during (a) charging and (b) discharging.

Thermochemical Heat Storage for Concentrated Solar Power, B. Wong Thermochemical System Reactor Design for Thermal Energy Storage, Phase II Final Report for the period September 30, 2008 through April 30, 2011
46 General Atomics Report GA–C27137
The limitations of the designed system discharge due to reaction and mass flow rates were investigated. Compared to the baseline case, if the reaction rate is effectively reduced by a factor of 100 ( R=0.01), the discharge can still be accomplished within 8 hours [Fig. 6.10(a)] and provide a constant heat outlet at 900°C. Only at much slower reaction rates ( R=0.001) does one observe a failure for the reactor to reach the operation targets. Hence, the reaction kinetics of cobalt-aluminum oxides had been improved to the point that it is no longer a limiting factor in the design for power levels up to 18.75 MWth. In case of higher mass flow rates the limitation is stronger, as seen in Fig. 6.10(b). At the slower reaction rate ( R=0.001) the demanded outlet temperature of 900°C cannot be reached. This serves as a reference for the applicability of TES oxides with slower reaction kinetics.
Fig. 6.10. Influence of (a) reaction and (b) mass flow rates on reactor performance during the discharging process.
In conclusion, a thermochemical heat storage system based on the dissociation and re-oxidation of cobalt monoxide was investigated theoretically in terms of pressure drop, temperature distribution and power level. The proposed design of Table 6.4 is a fixed bed with direct contact between the solid material and the heat transfer fluid (HTF) air. It consists of 8 cylindrical reactor units of ~120-190 MWhth thermal storage capacity. The nominal power is 18.75 MWth per reactor unit which corresponds to a mass flow rate of ~55 kg/s and a charging/discharging time of 8 hours. The solid temperature shifts between 600°C and 1200°C while the outlet temperature is ~900°C according to equilibrium conditions.
Because of the higher temperature level the pressure drop is more critical for the charging process. If 20% parasitic losses can be accepted and a mass flow rate of ~55 kg/s is set, a minimum particle size of 3 cm and a temperature drop of the HTF between inlet and outlet of at least 300 K is required. On the other hand, in a bed of bigger particles heat transfer limitation may become an issue. As an increase/decrease of the outlet temperature could be observed for the charging/discharging process for particle diameters larger than 3 cm, a maximum particle

B. Wong Thermochemical Heat Storage for Concentrated Solar Power, Thermochemical System Reactor Design for Thermal Energy Storage, Phase II Final Report for the period September 30, 2008 through April 30, 2011
General Atomics Report GA–C27137 47
diameter of 3 cm is preferable. Assuming that the reaction kinetics are comparable to those of the powder form, a constant outlet temperature can be achieved during the charging and discharging process. A reduction of the reaction rate could be in principle acceptable down to 1% of kinetics of powder. The investigation of the heat transfer and kinetic limitation is valid for a power level up to 18.75 MWth. In case of higher mass flow rates these limitations may become more critical.


B. Wong Thermochemical Heat Storage for Concentrated Solar Power, Thermochemical System Reactor Design for Thermal Energy Storage, Phase II Final Report for the period September 30, 2008 through April 30, 2011
General Atomics Report GA–C27137 49
7. TES SYSTEM ECONOMICS
For the proposed solid oxide based system to be implemented, the cost must be competitive. Hence, system economics of a CSP integrated with solid oxide based TES were evaluated using the baseline TES system design discussed in Chapter 6. The overall storage cost and levelized cost of electricity (LCOE) were calculated. For comparison purpose, the preliminary economics of a “closed” TES system based on calcium oxide were also evaluated. Published reaction rates were used for this study.
7.1. OXIDE BASED TES SYSTEM FLOWSHEET EVALUATION AND ECONOMICS
Two coupled components of the investigation into oxide TES are evaluation of process flowsheets and the economics of thermal storage and electricity production. It is desired to make collection of solar energy and its subsequent conversion to electricity as efficiently and economically as possible. Thus, material and energy balances are conducted and process components are designed to meet these goals. Economics and thermal efficiency are closely coupled, as tradeoffs must be found to determine the minimum cost. Highest thermal efficiency seldom equates to minimum cost. A crude example of this is illustrated in heat exchanger temperature differences. As temperature differences are minimized, thermal efficiency increases. To accomplish this, however, heat exchanger area increases as well, and this increases cost. Economic considerations are thus integrated as early as possible into process design. Software tools are used to develop process flowsheets based upon rigorous thermodynamic models. Flowsheet data are then used as input for economic evaluation software tools. Finally, design and cost for TES and power generation is integrated into the design for the solar power components. The levelized cost of electricity (LCOE), typically given in $/kWe-h, and capital cost of TES, typically given in $/kWt-h, are the primary economic parameters used to analyze the economic viability of a solar electricity plant design.
7.1.1. The Oxide Cycle Process Flowsheet
The basic components of oxide-based flowsheets are the same for all cases. These compo-nents and the general configuration of the flowsheets are shown in Fig. 7.1. As shown in the figure, each flowsheet contains the following equipment:
• Equipment for collection and transfer of solar thermal energy
• TES equipment, in this case consisting of oxide packed-bed reactors
• Equipment for power generation, most commonly done with steam Rankine cycles
• Equipment for recuperating thermal energy within the process

Thermochemical Heat Storage for Concentrated Solar Power, B. Wong Thermochemical System Reactor Design for Thermal Energy Storage, Phase II Final Report for the period September 30, 2008 through April 30, 2011
50 General Atomics Report GA–C27137
Fig. 7.1. Oxide based TES System Flowsheet Configuration
Oxide-based TES utilizes oxide transitions typically occurring over 500°C, and often near 1000°C. Thus, power tower configurations with heliostat fields are normally considered for solar thermal energy collection. Thermal receivers collect the focused thermal energy and transfer it to the process fluid (air). Packed-bed reactors contain the oxide TES material. Hot air passing through the bed during on-sun hours drives the reduction of the oxide bed, at the cost of lowering the process fluid temperature. Air passing through the oxide beds during off-sun hours is used to oxidize the beds to their original state, and heat is transferred in this case back to the process fluid. Thus, the temperature of the air exiting the packed beds is relatively constant. Steam generators and turbines produce the electricity, and heat exchange recuperators are used to recover heat remaining in the process fluid after power generation.
7.1.2. Methods for Flowsheet Analysis
Four primary tools are used to design and optimize oxide-based flowsheets:
• Aspen Plus® chemical process simulator
• Aspen Process Economic Analyzer
• COMSOL computational fluid dynamics software
• System Advisor Model

B. Wong Thermochemical Heat Storage for Concentrated Solar Power, Thermochemical System Reactor Design for Thermal Energy Storage, Phase II Final Report for the period September 30, 2008 through April 30, 2011
General Atomics Report GA–C27137 51
Aspen Plus® is a chemical process simulation tool used widely within the chemical process industries. It incorporates multiple thermodynamic models and some of the unit operations it is capable of rigorously simulating include heat exchangers, distillation columns, chemical reac-tors, and electric power conversion units. Both chemical and phase equilibria can be predicted, and the chemical reactor models can accept the gas-solid phase redox reactions that take place in the oxide TES packed beds. Sensitivity studies can be done to optimize design parameters. An additional feature is that the heat and material balances can easily be done at any scale. Models which produce one unit of product per time are useful in early calculations of process efficiency, and full-scale plant models can be used to evaluate process equipment at the intended output level.
The Aspen Process Economic Analyzer (APEA) allows for sizing and costing of chemical process equipment. It can be operated as a stand-alone package, or more conveniently, as an add-in to Aspen Plus®. Once a flowsheet is optimized at the desired scale, the equipment sizing and costing features of APEA can be activated and run within Aspen Plus®. This facilitates the use of costing as a criterion early in the design process.
COMSOL is a multi-physics software platform that uses finite element techniques for analysis of complex fluid systems, including reacting flows, as is found in the oxide packed-bed reactors. Important parameters, such as temperature profiles and working fluid pressure drops in the reactors, can be estimated with COMSOL.
The System Advisor Model (SAM) is a simulation tool developed at the National Renewable Energy Laboratory. It allows for preliminary design of several renewable energy technologies, including wind, geothermal, and solar plants. SAM contains a power tower module that allows for design of plants collecting concentrated solar thermal power. A key capability, given the proper inputs, is the prediction of costs for LCOE and TES, and also the plant capacity factor.
Capacity factor quantitatively is the ratio of actual power plant output over the course of one year to the power output if the plant were operating at 100% of capacity for the entire year. Qualitatively, the capacity factor is a measure of several parameters affecting solar plant output, including:
• Plant TES capacity
• Solar multiple
• Annual solar insulation at the plant site As plant TES capacity increases, so does the capacity factor, as the plant is capable of
operating longer during off-sun hours. The solar multiple (SM) is the ratio of solar plant peak thermal capacity to the thermal requirement of the power block at the design point. More energy is available for storage as SM increases. Annual solar insulation is a measure of annual solar energy available at a given site, and also of how the available energy varies over the course of

Thermochemical Heat Storage for Concentrated Solar Power, B. Wong Thermochemical System Reactor Design for Thermal Energy Storage, Phase II Final Report for the period September 30, 2008 through April 30, 2011
52 General Atomics Report GA–C27137
the year. More daylight hours and more thermal energy are available during summer months, for example. To illustrate, Fig. 7.2 is a graph or solar insulation as measured in Daggett, California.
Fig. 7.2. Solar Insulation Variation by Month in Daggett, California (SAM database).
Costs for TES and LCOE were estimated for several oxide cycles over the course of the project, as shown in Figs. 7.3 and 7.4. These cost data, in conjunction with experimental results for actual redox reaction performance, allowed for particular focus on two cycles:
• Mixed Manganese Oxide
• Cobalt Oxide
Fig. 7.3. LCOE for oxide-based TES plants.

B. Wong Thermochemical Heat Storage for Concentrated Solar Power, Thermochemical System Reactor Design for Thermal Energy Storage, Phase II Final Report for the period September 30, 2008 through April 30, 2011
General Atomics Report GA–C27137 53
Fig. 7.4. TES costs for oxide-based TES plants.
The manganese oxide cycle stood out as having the lowest predicted LCOE. However, experimental REDOX performance was only satisfactory when a mixed manganese oxide was used. A detailed cost estimate of manufacturing/preparation of mixed oxides for use at plant scale was not completed before the end of Phase II, but a preliminary study was done for future reference to look at the effect of mixed oxide processing on LCOE. It was found that a maximum cost of $0.50/kg oxide could be incurred for processing (beyond raw ore cost) and keep the LCOE at or below $0.09/kW-he.
The cobalt oxide cycle is of technical interest, as it was a consistently good performer in the laboratory experimental evaluation of REDOX reactions in metal oxides. The cost of the ore is high, however, which makes it a difficult choice on an economic basis. However, the cobalt cycle is useful for illustrating details of the flowsheeting and costing process, as shown in the following section, using the tools described previously.
7.1.3. Costing Example using Cobalt Oxide
Figure 7.5 is an Aspen Plus® graphic describing the major components of the Oxide TES cycles. In it, “CAV1”, “DSTEAM”, and “DPOWER” simulate the solar heat input, the steam generator, and the power turbine components that are already adequately modeled within SAM.
“DBED1” and “DRECUP1” are the components that are not included in the SAM standard template. DBED1 represents the oxide packed-bed reactors, and DRECUP1 is a heat exchanger that recovers energy from the air exiting the steam generator. Aspen Plus® calculates composi-tion, and heat and energy balances for each stream and component. It then links with APEA to size each component at the desired level, and assigns capital and installation costs.
For a 50 MWe cobalt oxide plant, APEA determined that a total of 18 shell-and-tube heat exchangers are required to carry out the heat recovery represented by RECUP1, at a total cost of $10.4 million.
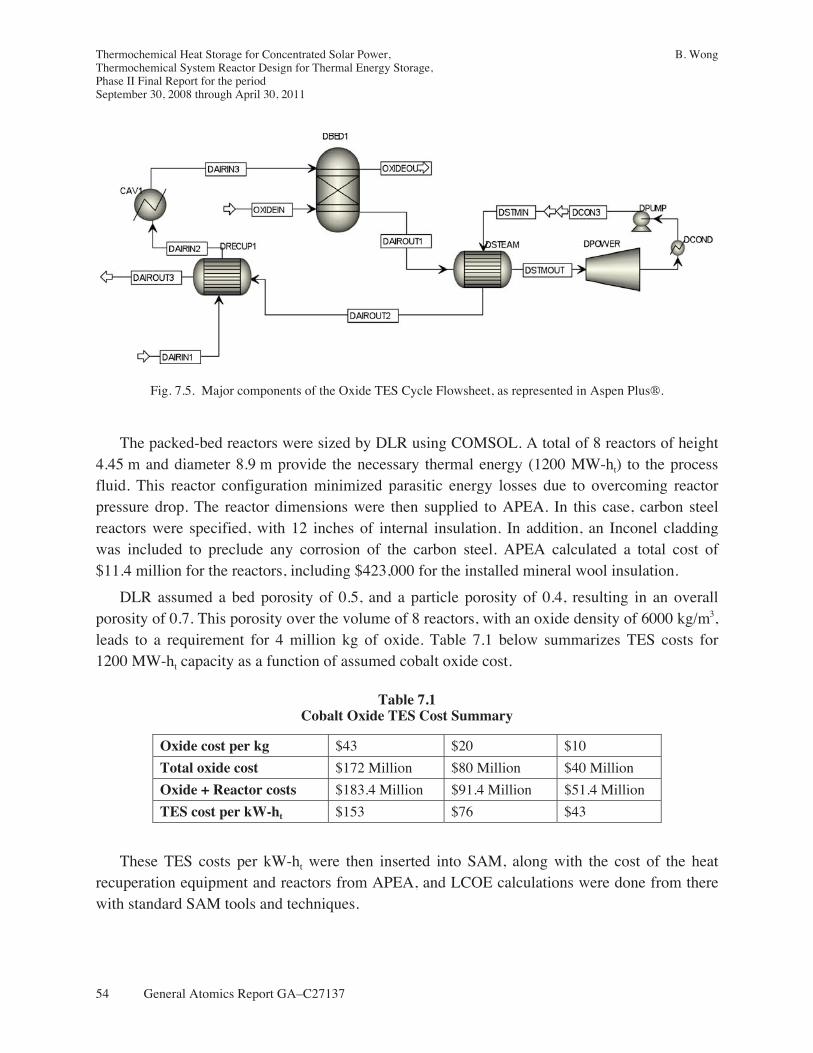
Thermochemical Heat Storage for Concentrated Solar Power, B. Wong Thermochemical System Reactor Design for Thermal Energy Storage, Phase II Final Report for the period September 30, 2008 through April 30, 2011
54 General Atomics Report GA–C27137
Fig. 7.5. Major components of the Oxide TES Cycle Flowsheet, as represented in Aspen Plus®.
The packed-bed reactors were sized by DLR using COMSOL. A total of 8 reactors of height 4.45 m and diameter 8.9 m provide the necessary thermal energy (1200 MW-ht) to the process fluid. This reactor configuration minimized parasitic energy losses due to overcoming reactor pressure drop. The reactor dimensions were then supplied to APEA. In this case, carbon steel reactors were specified, with 12 inches of internal insulation. In addition, an Inconel cladding was included to preclude any corrosion of the carbon steel. APEA calculated a total cost of $11.4 million for the reactors, including $423,000 for the installed mineral wool insulation.
DLR assumed a bed porosity of 0.5, and a particle porosity of 0.4, resulting in an overall porosity of 0.7. This porosity over the volume of 8 reactors, with an oxide density of 6000 kg/m3, leads to a requirement for 4 million kg of oxide. Table 7.1 below summarizes TES costs for 1200 MW-ht capacity as a function of assumed cobalt oxide cost.
Table 7.1 Cobalt Oxide TES Cost Summary
Oxide cost per kg $43 $20 $10
Total oxide cost $172 Million $80 Million $40 Million
Oxide + Reactor costs $183.4 Million $91.4 Million $51.4 Million
TES cost per kW-ht $153 $76 $43
These TES costs per kW-ht were then inserted into SAM, along with the cost of the heat recuperation equipment and reactors from APEA, and LCOE calculations were done from there with standard SAM tools and techniques.

B. Wong Thermochemical Heat Storage for Concentrated Solar Power, Thermochemical System Reactor Design for Thermal Energy Storage, Phase II Final Report for the period September 30, 2008 through April 30, 2011
General Atomics Report GA–C27137 55
The DLR analysis showed that reactor pressure drop is the primary factor in efficient design. COMSOL results confirmed that parasitic losses for air delivered at temperatures near the cobalt oxide transition temperature are unacceptably high, thus DLR increased the temperature until these losses were reduced to a relatively low fraction of plant output. It was found that air at 1200°C allowed the reactors to operate in this way.
However, the combined impact on LCOE of higher peak temperature and remaining system pressure losses is severe. The cost of the solar equipment, primarily due to increased heliostat area, increases considerably. For example, at 9 hours of TES capacity, the LCOE for packed-bed reactor conditions described by DLR is near $0.30/kW-h, as summarized in Fig. 7.6.
Fig. 7.6. SAM output for DLR packed-bed design.
These results, found at the end of Phase II, suggest that a realistic packed-bed reactor design for Oxide TES is not economically competitive. The advanced CFD analysis techniques utilized with COMSOL were crucial in this finding. This configuration is bound by parasitic losses at lower temperatures and high solar field costs at higher temperatures. See the following section for recommended actions in the event that investigations into oxide TES are renewed in the future.

Thermochemical Heat Storage for Concentrated Solar Power, B. Wong Thermochemical System Reactor Design for Thermal Energy Storage, Phase II Final Report for the period September 30, 2008 through April 30, 2011
56 General Atomics Report GA–C27137
7.1.4. Recommendations for Future Economic Improvements
Two avenues for cost reduction could be pursued to reduce LCOE for oxide-based cycles. The first is a change in reactor configuration to a “moving bed” design. This could be a rotary kiln, as is being explored at DLR, or a fluidized bed reactor. A rotary kiln, for example, would not be subject to the pressure drops seen in a packed bed reactor. Advantages stemming from “exergetic efficiency” would also allow for lower peak temperature in the solar collection equipment. Exergetic efficiency can be a measure of how effectively heat is used. It specifically compares the temperature at which heat is utilized to the temperature at which it is collected. An equation illustrating this is:
Exergetic efficiency =
1 298KTdischarge
1 298KTcharge
.
The heat is supplied to the packed bed reactor is at 1200°C (1473 K) and the equilibrium discharge temperature sent to the power generation equipment is near 927°C (1200 K). In this case the exergetic efficiency is 94.2%. A rotary kiln could operate at a charging temperature 50°C high than the discharge temperature, or 1250 K. Thus, the exergetic efficiency of a rotary kiln design would be 98.6%. Ultimately, the reduced pressure drop and lower peak temperature in the rotary kiln design would have significant cost improvement effects.
Lastly, a new design for power generation equipment could be considered. A power cycle based on a working fluid other than steam could provide for increased efficiency. The use of supercritical CO2, for example, in a cycle operating near the oxide transition temperature would minimize heat exchanger temperature differences. Such cycles can be as many as 10 percentage points higher in efficiency compared to steam Rankine cycles. If the cost of equipment were competitive, the increased power conversion efficiency would have a measurable beneficial impact on LCOE.
7.2. CLOSED CYCLE ECONOMICS ASSESSMENT
Preliminary economics of a closed cycle based on calcium carbonate was assessed to determine whether it has any advantage over an open cycle system. In the calcium carbonate (CaCO3) cycle, charging and discharging is based on the release and absorption of CO2:
CaCO3(s) CaO(s) + CO2(g) .
The primary complication is CO2 separation and capture as it is not viable to vent large volumes of CO2 on a continuous basis, so the cycle must be “closed.” Separation of CO2 from the heat transfer fluid (e.g. air) is essential as CaCO3 dissociation requires a very low CO2 inlet concentration due to low dissociation pressure of CO2. In contrast, a high CO2 partial pressure is preferred for CaCO3 formation. These two factors lead to the requirement for separation of low

B. Wong Thermochemical Heat Storage for Concentrated Solar Power, Thermochemical System Reactor Design for Thermal Energy Storage, Phase II Final Report for the period September 30, 2008 through April 30, 2011
General Atomics Report GA–C27137 57
concentration CO2 (3%-7%) from large volumes of air as the cycle progresses. In this case study, a monoethanolamine (MEA) solvent CO2 extraction plant was coupled to a TES flowsheet comprised of packed bed reactors and heat exchange equipment. The estimated LCOE cost of such a plant is $0.31/kW-h. Even though calcium carbonate is extremely cheap, the requirement to extract, compress and stored a CO2 based TES system made it significantly more expensive than the oxide based open loop system.


B. Wong Thermochemical Heat Storage for Concentrated Solar Power, Thermochemical System Reactor Design for Thermal Energy Storage, Phase II Final Report for the period September 30, 2008 through April 30, 2011
General Atomics Report GA–C27137 59
8. SUMMARY
This project investigated the engineering and economic feasibility of using thermochemical cycle based multivalent solid oxides for Thermal Energy Storage (TES). The concept is based on a pair of reduction and oxidation (REDOX) reactions which forms a thermochemical cycle (TC). A list of 16 pure oxides TCs were identified as TES candidates using HSC Chemistry software. The list was narrowed down to 10 based on potential cycle operating temperatures and storage costs. Preliminary laboratory measurements and literature data showed only BaO2, Co3O4, Mn2O3,
CuO, Fe2O3, and Mn3O4 have demonstrated reversibility in their REDOX behavior under ambient conditions. A final down select was carried out and this list was further reduced to the first three oxides as the latter three were judged to be impractical for this application. Additional laboratory measurements revealed that re-oxidation kinetics improvements were needed for BaO2, Co3O4,
and Mn2O3 for them to be used as TES media.
A novel approach to enhance the REDOX kinetics of the three selected oxides was established. This technique incorporates selected secondary oxide into the matrix of the primary oxide via mechanically alloying and annealing. The partial replacement of the primary cation by an appropriate secondary cation gave rise to a charge imbalance in the lattice and increased the density of vacancies. These vacancies enhanced the ionic mass transport and resulted in faster re-oxidation kinetics. For example, the re-oxidation fraction of Mn3O4 Mn2O3 was improved by 16 folds through the addition of iron oxide. Similar enhancements have been observed in cobalt-iron and cobalt aluminum mixed oxides. On the other hand, no improvement was realized in any of the barium mixed oxides. Both manganese and cobalt mixed oxides were shown to exhibit stable REDOX kinetics even after long term thermal cycling. Their TES capacity after cycling was significantly higher than their pure oxide counterpart. This can be attributed partly to the reduced grain size that stemmed from secondary oxide addition. Based on the measurement results, manganese-iron, cobalt-aluminum and cobalt-iron mixed oxides have been proposed for bench top demonstration.
The baseline system concept utilizes a pack bed reactor for charging and discharging of TES oxide. Nevertheless, a moving bed reactor can also be used. The applicability of both approaches was demonstrated repeatedly in the laboratory using cobalt and manganese based oxides. To prepare for the construction of prototype reactors, construction materials compatible with manganese-iron and cobalt-iron mixed oxides were identified. Inconel 625 was found to have the best compatibility with both oxides.
To design the TES system, a reactor model was established. Measured cobalt-aluminum oxide reaction kinetics were applied to the model and the influences of bed properties and process parameters on the overall system design were investigated. The optimal design was found to be a network of eight fixed bed reactors at 18.75 MWth each with charge and discharge

Thermochemical Heat Storage for Concentrated Solar Power, B. Wong Thermochemical System Reactor Design for Thermal Energy Storage, Phase II Final Report for the period September 30, 2008 through April 30, 2011
60 General Atomics Report GA–C27137
temperature between 1200°C and 600°C which provides a constant output temperature of 900°C. The charge and discharge time are 8 hours each respectively. Modeling results also showed that the cobalt-aluminum oxide reaction kinetics are fast and do not pose any limitation to the design. On the other hand, the mass flow rate design point must be carefully defined to minimize parasitic loads and oxide particles at around 3 cm in size work best for the present design.
A process flowsheet of a CSP plant integrated with an oxide based TES system was estab-lished. The system design defined by the reactor modeling work, the cobalt mixed oxide and the appropriate construction materials were incorporated into the flowsheet. The NREL (Solar Advi-sory Model) was used to define the cost of the solar facilities. It was found that the storage cost based on cobalt oxide is around $40 but can potentially decrease to $10 based on reduced materi-als cost on a bulk scale. The corresponding calculated LCOE was between $0.22-0.30/kW-h which also exceeded the DOE target. This cost is due to the high charging temperature required in this first design and the cost of cobalt oxide. It is expected that a moving bed reactor with manganese oxide will significantly decrease the associated cost.
In conclusion, the project demonstrated the engineering feasibility of using multivalent solid oxide for TES applications. A system based on manganese oxide and a rotary kiln has the potential to meet the economics targets. The following table summarizes the planned goal and accomplishments in the project.
GOALS ACCOMPLISHMENTS
Identify a list of potential TC for TES and carry out preliminary evaluation
A list of 16 oxides applicable to the proposed TES concept were found
Establish an experimental protocol to evaluate the TC candidates
A protocol to measure the short and long term REDOX behavior of TES oxide has been established
Carry out a down select to narrow down the list of TC candidates for further development
Manganese, cobalt and barium oxides were selected for further development
Improve the short and long REDOX kinetics of TC candidates
The reaction kinetics of manganese and cobalt based oxides were dramatically improved through the incorporation of mixed oxides
Establish a reactor model based on the REDOX kinetics of the developed oxide
A packed bed model was established. It was used to design a TES system. The sensitivity of reactor per-formance to various process parameters and bed pro-perties was established
Identify materials that can be used for reactor construction
Inconel 625 was selected as the best construction materials after extensive thermal cyclic testing
Design a CSP plant flowsheet integrated with solid oxide based TES and calculate the preliminary economics
A flowsheet that incorporate a CSP plant with a solid oxide based TES system has been established. The TES storage cost and LCOE using cobalt oxide have been defined
Carry out on sun demonstration in a rotary kiln reactor
Charge and discharge of cobalt oxide has been demon-strated in a directly irradiated rotary kiln reactor

B. Wong Thermochemical Heat Storage for Concentrated Solar Power, Thermochemical System Reactor Design for Thermal Energy Storage, Phase II Final Report for the period September 30, 2008 through April 30, 2011
General Atomics Report GA–C27137 61
8.1. PROJECT IMPACT
This project made technical impact in several areas. First, an approach to improve solid oxide REDOX kinetics has been established. This innovation is useful not only for TES but also in the area of high temperature chemical heat pumps, synfuel production, water-splitting and oxygen generators. In addition, it was the first time that a solid oxide based TES concept has been demonstrated in a rotary kiln. The project also demonstrated that such a plant is feasible (from an engineering perspective) and that the compatible engineering construction materials are available. Based on the accomplishment of this project, the European commission has established a sponsorship of a similar project in developing oxide based monolithic materials for thermal heat storage application.


B. Wong Thermochemical Heat Storage for Concentrated Solar Power, Thermochemical System Reactor Design for Thermal Energy Storage, Phase II Final Report for the period September 30, 2008 through April 30, 2011
General Atomics Report GA–C27137 63
ACKNOWLEDGMENT
This work prepared for the U.S. Department of Energy under DE-FG36-08GO18145.


B. Wong Thermochemical Heat Storage for Concentrated Solar Power, Thermochemical System Reactor Design for Thermal Energy Storage, Phase II Final Report for the period September 30, 2008 through April 30, 2011
General Atomics Report GA–C27137 65
APPENDIX A PROGRESS REPORT FROM
GERMAN AEROSPACE CENTER


Progress Report
Date of preparation: 03/11/2011
Thermochemical Heat Storage for Concentrated Solar Power
Thermochemical System Reactor Design
for Thermal Energy Storage
Phase II
Task 7.2 Reactor Design
Award number: DE-FG-08GO18145
Period covered: from 07/15/2010 to 01/15/2011
F. Schaube, A. Wörner, R. Tamme German Aerospace Center
Institute of Technical Thermodynamics
Pfaffenwaldring 38-40
D-70569 Stuttgart

TES Progress Report, II page 2 of 12
1 Preliminary results of phase 1 In phase I, a preliminary study of a possible reactor design with its limitations and specific
requirements for a thermochemical heat storage system was presented. The results were
based on the endothermic dissociation of cobalt monoxide and its exothermic re-oxidation:
A system of 1D partial differential equations and initial and boundary conditions was applied.
It was solved numerically by the Finite Element Method (FEM) using the software COMSOL
Multiphysics® giving a spatial evolution of temperature, pressure and solid density over time.
In the fixed bed reactor the pressured drop and the consequent losses were a main concern.
Therefore modifications of the predetermined reactor design were necessary to meet the
system requirements. For the new design the temperature distribution was calculated for the
discharging process (re-oxidation) and showed promising performance with regard to the
outlet temperature of the reactor. However, the results were strongly depending on the input
parameters such as reaction kinetics.
As in phase II improved data on the reaction kinetics are available, the reactor design as well
as the charging and discharging processes are studied in detail taking into account the new
experimental data. Table 1 shows the desired specifications for such storage system.
2 Properties The solid properties such as
density, porosity, heat capacity,
thermal conductivity and heat of
reaction are summarized in Tab. 2.
In this study the bed porosity b
defines the void fraction of the bed
whereas the particle porosity p
defines the void fraction within the
particle. In case of p<1 the overall
porosity is lower than the bed
porosity b (Eqn.(2)).
The reaction rate is defined by an effectiveness factor R, the dimensionless conversion rate
tX / , the porosity and the maximum and minimum density. For a first analysis, R=1 is
used.
Co3O4+ H 3 CoO + 0.5 O2 . (1)
Table 1: Specifications
Capacity Bed properties Boundary conditions Power
1200 MWhth Fixed bed
> 0.5
d p< 0.1 m
Pin,d: 0.95-0.9 bar
Pin,r: 1 bar
Tin,d: 1000°C-950°C
Tin,r: 600°C
Pd = 150 MWth
Pr = 75-600 MWth
Pcth/Pth < 20%
Table 2: Solid properties
Density at end of discharge, ss 6070 kg/m3
Density at end of charge, s0 5667 kg/m3
Porosity, b 0.5
Porosity, p 0.4
Specific heat, cpR 628+0.12*Ts J/kgK
Specific heat, cpO 328.6+0.55*Ts J/kgK
Particle thermal conductivity, s 1 W/mK
Reaction heat of formation, H 844 kJ/kgCo3O4
= b + p - b p (2)
))(1(R 0/
sssrdR tX (3)

TES Progress Report, II page 3 of 12
The conversion rates for the dissociation and re-oxidation as well as the equilibrium line of
cobalt monoxide with additional 5% of Al2O3 have been determined by General Atomics in
thermogravimetric measurements:
It is assumed that all the solid material takes actively part in the process.
3 Mathematical model The equation system of the mathematical model has been described in detail in the progress
report of phase I. In the following, the equation system is given including an additional mass
balance for the oxygen in Eqn.(9). In addition, the pressure work is taken into account in the
gas energy balance Eqn.(11).
The volumetric heat transfer coefficient hsg is calculated in Eqn.(15) depending on the heat
transfer coefficient h defined by Gnielinski [1], particle surface area, particle diameter and
thermal conductivity of the particles.
Initial conditions are set to:
whereas boundary conditions are set to:
3/228 ))1ln()(1)(/731000exp(1001.1 XXRTt
Xsd
(4)
3/27 ))1ln()(1)(/183801exp(1006.1 XXRTt
Xsr
(P/Peq-1) (5)
Ln(Peq) = -25.422*1000/(Teq)+20.01 (6)
R )(1t
s (7)
Ru)() (t
gg (8)
)Rw1()w(u)(wt
O2O2gO2g (9)
2
g
1-
F
guc u
K
µ P K (10)
)T-(TTRc)T(u)T(ct
Tc gsgpggggpgg
g
pg sgg h (11)
)T-(T)TcHR(t
Tc)-(1 sgsps
s
ps sgs h (12)
1
s
1
10
)1(6
hd
dh p
p
bsg (15)
s0s , 0PP , O2,0O2 ww , 0sg TTT (16)

TES Progress Report, II page 4 of 12
The system of 1D partial differential equations together with the initial and boundary
conditions is solved numerically by FEM using the software COMSOL Multiphysics®. Time
steps and grid are refined until the results do not depend on the number of calculation points
anymore.
3.1 Assumptions
The thermochemical storage is part of an open, not pressurized system.
Air is used as the heat transfer fluid (HTF) and is also the medium to transport the
reactant oxygen. There is direct contact between the air and the solid material.
The storage system consists of cylindrical packed bed reactors containing metal
oxide spheres.
The metal oxide forms stable spherical structures with constant porosity and particle
diameters up to 10 cm. There is no breakage of particles due to volume expansion.
Bed porosity does not change during the process.
4 Reactor design
4.1 Pressure drop In a fixed bed configuration the pressure drop is a main concern. Therefore the mean
pressure drop and its consequent parasitic losses due to pumping power have been
evaluated. The properties of air are needed for the calculation of the pressure drop according
to Eqn.(10). In this preliminary study, air properties at 1 bar and at a mean temperature,
being 1000°C for the discharging and 750°C for the charging process are used [2]. The outlet
pressure is set to 0.91 bar which correlates to an equilibrium temperature of 900°C. The
thermal equivalent of the isentropic compression work is calculated in Eqn.(19) as a function
of pressure drop:
4.1.1 Charging process For the charging process Fig.1 shows the ratio of the thermal equivalent of the compression
work to the maximum thermal power versus the number of tanks. It is assumed that the HTF
is cooled down to the equilibrium temperature of Teq=900°C while passing through the
reactor. A maximum tank diameter of D=2H and a thermal capacity of 1200 MWhth (including
sensible storage according to Tsolid=300 K) is assumed. According to that, the requirement
of 8 h charging time leads to the isentropic compression work depending on particle diameter
as shown on the left side and inlet temperature as shown on the right.
It can clearly be seen that the pressure work reduces with increasing number of tanks. On
the other hand the slope of the lines decreases as well. Therefore a further increase of the
number of tanks only slightly reduces the pressure drop.
In addition, bigger particles and lower requested mass flow rates through the reactor (as a
result of a higher inlet temperature) lead also to lower pressure drops. Assuming a maximum
0)( sn , Pin acc. to min, inO2,O2 ww , 0ing, TT , 0)(Tsn (17)
outPP , 0)(T)(w)( iO2s nnn (18)
1133.0
11
,
out
ininin
gthC P
PmT
MRP (19)

TES Progress Report, II page 5 of 12
acceptable ratio of 20%, the required amount of tanks in case of an inlet temperature of
1200°C and 5 cm particles would be 3, in case of 2 cm particles it would be 8 and in case of
1 cm particles 20 tanks are required. For a particle diameter of 5 cm and a reduced inlet
temperature of 1100°C 11 tanks are required. However, it has to be noted that the thermal
capacity of the tanks includes around 10% per 100 K temperature drop/rise of the solid.
Therefore lower inlet temperatures result in capacities <1200 MWhth.
Because of the quadratic term in Eqn.(10) an inlet temperature of 1000°C which may be
maximum in solar tower systems results in such high pressure drops that the fixed bed
design can not be implemented with theoretical parasitic losses lower than 20%. In that case,
a pressurized system, other bed design options such as fluidized beds or rotary kilns or other
possible reactions with lower equilibrium temperatures have to be considered. If a fixed bed
is realized, a temperature difference of ~300 K between inlet and outlet of the HTF is
preferable.
However, in order to exemplify the thermal performance of such storage system, an inlet
temperature of 1200°C during charge is used in the following. According to that, a design of 8
tanks with a height of 4.45 m and diameter of 8.9 m containing metal oxide spheres of 3 cm
particles is proposed for such storage system. The calculated losses due to the pressure
drop are ~13% if 1200 MWhth are transferred within 8 hours.
4.1.2 Discharging process During the discharging process a temperature difference of 300 K between inlet temperature
and equilibrium temperature is theoretically feasible if the inlet temperature is set to 600°C.
The system can be designed as proposed above if the requirements in terms of power are
equal to those of the charging process. If not, the storage system should be separately
dimensioned for either charging or discharging, depending on which case is more critical in
terms of pressure drop. Tab. 3 shows different possible discharge configurations with regard
to discharge time and power.
If a discharge time of 16 h at a power level of 150 MWth is demanded, the number of tanks
has to be doubled in comparison to the charging process. Also, if 16 h can be performed at
75 MWth the mass flow through the 8 tanks and the power transferred per tank decreases. As
a result, the pressure drop reduces compared to the charging process.
On the other hand, if a discharge time of 4 or 2 h at a power level of 150 MWth is demanded,
higher power levels per tank are required if only 4 or 2 of the 8 tanks should be discharged
(These cases are equal to a 8 tank design at 300 MWth or 600 MWth). Another possibility is to
partially discharge the 8 (or 16) tanks only to an extent of 50%, 25% or 12.5%. The
advantages are lower mass flows or power levels per tank, but additional sensible thermal
losses due to temperature equalization within the tank between the charging and discharging
process are involved.
Figure 1: Compression work during charge: Co3O4+ H 3 CoO+0.5 O2 Influence of particle diameter (left) and inlet temperature (right)

TES Progress Report, II page 6 of 12
There are two options to adjust the power level in a direct contact thermochemical storage
system. First the mass flow rate can be set according to Fig.2. Higher power levels result in
higher mass flows and parasitic losses due to pressure drop. For a required power level of
37.5 MWth or 75 MWth the parasitic losses exceed the requested 20%. Thus, more tanks are
required: Assuming particle diameters of 3 cm, 20 tanks of a height of 3.25 m and a diameter
of 6.5 m or 70 tanks of a height of 2.15 m and diameter of 4.3 m are required, respectively.
Second the inlet temperature can be reduced. In either case it has to be evaluated whether
the reaction kinetics
is still fast enough to
provide the heat of
reaction to rise the
temperature of the
HTF. Higher power
levels per tank may
be a difficult task as
increasing particle
diameters will reduce
the reaction rate.
These questions are
addressed in the
following based on
the thermal
performance of a
fixed bed of a height
of 4.45 m and a
diameter of 8.9 m.
Table 3: Tank capacity of 150 MWhth, discharge configurations
Discharge time
h
Power
MWth
Number of tanks
100% conversion
Number of tanks
x% conversion
Power per tank
MWth
16
16
8
8
4
4
4
4
2
2
2
2
2
75
150
150
150
150
150
300
300
150
150
150
600
600
8
16
8
-
4
-
8
-
2
-
-
8
-
-
-
-
16
-
8
-
16
-
8
16
-
16
9.4
9.4
18.75
9.4
37.5
18.75
37.5
18.75
75
18.75
9.4
75
37.5
Figure 2: Compression work during discharge: 3 CoO+0.5 O2 Co3O4+ H Influence of power level

TES Progress Report, II page 7 of 12
4.2 Thermal performance During the charging or discharging process of the thermochemical reactor heat has to be
provided or removed at a constant temperature level. This can be achieved by setting the
mass flow of the HTF and of the reactant in compliance with the heat transfer and reaction
rate.
In a fixed bed configuration a reaction and heat transfer zone develops as exemplified for the
discharging process in Fig.3. First the incoming air flows through that part of the solid which
has already re-oxidised and has therefore already reached the inlet temperature Tin. Second
the air flow enters the reaction zone where the reaction takes place and heat is transferred
from the solid to the gas. As soon as the equilibrium temperature is reached the reaction
stops and the air flows through the bed at maximum (=equilibrium) temperature. The length
of that zone depends on the reaction kinetics and the heat transfer characteristics. It should
be as short as possible compared to the overall length of the reactor because the outlet
temperature will start to drop once it reaches the
outlet.
The aim of the following investigation is to
classify the limiting parameters with regard to
thermal performance. These could be the heat
capacity of the overall mass flow rate (A), the
feed of the gaseous reactant (B), the solid-gas
heat transfer (C) or the particle reaction rate (D).
Figure 4 shows the outlet temperature as a
function of time for a strong limitation due to
case A, B, C or D. In general, the operating point
of the reactor should be in a range where the
overall mass flow rate is limiting due to the
thermal capacity of the feed flow (case A). In
that case the heat transfer as well as the reaction rate is fast enough to heat the HTF to the
equilibrium temperature. Then the output power
level can be controlled by variation of the HTF mass
flow rate whereas the outlet temperature is constant
throughout the process.
If the heat transfer is limiting (case C) the outlet
temperature will start to drop as soon as the
reaction zone reaches the outlet as it is not long
enough to transfer the required heat to the HTF. In
contrast, in case of strong kinetic limitation or a low
feed of the gaseous reactant (B, D), the outlet
temperature is at a constant level below the desired
outlet temperature. The heat transfer is fast enough
but the reaction proceeds at a low, constant level
throughout the reactor.
4.2.1 Results Table 4 summarizes the specifications of a first design in terms of bed geometry and
properties, boundary conditions and requested power level. Even though in the case of the
charging process the inlet pressure is expected to be 0.95-0.9 bar (outlet of solar plant) and
in the case of the discharging process it is expected to be 1 bar (ambient), an outlet pressure
of 0.91 bars is assumed. This is due to the fact that only the outlet pressure can be set in the
simulation tool if an incoming mass flow is fixed. As this pressure corresponds to an
equilibrium temperature of 900°C whereas 1 bar would result in Teq=905°C, the impact on the
thermal performance is supposed to be negligible at this point. The inlet pressure is expected
Figure 4: Theoretical outlet temperature
Figure 3: Moving reaction zone

TES Progress Report, II page 8 of 12
to be less than 0.96 bar taking into account the effect of pressure drop according to section
4.1.
In this section air properties are calculated as a function of temperature and pressure.
The mass flow rate at the inlet is set according to the nominal power and the maximum
temperature rise of the HTF of 300 K. The overall capacity depends on the sensible storage
of the solid which is ~10%/100 K. Therefore it may vary between 120 (no sensible storage)
and 190 MWhth ( Tsolid=600 K).
The gas and solid temperature change during one cycle is as follows: After the discharging
process the solid temperature is 600°C. Then, during the charging process the air enters the
reactor at 1200°C and is cooled to the equilibrium temperature of 900°C. In the end all solid
material is heated up to the air inlet temperature of 1200°C. During the discharging process
the air enters the storage system at 600°C and is heated up to the equilibrium temperature of
900°C. After the discharging process the solid temperature is again at 600°C.
Figure 5 and 6 show the thermal performance in terms of outlet temperature, conversion,
power and consequent parasitic losses for the charging and discharging process.
In case of the charging process, the outlet temperature first rises to 900°C, heating up the
solid from 600°C to 900°C. Afterwards, we find a constant outlet temperature, conversion
rate and power level in Fig.5. The air mass flow is cooled down to the equilibrium of ~900°C,
releasing 150 MWhth within 6.2 hours. Due to the higher temperature drop of Tsolid=600 K
instead of Tsolid=300 K the overall capacity increases to 190 MWhth instead of the nominal
capacity of 150 MWhth. According to Fig.4 the mass flow rate is the limiting factor.
In constrast to the power level, the parasitic losses due to pressure drop increase during the
process. In the beginning the solid material has temperature of T0=600°C. During the
charging process the reaction zone develops, dividing the reactor into a hot and cold zone.
Thus, the pressure drop increases due to higher gas velocity in the expanding hot zone. The
demand of PC,th/Pth<20% can only be met during the first four hours of the charging process.
Table 4: Design specifications
Geometry, Capacity Bed properties Boundary conditions Power, Mass flow
8x (Ø 8.9m, H=4.45 m)
8x 504 tCo3O4
8x ~120-180 MWhth
b=0.5, p=0.4
dp=0.03 m
Pout,d: 0.91 bar
Pout,r: 0.91 bar
Tin,d: 1200°C
Tin,r: 600°C
8x Pd = 18.75 MWth
8x Pr = 18.75 MWth
8x mair,d =56.4 kg/s
8x mair,r =54.6 kg/s
Figure 5: Performance during the charging process: Co3O4+ H 3 CoO+0.5 O2 Outlet temperature and conversion (left), power and parasitic losses (right)

TES Progress Report, II page 9 of 12
Even though the integral over the first eight hours states 18%, the transient ratio increases
up to 28%. Therefore particle diameters smaller than 3 cm are not acceptable in this fixed
bed design with regard to the pressure drop.
In case of the discharging process the outlet temperature first drops to 900°C, cooling down
the solid from 1200°C to 900°C. Afterwards, it remains constant at that level as seen in
Fig.(6). Therefore the theoretical equilibrium temperature of ~900°C is reached. Similar to the
charging process we find an overall capacity of 190 MWhth. According to Fig.4 the mass flow
rate is the limiting factor.
The pressure drop is reduced with higher conversion because the cold zone expands during
the process. Consequently, the parasitic losses are also diminished due to lower
temperatures during the discharging process.
Figure 7 shows the cold and hot zones along the reactor length which develop in case of the
charging and discharging process. In case of the charging process the reaction zone has a
length of ~1.2 m whereas 90% of conversion are achieved after 0.5 m. In case of the
discharging process it has a length of 0.8 m whereas 90% of conversion are achieved after
0.3 m.
In general, a fixed bed of 3 cm particles shows promising performance in terms of
temperature, power level and pressure drop. The parasitic losses due to pressure drop are
below 18% in case of the charging and below 10% in case of the discharging process.
However, it has to be evaluated in which way the particle size influences the overall process
due to a decreased heat transfer or a reduced reaction rate.
Figure 6: Performance during the discharging process: 3 CoO+0.5 O2 Co3O4+ H Outlet temperature and conversion (left), power and parasitic losses (right)
Figure 7: Reaction zone at t=4 h during the charging (left) and discharging (right) process

TES Progress Report, II page 10 of 12
4.2.2 Limitation due to heat transfer According to Eqn.(15) the particle diameter has an impact on the overall heat transfer
coefficient. Lower heat transfer rates may result in lower outlet temperatures as the heat of
reaction can not be transferred sufficiently to the HTF. Moreover, the particle temperature will
be close to equilibrium because of minor heat exchange. As the reaction kinetics slow down
near equilibrium, the reaction rate is diminished as well. In contrast, smaller particles may
increase the heat transfer rate, shorten the reaction zone and may result in higher outlet
temperatures.
Figure 8 shows the outlet temperature for different particle diameters of 3, 5 and 10 cm for
the charging (left) and discharging process (right), respectively.
In case of the charging process, it can be seen that the outlet temperature remains almost
constant providing consequently a constant power level. The temperature level is slightly
lower for 3 cm or 1 cm particles compared to those of a diameter of 10 cm. This is due to
heat transfer limitation. In case of the charging process heat transfer coefficients of h~180
W/m2K , h~100 W/m
2K or h~60 W/m
2K can be achieved which result in overall volumetric
heat transfer coefficients of hsg~45000 W/m3K, hsg~7800 W/m
3K or hsg~1100 W/m
3K for
particle diameters of 1 cm, 3 cm or 10 cm, respectively. 193 MWhth (dp= 1 cm), 180 MWhth
(dp= 3 cm), or 157 MWhth (dp= 10 cm) could be transferred to the gas within 8 hours,
respectively.
In case of the discharging process, it can be seen that the outlet temperature remains
constant. Only a slight decrease can be observed for a bed of 10 cm particles. Heat transfer
coefficients of h~170 W/m2K , h~100 W/m
2K or h~60 W/m
2K can be achieved which result in
overall volumetric heat transfer coefficients of hsg~44000 W/m3K, hsg~7400 W/m
3K or
hsg~1100 W/m3K for particle diameters of 1 cm, 3 cm or 10 cm, respectively. Similar to the
charging process, the sensible heat of the system almost compensates the limitation due to
heat transfer in case of 10 cm particles. 180-170 MWhth could be transferred to the gas within
8 hours.
In general, a fixed bed of 3 cm particles shows promising performance in terms of heat
transfer. Heat transfer coefficients are in the same range for the charging and discharging
process. However, it still has to be discussed in which way a reduction of the reaction rate
due to increasing particle diameters has a further impact on the process. As dissociation
kinetics were found to be faster as the re-oxidation, this question will be addressed in the
next section with regard to the discharging process.
Figure 8: Performance during the charging (left) and discharging (right) process Influence of particle diameter on outlet temperature

TES Progress Report, II page 11 of 12
4.2.3 Limitation due to the reaction rate Experimental data of kinetics are provided for material in powder form only. Therefore the
exact influence of the particle size on the thermal process can not be determined at this
point. However, it can be discussed to which amount a reduction of the reaction rate would
be acceptable. Therefore in this study varied effectiveness factors are implemented which
result in a variation of the reaction rate according to Eqn.(3).
Figure 9 shows the outlet temperatures (left) and conversions (right) for a fixed bed of 3 cm
particles and different effectiveness factors. In addition, for an effectiveness factor of
R=0.001 the mass flow rates are varied in Fig.10 according to the nominal powers of 18.75
MWth, 37.5 MWth and 75 MWth defined in Tab.3.
Good thermal performance with regard to outlet temperature and conversion can be
observed for reduced reaction rates down to an effectiveness factor of R=0.01. Only for
R=0.001 the level slightly decreases. However, this is only valid for power levels up to 18.75
MWth. In case of higher mass flow rates the limitation is stronger as seen in Fig.10. Assuming
an effectiveness factor of R=0.001, the demanded outlet temperature of 900°C can not be
reached. For a nominal power of 18.75, 37 or 75 MW, the nominal discharge time is 8, 4 or 2
h but only 180, 145 or 94 MWhth could be transferred to the air within that amount of time,
respectively.
Figure 9: Performance during the discharging process, 54.6 kg/sec: 3 CoO+0.5 O2 Co3O4+ H Influence of the reaction rate
Figure 10: Performance during the discharging process, R=0.001: 3 CoO+0.5 O2 Co3O4+ H Influence of the mass flow rate

TES Progress Report, II page 12 of 12
4.3 Conclusion
A thermochemical heat storage system based on the dissociation and re-oxidation of cobalt
monoxide was investigated theoretically in terms of pressure drop, temperature distribution
and power level. The proposed design of Tab.4 is a fixed bed with direct contact between the
solid material and the heat transfer fluid (HTF) air. It consists of 8 cylindrical reactor units of
~120-190 MWhth thermal storage capacity. The nominal power is 18.75 MWth per reactor unit
which corresponds to a mass flow rate of ~55 kg/s and a charging/discharging time of 8
hours. The solid temperature shifts between 600°C and 1200°C while the outlet temperature
is ~900°C according to equilibrium conditions.
Because of the higher temperature level the pressure drop is more critical for the charging
process. If 20% parasitic losses can be accepted and a mass flow rate of ~55 kg/s is set, a
minimum particle size of 3 cm and a temperature drop of the HTF between inlet and outlet of
at least 300 K is required.
On the other hand, in a bed of bigger particles heat transfer limitation may become an issue.
As an increase/decrease of the outlet temperature could be observed for the
charging/discharging process for particle diameters larger than 3 cm, a maximum particle
diameter of 3 cm is preferable.
Assuming that the reaction kinetics are comparable to those of the powder form, a constant
outlet temperature can be achieved during the charging and discharging process. A
reduction of the reaction rate could be in principle acceptable down to 1% of kinetics of
powder.
The investigation of the heat transfer and kinetic limitation is valid for a power level up to
18.75 MWth. In case of higher mass flow rates these limitations may become more critical.
The theoretical performance of the investigated thermochemical storage system is promising
for solar thermal applications. Future work items in order to implement a prototype are
proposed as follows:
Formation of stable particle structures with comparable kinetics
Determination of the impact of particle size on kinetics
Study of tank cost versus cost as a result of pumping power
Investigation of different reactions at lower temperature levels (charging process)
Investigation of different bed configurations, e.g. fluidized beds or rotary kilns
5 References
[1] Gnielinski, V., 2006. “Wärmeübertragung Partikel-Fluid in durchströmten Haufwerken, Abschnitt
Gj”. In VDI-Wärmeatlas, 10 ed.
[2] Span, R., 2006. “Stoffwerte von Luft, Abschnitt Dbb1”. In VDI-Wärmeatlas, 10 ed.

P.O. BOX 85608 SAN DIEGO, CA 92186-5608 (858) 455-3000