thermal-wave microscopy in corrosion studies
TRANSCRIPT
Thermal-Wave Microscopy in Corrosion Studies T i n h N g u y e n National Institute of Standards and Technology Building 226, Room B348, Gaithersburg, MD 20899
INTRODUCTION use of TWM has been limited primarily to the semiconductor industry, a brief sum-
All forms of metallic corrosion cost the mary of the principle and its current ap- United States 4.2% of its gross national plications in material science is presented product [1], about $175 billion per year at in the following section. the present value. Corrosion costs may be reduced by understanding how and why corrosion occurs and then by changing the BACKGROUND AND APPLICATIONS conditions that promote it. The most com- monly used microscopical techniques to
BACKGROUND detect and characterize early corrosion of metals have been scanning electron and In TWM analysis, the specimen is exposed light microscopies. A body of information to a focused beam (Fig. 1), usually a laser has been accumulated in the past several or electron beam, which is generally inten- years demonstrating that a new technique, sity modulated at a frequency in the range thermal-wave microscopy (TWM), has of 100-100 MHz. As the beam scans across considerable promise as a nondestructive the surface, energy is absorbed at or near tool for obtaining information on a mi- the surface of the specimen and causes crometer scale about the surface and near- local periodic heating and thermal expan- surface features of transparent and opaque sion. This periodic heating is the source of materials [2-15]. The technique, which is the thermal waves, which propagate from sensitive to minor variations in the thermal the heated region, while the periodic ther- conductivity of materials (such as those real expansion produces ultrasonic, or caused by grain boundaries, deformed thermoacoustic, waves. Thermal waves structures, and defects), can potentially are diffusive and highly damped waves image the microstructure and corrosion and travel only one to two wavelengths be- products of metal with and without a coat- fore their intensity becomes negligibly ing. We have applied TWM using an elec- small. Although short lived, thermal tron beam as the thermal excitation source waves behave similarly to other propagat- [electron thermal-wave microscopy ing waves, i.e., within their range, they (ETWM)] to study corrosion of bare steel interact with thermal features of the sur- and also of steel under organic protective roundings. Thus, any feature on or be- coatings. This article presents the results neath the specimen surface, but within the of these studies. Because the images re- thermal wave's propagation range with sulting from TWM appear dramatically dif- thermal characteristics different from its ferent from those obtained by light or scan- surroundings, will scatter and reflect ther- ning electron microscopy, and because the mal waves.
291 Published by Elsevier Science Publishing Co., Inc., 1 9 9 2 MATERIALS CHARACTERIZATION 28:291 309 (1992) 655 Avenue of the Americas, New York, NY 10010 1044-5803/92/

292 T. Nguyen
tron beam. In this method, the thermoa- coustic signals, which have a thermal and 1 J,F°CUSE°
l~'d, G~ elastic character, can be detected at high 1~(.,..,...,~,o'. frequency using piezoelectric transducers.
.o.,.c.--~ ~ o~.~I~.~u.~.c, Although the image contrast in the TWM using piezoelectric detector is not yet well
T,E,~',L - - ~FI'~ understood, this system provides striking W VES .~, - 5 microns ::~'~i~
~ ~ M ~ image cont ras t tha t is q u a l i t a t i v e l y d i f fe r - ~^w ~;!~:~ - ent from that observed using other detec-
tS" tion methods and may offer advantages in ~ ~ specific applications.
~.o-5.000 ....... .~ APPLICATIONS OF THERMAL-WAVE MICROSCOPY
Thermal-wave microscopy has found suc- cessful applications both as a research in-
!~o"~G ~ strument for materials science and as a tool ~ / / / / / / / / / , / / ~ / / / / / / / / / . , ~ ~ for on-line characterization of semiconduc-
tor materials and devices. The following I / / ~ ' ~ \ section summarizes some typical examples ACOUST,C O~T~CTO, of such applications. COUPLING (PiezO~lect ric
-,~ .... , ........ , Thermal-wave microscopy is very sen- sitive to minor variations in structure, such
FIG. 1. The physical processes that occur during ther- as disruption in the lattice structure of crys- mal-wave imaging. Reprinted with permission from talline materials. This ability is of consid- Ind. Eng. Chem. Prod. Res. Dev., vol. 24, no. 4, by T. erable utility in metallography, because Nguyen. © 1985 American Chemical Society. different metallic phases or grains can be
readily imaged with no special specimen The penetration depth of thermal waves preparation. Such applications of TWM
is determined by the signal-to-noise ratio using the electron beam as the local ther- and the thermal wavelength, and is about mal excitation source for imaging the mi- one to two thermal diffusion lengths. For crostructures of stainless steel [5], pure alu- typical modulation frequencies between minum [14], weld region of aluminum [16], 100 Hz and 100 MHz, the thermal diffusion low-carbon steel [17], and copper [3] have length varies from 200 to 0.2 p,m for ther- been demonstrated. These microstructures mal conductors and from 20 to 0.02 p,m for can be seen with conventional light or elec- thermal insulators. The spatial resolution tron microscopy only after special speci- is determined by the excitation source and men preparation. TWM can also identify the method of detection, the chemically modified regions, penetra-
There are a wide range of sources and tion depth, and lateral spreading of the im- detection methods in TWM [11, 15], which plantants and dopants [18, 19], which are corresponds to a number of different forms used commonly to modify certain prop- of thermal wave microscopes in use today, erties of materials. These modifications The main detection methods include: gas- cause changes in chemical composition microphone photoacoustics, photothermal and structure and, hence, in the thermal radiometry, optical beam deflection, opti- conductivity; thus, they can be imaged by cal beam reflection, and thermoacoustics. TWM. Several recent reports also de- We have utilized the last method to detect scribed the application of TWM to mea- the thermal waves generated from the elec- surements of the thermal diffusivity of ma-

Thermal-Wave Microscopy 293
terials [20-23]. This parameter is of ira- specimen then exposing it to ambient con- portance in fire resistant coatings, ditions for about 2 weeks. The fourth type insulation foams and extrudates, was KHSO4-induced corrosion, produced
Probably the area in which TWM has by depositing a 4-ram-diameter drop of been utilized the most is detecting me- 0.01M aqueous solution of KHSO4 on the chanical subsurface defects in materials, surface of the specimen. For studies of cot- including cracks, voids, and delaminations rosion under coatings, transparent acrylic, [5, 18, 23, 24]. These subsurface defects are and epoxy, and opaque alkyd coatings not visible with either light or electron mi- were applied on the corroded specimens croscopy. This unique capability of TWM, using a spin coater. All coated specimens which is due to the high sensitivity of ther- were cured for 3 days at room conditions, real waves to scattering and reflection by then postcured for 15 rain at 175°C. The defects, can be used advantageously as a thickness of transparent coatings on pol- nondestructive method for quality control ished specimens was measured experi- during processing of materials. The highly mentally using a scanning spectroscopic damped thermal waves, although difficult reflected light microscope (measures the to detect, also provide a means to profile reflected light spectrum in the 480-700 nm different depths beneath a material's sur- range). The thicknesses of transparent and face [4, 5, 24]. This can be accomplished in opaque coatings on rough specimens and TWM by varying the modulation fre- of opaque coatings on polished specimens quency and the phase of detection. Appli- were estimated on the basis of coating vis- cations of TWM for characterizing coatings cosity and spin speed. By using the pol- [25, 28], detecting corrosion of steel under ished steel specimens coated with trans- organic coatings [27, 28], and studying the parent coatings as references, film thick- wear behavior of Cu-Zn alloys [29] have nesses estimated in this way were found also been reported, to be within the range obtained by the
spectroscopic reflected light microscope
THERMAL-WAVE MICROSCOPY IN technique. CORROSION STUDIES OF STEEL
ELECTRON THERMAL-WAVE SPECIMEN PREPARATION MICROSCOPY INSTRUMENTATION
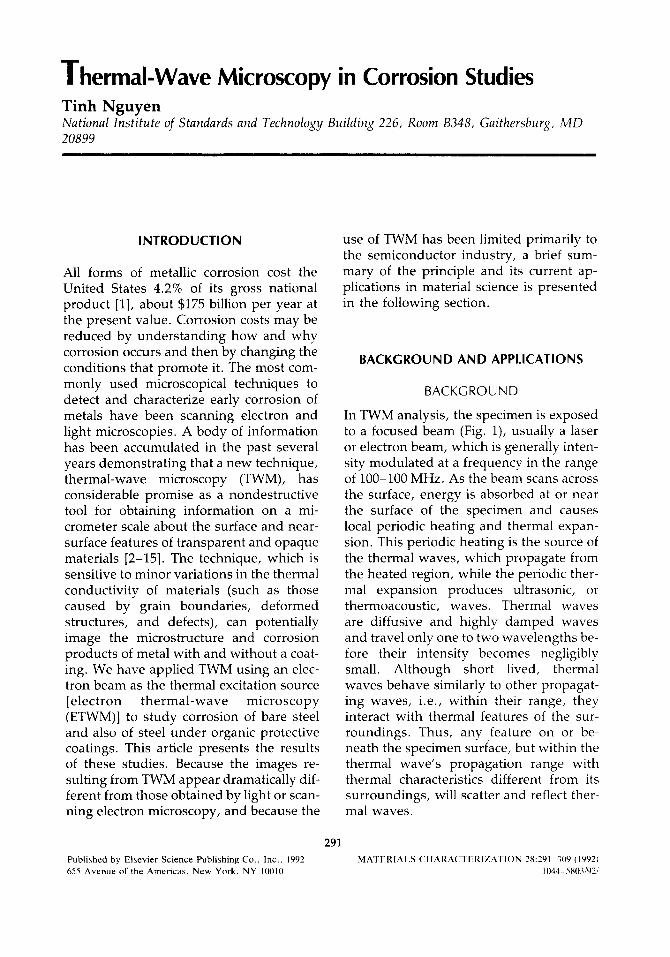
For our experiment, we used low-carbon, Thermal-wave microscopy was performed AISI/SAE 1010 and 1015 cold-rolled steels, on a thermal-wave uni t attached to a scan- either as received (rough specimens) or n ing electron microscope (Fig. 2). Because mechanically pol ished (final pol ishing was ETWM is an accessory to the scanning dec- with a 2-1am diamond paste). Specimens of tron microscope unit, it allows direct com- 25 x 25 x 0.8 mm were degreased and parison of images obtained via detection of then dried and stored in the desiccator be- electrons and thermal waves. The periodic fore use. Four types of corrosion were ex- power source was an electron beam op- amined. The first type was natural corro- erated at 30 keV and modulated at fre- sion, where the specimen was exposed to quencies between 79 kHz and 3 MHz using ambient conditions (24°C and 50% relative electrostatic plates inserted just below the humidity) until visible corrosion products gun anode. For detection of thermal occurred. The second type was humidity- waves, the system employed the thermoa- induced corrosion, produced by placing coustic waves to carry the signal to a pie- the specimen above a water-filled vial for zoelectric transducer mounted beneath the 1 week at ambient conditions. The third specimen. In most cases, we also obtained type was wate r - induced corrosion, backscatter-electron (BSE) images of the achieved by placing a drop of water on the same areas for comparison.
294 T. Nguyen
ELECTRON GUN
/ ~ SCANNING ELECTRON MICROSCOPE (SEMI
7 . . . . . I SEM COLUMN
PLATES I I
BLANKING ,,~o,M,._.. L i i ! IPu,s~, _~.,~v,~-w,v, TRANSOUCER - - ~ ' M,CROyO~E AND PRE AMP ANAL
= . . . . . . . . J t SEM CRT J F[C. 2. A block diagram of the elec- DISPLAY
tron thermal-wave microscopy technique.
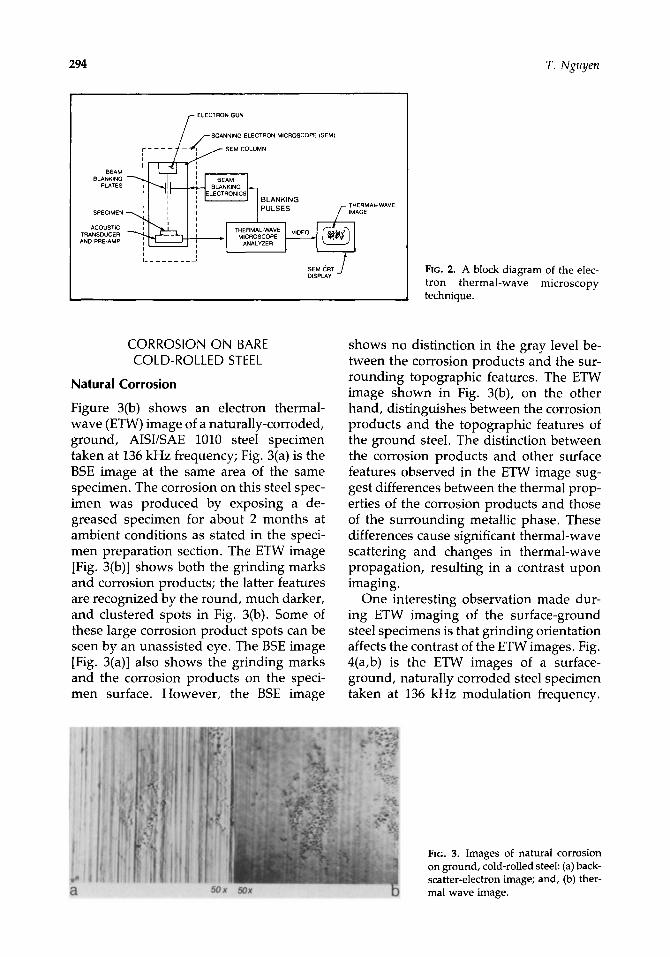
CORROSION ON BARE shows no distinction in the gray level be- COLD-ROLLED STEEL tween the corrosion products and the sur-
Natural Corrosion rounding topographic features. The ETW image shown in Fig. 3(b), on the other
Figure 3(b) shows an electron thermal- hand, distinguishes between the corrosion wave (ETW)image of a naturally-corroded, products and the topographic features of ground, AISI/SAE 1010 steel specimen the ground steel. The distinction between taken at 136 kHz frequency; Fig. 3(a) is the the corrosion products and other surface BSE image at the same area of the same features observed in the ETW image sug- specimen. The corrosion on this steel spec- gest differences between the thermal prop- imen was produced by exposing a de- erties of the corrosion products and those greased specimen for about 2 months at of the surrounding metallic phase. These ambient conditions as stated in the speci- differences cause significant thermal-wave men preparation section. The ETW image scattering and changes in thermal-wave [Fig. 3(b)] shows both the grinding marks propagation, resulting in a contrast upon and corrosion products; the latter features imaging. are recognized by the round, much darker, One interesting observation made dur- and clustered spots in Fig. 3(b). Some of ing ETW imaging of the surface-ground these large corrosion product spots can be steel specimens is that grinding orientation seen by an unassisted eye. The BSE image affects the contrast of the ETW images. Fig. [Fig. 3(a)] also shows the grinding marks 4(a,b) is the ETW images of a surface- and the corrosion products on the speci- ground, naturally corroded steel specimen men surface. However, the BSE image taken at 136 kHz modulation frequency.
~ J ~ i':~!~ ~!~I']~i ~i~ii!~ i ~iii~ o ~ F,o 3 Images o, ~atura, corrosion . . . . . . . . . . . o grou d co, ro,,ed t e,
a 5 0 x ~ . . . . . . . . . . . . . ~ real wave image.
Thermal-Wave Microscopy 295
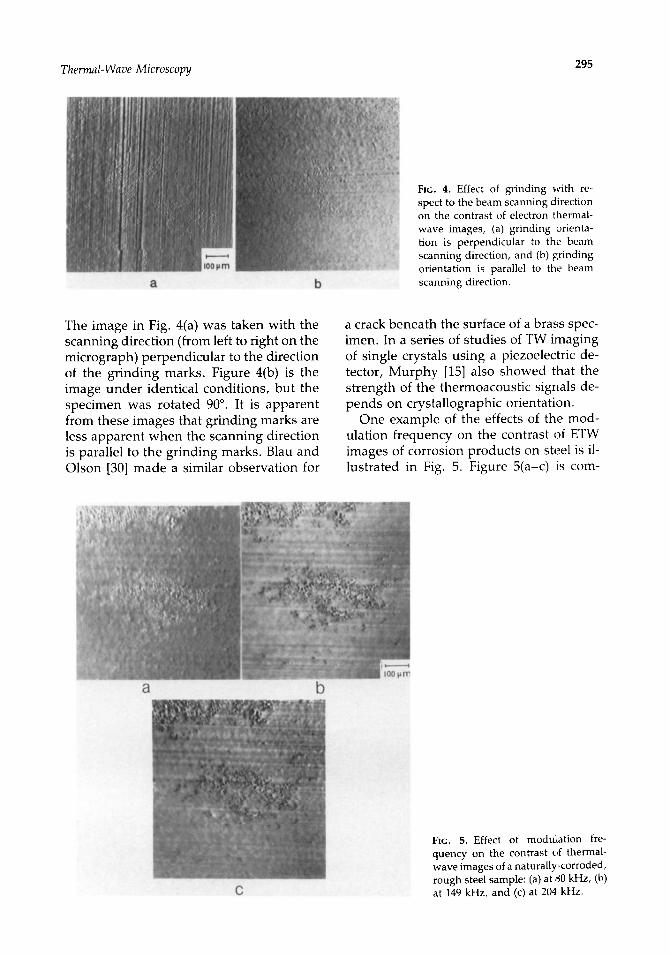
m ii ffect °f gnnding withre- spect to the beam scanning direction on the contrast of electron thermal- wave images, (a) grinding orienta-
F tion is perpendicular to the beam scanning direction, and (b) grinding
100 ~m orientation is parallel to the beam a b scanning direction.
The image in Fig. 4(a) was taken with the a crack beneath the surface of a brass spec- scanning direction (from left to right on the imen. In a series of studies of TW imaging micrograph) perpendicular to the direction of single crystals using a piezoelectric de- of the grinding marks. Figure 4(b) is the tector, Murphy [15] also showed that the image under identical conditions, but the strength of the thermoacoustic signals de- specimen was rotated 90 °. It is apparent pends on crystallographic orientation. from these images that grinding marks are One example of the effects of the mod- less apparent when the scanning direction ulation frequency on the contrast of ETW is parallel to the grinding marks. Blau and images of corrosion products on steel is il- Olson [30] made a similar observation for lustrated in Fig. 5. Figure 5(a-c) is corn-
I0O ~1"~
a b
Fxc. 5. Effect of modulation fre- quency on the contrast of thermal- wave images of a naturally-corroded, rough steel sample: (a) at 80 kHz, (b)
C at 149 kHz, and (c) at 204 kHz.
296 T. Nguyen
posed of ETW images taken at 80, 149, and poorer contrast of the corrosion products 204 kHx modulation frequencies, respec- in Fig. 5(c), image taken at 204 kHz. At this tively, of a naturally corroded, rough, AISI/ frequency, the images highlight features SAE 1010 cold-rolled steel. It is evident close to the surface as evidenced by the from Fig. 5(a-c) that the corrosion prod- more pronounced appearance of the sur- ucts are more clearly resolved, and the con- face roughness features in Fig. 5(c). trast between the corrosion products and
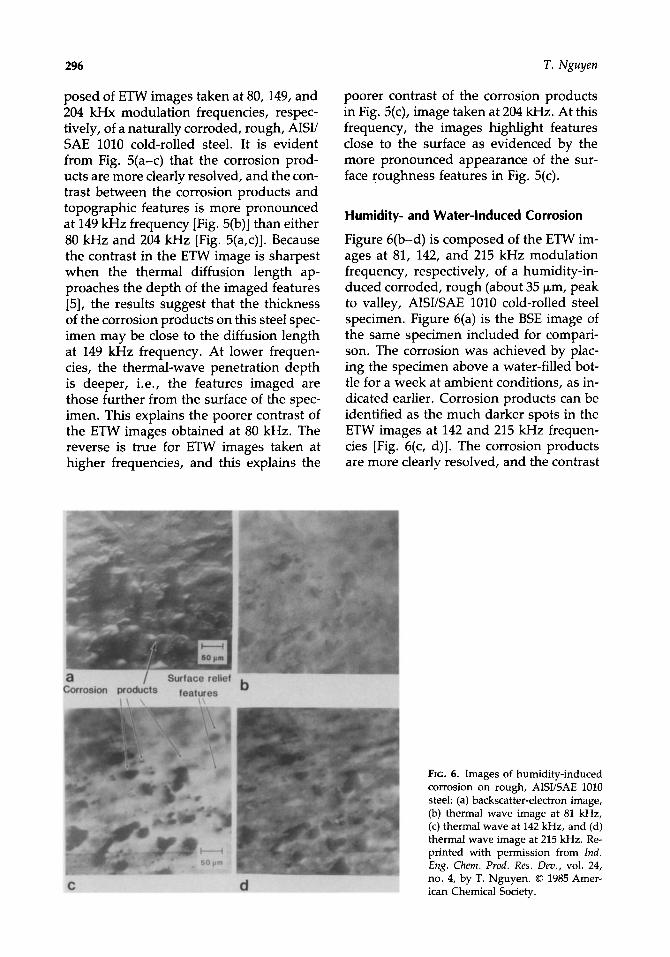
topographic features is more pronounced Humidity- and Water-Induced Corrosion at 149 kHz frequency [Fig. 5(b)] than either 80 kHz and 204 kHz [Fig. 5(a,c)]. Because Figure 6(b-d) is composed of the ETW im- the contrast in the ETW image is sharpest ages at 81, 142, and 215 kHz modulation when the thermal diffusion length ap- frequency, respectively, of a humidity-in- proaches the depth of the imaged features duced corroded, rough (about 35 p,m, peak [5], the results suggest that the thickness to valley, AISI/SAE 1010 cold-rolled steel of the corrosion products on this steel spec- specimen. Figure 6(a) is the BSE image of imen may be close to the diffusion length the same specimen included for compari- at 149 kHz frequency. At lower frequen- son. The corrosion was achieved by plac- cies, the thermal-wave penetration depth ing the specimen above a water-filled bot- is deeper, i.e., the features imaged are tle for a week at ambient conditions, as in- those further from the surface of the spec- dicated earlier. Corrosion products can be imen. This explains the poorer contrast of identified as the much darker spots in the the ETW images obtained at 80 kHz. The ETW images at 142 and 215 kHz frequen- reverse is true for ETW images taken at cies [Fig. 6(c, d)]. The corrosion products higher frequencies, and this explains the are more clearlv resolved, and the contrast
Corrosion pro~cts features D
FIG. 6. Images of humidity-induced corrosion on rough, AISI/SAE 1010 steel: (a) backscatter-electron image, (b) thermal wave image at 81 kHz, (c) thermal wave at 142 kHz, and (d) thermal wave image at 2t5 kHz. Re- printed with permission from Ind, Eng. Chem. Prod. Res. Dev., vol. 24, no. 4, by T. Nguyen. © 1985 Amer-
C d ican Chemical Society.

Thermal-Wave Microscopy 297
between the corrosion products and top- of surface roughness on the ETW images ographic features is more pronounced at of corrosion of cold-rolled steel. Figure 7(a, 142 kHz frequency than at either 81 kHz b) shows the ETW and BSE images, re- or 215 kHz. Figure 6(b-d) again indicates spectively, of a polished (final polishing that, at an appropriate modulation fre- was with 2-p~m diamond paste), humidity- quency, corrosion products on rough steel induced corroded, AISI/SAE 1010 speci- surfaces can be easily identified by ETWM. men. The ETW image was taken at 146 kHz
A comparison of Fig. 6(a) and 6(c) indi- modulation frequency (the frequency that cates that, although the BSE image shows provides the highest contrast). The BSE visible corrosion products and surface and ETW images of the same kind of cor- roughness features on the specimen, it rosion but on a rough specimen were cannot distinguish between them. The shown earlier in Fig. 6(a-d). From Fig. 7(a, ETW image, on the other hand, not only b), it appears that the ETW image of cor- shows clearly both the large and small rosion products on a polished steel surface spots of corrosion products but also clearly is not very clearly resolved and has some- differentiates the corrosion products from what less contrast than that obtained by the topographic features of the rough steel, the BSE technique. This is in contrast to The sharp contrast between the corrosion the corrosion on the rough specimen [Fig. products and the surrounding metallic 6(a-d)], which showed that, at appropriate phase observed in the ETW images, when frequencies, the ETW images have much combined with computerized image anal- better contrast between the corroded and ysis, provides a quick and convenient noncorroded areas than those obtained by method for quantifying the extent of cor- BSE microscopy. This may be due to the rosion on rough metal as will be demon- fact that the rougher specimens have so strated in the quantitative analysis section, much surface roughness that the corrosion
Thermal-wave images do not show the products no longer stand out clearly in the same detail of the surface topography as image obtained by BSE microscopy, which BSE images under the same experimental is quite sensitive to surface topography. conditions. Furthermore, although the ef- Figure 8 presents one example of water- fect of thermal properties on the thermal induced corrosion on a rough, cold-rolled wave characteristics has been docu- steel specimen. Figure 8(a-c) shows the mented, the influence of surface topogra- images at 80, 132, and 149 kHz modulation phy on the thermal wave images is not frequency, respectively, and Fig. 8(d)is the known. We have investigated the effects BSE image. The water droplet extended
I • ~ i ~̧2̧ ~̧ ' ~ '~ ~ ~ i~
50 pm :~ ......... ~ corrosionFIG" 7. ImageSon Ofpolished,humidity-inducedAisi/SAE 1010 steel: (a) thermal wave image,
8 b and (b) backscatter-electron image.
298 T. Nguyen
a ~osion pro~cts b
FIG. 8. Images of water-induced cor-
steel: rosiOn(a_c) on thermal rough, wave AISI/SAE image at 101080,
132, and 142 kHz frequencies, re- um spectively, and (d) backscatter-elec-
c d tron image.
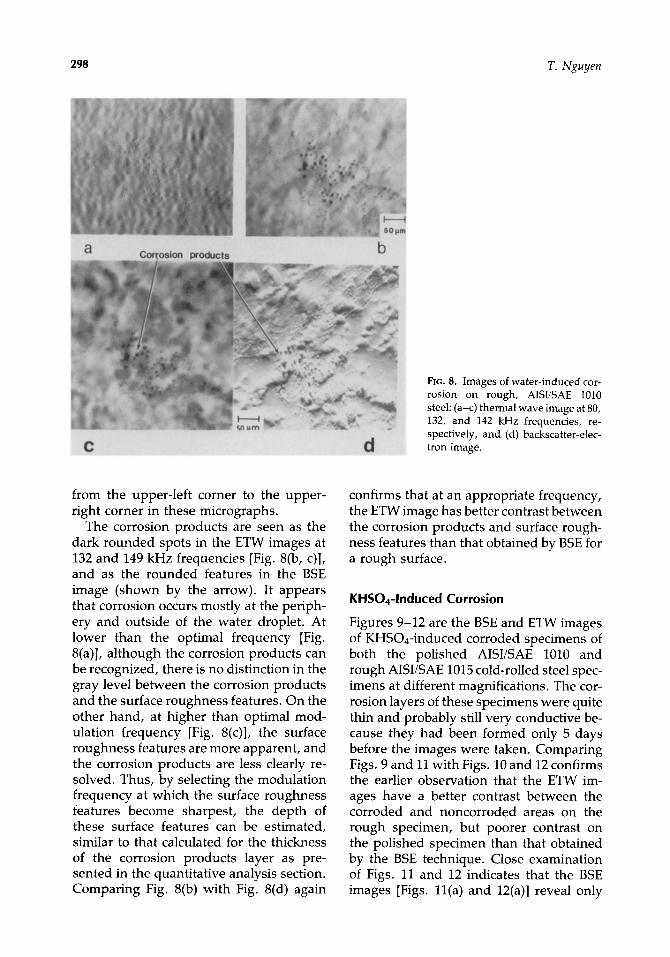
from the upper-left corner to the upper- confirms that at an appropriate frequency, right corner in these micrographs, the ETW image has better contrast between
The corrosion products are seen as the the corrosion products and surface rough- dark rounded spots in the ETW images at ness features than that obtained by BSE for 132 and 149 kHz frequencies [Fig. 8(b, c)], a rough surface. and as the rounded features in the BSE
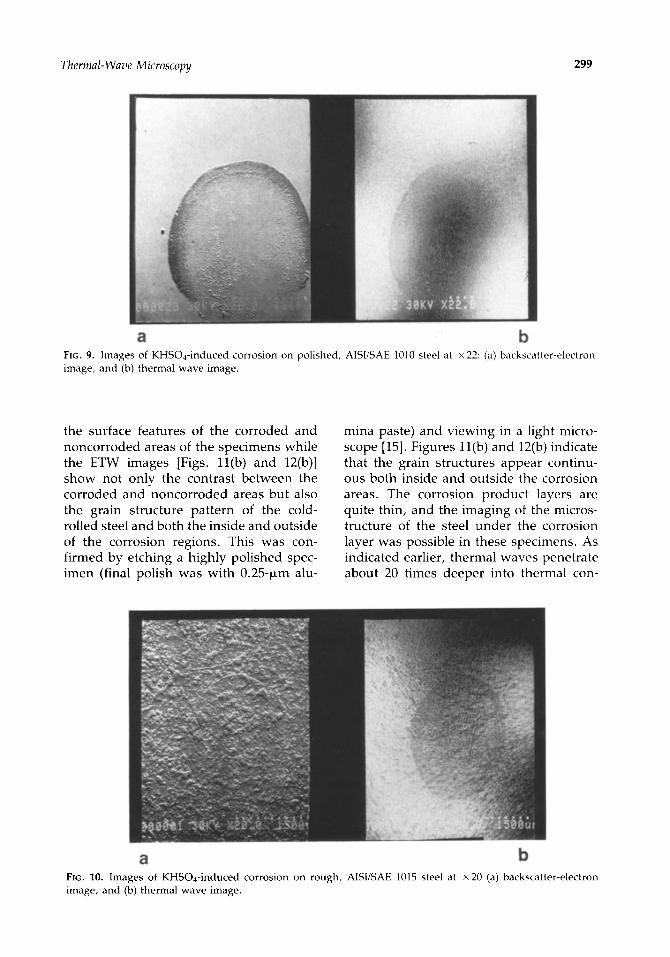
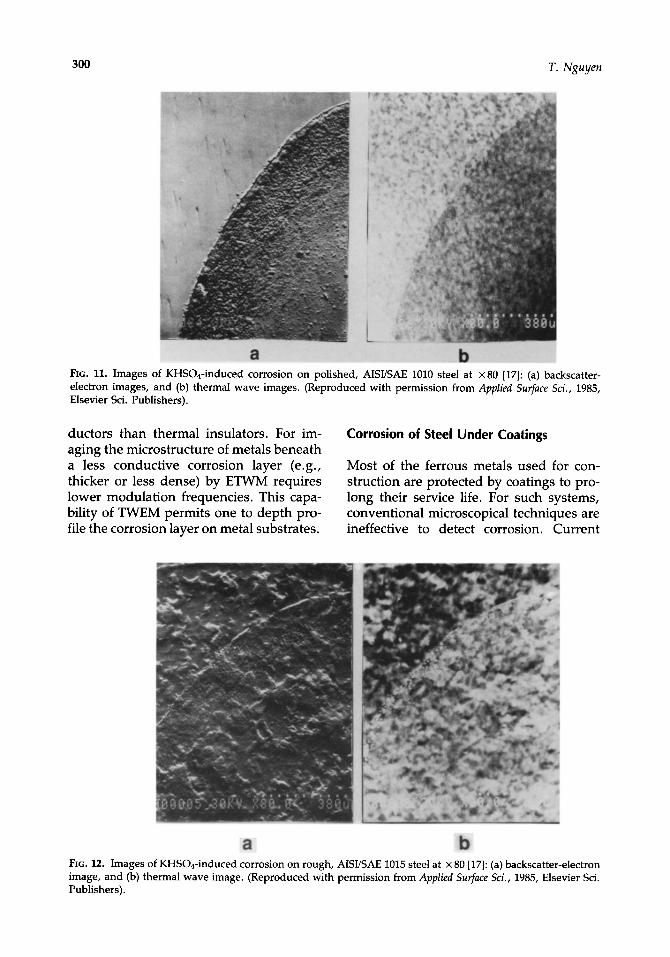
image (shown by the arrow). It appears KHSO4-1nduced Corrosion that corrosion occurs mostly at the periph- ery and outside of the water droplet. At Figures 9-12 are the BSE and ETW images lower than the optimal frequency [Fig. of KHSO4-induced corroded specimens of 8(a)], although the corrosion products can both the polished AISI/SAE 1010 and be recognized, there is no distinction in the rough AISI/SAE 1015 cold-rolled steel spec- gray level between the corrosion products imens at different magnifications. The cor- and the surface roughness features. On the rosion layers of these specimens were quite other hand, at higher than optimal mod- thin and probably still very conductive be- ulation frequency [Fig. 8(c)], the surface cause they had been formed only 5 days roughness features are more apparent, and before the images were taken. Comparing the corrosion products are less clearly re- Figs. 9 and 11 with Figs. 10 and 12 confirms solved. Thus, by selecting the modulation the earlier observation that the ETW im- frequency at which the surface roughness ages have a better contrast between the features become sharpest, the depth of corroded and noncorroded areas on the these surface features can be estimated, rough specimen, but poorer contrast on similar to that calculated for the thickness the polished specimen than that obtained of the corrosion products layer as pre- by the BSE technique. Close examination sented in the quantitative analysis section, of Figs. 11 and 12 indicates that the BSE Comparing Fig. 8(b) with Fig. 8(d) again images [Figs. 11(a) and 12(a)] reveal only
Thermal-Wave Microscopy 299
a b FIG. 9. Images of KHSO4-induced corrosion on polished, AISI/SAE 1010 steel at × 22: (a) backscatter-electron image, and (b) thermal wave image.
the surface features of the corroded and mina paste) and viewing in a light micro- noncor roded areas of the spec imens while scope [15]. Figures 11(b) and 12(b) indicate the ETW images [Figs. 11(b) and 12(b)] that the grain s t ructures appea r continu- show not only the contrast be tween the ous both inside and outside the corrosion corroded and noncor roded areas but also areas. The corrosion p roduc t layers are the grain s t ructure pa t te rn of the cold- quite thin, and the imaging of the micros- rolled steel and bo th the inside and outside t ructure of the steel unde r the corrosion of the corrosion regions. This was con- layer was possible in these specimens. As f i rmed by etching a highly pol ished spec- indicated earlier, thermal waves penet ra te imen (final polish was wi th 0.25-btm alu- about 20 t imes deeper into thermal con-
a b FIG. 10. Images of KHSO4-induced corrosion on rough, AISI/SAE 1015 steel at × 20 (a) backscatter-electron image, and (b) thermal wave image.
300 T. Nguyen
L a b
FIG. 11. Images of KHSO4-induced corrosion on polished, AISI/SAE 1010 steel at x 80 [17]: (a) backscatter- electron images, and (b) thermal wave images. (Reproduced with permission from Applied Surface Sci., 1985, Elsevier Sci. Publishers).
ductors than thermal insulators. For im- Corrosion of Steel Under Coatings aging the micros t ructure of metals benea th a less conduct ive corrosion layer (e.g., Most of the ferrous metals used for con- thicker or less dense) by ETWM requires s truct ion are protected by coatings to pro- lower modu la t ion frequencies. This capa- long their service life. For such systems, bility of TWEM permi t s one to dep th pro- convent ional microscopical techniques are file the corrosion layer on meta l substrates, ineffective to detect corrosion. Current
a b FIG. 12. Images of KHSO4-induced corrosion on rough, AISI/SAE 1015 steel at x 80 [17]: (a) backscatter-electron image, and (b) thermal wave image. (Reproduced with permission from Applied Surface Sci., 1985, Elsevier Sci. Publishers).
Thermal-Wave Microscopy 301
methods to detect and assess the corrosion presents some results of the use of ETWM of painted metals include visual inspection to detect and characterize corrosion of steel without removing the coatings, infrared under both transparent and opaque or- thermography [31], and visual inspection ganic coatings. after destructive removal of the coatings. The first two suffer the drawback that se-
Corrosion under Transparent Coatings vere corrosion may have already occurred before observation, while the third, a de- Our first effort was with relatively thin structive method, may change the nature acrylic coatings, 1.2 ~m thick on the cor- of the phenomena being studied. Because roded steel specimens shown in Figs. 9- the primary advantage of TWM is the abil- 12. Both the BSE and ETW microscopical ity to obtain information on near-subsur- techniques can easily image the corroded face features of transparent and opaque areas under this coating. The imaged ob- materials, it offers promise as a powerful, tained were very similar to those shown in nondestructive technique for detecting Figs. 9-12. Similar to the uncoated speci- and characterizing very early corrosion of mens, the ETW images have better contrast metals under coatings. The successful ap- between the corroded and noncorroded plication of this technique for corrosion areas of the rough steel, and poorer con- studies of coated metals will aid in the de- trast for the polished steel, than those ob- velopment of new and improved coatings, tained by BSE. corrosion inhibitors, accelerated testing Our next investigation was to test the methods for evaluating coated systems, ability of ETWM to detect corrosion of steel and surface preparation techniques of met- under thicker transparent coatings. To ob- als before coating. The following section tain good, clear images by TWM using an
a
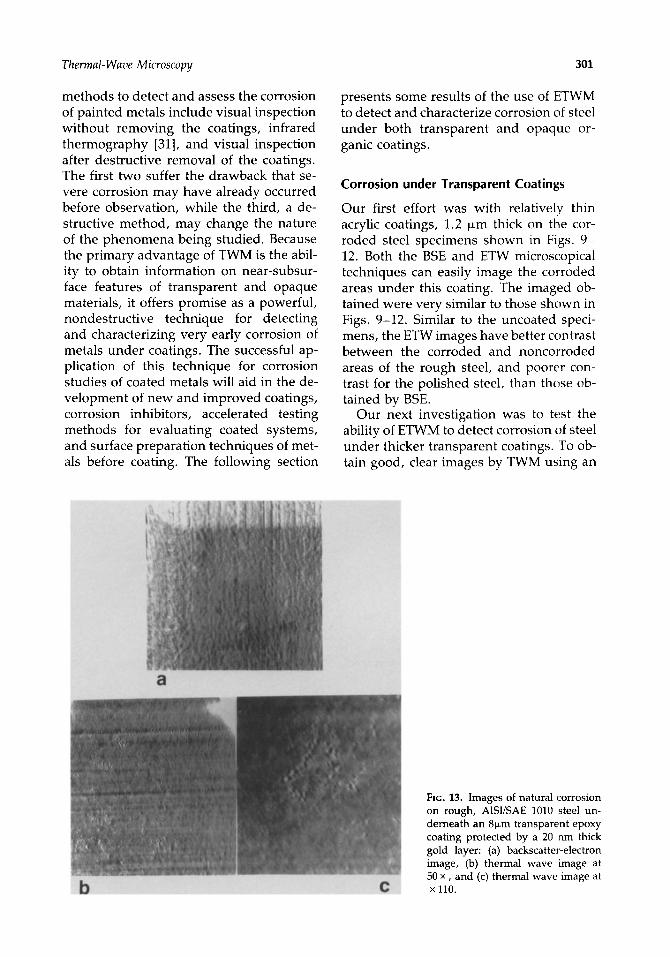
FIc. 13. Images of natural corrosion on rough, AISI/SAE 1010 steel un- derneath an 8~m transparent epoxy coating protected by a 20 nm thick gold layer: (a) backscatter-electron image, (b) thermal wave image at 50 x, and (c) thermal wave image at
b c x 1 1 0

302 T. Nguyen
electron source, the energy level must be 15(a)] indicating that probably some gold maintained relatively high, i.e., >25 keV. and organic coatings have been burned be- At this energy level, organic protective cause of the long time required for deter- coatings of >3 ~m thickness on the steel mining the proper modulation frequency specimens undergo charging and/or burn- for this specimen. Thus, care must be taken ing; hence, application of a thin gold layer in specimen preparation as well as during was required to preserve the organic coat- imaging, particularly for insulating ings during the imaging process. Figures materials. 13 and 14 are the BSE and ETW images of a naturally corroded steel specimen under Corrosion under Opaque Coatings 8 and 12~m thickness, respectively, trans- parent, cross-linked epoxy coatings. The Figures 16 and 17 are the BSE and ETW specimen shown in Fig. 13 was protected images of the humidity-induced corrosion by a 20-nm thick gold layer, and the spec- on rough and polished AISI/SAE 1010 steel imen shown in Fig. 14 was protected by a under a 2-p~m-thick opaque alkyd coating. 40-nm thick gold coating. The ETW images Similar to the uncoated specimens (Figs. 6 presented in Fig. 13(b,c) were taken at 146 and 7), the corrosion products on the pol- kHz frequency, and the ETW image pre- ished specimens are less resolved in the sented in Fig. 14 was taken at 136 kHz fie- ETW images than in the BSE images. For quency. The BSE images [Figs. 13(a) and the coated rough specimen (Fig. 16), the 14(a)] show no evidence of corrosion under BSE image still shows the corrosion prod- the coating, while the ETW images [Figs. ucts and topographic features of the steel 13(b) and 14(b)] show very well the cor- substrate. Imaging of corrosion on pol- rosion under rather thick organic coatings, ished steel, substrate surface features, and
The selection of a proper modulation fre- corrosion on the rough steel under a 2-p~m- quency and the imaging process by ETWM thick opaque coating by the conventional for a particular specimen may take quite a BSE technique may be explained by the long time, sometimes between 30 min to 1 coating method. The spinning action of h. A gold coating on the surface of the spin coating allows the low viscosity resin specimen may also be damaged during this to follow the contours of the raised surface long imaging period. One such example is features and corrosion products rather illustrated in Fig. 15. Figure 15(a, b) shows than filling in the contours. The corrosion the BSE and ETW images of a naturally cor- products and surface roughness features, roded steel specimen under a 10-p~m-thick although covered by the resin, are still epoxy coating, which was protected by a raised from the surface after spin coating. 40-nm-thick gold film. Some corrosion Had the coated surface been flat, the sub- spots are visible in the BSE image [Fig. strate surface features and the corrosion
: ~ F.G. 14. Images of natural corrosion i ~ on rough, AISI/SAE 1010 steel un-
derneath a 12-p~m-thick transparent ~ ~ l l l .... epoxy coating protected by a 40-nm-
thick gold layer: (a) backscatter-elec- tron image, and (b) thermal wave
a b image.
Thermal-Wave Microscopy 303
L a b
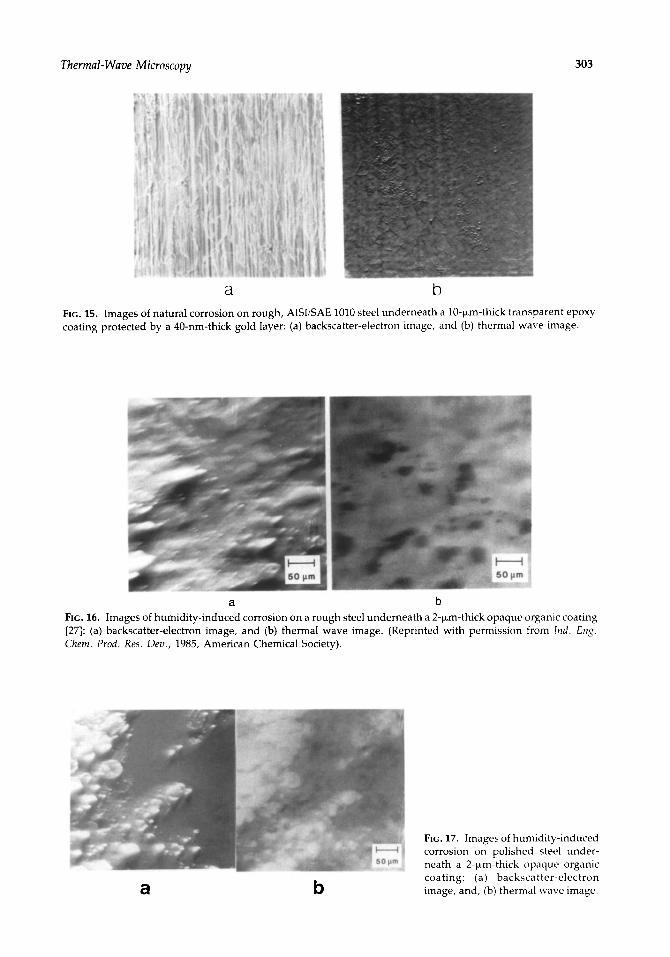
FIe. 15. Images of natural corrosion on rough, AISI/SAE 1010 steel underneath a 10-~m-thick transparent epoxy coating protected by a 40-nm-thick gold layer: (a) backscatter-electron image, and (b) thermal wave image.
so ~m
a b
FIG. 16. Images of humidity-induced corrosion on a rough steel underneath a 2-p,m-thick opaque organic coating [27]: (a) backscatter-electron image, and (b) thermal wave image. (Reprinted with permission from Ind. En~. Chem. Prod. Res. Dev., 1985, American Chemical Society).
FIG. 17. Images of humidity-induced corrosion on polished steel under- neath a 2-~m-thick opaque organic coating: (a) backscatter-electron
a b image, and, (b) thermal wave image.
304 T. Nguyen
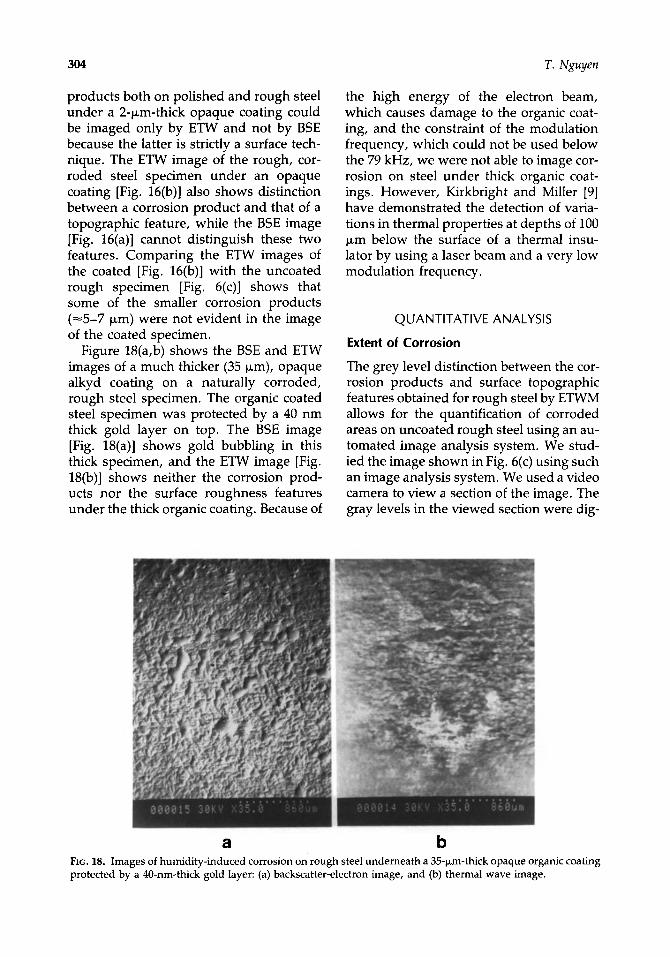
products both on polished and rough steel the high energy of the electron beam, under a 2-1~m-thick opaque coating could which causes damage to the organic coat- be imaged only by ETW and not by BSE ing, and the constraint of the modulation because the latter is strictly a surface tech- frequency, which could not be used below nique. The ETW image of the rough, cor- the 79 kHz, we were not able to image cor- roded steel specimen under an opaque rosion on steel under thick organic coat- coating [Fig. 16(b)] also shows distinction ings. However, Kirkbright and Miller [9] between a corrosion product and that of a have demonstrated the detection of varia- topographic feature, while the BSE image tions in thermal properties at depths of 100 [Fig. 16(a)] cannot distinguish these two I~m below the surface of a thermal insu- features. Comparing the ETW images of lator by using a laser beam and a very low the coated [Fig. 16(b)] with the uncoated modulation frequency. rough specimen [Fig. 6(c)] shows that some of the smaller corrosion products (~5-7 ~m) were not evident in the image QUANTITATIVE ANALYSIS
of the coated specimen. Extent of Corrosion Figure 18(a,b) shows the BSE and ETW
images of a much thicker (35 ~m), opaque The grey level distinction between the cor- alkyd coating on a naturally corroded, rosion products and surface topographic rough steel specimen. The organic coated features obtained for rough steel by ETWM steel specimen was protected by a 40 nm allows for the quantification of corroded thick gold layer on top. The BSE image areas on uncoated rough steel using an au- [Fig. 18(a)] shows gold bubbling in this tomated image analysis system. We stud- thick specimen, and the ETW image [Fig. ied the image shown in Fig. 6(c) using such 18(b)] shows neither the corrosion prod- an image analysis system. We used a video ucts nor the surface roughness features camera to view a section of the image. The under the thick organic coating. Because of gray levels in the viewed section were dig-
a b FIc. 18. Images of humidity-induced corrosion on rough steel underneath a 35-1~m-thick opaque organic coating protected by a 40-nm-thick gold layer: (a) backscatter-electron image, and (b) thermal wave image.
Thermal-Wave Microscopy 305
Corrosion products Surface relief features a
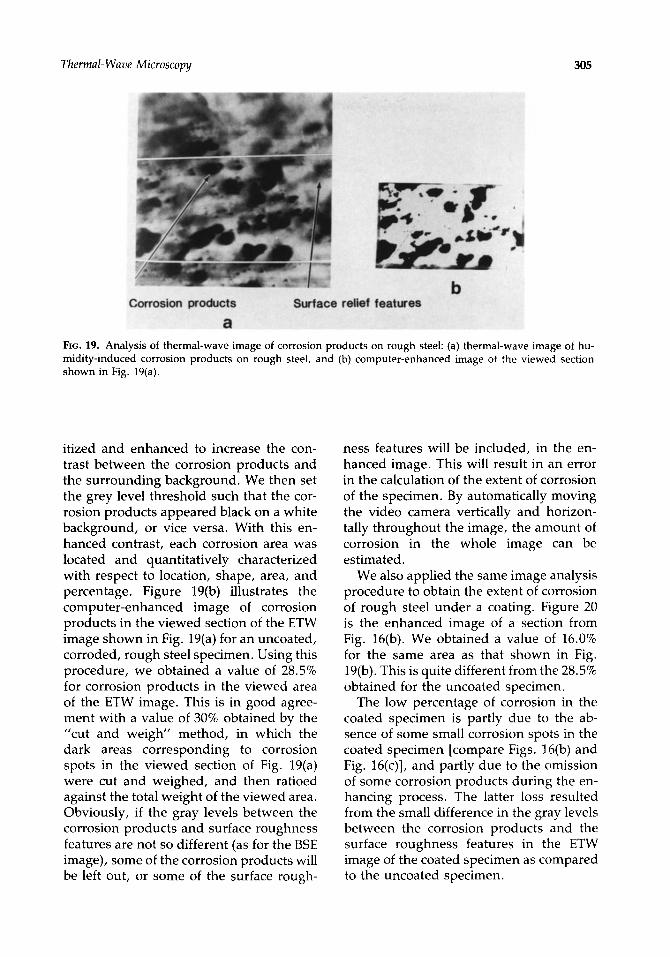
FIG. 19. Analysis of thermal-wave image of corrosion products on rough steel: (a) thermal-wave image of hu- midity-induced corrosion products on rough steel, and (b) computer-enhanced image of the viewed section shown in Fig. 19(a).
itized and enhanced to increase the con- ness features will be included, in the en- trast between the corrosion products and hanced image. This will result in an error the surrounding background. We then set in the calculation of the extent of corrosion the grey level threshold such that the cor- of the specimen. By automatically moving rosion products appeared black on a white the video camera vertically and horizon- background, or vice versa. With this en- tally throughout the image, the amount of hanced contrast, each corrosion area was corrosion in the whole image can be located and quantitatively characterized estimated. with respect to location, shape, area, and We also applied the same image analysis percentage. Figure 19(b) illustrates the procedure to obtain the extent of corrosion computer-enhanced image of corrosion of rough steel under a coating. Figure 20 products in the viewed section of the ETW is the enhanced image of a section from image shown in Fig. 19(a) for an uncoated, Fig. 16(b). We obtained a value of 16.0% corroded, rough steel specimen. Using this for the same area as that shown in Fig. procedure, we obtained a value of 28.5% 19(b). This is quite different from the 28.5% for corrosion products in the viewed area obtained for the uncoated specimen. of the ETW image. This is in good agree- The low percentage of corrosion in the ment with a value of 30% obtained by the coated specimen is partly due to the ab- "cut and weigh" method, in which the sence of some small corrosion spots in the dark areas corresponding to corrosion coated specimen [compare Figs. 16(b) and spots in the viewed section of Fig. 19(a) Fig. 16(c)], and partly due to the omission were cut and weighed, and then ratioed of some corrosion products during the en- against the total weight of the viewed area. hancing process. The latter loss resulted Obviously, if the gray levels between the from the small difference in the gray levels corrosion products and surface roughness between the corrosion products and the features are not so different (as for the BSE surface roughness features in the ETW image), some of the corrosion products will image of the coated specimen as compared be left out, or some of the surface rough- to the uncoated specimen.

306 T. Nguyen
FIG. 20. Computer-enhanced image of a section of the thermal-wave image of corrosion products under an opaque coating shown in Fig.
.~lLl , . ~ ; 16(b).
Sizes and Thickness of Corrosion Products length, f, can be estimated using the
There are still some debates about what expression [5]:
mechanism contributes to the image con- f = (2K/oCto)l/2 trast observed in a thermal wave micro- scope using a thermoacoustic transducer, where K is the thermal conductivity, p is For example, Rosencwaig [5, 6] has sug- the density, C is the heat capacity, and to gested that thermal contrast mechanisms is the modulation frequency. Although are the principal mechanisms responsible there was no independent method to relate for imaging the microstructure of materi- the thermal diffusion length and modula- als, and that the resolution is determined tion frequency performed in this study, it by the beam spot size and the thermal is believed that the main mechanism con- wavelength. On the other hand, Briggs tributing to the ETW images of corrosion [32] has stressed the importance of elastic products observed in this study was de- and other nonthermal contrast mecha- rived from the thermal component because nisms in the image obtained by this detec- these are microscopic and very near sur- tion method. Murphy [14] has also dem- face features. Thus, the previous expres- onstrated that for subsurface features that sion is used here for estimating the thermal are much deeper than the diffusion length diffusion length in corrosion products and of the thermal wave, the contrast mecha- the thickness of the corrosion products nism must be nonthermal. However, Mur- layer. phy has shown that the boundary contrast The corrosion products layer formed on observed in the images of the grain struc- the surface of steel contain mostly iron ture of aluminum is due to the thermal oxide of the hydrous form Fe203 [33]. This component, and that the thermal diffusion material likely becomes anhydrous under length is a function of modulation fre- scanning microscope conditions. By using quency. This supports the earlier asserta- K, p, and C values of Fe203 for the corro- tion by Rosencwaig that the thermal corn- sion products, the thermal diffusion length ponent plays a major role in the TW image of corrosion products shown in Fig. 6(c) is of the microstructure. For a system where 5.5 ixm at 142 kHz frequency. This value the thermal component is the main con- will vary depending upon corrosion prod- trast mechanism, the thermal diffusion ucts properties such as the macrostructure

Thermal-Wave Microscopy 307
and microstructure, density and chemical provide micrometre-level resolution of sur- composition. However, the use of K, p, face and subsurface features of opaque and and C values of Fe203 for the corrosion transparent specimens. It has the capabil- products in the specimen shown in Fig. 6 ity of detecting variations in the micros- are probably correct because the corrosion tructure, such as grains and grain bound- products on the surface of this specimen aries or changes in the chemical composi- are still in the early stage of their forma- tion. It has also been demonstrated that tion. Unlike the corrosion products of pure TWM is an excellent nondestructive tool to steel, which are loose and powdery, the detect near subsurface mechanical defects, corrosion products of low-alloy steel tend such as voids, cracks, and delaminations. to be compact and adherent [33]. Actual This article reports on the use of (electron) measurements of the smallest imaged cor- ETWM for the studies of corrosion of bare rosion spots in Fig. 6(c) are in the range of steel and steel under organic coatings. the calculated f values. It has been sug- Four types of laboratory-induced corrosion gested that because thermal wave micro- were studied; these include KHSO4-in- scopes normally operate in the extreme duced, humidity-induced, water-induced, near-field limit, resolutions that are orders and natural (exposed to 24°C and 50% rela- of magnitude better than a thermal wave tive humidity conditions) on polished and length (2~r~) may be possible [34]. The re- rough cold-rolled steel specimens. Opaque sults obtained in this study suggested that coatings up to 35 ~m thickness and trans- the smallest resolvable corrosion products parent coatings up to 12 ~m thickness ap- seem to be limited by the thermal diffusion plied on the corroded specimens were ex- length, which is in agreement with Ro- amined. The ETWM system consists of a sencwaig's view [5]. thermal-wave unit attached to a conven-
The contrast in the ETW image is sharp- tional scanning electron microscope. For est when the thermal diffusion length ap- ETWM, the electron beam was modulated proaches the depth of the imaged features, at frequencies between 79 KHz and 2 MHz; By using this principle, the thickness of the and the detector was a piezoelectric trans- corrosion products can be estimated. For ducer mounted underneath the sample. At example, the thickness of the steel corro- appropriate modula t ion frequencies, sion products shown in Fig. 8 is 6 ~m at ETWM was shown to provide better con- 132 kHz, the frequency at which the cor- trast between the corrosion products and rosion products are most clearly resolved the surface topographic features on rough and the contrasts are most pronounced, steel but poorer contrast on the polished The imaging depth of thermal waves specimen than that obtained by the BSE ranges between one and two thermal dif- technique. The sharp contrast between the fusion lengths. For newly formed and com- corroded and noncorroded areas on rough pact steel corrosion products, such as those steel obtained by ETWM, combined with shown in Figs. 6 and 8, the imaging depth image analysis, allows calculation of the of thermal waves using electrons as the ex- extent of corrosion and an estimation of the citation energy source is about 11 ~m at 142 thickness of the corrosion layer on rough kHz frequency. Imaging thicker and less steel. The diffusion lengths of ETWM in conductive corrosion layers requires much corrosion products are in the range of 1 p~m lower modulation frequencies, similar to at 5 MHz and 6 p,m at 132 kHz. the case for imaging polymeric materials. ETWM was shown to be capable of im-
aging micrometre-sized corrosion products of steel under rather thick transparent and S U M M A R Y A N D C O N C L U S I O N S opaque coatings. This technique can be
Thermal-wave microscopy, which em- used for estimating the thickness and ther- ploys heat flow to probe variations in the mal properties of the corrosion layer. thermal properties of solid materials, can When combined with image analysis, this

308 T. Nguyen
technique also provides a quick and con- 9. G. F. Kirkbright and R. M. Miller, Thermal-wave v e n i e n t w a y for q u a n t i f y i n g the e x t e n t of imaging of optically thin films utilizing the pho- c o r r o s i o n o n r o u g h s tee l s p e c i m e n s . H o w - toacoustic effect, The Analyst 10:798 (1982). eve r , t h e h i g h i n t e n s i t y of t h e e l e c t r o n 10. A. Mandelis(ed.), Photoacousticand Thermal-Wave
Phenomena in Semiconductors, North-Holland, b e a m t e n d s to d a m a g e o r g a n i c c o a t i n g s of New York (1987). 3 ~ m or th icker . A l t h o u g h E T W M is p o - 11. R. L. Thomas, L. D. Favro, and P. K. Kuo, Ther- t en t i a l l y a u s e f u l n o n d e s t r u c t i v e t e c h n i q u e mal-wave imaging for nondestructive evaluation, to d e t e c t a n d a s s e s s v e r y ea r ly c o r r o s i o n Can. J. Phys. 64:1234 (1986). o n r o u g h s tee l , w i t h a n d w i t h o u t a c o a t i n g 12. L. D. Favro, S. M. Shepard, P. K. Kuo, and R. L. f i lm, t he effects of su r face p r e p a r a t i o n Thomas, Mechanisms for the generation and scat- cha rac te r i s t i c s , s u c h as su r face r o u g h n e s s , tering of sound and thermal waves in thermoa-
coustic microscopes, Photoacoustic and Photother- g r i n d i n g o r i e n t a t i o n w i t h r e s p e c t to t he real Phenomena, Vol. 88, Springer-Verlag, New r a s t e r i n g d i r e c t i o n of t he e l e c t r o n b e a m , York (1988), pp. 370-376.
e tc . , o n the c o n t r a s t of t he ETW i m a g e s , i3. J. Opsal and A. Rosencwaig, Physics of thermal- a re n o t c lear a t th is t ime . F u r t h e r r e s e a r c h wave of NDE of semiconductor materials and de- i n th is a rea , a n d in t h e a p p l i c a t i o n of l o w e r vices, MRS Bulletin 13:38 (1988). e n e r g y b e a m s as t he exc i t a t ion sou rce , is 14. j. c. Murphy, J. W. Maclachlan, and L. C. Aa- n e e d e d b e f o r e t he full p o t e n t i a l of E T W M modt, Image contrast processes in thermal and
thermoacoustic imaging, IEEE Trans. Ultrason., as a n o n d e s t r u c t i v e t e c h n i q u e to cha rac - Ferro., Freq. Contr. UFFC-33:529 (1986). t e r i ze c o r r o s i o n of s tee l , w i t h a n d w i t h o u t 15. J. c. Murphy, J. w. Maclachlan, and L. C. Aa- p r o t e c t i v e coa t i ngs , can b e r ea l i z ed , modt, The role of thermal wave techniques in ma-
terials characterization, Intl. Adv. NDT, 14:175- This work was supported by the Office of Non- 218 (1989). destructive Evaluation, National Bureau of 16. Subsurface Microstructural Images of Metals by Ther- Standards. I thank Larry Kaetzel, Building Ma- real-Wave Microscopy, Technical Report No. 83.02, terials Division, National Bureau of Standards Therma-Wave, Inc., Fremont, CA. (1983). for his assistance in carrying out the computer 17. T. Nguyen and A. Rosencwaig, Thermal-wave
microscopy and its application to imaging the mi- image analysis, crostructure and corrosion of cold-rolled steel,
Appl. Surface Sci. 24:57 (1985). 18. A. Rosencwaig, Thermal-wave microscopy, Solid
References State Technol. 25:91 (1982). 19. A. Rosencwaig, Thermal wave characterization
1. L. H. Bennett et al., Economic effects of metallic and inspection of semiconductor materials and corrosion in the United States, NBS Special Pub- devices, Photoacoustic and Thermal-Wave Phenomena
in Semiconductors, North-Holland, New York lications 511-1, National Bureau of Standards, Gaithersburg, MD (1978). (1987), pp. 97-133.
2. A. Rosencwaig, Photoacoustics and Photoacoustic 20. P. K. Kuo et al., Mirage-effect measurement of thermal diffusivity, part I: experiment, Can. J. Spectroscopy, J. Wiley and Sons, New York (1980). Phys. 64:1165 (1986).
3. G. S. Cargill III, Electron-acoustic microscopy, 21. C. B. Reyes et al., Reflection-mirage measure- Phys. Today 34:27 (1981).
ments of thermal diffusivity, Review of Progress in 4. J. Opsal and A. Rosencwaig, Thermal-wave depth Quantitative Nondestructive Evaluation, Vol. 6A
profiling: theory, J. Appl. Phys. 53:4240 (1982). Plenum Press (1987), pp. 271-275. 5. A. Rosencwaig, Thermal-wave imaging, Science 22. P. Cielo, L. A. Utracki and M. Lamontagne, Ther-
218:223 (1982). mal-diffusivity measurements by the converging- 6. A. Rosencwaig, Thermal-wave imaging in a scan- thermal-wave technique, Can. J. Appl. Phys.
ning electron microscope, Ann. Rev. Mater. Sci. 54:6245 (1983).
15:103 (1985). 23. K. R. Griceetal., Thermal-waveimaging of closed 7. G. Birnbaum and G. S. White, Laser techniques cracks in solids, J. Appl. Phys. 54:6245 (1983).
in NDE, Research Techniques in Nondestructive Test- 24. S. Y. Zhang and L. Chien, Photoacoustic micros- ing, pp. (259-36), vol. 7, Academic Press, Lon- copy and detection of subsurface features of semi- don, (1984), pp. 259-365. conductor devices, Photoacousticand Thermal-Wave
8. T. Nguyen and A. Rosencwaig, Thermal-wave Phenomena in Semiconductors North-Holland, microscopy, Chemtech 16:635 (1986). (1987), pp. 27-51.

Thermal-Wave Microscopy 309
25. J. C. Murphy, J. W. Maclachlan and L. C. Aa- 30. P. J. Blau and C. D. Olson, Thermal-wave mi- modt, Thermal imaging of barrier coatings on re- croscopy for use in near surface crack depth and fractory substrates, Review of Progress in Quanti- orientation determination in metallic materials, tative Nondestructive Evaluation Plenum Press, National Bureau of Standards, Internal Report New York, (1987), pp. 245-252. No. NBSIR 85-3187, (1985), pp. 151-155.
26. ]. Jaarinen et al., Thermal wave characterization 31. M. E. McKnight and J. W. Martin, New concepts of coated surfaces Review of Progress in Quantitative for coating protection of steel structure, American Nondestructive Evaluation Plenum Press, New Society for Testing and Materials, Philadelphia, York, (1987), pp. 1347-1352. ASTM STP 841, (1984), pp. 13-20.
27. T. Nguyen, Thermal-wave imaging of the mi- 32. G. A. D. Briggs, Scanning electron acoustic mi- crostructure and corrosion of cold-rolled steel croscopy and scanning acoustic microscopy: a fa- under protective coatings, Ind. Eng. Chem. Prod. vorable comparison, Scan. Elec. Microscopy Res. Dev. 24:496 (1985). 3:1041 (1984).
28. T. Nguyen and M. E. McKnight, Nondestructive 33. H. H. Uhlig, Corrosion and Corrosion Control, 2nd early detection of corrosion and delamination ed., J. Wiley & Sons, New York, (1971). under protective coatings using thermal-wave mi- 34. L. J. Inglehart et al., Spatial resolution of thermal croscopy, National Bureau of Standards, Internal wave microscopes, Appl. Phys. Lett. 43:446 Report No. NBSIR 85-3187, (1985), pp. 139-150. (1983).
29. P.J. Blau and C. D. Olson, An application of ther- mal-wave microscopy to research on sliding wear break-in behavior of a tarnished Cu-15 wt%Zn alloy, Proc. Wear Materials, ASME, New York, (1985), pp. 424-431. Accepted January 1992.