thermal performance for greenhouse heating by …
TRANSCRIPT
BIOLOGICAL ENGINEERING
Misr J. Ag. Eng., July 2014 - 1095 -
THERMAL PERFORMANCE FOR GREENHOUSE HEATING BY USING EARTH-TUBE HEAT EXCHANGER DURING WINTER SEASON
Abd El- Latif1, S. M.; Radwan2, S .A.; Hassanain2, A. A.;
El-Sheikh2, I. H. and Kishk, S. S2.
ABSTRACT
In this research work an attempt has been made to analysis the thermal
performance of the earth-tube heat exchanger (ETHE) during winter
season of 2012-2013 (December to March). The experimental work was
executed in the experimental farm of Faculty of Agriculture, Suez Canal
University, Ismailia Governorate, Egypt (Latitude angle of 30.62ºN,
Longitude angle of 32.27ºE, and mean altitude above sea level of 5 m).
The ETHE technique was used to utilize the stability of deep soil
temperature for worming the indoor air of greenhouse cucumber during
winter season, and reducing the indoor air temperature during the
summer season. A computer simulation model has been developed and
used based on MATLAB program to determine the depth at which the soil
temperature is stabilized. The obtained data showed that, the depth at
which the soil temperature is stabilized was achieved at 3 m deep. The
overall thermal efficiency of the ETHE system during winter season
(heating process) was 72.90 %. Due to the microclimatic conditions (air
temperature and air relative humidity) were at and around the desired
level, the growth rate, flowering rate, fruit set rate, and fresh yield of
cucumber crop were at high rates and good quality. Data of the computer
simulation model of the indoor air and soil temperatures were found to be
very closest to that measured.
Key words: Greenhouses – Earth-tube heat exchanger – Simulation
model – Soil temperature.
1Agricultural Engineering Department, Faculty of Agriculture, El-
Mansoura University, El- Mansoura, Egypt.
-Department, Faculty of Agriculture, Suez Agricultural Engineering 2,3,4,5
Canal University, Ismailia, Egypt.
Misr J. Ag. Eng., 31 (3): 1095 - 1120

BIOLOGICAL ENGINEERING
Misr J. Ag. Eng., July 2014 - 1096 -
NOMENCLATURE Symbol Quantity Units Symbol Quantity Units
Ac the surface area of the cover m2 Qv the ventilation rate of floor surface area m3/s.m2
Af the floor surface area m2 Qven thermal heat loss from greenhouse air due to ventilation Wm-2
AIWP annual irrigation water productivity L.E/m3 Ri solar radiation flux incident inside the greenhouse Wm-2
AIWS annual irrigation water supply m3 temperature K
Ap the plant surface area m2 Tai inlet air temperature of earth-tube heat exchanger K
As soil surface area m2 Tao outlet air temperature of earth-tube heat exchanger K
Cpa specific heat of dry air Jkg-1k-1 Tc cover surface temperature Wm-2k-1
Cpex the specific heat of air leaving greenhouse Jkg-1k-1 Tex the temperature of exhaust air leaving greenhouse ºC
Cps Greenhouse soil specific heat Jkg-1K-1 Tf equilibrium temperature K
D thickness of the soil layer m Ti air temperature inside the greenhouse K
E the evapotranspiration coefficient - Tinlet the temperature of air entering greenhouse ºC
ETHE Earth to Air Heat Exchanger - To the outside air temperature ºC
ETHE Earth Tube Heat Exchanger - Tp the plant surface temperature K
Fp-c shape factor between the plant and cover surface - Ts sandy soil temperature K
Fs-c shape factor between the soil and cover surface - Tsk the sky temperature K
Fs-p shape factor between soil and plant surface - Tsub soil bulk temperature K
hfg latent heat of vaporization of water kJkg-1 Tw water temperature K
hi convective heat transfer coefficient of the inside
greenhouse
Wm-2k-1 U the overall heat transfer coefficient W/m2ºC
ho convective heat transfer coefficient of the outside
greenhouse cover
V wind speed ms-1
hp convective heat transfer coefficient of the plant Wm-2k-1 Vex the specific volume of air leaving greenhouse m3/kgair
hs convective heat transfer coefficient between the
greenhouse soil and indoor air
Wm-2k-1 VPair air vapour pressure kPa
I the solar radiation of floor area W/m2 VPD vapour pressure deficit kPa
IWUE Irrigation water use efficiency kg/m3 VPsat saturation vapour pressure kPa
k Soil Thermal Conductivity Wm-1K-1 Wac humidity ratio of air at the given cover temperature kg kg-1
m mass flow rate of air kg s – 1 Wai humidity ratio of the greenhouse air kg kg-1
Pwvs saturated vapour pressure kPa Wap
humidity ratio of air at the given plant surface temperature kg kg-1
Q(C-s) convective heat transfer from the soil surface Wm-2 Was humidity ratio of air at the given soil surface temperature kg kg-1
Q(Sh-s ) solar radiation absorbed by soil surface Wm-2 α thermal diffusivity of soil m2 s – 1
QC(c-i) convective heat energy at inside cover surface Wm-2 αp leaf surface absorption -
QC(c-o) convective heat at outside cover surface Wm-2 αs soil surface absorption -
Qcond conductive heat transfer from the soil Wm-2 γ ventilation rate m3s-1
Qconden heat flow due to condensation on the cover Wm-2 εc greenhouse cover emissivity -
Qearth heating potential obtained from the earth-tube heat
exchanger
Wm-2 εp emissivity factor of the plant -
Qevap latent heat from the soil to the inside air due to
evaporation
Wm-2 εs soil surface emissivity -
Qexc heat exchanging rate, Watt ζp water covering ratio of the leaf surface -
QG solar heat gain Wm-2 ζs water covering ratio of the soil surface -
Qloss heat loss from the greenhouse element Wm-2 η effectiveness of earth tube heat exchanger %
Qr(c-sk) longwave radiant heat emitted from the cover to the
ambient air
Wm-2 ρa density of the air kgm-3
Qr(p-c) radiant heat exchange between the plant and the cover Wm-2 ρs The density of the sand soil kg m – 3
Qr(s-c) radiant heat exchange between the soil and the cover Wm-2 σ Stefan-Boltzmann constant Wm-2K-4
Qr(s-p) radiant heat exchange between the soil and the plant Wm-2 τc The effective transmissivity of the cover
Qsub heat supplied to the greenhouse element Wm-2
1.NTRODUCTION
reenhouses are widely used to increase the productivity of the
unit area and achieve optimal control over the environment
inside the greenhouses where a suitable microclimate is provided
and maintained (Sethi and Sharma, 2007). Agricultural greenhouses
have been proven a viable solution to world-wide increased demand for
G

BIOLOGICAL ENGINEERING
Misr J. Ag. Eng., July 2014 - 1097 -
expanding production, facilitating out of season cultivation, protecting
crops from unfavorable outdoor conditions, and allowing the growth of
certain varieties in areas where it was not possible earlier (Santamouris
et al., 1995). Heating of greenhouse is one of the most energy consuming
activities during winter periods. Lack of heating has adverse effects on
the yield, cultivation time, quality and quantity of the products in the
greenhouse (Shukla et al., 2006). The use of low-cost and alternative
heating system is therefore of primary importance for a greenhouse to
provide optimum indoor conditions during winter months. Greenhouse
heating can be obtained by active or passive methods of heating. For
active heating in comparison to ground collector, warm water, warm air
and an earth–air heat exchanger (EAHE). The passive heating technique
in which heat is given to the greenhouses from the earth has become
popular nowadays (Ghosal et al., 2005). However, heating systems
increase the capital and operational costs by 30 % and may be too
expensive to use for most applications (Tiwari, 2003). Due to high
relative cost of energy, only a small number of greenhouse owners can
afford to use auxiliary heating systems. It is well known that the
temperature of the ground at a depth of about 2.5-3 m remains fairly
constant and low around the year. The idea to dissipate the excess heat
from a building to a natural sink like the ground is known from the
ancient time. The most common technique to couple buildings and other
structures with the ground is the use of underground air tunnels, known as
earth-tube heat exchangers (ETHE) (Mihalakakou, 1997). The ETHE are
considered as an effective passive heating medium for buildings. It uses
underground soil as a heat source and air as the heat transfer medium for
space heating in winter. Earth to air heat exchangers consist of pipes
which are buried in the soil while an air circulation system forces the air
through the pipes and eventually mixes it with the indoor air of the
building or the agricultural greenhouse. As a result, the air temperature at
the outlet of the earth–air–pipes is much higher than that of the ambient.
The outlet air from the earth–air–pipes can be directly used for space
heating if its temperature is high enough (Ascione et al., 2011). Heating
of greenhouse using an earth–air heat exchanger has been studied by
many others (Pfafferott, 2003; Chen et al., 2006). The main advantages
BIOLOGICAL ENGINEERING
Misr J. Ag. Eng., July 2014 - 1098 -
of EAHE system are its simplicity, high cooling and pre-heating potential,
low operational and maintenance costs. Plastic or aluminum buried pipes
were used by Santamouris et al. (1996). Greenhouses coupled with
buried pipes have an average annual energy consumption for heating that
is 30-60 % less than for a conventional greenhouse; the indoor
temperatures are 3-10°C higher than the minimum outdoor temperature.
Kassem (1999) studied the potential of using the deep soil as a renewable
source of heating and cooling ambient air for protected agriculture. He
found that the thermal performance of earth-tube heat exchanger was
found to be directly proportional to temperature difference between the
outlet and inlet airflow and inversely proportional to the temperature
difference between tube surface and the inlet airflow. Ghosal and Tiwari
(2006) developed a new thermal model for greenhouse heating with
EAHE in New Delhi, India. The earth air heat exchanger, consisting of
PVC pipes of 39 m length and 0.06m diameter. They found that, the
greenhouse air temperature higher by 7-8oC in the winter than those of the
same greenhouse without EAHE. Also, the greenhouse air temperature
increased in the winter with increasing pipe length, decreasing pipe
diameter and decreasing mass flow rate of flowing air inside buried pipe.
Shukla et al. (2006) studied a thermal model for heating of greenhouse
by using different combinations of inner thermal curtain, an earth–air heat
exchanger and geothermal heating. They found that an earth–air heat
exchanger provided an alternative source for heating of greenhouse when
geothermal energy is not available. Tiwari et al. (2006) studied the
annual thermal performance of greenhouse with an earth- air heat
exchanger. They found that the temperature of the greenhouse increased
by 4oC in winter, due to use of an EAHE. Chel and Tiwari (2009)
developed a thermal model for a building integrated with earth to air heat
exchanger (EAHE). They conducted a performance evaluation and life
cycle cost analysis of EAHE. Experimental results showed that the room
air temperature during winter was found to be 5-15oC higher compared
with ambient air temperature. A transient and implicit model based on
computational fluid dynamics was developed by Bansal et al. (2009) to
predict the thermal performance and heating capacity of earth–air–pipe
heat exchanger systems. Effects of the operating parameters (i.e. the pipe
BIOLOGICAL ENGINEERING
Misr J. Ag. Eng., July 2014 - 1099 -
material, air velocity) on the thermal performance of earth-air-pipe heat
exchanger systems were studied. The 23.4 m long EAHE system
discussed in this paper gave heating in the range of 4.1 - 4.8oC for the
flow velocities of 2-5 m/s. Investigations on steel and PVC pipes have
shown that performance of the EAHE system was not significantly
affected by the material of the buried pipe. Nayak and Tiwari (2010)
carried out a theoretical performance assessment of an integrated
photovoltaic and earth–air heat exchanger greenhouse. The results
indicated that the air temperature inside the greenhouse can be increased
by around 7- 8oC during winter season when the system coupled with
EAHE at night. Ozgener and Ozgener (2010) studied the heating
performance of underground air tunnel UAT. A galvanized pipe of 56 cm
in diameter 47 m in length was buried in the soil at about 3 m in depth, a
galvanized pipe of 80 cm in diameter 15 m in length was connected to
greenhouse. The experimental results indicate that this system can be used
for greenhouse heating in the Mediterranean and Aegean regions of
Turkey. The objective of this study is use earth-to-air heat exchanger as a
method to overcome the reduction in the greenhouse air temperature
within the cold nights of winter season.
2. Experimental Set-up
The experimental work was carried out in the experimental farm of
Faculty of Agriculture, Suez Canal University, Ismailia Governorate,
Egypt (Latitude angle of 30.62ºN, Longitude angle of 32.27ºE, and mean
altitude above sea level of 5 m). It was executed during winter season of
2012-2013 (3rd of December to 30th of March) in order to investigate the
possibility of using earth-to-air heat exchanger system for greenhouse
heating. Two similar gable-even-span form greenhouses were designed,
constructed, and operated during this research work. The first greenhouse
with ETHE, the second greenhouse was considered as a control trial
without any auxiliary heating systems The geometric characteristics of the
gable-even-span greenhouse are as follows: eaves height 2.933 m, gable
height 0.933 m, rafter angle 25º, total width 4.0 m, total length 6.0 m,
floor surface area 24 m2, and volume 60.00 m3 as shown in Figure (1).
The greenhouse structural frame is formed of 25.4 mm hot dipped
galvanized pipes (1 inch) with excellent anti-corrosion. The rafter length

BIOLOGICAL ENGINEERING
Misr J. Ag. Eng., July 2014 - 1100 -
of the greenhouse gable is 2.207 m and gable height is 0.933 m, whilst
the height of each vertical side wall is 2 m. The rafters were tilted at 25o
to minimize the side effects of wind load on the roof of the greenhouse.
At the same time it may be maximize the solar radiation flux incident on
the inclined roof of the greenhouse. The two identical greenhouses (G1
and G2) were covered using double layer of UV polyethylene sheets of
150 µm thick in order to reduce the heat energy loss from the greenhouse
particularly at nighttime. The two greenhouses were orientated in East-
West direction, where the southern longitudinal direction faced into the
sun's rays. The earth-tube heat exchanger was made from PVC pipes
buried under the ground at 3 m in sandy soil. The gross dimensions of the
earth-tube heat exchanger were 26 m long and 0.144 m inner diameter
(Figure 2). A portable blower of 335 W and flow rate of 1200 m3 h-1 has
been fitted at the suction end of the pipe positioned in the center south
side of the greenhouse. The mechanical analysis of the greenhouse soil
was conducted according to the international pipette method (Arnold et
al., 1986) to determine the soil structures as presented in Table (1).
Experimental greenhouse trails plants were irrigated using drip irrigation
system. The fertilizer was directly added to the soil and vegetative
fertilization was also used to obtain a higher growth and production.
Figure (1): Schematic diagram of gable even-span greenhouse Figure (2): Diagram of the earth-tube heat exchanger
Table (1): Structure of the experimental soil
Soil structure % Texture grade
Coarse sand Fine sand Silt Clay
68.93 26.04 3.81 1.22 Sandy
For the rest of this research, the greenhouse equipped with the earth-tube
heat exchanger system and the control greenhouse are referred to as G1
and G2, respectively.

BIOLOGICAL ENGINEERING
Misr J. Ag. Eng., July 2014 - 1101 -
3. Methodology and instrumentations
Meteorological station (Vantage Pro 2, Davis, USA) located above the
roof of the Agricultural Engineering Department, was used to measure
different macroclimate variables such as, the solar radiation flux incident
on a horizontal surface, dry-bulb, wet-bulb, and dew-point air
temperatures (ventilated thermistor), wind speed and its direction, air
relative humidity and rainfall amounts. For the duration of the whole year
of 2011, the temperature distribution in the earth at different depths of
0.0, 1.0, 2.0 and 3.0 m was measured and recorded to assess the specific
depth of earth at which the relative temperature remains sufficiently high
and low for effective heating and cooling modes performance,
respectively. Eight thermocouples were vertically located in the earth at
different depths starting at 0.0 m deep and continuing at 1.0 m intervals to
a depth of 3.0 m (two thermocouples were used to measure each point).
The two greenhouses soil temperatures were measured at four different
depths of 0.0, 10.0, 20.0, and 30.0 cm using four thermocouples in each
greenhouse. These depths represent the most root zone of cucumber crop
(20-30 cm) as mentioned by Hassan (2001). The inlet ambient air
temperature was measured using two thermocouples. The outlet air
temperature of the earth-tube heat exchanger was also measure using two
thermocouples. Data included the measured indoor dry-bulb and wet-bulb
temperatures were functioned to determine the indoor air relative
humidity of the two greenhouses using a specific software computer
program (Sonntage and Borgnakke, 1988). These sensors were
connected to a data-logger system (Lab-Jack logger, powered by USB
cable, supply 4-5.25 volt, USA) to display, and record the data during the
experimental period. Mono Crestline solar cell (75 mm x 75 mm, 0.5 volt,
current of 800 mA, kemo, 139, Germany) was used to measure the global
solar radiation. Formula was functioned to determine the solar radiation
flux incident according to Mujahid and Lamoud (1988). The Mono
Crestline solar cell was calibrated with a Kipp pyranometer (Kipp and
Zohne, Australia) under clear sky conditions. The short circuit reading
obtained from the solar cell was measured using a digital multimeter
(M3800, China) according to Duffie and Beckman (1991). The solar cell
and the Kipp pyranometer were placed in the same horizontal plane. One

BIOLOGICAL ENGINEERING
Misr J. Ag. Eng., July 2014 - 1102 -
hundred readings were taken and recorded inside and outside the
greenhouse. The effective transmissivity (τc) of the double layer of UV
polyethylene sheet was determined using the following equation:
τc= 100xgreenhousetheoutsideradiationSolar
greenhousetheinsideradiationSolar
The effective transmissivity of the double layer polyethylene sheet was 82
%. The thermal conductivity of the sandy soil was determined using the
method of Lewis (1990). From this method the average thermal
conductivity of the sandy soil was found to be 0.97 W m – 1 K – 1.
The specific heat (Cps) of the sandy soil was determined in J kg – 1 K – 1
using locally made calorimeter device according to the following equation
(Klute, 1986). This method was applied on three different samples of
sandy soil. The average specific heat was found to be 924 J kg – 1 K – 1.
The density of the sand soil (ρs) was deduced and determined using the
method of paraffin wax (Black, 1965). It was found to be 1442 kg m – 3.
The thermal conductivity (k), density (ρs), and the specific heat of sandy
soil were functioned to deduce the thermal diffusivity (α) using the
following equation (Incropera and Dewitt, 1996):
α=pss C
k
The thermal diffusivity of the sandy soil which utilized in this research
work was found to be 7.28 x 10 – 7 m2 s – 1.
3.1 Effectiveness of earth-tube heat exchanger (ETHE)
The effectiveness of the earth-tube heat exchanger (η) was computed
using the following two equations (Al-Ajmi et al., 2006):
x100TT
TT
sai
aoai
η
The potential heating acquired from the earth-tube heat exchanger (Qexc)
can be calculated using the following equation (Li et al., 2014):
) T- (T C Q aiaopaexc
m
3.2 Experimental procedure and data analysis for cucumber crop
The effect of microclimatic conditions of the greenhouses on cucumber
crop growth stages (vegetative growth, flowering, fruit set rate, and fresh
yield) were estimated. The stem length of cucumber plants was measured
every week from the transplanting date inside the two greenhouses.
Flowering measurement was taken every day after four weeks of
BIOLOGICAL ENGINEERING
Misr J. Ag. Eng., July 2014 - 1103 -
transplanting date. Fresh yield of cucumber crop were measured in
kilogram twice every week during the harvesting period. Finally, the total
fresh yield per square meter for each greenhouse during summer and
winter crops were determined. Dry weight characteristic is a good
indicator for growth of greenhouse protected cropping. Dry weight was
also functioned to determine the total water consumption throughout the
growing period of the greenhouse crops. Aldrich and Bartok (1990)
reported that, each 28 grams of dry weight of greenhouse crop consume
7.5 litres of water during the complete growth. From the previous
information, the amount of irrigation water in cubic meter (annual
irrigation water supply, AIWS) during the growing period can be
computed.
The annual irrigation water productivity (AIWP) is defined as the total
value of crop production in L.E to the annual irrigation water supply in
cubic meter. It can be computed as follows:
AIWP = )(
.).(3mAIWS
ELproductioncropofvalueTotal L.E. m – 3
The Irrigation water use efficiency (IWUE) is defined as the ratio of the
marketable crop yield in kg to the annual irrigation water supply in cubic
meter. It can be determined as follows:
IWUE = )(
)(3mAIWS
kgyieldcropMarketable kg m – 3
3.3 Vapour pressure deficit (VPD)
Vapour pressure deficit (VPD) is the difference (deficit) between the
amount of moisture in the air and how much moisture the air can hold
when it is saturated. VPD can be used to evaluate the disease threat,
condensation potential, and irrigation needs of a greenhouse crop. The
differences between the saturation vapour pressure and the actual air
vapour pressure (VPsat – Vpair) is the mathematical definition of vapour
pressure deficit (VPD). Higher vapour pressure deficit means that the air
has a higher capacity of hold water, stimulating water vapour transfer
(transpiration) into the air in this low humidity condition. Lower vapour
pressure deficit, on the other hand, means the air is at or near saturation,
so the air can not accept moisture from a leaf in this high humidity
conditions (Pringer and Ling, 2004).
BIOLOGICAL ENGINEERING
Misr J. Ag. Eng., July 2014 - 1104 -
4. Mathematical simulation model
4.1 Greenhouse energy balance
Environmental control of the greenhouse may be included the control of
solar radiation, heat losses and gain, energy conservation, and humidity
control. A greenhouse cover with high transmissivity for solar energy can
produce temperatures that are higher than desired in the crop zone. Most
surfaces within a greenhouse have high absorptivity for solar energy.
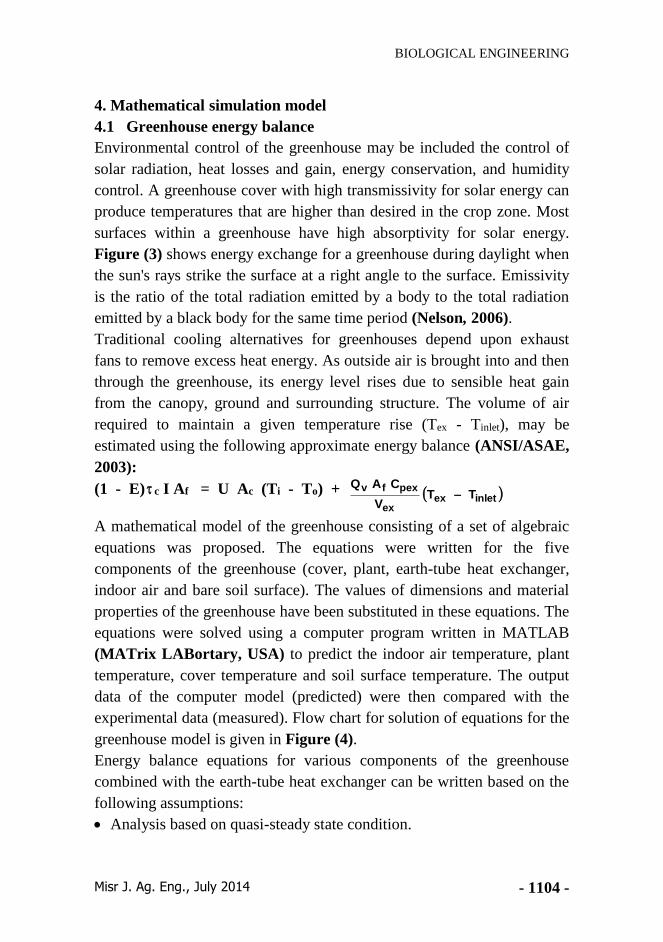
Figure (3) shows energy exchange for a greenhouse during daylight when
the sun's rays strike the surface at a right angle to the surface. Emissivity
is the ratio of the total radiation emitted by a body to the total radiation
emitted by a black body for the same time period (Nelson, 2006).
Traditional cooling alternatives for greenhouses depend upon exhaust
fans to remove excess heat energy. As outside air is brought into and then
through the greenhouse, its energy level rises due to sensible heat gain
from the canopy, ground and surrounding structure. The volume of air
required to maintain a given temperature rise (Tex - Tinlet), may be
estimated using the following approximate energy balance (ANSI/ASAE,
2003):
(1 - E) c I Af = U Ac (Ti - To) + inletexex
pexfvTT
V
CAQ
A mathematical model of the greenhouse consisting of a set of algebraic
equations was proposed. The equations were written for the five
components of the greenhouse (cover, plant, earth-tube heat exchanger,
indoor air and bare soil surface). The values of dimensions and material
properties of the greenhouse have been substituted in these equations. The
equations were solved using a computer program written in MATLAB
(MATrix LABortary, USA) to predict the indoor air temperature, plant
temperature, cover temperature and soil surface temperature. The output
data of the computer model (predicted) were then compared with the
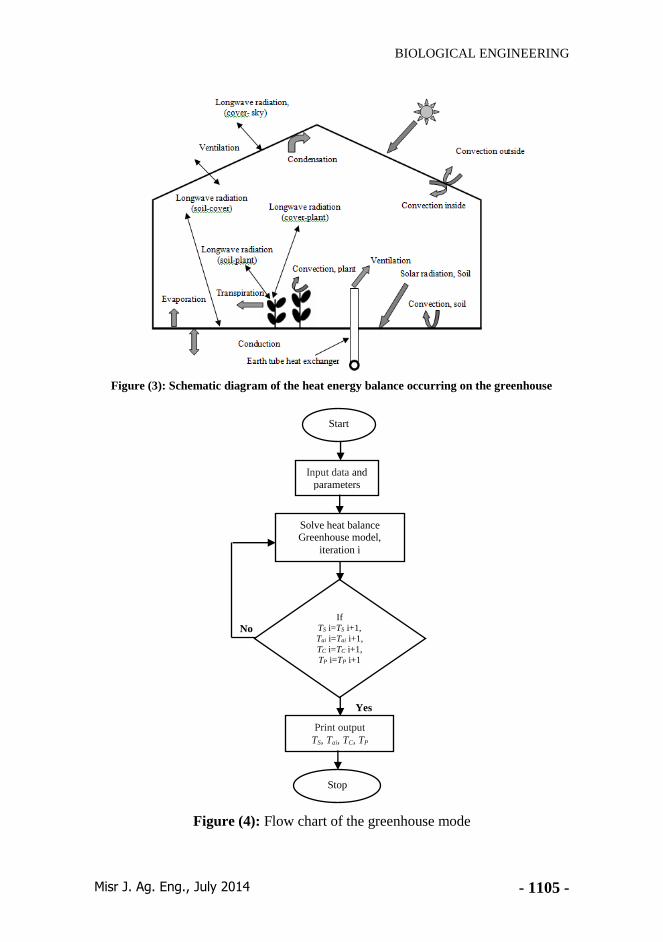
experimental data (measured). Flow chart for solution of equations for the
greenhouse model is given in Figure (4).
Energy balance equations for various components of the greenhouse
combined with the earth-tube heat exchanger can be written based on the
following assumptions:
Analysis based on quasi-steady state condition.
BIOLOGICAL ENGINEERING
Misr J. Ag. Eng., July 2014 - 1105 -
Figure (3): Schematic diagram of the heat energy balance occurring on the greenhouse
Figure (4): Flow chart of the greenhouse mode
Start
Input data and
parameters
Solve heat balance Greenhouse model,
iteration i
If
TS i=TS i+1,
Tai i=Tai i+1,
TC i=TC i+1,
TP i=TP i+1
,
No
Yes
Print output
TS, Tai, TC, TP
Stop

BIOLOGICAL ENGINEERING
Misr J. Ag. Eng., July 2014 - 1106 -
Temperatures of shading cloth and greenhouse cover are all the same.
Heat conduction through the bottom layer of the ground is one-
dimensional.
Flow of air is uniform along the length of the buried pipes.
The pipes are uniform circular cross-section.
The soil surrounding the pipe is homogenous and has constant thermal
conductivity.
4.2 Energy balance on greenhouse cover
Greenhouse cover is exposed to solar radiation and exchange thermal
radiation with the plants, soil, and sky. Convective heat transfer takes
place from the cover to the outside depending on wind speed.
Condensation could also be detected on the cover depending upon the
saturated humidity ratios at both the cover surface and inside air. An
energy balance equation can be written for the greenhouse cover as
follows (Ibrahim, 1999):
0)()()()()( CondencprskcrcsricCocC QQQQQQ
The convection heat transfer from the outside cover surface was determined
as follows (Norton, 1992):
)( )( ocoocC TThQ
The rate of heat transfer by the greenhouse covering sheet convection is
highly dependent on wind speed. The relationship between the wind
speed and the convection heat transfer coefficient (hout) is given by Mc
Adams (1954) as:
)( 98.1 8.0Vho
The convective heat loss from the inside cover surface to ambient air was
computed by the following equation (Hollman, 2010):
)( )( iciicC TThQ , 25.0)( 36.4 ciins TTh
The thermal radiant heat exchange between the cover and the soil was
determined using the following equation (El-Sheikh, 2001):
)( 44
)( cs
c
scscsr TT
A
AFQ ,
)11
(1
1
cc
s
s
cs
A
AF
The longwave radiant heat emitted from the cover to the ambient air can
be estimated as follows (Taha, 2003):
)( 44
)( skccskcr TTQ

BIOLOGICAL ENGINEERING
Misr J. Ag. Eng., July 2014 - 1107 -
The sky temperature can be calculated from the following equation
(Pieters et al., 1994): 5.1)( 0552.0 aosk TT
The thermal radiant heat exchange between the plant and the cover was
determined using the following equation (El-Sheikh, 2001):
)( 44
)( cp
c
p
cpcpr TTA
AFQ ,
)11
(1
1
cc
p
p
cp
A
AF
Condensation may occur if the humidity ratio of the greenhouse air is
greater than that of the saturated air at the temperature of the cover. The
heat flow due to condensation on the cover can is expressed as follows
(Garzoli, 1985):
)( fg acai
pa
insconden WWh
C
hQ
Humidity ratio was determined using the following equations (Lewis,
1990):
wva
wvai
PP
PW
29
18 , wvsa
wvsac
PP
PW
29
18 ,
3.237
2693882.17exp61078.0
T
TPwv
4.3 Energy balance of greenhouse soil
An energy balance equation for the bare soil surface can be written as
follows:
0)()()()( evapcondpsrscrsCsSh QQQQQQ
The solar radiation absorbed by the soil surface can be determined as
follows:
issSh REQ )1()(
The convective heat transfer from the soil surface can be computed as
follows:
)( )( isssC TThQ , )( 5.2 25.0
iss TTh
The thermal radiant heat exchange between the soil and the plant was
determined using the following equation:
)( 44
)( ps
p
spspsr TT
A
AFQ
,
)11
(1
1
pp
s
s
ps
A
AF
The conductive heat transfer from the soil can be expressed as follows:
dTTkQ subscond / )(
BIOLOGICAL ENGINEERING
Misr J. Ag. Eng., July 2014 - 1108 -
The latent heat from the soil to the inside air due to evaporation is given
by the following equation:
)( fg asais
pa
sevap WWh
C
hQ
4.4 Energy balance of plant
An energy balance equation can be written for the plant as follows:
0)()()( TranspsrpcrpCabs QQQQQ
The solar radiation at the plant can be determined as follows:
i RQ pabs
The convective heat transfer from the plant surface can be computed as
follows:-
)( ipppC TThQ , 25.0)( 5.2 ipp TTh
The latent heat from the plant to the inside air due to transpiration is given
by the following equation:-
)( apaipfg
pa
p
Trans WWhC
hQ
4.5 Energy balance of indoor air
An energy balance equation can be written for the indoor air of
greenhouse as follows:
0)()()( earthvenpCsCcCG QQQQQQ
The solar gain can be estimated by the following equation:-
i RAQ fG
The heat flow from inside to outside due to ventilation through
ventilations openings can be calculated by using the following formula:
)( oipaaven TTcQ
The heating potential obtained from the earth-tube heat exchanger was
calculated as the following expression: (Ghosal and Tiwari, 2006; Al-
Ajmi et al., 2006; Li. et al., 2014)
) T- (T C Q aoipasupply
m
5. RESULTS AND DISCUSSIONS
5.1 Deep Soil as an Energy Source
For the duration of the whole year the temperature gradients in the earth
at different depths of 1.0, 2.0 and 3 m and the maximum and the
minimum ambient air temperatures were examined, measured and

BIOLOGICAL ENGINEERING
Misr J. Ag. Eng., July 2014 - 1109 -
recorded to assess the specific depth of earth at which the relative
temperature remains sufficiently high or low for effective cooling or
heating modes performance, respectively. The obtained data for winter
season is summarized and listed in Table (2). From table, the 3 m
peripheral deep soil temperature on average remained constant at 21.7oC
during the four months period of winter season. This deep soil
temperature on January was 21.2oC and on March it was 22.1oC. This was
a change of 0.9oC for that period; sequentially there were some little
variation in the earth temperature for the 3 m deep soil throughout the
winter months. Also, the monthly average daily thermal potential
difference between the 3 m deep soil temperature and average minimum
temperature was 11.5oC.
Table (2): Monthly average daily maximum and minimum ambient air temperatures and
peripheral deep soil temperature at different depths for the winter months of 2012-2013
Month Ambient air temperature, oC
Deep soil temperature at different
depths, m
Maximum Minimum Mean 1 2 3
December 23.6 11.6 16.4 19.2 21.4 21.9
January 23.0 8.0 14.2 17.0 19.8 21.2
February 26.1 10.1 17.3 18.5 20.9 21.6
March 27.2 11.3 18.4 21.1 21.7 22.1
Mean 25.0 10.2 16.6 19.0 20.8 21.7
5.2. Effectiveness and heat exchange
The monthly average daily inlet airflow temperature, outlet airflow
temperature, peripheral deep soil temperature at 3 m deep, thermal
efficiency and heat exchange rate of the earth-tube heat exchanger are
summarized and listed in Table (3). It obviously indicates that, the
thermal efficiency and heat exchange rate of earth-tube heat exchanger
system was continuously variable during the whole period of heating
mode depending upon the temperature difference between outlet and inlet
earth-tube airflow and temperature difference between peripheral deep
soil temperature and inlet earth-tube airflow. It reveals that, the monthly
average daily overall thermal efficiency for December, January, February,
and March months, respectively, were 71.9 %, 77.0 %, 72.4 %, and 70.2
% that gave an average overall thermal efficiency of 72.9 %. It evidently
shows that, the greatest value of heat energy exchange rate (3.341 kWh)
occurred on January month when the monthly average daily inlet airflow

BIOLOGICAL ENGINEERING
Misr J. Ag. Eng., July 2014 - 1110 -
temperature was quite low (10.3ºC). Whereas, the lowest magnitude of
heat energy exchange rate (2.307 kWh) was achieved on March month
with an inlet airflow temperature of 13.8ºC. It also reveals that, the
seasonal average daily heat energy exchange rate throughout the heating
mode was 2.734 kWh.
Table (3): Monthly average daily inlet airflow temperature (Tai), outlet airflow (Tao), soil
temperature at 3 m deep (Ts), overall thermal efficiency (ηh) and heat exchange rate (Qexc )
throughout the winter season of 2012-2013
Month Tai , oC Tao , oC Ts , oC ηh, % Qexc ,
kWh/day
December 12.6 19.3 21.9 71.9 2.665
January 10.3 18.7 21.2 77.0 3.341
February 12.5 19.1 21.6 72.4 2.625
March 13.8 19.6 22.1 70.2 2.307
Mean 12.3 19.2 21.7 72.9 2.734
The relationship between seasonal average hourly thermal efficiency of
the earth-tube heat exchanger and time of the day is illustrated in Figure
(5). Also, the seasonal average hourly thermal energy exchange of the
earth-tube heat exchanger which related to the inlet and outlet airflow
temperature is illustrated together in Figure (6). This figure shows that an
inverse relationship between the energy exchange rate and the inlet air
flow temperature.
5
7
9
11
13
15
17
18.0
0
19.0
0
20.0
0
21.0
0
22.0
0
23.0
00.
001.
002.
003.
004.
005.
006.
00
Time of the day, hr
Te
mp
era
ture
, oC
0
10
20
30
40
50
60
70
80
90
Th
erm
al
eff
icie
nc
y,
%
Inlet airflow temperature
Thermal efficiency
0
5
10
15
20
25
18.0
0
19.0
0
20.0
0
21.0
0
22.0
0
23.0
00.
001.
002.
003.
004.
005.
006.
00
Time of the day, hr
Air
flo
w t
em
pe
ratu
re,
oC
0.0
0.5
1.0
1.5
2.0
2.5
3.0
3.5
4.0
En
erg
y e
xc
ha
ng
e,
kW
Inlet airflow temperature
Outlet airflow temperature.
Q exc
Figure (5): Hourly average thermal efficiency of earth-
tube heat exchanger related to the inlet airflow
temperature for winter season of 2012-2013
Figure (6): Seasonal average heat energy exchange rate
related to the inlet and outlet airflow temperatures
during winter season of 20122013
5.3. Effect of earth-tube heat exchanger system on microclimatic
conditions of cucumber growth, development and productivity
The seasonal average hourly exterior and interior air temperature for the
two greenhouses (G1 and G2) around 24 hours is shown in Figure (7). It

BIOLOGICAL ENGINEERING
Misr J. Ag. Eng., July 2014 - 1111 -
evidently shows that, the nightly average outdoor air temperature, the
outlet airflow temperature of the earth-tube heat exchanger system, and
the indoor air temperatures for the two greenhouses (G1 and G2) during
the heating period, respectively, were 12.3, 19.1, 16.7, and 11.9ºC. It also
reveals that, the nightly average indoor air temperature of the greenhouse
(G1) was higher than that of the control greenhouse (G2) by 4.8ºC (40.34
%) owing to the heat energy gained from the earth-tube heat exchanger
system. For the duration of the heating period, the earth-tube heat
exchanger system was provided a heating effect of 6.8ºC.
Average soil temperature for the greenhouse (G1) and greenhouse (G2)
were averaged in Table (4). It was found that, the presence of the earth-
tube heat exchanger increased the average soil temperature as a result to
the earth-tube heat exchanger increased the greenhouse inside air
temperature above that for the control greenhouse.
Table (4): Monthly average soil temperatures for the two greenhouses (G1 and G2)
under different soil depths
Month
Soil temperature under the greenhouse
with earth-tube heat exchanger, °C
Soil temperature under the control
greenhouse, °C
Soil
surface
10 cm
depth
20 cm
depth
30 cm
depth
Soil
surface
10 cm
depth
20 cm
depth
30 cm
depth
December 19.5 19.7 20.6 21.5 18.9 19.1 19.2 21.1
January 18.1 18.2 18.5 19.2 17.2 17.1 17.2 17.9
February 18.5 18.8 19.1 19.6 17.5 17.7 17.9 18.2
March 21.0 20.2 20.3 20.8 19.7 18.8 18.9 19.5
Mean 19.3 19.2 19.6 20.3 18.3 18.2 18.3 19.2
The hourly average vapour pressure deficit (VPD) inside the two
greenhouses (G1 and G2) was plotted in Figure (8). It evidently reveals
that, the vapour pressure deficit of the air surrounding the cucumber
plants decreased gradually with time from 1.466 kPa (G1) and 1.194 kPa
(G2) at 18.00 hour until they reached the minimum values (0.896 and
0.166 kPa, respectively) at 6.00 hour, as the indoor air temperature
decreased, and the air relative humidity increased. Four the duration of
the heating season, the hourly average vapour pressure deficit (VPD)
occurred inside the two greenhouses (G1 and G2) at nighttime,
respectively, was o.969 and 0.343 kPa.

BIOLOGICAL ENGINEERING
Misr J. Ag. Eng., July 2014 - 1112 -
0
5
10
15
20
25
30
35
7.00
8.00
9.00
10.00
11.00
12.00
13.00
14.00
15.00
16.00
17.00
18.00
19.00
20.00
21.00
22.00
23.000.00
1.00
2.00
3.00
4.00
5.00
6.00
Time of the day, hr
Air
tem
pera
ture
, oC
Outside air temperature.
Air temperature inside the greenhouse with ETHE.
Air temperature inside the control greenhouse.
Optimum night air temperature
0.0
0.5
1.0
1.5
2.0
2.5
7.00
8.00
9.00
10.00
11.00
12.00
13.00
14.00
15.00
16.00
17.00
18.00
19.00
20.00
21.00
22.00
23.000.00
1.00
2.00
3.00
4.00
5.00
6.00
Time of the day, hr
Vap
ou
r p
ressu
re d
efi
cit
, kP
a
Vapour pressure deficit inside the greenhouse (G1)
Vapour pressure deficit inside the greenhouse (G2)Maximum level
Minimum level
Figure (7): Changes in indoor and outdoor air
temperatures for the two greenhouses as a function of
time during the heating period.
Figure (8): Variations in vapour pressure deficit inside
the two greenhouses (G1 and G2) during the heating
period
5.4. Effect of Earth-tube Heat Exchanger System on Microclimatic
Conditions of Cucumber Growth, Development and Productivity
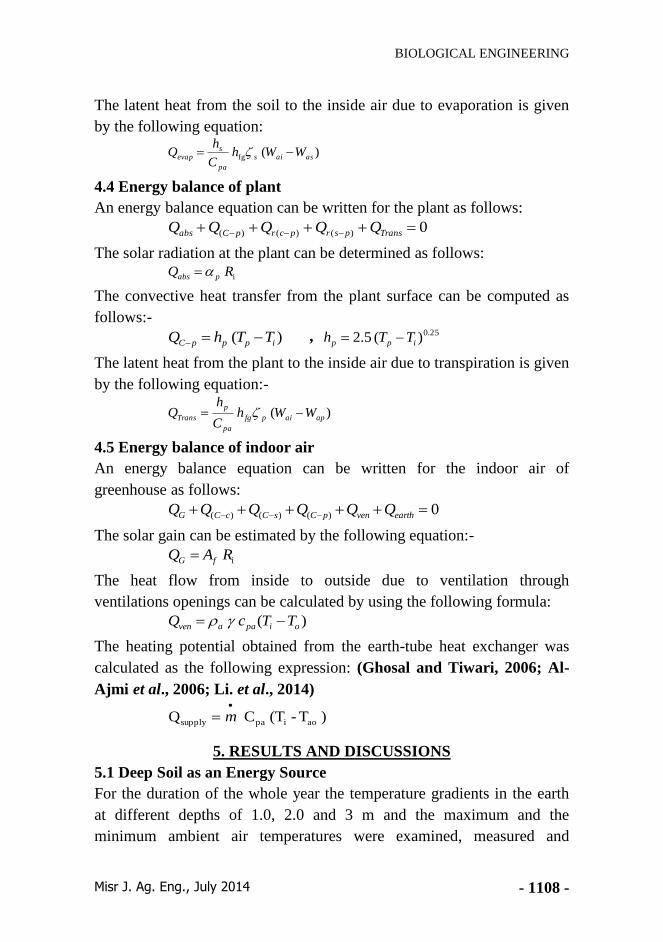
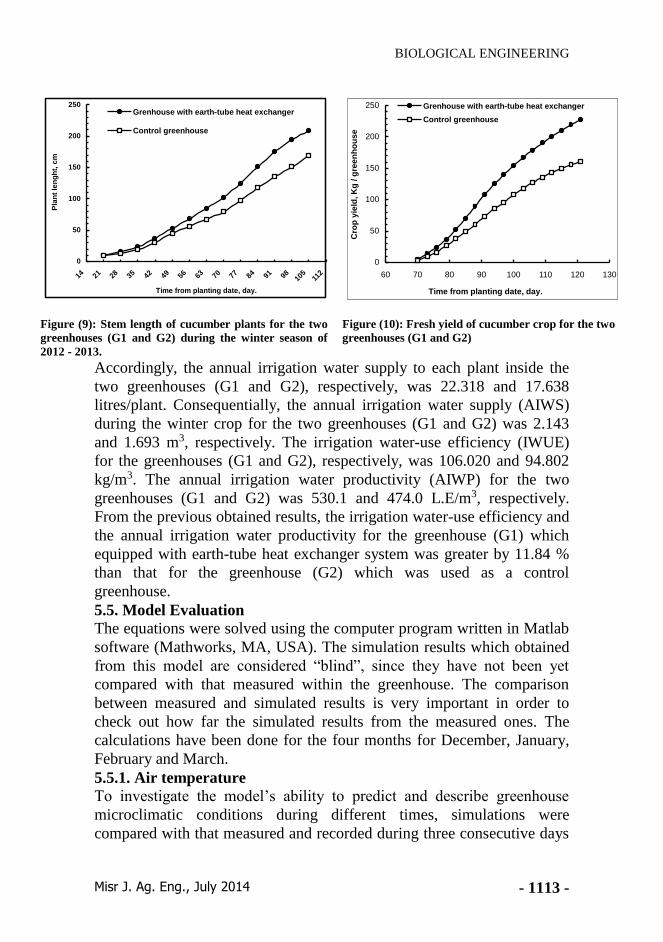
The stem length of cucumber plants varied during the growth stage (17
weeks) in each greenhouse. The weekly averages stem length of
cucumber plants for the two greenhouses (G1 and G2) were 12.26 and
9.98 cm/week, respectively. The maximum lengths of the cucumber
plants inside the two greenhouses, respectively, were 208.4 and 169.6 cm
as shown in Figure (9). The average numbers of flowerage inside the two
greenhouses (G1 and G2) after 65 days from the transplanting of
cucumber plants, respectively, were of 11.14 and 7.52 flower/plant. Duo
to all the previous reasons, the total fresh yield of cucumber crop for the
two greenhouses (G1 and G2), respectively, was 227.2 and 160.5 kg as
revealed in Figure (10). This means the earth-tube heat exchanger
increased the greenhouse crop production by 41.6 % above that for the
control greenhouse. After the final harvesting operation, five samples of
cucumber plants were randomly taken from each greenhouse for
determining the wet and dry matter weights. The average dry weight of
cucumber plants for the two greenhouses (G1 and G2) was 83.32 and
65.85 g/plant. Dry weight was functioned to determine the water
consumption during the long growth period.
BIOLOGICAL ENGINEERING
Misr J. Ag. Eng., July 2014 - 1113 -
0
50
100
150
200
250
14 21 28 35 42 49 56 63 70 77 84 91 98 105
112
Time from planting date, day.
Pla
nt
len
gh
t, c
m
Grenhouse with earth-tube heat exchanger
Control greenhouse
0
50
100
150
200
250
60 70 80 90 100 110 120 130
Time from planting date, day.
Cro
p y
ield
, K
g / g
ree
nh
ou
se
Grenhouse with earth-tube heat exchanger
Control greenhouse
Figure (9): Stem length of cucumber plants for the two
greenhouses (G1 and G2) during the winter season of
2012 - 2013.
Figure (10): Fresh yield of cucumber crop for the two
greenhouses (G1 and G2)
Accordingly, the annual irrigation water supply to each plant inside the
two greenhouses (G1 and G2), respectively, was 22.318 and 17.638
litres/plant. Consequentially, the annual irrigation water supply (AIWS)
during the winter crop for the two greenhouses (G1 and G2) was 2.143
and 1.693 m3, respectively. The irrigation water-use efficiency (IWUE)
for the greenhouses (G1 and G2), respectively, was 106.020 and 94.802
kg/m3. The annual irrigation water productivity (AIWP) for the two
greenhouses (G1 and G2) was 530.1 and 474.0 L.E/m3, respectively.
From the previous obtained results, the irrigation water-use efficiency and
the annual irrigation water productivity for the greenhouse (G1) which
equipped with earth-tube heat exchanger system was greater by 11.84 %
than that for the greenhouse (G2) which was used as a control
greenhouse.
5.5. Model Evaluation
The equations were solved using the computer program written in Matlab
software (Mathworks, MA, USA). The simulation results which obtained
from this model are considered “blind”, since they have not been yet
compared with that measured within the greenhouse. The comparison
between measured and simulated results is very important in order to
check out how far the simulated results from the measured ones. The
calculations have been done for the four months for December, January,
February and March.
5.5.1. Air temperature
To investigate the model’s ability to predict and describe greenhouse
microclimatic conditions during different times, simulations were
compared with that measured and recorded during three consecutive days
BIOLOGICAL ENGINEERING
Misr J. Ag. Eng., July 2014 - 1114 -
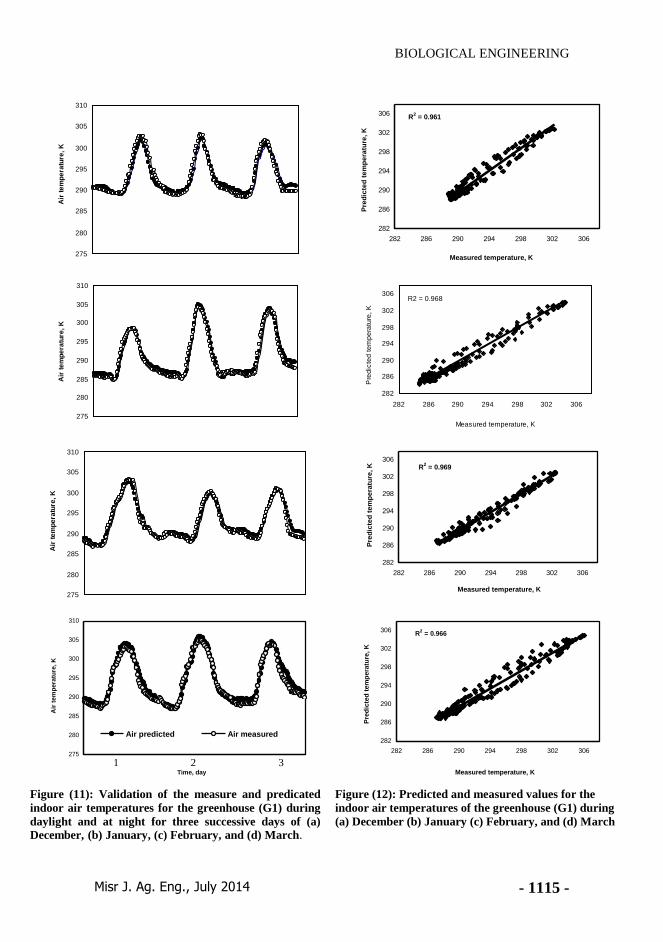
for each month as follows: 19, 20 and 21 December 2012, 11, 12 and 13
January, 12, 13 and 14 February, 5, 6 and 7 March 2013. Figure (11)
present the measured and predicted air temperatures inside the greenhouse
with earth-tube heat exchanger against simulation period assuming that
the state of cover and plant temperatures equal to the simulated values
obtained from the model during the simulation periods. The measured air
temperature inside the greenhouse with earth-tube heat exchanger was
plotted versus the predicted temperature from simulation model shown in
Figure (12). The closeness of predicted and experimental values has been
presented with root mean square of percent. High correlation coefficient
between the predicted and measured values of air temperature inside the
greenhouse was observed. It was found as 0.961, 0.968, 0.969 and 0.966
for the December, January, February and March, respectively. This shows
that the thermal model given by MatLab is in fair agreement with the
experimental work for composite climate of Ismailia, Egypt.
5.5.2. Soil surface temperature
The simplest mathematical representation of the fluctuating thermal
regime in the soil profile is assuming that at all soil depths, the
temperature oscillates as a pure harmonic (sinusoidal) function of time
around an average value. At each succeeding depth, the peak temperature
is dampened and shifted progressively over time. Figure (13) show the
measured and predicted soil surface temperature for three successive
days. A good agreement can be observed between the simulated soil
surface temperature and that measured. Sometimes, there are little
differences between measured and predicted soil surface temperature
profiles occurred. The coefficient determination of soil surface
temperature between predicted and measured values was 0.972, 0.978,
0.958 and 0.967 for the month of December, January, February and
March, respectively as shown in Figure (14).
CONCLUSION
The 3 m deep soil temperature on average remained constant during the
four months period of winter season.
The monthly average daily overall thermal efficiency for December,
January, February and March months were 71.9, 77.0, 72.4 and 70.2 %
respectively that gave an average overall thermal efficiency of 72.9 %.
The average monthly thermal energy exchange of an earth-tube heat
exchanger were found as 2.7, 3.3, 2.6 and 2.3 kW for December,
January, February and March months, respectively that gave an average
of 2.7kW.
BIOLOGICAL ENGINEERING
Misr J. Ag. Eng., July 2014 - 1115 -
275
280
285
290
295
300
305
310
Air
te
mp
era
ture
, K
R2 = 0.961
282
286
290
294
298
302
306
282 286 290 294 298 302 306
Measured temperature, K
Pre
dic
ted
te
mp
era
ture
, K
275
280
285
290
295
300
305
310
Air
te
mp
era
ture
, K
R2 = 0.968
282
286
290
294
298
302
306
282 286 290 294 298 302 306
Measured temperature, K
Pre
dic
ted
te
mp
era
ture
, K
275
280
285
290
295
300
305
310
Air
te
mp
era
ture
, K
R2 = 0.969
282
286
290
294
298
302
306
282 286 290 294 298 302 306
Measured temperature, K
Pre
dic
ted
te
mp
era
ture
, K
275
280
285
290
295
300
305
310
Time, day
Air
tem
pera
ture
, K
Air predicted Air measured
R2 = 0.966
282
286
290
294
298
302
306
282 286 290 294 298 302 306
Measured temperature, K
Pre
dic
ted
tem
pera
ture
, K
Figure (11): Validation of the measure and predicated
indoor air temperatures for the greenhouse (G1) during
daylight and at night for three successive days of (a)
December, (b) January, (c) February, and (d) March.
Figure (12): Predicted and measured values for the
indoor air temperatures of the greenhouse (G1) during
(a) December (b) January (c) February, and (d) March
1 2 3

BIOLOGICAL ENGINEERING
Misr J. Ag. Eng., July 2014 - 1116 -
275
280
285
290
295
300
305
So
il t
em
pe
ratu
re, K
R2 = 0.972
282
286
290
294
298
302
306
282 286 290 294 298 302 306
Measured temperature, K
Pre
dic
ted
te
mp
era
ture
, K
275
280
285
290
295
300
305
So
il t
em
pera
ture
, K
R2 = 0.978
282
286
290
294
298
302
306
282 286 290 294 298 302 306
Measured temperature, K
Pre
dic
ted
tem
pera
ture
, K
275
280
285
290
295
300
305
So
il t
em
pe
ratu
re,
K
R2 = 0.956
282
286
290
294
298
302
306
282 286 290 294 298 302 306
Measured temperature, K
Pre
dic
ted
tem
pera
ture
, K
275
280
285
290
295
300
305
Time, day
So
il t
em
pera
ture
, K
Soil predicted Soil measured
R2 = 0.967
282
286
290
294
298
302
306
282 286 290 294 298 302 306
Measured temperature, K
Pre
dic
ted
tem
pera
ture
, K
Figure (13): Validation of the measure and predicated
soil temperatures for the greenhouse (G1) during
daylight and at night for three successive days of (a)
December, (b) January, (c) February, and (d) March.
Figure (14): Predicted and measured values for the soil
temperatures of the greenhouse (G1) during cooling
mode; (a) June, (b) July, and
(c) August, R2 coefficient of determination.
1 2 3
BIOLOGICAL ENGINEERING
Misr J. Ag. Eng., July 2014 - 1117 -
Average air temperature under the greenhouse containing ETHE was
increased above the control greenhouse.
The output values obtained by simulation model are very close to the
measured values.
REFERENCES
Aldrich, R. A. ; and Bartok, J. W. (1990) ''Greenhouse engineering''
Northeast Regional Agricultural Engineering Service, Comell
University, Ithaca, New York, 14853.
ANSI/ASAE STANDARDS, American Society of Agricultural
Engineers (2003) "Heating, Ventilating and Cooling Greenhouses"
ANSI/ASAE EP 406.4
Arcidiacono, C. ; Emilio, A. D. ; Mazzarella, R. ; and Leonardi, C.
(2001) ''Covering materials to improve the microclimate during
summer in hot climates'' Acta Horticulturae, 719, 214.
Arnold, K. A. ; Camplell, G. S. ; Nielsen, D. R. ; Jackson, R. D. ;
Chair, A. K. ; and Morthand M. M. (1986) ''Methods of soil
analysis'' Part (1) Physical and Mineralogical Methods second
edition. American Society of Agronomy, Inc. Ch (15): 383-409.
Bansal, V. ; Misra, R. ; Agrawal, G. D. ; and Mathur, J. (2009)
''Performance analysis of earth–pipe–air heat exchanger for winter
heating'' Energy and Buildings, 41, 1151-1154.
Black, C. A. (1965) ''Methods of Soil Analysis'' Society of Testing and
Materials, No A, USA.
Chel, A. ; and Tiwari, G. N. (2009) ''Performance evaluation and life
cycle cost analysis of earth to air heat exchanger integrated adobe
building for New Delhi composite climate'' Energy and Buildings,
41, 56-66.
Chen, Y. ; Shi, M. ; and Li, X. (2006) ''Experimental investigation on
heat moisture and salt transfer in soil'' International
Communications in Heat and Mass Transfer 33 (9):1122-1129.
Duffie, J. A. ; and Beckman, W. A. (1991) ''Solar Engineering of the
Thermal Process Wiley'' Interscine New York, USA, 3-44.
El-Sheikh, I. H. (2001) ''Soil heating and climate simulation model for
greenhouses'' Ph.D, Thesis Institute for Techniik in Gratenbau and
landwirtschaft, Universitat Hanover, Germany.
Garzoli, K. V. (1985) ''A simple greenhouse climate model'' Acta
Horticulturae, 174, 393-400.
Ghosal, M. K. ; and Tiwari, G. N. (2006) ''Modeling and parametric
studies for thermal performance of an earth-to-air heat exchanger
BIOLOGICAL ENGINEERING
Misr J. Ag. Eng., July 2014 - 1118 -
integrated with a greenhouse'' Energy Conversion and Management
August, 47 (13-14): 1779-1798.
Ghosal, M. K. ; Tiwari, G. N. ; Das, D. K. ; and Pandey, K. P. (2005)
''Modeling and comparative thermal performance of ground air
collector and earth air heat exchanger for heating of greenhouse''
Energy and Buildings, 37, 613-621.
Hassan, A. A. (2001) ''Ground Family'' Arabic Text Book, Eldar
Elarabia Publishing & Distribution, Cairo, Egypt, PP: 498.
Holman, J. P. (2010) ''Heat transfer'' McGraw-Hill. McGraw-Hill
international book company, London, Hamburg, Paris, Sydney, and
Tokyo.
Ibrahim, M. H. (1999) ''Predicting microclimatic conditions in
greenhouses'' Misr Journal of Agricultural Engineering, 16 (1): 67-
82.
Incropera, F. P. ; and Dewitt, D. P. (1996) ''Fundamental of Heat and
Mass Transfer'' John wiley &Sons: 886.
Kassem, A. M. (1999): Possibilities of using soil heat as a renewable
source for conditioned greenhouses. Ph. D Science, Department of
Agricultural Mechanization, Faculty of Agriculture, El- Mansoura
University, Egypt.
Klute, A. (1986) ''Methods of soil analysis'' Physical and Minarological
Methods, 2nd Edition, Madison Wisconsin, USA.
Lewis, M. J. (1990) ''Physical properties of foods and food processing
system'' Ellis Horwood limited.
Li, H. ; Yu. Y. ; Niu, F. ; Shafik, M. ; and Chen, B. (2014)
''Performance of a coupled cooling system with earth-to-air heat
exchanger and solar chimney'' Renewable Energy, 62, 468-477.
Mc Adams (1954) ''Heat Transmission'' 3rd edition, Mc Graw – Hill
Book Company, New York, USA.
Mihalakakou, G. (1997) ''On the application of the energy balance
equation to predict ground temperature profiles'' Solar Energy, 60
(3-4): 181-190.
Mujahid, A. M. ; and Alamoud, A. R. (1988) ''An easily designed and
constructed photovoltaic pyrheliometer'' Solar &Wind Technology,
5 (2): 127-130.
Nayak, S. ; and Tiwari, G. N. (2010) ''Energy metrics of
photovoltaic/thermal and earth air heat exchanger integrated
greenhouse for different climatic conditions of India'' Applied
Energy, 87, 2984-2993.
BIOLOGICAL ENGINEERING
Misr J. Ag. Eng., July 2014 - 1119 -
Nelson, V. P. (2006) ''Greenhouse operation and management'' Fifth
Edition, A Reston Book, Prentice-Hall, Inc, Englewood cliffs, New
Jersey, USA, 598pp.
Norton, B. (1992) ''Solar Energy thermal technology'' Springer- Veriag,
London, 279.
Ozgener, L. ; and Ozgener, O. (2010) ''Energetic performance test of an
underground air tunnel system for greenhouse heating'' Energy, 35,
4079-4085.
Pfafferott, J. (2003) ''Evaluation of earth-to-air heat exchangers with a
standardized method to calculate energy efficiency'' Energy and
Buildings 35, 971-983.
Pieters, J. G. ; Deltour, J. M. ; and Debruyckere, M. J. (1994)
''Condensation and static heat transfer through greenhouse cover
during night'' Trans, ASAE, 37(6) 1965-1972.
Pringer, J. J. ; and Ling, P. P. (2004) "Greenhouse condensation
control; Understanding and using vapour pressure deficit"
Extension Fact-sheet, Ohio Sate University Extension, USA.
Santamouris, M. ; Mihalakakou, G. ; Argiriou, A. ; and
Asimakopoulos, D. N. (1995) ''On the performance of buildings
coupled with earth to air heat exchangers'' Solar Energy, 54, (6):
375-380.
Santamouris, M. ; Mihalakakou, G. ; Balaras, C. A. ; Lewis, J, O. ;
Vallindras, M. ; and Argiriou, A. (1996) ''Energy conservation in
greenhouse with buried pipes'' Energy, 21, (5): 353-360.
Sethi, V. P. ; and Sharma, S. K. (2007) ''Greenhouse heating and
cooling using aquifer water'' Energy, 32, 1414-1421.
Shukla, A. ; Tiwari, G. N. ; and Sodha, M. S. (2006) ''Thermal
modeling for greenhouse heating by using thermal curtain and an
earth–air heat exchanger'' Building and Environment, 41, 843-850.
Sonntage, R. ; and Borgnakke, C. (1988) ''Fundamental of
Thermodynamics (Sth edit)'' Computer Aided thermodynamic
Tables 2 (CATT2) developed by Intellipro,Ggordon van wylen
John wiley & Sons, Inc.
Taha, A. (2003) ''Simulation model of energy fluxes in passive solar
greenhouse with concrete North wall'' ph.D, Thesis Institute for
Techniik in Gratenbau and landwirtschaft, Universitat Hanover,
Germany.
Tiwari, G. N. (2003) ''Greenhouse technology for controlled
environment'' India: Narosa Publishing House.

BIOLOGICAL ENGINEERING
Misr J. Ag. Eng., July 2014 - 1120 -
Tiwari, G. N. ; Akhtar, M. A. ; Shukla, A. ; and Khan, E. M. (2006)
''Annual thermal performance of greenhouse with an earth–air heat
exchanger: An experimental validation'' Renewable Energy, 31,
2432-2446.
الملخص العربى
يوت المحمية باستخدام مبادل الهواء التحت أرضى السلوك الحرارى لتدفئة الب
خلال موسم الشتاء
صلاح م. عبد اللطيف1 ، شريف ع. رضوان2 ، أحمد ع. حسانين3 ، اسلام ح. الشيخ4 و سامح س. كشك5
الهدف الرئيسى لهذا البحث هو استخدام مبادل الهواء التحت أرضى لتوفير الظروف المثلى لنمو
البيوت المحمية أثناء فترات اليل خلال موسم الشتاء. استخدمت للتجارب محصول الخيار داخل
. الصوبة 4م 42صوبتين من البلاستيك على شكل الجمالون المتناظر الجوانب بمساحة ارضية
( متصلة بنظام مبادل الهواء التحت أرضى و المشيدة بمزرعة كلية الزراعة جامعه 1الاولى )ج
( صوبة مقارنة. التجارب نفذت خلال 4ة, مصر. الصوبة الثانية )جقناة السويس, الإسماعيلي
. تم تصميم نموذج محاكاة رياضى على 4113مارس 31و حتى 4114ديسمبر 3الفترة من
برنامج الماتلاب للتنبؤ بدرجة حرارة الهواء الداخلى و كذلك حرارة سطح التربة للصوبة أثناء
متر 3درجة حرارة ثبات التربة وجدت على عمق إلي فترة التجارب. وقد توصلت الدراسة
وتظل ثابتة عند و حول هذه القيمة خلال شهور الشتاء. المتوسط الشهري οم4112خلال بمقدار
اليومى للكفاءة الحرارية الكلية لنظام مبادل الهواء التحت أرضى خلال شهور ديسمبر و يناير و
على الترتيب. المتوسط الشهرى % 2114، 2412، 2211، 2112فبراير و مارس وجدت
، 41.2اليومى لكل ساعة لمعدل التبادل الحراري لنظام مبادل الهواء التحت ارضى وجدت
كيلو وات/ساعة لشهور ديسمبر و يناير و فبراير و مارس على الترتيب. 4131، 41.3، 3132
، 1.12( وجدت 4ج و1المتوسط الموسمي لكل ساعة لحرارة الهواء الداخلية للصوبتين )ج
على الترتيب. و بالتالى فإن نظام مبادل الهواء التحت أرضي أدى الى زيادة حرارة οم.141
مبادل الهواء التحت أرضي أدى الى (.4عن صوبة المقارنة )ج οم211الهواء الداخلى بمقدار
النباتات زيادة متوسط درجة حرارة التربة عن صوبة المقارنة. المتوسط الاسبوعى لطول ساق
سم/اسبوع, على الترتيب و بالتالى فإن 1.9.و .1414( وجدت 4و ج1تحت الصوبتين )ج
مقارنة % .441نظام مبادل الهواء التحت أرضي أدى الى زيادة متوسط النمو الخضرى بمقدار
و 44214( على الترتيب وجد 4و ج1بصوبة المقارنة. كمية محصول الخيار الكلى للصوبتين )ج
كيلو جرام. وبالتالى نظام مبادل الهواء التحت أرضي حقق زيادة فى كمية المحصول 1.111
.معامل الإرتباط بين النتائج المتحصل عليها من نموذج المحاكاة و النتائج % .211بمقدار
لشهور ديسمبر و ...11، ...11، 9..11، 1..11المقاسة لحرارة الهواء الداخلى وجد
لحرارة 2..11، 11.19. 11.29، 11.24س على الترتيب. بينما وجد يناير و فبراير و مار
التربة لنفس الشهور على الترتيب.
ج. المنصورة. –كلية الزراعة –قسم الهندسة الزراعية –. أستاذ المنشئات الزراعية والتحكم البيئى 1
. قناة السويس.ج –كلية الزراعة –قسم الهندسة الزراعية -. استاذ الهندسة الزراعية 2،3
ج. قناة السويس. –كلية الزراعة –قسم الهندسة الزراعية -. استاذ مساعد الهندسة الزراعية 4
ج. قناة السويس. –كلية الزراعة –قسم الهندسة الزراعية -. مدرس مساعد 5