thermal modeling of aluminum electrolytic capacitors · 2019-06-21 · thermal modeling of aluminum...
TRANSCRIPT

Thermal Modeling of Aluminum Electrolytic Capacitors
Sam G Parler Jr Cornell Dubilier
140 Technology Place Liberty SC 29657
Abstract A comprehensive thermal model for screw-termi-
nal aluminum electrolytic capacitors is developed The test meth-
odology and data upon which the model is based are discussed
Exact one-dimensional solutions multi-dimensional heat equa-
tions and finite-element analysis (FEA) model simulation results
are presented The effects of conduction heat sinking natural
(free) convection forced convection and radiation are quanti-
fied and compared Complex issues such as anisotropism and
multi-phase heat transfer are discussed A comparison of model
results to test data is presented Varying capacitor construction
techniques are evaluated
I INTRODUCTION
The life of an aluminum electrolytic capacitor varies expo-
nentially with temperature approximately doubling for each
10 ordmC cooler the hottest place in the capacitor (the ldquocorerdquo or ldquohot spotrdquo) is operated [1] Since the temperature rise of the
core is directly proportional to the core-to-ambient thermal re-
sistance the life is also an exponential function of the thermal resistance In this paper models to predict this thermal resis-
tance for various construction techniques are developed and
used This paper focuses on modeling computergrade or screw
terminal capacitors However the concepts can be applied to
other aluminum electrolytic capacitor constructions such as snap-mount radial and axial capacitors
An aluminum electrolytic capacitor is generally comprised
of a cylindrical winding (ldquosectionrdquo) of aluminum anode and cathode foils separated by papers impregnated with a liquid
electrolyte usually based on ethylene glycol See Fig 1 The
anode and cathode foils are made of aluminum and the anode is usually highly etched There is a thin coating of aluminum
oxide on the surface of the anode The anode and cathode foils
are contacted by means of aluminum tabs that are extended from the winding These tabs are attached to aluminum termi-
nals in a polymeric top The wet winding is sealed into an
aluminum can
One fact that is apparent when beginning the task of ther-
mally modeling an aluminum electrolytic capacitor in a typi-cal operating environment is that the effort is inherently com-
plex This complexity is due to several factors First all three
of the heat transfer modes (conduction convection and radia-tion) are present and may be significant Second the conduc-
tion from the winding to the case is dependent on the method
and intimacy of contact between the two Third as will be discussed later the conductivity of the winding is different in
the axial and radial directions Fourth both free convection of
electrolyte-air vapor as well as two-phase heat transfer mecha-nisms may be present internally Finally external to the ca-
pacitor both radiation and convection are present as heat trans-
fer modes the latter of which may be natural or forced or both
We undertake this work by first looking at the simpler con-
duction and convection aspects of the problem We use some mathematical and FEA simulation techniques to compare pre-
dictions of simpler models with measurements taken on ca-
pacitors of known construction operating with known ripple power in known thermal environments
Fig 1 Typical screw terminal capacitor constructions pitch (left) and pitchless (right)
1 Presented at the IEEE Industry Applications Society Conference October 1999
II THE WINDING
Starting from the hottest spot and working outward we find
that the winding of an aluminum electrolytic capacitor is highly
anisotropic due to the fact that the thermal conductivity is much larger in the axial direction than in the radial direction This is
because the papers are effectively in parallel in the axial direc-
tion but in series in the radial direction and the conductivity of the foil is much higher than that of the papers even when
the papers are wet with electrolyte See Table I [2] On the
other hand the cross-sectional area of the heat flux path is generally larger in the radial direction and the heat flux path
distance is usually smaller in the radial direction depending
upon the aspect ratio (lengthwidth ratio) of the capacitor wind-ing Both of these heat path geometric facts favor relatively
higher thermal conductance in the radial direction while the
anisotropism greatly favors higher thermal conductance in the axial direction
Considering a general three-dimensional physical model of
the capacitor winding we find that the symmetry lends itself to cylindrical coordinates involving an axial component z a
radial component r and an angular component ψ It is hoped
that the thermal conductivity can be modeled as an anisotropic
cylinder with no angular variation so that ψ may be neglected
Furthermore it is desirable to assume position-independent constant axial and radial thermal conductivities This is equiva-
lent to modeling the capacitor winding axisymmetrically as a
series of concentric cylinders alternating foil and wet paper However we realize that there is a turn-to-turn angular contri-
bution of the foil to the radial conductivity This contribution
diminishes as the radial position is increased See Fig 2
To justify the assumption of a negligible angular coupling
contribution to the radial thermal conductivity we consider a single representative turn of a foil-paper layer in the winding
and compare the magnitudes of the radial thermal resistances
through the bulk versus along the angular direction See Fig 3 We may assume that the angular conductivity kψ is approxi-
mately that of aluminum that the radial conductivity k is ap-r
proximately that of the electrolyte and that the aluminum plate thickness and paper thickness are approximately the same Δr
2 Since kψ gtgt k the radial thermal resistance of this arbi-r
trary turn is
θ asymp Δr ( 4πRLk ) (1) r r
the angular contribution to the radial thermal resistance is
θψ asymp 4πR ( ΔrLkψ ) (2)
and the ratio of these thermal resistances is
θψ θ asymp ( 4πR Δr )2 times ( k kψ ) (3) r r
Noting that the paper thickness is approximately 100 microm the radial position R of concern is at least 1 cm and kψ exceeds k
r by less than three orders of magnitude we find that the ratio
(3) evaluates to at least 1600 Therefore the angular contribu-tion of the thermal conductivity is negligible and so the radial
variation of the radial thermal conductivity is negligible By
further appealing to the symmetry of the winding we can dem-onstrate that the axial conductivity k and the radial conduc-
ztivity k can be assumed to be constant
r
Table I Thermal Conductivity of Selected Materials
Material k (WmAK) Type IIa Diamond 2300 Silicon Carbide 490 Silver 425 Copper 398 Aluminum 240 Aluminum Oxide 36 Ice 20 Pyrex Glass 14 Water 065 Silicone Rubber 035 Ethylene Glycol 026 Fig 2 Angular contribution to theAir or steam 003 radial thermal conductivity
2 Presented at the IEEE Industry Applications Society Conference October 1999
2
We would like to use k and k as average values for a givenr z
winding These values need to take into account the relative thicknesses of the foil and of the paper One complication with
simply calculating the k parameters as weighted averages is
that the anode foil is typically highly etched and is often about 70 aluminum by weight and 30 aluminum oxide by weight
when dry By volume the anode foil is only about 50 alumi-
num the other components being aluminum oxide and elec-trolyte Obviously we cannot simply use the percentage of alu-
minum to calculate the relative values of the axial and radial
thermal conductivities of the anode foil since the etching ge-ometry is the more dominant factor and is not uniquely deter-
mined by the aluminum volume
Another complicating factor in calculating the axial and ra-dial thermal conductivities is the paper compression that oc-
curs in an actual winding It is difficult to know the compres-
sive force on a paper as it is wound and even more difficult to estimate this after the winding is saturated with electrolyte
causing the paper to swell
Because of these complicating factors and since we want to measure the thermal conductivities of other materials used in
the construction of capacitors we measure the thermal con-
ductivities empirically on a thermal test stand Fig 4 shows a schematic of the test setup we use A material of thermal con-
ductivity k uniform length L and uniform cross-sectional area
A has a thermal resistance along its length of
θ = L (kA) (4)
Fig 3 Angular contribution to the radial thermal conductivity of an arbitrary turn at radial location R
The temperature drop ΔT across a thermal resistance θ with a
power P flowing through it is
ΔT= Pθ = PL (kA) (5)
Therefore the thermal conductivity can be determined as
k = PL (AΔT) (6)
This simple relationship was used to determine thermal con-
ductivities of a wide variety of capacitor materials and of the axial thermal conductivity k of the winding itself Windings
zof various sizes were drilled at 1 inch axial spacing approxi-
mately 05 inches deep and thermocouples were inserted into these holes The injected power P was adjusted from 5 watts to
20 watts through use of a silicone rubber heater clamped be-
tween thin aluminum plates The power source was an AC variac and a power meter was used to measure the dissipated
power The plate was pressed in contact with the top of the wet
winding and the bottom of the winding was placed in contact with a flux-measuring device comprised of two parallel alumi-
num plates with a vacuum casting of a polymer with known
thermal conductivity The other side of the flux measuring de-vice was thermally bonded to an aluminum chiller plate of pro-
grammable temperature
The entire system was enclosed in a large silicone foam rub-ber cylinder full of styrofoam pellets to create a nearly adia-
batic environment A computer and data acquisition system
Fig 4 Measuring the axial thermal conductivity of a capacitor winding
3 Presented at the IEEE Industry Applications Society Conference October 1999
were used to monitor the temperatures under each test condi-
tion Generally steady-state conditions were reached within four hours
Measuring the radial thermal conductivity was somewhat
more complex than measuring the axial thermal conductivity for two reasons First a radial heat source to make intimate
contact with the arbor hole was not easy to design and fabri-
cate It was necessary to use an expanding copper arbor with thermally bonded resistors Secondly the radial heat flow path
prevented (6) from being used since the cross-sectional area
varied with the radius An expression for the thermal conduc-tivity versus power length and radial position is derived as
follows Let P represent the uniformly injected power into a
cylindrical region of radius RI centered along the axis of a cy-lindrical winding whose outer radius is R
O and whose radial
thermal conductivity is k The outer surface r=RO of the wind-
r ing is maintained at temperature T
O See Fig 5 The tempera-
ture distribution is readily derived by using a variation of (5)
where we consider the length to be an incremental radius dλ and the cross-sectional area to be a function of the radius λ
A(λ) = 2πλL (7)
Since we know the temperature at r=RO we have
RPAdλT(r) = T + I O
(8) O 2πk λL r r
which simplifies to
T(r) = TO + PAln(R
Or)(2πk L) (9)
r
Equation (9) assumes that there is no axial heat loss
Fig 5 Measuring the radial thermal conductivity of a capacitor winding
Radial thermal tests were performed on a 25rdquo diameter by
5rdquo long winding with a 075rdquo diameter hole bored along its axis Thermocouples were inserted into small holes drilled at
025rdquo intervals approximately 15rdquo deep at various radial lo-
cations The winding was impregnated with pure ethylene gly-col (the nonconductive common electrolyte solvent) instead of
electrolyte to prevent ionic contamination of the copper power
resistor assembly A large flanged four-piece hollow alumi-num cylinder with 075rdquo thick walls was used to make contact
between the outside of the winding and the flat chiller plate
during these tests The four sides of the block were clamped with large hose clamps to establish good thermal contact to the
outside of the wet winding The entire system was thermally
isolated as in the previous tests The temperature distribution was recorded on the data ac-
quisition system and the temperatures were found to fit a loga-
rithmic plot that conformed to (9) almost perfectly See Fig 6 The power was varied from 10W to 20W and the chiller refer-
ence temperature was varied from 25 ordmC to 65 ordmC The value of
k was deduced from these measurements and was found not to rvary by more than plusmn10 over the tested range
Additional measurements were made of stacks of wet ca-
pacitor paper materials of the sleeve materials of pitch mate-rials and of contact resistances between the wet capacitor wind-
ing and the can bottom versus applied force
Table II summarizes the measured values of thermal con-ductivities We want to use these values in a thermal model
but we also want to be able to evaluate various sizes shapes
and construction techniques interactively For example what is the effect of thickening the can bottom installing an alumi-
num rod through the center of the capacitor using an alumi-
num top etc Before we can answer these questions we need to
Radial Temperature Distribution
80
60
40
20
0 01 1 10
Radial Position (in)
Tem
pera
ture
(ordmC
)
Data Model
Fig 6 Model and data of the radial temperature distribution of a capacitor winding with power injected at the arbor
4 Presented at the IEEE Industry Applications Society Conference October 1999
develop a model of how heat is transferred throughout the wind-
ing when the power generation is uniform rather than concen-trated at an artificially established isothermal surface as in the
thermal conductivity measurement experiments Additionally
we need to determine how the heat is transferred from the ca-pacitor winding to the can and from the can to the environ-
ment Also we want a fast interactive thermal model
The general heat equation is
g δC MTL2T P+ = C (10)k k Mt
where L2 is the Laplacian operator T is the spatial temperature
distribution δ is the material density k is the material thermal
conductivity g is the regional volumetric power density CP is
the specific heat and t is time
When the steady-state solution is sought the transient term
on the right-hand side of (10) is zero In rectangular coordi-nates the steady state one-dimensional heat equation is
M2T g + = 0 (11)
Mz2 k
The solution for the axial temperature distribution of a wind-
ing whose power is removed through conduction through its bottom end to a reference environmental temperature T
1 is
straightforward See Fig 7 In this case g = P(AL) and inte-
grating (11) twice with respect to the axial coordinate z we obtain
T = Cz2 + Cz + C (12)1 2 3
Table II Measured Thermal Conductivities
To obtain the value of the three constants we need to use three
boundary conditions We know that since the total power flows through the thermal resistances to the reference temperature
C3 = T(0) = T
1 + P ( θ
1 + θ
2 ) (13)
Furthermore by Fourierrsquos Law [3] at the bottom we know that
dT PC = = (14)2 dz k A
z=0 z
Finally applying Fourierrsquos Law at the top we obtain
dT = 0 = 2C
1L + C
2 (15)dz
z=L
which yields
C1 = P 2kLA (16)z
In a similar manner we may solve for the radial temperature
distribution of a winding with uniform power generation and
whose heat is removed solely in the radial direction See Fig 8 We first examine the steady state heat equation in cylindri-
cal coordinates
1 d dTC r +g
= 0 (17)r dr [ ]dr k r
Here
g = P [π(RO
2 RI2)L] (18)
A
Fig 7 Deriving the axial temperature distribution of a capacitor winding with uniform power generation
Material k
zk
rDry Paper (035 gcm3)Dry Paper (055 gcm3)Dry Paper (090 gcm3)EG-Impregnated paperPVC Sleeve MaterialEnd Disc MaterialSil Pad MaterialPitch
k (WmAK) 100
021 0046 0055 0076 017 - 020 0093 0089 034 035
5 Presented at the IEEE Industry Applications Society Conference October 1999
Multiplying by r then integrating yields
dT Pr2
r = + C4 (19)dr 2π(R
O2 R
I2)Lk
r
Dividing by r and integrating we have
Pr2
T(r) = + C4 ln(r) + C
5 (20)
4π(RO
2 RI2)Lkr
Again solving for constants by enforcing boundary conditions
we know that there is no flux or gradient at r=RI Therefore
2dT 2PRI= 0 Y C
4 = (21)dr 4π(R
O2 R
I2)Lkr=R
I r
Since we know T(RO) = T
1 + P ( θ
1 + θ
2 ) we have
P[R 2 + 2R2 ln(R ) ]O I OC
5 = T
1 + P ( θ
1 + θ
2) + (22)4π(R
O2 R
I2)Lk
r
III WINDING TO CAN
At this stage we have sufficient models ((4) (9) (12) and
(20)) and parametric values (Table II) to perform some com-
parisons between radial and axial heat transfer for a couple of different construction types and cooling techniques
Let us first consider windings of various sizes whose lengths
are three times their diameters assuming a uniform volumet-ric power density g = 105 Wm3 Fig 9 shows the relative effect
on the maximum core temperature of maintaining an isother-
mal surface of 25 ordmC at the entire outer radial surface (radial cooling) versus contacting the bottom only (axial cooling) Here
θ1 = θ
2 = 0 It can be seen that axial cooling is much more
effective than radial cooling especially in larger capacitors
Fig 8 Deriving the radial temperature distribution of a capacitor winding with uniform power generation
Now let us compare axial and radial conductances by con-
sidering a more realistic case where the capacitor winding is coupled through its can which is contacting slowly moving air
at a temperature T1= 25 ordmC The winding size is 25rdquo diameter
by 5rdquo length dissipating 10 watts and the can is 30rdquo outside diameter (295rdquo inside diameter) by 56rdquo length Let θ
1 repre-
sent the thermal resistance from the winding to the can and let
θ2 = 2 ordmC W represent the thermal resistance from the can to
the environmental temperature T1 If we consider the can to be
an isothermal surface this means that the can temperature is
45 ordmC Generally in capacitor designs with pitch or potting com-
pound the winding is not compressed tightly against the can
bottom causing the axial thermal resistance from the winding to the can bottom to be relatively high In the best pitchless
designs there are reinforcement ribs and integral center spikes
in the top (header) and in the bottom to keep the winding aligned and to allow high compression of the winding The lowest axial
thermal resistance from winding to case is achieved in high
compression pitchless designs with extended cathode where the cathode is wider than the anode and is offset and exposed
on the bottom of the winding having an effective thermal con-
ductivity that is dominated by interfacial properties (contact resistance) rather than bulk conduction properties This inter-
facial conductivity was measured on the thermal test stand of
Fig 4 as being approximately 800 W(m2K) Notice the units indicate that the effective conductivity is obtained by multiply-
ing the interfacial conductivity by the thickness of the inter-
face For the case of axial conduction we find for compressed wet
paper between the winding bottom and the can assuming a
thickness of 0062rdquo and referring to (4) and Table II θ1 = 28
Maximum Core Temperature vs Winding Radius Radial vs Axial Heat Transfer Modes
150
100
50
0
0 05 1 15 2
LRo = 6 Outer Radial Surface at 25 ordmC
g = 105 Wm3
Ri =02 in
Bottom Surface at 25 ordmC
Outer Radius (in)
Fig 9 Relative effects of heatsinking the outer radial surface of winding vs heatsinking the bottom of winding
Max
imum
Cor
eTem
pera
ture
(ordmC
)
6 Presented at the IEEE Industry Applications Society Conference October 1999
ordmCW for uncompressed paper assuming the thickness is 0125
inches θ1 = 56 ordmCW For compressed extended cathode wind-
ing of this size in a pitchless design we obtain 04 ordmCW Us-
ing (12) we calculate the axial thermal resistance of the wind-
ing as θ a = 020 ordmCW
In the radial direction in a design which is half-filled with
pitch the winding-to-can thermal resistance due to the pitch is
calculated using (9) as 12 ordmCW We have not yet derived the expressions for coupling via free convection and radiation of
the winding to the can in the case of a pitchless design but let
us take this (to be justified later) as θ1 = 27 ordmCW for the entire
winding to the can Twice this thermal resistance would ap-
pear in parallel with the pitch resistance of 12 ordmC since the
pitch only fills half of the space between the winding and can giving a revised value of θ
1 = 12 54 = 098 ordmCW for the
radial winding-to-can thermal resistance of the pitch design
Using (20) we find the radial thermal resistance of the wind-ing to be θ
r = 31 ordmCW
Employing the thermal resistances above we obtain the re-
sults summarized in Table III Since both radial and axial heat transfer modes are present and the can is virtually an isother-
mal surface we may approximate the simultaneous effects of
both axial and radial conduction by computing the result of the axial and radial thermal resistances in parallel We conclude
that the pitchless design with extended paper has a slight ad-
vantage over the pitch design and that the extended cathode design has a very large advantage In actual practice the can
temperature is not truly isothermal In the case of the pitchless
extended cathode design the can bottom is somewhat hotter than the sides erasing some of the advantage of the pitchless
design over that of the pitch design
Even though our simple one-dimensional thermal models
Table III Results from 1-D Models
θ2 = 2 ordmCW T
1 = 25 ordmC P = 10 W 25rdquo dia times 5rdquo L winding
Construction θ1
θ1
Heat Flow Direction r z Radial Axial r z
ordmCW ordmCW T T TCORE CORE CORE
Pitch 098 56 86 ordmC 103 ordmC 67 ordmC
Pitchless 27 28 103 75 65 Extended Paper
Pitchless 27 04 103 51 50 Extended Cathode
have already led to useful results showing that axial conduc-
tion offers the best opportunity for heat removal and allowing us to quantify the effects of heatsinking we have so far only
considered axial and radial thermal conductivity separately
and then lumped the average thermal resistances in parallel to examine the simultaneous effect To precisely model the axial
and radial heat conduction we need to revisit (10) In cylindri-
cal coordinates for the steady-state solution we multiply by k to obtain
M Mk MTC r + k + g = 0 [ ] 2
zT2 (23)r Mr Mr M
Since we are considering an anisotropic medium we must as-
sociate the axial and radial conductivities separately Fortu-nately (23) is in a separable form with respect to the spacial
variables and this is straightforward We have
k M MT M2T r C Mr [ r ] + k
z z2 + g = 0 (24)r Mr M
Unfortunately (24) is impossible to solve in closed form for most interesting cases If we assume g=0 (no internal power
generation) and provide surfaces with simple boundary condi-
tions we obtain solutions of the form
4 4 λr λrT(rz) = 33 [ai
J0 ( ) + b
i Y
0( ) ]Cok ok r ri j (λz λz (25)
[cj J
0 ) + dj Y
0( )]ok ok z z
where J0 and Y
0 are the zeroth-order Bessel and Weber func-
tions respectively It was therefore concluded fairly early in
our thermal modeling development work that computer solu-
tions would need to be employed
IV CAN TO ENVIRONMENT
The heat transfer modes from the can to the ambient envi-
ronment may include conduction convection and radiation
Conduction is a volumetric parameter and includes path length as well as cross-sectional area effects as has already been dis-
cussed Externally conduction is a significant mode only when
the capacitor is attached to a heat sink Convection on the other hand is generally modeled as a
surface effect although the localized film thickness and veloc-
ity (hydrodynamic) and temperature (thermodynamic) distri-butions extend beyond the surface The parameter that describes
the degree of thermal heat transfer coupling from a surface of
7 Presented at the IEEE Industry Applications Society Conference October 1999
area A to the ambient fluid is known as the convection or film
coefficient h which is a strong function of the fluid velocity and mass transfer properties such as density and viscosity If
the surface is at a higher temperature than the environment by
an amount ΔT the power PCONV
dissipated through convection
is given by
PCONV
= hAΔT (26)
Although (26) holds for virtually any fluid this paper deals
only with the fluid being air at standard atmospheric pressure
and at a temperature between 25 ordmC and 85 ordmC An approximate value of h versus velocity which is com-
monly used in the capacitor industry is
hTOT
asymp 11 (v+025)(025) [Wm2K] (27)radic where the velocity v is in units of [ms] Other sources also use a square-root dependence of h on airstream velocity [45] We
note that h has the same units as the interfacial conductance
and analogously is also associated with a thickness (the ldquofilmrdquo thickness) to calculate a relevant thermal conductivity The film
thickness is not used directly in our calculations but it varies
from about 3 cm in natural convection to less than 1 mm in high-velocity air flows [6]
Equation (27) lumps together the effects of natural (free) con-
vection forced convection and radiation The velocity of ldquostillrdquo air or natural convection is taken as 0 The equation above
does not take into account many factors such as capacitor gravi-
metric orientation the aspect ratio (DL) the ambient and sur-face temperatures laminar versus turbulent flow etc The re-
sults when using (27) to predict heat rise ΔT are generally within
about 20 of the measured value For more exact solutions we need to use heat transfer theory
Let us denote the unitless average Reynolds Nusselt and
Rayleigh numbers as Re Nu and Ra respectively A subscript of D or L is generally used along with the numbers to indicate
application to a cylinder or plate respectively Additionally
there is a unitless number Pr the Prandtl number which de-scribes the medium Pr is 23 for monatomic gasses 57 for
diatomic gasses and has little temperature variation in our re-
gion of interest [7] For airstream velocity v cylinder diameter D and kinematic viscosity ν
ReD = vDν (28)
and
12 13 58 45062 ReD Pr Re
DNu = 03 + 1 + ) ] (29)D 23 14[ 1 + (04Pr) ] [ (28200
and finally
h = k NuD
D (30)
for a cylinder in cross-flow where k is the thermal conductiv-ity of air at the film temperature taken as the average of the
surface and airstream temperatures [8] Notice that (29) con-
tradicts the assumption of a strictly square-root relationship between the convection coefficient and the airstream velocity
For natural (free) convection of aluminum electrolytic ca-
pacitors
h = 132 (ΔTD)14 [Wm2K] (31)
where ΔT is the difference in temperature between the can sur-
face and the ambient air temperature in ordmC and D is the diam-
eter in meters [9] Some general comments should be made about convection
at this time In general the convection coefficient h is some-
what larger for small capacitors than for large ones especially for free convection as indicated in (31) Over the size range of
aluminum electrolytic screw terminal capacitors h may be up
to 40 higher for the smallest caps (35 times 40 mm) than for the largest capacitors (90 times 220 mm) due to size alone Also h for
forced air decreases slightly at elevated temperatures due to
the positive temperature coefficient of the ν factor which in-creases about 05ordmC [2] There is some gravitational depen-
dence but it has been found by this author to be slight
Radiation like convection is also a surface-to-environment effect The radiation heat transfer is dependent not only on the
temperature difference between a surface and its environment
but also on the absolute temperatures involved The surface ldquodarknessrdquo or emissivity ε is also important in radiation heat
transfer The power PRAD
transferred from a surface area A at
temperature TS to an environment at temperature T4 due to
radiation is
PRAD
= εσA ( TS4 T4
4 ) (32)
where ε is the surface emissivity (0-1) or ldquodarknessrdquo in the
infrared region of the electromagnetic spectrum and σ = 567 times 108 Wm2K4 is the Stefan-Boltzmann constant [9] For
sleeved capacitors ε = 085 is a good approximation [9] For
8 Presented at the IEEE Industry Applications Society Conference October 1999
bare capacitors ε = 04 approximately [9] Equation (32) may
be put into a form equivalent to (26) by factoring out ΔT = ( TS
T4) yielding
P = h AΔT (33)RAD RAD
where
h = εσ( T + T )( T 2 + T 2 ) (34)RAD S 4 S 4
It can be seen from (34) that the radiation coefficient hRAD
in-creases with both increasing surface and environmental tem-
peratures and it increases slightly as the ΔT is increased while
maintaining the same average temperature This effect is often offset by the decrease in h (convection) with increasing tem-
perature when both radiation and convection are significant
heat transfer modes Radiation heat transfer can be significant compared to natu-
ral convection alone Generally the convection coefficient h
for natural convection varies from about 5 to about 7 Wm2K while h
RAD varies from about 5 to 9 Wm2K for capacitors of
this size and temperature range This gives a total h range for
natural convection plus radiation of about 10 to 15 Wm2K agreeing with (27)
Fig 10 compares the values of h found for actual capacitors
under natural convection conditions versus the model result-ing from adding (31) and (34) Fig 11 compares the values of h
found for capacitors under forced convection conditions com-
pared to (27) and to (30) evaluated at two diameters A new model is proposed as
Free Convection Data and Model
hTOT
= 5 + 17 (v + 01)066 (35)
and this is also shown in Fig 11
V OTHER INTERNAL CONSIDERATIONS
Now that we have discussed both radiation and natural con-
vection we may consider their combined effects in radially cou-pling the outer surface of the winding to the inside of the can
wall If we assume the outer surface of the winding of radius
RW and length L to be at absolute temperature T
W and to have
an emissivity of εW = 085 and the inner surface of the can of
radius RC to be at absolute temperature T
C and have an emis-
sivity of εC = 040 we may calculate the transferred power via
radiation [10] as
σA ( TW
4 TC4 )
PRAD
= 1 1ε R (36)C W+ε ε [ ]
W C RC
We may also calculate the power transferred from the winding radially to the can wall via convection by using [11]
k = 0386 k [PrRa (0861+Pr)]14 (37)EFF AIR C
where KAIR
is the conductivity of still air and
-35 )5 ]Ra = 8Ra [ ln(R R ) ]4 [ L3 ( R -35 + R (38)C L C W C W
where RC is the inner radius of the can wall R
W is the outer
radius of the winding L = RC R
W and Ra
L is given by
Total Heat Transfer Coefficient h vs Air Velocity Data vs Models
Tot
al T
rans
fer
Coe
ffici
ent (
Wm
2 K
) 20
15
10
5
0
0 1 2 3 4 0 10 20 30 40 50 60 70 80 90
Tra
nsfe
r C
oeffi
cien
t h(W
m2 K
)
Eq (30) D=14rdquo
Eq (30) D=30rdquo Eq (35)
Eq (27)
Diameter (in) 0 2 4 6 8 10 12
Air Velocity (ms)
Lab Data Oven Data Lab Model Oven Model
Fig 10 Data and model for total heat transfer coefficient h Fig 11 Data and model for total heat transfer coefficient h versus diameter for natural convection cooling versus air velocity for convection cooling
9 Presented at the IEEE Industry Applications Society Conference October 1999
RaL = gL3(T
Fνα) (39)
where TF is the absolute film temperature and α is the thermal
diffusivity which has about the same temperature coefficient
as the kinematic viscosity ν Equation (37) is recommended for use in the range of 102 lt Ra
L lt 107 but has been found by
this author to give reasonably accurate estimates below the lower
range After examining the combined effects of (36) and (37) for capacitors of the sizes and temperatures under consider-
ation this author suggests using a simplified combined radial
transfer thermal conductivity of
σ R ( T 4 T 4 )ln(R R )W W C C W
kRWC
= 0030 + 13 1 1ε R (40) ε ε
C W[ + [ ]] ΔT W C R
C
Another postulated contributing factor to promoting radial
heat transfer from the winding to the case as well as possibly increasing the effective axial thermal conductivity of the can
wall is the so-called ldquoheat piperdquo effect which is augmented
heat transfer due to phase change of the electrolyte The effect has a gravitational dependency and is most effective when used
with a fluid with a large latent heat of vaporization which evapo-
rates and condenses readily at the device and heatsink tem-peratures respectively Heat pipes transfer heat most readily
from a hot area (heat source) below a cooler area (environ-
ment) and can achieve extremely high effective thermal con-ductivity over 100 times that of silver [12] Because this effect
was potentially significant but was difficult to calculate we
decided to measure it experimentally using a thermal conduc-tivity test stand similar to that of Fig 4 We measured the can
wall conductivity of a 3rdquo diameter by 863rdquo length empty ca-
pacitor sealed with a capacitor top and gasket Then we punc-tured the side wall injected approximately 10 cm3 electrolyte
resealed the can and measured the thermal conductivity again
We performed the same procedure for a capacitor that was empty except for a single turn of foil taped to form a hollow cylinder
of approximate size 27rdquo diameter by 5rdquo length We wrapped
several turns of capacitor paper around the hollow form to pro-duce a wick We also measured capacitors of the same size
with large and small winding diameters To summarize the
results we found an improvement in axial conductivity of only 10 - 25 in this series of experiments
VI OTHER EXTERNAL CONSIDERATIONS
The test stand of Fig 4 was used to measure interfacial con-
ductivities between the can and a heatsink These data are sum-
marized in Table IV The forces are based on the calculations from the torque applied to the 4 threaded rods used to clamp
the capacitors to the chiller plate
It is postulated that the air trapped between the capacitor and the chiller plate gives rise to the largest effects that are
observed The flatness of the capacitor can bottom is also im-
portant and presumably interacts with the clamping technique employed For example if the capacitor bottom surface were
concave clamping via the can walls would not be as effective
in driving out the air pockets as mounting via a stud in the center of the can bottom
Although a bare aluminum capacitor can offers the highest
interfacial conductance from the can bottom to the heat sink generally electrical isolation is needed between these two sur-
faces In this case the best thermal interfacial conductance is
achieved with a Sil-Pad Material or with thermal grease along with flat surfaces and at least 20 pounds of force per square
inch of can bottom area
VII M ODEL RESULTS
Early in this project we were using a finite-element analysis (FEA) software package which did not allow direct simulation
of anisotropic material properties Instead a large number of
individual paper and foil layers had to be drawn A change in construction (paper thickness capacitor length etc) usually
required a complete redraw taking two hours Rerunning the
software for a new condition took about 20 minutes This meant we could run about 4 simulations per day For these reasons
this author began investigating other alternatives and decided
the best solution was to automatically draw the capacitor and
Table IV Measured Thermal Contact Resistances
3-inch Diameter Capacitor Bottom to Flat Plate
Force (lbs) 0 90 180 360
0 90 180 360
Sleeve End Disc 162 ordmCW 130 122 112
Sleeve End Disc Sil Pad 152 120 113 107
Bare Aluminum 062 033 033 030
Bare Aluminum plus Sil Pad 062 048 042 040
10 Presented at the IEEE Industry Applications Society Conference October 1999
solve the partial differential equations and boundary conditions
with an FEA equation solver The equation solver we use allows the capacitor to be ldquodrawnrdquo
by connecting coordinates with line segments and arcs Each
component of the capacitormdash the can the bottom of the wind-ing the inactive turns (with no anode) at the arbor the active
winding the top of the winding the header the header ribs
the dead space around the winding the dead space in the ar-bor the sleeve the end disc etc are all drawn symbolically
with their dimensions as user-editable inputs in the text-based
source file Axial and radial conductivities are assigned to each of the components as are any boundary conditions such as
flux at the outer edge of the sleeve end discs and top The
main advantage of this approach is the speed with which modi-fications are made and evaluated For example to evaluate a
sleeve thickness change only the sleeve thickness dimension
needs to be edited as all other dimensions are adjusted auto-matically working in from the outside dimensions since they
are variables This change is made in about 15 seconds and
the program generally executes in about 30 seconds As other examples the can bottom thickness can wall thick-
ness sleeve conductivity dead turns thickness arbor conduc-
tivity header conductivity air velocity heat sink properties etc are all changed and evaluated within minutes instead of
hours The output is graphical showing a color plot of the
right half of a cross-section of the axisymmetric temperature distribution See Fig 12
The equations and measured values presented in this paper
are used as inputs and there appears to be good correlation between the model results and actual data See Table V These
capacitors are all of extended cathode construction but the
model was found to fit well to capacitors of extended paper construction as well as ECEP (extended cathode extended
Fig 12 Typical graphical output from thermal model The isotherms are shown and are labeled and color-coded
This particular model has a heatsink and 2 ms moving air
paper) is programmed as a parameter within the simulation
The model takes into account the winding diameter which var-ies in this data from about 50 full to over 90 full The model
is generally within 10 of predicting the actual heat rise The
repeatability of the experimental data is not much less than 10 especially for low air velocity andor low heat rise Re-
finement of the model and of the measurement techniques con-
tinues The relative benefit of various constructions are shown in
Table VI The base assumptions are a capacitor of can size 3rdquo
diameter by 5625rdquo length dissipating 10 watts in a 45 ordmC en-vironment with an air flow velocity of 2 ms All of the EP
simulations including those of pitch-containing capacitors
assume the construction to be of the high-compression type which gives a somewhat lower core-to-can-bottom thermal re-
sistance than would be expected from a typical uncompressed
pitch design The poorest construction from a thermal stand-point is the pitchless construction with extended paper (NP
Table V Measured versus Modeled Temperatures
Miscellaneous Production Capacitors (Tc and Tb are core and bottom temperatures (ordmC) respectively)
Measured Modeled D(in) L(in) Ta(ordmC) v(ms) P(W) Tc Tb Tc Tb 20 31 246 10 50 456 410 453 395 20 31 267 18 53 432 395 450 390 20 31 273 36 55 416 359 429 365 25 56 271 076 91 520 444 510 425 25 56 276 18 94 485 399 475 385 25 56 281 36 95 468 377 453 365 25 56 278 076 43 406 383 393 351 25 56 294 18 44 393 365 388 345 25 56 302 36 44 389 358 383 339 20 31 596 076 38 768 735 767 725 20 31 588 10 38 766 709 750 710 30 56 320 10 77 463 430 470 415 30 56 299 18 80 421 376 436 380 30 56 323 33 79 425 382 440 385 20 31 588 060 38 782 750 770 725 30 56 646 090 22 692 681 695 674 25 56 302 076 84 541 464 521 440 25 56 290 15 90 493 405 488 405 25 56 301 30 93 480 389 475 385 30 56 673 10 49 769 740 780 735 25 41 310 10 57 464 436 463 420 25 41 318 18 58 437 409 451 405 25 41 330 36 58 422 401 440 395 30 41 270 076 64 445 402 441 380 30 41 300 18 64 436 390 438 380 30 41 289 36 66 411 363 409 350 14 46 248 51 53 416 331 401 330 14 41 250 51 41 382 330 376 320 25 41 254 51 46 326 291 337 297 30 41 258 51 59 375 317 375 300
11 Presented at the IEEE Industry Applications Society Conference October 1999
EP) The core temperature in this case is 731 ordmC Adding
enough pitch to fill the entire area outside the winding lowers this by 5 ordmC adding 40 to the life However a pitchless ex-
tended cathode design drops the core an additional 7 ordmC to 614
ordmC No other construction changes including doubling the can bottom thickness wall thickness arbor rod etc are of much
help with the exception of the core winding [13] technique
which allows the pitchEP design performance to approach that of the pitchlessEC design Although more expensive than ex-
tended cathode and not always feasible due to volume restric-
tions this technique is useful in improving performance in ca-pacitor designs that would normally have empty space around
the winding This space is instead occupied by additional wind-
ing area by first winding many ldquodeadrdquo turns of cathode and paper at the beginning of the winding process before introduc-
ing the anode The core winding technique is successful due
not as much by having a conductive core as by moving the active power-generating area outward to an area of larger ra-
dius and by placing the outer area of the winding in closer
radial proximity to the can wall If a core winding is combined with a high-compression extended cathode the core tempera-
Table VI Modeled Temperatures
Various Capacitor Constructions Construction Tcore Tbottom Tside PEP 681 540 520 NPEP 731 550 520 NPEC 614 565 525 NPAREC 612 565 515 PCWEP 622 530 525 NPCWEC 575 540 520 NPECHS 544 490 490 NPEPHS 684 520 510 NPEPCWHS 599 515 515 NPECCWHS 560 522 510 NPECDB 610 560 515 NPECDBDW 598 545 525 NPECDBDWAT 588 540 520
Legend P=10 W D=30rdquo L=563rdquo Winding D=255rdquo Ta = 45 ordmC v=2 ms ECmdash Extended Cathode EPmdash Extended Paper HSmdash Heat Sink aty capacitor bottom ID=12rdquo OD=30rdquo
Theta = 10 ordmCW plus 10 ordmCW contact resistance CWmdash Core Winding Inactive 14rdquo inactive diameter (paper and
cathode only) Winding OD=290rdquo Pmdash Outside of winding is filled completely with pitch NPmdash Contains no pitch Outside of winding is empty ARmdash Aluminum arbor rod Diameter = 03rdquo ATmdash Aluminum top DWmdash Double the can wall thickness DBmdash Double the can bottom thickness
ture can be further reduced by 4-5 ordmC versus either technique
alone Additional improvement in capacitor performance can be
achieved through the use of a heat sink especially when the
capacitor construction is extended cathode the thermal con-tact is intimate and the heat sink thermal resistance is low
VIII CONCLUSIONS
We have explored the issues and theory behind thermal mod-
eling of aluminum electrolytic capacitors and have developed and presented a model that has simulation and predictive value
REFERENCES
[1] Greason W D Critchley John ldquoShelf-life evaluation of
aluminum electrolytic capacitorsrdquo IEEE Transactions on Components Hybrids and Manufacturing Technology
vol 9 no 3 September 1986 pp 293-299
[2] Incropera F P DeWitt D P Introduction to Heat Transfer John J Wiley and Sons New York 1985 pp
669-687
[3] Incropera F P DeWitt D P ibid p 35 [4] Unattributed ldquoAavid Forced Air Thermal Calculatorrdquo
Aavid Engineering Inc 1987
[5] Eisaian A ldquoAir-cooling electronic systems an introduc-tionrdquo Electronic Design December 1997
[6] Hsu T H Engineering Heat Transfer D Van Nostrand
Company Inc Princeton 1963 p 269 [7] Lienhard J H A Heat Transfer Textbook Prentice-Hall
Englewood Cliffs NJ 1981 p 285
[8] Incropera F P DeWitt D P Fundamentals of Mass and Heat Transfer John J Wiley and Sons New York
1996 p 371
[9] Gasperi M L Gollhardt N ldquoHeat transfer model for capacitor banksrdquo 33rd Annual Meeting of the IEEE IAS
October 1998
[10] Incropera F P DeWitt D P Introduction to Heat Transfer John J Wiley and Sons New York 1985
p 609
[11] Incropera F P DeWitt D P ibid pp 403-404 [12] Catalog of Indek Corporation 1998
[13] Stevens J L Shaffer J S ldquoModeling and improving
heat dissipation from large aluminum electrolytic capaci-tors IIrdquo 32nd Annual Meeting of the IEEE IAS Octo-
ber 1997 pp 1046-1051
12 Presented at the IEEE Industry Applications Society Conference October 1999
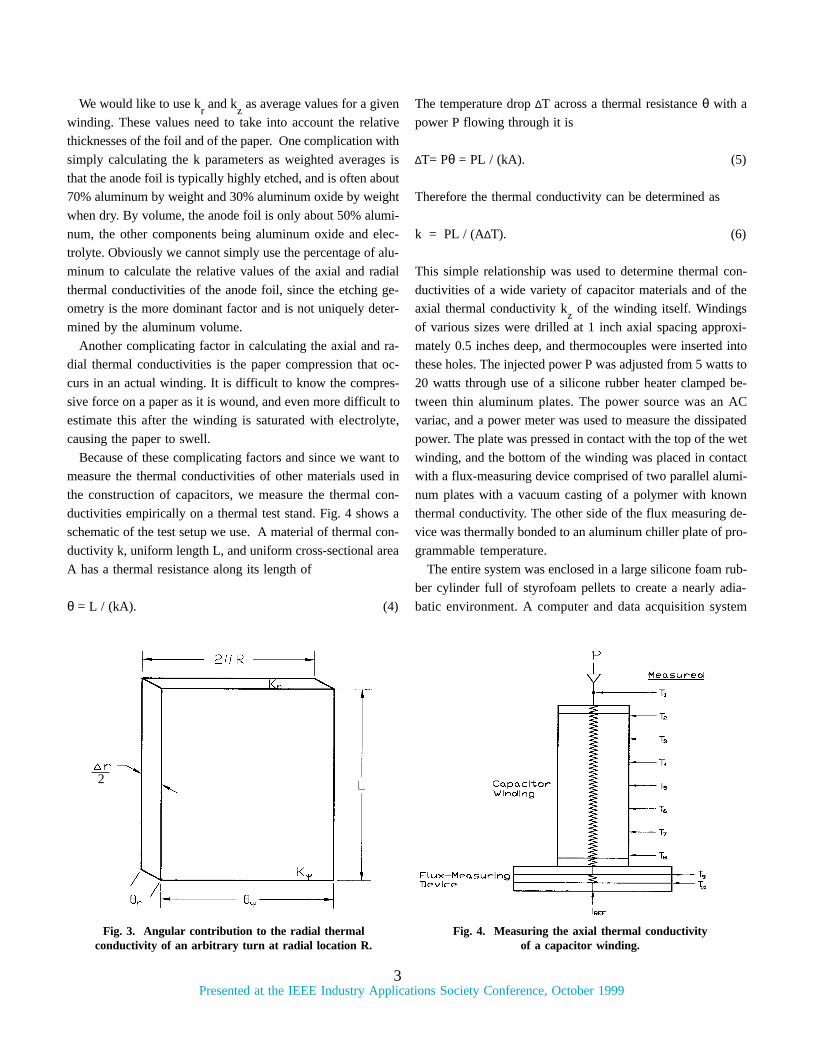
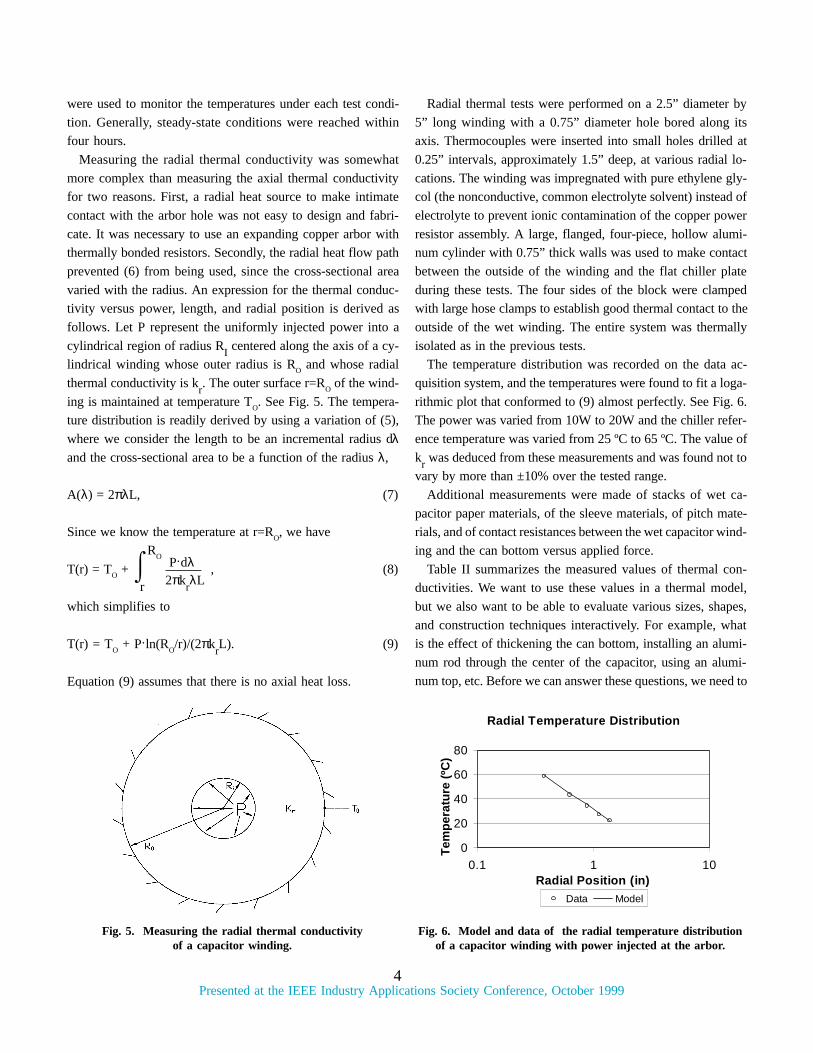
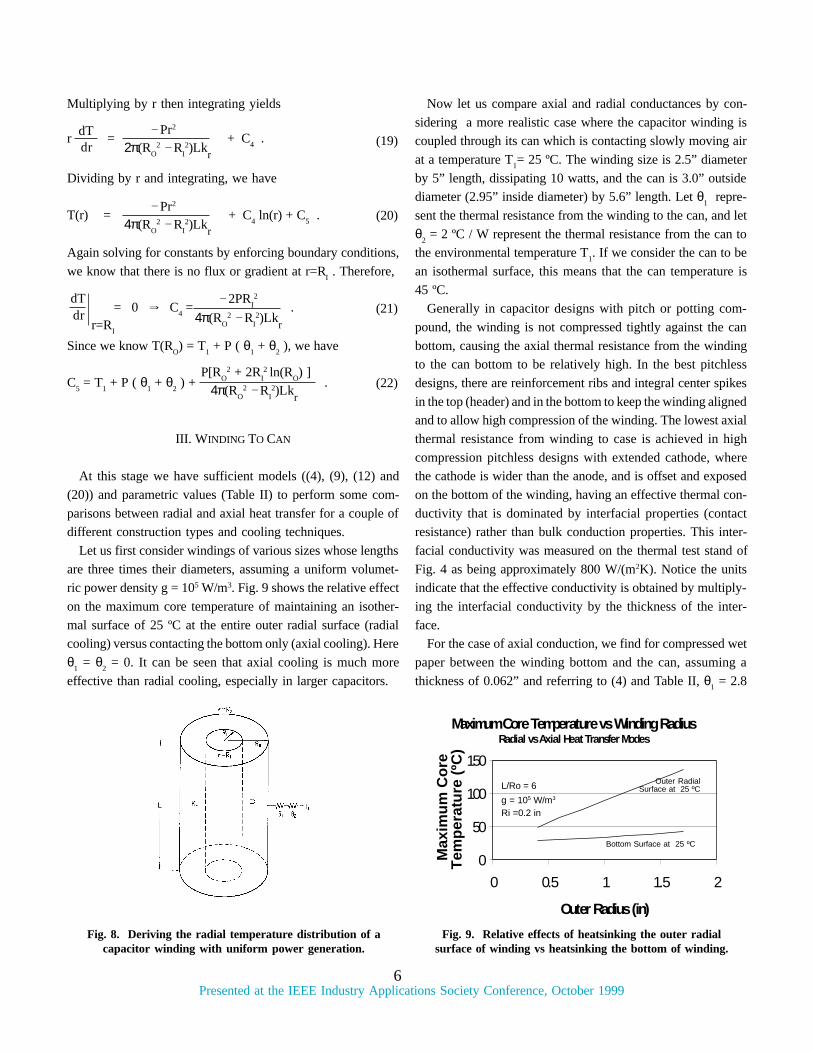
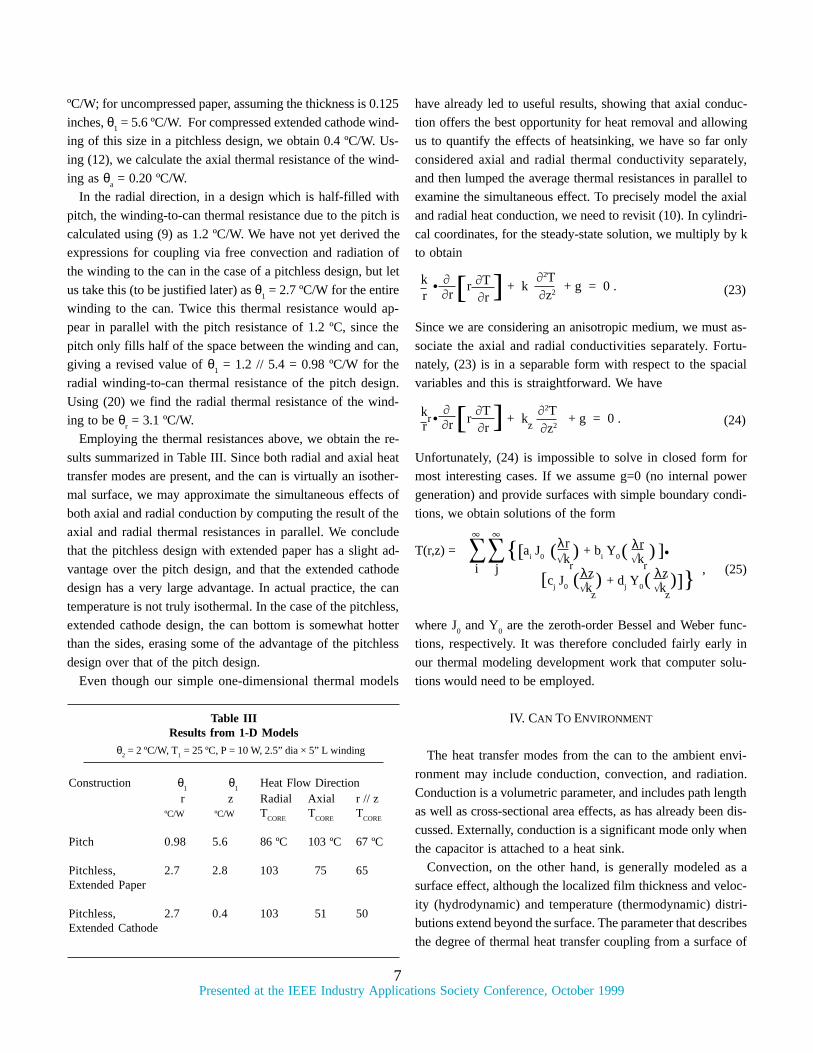
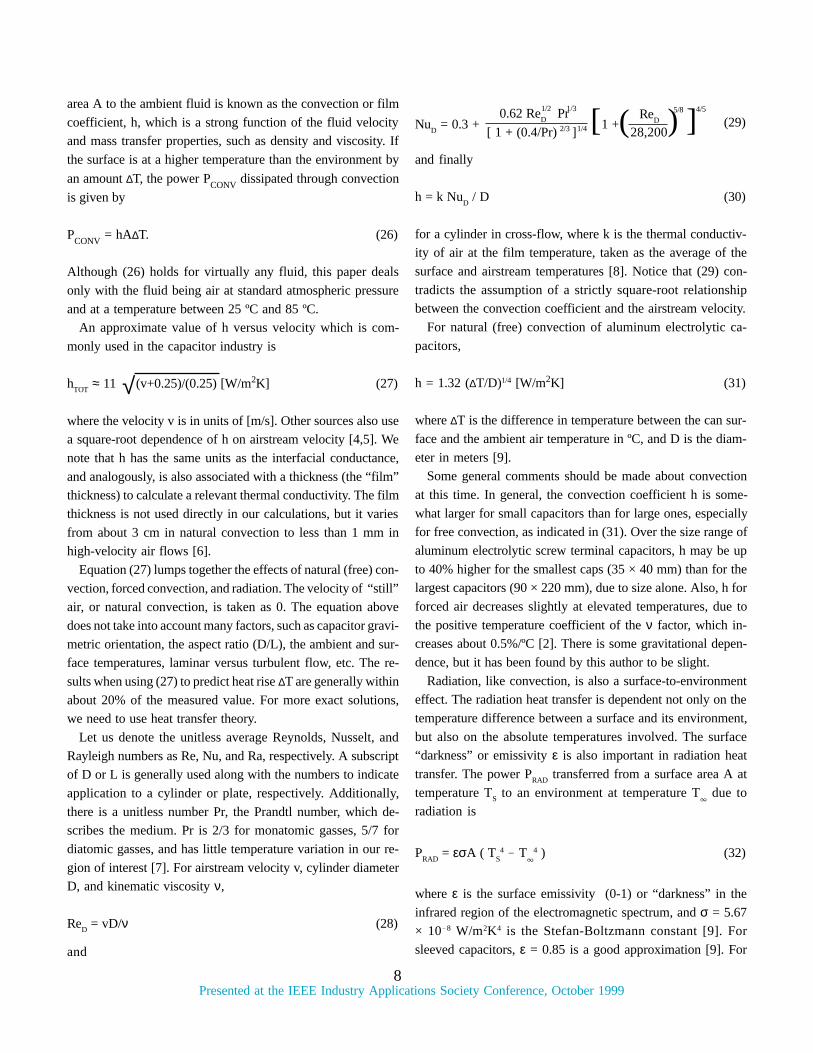