thermal inactivation of acid adapted and non...
TRANSCRIPT

1
THERMAL INACTIVATION OF ACID ADAPTED AND NON-ADAPTED STATIONARY
PHASE SHIGA TOXIN-PRODUCING ESCHERICHIA COLI (STEC), SALMONELLA SPP.,
AND LISTERIA MONOCYTOGENES IN ORANGE JUICE
By
ZEYNAL TOPALCENGIZ
A THESIS PRESENTED TO THE GRADUATE SCHOOL
OF THE UNIVERSITY OF FLORIDA IN PARTIAL FULFILLMENT
OF THE REQUIREMENTS FOR THE DEGREE OF
MASTER OF SCIENCE
UNIVERSITY OF FLORIDA
2012

2
© 2012 Zeynal Topalcengiz

3
To my mother Mrs. Guler Topalcengiz, my father Mr. Muhsin Topalcengiz, my brother, Mr.
Muharrem Yekta Topalcengiz, my sister-in-law, Mrs. Medine Topalcengiz, and my lovely
nephew, Mr. Hasan Topalcengiz, for their endless support

4
ACKNOWLEDGMENTS
I would like to thank my advisor Michelle D. Danyluk for the opportunity, great
understanding and support during my research. I thank especially lab mates Ms. Angela M.
Valadeza, Ms. Thao Nguyen, Ms. Rachel Mcegan, Ms. Loretta M. Friedrich, and all other
Danyluk’s group members. I also would like to thank Ms. Gwen Lundy, Mr. Luis Martinez, and
Mr. Brian Buzzie for technical assistance. I also would like to thank Mr. Mihai C. Giurcanu for
statistical assistance.
I thank my friends in Gainesville who shared their experiences and knowledge with me,
Mr. Engin Kilic, Mr. Ilker Avan, Mr. Yavuz Yagiz. I also thank my friends, Mr. Umit Erdem
Algun, Mr. Egemen Tuncay, Mr. Emir Altug.
I thank my committee members, Dr. José I. Reyes, Dr. Renée Goodrich Schneider, and Dr.
Reza Ehsani for their helpful discussion and recommendations.
I also would like to thank my parents and my brother for their endless support and
encouragement.

5
TABLE OF CONTENTS
page
ACKNOWLEDGMENTS ...............................................................................................................4
LIST OF TABLES ...........................................................................................................................7
LIST OF FIGURES .........................................................................................................................8
ABSTRACT .....................................................................................................................................9
CHAPTER
1 INTRODUCTION ..................................................................................................................11
2 LITERATURE REVIEW .......................................................................................................15
Fruit Juice, Pathogens, and Process ........................................................................................15
Fruit Juice Pathogens ..............................................................................................................15
Escherichia coli ...............................................................................................................16
Salmonella .......................................................................................................................18
Listeria monocytogenes ...................................................................................................20
Cryptosporidium parvum .................................................................................................22
History of Fruit Juice Outbreaks.............................................................................................23
Orange Juice ...........................................................................................................................25
Orange Juice Process .......................................................................................................26
Thermal Orange Juice Pasteurization and Alternatives ...................................................27
Acid Adaptation and Thermal Resistance ..............................................................................28
Acid Adaptation ...............................................................................................................28
The ATR of E. coli ...................................................................................................30
The ATR of Salmonella ...........................................................................................31
The ATR of Listeria .................................................................................................32
Thermal Tolerance and Experimental Thermal Treatments ............................................33
Thermal resistance of E. coli ....................................................................................34
Thermal resistance of Salmonella ............................................................................35
Thermal resistance of Listeria ..................................................................................36
3 MATERIAL AND METHODS ..............................................................................................38
Juice ........................................................................................................................................38
Strains Used ............................................................................................................................38
Inoculum Preparation ..............................................................................................................39
Thermal Treatment of Inoculated Juice ..................................................................................40
Microbiological Analysis ........................................................................................................41
Statistical Analysis ..................................................................................................................41

6
4 RESULTS ...............................................................................................................................47
Time Interval Determination ..................................................................................................47
D and z-value Determination for Strains and Serotypes of Pathogens Used ..........................47
D and z-values of STEC Strains .............................................................................................48
D-values of Salmonella Serotypes ..........................................................................................49
D-values of L. monocytogenes Strains....................................................................................50
Heat Resistance of All Pathogens ...........................................................................................51
5 DISCUSSION .........................................................................................................................74
6 CONCLUSIONS AND FUTURE WORKS ...........................................................................80
LIST OF REFERENCES ...............................................................................................................82
BIOGRAPHICAL SKETCH .........................................................................................................94

7
LIST OF TABLES
Table page
3-1 Isolates used for thermal processing experiments. ............................................................43
3-2 Time intervals used in heat treatment experiments of STEC strains to plot regression
lines in determination of D-values. ....................................................................................44
3-3 Time intervals used in heat treatment experiments of serotypes to plot regression
lines in determination of D-values. ....................................................................................45
3-4 Time intervals used in heat treatment experiments of L. monocytogenes strains to
plot regression lines in determination of D-values. ...........................................................46
4-1 Linear regression equations and R2 of STEC strains used in D-value calculations at
56, 58, 60°C.. .....................................................................................................................53
4-2 Linear regression equations and R2 of Salmonella serotypes used in D-value
calculations at 55, 58, 60°C.. .............................................................................................54
4-3 Linear regression equations and R2 of L. monocytogenes strains used in D-value
calculations at 56, 58, 60°C.. .............................................................................................55
4-4 Linear regression equations and R2 of strains used in z-value calculations.. .....................56
4-5 D and z-values of STEC strains from linear regression equations.. ...................................57
4-6 D and z-values of Salmonella serotypes from linear regression equations.. ......................58
4-7 D and z-values of L. monocytogenes strains from linear regression equations.. ...............59
4-8 Average z-values of STEC and L. monocytogenes strains and Salmonella serotypes. ......60

8
LIST OF FIGURES
Figure page
4-1 Linear regression lines of STEC strain at 56°C to estimate D-value. ................................61
4-2 Linear regression lines of STEC strains at 58°C to estimate D-value.. .............................62
4-3 Linear regression lines of STEC strains at 60°C to estimate D-value. ..............................63
4-4 Linear regression lines of Salmonella serotypes at 55°C to estimate D-value.. ................64
4-5 Linear regression lines of Salmonella serotypes at 58°C to estimate D-value. .................65
4-6 Linear regression lines of Salmonella serotypes at 60°C to estimate D-value.. ................66
4-7 Linear regression lines of L. monocytogenes strains at 56°C to estimate D-value. ...........67
4-8 Linear regression lines of L. monocytogenes strains at 58°C to estimate D-value.. ..........68
4-9 Linear regression lines of L. monocytogenes strains at 60°C to estimate D-value. ...........69
4-10 Linear regression lines of STEC strains to estimate z-value..............................................70
4-11 Linear regression lines of Salmonella serotypes to estimate z-value.. ...............................71
4-12 Linear regression lines of L. monocytogenes strains estimate z-value.. .............................72
4-13 Semilogaritmic plot of D-values versus temperature.........................................................73

9
Abstract of Thesis Presented to the Graduate School
of the University of Florida in Partial Fulfillment of the
Requirements for the Degree of Master of Science
THERMAL INACTIVATION OF ACID ADAPTED AND NON-ADAPTED STATIONARY
PHASE SHIGA TOXIN-PRODUCING ESCHERICHIA COLI (STEC), SALMONELLA SPP.,
AND LISTERIA MONOCYTOGENES IN ORANGE JUICE
By
Zeynal Topalcengiz
August 2012
Chair: Michelle D. Danyluk
Major: Food Science and Human Nutrition
Thermal inactivation parameters of stationary phase, non-adapted and acid adapted
pathogens, primarily as cocktails of multiple strains, have been studied in various juice products.
All D-values for STEC, Salmonella, and L. monocytogenes in orange juice were obtained using
strain cocktails. The objective of this study was to evaluate the heat resistance of individual
strains of stationary phase non-adapted and acid adapted Shiga toxin-producing Escherichia coli
(STEC), Salmonella spp., and L. monocytogenes in orange juice.
Three STEC, L. monocytogenes, and Salmonella strains/serotypes were evaluated. STEC
and Salmonella isolates were grown in TSB, and L. monocytogenes strains grown in BHI,
supplemented with 1% glucose for acid adaption, and inoculated into single-strength pasteurized
orange juice without pulp. Inoculated juice was sealed into microcapillary tubes. Microtubes
were immersed into water baths at 56, 58, and 60°C for STEC and L. monocytogenes strains and
at 55, 58, and 60°C for Salmonella serotypes, removed at predetermined time intervals, and
placed immediately onto ice. Thermally treated and sterilized tubes were crushed in 0.1%
peptone using a sterile glass rod for microbiological analysis. Populations of STEC and
Salmonella were enumerated on TSA supplemented with 0.1% sodium pyruvate; BHI agar
supplemented with 0.1% sodium pyruvate was used for L. monocytogenes strains.

10
Different strains in the same species responded to heat differently. Thermal tolerance was
increased significantly (P < 0.05) for acid adapted STEC strains, however, acid adaptation did
not improve heat resistance for Salmonella spp., and L. monocytogenes strains at most
temperatures tested. Salmonella serotypes are less heat resistant, at all temperatures tested, than
L. monocytogenes and STEC. Shiga toxin-producing Escherichia coli, especially strain O111,
are the most heat resistant at 56 and 58°C; L. monocytogenes strains are the most thermal
tolerance at 60°C. Combining individual results of all pathogens tested, the formula of log D =
8.2 – 0.14T (°C) was used to calculate a general process for orange juice at 71.1°C. Using this
equation, a 5-log reduction of all three pathogens in single strength orange juice requires 5.29 s
at 71.1°C, with a z-value of 7.1°C.

11
CHAPTER 1
INTRODUCTION
Pathogenic, foodborne microorganisms remain a significant food safety concern in food
production. To inactivate these pathogens, thermal pasteurization is one of the most commonly
applied and effective technique (MacGregor and Farish, 2000). The thermal inactivation
parameters of acid adapted and non-adapted stationary phase Escherichia coli O157:H7,
Salmonella spp, and Listeria monocytogenes, primarily as cocktails of multiple strains, has been
studied in various food products; most of these studies were conducted a decade ago (Mazzotta,
2001; Mak et al., 2001; Singh et al., 2008). Fruit juices are widely consumed product with a
pasteurization step during process (Ngadi et al., 2010). In thermal fruit juice pasteurization, the
success of the process depends on the establishment of appropriate heat application times and
temperatures. Validation of these parameters through elaborated studies with appropriate
methodologies is essential.
Several outbreaks related to fruit juices occurred in 1990s, threatening public health
(Vojdani et al., 2008). The Centers for Disease Control and Prevention (CDC) report a total of 21
outbreaks of E. coli O157:H7, Salmonella spp., and Crytosporidium, associated with the
consumption of unpasteurized fruit juice between 1995 and 2005 (Vojdani et al., 2008).
Outbreaks of E. coli have been associated with the consumption of unpasteurized apple cider and
apple juice. Outbreaks of Salmonella serotypes have been linked mainly to unpasteurized orange
juice consumption. Listeria monocytogenes has not been implicated in any outbreak related to
fruit juice consumption (FDA, 2001). The routes of contamination of these pathogens have not
been completely identified in any of the juice outbreaks. The use of dropped fruit, non-potable
water, and the presence of cattle and wildlife in, or close to, the production or processing
environment are included as likely sources of juice contamination (Harris et al., 2003).

12
Inactivation of pathogens before consumption of fruit juices has become mandatory as a result of
outbreaks associated with fruit juice. Food and Drug Administration (FDA) published a juice
final rule (66 FR 6137) in January, 2001, requiring that all the juice processors must comply with
the Hazard Analysis Critical Control Points (HACCP), and achieve a 5-log reduction of the
pertinent pathogenic microorganism (FDA, 2001).
Pasteurization in the juice industry can be achieved by many different technologies;
however thermal pasteurization is the most common. High temperature short time (HTST)
pasteurization is commonly used as a heat treatment technique with optimum temperatures and
time parameters. Current thermal treatment of fruit juices and apple cider appears to be efficient
in the prevention of microbial spoilage and elimination of pathogens. Pasteurization parameters
for fruit juice with the use of cocktails of target microorganisms have been studied by numerous
researchers (Mazzotta, 2001; Mak et al., 2001; Singh et al., 2008), and appropriate time and
temperature parameters in pasteurization have been recommended as 3 s at 71.1º C by FDA. The
inactivation of “pertinent microorganism” is targeted by processors in the determination of
pasteurization parameters. Pasteurization may also cause unavoidable change of
physicochemical, nutritious, and sensory properties of juice (Lee and Coates, 2002; Moshonas et
al., 1993; Moshonas and Shaw, 1995). Determination of the appropriate thermal inactivation
parameters constitute essential variables for the designation of juice pasteurization to produce
safe, stable, and quality juices. In the absence of pasteurization, spoilage microorganism can
take advantage of favorable environment of fruit juices, grow, and spoil products. However,
foodborne pathogens do not normally grow in fruit juices.
Acidic foods, like most fruit juices, were not recognized as a vehicle of foodborne
pathogens until the first confirmed outbreak of E. coli O157:H7 related to unpasteurized apple

13
cider in 1991 (Besser et al., 1993). Some foodborne pathogens can develop acid adaptation
systems that induce cross-protection, and makes them more resistant against other environmental
stresses (Leyer and Johnson, 1993; Bearson et al., 1997; Ryu et al., 1998; Ryu and Beuchat,
1998), thus, increasing their ability to survive in juice long enough to cause an outbreak.
Escherichia coli O157:H7, Listeria monocytogenes, Salmonella spp., and Cryptosporidium
parvum, can tolerate low pH values and survive in fruit juices and juice concentrates longer than
non-adapted cells (Hsin-Yi and Chou, 2001; Oyarzabal et al., 2003; Gahan et al., 1996). The acid
adaptation of L. monocytogenes, E. coli O157:H7, and Salmonella spp, also increases the heat
resistance of these bacteria in apple, orange, white grape juices, apple cider, cantaloupe, and
watermelon juice (Mazotta, 2001; Ryu and Beuchat, 1998; Sharma et al., 2005). Research
comparing acid adapted and non-adapted strains used various strains and serotypes of each
microorganism as cocktails with similar temperature values (52, 56, 57, 60, 62, 64°C).
Fruit juice pasteurization parameters should be studied in more detail due to differences among
the methodologies applied and the use of cocktails rather than individual strains in currently
published studies. The number of current studies regarding thermal inactivation of acid-adapted
microorganisms in the fruit juices is limited, and compounded by the use of strain cocktails. In
this master thesis, we evaluate the effect of acid adaptation on the heat resistance of individual
isolates of Shiga toxin-producing E. coli (STEC), Salmonella spp. and Listeria monocytogenes in
single strength orange juice. The purpose of this study is to evaluate the thermal inactivation
responses of acid adapted and non-adapted stationary phase Shiga toxin-producing E. coli
(STEC), Salmonella spp., and L. monocytogenes by using individual strains of each organism in
single strength orange juice, respectively. We inoculated each microorganism separately for a
respective determination of thermal inactivation values, rather than inoculating as cocktail where

14
strain to strain variability may be lost or masked, as previous studies have done. Also, the
specific objectives of this study are to determine how acid adaptation of each pathogen affects
the thermal inactivation values in the absence of potential microbial interactions and metabolic
end products among different species, to estimate thermal death time parameters (D- and z- value)
for acid adapted and non-adapted stationary phase of these pathogens, and to validate current
studies about thermal death time parameters (D- and z- value) for acid adapted and non-adapted
stationary phase pathogens in orange juices. Results of this project should provide more detailed
and clarified information about the effect of acid adaptation of stationary phase microorganisms
on thermal inactivation of bacterial survival, and should lead to be a better understanding of the
determination of pasteurization parameters for processors.

15
CHAPTER 2
LITERATURE REVIEW
Fruit Juice, Pathogens, and Process
Legally, a commercial product that is “100% juice” is called juice in the United States,
while other carbonated or noncarbonated beverages that contains less than 100 % juice are called
“beverages”, “cocktails”, or “drinks” under 21 CFR 102 (FDA, 2010) . “Juice” is defined under
21 CFR 120.1(a) as “the aqueous liquid expressed or extracted from one or more fruits or
vegetables, purees of the edible portions of one or more fruits or vegetables, or any concentrates
of such liquid or puree” (FDA, 2009). Lozano (2006) describes fruit juices as the products that
are ready for direct consumption, and are obtained by the extraction of cellular juice from fruit
tissues.
Fruit juices are significant commodities in the global market with the consumers from all
age groups. Health advantages, freshness and preferable taste and flavor properties, are some of
the reasons for the popularity of fruit juices. In 2009, the U.S. juice industry in had a value over
$22 billion, volume in excess of 16 billion liters, and accounted for 30.8% of the global juices
market value (Datamonitor, 2010). According to the U.S. Department of Agriculture/Economic
Research Service in 2008, out of the 25.7 gallons of beverages consumed per capita, 6.9 gallons
were fruit juice (USDA-ERS, 2010).
Fruit Juice Pathogens
Fruit juices can be spoiled by microorganisms; particularly yeasts, molds, and acid
tolerant bacteria, due to their high water activity and sugar content. Foodborne pathogens do not
normally grow to levels of spoilage in fruit juices, primarily due to the high acid content of many
of these juices. Nonetheless outbreaks, including the first confirmed outbreak of Escherichia coli
O157:H7 associated with apple cider in 1991 (Besser et al., 1993), led researchers to reevaluate

16
the ability of foodborne pathogens to survive for extended periods in high-acid food products
(Moody, 2003). Shiga toxigenic E. coli (STEC), Listeria monocytogenes, Salmonella spp., and
Cryptosporidium parvum, can tolerate the acidic environment and survive in fruit juices and
juice concentrates longer than initially expected. The ability of some of these pathogens to adapt
to the acidic environment increases the risk (Hsin-Yi and Chou, 2001; Oyarzabal et al., 2003;
Gahan et al., 1996). With the exception of L. monocytogenes, STEC Salmonella spp and C.
parvum are implicated as the primary cause of many fruit juice associated outbreaks. Although
not linked to any fruit juice associated outbreaks; Listeria species have been isolated from
unpasteurized apple and apple raspberry blends in a survey of fifty juices (Sado et al. 1998).
Escherichia coli
The genus Escherichia is a typical member of enterobacteriaceae that live in the intestinal
system of humans and warm-blood animals. Escherichia coli are gram-negative, rod-shaped
facultative anaerobes, some species of which may causes a large variety of diseases including
diarrhea, urinary tract infections, sepsis and meningitis (Meng et al., 2007). The optimum
temperature for growth is 37°C, but growth has been observed between 8°C and 45°C (Meng et
al., 2007). Generic E. coli is commonly used as an indicator of fecal contamination indicator in
water supplies as up to 1% of the fecal bacterial flora of mammals is compromised of E.coli
(Windfield and Groisman, 2003).
The serotypes of E. coli are separated according to three major antigens: The “O” antigen
on lipopolysaccharide of the outer membranes, “H” antigens on the flagella, and “K” antigens on
the capsules. A total of 173 O antigens, 56 H antigens, and 103 K antigens have been identified
(Orskov and Orskov, 1992). Based on virulence properties, mechanisms of pathogenicity,
clinical symptoms, and different O:H serotypes, E. coli isolates that induce diarrheal diseases
have been classified into groups called pathotypes (Meng et al., 2007). Enterotoxigenic E. coli

17
(ETEC), Enteroinvasive E. coli (EIEC), Enterohemorrhagic E. coli (EHEC), Enteropathogenic E.
coli (EPEC), diffuse-adhering E. coli, and Enteroaggregative E. coli (EAEC) represent the six
pathotypes of E. coli that are responsible for outbreaks due to the consumption of contaminated
food and beverages.
Escherichia coli O157:H7, (EHEC; STEC) were first recognized as human pathogens
following two outbreaks of bloody diarrhea (hemorrhagic colitis; Riley et al. 1983). Although
numerous serotypes of EHEC including O26, O111, Sorbitol–fermenting O157:NM have been
implicated as the cause of hemorrhagic colitis, E. coli O157:H7 remains the primary cause of
hemorrhagic colitis in the U.S., which may be followed by the fatal hemolytic uremic syndrome
(HUS) complication, especially among children (Karch et al., 2005). The cause of the bloody
diarrhea and HUS is the ability of EHEC to produce a called Shiga-toxin (or verotoxin, STEC, or
verotoxin-producing E. coli (VTEC); Griffin, 1998). The name of toxin comes from its similarity
to toxin produced by Shigella dysenteriae type 1 (O’Brien et al., 1992).
STEC strains are not part of the natural microflora of fresh juice or the fruit used in the
production of fresh juice. It is believed that the presence of E. coli in fruit juice is a consequence
of fecal contamination emanated from other reservoirs, such as cattle, wild birds, deer, rodents,
goats, sheep, cats, dogs (Nielsen et al., 2004). In the light of numerous juice outbreaks, STEC
can tolerate the low pH of juice and survive to cause illnesses. The effect of environmental
stresses on the resistance of E. coli O157:H7 have been studied in different types of buffer,
media, models, and food. Acid-adapted E. coli O157:H7, grown in medium supplemented with
1 % glucose, increased the thermal resistance in apple cider and orange juice; however the strain,
type of organic acid, acid adaptation, and acid shocking affected the acid resistance (Ryu and
Beuchat 1998). Acid-adapted E. coli O157:H7 survive longer than non-adapted cells in fruit

18
juices under refrigeration (Hsing-Yi and Chou, 2001). Escherichia coli O157:H7 survived at
detectable levels in apple, orange, pineapple, and write grape concentrates in 12 weeks period
storing at -23°C (Oyarbazal et al., 2003) and at levels of 103
CFU/100 mL from orange juice
concentrates stored for 147 day at -12.2°C with 107
CFU/100 mL initial concentrations (Larkin et
al., 1995). In apple juice, E. coli O157:H7 survives up to 24 days at 4°C. (Miller and Kaspar,
1994; Fratamico et al., 1997; Splittstoesser et al., 1996).
Salmonella
Although Salmonella Typhi was discovered in 1880 by Karl Joseph Eberth, and isolated
in 1884 by Georg Theodor August Gaffky, the name of this microorganism comes from the name
of one of the two researchers, Daniel Elmer Salmon, a U.S. veterinary surgeon and Theobald
Smith, who isolated Salmonella cholera-suis from ill hogs in 1885 (ICMSF, 1996).
Salmonella spp. are gram-negative, facultative anaerobic, non-spore forming, rod-shaped
bacterium in the family Enterobacteriaceae. Non-typhoidal Salmonella infections cause
salmonellosis, whose symptoms include diarrhea, fever, vomiting, nausea, and abdominal pain.
The most vulnerable groups to Salmonella infection are young children, the elderly, and
immunocompromsied individuals. Although some members of this family are nonflagellated,
member of Salmonella genus predominantly have peritrichous flagella, and are motile (Maure
and D’Aoust, 2007). Salmonella bongori and Salmonella enterica represent the two species of
the genius Salmonella. Salmonella enterica are subdivided into seven subspecies: Salmonella
enterica subsp. enterica (I), Salmonella enterica subsp. salmonae (II), Salmonella enterica
subsp. arizonae (IIIa), Salmonella enterica subsp. diarizonae (IIIb), Salmonella enterica subsp.
houtenae (IV), Salmonella bongori (V), and Salmonella enterica subsp. indica (VI), that induces
the majority of Salmonella-causing diseases among human and the warm-blooded animals

19
(Cooke et al., 2007).According to Kauffmann-White scheme, an antigenic formula for
Salmonella serotypes, there are over 2,600 Salmonella serotypes (Popoff et al., 2004).
Salmonella can be easily cultured in the laboratory, and it is easy to see visible colonies
after 24 h incubation at about 37°C. They can survive a wide range of pH, between 4.5 and 9.0;
with the optimal pH for growth around neutrality (Rovira et al., 2006). The maximum growth
temperature is just above body temperature, and most serotypes do not grow below 7°C,
however some serotypes can grow as low as 2°C and as high as 54°C (Baker et al., 1986;
Droffner and Yamamoto, 1992). Recent outbreaks of Salmonella have been associated with
consumption of fresh tomatoes, raw/undercooked shell eggs, lettuce, unpasteurized orange juice,
cantaloupes, chocolate, alfalfa sprouts, and poultry (Yaun, 2002; CDC, 2012). Salmonella can
tolerate and adapt to acidic conditions, and high acidic foods, such as unpasteurized orange juice,
and tomatoes have caused outbreaks (Yuk and Schneider, 2006; Leyer and Johnson, 1992).
There are a number of ways Salmonella may be introduced to fruit juices from harvest to
the final product. Although pathogen contamination routes have not been definitively confirmed
in any juice outbreak, the use of dropped fruit, nonpotable water, and the presence of cattle, deer,
or, in one case, amphibians, in or near production of fruit appear to be a reoccurring theme
(Harris et al., 2003). Danyluk et al. (2010) concluded that under typical postharvest handling
practices Salmonella population on the orange peel surface did not grow or penetration in to
juice for intact fruit, even in the presence of minor wounds or natural-light labeling; survival on
the peel surface exceeded 45 days. The long term survival on fruit surfaces may be a potential
contamination risk for processing equipment. However, microbial levels detected in fresh juice
were 90–99% lower than levels found on corresponding fruit surface, indicating that much of the
surface contamination on fruit can be eliminated by commercial citrus juice extraction. Valero et

20
al. (2010) indicate that high initial microbial population level (105
to 106 CFU/mL) in citrus juice
may occur as a consequence of insufficient sanitation, poor hygiene practices, deteriorated fruits,
and poor equipment sanitation, potentially increasing the risks of foodborne pathogens in juice.
Salmonella can adapt to extreme acid environments in a similar manner as E. coli, and can
survive in apple juice with a pH of 3.6 for 30 day at 22°C (Goverd et al., 1979). In orange juice,
Parish et al. (1997), describe the survival of Salmonella serotypes Gaminara, Hartford, Rubislaw,
and Typhimurium in pH 3.5, 3.8, 4.1, and 4.4, and stored at 0 and 4°C with 106 CFU/mL initial
concentration survived in detectable numbers more than 26 days at pH 3.5, 46 days at pH 3.8, 60
days at pH 4.1, and 73 days at pH 4.4.
According to CDC (2010), an estimated 1.4 million cases of salmonellosis occur annually
in the U.S. resulting in approximately 400 fatalities. Historically, a number of Salmonella
outbreaks were linked to consumption of unpasteurized juices.
Listeria monocytogenes
Listeria monocytogenes differs from E. coli and Salmonella due to severity of illness it
causes, the high case-fatality rate, long incubation period prior to consumption, unique growth
capabilities, and ability to survive.
Listeria monocytogenes is a gram positive, rod-shaped, non-sporeforming, motile,
facultative anaerobe, and the causes a disease called listeriosis. The onset time for serious
listeriosis symptoms may be five weeks, complicating traceback investigations. Severe
listeriosis symptoms may include meningitis, septicemia, and spontaneous miscarriage or still
birth following early influenza-like symptoms including nausea, vomiting, persistent fever, and
diarrhea. Newborns, immunocompromised people, elderly, and pregnant are the high risk
population of listeriosis. Listeria monocytogenes is a critical public health concern due to the 20-
30% mortality rate (Ramaswamy et al., 2007). Each year an estimated 500 deaths out of 2,500

21
infections are linked to Listeria in the U.S., making it the leading cause of death due to
foodborne bacterial pathogens (CDC, 2000).
Various changes in social patters with complex interaction have resulted in the
emergence of listeriosis as an important public health concern (Swaminathan et al., 2007). These
factors include: increase of life expectancy; increase of immunocompromised population due to
AIDS and organ transplantation; centralization and consolidation of food production and
processing; increase of demand for Ready-to- eat, refrigerated, frozen, and short time cooking
foods (Swaminathan et al., 2007).
Within the six Listeria species, (L. monocytogenes, L. inanovii, L. welshimeri, L.
seeligeri,L.murayyi and L. grayi) in the genus Listeria, only L. monocytogenes and L. ivanovii,
are considered pathogenic. An estimated 90% of human L. monocytogenes isolates belong to
serotype 1/2a, 1/2b, and 4b in total of 13 serotypes of L. monocytogenes (Dalgaard, 2006).
Serotype 4b is an epidemic strain that causes sporadic human cases worldwide. The U.S. has a
zero-tolerance policy regarding the detection of L. monocytogenes in foods and beverages.
In 1981, the first confirmed outbreak of Listeria with 41 cases and 8 deaths was
associated with consumption of contaminated coleslaw Nova Scotia, Canada (Montville and
Mathews, 2005). Following this outbreak, investigations demonstrated that the primary
transmission of listeriosis was from the consumption of contaminated food (Swaminathan et al.,
2007).
Listeria monocytogenes can be found in soil, mammalian feces, sewage, water, and
decaying vegetation, and can grow temperature range of 2 to 45°C (Swaminathan et al., 2007).
Also it is a pschrotroph that can multiply at temperatures as low as -0.4°C (Dalgaard, 2006).
Listeria also has the ability to survive in the high salinity conditions, and grow between pH 4.4

22
and 9.6, depending on type of acid and incubation temperature (Swaminathan et al., 2007). These
survival capabilities make L. monocytogenes very durable under extreme environmental
conditions.
Listeria monocytogenes is commonly associated with foods such as ready-to-eat foods,
meat and poultry, milk products (particularly cheese), and seafood. Although L. monocytogenes
has not been implicated in any juice outbreaks it has been reported that acid adaptation causes
Listeria become more resistant to other environmental stresses as a result of cross-protection
(Mazotta, 2001). Listeria monocytogenes survives in white grape juice for 12 days, in apple cider
for 24 days, and in orange juice for 61 days, respectively in different storage temperatures
(Piotrowski, 2003). Acid adapted L. monocytogenes cells grew in orange juice (pH 2.6) stored at
37°C, by almost 104 CFU/mL
in 6 h (Caggia et al., 2007). Also, Parish and Higgins (1989)
demonstrated that population of Listeria cells decreased 106
CFU/mL in orange juice stored at
4°C in 25 days at pH 3.6 and in 43 days at pH 4.0.
Cryptosporidium parvum
Cryptosporidium is a single-celled, protozoan parasite that was first recognized by Ernest
Edward Tyzzeras in the gastric glands of laboratory mice in 1907 (Fayer, 2008). It was not
identified until 1976 when two distinct research groups reported separate cases of
cryptosporidiosis in humans (Nime et al., 1976; Meisel et al, 1976). The taxonomic classification
of Cryptosporidium only became clear in 1990s when studies based on molecular taxonomy
indicated the genus is much more complicated than morphology and host specify can define.
Thirteen Cryptosporidium species are identified, including C. parvum, C. muris, C. felis and C.
wrairi, that infect mammals; C. baileyi and C. meleagridis that infect birds; C. serpentis and C.
saurophilum linked to the infection of reptiles, and C. nasorum tropical fish infections (WHO,

23
2006). The most common human isolate is C. parvum, which has been linked to consumption of
unpasteurized fruit juices.
The symptoms of infection include diarrhea; abdominal cramps, headaches, nausea, and
vomiting. In individuals with weakened immune system, such as immunocompromised people
(AIDS), elderly, and the very young children symptoms can be more severe. Onset of symptoms
takes up to twelve days after consumption of contaminated food or water. Cryptosporidium is
transmitted through the fecal-oral route, beginning with ingestion of the Cryptosporidium
oocycst that survives for a long time in the environmental conditions (Robertson et al., 1992).
History of Fruit Juice Outbreaks
High acid foods, such as fruit juices, with pH 4.6 or below are generally considered as
safe to consume directly by researchers and agencies like Food and Drug Administration (FDA)
(FDA, 2010). The assumption is that while fruit juices provide favorable environments for
spoilage by yeasts, molds and acid tolerant bacteria due to the high water activity and sugar
content; the high acidity would prevent pathogenic bacteria from being a problem. However,
outbreaks associated with the consumption of fruit juice increased in the 1990s (Mazotta, 2001).
In 1991, fresh-pressed apple cider contaminated with E. coli O157:H7 caused four
children in southern Massachusetts to be hospitalized with HUS (Besser et al., 1993). A total of
23 HUS cases were reported. Cattle raised by the cider press operator and grazed in the field
adjacent to the mill were identified as the possible source of contamination resulting in apples
being contaminated with manure from equipment, handling of workers, contaminated water, or
contaminated storage areas. In 1996, the Seattle-King county Department of Public Health
reported an outbreak of E. coli O157:H7 associated with Odwalla brand unpasteurized apple
juice and Odwalla juice mixtures containing apple juice, resulting in a voluntary nationwide

24
recall that ended with 70 cases (14 HUS) and one death due to the use of dropped fruits and the
localization of apple orchard near cattle farm (CDC, 1996).
Since 1990, a number of outbreaks involving salmonellosis have been reported mostly
associated with fresh (unpasteurized) orange juice. An outbreak of Salmonella enteric serotype
Hartford resulted in 62 case patients from 21 states during May and June 1995 because of
unpasteurized locally produced orange juices (Cook et al.1998). An outbreak of Salmonella
Muenchen causing 423 cases and 1 death in Canada was due to consumption of unpasteurized
orange juice, produced by a single producer and distributed widely in the United States and
Canada (CDC, 1999; CCDR, 1999).
A total of 21 juice associated outbreaks – 10 related to apple juice and cider, 8 linked to
orange juice, and 3 caused by other kind of juices – occurred from 1995 through 2005, with 1366
total illnesses (Vojdani et al., 2008). As a result of these outbreaks, the U.S. Food and Drug
Administration published a juice rule (66 FR 6137) in January, 2001, requiring all processors of
100% juice must comply with Hazard Analysis Critical Control Points (HACCP) to achieve 5-
log reduction of pathogenic microorganisms (U.S. FDA, 2001).
This regulation made HACCP mandatory in juice processing and packaging plants. The
potential hazards for juice fall into three categories a) chemical including pesticide residues, food
allergens, toxins and heavy metal contamination; b) Physical including glass and metal
fragments; and c) biological including pathogen microorganisms, such as Salmonella, STEC, and
Cryptosporidium. The US FDA has also declared patulin, a mold toxin, as a potential hazard in
apple juice that must be controlled. The control of these hazards is explained in guidance for
industry regarding juice HACCP hazards and controls published by FDA in March 3, 2004
(FDA, 2004).

25
Prior to the development of a HACCP plan, juice processors must have Good
Manufacturing Practices (GMP) requirements and Sanitation Standard Operating Procedures
(SSOPs) in place as prerequisite programs. If juice is not pasteurized, the U.S. FDA requires a
warning statement to inform consumers about potential food safety risks related to the product
(FDA, 1998) that reads
THIS PRODUCT HAS NOT BEEN PASTEURIZED AND THEREFORE MAY
CONTAIN HARMFUL BACTERIA THAT CAN CAUSE SERIOUS ILLNESS
IN CHILDREN, THE ELDERLY AND PERSONS WITH WEAKENED
IMMUNE SYSTEMS.
Under HACCP, fruit juices must be processed to achieve a 5-log pathogen reduction (21
CFR 120.24) of the “pertinent microorganism”. This is most commonly achieved through a
thermal pasteurization treatment. However, citrus juice processors who produce fresh juice have
an option to apply a cumulative 5-log reduction plan to fruit surfaces. After HACCP has been
made mandatory to juice processors, no outbreak associated with the consumption of pasteurized
juice has occurred.
Orange Juice
Originating in Southeast Asia, orange trees are grown in China, Brazil, U.S., Spain,
Mexico, and Turkey (Orange book, 1998). Approximately 55 million tones of oranges are
produced throughout world annually with 40% of this production processed and consumed as
orange juice. Brazil and Florida in the U.S. represent the highest global orange juice producers
(USDA, 2011). One thousand kilograms of Florida ‘Valencia’ oranges yields on average 553 kg
juice, 413 kg peel, rag, and seeds, 30 kg pulp (Orange book, 1998). Orange juices can be
classified as ready to drink (RTD) orange juices, fortified orange juices, concentrated orange
juices, and RTD orange products which may not be called as orange juice, such as orange
nectars, orange juice drinks, and orange flavor drinks (Orange book, 1998).

26
Orange Juice Process
The process of juice roughly includes four main steps: washing, sorting, extraction, and
pasteurization. The first step of juice production is to wash the harvested fruits. The purpose of
the washing is to reduce microbial population on fruit, eliminate pesticide residues, and remove
the foreign matters such as soil, sand, and mud. Spoiled fruit should be discarded before washing
in order to prevent other fruits from contamination. Washing efficiency is described by the total
number of microorganisms present on fruit surface before and after washing (Dauthy, 1995).
Removal of partially or completely decayed fruit and any foreign substance is the most
significant factor in the preparation of fruit for production of fruit juice. Determination of variety
and maturity of fruits is also part of initial sorting. Sorting can be done automatically or by
hands.
The purpose of extraction process is to separate the liquid phase of fruit from solid
particles. Mainly, two types of extractors manufactured by different companies are common in
citrus processing (Ramaswamy, 2005). The Brown extractor (automatic machinery corporation)
and the rotary press involve cutting the fruit in half and reaming the each half of fruit. The
reaming extraction methods results with separation of white skin lining, segment walls, cell
tissue, piece of skin, and seeds in the juice and these residues must be taken away from juice
(Rutledge, 2001). The John Bean Technologies Corporation (JBT) citrus juice extractors do not
require fruit to be halved prior to extraction, and are used by more than 75% of the world’s citrus
juice processors (Lozano, 2006). The principle of JBT machines depends on squeezing the fruit
through hole from the center of bottom cup shaped set of fingers. After extraction of juice,
pasteurization is applied to obtain safe and more stable final products.

27
Thermal Orange Juice Pasteurization and Alternatives
Pasteurization is the main step of orange juice production that eliminates foodborne
pathogens, and inactivates spoilage microorganisms. Pasteurization also helps to stabilize cloudy
appearance by inactivating enzymes, especially pectin methyl esterase (PME) to prevent cloud
loss. Pasteurization parameters chosen must reduce the number of pertinent microorganism at
least 5-log in accordance with FDA regulations. Pasteurization may also cause unavoidable
changes in of physicochemical, nutritious, and sensory properties of juice (Lee and Coates, 2002;
Moshonas et al., 1993; Moshonas and Shaw, 1995).
Currently, high temperature short time (HTST) pasteurization is used as a heat treatment
for citrus pasteurization. In HTST, the optimal temperature is 76.6–87.7°C with a holding time
between 25 and 30 s (Moyer and Aitken, 1980), and specifically for orange juice, conventional
HTST treatment is 98°C, 21 s (Rivas et al., 2005).
Alternatives to the thermal pasteurization of orange juice include microwave processing,
ohmic heating, stem and hot water treatments, high pressure processing, UV radiation,
electromagnetic fields, ozone, irradiation, chemical treatment, and pulsed field electric.
(NACMCF, 2006). Pulsed electrical field (PEF), high-pressure treatment microwave heating,
and gamma radiation are some of the last developments in juice processing (Kulwant and
Kuldip, 2006). PEF is a commonly studied non-thermal processing technology, based on the use
of an external electric field to destabilize cell membranes by applying high voltage pulses
(generally 20–80 kV/cm) for very short time (μs to ms), producing PEFs between two electrodes
(Cserhalmi, 2006). As a non-thermal pasteurization technique, UV radiation pasteurization is an
FDA approved technique to reduce pertinent microorganism population by 5-log in some juices
(FDA, 2011). This technique also doubles shelf life of refrigerated juice compare to untreated or
unpasteurized juice (Piotrowski, 2003).

28
Acid Adaptation and Thermal Resistance
Acid Adaptation
Foodborne pathogens are exposed to various kinds of stresses in the environments and in
the gastrointestinal system of their hosts. During all steps of food production foodborne
pathogens encounter to different stresses, including pH, temperature, and osmotic stress. To
endure these stressful conditions, pathogens develop protective mechanisms to survive.
Some bacteria species, including E. coli O157:H7, Salmonella spp., and L.
monocytogenes are able to protect themselves from acidic conditions as a result of acid
adaptation. As a result of acid adaptation of E. coli O157:H7, Salmonella spp, and L.
monocytogenes, not only enhanced the survival capability of these pathogens, but also increased
their heat resistance in apple, orange, and white grape juices (Mazzotta, 2001). Acid adaptation
of E. coli O157:H7 increased Decimal reduction times (D- values) in apple cider and orange
juice (Ryu and Beuchat, 1998) and also significantly increased D-values of Salmonella and E.
coli O157:H7 in watermelon and cantaloupe juice (Sharma et al., 2005). Detailed descriptions of
acid adaptation mechanisms employed by these pathogens, especially in stationary phase, are
available.
Factors influencing the acid tolerance response (ATR)
The acid tolerance response (ATR) is one of survival protection mechanisms used by
microorganisms to survive in low pH environments after its induction as a result of growth in
moderately low pH or exposure to mild acidic conditions (Álvarez-Ordóñez et al., 2012). There
are a number of factors influencing the ATR system. The presence of inhibitory and other
chemicals may also affect the development of ATR (Rowbury 1995), as may the type of acid for
E. coli O157:H7 (Beales, 2004).

29
The induction of acid tolerance differs with environmental factors and the physiological
state of the cells. The effectiveness of ATR directly depends on the pH of the adaptation
conditions and the duration of adaptive period (Davis et al., 1996), and is also dependent on the
state of the cell for some organisms. L. monocytogenes achieved greater acid resistance in
stationary phase than in log phase (Davis et al., 1996). Habituation to acidic environments at
different pH ranges affects the increase of acid tolerance differently for L. monocytogenes
(increase at pH 5.0 – 6.0), E. coli O157:H7 (increase at pH 4.0 – 5.5), and S. Typhimurium
(increase at pH 4.0 – 5.0) (Koutsoumanis and Sofos, 2004). Salmonella Typhimurium cells in log
phase may reach their maximum acid tolerance capacities when they are habituated at pH around
5.5, however, in stationary phase lower pH values, around 4.5, are required (Álvarez-Ordóñez et
al.(2012). In the log phase, S. Typhimurium in pH 4.3 for 10 to 20 min developed less effective
acid tolerance than cells in pH 3.3 for 30 to 40 min (Foster, 1993) and log phase cells that were
exposed to different pH values between pH 5.0 and 8.0 for 1 hour before acid challenge varied in
their acid resistance (Kwon and Rickie 1998).
Escherichia coli and Salmonella enteritidis incubated at 42 - 45°C were more acid-
resistant than cells grown at37°C; growth at 20-25°C decreased the acid tolerance beyond that
developed at 37°C (Humprey et al., 1993). Temperature is another factor that influences ATR
development. At 10°C, S. Typhimurium lower acid tolerance developed compare to the acid
tolerance of adapted cells at 25, 37, and 45°C (Álvarez-Ordóñez et al., 2010). Under different
acidic conditions and incubation temperatures between 5 and 35°C, the acid tolerance of L.
monocytogenes increased with increases in temperature (USDA- ERRC, 2003).
The ATR system of bacteria can be induced by exposure to various acids including citric,
acetic, lactic, malic, hydrocholoric, ascorbic (Álvarez-Ordóñez et al. 2009). Gluconic acid

30
(pentahydroxycaproic acid) is a final production of enzyme glucose oxidase in fungi and enzyme
glucose dehyrogenase in bacteria. When glucose is oxidized by one of these enzymes, gluconic
acid is formed after hydrolization step of glucono delta lactone (Ramachandran et al., 2006).
Gluconic acid induces the ATR system as a result of glucose fermentation during bacterial
growth (Buchanan and Edelson, 1996).
The ATR of E. coli
Resistance against low pH can provide a competitive advantage for E. coli O157:H7 in
acidic foods, heat treatment and passing through the stomach of a host. Generally, ATR is
induced by exposing bacteria to moderately low pH (5.5 or lower for E. coli) that promote
expression of acid-shock proteins. Acid shock proteins prevent protein denaturation and refold
proteins that have already been denatured (Diez-Gonzalez and Kuruc, 2009). Several
compounds, including glucose, glutamate, aspartate, FeCl3, KCl, and L-proline can induce
habituation at neutral pH (Rowbury et al., 1989). The mechanisms of acid adaptation of E. coli
O157:H7 has been studied in different types of acidic condition and three ATR systems are
commonly accepted (Foster 2000). These systems include: acid-induced oxidative system, an
acid-induced arginine-dependent system, and a glutamate-dependent system (Lin et al., 1996).
Acid resistance system 1, called oxidative or glucose-repressed system, is one of the
characterized ATR systems in stationary phase. This glucose-repressed system is different from
the other ATR systems as it does not require exogenous amino acids in acid adaptation process.
It does however require the RpoS sigma factor (Ma, 2003). The key regulators of the acid-
induced oxidative system include the alternative sigma factor σs, cyclic AMP (cAMP), and
cAMP receptor protein (CRP) (Castanie-Cornet et al., 1999). RpoS is critical for the gene
expression transition period from log phase to stationary phase, and for survival under acid
stress. However, its role in type 1 ATR is questioned (Richard and Foster, 2003). While the

31
structural components of ATR 1 remain to be completely defined, it is a known component of E.
coli O157:H7 survival capability under acidic conditions at pH values above 3 (Audia et al.,
2001).
Acid resistance system 2, a glutamate-dependent system, occurs during stationary phase,
and acts independent of RpoS. This system includes several proteins that are located in different
part of cells and extracellular glutamate .The system is located at the cell membrane and
glutamate decarboxylase isoenzymes (GadA and Gad B), structural components of this system
that uses intracellular glutamate-aminobutyric acid (GABA), present in the cytoplasm (Hersh et
al., 1996). In glutamate induced system, Glutamate decarboxylase isoenzymes protects cell from
acid stress by consuming one proton then releasing CO2 in acid resistance process. Finally,
glutamate-aminobutyric acid (GABA) is carried out of cell by simultaneous uptake of glutamate.
The last resistance system ATR 3, the arginine dependent system, is similar to ATR 2,
where the decarboxylation of arginine to agmatine and the interchange of arginine and agmatine
form the basic mechanisms of this system. ATR 3 system is induced at low pH numbers under
anaerobic conditions in rich medium. When grown under acidic conditions, E. coli O157:H7
cells have an internal pH between 4 to 5, and the AdiA enzyme, which is one of two enzymes
synthesized by two arginine decarboxylase genes starts to function. AdiA, PLP-dependent
enzyme, is the enzyme that catalyzes the exchange of arginine to agmatine (Foster 2004).
The ATR of Salmonella
In the last two decade, a number of studies, most using S. Typhimurium, have described
Salmonellas ATR mechanisms. While most experiments have focused on the serotype S.
Typhimurium, similar adaptive responses have been reported for other serotypes (Álvarez-
Ordóñez et al., 2012). Salmonella including Agona, Anatum, Gaminara, Mbandaka, Michigan,
Montevideo, Poona, Reading and Saintpaul have all been readily adapted in apple, orange, and

32
tomato juice or broth supplemented with glucose (Yuk and Schneider, 2006; Bacon et al., 2003)
After acid adaptation in apple or tomato juice, cells were the most acid tolerant in simulated
gastric fluid (Yuk and Schneider, 2006).
Salmonella also use three ATR responses to survive in acidic conditions including the
general sigma factor (RpoS) response induced in log or stationary phase, and an arginine
dependent system (Diez-Gonzalez and Kuruc, 2009).
The induction of ATR during the log phase leads to the production of more than 50
proteins, and time to development is generally faster than in stationary phase. It is dependent on
the RpoS system and gene the fur (Hall and Foster, 1996). RpoS is responsible for controlling the
expression of at least 10 acid shock proteins (ASPs; Baik et al., 1996; Lee et al., 1995), while
Fur (Ferric uptake regulation) is a regulatory gene that works as a transcriptional repressor and a
controller of ASPs (Hall and Foster, 1996).
The stationary phase dependent ATR is activated when cells are exposed to low pH for a
long time. The adaptation period is slower during gradual decrease of pH (Diez-Gonzalez and
Kuruc, 2009). In both cases, the ATR is ompR dependent. OmpR (Osmolarity Response
Regulator) is a regulator that is responsible for the control of the expression of acid induced
virulence operon ssrAB and required for the OmpR/EnvZ regulation system (Bang et al., 2002).
In addition to the log and stationary ATR, S. Typhimurium has an arginine dependent
ATR, what includes an arginine decarboxylase (AdiA) and antiporter, that is only activated
under anaerobic conditions (Kim et al., 2002). AdiA consumes the acidic proton by converting
arginine into agmatine in the cytoplasm (Álvarez-Ordóñez et al., 2012).
The ATR of Listeria
Listeria monocytogenes develops one of the most advanced ATR in mildly acidic
conditions (pH 5 -6; Barak et al., 2005). At least four different acid stress response mechanisms

33
can be activated in L. monocytogenes (Becker et al., 1998). The activation of one system only
occurs in log phase, and is induced by low pH (Ferreira et al., 2003). Davis et al. (1996) showed
that maximum acid resistance of Listeria in log phase was observed when the cells were exposed
to pH 5.0 for 1 h prior to challenge at pH 3.0, even though medium levels of protection were
developed by exposure to pH values ranging from 4.0 to 6.0.When L. monocytogenes enters the
stationary phase, the σβ-dependent ATR system develops (Becker et al., 1998). The third system
is a σβ-independent mechanism that may also develop in stationary phase (Becker et al., 1998). A
GAD-based ATR system has also been described (Diez-Gonzalez and Kuruc, 2009) and consists
of three glutamate decarboxylase genes (gadD1, gadD2 and gadD3) similar to that of E. coli
(Cotter et al., 2001).
Thermal Tolerance and Experimental Thermal Treatments
A number of experimental methodologies have been used to conduct thermal tolerance
experiments. The use of a water bath being the most common method to hold the inoculated
medium or food at constant temperature for a give time. An alternative method is the inoculation
of an already heated medium or food on a heating mantle or hot plate stirrer. For liquid food
samples, including fruit juices, three variations on these methods are common. Microcapillary
tubes are a very effective method, and preferred by several researchers (Sharma et al., 2005;
Splittstoesser et al., 1996). In this method, low volumes of inoculated juice in microcapillary
tubes are held in waterbaths for predetermined time intervals, following the set time, tubes are
cooled immedieately on ice. Alternatively, juice can be heated in advance with a heating mantle
priot to inoculation, inoculated with microorganisms, and samples pulled at predetermined time
intervals from th larger inoculated sample(Mazotta, 2001). Finally, a submerged coil heating
apparatus, consisting of a narrow internal diameter (~2.0828 mm) bore stainless steel coil that is
completely submerged in a heat controlled water bath can be used (Enache et al., 2011). This

34
device is the newest technology for thermal tolerance experiments, and is gaining popularity
(Enache et al., 2011).
Thermal tolerance experiments may use either cocktail of multiple strains or single
strains, depending on the purpose of study. The use of single strain allows researchers to see
variability among the strains, and to have more precise conclusions. For example, L.
monocytogenes strains from Brie cheese (Brie-1), a cabbage outbreak (LCDC), a human isolate
from milk related outbreak (Scott A), and another human isolate have significantly different D-
values at 56°C (16.0, 10.4, 7.4, 5.7 min, respectively; Golden et al., 1988); and STEC E. coli
serogroups O26, O45, O103, O111, O121, O145, and O157:H7 have D-values at 56°C ranging
between 2.14 min (O26) 8.37min (O157:H7) in apple juice (Enache et al., 2011). The use of
cocktail of strains mimics what may occur in practice, and as all strains are used at once, these
studies are often much quicker to complete. The use of cocktails also allows insight into the
effect of possible strain interaction on results. However, the most or least resistant strain in a
cocktail may cause misleading result due to masking.
Heat treatments that are used by food processors to eliminate pathogens are often based
on experimental data. Heat resistance of distinct Salmonella serotypes, E. coli and L.
monocytogenes strains have been studied in numerous types of food products and laboratory
media. The thermal tolerance of these pathogens varies depending on the formulation of media
and characteristic of foods including total solids, acidity, and water activity (Doyle and Mazotta,
2000).
Thermal resistance of E. coli
Escherichia coli is one of the most commonly studied microorganisms in thermal
tolerance researches due to its high potential risk of outbreak in different type of foods, high
thermal resistance response, and ease of study. Survival of E. coli O157:H7 isolate 204P is

35
increased by fat presence in ground beef (7%, 10%, and 20% fat), pork sausage (7%, 10%, and
30% fat), chicken and turkey (3% and 11% fat) from D-values at generated at 60°C (Ahmed et
al., 2006). The D-values (min) varied in different meat samples as follows: 0.45-0.47 in beef,
0.37-0.55 in pork sausage, 0.38-0.55 in chicken and 0.55-0.58 in turkey. When heat resistance of
E. coli was tested by using low (3%) and high fat (11%) turkey with mixture of 8% NaCl, 4%
sodium lactate, and 0.5% polyphosphate at 52, 55, 57, and 60°C. the addition of additives
enhanced survival of E. coli (Kotrola and Conner, 1997).
In fruit juices, the D-values provided in literature are primarily for E. coli. The heat
resistance of E. coli O157:H7was not affected by increasing the soluble solid of apple juice from
11.8° to 16.5°Brix; but was altered by the reduction of pH from 4.4 to 3.6 by addition of malic
acid and the addition of sorbic and benzoic acid at 52°C (Splittstoesser et al., 1996). The acid
adaption of stationary phase E. coli O157:H7 increased the thermal inactivation activation time
compared to non-adapted stationary phase cells in apple, orange, and white grape juices, where
D-values at 60°C for acid adapted and non adapted E. coli O157:H7 were 1.5 and 0.8 min in
apple juice, 1.7 and 1.1 min in orange juice, and 1.2 and 0.7 min in white grape juice,
respectively (Mazotta, 2001). Serogroup variability of E. coli can affect the thermal resistance,
where D-values of stationary-phase and acid-adapted cells of E. coli strains from serogroups
O26, O45, O103, O111, O121, O145, and O157:H7 were investigated by using an immersed coil
apparatus at various temperature. At 60C E. coli O157:H7 and O103 showed the highest D-
values, 1.37 and 1.07 min, respectively (Enache et al., 2011).
Thermal resistance of Salmonella
The thermal inactivation parameters of Salmonella may be affected by the type of
experiment, methodology, culture conditions (e.g. acid or none adapted), strains and heating
mechanism. The thermal resistance of Salmonella in whole eggs, egg yolks, and whites has been

36
widely studied under conditions of variable pH, water activity (including salt and sugar
concentrations), age and incubation temperature of Salmonella inoculum, previous heat shock,
storage conditions of eggs, the presence of lactic acid, hydrogen peroxide, EDTA, nisin, and
polyphosphate (Doyle and Mazotta, 2000). Salmonella survives in egg yolk better than in egg
white, and heat resistance differs according to serotype. In milk and dairy products, an increase
in concentration of total solid in milk enhances the heat resistance of Salmonella, where S.
Typhimurium at 55°C have 4.7 min D-value at 10% solids but when the solid content increases
to 42%, the D-value; increased to 18.3 min.
Salmonella Seftenberg is often considered one of the most heat tolerant Salmonella
serotypes. D-values for S. Seftenberg in ground beef at 55, 60 and 65°C were 211.4, 13.2, and
3.4 min, respectively, and are higher than reported D-values for other Salmonella serotypes in
the ground beef and E. coli O157:H7 in the same conditions (Doyle and Mazotta, 2000).
Chocolate, wheat and corn flour, corn-soy milk blends, shellfish, coconuts and pecans, alfalfa
seeds are some of the other foods that heat resistance of Salmonella have been studied.
The number of studies evaluating thermal inactivation of Salmonella in fruit juices is
limited. The acid adaptation of Salmonella increases its thermal resistance in apple, orange and
white grape juice at different temperatures (Mazotta, 2001). D-values of Salmonella in
phosphate-buffered saline (PBS) and apple juice at 55°C are similar at 0.51 and 0.49 min,
respectively (Gabriel and Nakano, 2009).
Thermal resistance of Listeria
Similar to Salmonella, thermal resistance of L. monocytogenes is affected by strain
variability, heating mechanism, previous growth conditions of cells, and other factors, such as
acid and heat shock. The effectiveness of thermal inactivation on L. monocytogenes in meat and
poultry is affected directly by fat content of meat, age of inoculums, heat source, and exposure of

37
the bacteria to acid, heat shock and preservatives (Doyle et al., 2001). When inoculated on fresh
pork, L. monocytogenes have greater D-values at 62°C compare to cells inoculated into three
month old ground pork (Kim et al., 1998). In high fat (30.5%) ground beef, L. monocytogenes
survives better at 57.2 and 62.8°C than cell in low fat (2%) ground beef (Fain et al., 1992). Slow
heating time (1.3°C/min) also leads to increase Listeria survival compared to fast heating
(8°C/min) in ground pork (Kim et al., 1994).
Thermal tolerance studies on L. monocytogenes have been conducted in various kinds of
milk and dairy products including raw milk, sterile milk, whole milk, skim milk, cream, and
butter. Listeria monocytogenes survives better in raw milk than in sterile milk and in skim milk
than in whole milk at temperatures below 63°C (Bradshaw et al., 1995). During cheese
production, the heat tolerance of L .monocytogenes varies by type of cheese and applied
temperatures.
In egg and egg products, Listeria is more thermal resistant than Salmonella serotypes
tested under the same experimental conditions (McKenna et al., 1991; Muriana et al., 1996).
Addition of 10% sodium chlorine or 10% sucrose increased the thermal tolerance of Listeria
(Palumbo et al., 1995). Listeria monocytogenes strain Scott A was more durability to heat than
strain LCDC, and was more heat tolerance at pH 5.6 than at pH 4.6 (Beuchat et al., 1986).
Thermal tolerance of Listeria has also been extensively studied fish and shellfish, vegetables and
other meat products.

38
CHAPTER 3
MATERIAL AND METHODS
Juice
One brand of 100% pure and single-strength pasteurized orange juice without preservatives
and pulp was purchased from a local supermarket (Publix, Winter Haven, FL). The pH of juice
was obtained via Denver model UB-5 pH meter with a combination electrode (Denver
Instrument Inc., Arvada, CO, USA). The soluble solid content of juice was measured by using
The Leica Mark II plus digital refractometer (Buffalo, NY, USA). Juice was filled into 50 mL
conical centrifuge tubes (Becton, Dickinson and Company, Franklin Lakes, NJ, USA)
aseptically, and stored at -20 °C until use. One tube of juice was used for each experimental trial.
Strains Used
All strains used in this study are listed in Table 3-1. Three strains of shiga-toxin producing
Escherichia coli, three serotypes of Salmonella, and three strains of Listeria monocytogenes were
used. All strains are available in Dr. Danyluk’s culture collection. Three shiga-toxin producing
E. coli strains including E. coli O111 (MDD339; clinical isolate from an apple cider outbreak of
2004, New York), E. coli O157:H7 (MDD338; clinical isolate from an apple juice outbreak of
1991, Massachusetts), and E. coli O157:H7 (F4546; clinical isolate from a sprout outbreak of
1997) were obtained from Dr. Danyluk’s culture collection.
The Salmonella serotypes include Typhimurium (ATCC 14028; orange juice outbreak of
1999), Gaminara (CDC H0622); orange juice outbreak of 1995), and Muenchen (MDD30;
orange juice outbreak of 1999).
The three L. monocytogenes strains from Dr. Danyluk’s culture collection include L.
monocytogenes (LCDC 81-861; raw cabbage outbreak of 1981), L. monocytogenes (Scott A;
human milk outbreak of 1983), and L. monocytogenes (v7; milk associated outbreak of 1985).

39
Inoculum Preparation
All strains, stored at -80°C, were converted to working cultures by streaking on non-
selective Tryptic Soy Agar (TSA; Becton, Dickinson and Company, Sparks, MD, USA) plates
for E. coli and Salmonella, and on Brain Heart Infusion (BHI) agar (Becton, Dickinson and
Company, Sparks, MD, USA) plates for L. monocytogenes. Plates were incubated at 37 ± 2°C for
24 ± 2 h.
Inoculum preparation was different for non-adapted and acid adapted cells. For non-
adapted stationary phase inoculum preparation, one isolated colony from each strain of E. coli
O157:H7, and Salmonella were grown in Tryptic Soy Broth (TSB;Becton, Dickinson and
Company) at 37 ± 2°C for 18 h. One isolated colony from each L. monocytogenes strain was
incubated in BHI broth at 37 ± 2°C for 18 h. One loopful of overnight growth was transferred to
a new tube of broth and incubated at 37 ± 2°C for 18 h. For acid adapted stationary phase
inoculum preparation, strains of E. coli and Salmonella were grown in TSB supplemented with
1% glucose (10 g/l), TSBG; Fisher Scientific, Lawn, NJ, USA) at 37 ± 2°C for 18 h as described
by Buchanan and Edelson (1996). For strains of L. monocytogenes, BHI supplemented with 1%
glucose (10 g/l) BHIG was used at 37 ± 2°C for 18 h. One loopful (10µL) of overnight growth
was transferred to a new tube of broth and incubated at 37 ± 2°C for 18 h. The addition of
glucose to the broth induces acid production by the E. coli, Salmonella, and L. monocytogenes
strains, resulting in an acidic environment and the development of acid adaptation.
Following incubation, cells were collected by centrifugation at 3000 x g for 10 min
(Allegra X-12, Beckman Coulter, Fullerton, CA) The supernatant was removed and 10 mL of
0.1% peptone (Becton, Dickinson and Company) water was vortexed with the pellet to wash
cells. Cells were centrifuged and the washing step was repeated. After the cells had been

40
washed three times, the pellets were resuspended in 5 mL orange juice to obtain the desired
concentration of cells (108
– 1010
CFU/mL).
Thermal Treatment of Inoculated Juice
Each strain of STEC, Salmonella, and L. monocytogenes was inoculated into orange juice
as described above. Two sterile microcapillary tubes (1.5–1.8 (ID) 90 mm; Kimble-Kontes,
Vineland, NJ, USA) with one head heat sealed, were each injected with 50 µL of inoculated
orange juice. The aseptic injection was achieved using a sterile 20 gauge 4 inch deflected-point
needle (Popper and Sons, Inc., Hyde Park, NJ, USA), and 1 mL syringe (Luer-Lok Tip, Franklin
Lakes, NJ, USA). The open end of the micro capillary tubes was sealed with a Bunsen burner
flame. To prevent cracking of the tubes from sudden temperature change before thermal
treatment, the microcapillary tubes were held at room temperature for 30 min prior to the
beginning of the experiment.
Inoculated, sealed, microcapillary tubes of each strain were immersed into water baths
(LAUDA Brinkmann, ECO-Line RE120, Germany) at desired temperatures. Two sealed
microcapillary tubes filled with inoculated orange juice were placed in a preheated culture tubes
in water bath during heat treatment. Time and temperature values were chosen according to
preliminary tests. Briefly, to determine each time interval, the time required for a one log
reduction on average was used as reference according to result of preliminary experiments. To
estimate D-values, the inoculated juice was exposed to the selected temperature until an average
five-log reduction was achieved. Last time interval used was determined based on total of five-
log reduction of cells from initial concentration. Total of at least seven time intervals were used.
Three temperatures: 55, 58, and 60°C for Salmonella; 56, 58, and 60°C for E. coli, and L.
monocytogenes were tested. Temperature and time intervals for each strain are available in
Tables 3-2, 3-3, and 3-4. After heat treatment, microcapillary tubes were poured immediately

41
onto ice, and then further cooled and sterilized by immersing 70% ethanol at room temperature
for one minute. Excessive alcohol was removed by rinsing microcapillary tubes in sterile
deionized water at room temperature. Thermally treated and sterilized microcapillary tubes (0.1
mL inoculated juice) were added into 10 mL of sterile 0.1% peptone water in 15 mL conical
centrifuge tubes (Becton, Dickson and Company), resulting in an initial 1:100 dilution.
Microcapillary tubes were crushed using a sterile glass rod, and centrifuge tubes were vortexed
prior to microbiological analysis. Six replicates were used for each time interval at all
temperatures; duplicate samples of each time interval were examined in triplicate.
Microbiological Analysis
Populations of E. coli, Salmonella, and L. monocytogenes in thermally treated juice were
determined by spread plating samples and dilutions (0.1 mL) onto TSA for E. coli and
Salmonella, and BHI agar for L. monocytogenes supplemented. All media was supplemented
with 0.1% sodium pyruvate (Sigma-Aldrich, St Louis, MO, USA; TSAP or BHIP) to enhance the
recovery of injured cells (Knudsen et al., 2001; Yamamoto and Harris, 2001). Plates were
incubated at 37± 2°C for 24 – 48 h depending on strain to achieve full recovery of survived and
injured cells prior to counting. To increase the sensitivity and lower the limit of detection to 2 log
CFU/mL, 1 mL of the initial dilution (10-2
) was spread over 4 plates (0.25 mL/plate).
Statistical Analysis
The number of enumerated pathogens (log CFU/mL) after heat treatment was plotted on
the y-axis versus heating time (min) on the x-axis. Linear regression was used to determine best-
fit lines, and to calculate D-values of each strain by analyzing data with JMP software (Version
9.0.2 SAS® Institute Inc., Cary, NC, USA 2010). z-values (°C) were determined by calculating
inverse slope of regression line from the plot of log D-value versus the temperature for the D-
value. D-values of acid adapted and non-adapted strains at the same temperature were compared

42
statistically (P < 0.05). D-values of E. coli, Salmonella, and L. monocytogenes strains at the same
temperature were compared statistically (P < 0.05) in the same specie group. Mean z-values of
each species were compared statistically by using Analysis of Variance (ANOVA) (P < 0.05). To
find out statistical significances among the D-values, the Analysis of Covariance (ANCOVA - a
combination of ANOVA and linear regression) was used via JMP software (SAS® Institute
Inc.).

43
Table 3-1. Isolates used for thermal processing experiments.
Strain or serotype Strain
designation
Year of
outbreak
Sources
E. coli O157:H7 F4546 1997 Clinical alfalfa sprout outbreak
E. coli O157:H7 MDD338 1991 Clinical apple juice outbreak Massachusetts
E. coli O111 MDD339 2004 Clinical apple cider outbreak New York
S. Typhimurium ATCC 14028 1999 Orange juice outbreak
S. Gaminara CDC HO662 1995 Orange juice outbreak
S. Muenchen MDD30 1999 Orange juice outbreak
L. monocytogenes LCDC 81-861 1981 Raw cabbage outbreak
L. monocytogenes Scott A 1983 Human milk outbreak
L. monocytogenes v7 1985 Milk associated outbreak

44
Table 3-2. Time intervals used in heat treatment experiments of STEC strains to plot regression
lines in determination of D-values.
Temperature (˚C)
56 58 60
Time intervals (min) Non Acid Non Acid Non Acid
T1 0a,b,c
0a,b,c
0a,b,c
0a,b,c
0a,b,c
0a,b,c
T2 1.5a,b,c
1.5a,b,c
1a,b,c
1a,b,c
0.5a,b,c
0.5a,b,c
T3 3a,b,c
3a,b,c
2a,b,c
2a,b,c
1a,b,c
1a,b,c
T4 4.5b 4.5 3
a,b,c 3
a,b,c 1.5
a,b,c 1.5
a,b,c
T5 6a,b,c
6a,b,c
4a,b,c
4a,b,c
2a,b,c
2a,b,c
T6 7.5b 7.5 5
a,b,c 5
a,b,c 2.5
a,b,c 2.5
a,b,c
T7 9a,b,c
9a,b,c
6b 6
b 3.0
a,b,c 3.0
a,b,c
T8 12a,b,c
12a,b,c
7a,c
7a,b,c
3.5a,c
3.5a,c
T9 15a,c
15a,b,c
4a
T10 18c
aTime intervals for E. coli O157:H7 from human feces-sprout outbreak (F4546)
bTime intervals for E. coli O157:H7 from apple juice outbreak Massachusetts (MDD338)
cTime intervals for E. coli O111from apple cider outbreak New York (MDD339)

45
Table 3-3. Time intervals used in heat treatment experiments of serotypes to plot regression lines
in determination of D-values.
Temperature (˚C)
56 58 60
Time intervals (min) Non Acid Non Acid Non Acid
T1 0a,b,c
0a,b,c
0a,b,c
0a,b,c
0a,b,c
0a,b,c
T2 0.5a,b,c
0.5a,b,c
0.17a,b,c
0.17a,b,c
0.17a,b,c
0.17a,b,c
T3 1a,b,c
1a,b,c
0.33a,b,c
0.33a,b,c
0.33a,b,c
0.33a,b,c
T4 1.5a,b,c
1.5a,b,c
0.5a 0.5
a 0.5
a,b,c 0.5
a,b,c
T5 2a,b,c
2a,b,c
0.67a,b,c
0.67a,b,c
0.67a,b,c
0.67a,b,c
T6 2.5a,b,c
2.5a,b,c
1a,b,c
1a,b,c
0.83a,b,c
0.83a,b,c
T7 3b,c
3b,c
1.33b,c
1.33b,c
1a,b,c
1a,b,c
T8 3.5a 3.5
a 1.67
a,b,c 1.67
b,c
T9 4b 4
b,c 2
b,c 2
b,c
T10 5a 5
a
aTime intervals for S. Typhimurium from orange juice outbreak (ATCC 14028)
bTime intervals for S. Gaminara from orange juice outbreak (CDC H0622)
cTime intervals for S. Muenchen from orange juice outbreak (MDD30)
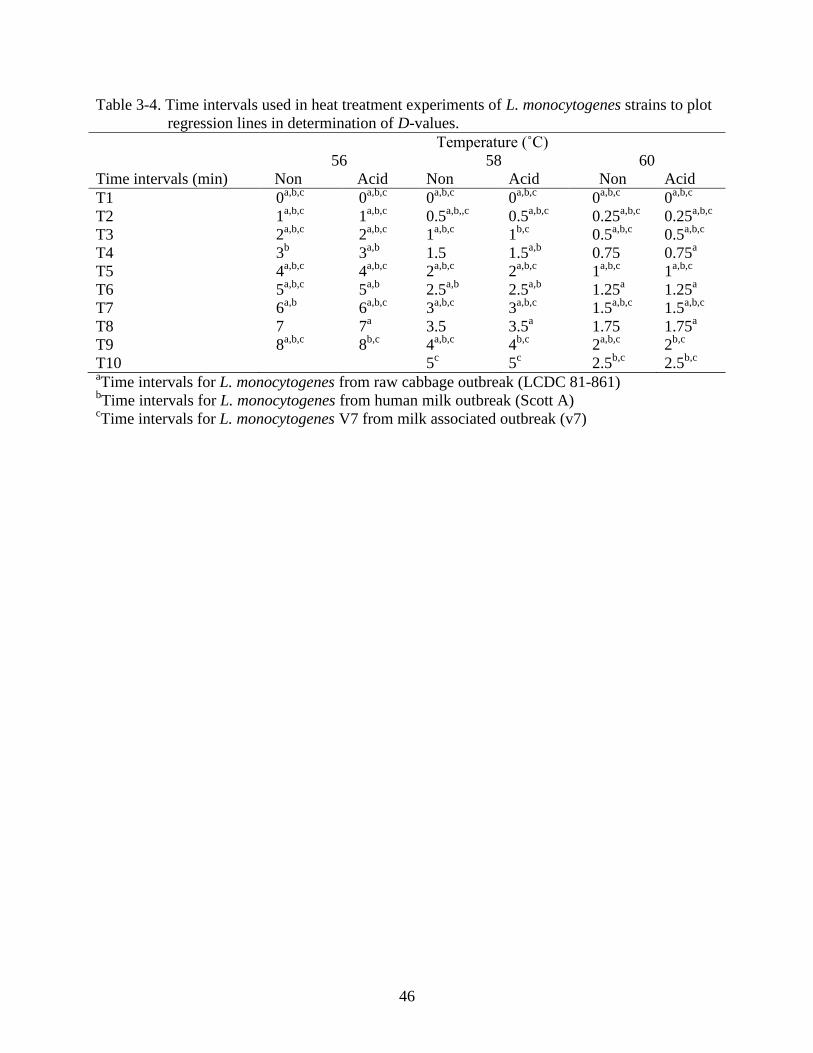
46
Table 3-4. Time intervals used in heat treatment experiments of L. monocytogenes strains to plot
regression lines in determination of D-values.
Temperature (˚C)
56 58 60
Time intervals (min) Non Acid Non Acid Non Acid
T1 0a,b,c
0a,b,c
0a,b,c
0a,b,c
0a,b,c
0a,b,c
T2 1a,b,c
1a,b,c
0.5a,b,,c
0.5a,b,c
0.25a,b,c
0.25a,b,c
T3 2a,b,c
2a,b,c
1a,b,c
1b,c
0.5a,b,c
0.5a,b,c
T4 3b 3
a,b 1.5 1.5
a,b 0.75 0.75
a
T5 4a,b,c
4a,b,c
2a,b,c
2a,b,c
1a,b,c
1a,b,c
T6 5a,b,c
5a,b
2.5a,b
2.5a,b
1.25a 1.25
a
T7 6a,b
6a,b,c
3a,b,c
3a,b,c
1.5a,b,c
1.5a,b,c
T8 7 7a 3.5 3.5
a 1.75 1.75
a
T9 8a,b,c
8b,c
4a,b,c
4b,c
2a,b,c
2b,c
T10 5c 5
c 2.5
b,c 2.5
b,c
aTime intervals for L. monocytogenes from raw cabbage outbreak (LCDC 81-861)
bTime intervals for L. monocytogenes from human milk outbreak (Scott A)
cTime intervals for L. monocytogenes V7 from milk associated outbreak (v7)

47
CHAPTER 4
RESULTS
Time Interval Determination
The most appropriate time intervals for sampling each strain and serotype at a particular
temperature were determined during preliminary thermal death time experiments. Time intervals
used to determine D-values of each strain varied both among the species and the strains or
serotypes of each species. Acid adaptation also influenced the use of different time intervals,
even for the same strain at the same temperature. The maximum applicable time intervals, by
pathogen, were: Salmonella serotypes at 55°C, 5 min; STEC and L. monocytogenes strains at
56°C; 18 and 8 min, and STEC, Salmonella and L. monocytogenes at 58 and 60°C: 7, 5, 2 min
and 4, 2.5, 1 min, respectively.
D and z-value Determination for Strains and Serotypes of Pathogens Used
To estimate D-values of each strain and serotypes of pathogens tested, population of
survived cells (log CFU/mL) from thermal destruction treatment versus time (min) were plotted
to obtain linear curve at desired temperatures. Linear regression lines for both acid adapted and
non-adapted STEC strains were plotted on the same plots to compare regression trends at all
temperatures tested, and shown in Figures 4-1, 4-2, 4-3. Similar plots were prepared for
Salmonella serotypes and L. monocytogenes strains to observe linear curves as shown Figures 4-
4, 4-5, 4-6 and Figures 4-7, 4-8, 4-9, respectively. The equations of these linear regression lines
were used to calculate D-values. All equations of thermal death curves used to calculate D-
values of STEC strains, Salmonella serotypes, and L. monocytogenes strains were listed in
Tables 4-1, 4-2, and 4-3, respectively.
Similar to D-value determination, z-values were calculated by using the linear regression
equations of plots of log D-values versus temperature (°C) for each strain. Linear regression

48
lines of z-values for STEC strains, Salmonella serotypes, and L. monocytogenes strains were
shown in Figures 4-10, 4-11, 4-12, respectively. Also, equations of these linear curves to
calculate z-values were listed in Table 4-4.
D and z-values of STEC Strains
D and z-value of STEC strains grown in TSB and TSBG and heated at 56, 58, and 60°C
were shown in Table 4-5. D-values for acid adapted and non-adapted E. coli O157:H7 (F4546) at
56, 58, and 60°C are 2.81 ± 0.06 and 2.72 ± 0.07 min, 1.35 ± 0.07 and 1.28 ± 0.07 min, and 0.61
± 0.06 and 0.52 ± 0.05 min, respectively. A similar trend was seen for E. coli O111 (MDD339),
where D-values for acid adapted and non-adapted cells at 56, 58, and 60°C are 3.41 ± 0.06 and
3.05 ± 0.06 min, 1.60 ± 0.05 and 1.39 ± 0.04 min, and 0.61 ± 0.05 and 0.54 ± 0.05 min,
respectively. D-values for acid adapted E. coli O157:H7(MDD338) were similar to the other two
STEC strains at 56, 58, and 60°C, and they are 3.21 ± 0.08 and 1.31 ± 0.04 and 0.61 ± 0.08,
respectively. However, D-values for non-adapted strain MDD338, are significantly lower than as
for the other two STEC strains at 56, 58°C (P < 0.05), where D-values for non-adapted form of
this strain at 56, 58, 60°C are 1.93 ± 0.07, 1.04 ± 0.12, and similar to others 0.52 ± 0.13,
respectively. z-values for acid adapted and non-adapted STEC strain F4546, MDD338, and
MDD339 were, 6.0 and 5.6, 5.5 and 7.0, and 5.4 and 5.3, respectively.
Acid adapted STEC have higher D-values than non-adapted cells, at all temperatures for all
strains with the exception of strain F4546 at 56, 58°C (P < 0.05). D-values for E. coli O111 were
higher at 56, 58°C evaluated than those of both E. coli O157:H7 strains (P < 0.05). D-value
differences between acid adapted and non-adapted strain MDD338 cells were greater than in
strain MDD339 and strain F4546 at 56 and 58°C. With the exception of D-values for strain
F4546 at 56 and 58°C, all non-adapted STEC strains have significantly lower heat resistance
compare to acid adapted STEC strains (P < 0.05). Both acid adapted and non-adapted strain E.

49
coli O111 had the highest D-values at all temperatures, where the D-values for acid adapted and
non-adapted strain E. coli O111 at 56, 58, and 60°C are 3.41 ± 0.06 and 3.05 ± 0.06 min, 1.60 ±
0.05 and 1.39 ± 0.04 min, and 0.61 ± 0.05 and 0.54 ± 0.05 min, respectively (Table 4-5).
Although D-values for both acid adapted and non-adapted STEC strains were significantly
different from each other in the same adaptation group at 56 and 58°C (P < 0.05), no difference
exists among strains for both acid adapted and non-adapted groups at 60°C (P > 0.05) in the
same adaptation group. Particularly, D-values for acid adapted STEC strains at 60°C were the
same (0.61 ± 08) (P > 0.05) (Table 4-5).
D-values of Salmonella Serotypes
D and z-values of acid and non-acid adapted Salmonella serotypes, heated at 55, 58, and
60°C were shown in Table 4-6. All Salmonella species demonstrated similar responses to heat at
all temperatures. D-values for acid adapted and non-adapted S. Typhimurium at 55, 58, and 60°C
are 1.03 ± 0.08 and 0.98 ± 0.09 min, 0.28 ± 0.10and 0.30 ± 0.10 min, and 0.17 ± 0.09 and 0.17 ±
0.09 min, respectively. A similar trend was seen for S. Gaminara, where D-values for acid
adapted and non-adapted cells at 55, 58, and 60°C are 0.89 ± 0.06 and 0.80 ± 0.10 min, 0.36 ±
0.09 and 0.36 ± 0.07, and 0.20 ± 0.08 and 0.17 ± 0.017 min, respectively. D-value for acid
adapted S. Muenchen at 55°C temperatures is lower than D-values of S. Typhimurium (P <
0.05), and equal to those D-values of S. Gaminara. However, S. Muenchen had the highest heat
resistance for both acid adapted and non-adapted cells at 58 and 60°C. D-values for acid adapted
and non-adapted S. Muenchen at 55, 58, and 60°C are 0.89 ± 0.09 and 0.80 ± 0.12 min, 0.36 ±
0.09 and 0.36 ± 0.07 min, and 0.20 ± 0.08 and 0.17 ± 0.09 min. z-values for acid adapted and
non-adapted S. Typhimurium, S. Gaminara, and S. Muenchen are 6.3 and 6.5, 7.5 and 7.1, and
6.5 and 6.7, respectively (Table 4-6).

50
With the exception of D-values for acid-adapted and non-adapted S. Muenchen at 60°C (P
< 0.05), there was not a significant difference between D-values for acid adapted and non-
adapted Salmonella serotypes at all temperatures (P > 0.05). D-value differences among
serotypes for both acid adapted and non-adapted groups showed different trends according to
temperature. D-values for both acid and non-adapted S. Typhimurium at 55 and 58°C were
significantly different from D-values for both acid and non-adapted S. Gaminara and S.
Muenchen in the same adaptation group (P > 0.05). However, D-values for both acid and non-
adapted S. Muenchen at 60°C are significantly different from D-values for both acid and non-
adapted S. Typhimurium and S. Muenchen in the same adaptation group (P < 0.05).
D-values of L. monocytogenes Strains
In Table 4-7, D and z-value of L. monocytogenes strains grown in BHI and BHIG and
heated at 56, 58, and 60°C are shown. Non-adapted L. monocytogenes strains always had higher
D-values than acid adapted strains except for strain LCDC 81-861 at 55°C. D-values for acid
adapted and non-adapted L. monocytogenes LCDC 81-861 at 56, 58, and 60°C were 1.34 ± 0.08
and 1.59 ± 0.07 min, 0.92 ± 0.09 and 0.91 ± 0.08 min, and 0.48 ± 0.14 and 0.55 ± 0.06 min,
respectively. A similar trend was seen for other L. monocytogenes strain Scott A, where D-
values for acid adapted and non-adapted cells at 56, 58, and 60°C were 1.73 ± 0.06 and 1.82 ±
0.05 min, 0.99 ± 0.06 and 1.05 ± 0.07 min, and 0.62 ± 0.07 and 0.65 ± 0.06 min, respectively.
Also, D-values for acid adapted and non-adapted L. monocytogenes v7 resembled to other two L.
monocytogenes strains at 56°C, but lower at 58, and 60°C. They were 1.47 ± 0.10 and 1.65 ±
0.07 min, 0.85 ± 0.10 and 0.90 ± 0.09 min, and 0.49 ± 0.08 and 0.52 ± 0.05 min, respectively. z-
values for acid adapted and non-adapted L. monocytogens strain LCDC 81-861, Scott A, and v7
were, 9.0 and 8.7, 9.0 and 8.9, and 8.4 and 8.0, respectively.

51
With the exception of D-values for acid-adapted and non-adapted strain LCDC 81-861 at
56°C (P < 0.05), there was not a significant difference between D-values for acid adapted and
non-adapted L. monocytogenes strains at all temperatures (P > 0.05). D-values for non-adapted
L. monocytogenes strains were significantly different from each other in the same adaptation
group at 56°C; however, only strain D-values of non-adapted strain Scott A had significantly
different D-values at 58 and 60°C in the non adapted strain groups (P < 0.05). For acid-adapted
strain group, different trend was seen. D-values for acid adapted L. monocytogenes strains were
significantly different from each other in the same adaptation group at 56 and 60°C (P < 0.05),
whereas they were not significant at 58°C (P > 0.05).
Heat Resistance of All Pathogens
D-values of STEC strains, Salmonella serotypes, and L. monocytogenes strains were
calculated by using linear regression equations as presented in Tables 4-1, 4-2, and 4-3,
respectively. A total of three STEC strains, three Salmonella serotypes, and three L.
monocytogenes strains were tested to determine the heat resistance of the pathogens in single
strength orange juice (pH 3.87 ± 0.01; Brix° corrected 12.24). Salmonella serotypes were less
heat resistance than STEC and L. monocytogenes strains. All acid adapted and non-adapted
STEC strains had the highest D-values at 56 and 58°C; one of acid adapted and non-adapted L.
monocytogenes strain Scott A was the most heat tolerant strain at 60°C. Acid adaptation caused
change of heat resistance for all STEC strains at all temperatures except for strain F4546 at 55
and 58°C (P < 0.05). However, it had almost no significant effect on Salmonella serotypes and L.
monocytogenes strains except for S. Muenchen at 60°C and L. monocytogenes strain LCDC 81-
861 at 56°C (P > 0.05). An analysis of variance showed that average z-values of three L.
monocytogenes strain are significantly different from average z-values of three STEC strains and
three Salmonella serotypes (P < 0.05) (Table 4-8).

52
A semilogaritmic plot of D-value versus temperature for STEC strains, Salmonella
serotypes and L. monocytogenes strains was used to evaluate the heat resistance of these
pathogens on the same plot (Figure 4-13). The highest D-value for acid-adapted and non-adapted
strains and serotypes were plotted to calculate minimum process time at 71.1°C. A linear
regression line for each acid adapted and non adapted pathogens were obtained. These linear
regression lines were extrapolated to higher temperatures to cover higher processing
temperatures including milk pasteurization temperature (71.1°C). Extrapolated regression lines
from the highest D-value for STEC and L. monocytogenes strains crossed around 59°C. To
determine process parameters that would provided the thermal inactivation of all three
pathogens, a regression line covering all regression lines for all three pathogens was drawn
above all regression lines for strains and serotypes with the highest D-values. The equation of
this cover line (log D = 8.2 – 0.14T (°C)) was used to calculate a general process for orange juice
at 71.1°C. The calculations via this equation yielded that achievement of 5 log reductions of all
three pathogens in orange juice requires 5.29 seconds at 71.1°C with a z-value of 7.1°C
.

53
Table 4-1. Linear regression equations and R2 of STEC strains used in D-value calculations at 56, 58, 60°C. Non adapted pathogens
were grown in TSB and acid adapted pathogens were grown in TSB supplemented with 1% glucose (TSBG) (n = 6).
Linear regression equations of strains and R2 at temperatures
E. coli 56°C 58°C 60°C
Strain Adaptation Equations R2 Equations R
2 Equations R
2
O157:H7
(F4546)
Non
y = -0.3681x + 9.3693 0.95 y = -0.7841x + 9.6966 0.95 y = -1.9080x + 9.8733 0.97
Acid
y = -0.3554x + 9.6283 0.97 y = -0.7392x + 9.7800 0.97 y = -1.6454x + 9.7084 0.95
O157:H7
(MDD338)
Non
y = -0.5187x + 8.9160 0.95 y = -0.9576x + 8.5780 0.88 y = -1.9387x + 8.5726 0.85
Acid
y = -0.3117x + 9.1629 0.94 y = -0.7612x + 9.1664 0.92 y = -1.6411x + 9.0879 0.93
O111
(MDD339)
Non
y = -0.3272x + 9.2080 0.97 y = -0.7216x + 9.3120 0.93 y = -1.8423x + 9.6380 0.97
Acid
y = -0.2930x + 9.2772 0.97 y = -0.6269x + 9.3018 0.92 y = -1.6338x + 9.5688 0.97

54
Table 4-2. Linear regression equations and R2 of Salmonella serotypes used in D-value calculations at 55, 58, 60°C. Non adapted
pathogens were grown in TSB and acid adapted pathogens were grown in TSB supplemented with 1% glucose (TSBG) (n
= 6).
Linear regression equations of strains and R2 at temperatures
Salmonella 55°C 58°C 60°C
Serotype Adaptation Equations R2 Equations R
2 Equations R
2
Typhimurium
(ATCC 14028)
Non
y = -1.0203x + 8.3253 0.91 y = -3.3286x + 8.6029 0.91 y = -5.8235x + 8.8061 0.93
Acid
y = -0.9721x + 8.4866 0.94 y = -3.5334x + 9.0032 0.93 y = -5.8561x + 9.0074 0.93
Gaminara (CDC
H0622)
Non
y = -1.2465x + 8.9191 0.90 y = -3.0724x + 8.8656 0.92 y = -6.9899x + 9.2921 0.94
Acid
y = -1.1263x + 9.0258 0.96 y = -3.1410x + 9.3009 0.97 y = -6.7254x + 9.4836 0.94
Muenchen
(MDD30)
Non
y = -1.2567x + 8.7988 0.87 y = -2.7575x + 8.6942 0.94 y = -5.8555x + 8.8314 0.92
Acid
y = -1.1233x + 9.0139 0.92 y = -2.8116x + 8.8308 0.93 y = -5.0934x + 8.9485 0.93

55
Table 4-3. Linear regression equations and R2 of L. monocytogenes strains used in D-value calculations at 56, 58, 60°C. Non adapted
pathogens were grown in BHI and acid adapted pathogens were grown in BHI supplemented with 1% glucose (BHIG) (n =
6).
Linear regression equations of strains and R2 at temperatures
L. monocytogenes 56°C 58°C 60°C
Strain Adaptation Equations R2 Equations R
2 Equations R
2
LCDC 81-861 Non
y = -0.6276x + 9.3324 0.96 y = -1.0985x + 9.4175 0.94 y = -1.8173x + 9.2424 0.96
Acid
y = -0.7472x + 9.2413 0.93 y = -1.0922x + 9.0574 0.93 y = -2.0636x + 8.8346 0.82
Scott A Non
y = -0.5500x + 9.5018 0.98 y = -0.9529x + 9.4533 0.96 y = -1.5380x + 9.4503 0.96
Acid
y = -0.5790x + 9.3232 0.96 y = -1.0112x + 9.3661 0.96 y = -1.6027x + 9.3616 0.96
v7 Non
y = -0.6061x + 9.4928 0.96 y = -1.1067x + 9.5121 0.92 y = -1.9095x + 9.4006 0.97
Acid
y = -0.6794x + 9.4639 0.92 y = -1.1735x + 9.5026 0.92 y = -2.0601x + 9.5129 0.94

56
Table 4-4. Linear regression equations and R2 of strains used in z-value calculations. Non
adapted STEC strains and Salmonella serotypes were grown in TSB and acid adapted
STEC strains and Salmonella were grown in TSB supplemented with 1% glucose
(TSBG). Non adapted L. monocytogenes strains were grown in BHI and acid adapted
L. monocytogenes strains were grown in BHI supplemented with 1% glucose (BHIG).
Linear regression equations of strains to
estimate z-value
R2 Strain or serotype Adaptation
E. coli O157:H7
(F4546)
Non
y = -0.1796x + 10.505 0.99
Acid
y = -0.1658x + 9.7404 0.99
E. coli O157:H7
(MDD338)
Non
y = -0.1424x + 8.2647 0.99
Acid
y = -0.1803x + 10.593 0.99
E. coli O111
(MDD339)
Non
y = -0.1880x + 11.023 0.99
Acid
y = -0.1869x + 11.012 0.99
S. Typhimurium Non
y = -0.1537x + 8.4280 0.99
(ATCC 14028) Acid
y = -0.1590x + 8.7331 0.98
S. Gaminara Non
y = -0.1400x + 7.6411 0.99
(CDC H0622) Acid
y = -0.1332x + 7.2671 0.99
S. Muenchen Non
y = -0.1486x + 8.1025 0.97
(MDD30) Acid
y = -0.1528x + 8.3717 0.99
L. monocytogenes Non
y = -0.1153x + 6.6519 0.99
LCDC 81-861 Acid
y = -0.1115x + 6.3891 0.98
L. monocytogenes Non
y = -0.1118x + 6.5138 0.99
Scott A Acid
y = -0.1114x + 6.4707 0.99
L. monocytogenes Non
y = -0.1254x + 7.2340 0.99
V7 Acid
y = -0.1193x + 6.8472 1.00

57
Table 4-5. D and z-values of STEC strains from linear regression equations. Non adapted pathogens were grown in TSB and acid
adapted pathogens were grown in TSB supplemented with 1% glucose (TSBG).
*Capital letters in rows indicate significant difference in D-values between acid adapted and non-adapted cells within each temperature
and strain. Lower case letters, within columns, indicate significant difference in D-values (P < 0.05)
STEC
Strain
D-value ± SD (min) at temperatures*
56°C 58°C 60°C z-value (°C)
Adaptation
Non Acid Non Acid Non Acid Non Acid
O157:H7
(F4546) 2.72±0.07Aa 2.81±0.06Aa 1.28±0.07Aa 1.35±0.05Aa 0.52±0.05Aa 0.61±0.06Ba 5.6±0.10 6.0±0.05
O157:H7
(MDD338) 1.93±0.07Ab 3.21±0.08Bb 1.04±0.12Ab 1.31±0.04Bb 0.52±0.13Aa 0.61±0.08Ba 7.0±0.07 5.5±0.09
O111
(MDD339) 3.05±0.06Ac 3.41±0.06Bc 1.39±0.04Ac 1.60±0.05Bc 0.54±0.05Aa 0.61±0.05Ba 5.3±0.11 5.4±0.14

58
Table 4-6. D and z-values of Salmonella serotypes from linear regression equations. Non adapted pathogens were grown in TSB and
acid adapted pathogens were grown in TSB supplemented with 1% glucose (TSBG).
*Capital letters in rows indicate significant difference in D-values between acid adapted and non-adapted cells within each temperature
and serotype. Lower case letters, within columns, indicate significant difference in D-values (P < 0.05)
Salmonella
Serotype
D-value ± SD (min) at temperatures*
55°C 58°C 60°C z-value (°C)
Adaptation
Non Acid Non Acid Non Acid Non Acid
Typhimirium
(ATCC
14028)
0.98±0.09Aa 1.03±0.08Aa 0.30±0.10Aa 0.28±0.10Aa 0.17±0.09Aa 0.17±0.09Aa 6.5±0.17 6.3±0.28
Gaminara
(CDC
H0622)
0.80±0.10Ab 0.89±0.06Ab 0.33±0.09Ab 0.32±0.05Ab 0.14±0.08Ab 0.15±0.08Ab 7.1±0.10 7.5±0.10
Muenchen
(MDD30) 0.80±0.12Ab 0.89±0.09Ab 0.36±0.07Ab 0.36±0.09Ab 0.17±0.09Aa 0.20±0.08Ba 6.7±0.33 6.5±0.21

59
Table 4-7. D and z-values of L. monocytogenes strains from linear regression equations. Non adapted pathogens were grown in BHI
and acid adapted pathogens were grown in BHI supplemented with 1% glucose (BHIG).
D-value ± SD (min) at temperatures*
Listeria
Strain
56°C 58°C 60°C z-value (°C)
Adaptation
Non Acid Non Acid Non Acid Non Acid
LCDC 81-861 1.59±0.07Aa 1.34±0.08Ba 0.91±0.08Aa 0.92±0.09Aa 0.55±0.06Aa 0.48±0.14Aa 8.7±0.06 9.0±0.31
Scott A 1.82±0.05Ab 1.73±0.06Ab 1.05±0.07Ab
0.99±0.06Aa 0.65±0.06Ab 0.62±0.07Ab 8.9±0.10 9.0±0.10
V7 1.65±0.07Ac 1.47±0.10Ac 0.90±0.09Aa 0.85±0.10Aa 0.52±0.05Aa 0.49±0.08Ac 8.0±0.06 8.4±0.01
*Capital letters in rows indicate significant difference in D-values between acid adapted and non-adapted cells within each temperature
and strain. Lower case letters, within columns, indicate significant difference in D-values (P < 0.05)

60
Table 4-8. Average z-values of STEC and L. monocytogenes strains and Salmonella serotypes. .
Non adapted STEC strains and Salmonella serotypes were grown in TSB and acid
adapted STEC strains and Salmonella were grown in TSB supplemented with 1%
glucose (TSBG). Non adapted L. monocytogenes strains were grown in BHI and acid
adapted L. monocytogenes strains were grown in BHI supplemented with 1% glucose
(BHIG)
Species Adaptation Average z-values (°C)
STEC Non
6.0a
Acid
5.6a
Salmonella Non
6.8a
Acid
6.8a
L. monocytogenes Non
8.5b
Acid
8.8b
aWithin the same type of adaptation, z-values with different letter in the same column are
significantly different (P < 0.05)

61
Figure 4-1. Linear regression lines of STEC strain at 56°C to estimate D-value. A) E. coli
O157:H7 from human feces-sprout outbreak (F4546), B) E. coli O157:H7 from apple
juice outbreak Massachusetts (MDD338), C) E. coli from apple cider outbreak New
York O111 (MDD339). (■) Acid adapted, (♦) Non-adapted (n=6).

62
Figure 4-2. Linear regression lines of STEC strains at 58°C to estimate D-value. A) E. coli
O157:H7 from human feces-sprout outbreak (F4546), B) E. coli O157:H7 from apple
juice outbreak Massachusetts (MDD338), C) E. coli from apple cider outbreak New
York O111 (MDD339). (■) Acid adapted, (♦) Non-adapted (n=6).

63
Figure 4-3. Linear regression lines of STEC strains at 60°C to estimate D-value. A) E. coli
O157:H7 from human feces-sprout outbreak (F4546), B) E. coli O157:H7 from apple
juice outbreak Massachusetts (MDD338), C) E. coli from apple cider outbreak New
York O111 (MDD339). (■) Acid adapted, (♦) Non-adapted (n=6).

64
Figure 4-4. Linear regression lines of Salmonella serotypes at 55°C to estimate D-value. A) S.
Typhimurium from orange juice outbreak (ATCC 14028), B) S. Gaminara from
orange juice outbreak (CDC H0662), C) S. Muenchen from orange juice outbreak
(MDD30). (■) Acid adapted, (♦) Non-adapted (n=6).

65
Figure 4-5. Linear regression lines of Salmonella serotypes at 58°C to estimate D-value. A) S.
Typhimurium from orange juice outbreak (ATCC 14028), B) S. Gaminara from
orange juice outbreak (CDC H0662), C) S. Muenchen from orange juice outbreak
(MDD30). (■) Acid adapted, (♦) Non-adapted (n=6).

66
Figure 4-6. Linear regression lines of Salmonella serotypes at 60°C to estimate D-value. A) S.
Typhimurium from orange juice outbreak (ATCC 14028), B) S. Gaminara from
orange juice outbreak (CDC H0662), C) S. Muenchen from orange juice outbreak
(MDD30). (■) Acid adapted, (♦) Non-adapted (n=6).

67
Figure 4-7. Linear regression lines of L. monocytogenes strains at 56°C to estimate D-value. A)
L. monocytogenes from raw cabbage outbreak (LCDC 81-861), B) L. monocytogenes
from human milk outbreak (Scott A), C) L. monocytogenes from milk associated
outbreak (v7). (■) Acid adapted, (♦) Non-adapted (n=6).

68
Figure 4-8. Linear regression lines of L. monocytogenes strains at 58°C to estimate D-value. A)
L. monocytogenes from raw cabbage outbreak (LCDC 81-861), B) L. monocytogenes
from human milk outbreak (Scott A), C) L. monocytogenes from milk associated
outbreak (v7). (■) Acid adapted, (♦) Non-adapted (n=6).

69
Figure 4-9. Linear regression lines of L. monocytogenes strains at 60°C to estimate D-value. A)
L. monocytogenes from raw cabbage outbreak (LCDC 81-861), B) L. monocytogenes
from human milk outbreak (Scott A), C) L. monocytogenes from milk associated
outbreak (v7). (■) Acid adapted, (♦) Non-adapted (n=6).

70
Figure 4-10. Linear regression lines of STEC strains to estimate z-value. A) E. coli O157:H7
from human feces-sprout outbreak (F4546), B) E. coli O157:H7 from apple juice
outbreak Massachusetts (MDD338), C) E. coli from apple cider outbreak New York
O111 (MDD339). (■) Acid adapted, (♦) Non-adapted.

71
Figure 4-11. Linear regression lines of Salmonella serotypes to estimate z-value. A) S.
Typhimurium from orange juice outbreak (ATCC 14028), B) S. Gaminara from
orange juice outbreak (CDC H0662), C) S. Muenchen from orange juice outbreak
(MDD30). (■) Acid adapted, (♦) Non-adapted.

72
Figure 4-12. Linear regression lines of L. monocytogenes strains estimate z-value. A) L.
monocytogenes from raw cabbage outbreak (LCDC 81-861), B) L. monocytogenes
from human milk outbreak (Scott A), C) L. monocytogenes from milk associated
outbreak (v7). (■) Acid adapted, (♦) Non-adapted.
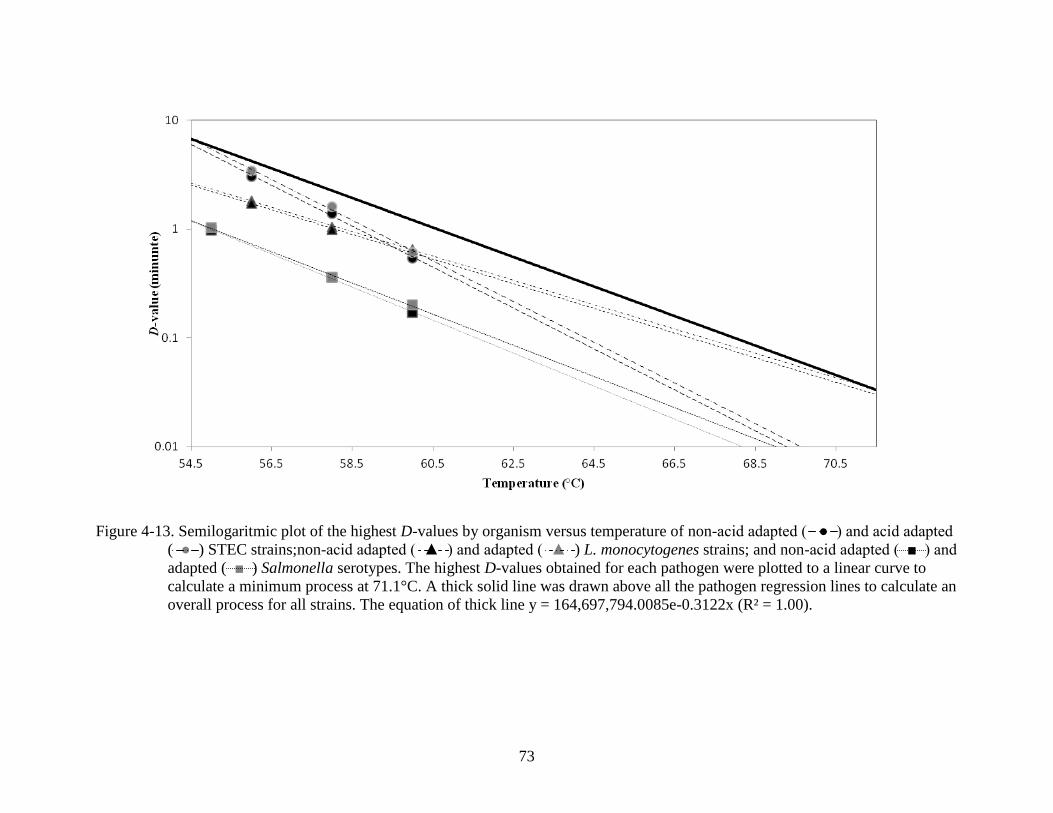
73
Figure 4-13. Semilogaritmic plot of the highest D-values by organism versus temperature of non-acid adapted ( ● ) and acid adapted
( ● ) STEC strains;non-acid adapted ( ▲ ) and adapted ( ▲ ) L. monocytogenes strains; and non-acid adapted ( ■ ) and
adapted ( ■ ) Salmonella serotypes. The highest D-values obtained for each pathogen were plotted to a linear curve to
calculate a minimum process at 71.1°C. A thick solid line was drawn above all the pathogen regression lines to calculate an
overall process for all strains. The equation of thick line y = 164,697,794.0085e-0.3122x (R² = 1.00).

74
CHAPTER 5
DISCUSSION
The microbial safety of fruit juices can be ensured by pasteurization treatment with proper
time and temperature parameters to destroy sufficient levels of pathogens. Current juice
pasteurization parameters describe “pertinent microorganisms” or the most resistant
microorganism of public health significance that is likely to occur in the juice (FDA, 2001). Fruit
juice processors target 5-log reduction of pertinent microorganisms during pasteurization, as
described in the Juice HACCP rule (FDA, 2001). In identification of the pertinent
microorganism, outbreaks of pathogen associated with different types of juice have been
considered. FDA (2001) states that Salmonella species are implicated with outbreaks related to
orange juice, and are considered the “pertinent microorganism” in orange juice, while both
Escherichia coli O157:H7 and Cryptosporidium are considered “pertinent microorganisms” in
apple juice. Recently, when orange juice moves between facilities, and is required under juice
HACCP to be repasteurized, Listeria monocytogenes has been suggested as a reasonable
pertinent microorganism due to its ubiquitous nature. Both E. coli and L. monocytogenes survive
for extended periods of time in orange juice to be able to cause outbreaks (Piotrowski, 2003;
Parish and Higgins, 1989; Oyarzabal et al., 2006). Although not present natural flora of fresh
juice, it is believed that E. coli can be introduced to juice as a consequence of fecal
contamination from reservoirs including cattle, wild birds, deer rodents, goat, sheep, cats, dogs.
(Nielsen et al., 2004). The ubiquitous nature of L. monocytogenes makes it a potential risk for all
juice products. To set conservative pasteurization parameters, thermal death of Salmonella, E.
coli and L. monocytogenes should be considered.
Acid adaptation is generally believed to enhance the thermal tolerance of pathogens in fruit
juices, and has been demonstrated for E. coli O157:H7, Salmonella, and L. monocytogenes in

75
apple, orange and white grape juices (Mazotta, 2001), and E. coli O157:H7 at 52°C in orange
juice and apple cider (Ryu and Beuchat, 1998). Similar to previous studies on strain cocktails
(Mazotta, 2001; Ryu and Beuchat, 1998), acid adaptation significantly increased the heat
resistance of STEC strains MDD338 and MDD339 at all temperatures tested. However, the
thermal resistance of STEC strain F4546 was not significantly increased by acid adaptation at 56
and 58ºC, indicating that there is strain to strain variability in the protective effects of acid
adaptation and that acid adaptation may not increase thermal tolerance of all STEC strains. In
this study, only small, insignificant (P > 0.05), increases in thermal tolerance of Salmonella
resulted from acid adaptation, unlike those previously reported in the literature with the
exception of S. Typhimurium at 55ºC (Mazotta, 2001). In a recent study where the authors used
individual Salmonella serotypes, non-adapted S. Newport and S. Saintpaul had higher thermal
tolerance than acid adapted cells at 56°C in mango and pineapple juice (Yang et al., 2012).
Methodology differences, serotype variability and use of cocktails are likely reasons for different
thermal tolerance results among the studies. L. monocytogenes strains had very different heat
resistance trend following acid adaptation when compared to STEC strains and Salmonella
serotypes. Acid adaptation decreased, but not statistically significantly (P > 0.05), the heat
resistance of L. monocytogenes strains in this study at all temperatures tested, while Mazotta
(2001) reports that acid adaptation led to higher L. monocytogenes heat resistance in orange
juice. Only, acid adapted L. monocytogenes strain LCDC 81-861 has higher D-values than non-
adapted cells at 58ºC. Similar to this study, Sharma et al. (2005) reported that acid adapted E.
coli strains and Salmonella serotypes are more heat resistant, but did not see the same for L.
monocytogenes in watermelon and cantaloupe juice. The differences between the acid adaptation
responses of L. monocytogenes among the studies may be explained by the use of different

76
strains and procedure differences for adaptation. Overall, the most resistant form of bacteria
should be considered as reference in determination of pasteurization parameters.
The D-values reported here are lower than those reported in Mazotta (2001) at all
temperatures, for all species, with the exception of L. monocytogenes at 60ºC. Salmonella were
the most heat sensitive pathogens at all temperatures tested similar to reported in previous studies
(Mak et al., 2001, Mazotta, 2001, Sharma et al., 2005). Here, E. coli O111 was the most heat
resistant pathogen at 56 and 58ºC, while L. monocytogenes strain from human milk outbreak had
the highest D-value at 60ºC. Mazotta (2001) also finds that L. monocytogenes is more heat
resistant than E. coli at higher temperatures, particularly after 65ºC. Enache et al. (2011) report
D-values varied among different E. coli serogroups O26, O45, O103, O111, O121, O145, and
O157 in apple juice, and that E. coli O157:H7 was the most heat resistant. The D-values reported
here for E. coli O157:H7 were also lower than those reported by Enache et al., (2011), however
D-values for strain O111 were similar for both non-adapted and acid adapted cells. Unlike apple
juice, our results indicate that E. coli O111 was more heat resistant than E. coli O157:H7 in
orange juice at all temperatures tested. We also observed that D-values, for all strains in a single
species, varied significantly at lower temperatures, while increasing the temperature reduced the
D-value variability among the strains.
Amongst the three strains/serotypes of STEC, Salmonella and L. monocytogenes we have
tested in orange juice, STEC was the most heat resistant pathogen. However, non-adapted L.
monocytogenes had a higher D-value at 60°C, and the highest z-value among all pathogens
evaluated, indicating that L. monocytogenes have higher thermal tolerance as temperature
increases. This result confirms work by Mazotta (2001) where L. monocytogenes has higher
thermal tolerance than E. coli O157:H7 at typical juice-processing temperatures. Lower D-value

77
differences for L. monocytogenes strains at tested temperatures resulted in high z-values compare
to z-values reported in Mazotta’s (2001) study. Also, higher z-values determined in this study
indicated that larger changes in temperature were required to reduce the treatment time. As L.
monocytogenes can survive at 4°C up to 61 days (Piotrowski, 2003), is ubiquitous, and more heat
resistance than E. coli O157:H7 at higher processing temperatures (Mazotta, 2001), processors
should consider L. monocytogenes in orange juice pasteurization.
Semi logarithmic plot of the highest D-values versus temperature for each pathogen was
plotted as described by Mazotta (2001) to determine orange juice pasteurization parameters. The
highest D-values obtained for both non-adapted and acid adapted cells of each pathogen were
plotted to obtain a linear curve to calculate a minimum process at 71.1°C. To determine process
parameters that would provide the thermal inactivation of all three pathogens, a regression line
covering all regression lines for all three pathogens was drawn above all regression lines for
strains and serotypes with the highest D-values (Figure 4-13 ). The equation of this line (log D =
8.2 – 0.14T (°C)) was used to calculate a general process for orange juice at 71.1°C, indicating
that achievement of 5 log reductions of all three pathogens in orange juice requires 5.29 seconds
at 71.1°C with, a z-value of 7.1°C. Mazotta (2001) indicates that process of 3 s at 71.1°C is
sufficient for fruit juice pasteurization, 2.3 seconds less than our calculated value. In New York,
the recommended pasteurization parameters of apple cider are already 6 s at 71.1ºC for most
varieties of apples (NYSDM, 1998; Mak et al., 2001). The use of cocktail of strains in thermal
destruction experiments might be an explanation for the differences between Mazotta (2001) and
results reported here; as is our use of the O111 serogroup of E. coli. A validation study of apple
cider pasteurization where the authors observed that higher log reductions were observed in two
E. coli O157:H7 strains compare to the other three strains they used in their cocktail demonstrate

78
the masking effect strain cocktails may have while determining pasteurization parameters (Mak
et al., 2001). In this case the authors note that use of the less heat-tolerant strains would not be
appropriate for successful pasteurization of apple cider.
Differences in pasteurization parameters defined here and those produced in previous
studies may be due to a number of reasons. Mazotta (2001) only used E. coli O157:H7 cocktail,
and in this case, acid adapted E. coli O157:H7 was the most heat resistant pathogen in
calculation of the pasteurization parameter. Here, acid adapted E. coli O111 was the most heat
resistant pathogen, increasing the time to achieve a 5 log reduction at 71.1°C by 2.3 seconds. As
only individual strains were used to determine D-values of pathogens in our studies, the possible
masking affect among the strains and serotypes was eliminated. Finally, significant methodology
differences might have affected the results, which may explain the lower D-values we report.
Although our individual D-values were lower than those reported in literature, the calculated
juice pasteurization time at the same temperature is higher. This indicates that proportions of the
D-values at different temperatures within experiments may play more of a role than calculated
D-value numbers in determination of pasteurization parameters.
No outbreaks associated with pasteurized orange juice have occurred since FDA required 5
log reduction of “pertinent microorganism” as a mandatory step in fruit juice process. Current
fruit juice pasteurization parameters recommended by FDA are likely sufficient to produce safe
fruit juices, due to the absence of outbreaks associated with juices being produced under
functioning HACCP (Vojdani et al., 2008). However, we should consider other factors that
directly affect the success of fruit juice pasteurization. Salmonella can survive long enough on
orange peel surface to be a contamination source; Salmonella population on the orange peel
surface declined between 1.5 and 3.0 log CFU/orange after 30 days in any set of post harvest

79
treatment conditions fruit tested (Danyluk et al. 2010). Pao and Davis (2001) indicate that
microbial levels detected in fresh juice are 90–99% lower than microorganism presence on fruit
surface indicating that most contamination on fruit can be eliminated by commercial citrus juice
extraction. It is unlikely possible that fruit juices will be contaminated with more than 5 logs of
foodborne pathogen under good manufacturing practices (GMPs) and standard sanitation
operating procedures (SSOPs). However, we cannot ignore the possibility of worst case scenario.
Valero et al. (2010) states that high initial microbial population level (105
to 106
CFU/mL) in
citrus juice may occur as a consequence of insufficient sanitation, poor hygiene practices,
deteriorated fruits, and poor equipment sanitation to increase the potential risks of level of
foodborne pathogen in juice.

80
CHAPTER 6
CONCLUSIONS AND FUTURE WORKS
FDA (2001) recommends the heat treatment of fruit juices for 3 s at 71.1ºC to achieve 5-
log reduction of viable microorganisms. Based on Mazotta’s study (2001), these parameters are
sufficient to achieve 5-log reductions of pertinent bacterial pathogens in different types of fruit
juices. In this study, we determined that these parameters may not be adequate to kill 99.999% of
the viable pertinent bacterial pathogens in orange juices. Our findings indicate the achievement
of successful 5-log pasteurization under the requirement of FDA can be completed with heat
treatment for 5.29 s at 71.1ºC. This implies that if the population of viable pathogens in orange
juice somehow reaches over 100,000 CFU/mL, an outbreak associated with orange juice may
result under current pasteurization parameters. In practice, orange juice processors pasteurize
their products over recommended pasteurization parameters to avoid any violation of critical
limits and to inactivate pectin methyl esterase; this study is important in validation of
pasteurization parameters for orange juice processors.
D-values reported in this study are lower than those previously reported in literature at all
temperatures (Mazotta, 2001; Sharma et al., 2005; Enache et al., 2011). This may be a result of
methodology differences and the effect of serotype variability in cocktails used by previous
researchers. Although D-values reported in here are lower than those previously reported, the
calculated overall process parameters to achieve a 5-log reduction are higher. We believe that
proportions between the D-values at temperatures tested are more important than calculated D-
values when the purpose of the study is to estimate pasteurization parameters to achieve 5-log
reductions.
The use of individual strains and serotypes provides us a better understanding of thermal
inactivation response differences amongst strains and serotypes. Different strains and serotypes

81
responded to heat treatment similarly, but development of acid adaptation varied strain to strain
even within the same species. We suggest that more strains of E. coli and L. monocytogenes
strains as well as Salmonella serotypes should be studied in orange and other juices types.

82
LIST OF REFERENCES
Ahmed, N.M., Conner, D.E., Huffman, D.L., 1995. Heat-resistance of Escherichia coli O157:H7
in meat and poultry as affected by product composition. Journal of Food Science 60, 606-
610.
Álvarez-Ordóñez, A., Fernández, A., Bernardo, A., López, M., 2009. A comparative study of
thermal and acid inactivation kinetics in fruit juices of Salmonella enterica serovar
Typhimurium and Salmonella enterica serovar Seftenberg grown at acidic conditions.
Foodborne Pathogens and Disease 6, 1147–1155.
Álvarez-Ordóñez, A., Prieto, M., Bernardo, A., Hill, C., López, M., 2012. The acid tolerance
response of Salmonella spp.: An adaptive strategy to survive in stressful environments
prevailing in foods and the host. Food Research International 45, 482-492.
Audia, J.P., Webb, C.C., Foster, J.W., 2001. Breaking through the acid barrier: an orchestrated
response to proton stress by enteric bacteria. International Journal of Medical
Microbiology 291, 97-106.
Bacon, R.T., Sofos, J.N., Kendall, P.A., Belk, K.E., Smith, G.C., 2003. Comparative analysis of
acid resistance between susceptible and multi-antimicrobial-resistant Salmonella strains
cultured under stationary-phase acid tolerance-inducing and noninducing conditions.
Journal of Food Protection 66, 732-740.
Baik, H.S., Bearson, S., Dunbar, S., Foster, J.W., 1996. The acid tolerance response of
Salmonella Typhimurium provides protection against organic acids. Microbiology 142,
3195-3200.
Baker, R.C., Qureshi, R.A., Hotchkiss, J.H., 1986. Effect of an elevated level of carbon dioxide
containing atmosphere on the growth of spoilage and pathogenic bacteria at 2, 7, and 13
C. Poultry Science 65, 729-737.
Bang, I.S., Audia, J.P., Park, Y.K., Foster, J.W., 2002. Autoinduction of the ompR response
regulator by acid shock and control of the Salmonella enterica acid tolerance response.
Molecular Microbiology 44, 1235-1250.
Barak, J.D., Gorski, L., Naraghi-Arani, P., Charkowski, A.O., 2005. Salmonella enterica
virulence genes are required for bacterial attachment to plant tissue. Applied
Environmental Microbiology 71, 5685-5691.
Beales, N., 2004. Adaptation of microorganisms to cold temperatures, weak acid preservatives,
low pH, and osmotic Stress: A Review. Comprehensive Reviews in Food Science and
Food Safety 3, 1-20.
Bean, N.H., Goulding, J.S., Lao, C., Angulo, F.J., 1996. Surveillance for foodborne-disease
outbreaks--United States, 1988-1992. MMWR. CDC surveillance summaries : Morbidity
and mortality weekly report. CDC surveillance summaries / Centers for Disease Control
45, 1-66.

83
Becker, L.A., Cetin, M.S., Hutkins, R.W., Benson, A.K., 1998. Identification of the gene
encoding the alternative sigma factor sigmaB from Listeria monocytogenes and its role in
osmotolerance. Journal of Bacteriology 180, 4547-4554.
Besser, R.E., Lett, S.M., Weber, J.T., Doyle, M.P., Barrett, T.J., Wells, J.G., Griffin, P.M., 1993.
An outbreak of diarrhea and hemolytic uremic syndrome from Escherichia coli O157:H7
in fresh-pressed apple cider. Jama 269, 2217-2220.
Beuchat, L. R., Brackett, R.E., Hao, Y.Y., Conner, D.E., 1986. Growth and thermal inactivation
of Listeria monocytogenes in cabbage and cabbage juice. Canadian. Journal of
Microbiology. 32:791–795.
Bradshaw, J. G., Peeler, J.T., Corwin, J.J., Hunt, J.M., Tierney, J.T., Larkin, E.P., Twedt, R.M.,
1985. Thermal resistance of Listeria monocytogenes in milk. Journal of Food Protection
48, 743–745.
Buchanan, R.L., Edelson, S.G., 1996. Culturing enterohemorrhagic Escherichia coli O157:H7 in
the presence and absence of glucose as a simple means of evaluating the acid tolerance of
stationary-phase cells. Applied Environmental Microbiology 52, 4009–4013.
Caggia, C., Scifò, G.O., Restuccia, C., Randazzo, C.L., 2009. Growth of acid-adapted Listeria
monocytogenes in orange juice and in minimally processed orange slices. Food Control
20, 59-66.
Canada Communicable Disease Report (CCDR), 1999. Outbreak of Salmonella serotype
Muenchen infection in The United States and Canada associated with unpasteurized
orange juice – The British Columbia Experience 25, 19.
Castanie-Cornet, M.P., Penfound, T.A., Smith, D., Elliott, J.F., Foster, J.W., 1999 Control of
acid resistance in Escherichia coli. Journal of Bacteriology 181: 3525–3535.
Centers for Disease Control and Prevention (CDC), 1996. Outbreak of Escherichia coli O157:H7
infections associated with drinking unpasteurized commercial apple juice -- British
Columbia, California, Colorado, and Washington, October 1996. Morbidity and Mortality
Weekly Report 45(44), 975.
Centers for Disease Control and Prevention (CDC), 1999. Outbreak of Salmonella Serotype
Muenchen Infection Associated With Unpasteurized Orange Juice— United States and
Canada, June 1999 Morbidity and Mortality Weekly Report 48, 582-585.
Centers for Disease Control and Prevention (CDC), 2000. Multistate Outbreak of Listeriosis---
United States, 2000. Morbidity and Mortality Weekly Report (MMWR). 49(50), 1129-
1130.
Centers for Disease Control and Prevention (CDC), 2010. Multistate outbreak of human
Salmonella Typhimurium infections associated with aquatic frogs - United States, 2009.
Morbility and Mortality Weekly Report 58, 1433-1436.

84
Centers for Disease Control and Prevention (CDC), 2012. Salmonella outbreaks. Available at:
http:// http://www.cdc.gov/salmonella/outbreaks.html. Accessed 26 June 2012.
Cserhalmi, S., 2006. Non-thermal pasteurization of fruit juice using high voltage pulsed electric
fields. In: Hui, Y.H. (Ed.). Handbook of fruit and fruit processing. Iowa: Blackwell
Publishing. pp. 95-114.
Cook, K.A., Dobbs, T.E., Hlady, G., Wells, J.G., Barrett, T.J., Puhr, N.D., Lancette, G.A.,
Bodager, D.W., Toth, B.L., Genese, C.A., Highsmith, A.K., Pilot, K.E., Finelli, L.,
Swerdlow, D.L., 1998. Outbreaks of Salmonella serotype Hartford infections associated
with unpasteurized orange juice. JAMA 280, 1504.1509.
Cooke, F.J., Threlfall, E.J., Wain, J., 2007. Current trends n the spread and occurrence of human
Salmonellosis: Molecular typing and emerging antibiotic resistance. In: Rhen, M.,
Maskell, D., Mastroeni, P., Threlfall. (Eds.), In: Salmonella molecular biology and
pathogenesis. In:Salmonella: Molecular biology and pathogenesis. U.K. Horizon
Bioscience. pp 1-36.
Cotter, P.D., Gahan, C.G.M., Hill, C., 2001. A glutamate decarboxylase system protects Listeria
monocytogenes in gastric fluid. Molecular Microbiology 40, 465-475.
Dalgaard, P., 2006. Microbiology of land muscle foods. In: Hui, Y.H. (Ed.) Handbook of Food
Science, Technology, and Engineering, Taylor &Francis Group, LLC. Section 53.
Danyluk, M.D., Sood, P., Proano, L., Friedrich, L.M., Etxeberria, E., 2010. Salmonella does not
penetrate citrus peel through natural light labels. Proceeding of the Florida State
Horticulture Society 123, 217–219.
D'Aoust, J., Maurer, J.J., 2007. Salmonella Species. In: Doyle, M.P., Beuchat, L.R. (Eds.), Food
Microbiology: Fundamentals and Frontiers. American Society for Microbiology Press,
Washington, DC, pp. 187-236.
Datamonitor., 2009. Juices in the United States. Available from: www.datamonitor.com.
Dauthy, M.E., 1995. Fruit and vegetable processing. Rome: Food and Agriculture Organization.
Available from: http://www.fao.org/docrep/v5030e/v5030e0i.htm. Accessed 25
September 2010.
Davis, M.J., Coote, P.J., O'Byrne, C.P., 1996. Acid tolerance in Listeria monocytogenes: the
adaptive acid tolerance response (ATR) and growth-phase-dependent acid resistance.
Microbiology 142, 2975-2982.
Diez-Gonzalez, F., Callaway, T.R., Kizoulis, M.G., Russell, J.B., 1998. Grain feeding and the
dissemination of acid-resistant Escherichia coli from cattle. Science 281, 1666-1668.\

85
Diez-Gonzalez, F., Kuruc, J., 2009. Molecular mechanisms of food microbial survival in foods.
In: Jaykus, L.A., Wang, H.H., Schlesinger, L.S. (Eds.), Food-Borne Microbes Shaping
The Host Ecosystem. American Society for Microbiology Press, Washington, DC, pp.
135-160.
Doyle, M.E., Mazotta, A.S., 2000. Review studies of thermal resistance of Salmonellae. Journal
of Food Protection 63:779–795.
Doyle, M.E., Mazotta, A.S., Wang, T., Wiseman, D.W., Scott V.N., 2001. Heat Resistance of
Listeria monocytogenes Journal of Food Protection 64:410–429
Droffner, M.L., Yamamoto, N., 1991. Procedure for isolation of Escherichia, Salmonella, and
Pseudomonas mutants capable of growth at the refractory temperature of 54°C. Journal
of Microbiological Methods 14, 201-206.
Department of Agriculture: Economic Research Service (ERC/USDA), 2010. Food Availability:
Spreadsheets. Washington, D.C.: U.S. Dept. of Agriculture. Available at:
http://www.ers.usda.gov/data/foodconsumption/FoodAvailspreadsheets.htm#fruitju.
Accessed 1 November 2010.
Department of Agriculture: Economic Research Service (ERC/USDA), 2010. Food Availability:
Spreadsheets. Washington, D.C.: U.S. Dept. of Agriculture. Available at:
http://www.ers.usda.gov/Data/FoodConsumption/FoodAvailSpreadsheets.htm#beverage.
Accessed 1 November 2010.
Department of Agriculture: Eastern regional research center (ERRC/USDA), 2003.Pathogen
modelling program (version 7.0). Available at:
http://www.ars.usda.gov/services/docs.htm?docid=6786. Accessed 10 May 2012.
Enache, E., Mathusa, E.C., Elliot, P.H., Black, D.G., Chen, Y., Scott, V.N., Schaffner, D.W.
2011. Thermal resistance parameters for Shiga Toxin–Producing Escherichia coli in
apple juice. Journal of Food Protection 74, 1231–1237.
Fain, A. R., Line, Jr., J. E., Moran, A. B., Martin, L. M., Lechowich, R. V., Carosella, J. M.,
Brown, W. L., 1991. Lethality of heat to Listeria monocytogenes Scott A: D-value and z-
value determinations in ground beef and turkey. Journal of Food Protection 54:756–761
Fayer, R., 2008. Cryptosporidium and Cryptosporidiosis. In: Fayer, R., Xiao, L.(Eds.) The
general biology of Cryptosporidium. CRC Press. Boca Raton, Fla. pp 1-42.
Ferreira, A., Sue, D., O'Byrne, C.P., Boor, K.J., 2003. Role of Listeria monocytogenes sigma(B)
in survival of lethal acidic conditions and in the acquired acid tolerance response.
Applied Environmental Microbiology 69, 2692-2698.
Food and Drug Administration (FDA), 1998. Federal Register Proposed Rules - 63 FR 20449
April 24, 1998 - Hazard Analysis and Critical Control Point (HACCP); Procedures for
the Safe and Sanitary Processing and Importing of Juice; Food Labeling: Warning Notice
Statements; Labeling of Juice Products. Available at:

86
http://www.fda.gov/Food/FoodSafety/HazardAnalysisCriticalControlPointsHACCP/Juice
HACCP/ucm082031.htm. Accessed 3 November 2010.
Food and Drug Administration (FDA), 2001. Federal Register Final Rule – 66 FR 6137, January
19, 2001: Hazard Analysis and Critical Control Point (HACCP); Procedures for the Safe
and Sanitary Processing and Importing of Juice. Available at:
http://www.fda.gov/Food/FoodSafety/HazardAnalysisCriticalControlPointsHACCP/Juice
HACCP/ucm073594.htm . Accessed 29 September 2011.
Food and Drug Administration (FDA), 2004. Guidance for Industry: Juice HACCP Hazards and
Controls Guidance First Edition; Final Guidance. Available at:
http://www.fda.gov/Food/GuidanceComplianceRegulatoryInformation/GuidanceDocume
nts/Juice/ucm072557.htm . Accessed 26 June, 2012.
Food and Drug Administration (FDA), 2009. Guidance for industry: Ingredients declared as
evaporated cane juice; draft guidance. Available at:
http://www.fda.gov/Food/GuidanceComplianceRegulatoryInformation/GuidanceDocume
nts/FoodLabelingNutrition/ucm181491.htm . Accessed 24 April , 2010.
Food and Drug Administration (FDA), 2010. CFR - Code of Federal Regulations Title 21: Sec.
102.33 Beverages that contain fruit or vegetable juice. Available at:
http://www.accessdata.fda.gov/scripts/cdrh/cfdocs/cfcfr/CFRSearch.cfm?CFRPart=102&
showFR=1&subpartNode=21:2.0.1.1.3.2. . Accessed 24 April 2010.
Food and Drug Administration (FDA), 2010. Draft Guidance for Industry: Acidified Foods.
Available at:
http://www.fda.gov/Food/GuidanceComplianceRegulatoryInformation/GuidanceDocume
nts/AcidifiedandLow-AcidCannedFoods/ucm222618.htm. Accessed 26 June 2012.
Food and Drug Administration (FDA), 2011. CFR - Code of Federal Regulations Title 21
Available at:
http://www.accessdata.fda.gov/scripts/cdrh/cfdocs/cfcfr/CFRSearch.cfm?fr=179.39.
Accessed 26 June 2012.
Foster, J.W., 1993. The acid tolerance response of Salmonella Typhimurium involves transient
synthesis of key acid shock proteins. Journal of Bacteriology 175, 1981-1987.
Foster, J.W., 2004. Escherichia coli acid resistance: tales of an amateur acidophile. Nature
Reviews Microbiology 2, 898-907.
Fratamico, P.M., Deng, M.Y., Strobaugh, T.P., Palumbo, S.A., 1997. Construction and
characterization of Escherichia coli O157:H7 strains expressing firefly luciferase and
green fluorescent protein and their use in survival studies. Journal of Food Protection 60,
1167-1173.
Gabriel, A.A., Nakano, H., 2009. Inactivation of Salmonella, E. coli and Listeria monocytogenes
in phosphate-buffered saline and apple juice by ultraviolet and heat treatments. Food
Control 20, 443-446.

87
Gahan, C.G., O'Driscoll, B., Hill, C., 1996. Acid adaptation of Listeria monocytogenes can
enhance survival in acidic foods and during milk fermentation. Applied Environmental
Microbiology 62, 3128-3132.
Golden, D. A., Beuchat, L. R., Brackett, R. E., 1988. Inactivation and injury of Listeria
monocytogenes as affected by heating and freezing. Food Microbiology 5, 17–23.
Goverd, K.A., Beech, F.W., Hobbs, R.P., Shannon, R., 1979. The occurrence and survival of
coliforms and Salmonellas in apple juice and cider. Journal of Applied Microbiology 46,
521-530.
Griffin, P.M., 1998. Epidemiology of Shiga toxin-producing Escherichia coli infections in
humans in the United States. In: Kaper, J.B., O'Brien, A.D., (Eds). Escherichia coli
O157:H7 and other Shiga toxin-producing E. coli strains. American Society for
Microbiology Press, Washington, DC. pp. 15-22.
The Orange Book, 1998. The orange book. Tetra Pak Processing Systems AB, Lund, Sweden.
pp. 1-39.
Hall, H.K., Foster, J.W., 1996. The role of fur in the acid tolerance response of Salmonella
Typhimurium is physiologically and genetically separable from its role in iron acquisition.
Journal of Bacteriology 178, 5683-5691.
Harris, L.J., Farber, J.N., Beuchat, L.R., Parish, M.E., Suslow, T.V., Garrett, E.H., Busta, F.F.,
2003. Outbreaks Associated with Fresh Produce: Incidence, Growth, and Survival of
Pathogens in Fresh and Fresh-Cut Produce. Comprehensive Reviews in Food Science and
Food Safety 2, 78-141.
Hersh, B.M., Farooq, F.T., Barstad, D.N., Blankenhorn, D.L., Slonczewski, J.L., 1996. A
glutamate-dependent acid resistance gene in Escherichia coli. Journal of Bacteriology
178, 3978-3981.
Hsin-Yi, C., Chou, C.C., 2001. Acid adaptation and temperature effect on the survival of E. coli
O157:H7 in acidic fruit juice and lactic fermented milk product. International Journal of
Food Microbiology 70, 189-195.
Humphrey, T.J., Richardson, N.P., Statton, K.M., Rowbury, R.J., 1993. Effects of temperature
shift on acid and heat tolerance in Salmonella enteritidis phage type 4. Applied
Environmental Microbiology 59, 3120-3122.
Hurd, S., Phan, Q., Hadler, J., Mackenzie, B., Lance-Parker, S., Blake, P., Deasy, M., Rankin, J.,
Frye, D., Lee, I., Werner, B., Vugia, D., Bidol, S., Stoltman, G., Boulton, M., Widemann,
M., Kornstein, L., Reddy, S., Mojica, B., Guido, F., Huang, A., Vincent, C., Bugenhagen,
A., Corby, J., Carloni, E., Holcomb, M. 2000. Multistate outbreak of listeriosis - United
States, 2000. Morbidity and Mortality Weekly Report (MMWR) 49, 1129-1130.

88
International Commission on Microbiological Specifications for Foods (ICMSF), 1996.
Microorganisms in food 5: Characteristics of microbial pathogens. London: Co-
published by James & James Ltd and Chapman &Hall. pp. 217-264.
Karch, H., Tarr, P.I., Bielaszewska, M., 2005. Enterohaemorrhagic Escherichia coli in human
medicine. International Journal of Medical Microbiology 295, 405-418.
Kim, K. T., Murano, E.A., Olson, D.G., 1994. Heating and storage conditions affect survival and
recovery of Listeria monocytogenes in ground pork. Journal of Food Science 59:30–32,
39.
Kim, J., Schmidt, K.A., Phebus, R.K., Jeon, I.J., 1998. Time and temperature of stretching as
critical control points for Listeria monocytogenes during production of mozzarella
cheese. Journal of Food Protection 61:116–118.
Kim, K.S., Rao, N.N., Fraley, C.D., Kornberg, A., 2002. Inorganic polyphosphate is essential for
long-term survival and virulence factors in Shigella and Salmonella spp. Proceeding of
the National Academy of Sciences of the United States of America 99, 7675-7680.
Kotrola, J.S., Conner, D.E., 1997. Heat inactivation of Escherichia coli O157:H7 in turkey meat
as affected by sodium chloride, sodium lactate, polyphosphate, and fat content. Journal of
Food Protection 60, 898-902.
Koutsoumanis, K.P., Sofos, J.N., 2004. Comparative acid stress response of Listeria
monocytogenes, Escherichia coli O157:H7 and Salmonella Typhimurium after
habituation at different pH conditions. Letters in Applied Microbiology 38, 321-326.
Kwon, Y. M., Ricke, S. C., 1998. Induction of acid resistance of Salmonella Typhimurium by
exposure to short-chain fatty acids. Applied and Environmental Microbiology 64, 3458–
3463.
Kulwant, S.S., Kuldip, S.M., 2006. Oranges and citrus juices. In: Hui, Y.H. (Ed.) Handbook of
fruit and fruit processing. Iowa: Blackwell Publishing. pp. 309-357.
Larkin, E.P., Litsky, W., Fuller, J.E., 1955. Fecal streptococci in frozen foods. III. Effect of
freezing storage on Escherichia coli, Streptococcus faecalis, and Streptococcus
liquefaciens inoculated into orange concentrate. Applied Microbiology 3, 104-106.
Lee, H.S., Coates, A.G., 2002. Effect of thermal pasteurization on Valencia orange juice color
and pigments. Lebensmittel-Wissenschaft & Technologie 36, 153–156.
Lee, I.S., Lin, J., Hall, H.K., Bearson, B., Foster, J.W., 1995. The stationary-phase sigma factor
sigma S (RpoS) is required for a sustained acid tolerance response in virulent Salmonella
Typhimurium. Molecular Microbiology 17, 155-167.
Leyer, G.J., Johnson, E.A., 1992. Acid adaptation promotes survival of Salmonella spp. in
cheese. Applied Environmental Microbiology 58, 2075-2080.

89
Lin, J., Smith, M.P., Chapin, K.C., Baik, H.S., Bennett, G.N., Foster, J.W., 1996. Mechanisms of
acid resistance in enterohemorrhagic Escherichia coli. Applied Environmental
Microbiology 62, 3094-3100.
Lozano, J.E. 2006. Fruit manufacturing: scientific basis, engineering properties, and
deteriorative reactions of technological importance. New York: Springer
Science+Business media, LLC. pp. 30.
Ma, Z.,Gong, S., Richard, H., Tucker, D.L., Conway, T., Foster, J.W., 2003. GadE (YhiE)
activates glutamate decarboxylasedependent acid resistance in Escherichia coli K-12.
Molecular Microbiology 49(5), 1309–1320.
MacGregor, S.J., Farish, O., 2000. Inactivation of pathogenic and spoilage microorganisms in a
test liquid using pulsed electric fields. IEEE Transactions on Plasma Science 28, 144-
149.
Mak, P.P., Ingham, B.H., Ingham, S.C., 2001. Validation of apple cider pasteurization treatments
against Escherichia coli O157:H7, Salmonella, and Listeria monocytogenes. Journal of
Food Protection 64, 1679–1689.
Mazzotta, A.S., 2001. Thermal inactivation of stationary-phase and acid-adapted Escherichia
coli O157:H7, Salmonella, and Listeria monocytogenes in fruit juices. Journal of Food
Protection 64, 315-320.
McKenna, R. T., Patel, S.V., Cirigliano, M.C., 1991. Thermal resistance of Listeria
monocytogenes in raw liquid egg yolk. Journal of Food Protection 54:816.
Meisel, J.L., Perera, D.R., Meligro, C., Rubin, C.E., 1976. Overwhelming watery diarrhea
associated with a Cryptosporidium in an immunosuppressed patient. Gastroenterology 70,
1156-1160.
Meng, J., Doyle, M. P., Zhao, T., Zhao, S., 2007. Enterohemorrhagic Escherichia coli. In: Doyle,
M.P., Beuchat, L.R. (Eds.), Food Microbiology: Fundamentals and Frontiers. American
Society for Microbiology Press, Washington, DC, pp. 249-270.
Miller, L.G., Kaspar, C.W., 1994. Escherichia coli O157:H7 Acid tolerance and survival in apple
cider. Journal of Food Protection 57, 460-464.
Montville, T.J., Mathews, K.R., 2005. Food Microbiology: An Introduction. American Society
for Microbiology Press, Washington, DC, pp. 173-187.
Moody, V., 2003. Thermal inactivation of Escherichia coli and Alicyclobacillus acidoterrestris
in orange juice. PhD thesis, University of Florida, Gainesville, FL.
Moshonas, M.G., Shaw, P.E., Buslig, B.S., 1993. Retention of fresh orange juice flavor and
aroma in an aqueous distillate from Valencia orange juice. Journal of Food Quality 16,
101–108.

90
Moshonas, M.G., Shaw, P.E., 1995. A research note flavor and chemical comparison of
pasteurized and fresh Valencia orange juices. Journal of Food Quality 20, 31–40.
Moyer, J.C., Aitken, H.C., 1980. Apple juice. In: Nelson, P.E., Tressler, D.K. (Eds.), Fruit and
Vegetable Juice Processing Technology. AVI Publishing Corporation, Westport, CT, pp.
212–267.
Muriana, P. M., Hou, H., Singh, R.K., 1996. A flow-injection system for studying heat
inactivation of Listeria monocytogenes and Salmonella enteritidis in liquid whole egg.
Journal of Food Protection 59, 121–126.
National Advisory Committee on Microbiological Criteria for Foods (NACMCF), 2006.
Requisite scientific parameters for establishing the equivalence of alternative methods of
pasteurization. Journal of Food Protection 69, 1190-1216.
New York State Department of Agriculture & Markets (NYSDM), 1998. Apple cider
pasteurization equipment recommendations Division of Food Safety and Inspection,
Albany, New York.
Ngadi, M.O., Yu, L., Amiali, M., Ortega-Rivas, E., 2010. Food quality and safety issues during
pulsed electric field processing. In: Ortega-Rivas, E. (Ed.), Processing Effects on Safety
and Quality of Foods. CRC Press. Boca Raton, Fla. pp 441-472.
Nielsen, E.M., Skov, M.N., Madsen, J.J., Lodal, J., Jespersen, J.B., Baggesen, D.L., 2004.
Verocytotoxin-producing Escherichia coli in wild birds and rodents in close proximity to
farms. Applied Environmental Microbiology 70, 6944-6947.
Nime, F.A., Burek, J.D., Page, D.L., Holscher, M.A., Yardley, J.H., 1976. Acute enterocolitis in
a human being infected with the protozoan Cryptosporidium. Gastroenterology 70, 592-
598.
O'Brien, A.D., Tesh, V.L., Donohue-Rolfe, A., Jackson, M.P., Olsnes, S., Sandvig, K., Lindberg,
A.A., Keusch, G.T., 1992. Shiga toxin: biochemistry, genetics, mode of action, and role
in pathogenesis. Current Topics in Microbiology and Immunology 180, 65-94.
Orskov, F., Orskov, I., 1992. Escherichia coli serotyping and disease in man and animals.
Canadian Journal of Microbiology 38, 699-704.
Oyarzabal, O.A., Nogueira, M.C., Gombas, D.E., 2003. Survival of Escherichia coli O157:H7,
Listeria monocytogenes, and Salmonella in juice concentrates. Journal of Food Protection
66, 1595-1598.
Palumbo, M. S., Beers, S.M., Bhaduri, S., Palumbo, S.A., 1995. Thermal resistance of
Salmonella spp. and Listeria monocytogenes in liquid egg yolk and egg yolk products.
Journal of Food Protection 58, 960–966.

91
Pao, S., Davis, C.L., 2001. Research Note: Transfer of natural and artificially inoculated
microorganisms from orange fruit to fresh juice during extraction. LWT - Food Science
and Technology 34, 113-117.
Parish, M.E., Higgins, D.P., 1989. Survival of Listeria monocytogenes in low pH model broth
systems. Journal of Food Protection 52(3), 144-147.
Parish, M.E., Narciso, J.A., Friedrich, L.M., 1997. Survival of Salmonella in Orange Juice1.
Journal of Food Safety 17, 273-281.
Piotrowski, C.L., 2003. Survival of Listeria Monocytogenes in fruit juices during refrigerated
and temperature-abusive storage. Master Thesis, Virginia Polytechnic Institute and State
University Blacksburg, VA.
Popoff, M.Y., Bockemühl, J., Gheesling, L.L., 2003. Supplement 2001 (no. 45) to the
Kauffmann–White scheme. Research in Microbiology 154, 173-174.
Ramachandran, S. Fontanille, P., Pandey, A., Larroche, C., 2006. Gluconic acid: properties,
applications and microbial production. Food Technology and Biotechnology, 44 185–
195.
Ramaswamy, H., 2005. Thermal processing of fruits. In: Barret, D.M., Somogyi, L.,
Ramaswamy, H. (Eds.) Processing fruits: science and technology. CRC Press Boca
Raton, Fla.
Ramaswamy, V., Cresence, V.M., Rejitha, J.S., Lekshmi, M.U., Dharsana, K.S., Prasad, S.P.,
Vijila, H.M., 2007. Listeria--review of epidemiology and pathogenesis. Journal of
Microbiology Immunology and Infection 40, 4-13.
Rice, D.H., Hancock, D.D., Besser, T.E., 1995. Verotoxigenic E. coli O157 colonisation of wild
deer and range cattle. Veterinary Record. 11;137(20), 524.
Richard, H.T., Foster, J.W., 2003. Acid resistance in Escherichia coli. In: advances in applied
microbiology. Academic Press, CA.pp. 167-186.
Riley, L.W., Remis, R.S., Helgerson, S.D., McGee, H.B., Wells, J.G., Davis, B.R., Hebert, R.J.,
Olcott, E.S., Johnson, L.M., Hargrett, N.T., Blake, P.A., Cohen, M.L., 1983.
Hemorrhagic colitis associated with a rare Escherichia coli serotype. The New England
journal of medicine 308, 681-685.
Rivas, A., Rodrigo, D., Martınez, A., Barbosa-Ca´novas, G.V., Rodrigo, M., 2006. Effect of PEF
and heat pasteurization on the physical–chemical characteristics of blended orange and
carrot juice. LWT–Food Science and Technology 39, 1163–1170.
Robertson, L. J., A. T. Campbell, and H. V. Smith., 1992. Survival of Cryptosporidium
parvum oocysts under various environmental pressures. Applied Environmental
Microbiology 58, 3494-3500.

92
Rovia, J., Cencic, A., Santos, E., Jokobsen, M., 2006. Types of biological hazard. In: safety in
the agri-food chain. In: Luning, P.A., Devlieghere, F., Verhe, R. (Eds.), Wageningen
Academic Publishers, The Netherlands pp 67-136.
Rowbury, R.J., Goodson, M., Whitting, G.C., 1989. Habituation of Escherichia coli to acid and
alkaline pH and its relevance for bacterial survival in chemically polluted waters.
Chemical Industry 1989, 685-686.
Rowbury, R.J., 1995. An assessment of environmental factors influencing acid tolerance and
sensitivity in Escherichia coli, Salmonella spp. and other enterobacteria. Letters in
Applied Microbiology 20, 333-337.
Rutledge, P., 2001. Production of nonfermented fruit products. In: Arthey, D., Ashurst, P.R.,
(Eds.) Fruit processing: nutrition, product, and quality management. Maryland: Aspen
Publishers, Inc. pp. 89.
Ryu, J.H., Beuchat, L.R., 1998. Influence of acid tolerance responses on survival, growth, and
thermal cross-protection of Escherichia coli O157:H7 in acidified media and fruit juices.
International Journal of Food Microbiology 45, 185-193.
Sado, P.N., Jinneman, K.C., Husby, G.J., Sorg, S.M., Omiecinski, C.J., 1998. Identification of
Listeria monocytogenes from unpasteurized apple juice using rapid test kits. Journal of
Food Protection 61, 1199-1202.
Sharma, M., Adler, B.B., Harrison, M.D., Beuchat, L.R., 2005. Thermal tolerance of acid-
adapted and unadapted Salmonella, Escherichia coli O157H7, and Listeria
monocytogenes in cantaloupe juice and watermelon juice. Letters in Applied
Microbiology 41, 448–453.
Singh, M., Mullins, H.R., Simpson, S.M., Dickson, J.S., 2008. Effect of acid adaptation on
thermal tolerance of Escherichia Coli O157:H7 and Salmonella enterica in meat serum.
Journal of Food Safety 30, 111–123.
Splittstoesser, D.F., McLellan, M.R., Churey, J.J., 1996. Heat Resistance of Escherichia coli
O157:H7 in Apple Juice. Journal of Food Protection 59, 226-229.
Swaminathan, B., Cabanes, D., Zhang, W., Cossart, P., 2007. Listeria monocytogenes. In: Doyle,
M.P., Beuchat, L.R. (Eds.), Food Microbiology: Fundamentals and Frontiers. American
Society for Microbiology Press, Washington, DC, pp. 457-492.
Wang, A.Y., Cronan, J.E., Jr., 1994. The growth phase-dependent synthesis of cyclopropane
fatty acids in Escherichia coli is the result of an RpoS(KatF)-dependent promoter plus
enzyme instability. Molecular Microbiology 11, 1009-1017.
Ward, T.J., Gorski, L., Borucki, M.K., Mandrell, R.E., Hutchins, J., Pupedis, K., 2004.
Intraspecific phylogeny and lineage group identification based on the prfA virulence gene
cluster of Listeria monocytogenes. Journal of Bacteriology 186, 4994-5002.

93
Winfield, M.D., Groisman, E.A., 2003. Role of nonhost environments in the lifestyles of
Salmonella and Escherichia coli. Applied Environmental Microbiology 69, 3687-3694.
World Health Orgamisation (WHO). 2006. WHO Guidelines for drinking water quality
Cryptosporidium..
United States Department of Agriculture (USDA). 2011. Citrus: World markets and trades.
Available at:http://www.fas.usda.gov/htp/2011_jan_citrus.Pdf. Accessed 10 July 2012.
Valero, M., Micol, V., Saura, D., Munoz, N. Lorente, J., Marti, N., 2010. Comparison of
antimicrobial treatments for citrus juices. In: Hemming David, (Ed.). Plant Science
reviews 2010, S R Nova Pvt Ltd, Bangalore, India. pp. 63-74.
Vojdani, J.D., Beuchat, L.R., Tauxe, R.V., 2008. Juice-associated outbreaks of human illness in
the United States, 1995 through 2005. Journal of Food Protection 71(2):356-64.
Yaun, B., 2003. Efficacy of ultraviolet treatments for the inhibition of pathogens on the surface
of fresh fruits and vegetables. Master Thesis, Virginia Polytechnic Institute and State
University Blacksburg, VA.
Yuk, H.G., Schneider, K.R., 2006. Adaptation of Salmonella spp. in juice stored under
refrigerated and room temperature enhances acid resistance to simulated gastric fluid.
Food Microbiology 23, 694-700.

94
BIOGRAPHICAL SKETCH
Zeynal Topalcengiz is a master graduate research assistant seeking for master degree at
Citrus Research and Education Center, off-campus experiment station in University of Florida’s
Food Science and Human Nutrition department. His main project consists of the estimation of
thermal death parameters (D-value and z-value) of acid adapted and non-adapted stationary
phase Shiga toxin-producing Escherichia coli (STEC), Salmonella spp., and Listeria
monocytogenes in fruit juices. Zeynal was raised in Mersin, Turkey. After he graduated with a
bachelor degree in food engineering from the Department of Food Engineering of Inonu
University in Turkey, he worked in two main sectors of food industry; dairy, catering. He has
been honored with several scholarships, including his current scholarship for master degree by
the Republic of Turkey the Ministry of National Education. In the near future, Zeynal will pursue
his PhD. in food microbiology, particularly, in the field of food safety