thermal gasification or direct combustion? a
TRANSCRIPT
THERMAL GASIFICATION OR DIRECT COMBUSTION?
A TECHNICAL ASSESSMENT OF ENERGY GENERATION IN
INDONESIAN SUGAR FACTORIES
By
Ranjit Deshmukh
A Thesis
Presented to
The Faculty of Humboldt State University
In Partial Fulfillment
Of the Requirements for the Degree
Master of Science
In Environmental Systems:
Energy, Environment, and Society Option
December, 2008
THERMAL GASIFICATION OR DIRECT COMBUSTION?
A TECHNICAL ASSESSMENT OF ENERGY GENERATION IN
INDONESIAN SUGAR FACTORIES
By
Ranjit Deshmukh
Approved by the Master's Thesis Committee:
Dr. Arne Jacobson, Major Professor Date
Dr. Charles Chamberlin, Committee Member Date
Dr. Steven Hackett, Committee Member Date
Dr. Christopher Dugaw, Graduate Coordinator Date
Dr. Chris A. Hopper, Dean for Research and Graduate Studies Date
iii
ABSTRACT
THERMAL GASIFICATION OR DIRECT COMBUSTION?
A TECHNICAL ASSESSMENT OF ENERGY GENERATION IN
INDONESIAN SUGAR FACTORIES
Ranjit Deshmukh
In this study, I compare different cogeneration system scenarios for efficient
energy generation in an Indonesian sugar and ethanol factory. These scenarios include the
use of condensing-extraction steam turbines, variable speed electric drives for sugar
processing equipment, measures to reduce the low pressure steam demand for sugar and
ethanol processing, and two advanced cogeneration systems. The advanced cogeneration
systems considered are an 80 bar high pressure direct combustion steam Rankine cycle
(advanced SRC) system and a biomass integrated gasifier combined cycle (BIGCC)
system. Using steady-state thermodynamic models, I estimate a maximum net electricity
generation potential of 180 kWh/tc for the BIGCC system. This is 38 percent greater than
the electricity generation potential of 130 kWh/tc for the advanced SRC system. The net
electricity generation potentials of the BIGCC and advanced SRC systems are
approximately eight and six times the potential of the existing factory, respectively.
Although the BIGCC system has a greater electricity generation potential than the
advanced SRC system, it needs a 50 percent higher minimum bagasse feed rate to satisfy
the factory low pressure steam demand for sugar and ethanol processing, which may
affect its ability to provide steam and electricity during the off-season. For the Indonesian

iv
sugar factory, the annual revenue potential of the BIGCC system is US$15 million per
year, approximately 50 percent higher than the US$10 million per year for the advanced
SRC system, assuming an electricity sale rate of US$45/MWh and Certified Emissions
Reduction carbon credit price of US$13.60. BIGCC technology is in the development
stage, with no commercial systems in operation today. More importantly, to date no large
scale BIGCC system has operated successfully in a commercial sugar factory. Given
these risks, an advanced SRC system may be more suitable for efficient cogeneration at
the Indonesian sugar factory in the near future.

v
ACKNOWLEDGEMENTS
I owe my fabulous life experience in Humboldt to many dear people. First and
foremost, I want to thank Arne, Charles, Peter and Steve for being patient teachers,
amazing mentors, and close friends. They are and always will be an inspiration to me.
I also thank all the people I worked with at the Schatz Energy Research Center.
Greg and Jim have been great friends and mentors. I owe a great deal to big Joe, Mark,
Marc, Scottie and Ray for getting the gasifier running.
I would like to thank the Indonesian Sugar Group Companies for sponsoring my
research. I owe Enio Troiani for the many insights and knowledge I gained about
thermodynamics of energy systems and sugar factories. I would like to acknowledge Dr.
Dan Kammen for leading the Berkeley-Humboldt team as well as Anand and Tyler for
their contributions to the Indonesian gasification project.
I must thank my many friends that made me feel at home in Humboldt and
contributed significantly to my learning experience. Juliette’s bio-waste to energy
(someday she will beat me in ping pong), Colin’s wind prophecy (he’s graduating to
fatherhood), Kristen’s LED lighting, Karma’s micro-hydro, Alex’s piggy digesters, Peter
and Andrea’s H2 research projects, have all been inspirational. All, except for “graduate”
Karma, are close to finishing their theses and I wish them luck. I want to give a shout out
to Mary, Marty and the Moonies who have been so loving and fun to hang out.
Finally, I have immense gratitude for my parents who made me what I am, and
my dear grandfather who has been a role model.

vi
TABLE OF CONTENTS
ABSTRACT ................................................................................................................. iii
ACKNOWLEDGEMENTS ...........................................................................................v
LIST OF TABLES ....................................................................................................... ix
LIST OF FIGURES .................................................................................................... xii
LIST OF APPENDICES ............................................................................................ xiv
ACRONYMS AND ABBREVIATIONS ....................................................................xv
GLOSSARY .............................................................................................................. xvi
CHAPTER 1. INTRODUCTION ..................................................................................1
1.1 Direct combustion or gasification ........................................................................ 3
1.2 Thesis Outline ...................................................................................................... 6
CHAPTER 2. THE SUGAR AND ETHANOL INDUSTRY .......................................8
2.1 Overview of the Sugar and Ethanol Industry ....................................................... 8
2.2 Sugar cane harvesting......................................................................................... 13
2.3 Sugar and Ethanol Processing ............................................................................ 15
2.4 Direct Combustion Steam Rankine Cycle Cogeneration System ...................... 21
2.5 Efficient cogeneration for electricity export ...................................................... 23
CHAPTER 3. BIOMASS INTEGRATED GASIFIER COMBINED CYCLE ...........28
3.1 Thermal Gasification .......................................................................................... 28
3.2 Biomass Integrated Gasifier Combined Cycle ................................................... 31
3.3 Fuel Pretreatment ............................................................................................... 32
3.4 Fuel Feeding Systems for Bagasse ..................................................................... 34
vii
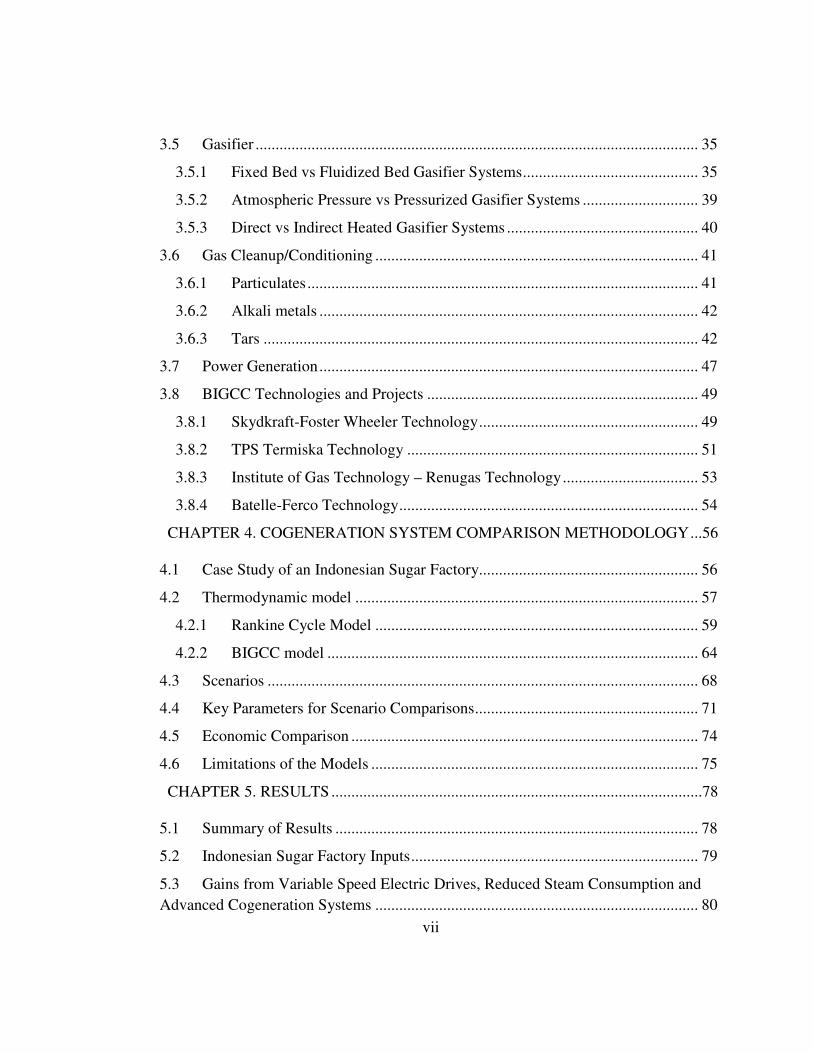
3.5 Gasifier ............................................................................................................... 35
3.5.1 Fixed Bed vs Fluidized Bed Gasifier Systems ............................................ 35
3.5.2 Atmospheric Pressure vs Pressurized Gasifier Systems ............................. 39
3.5.3 Direct vs Indirect Heated Gasifier Systems ................................................ 40
3.6 Gas Cleanup/Conditioning ................................................................................. 41
3.6.1 Particulates .................................................................................................. 41
3.6.2 Alkali metals ............................................................................................... 42
3.6.3 Tars ............................................................................................................. 42
3.7 Power Generation ............................................................................................... 47
3.8 BIGCC Technologies and Projects .................................................................... 49
3.8.1 Skydkraft-Foster Wheeler Technology ....................................................... 49
3.8.2 TPS Termiska Technology ......................................................................... 51
3.8.3 Institute of Gas Technology – Renugas Technology .................................. 53
3.8.4 Batelle-Ferco Technology ........................................................................... 54
CHAPTER 4. COGENERATION SYSTEM COMPARISON METHODOLOGY ...56
4.1 Case Study of an Indonesian Sugar Factory....................................................... 56
4.2 Thermodynamic model ...................................................................................... 57
4.2.1 Rankine Cycle Model ................................................................................. 59
4.2.2 BIGCC model ............................................................................................. 64
4.3 Scenarios ............................................................................................................ 68
4.4 Key Parameters for Scenario Comparisons ........................................................ 71
4.5 Economic Comparison ....................................................................................... 74
4.6 Limitations of the Models .................................................................................. 75
CHAPTER 5. RESULTS .............................................................................................78
5.1 Summary of Results ........................................................................................... 78
5.2 Indonesian Sugar Factory Inputs ........................................................................ 79
5.3 Gains from Variable Speed Electric Drives, Reduced Steam Consumption and
Advanced Cogeneration Systems ................................................................................. 80

viii
5.4 Advanced Cogeneration Scenarios..................................................................... 87
5.5 Energy Balance and Flow .................................................................................. 89
5.6 Gasifier Results .................................................................................................. 92
5.7 Sensitivity Analysis ............................................................................................ 94
5.8 Economic Analysis ........................................................................................... 101
CHAPTER 6. DISCUSSION .....................................................................................106
CHAPTER 7. CONCLUSIONS ................................................................................112
REFERENCES ..........................................................................................................114
APPENDICES ...........................................................................................................119
ix
LIST OF TABLES
Table Page
2.1 Typical ultimate analysis of bagasse (Rodrigues et al., 2007). ............................... 21
2.2 Typical physical characteristics of wet bagasse as it comes out of the juice
extraction system (Rodrigues et al., 2007). ............................................................ 22
3.1 Typical product gas composition from an air gasification process ......................... 30
4.1 Key for schematic of the direct combustion steam Rankine cycle thermodynamic
model for a sugar factory. ....................................................................................... 61
4.2 Key for schematic of the biomass integrated gasifier combined cycle
thermodynamic model for a sugar factory. ............................................................ 66
4.3 Scenarios for comparison between existing Indonesian sugar factory utlizing back-
pressure turbines (BPTs) and grid connected factory scenarios with condensing-
extraction steam turbines (CESTs), variable speed electric drives and reduced
process steam consumption. ................................................................................... 70
5.1 Indonesian sugar factory data for 2007. .................................................................. 80
5.2 Comparison between existing Indonesian sugar factory (back-pressure steam
turbines (BPT) and no grid connection) and grid connected factory scenarios with
condensing-extraction steam turbines (CEST), variable speed electric drives and
reduced process steam consumption, as well as high pressure direct combustion
steam Rankine cycle and biomass integerated gasification combined cycle
(BIGCC) systems. .................................................................................................. 82
5.3 Comparison between high pressure direct combustion steam Rankine cycle and
biomass integrated gasifier combined cycle cogeneration system scenarios. ........ 88
5.4 Electricity and process heat balance for the sugar factory base case scenarios using
biomass integrated gasifier combined cycle and high pressure direct combustion
steam Rankine cycle cogeneration systems. ........................................................... 92
5.5 Input and output parameters for the gasifier and composition of wet product gas
from simulation of the BIGCC cogeneration system scenario. .............................. 93
5.6 Sensitivity analysis results for the direct combustion steam Rankine cycle model.95
5.7 Sensitivity analysis results for the biomass integrated gasifier combined cycle
model. ..................................................................................................................... 95
5.8 Sensitivity of minimum bagasse required to satisfy low pressure steam demand for
sugar and ethanol processing for advanced cogeneration scenarios. ..................... 98

x
Table Page
5.9 Effect of turbine pressure ratio of BIGCC system on net electricity generation and
minimum bagasse required to satisfy process steam requirement of 350 kg/tc. .. 100
5.10 Revenues for sugar factory from the sale of electricity and Certified Emissions
Reductions (carbon credits). ................................................................................. 102
5.11 Sensitivity of revenues to price of Certified Emissions Reductions. .................... 105
5.12 Sensitivity of revenues to wholesale price of electricity. ..................................... 105
A. 1 Input parameters for factory requirements. ........................................................... 119
A. 2 Input parameters for fuel properties. ..................................................................... 121
B. 1 Parameter notations and units. .............................................................................. 123
B. 2 Key for schematic of the direct combustion steam Rankine cycle thermodynamic
model for a sugar factory. ..................................................................................... 125
B. 3 Input parameters for primary pump module. ........................................................ 125
B. 4 Input parameters for boiler module. ...................................................................... 126
B. 5 Input parameters for steam turbines for mechanical drives module. .................... 127
B. 6 Input parameters for steam turbines for power generation module. ..................... 130
B. 7 Input parameters for condenser and condensate pump module. ........................... 132
B. 8 Input parameter for mass and energy balance for steam Rankine cycle model. ... 133
B. 9 Input parameters for boiler feed water module. .................................................... 140
B. 10 Input parameters for energy generation and consumption module for steam Rankine
cycle model. .......................................................................................................... 142
C. 1 Key for schematic of the biomass integrated gasifier combined cycle
thermodynamic model for a sugar factory. .......................................................... 145
C. 2 Input parameters for ambient air module. ............................................................. 146
C. 3 Input parameters for dryer module. ....................................................................... 146
C. 4 Input parameters for fluidizing air compressor module. ....................................... 149
C. 5 Input parameters for gasifier module. ................................................................... 151
C. 6 Input parameter for gas cleanup/conditioning module. ......................................... 153
C. 7 Input parameters for air compressor module for Brayton cycle. ........................... 154
C. 8 Input parameters for product gas compressor module. ......................................... 156
C. 9 Input parameters for gas turbine module of Brayton cycle. .................................. 158
C. 10 Input parameters for primary pump module of bottoming steam Rankine cycle.. 160

xi
Table Page
C. 11 Input parameters for heat recovery steam generator module. .............................. 162
C. 12 Input parameters for bottoming steam Rankine cycle turbines for power generation
module. ................................................................................................................. 163
C. 13 Input parameters for condenser and condensate pump module for bottoming steam
Rankine cycle. ...................................................................................................... 165
C. 14 Input parameter for mass and energy balance for biomass integrated gasifier
combined cycle model. ......................................................................................... 166
C. 15 Input parameters for heat recovery steam generator feed water module. ............ 169
C. 16 Input parameters for energy generation and consumption module for the biomass
integrated gasifier combined cycle model. ........................................................... 171
xii
LIST OF FIGURES
Figure Page
2.1 World map of sugar cane production. ....................................................................... 9
2.2 Sugar cane production in the world’s top twenty sugar cane producing countries for
2007. ....................................................................................................................... 10
2.3 World sugar production forecast in million tons for 2007-08. ............................... 11
2.4 World ethanol production in million liters for 2005 ............................................... 12
2.5 Trends for sugar cane, sugar and ethanol production in Brazil. ............................. 13
2.6 Sugar cane plant. ..................................................................................................... 14
2.7 Sugar and ethanol factory block diagram. .............................................................. 16
2.8 Flow diagram of sugar factory processes................................................................ 18
3.1 Basic schematic for thermal gasification. ............................................................... 28
3.2 Block diagram of a biomass integrated gasification combined cycle cogeneration
system for a sugar factory. ..................................................................................... 32
3.3 Schematic of four different gasifier designs. .......................................................... 37
3.4 Tar removal methods for gasification systems (Han & Kim, 2008). ...................... 44
3.5 The Värnamo biomass integrated gasifier combined cycle plant. .......................... 50
4.1 Schematic of the direct combustion steam Rankine cycle thermodynamic model for
a sugar factory. ....................................................................................................... 60
4.2 Schematic of the biomass integrated gasifier combined cycle thermodynamic
model for a sugar factory. ....................................................................................... 65
5.1 Electricity export potential for the Indonesian sugar factory in implementing
condensing-extraction steam turbines, variable speed electric drives, reduced
process steam consumption, a high pressure direct combustion steam Rankine
cycle and a biomass integrated gasifier combined cycle. ....................................... 86
5.2 Sankey diagram for high pressure direct combustion steam Rankine cycle
cogeneration system. .............................................................................................. 89
5.3 Sankey diagram for biomass integrated gasifier combined cycle cogeneration
system. .................................................................................................................... 89
5.4 Sensitivity of minimum bagasse required to satisfy low pressure steam demand for
sugar and ethanol processing for advanced cogeneration scenarios. ..................... 98
5.5 Effect of pressure and temperature of the heat recovery steam generator on the net
electricity generation and minimum bagasse required for a BIGCC system. ........ 99

xiii
Figure Page
5.6 Effect of turbine pressure ratio of BIGCC system on net electricity generation and
minimum bagasse required to satisfy process steam requirement of 350 kg/tc. .. 101
5.7 Revenues for sugar factory from sale of electricity and certified emissions
reductions. ............................................................................................................ 104
B. 1 Schematic of the direct combustion steam Rankine cycle thermodynamic model
for a sugar factory. ................................................................................................ 124
C. 1 Schematic of the biomass integrated gasifier combined cycle thermodynamic
model for a sugar factory. ..................................................................................... 144
C. 2 Temperature profile in a heat recovery steam generator. ..................................... 162
xiv
LIST OF APPENDICES
Appendix Page
A Derivations for Sugar and Ethanol Factory Inputs, and Bagasse Fuel Properties 119
B Derivations for Mass, Energy and Other Properties for the Direct Combustion
Steam Rankine Cycle Model ................................................................................ 123
C Derivations for Mass, Energy and Other Properties for the Biomass Integrated
Gasifier Combined Cycle Model .......................................................................... 144
D Input Parameters for Direct Combustion Steam Rankine Cycle Model along with
Representative Values from the Literature. .......................................................... 173
E Input Parameters for Biomass Integrated Gasifier Combined Cycle Model along
with Representative Values from the Literature. .................................................. 175
F Sensitivity Analysis for Direct Combustion Steam Rankine Cycle Model .......... 178
G Sensitivity Analysis for Biomass Integrated Gasifier Combined Cycle Model .... 179
H Energy Balance for Direct Combustion Steam Rankine Cycle Model ................. 180
I Energy Balance for Biomass Integrated Gasifier Combined Cycle Model .......... 181

xv
ACRONYMS AND ABBREVIATIONS
BIGCC Biomass Integrated Gasifier Combined Cycle
BPT Back-Pressure Turbine
CDM Clean Development Mechanism
CER Certified Emissions Credit
CEST Condensing-Extraction Steam Turbine
CFB Circulating Fluidized Bed
ER Equivalence Ratio
EUF Energy Utilization Factor
GWh Gigawatt-hour
kW Kilowatt
kWh/tc Kilowatt-hour per ton of cane
HRSG Heat Recovery Steam Generator
kL/y Kilo Liters per Year
LHV Lower Heating Value
MW Megawatt
MWh Megawatt-hour
PHR Power to Heat Ratio
PLN Perusahaan Listrik Negara – Indonesian State Utility
ppbw Parts Per Billion by Weight
ppmw Parts Per Million by Weight
RDF Refuse Derived Fuels
tc/y Ton Cane per Year
SRC Steam Rankine Cycle
xvi
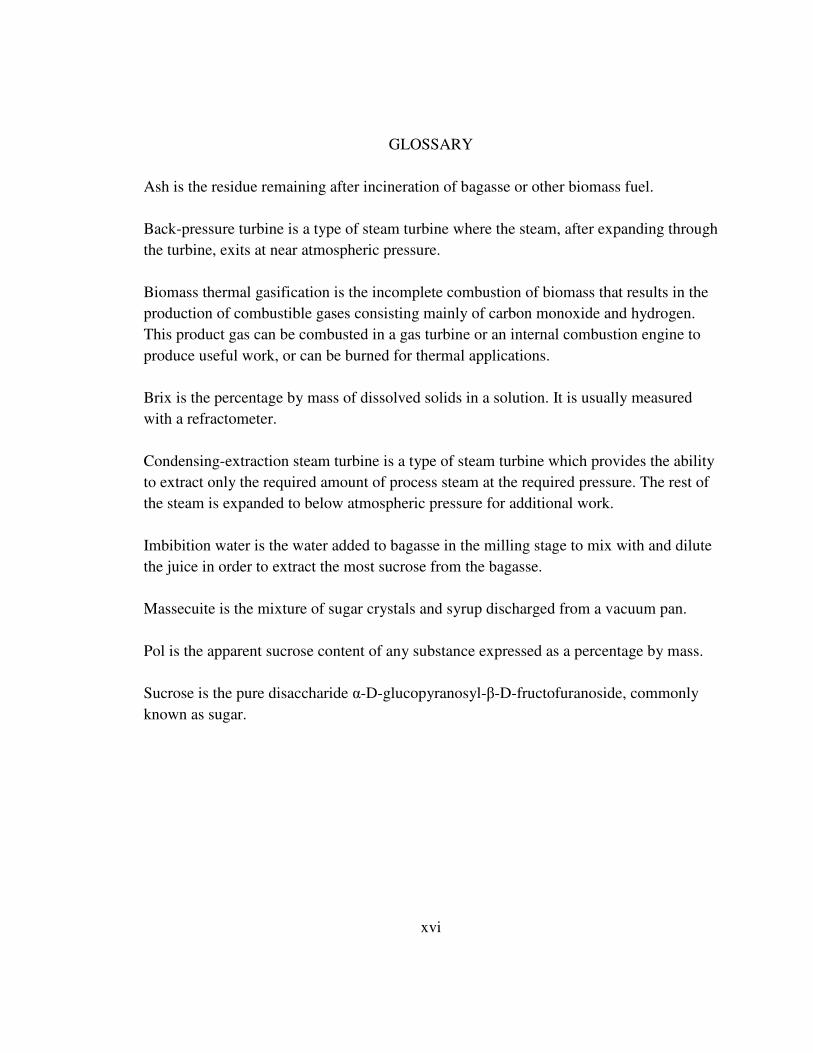
GLOSSARY
Ash is the residue remaining after incineration of bagasse or other biomass fuel.
Back-pressure turbine is a type of steam turbine where the steam, after expanding through
the turbine, exits at near atmospheric pressure.
Biomass thermal gasification is the incomplete combustion of biomass that results in the
production of combustible gases consisting mainly of carbon monoxide and hydrogen.
This product gas can be combusted in a gas turbine or an internal combustion engine to
produce useful work, or can be burned for thermal applications.
Brix is the percentage by mass of dissolved solids in a solution. It is usually measured
with a refractometer.
Condensing-extraction steam turbine is a type of steam turbine which provides the ability
to extract only the required amount of process steam at the required pressure. The rest of
the steam is expanded to below atmospheric pressure for additional work.
Imbibition water is the water added to bagasse in the milling stage to mix with and dilute
the juice in order to extract the most sucrose from the bagasse.
Massecuite is the mixture of sugar crystals and syrup discharged from a vacuum pan.
Pol is the apparent sucrose content of any substance expressed as a percentage by mass.
Sucrose is the pure disaccharide α-D-glucopyranosyl-β-D-fructofuranoside, commonly
known as sugar.

1
CHAPTER 1. INTRODUCTION
The main objective of my study is to compare two advanced cogeneration systems
for the sugar and ethanol industry; a high pressure direct combustion steam Rankine
cycle (SRC) system and a biomass integrated gasifier combined cycle (BIGCC) system.
These systems provide significant opportunities to improve energy conversion
efficiencies and to increase electricity generation in sugar factories.
In 2007, the world sugar and ethanol industry processed 1.56 billion metric tons
of sugar cane (FAO, 2007a). This generated approximately 200 million metric dry tons of
bagasse,1 which serves as the primary fuel for the cogeneration of electricity and steam in
sugar factories. This level of bagasse production corresponds to an electricity generation
potential of 200 GWh at a net efficiency of 20 percent.
The world sugar industry was only able to generate a fraction of this electricity,
however, as most electricity generation equipment in this industry has not been designed
to operate at high efficiencies. Typically, bagasse is generated at a rate that is higher than
what is needed by the industry for its in-house sugar and/or ethanol processing needs.
Historically, sugar factories have been stand-alone units, not connected to the electric
grid. Due to the surplus amount of bagasse, the factories burn bagasse inefficiently in
their boilers, more as a means of disposal than for efficient energy generation (Turn,
1999a). Hence, their co-generation systems have typically been designed to be relatively
1 Bagasse is the fibrous byproduct created when cane juice is separated from sugar cane stalks in factory milling machines. The calculation used to estimate world bagasse production is based on an assumption that the dry bagasse yield rate is equal to 15% of harvested sugar cane on a mass basis.
2
inefficient in order to ensure that little or no bagasse disposal costs are incurred (Larson
et al., 2001).
This historic inefficiency provides an opportunity to do “more with less.” In
recent years a number of factories have explored possibilities to use advanced co-
generation systems that are highly efficient and would enable them to export electricity to
the grid in addition to satisfying their in-house energy demands. Developing countries are
host to three-quarters of the sugar industry in the world (FAO, 2007b). As these countries
continue to grow their economies, this electricity generation potential has become quite
attractive to their energy starved utilities. Additionally, since bagasse is considered a
renewable biomass resource, the electricity generated by the sugar industry is considered
renewable. Bagasse-based electricity exported to the grid is assumed to displace
electricity with a carbon intensity equivalent to the local grid mix. This carbon intensity
depends on the amount of fossil fuel based energy generation for that grid. In light of
global warming, this is an important contribution to mitigating the greenhouse gas
emissions associated with fossil fuel burning.
In installing and operating advanced efficient cogeneration systems and feeding
the surplus electricity to the grid, the sugar cane industry stands to earn revenues through
electricity sales in addition to sugar and ethanol sales. In developing countries, an
3
additional potential for revenue generation is the sale of Certified Emissions Reductions
(CERs) under the Clean Development Mechanism (CDM) of the Kyoto Protocol.2
1.1 Direct combustion or gasification
Today, all sugar factories use the conventional direct combustion steam Rankine
cycle (SRC) for cogeneration. In these cogeneration systems, bagasse is burned in boilers
to generate pressurized steam. This pressurized steam is expanded through power
turbines to generate electricity as well as through mechanical turbines to provide motive
power to sugar processing equipment like cutters, shredders and mills. The near
atmospheric pressure steam exhausted from these turbines is used to provide heat for
sugar and/or ethanol processing. Typically, the “inefficient” cogeneration systems at
sugar factories utilize relatively low pressure (~20-30 bar) boilers and back-pressure
turbines (BPT). In a BPT, the steam, after expanding through the turbine, exits at near
atmospheric pressure. This type of low pressure cogeneration system is sufficient for a
stand-alone sugar factory, but ineffective for a factory looking to export electricity to the
grid.
There are two main types of advanced cogeneration systems that can be
considered in efforts to increase the conversion efficiency for bagasse fuel utilization in
2 The Kyoto Protocol is a protocol to the United Nations Framework Convention on Climate Change (UNFCCC), an international environmental treaty produced at the United Nations Conference on Environment and Development. The treaty is intended to achieve stabilization of greenhouse gas concentrations in the atmosphere at a level that would prevent dangerous anthropogenic interference with the climate system. Official UNFCCC site: www.unfccc.int. A CER is a carbon credit, equal to one metric ton of carbon dioxide equivalent. Under the Clean Development Mechanism of the Kyoto Protocol, an entity in a developing or non-Annex I country has the potential to earn CERs for reducing carbon emissions. These CERs can be sold on the market to entities in a developed or Annex I country, for them to achieve their carbon emissions reduction targets.
4
sugar factories. The first one is the direct combustion high pressure SRC system utilizing
condensing-extraction steam turbines (CESTs). In a CEST, some steam is extracted at the
required pressure for sugar and/or ethanol processing. The rest of the steam is expanded
through the turbine to a pressure that is well below atmospheric in order to extract
additional work. High pressure boilers and turbines are much more efficient than low
pressure systems because higher pressure steam can do more work per unit mass of
steam. These high pressure boilers, operating at pressures up to 100 bar, combined with
CESTs have a much greater electricity generation potential than low pressure
cogeneration systems with BPTs.
The second option is the BIGCC technology, which is promising for cogeneration
in the sugar industry. It has the potential for increased electricity generation efficiency
over the conventional direct combustion SRC technology described above. Biomass
thermal gasification is the incomplete combustion of biomass that results in the
production of combustible gases consisting mainly of carbon monoxide and hydrogen. In
a BIGCC system, these product gases from the gasifier, after being cleaned and filtered,
are fed into a gas turbine to run an electric generator. The surplus heat in the exhaust
gases from the gas turbine is used to generate steam and run a bottoming steam Rankine
cycle for additional electricity generation. In the case of sugar factories, some steam can
be extracted from the CEST for sugar and/or ethanol processing.
Given the tremendous potential of BIGCC systems, it is important to ask whether
sugar factories should install the more established high pressure boiler and turbine
5
systems or think about BIGCC systems that offer the possibility of much larger revenues.
To answer this question, it is important to compare the electricity generation and export
potential of the two systems and their economics. It is also important to understand the
state of BIGCC technology and the risks associated with investments in this technology
given its present development stage.
By some estimates, BIGCC systems have the potential for producing up to twice
as much electricity per unit of biomass consumed and are expected to have lower capital
investment requirements per kW of capacity than conventional SRC systems (Larson et
al., 2001). In this thesis, I use a case study of an Indonesian sugar factory to estimate the
electricity generation potential of the two advanced cogeneration systems using steady
state thermodynamic models. According to the estimates for the base case scenarios of
my models, the net electricity generation potentials of the BIGCC and high pressure
direct combustion SRC systems are approximately eight and six times the potential of the
existing factory, respectively. The BIGCC system has a net electricity generation
potential of 180 kWh/tc, which is 38 percent greater than that of the high pressure direct
combustion SRC system. For the Indonesian sugar factory, the annual revenue potential
from electricity exports and the sale of carbon credits for a BIGCC cogeneration system
is US$15 million per year, approximately 50 percent higher than the US$10 million per
year from an advanced high pressure direct combustion SRC cogeneration system.3
3 Assumption: Electricity sale rate = US$45/MWh, Certified Emissions Reduction price (carbon credits) = US$13.60
6
However, BIGCC is a relatively new technology and is in its development stage.
As I will discuss in Section 3.8, large scale BIGCC systems have been installed only as
demonstration projects and none of them are continuously operating today for various
reasons. Although preliminary studies and pilot scale projects have been initiated to study
the possibility of integrating a BIGCC system into a sugar factory, no large scale bagasse
based BIGCC system has been installed and operated at any sugar factory.
1.2 Thesis Outline
In this thesis, first I present an overview of the world sugar and ethanol industry,
followed by details of sugar and ethanol processing as well as cogeneration systems seen
in the industry today. I then describe the BIGCC cogeneration system and its various
components. I also provide details of four different BIGCC technologies being developed
and the status of their current and past projects. Next, I describe the steady state
thermodynamic models that I developed to simulate mass and energy balances for the
Indonesian sugar factory and the scenarios for the advanced cogeneration systems. The
main criteria for the comparison is the net electricity generation potential of the two
systems and the subsequent export of surplus electricity to the electric grid. I also
compare the minimum amount of bagasse required for each cogeneration option to satisfy
the factory in-house low pressure steam demand for sugar and ethanol processing. In
addition to a technical comparison, I provide an economic comparison based on the gross
revenue potential for the Indonesian sugar factory from the sale of surplus electricity and

7
CERs. I present these results followed by a discussion about the implications of choosing
one of the advanced cogeneration systems for the sugar factory.

8
CHAPTER 2. THE SUGAR AND ETHANOL INDUSTRY
The sugar industry is mainly constituted of sugar manufacturers using sugar cane
and sugar beet as the primary source. The ethanol industry is made up of distilleries
making ethanol mostly from sugar cane and corn. In this thesis, I focus on the sugar cane
based sugar and ethanol industries. Sugar cane is crushed to extract juice, which is then
further processed to make sugar and ethanol. The fiber that is left after crushing is called
bagasse and is the primary energy source for the factory. This bagasse, if used in efficient
cogeneration, can provide surplus renewable electricity for export to the grid. In this
section, I present an overview of the sugar cane based sugar and ethanol industry with a
focus on the potential for efficient bagasse cogeneration as well as its significance to the
developing world. I then describe the workings of a sugar factory and the processes for
making sugar and ethanol. Here, I highlight the high and low pressure steam demand for
the various processes, where applicable. Finally, I describe the direct combustion based
cogeneration technology that is used in sugar factories today.
2.1 Overview of the Sugar and Ethanol Industry
Sugar cane is a tall perennial grass that usually grows in warm temperate and
tropical regions. Figure 2.1 shows the world map of sugar cane production.

9
Figure 2.1: World map of sugar cane production. Image source: British Sugar
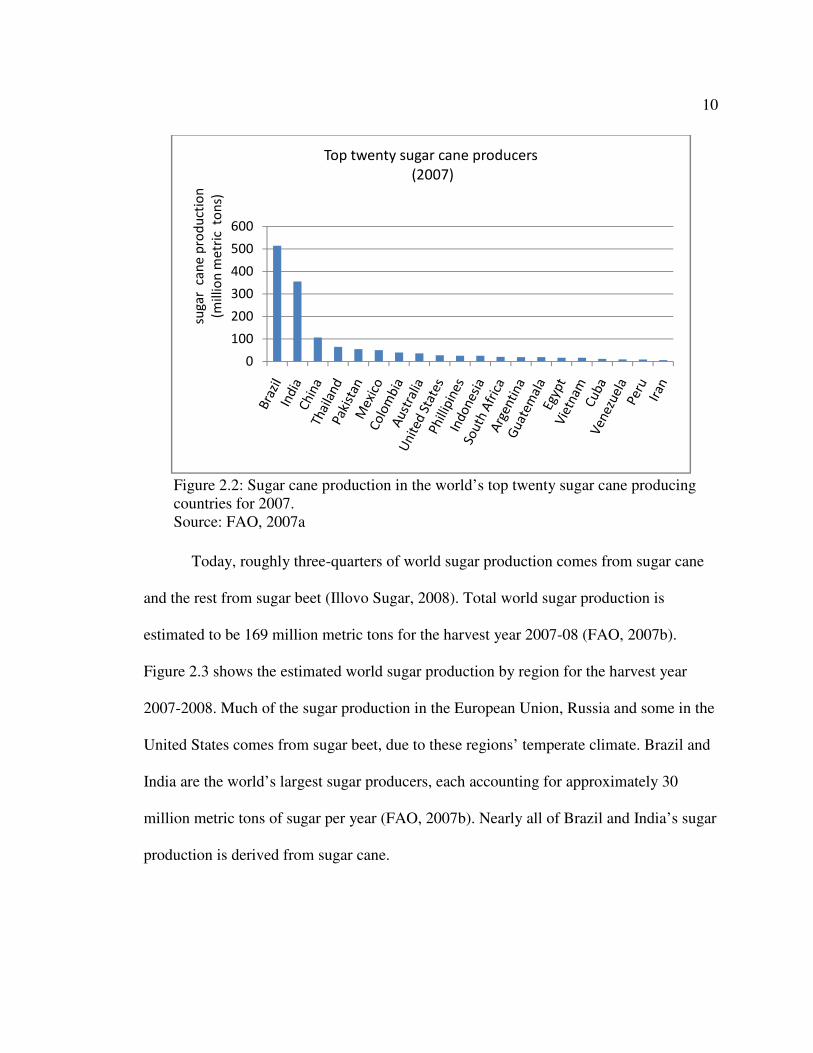
In 2007, total sugar cane production in the world was approximately 1,560 million
metris tons (FAO, 2007a). Brazil and India are the two largest sugar cane producers in
the world. In 2007, Brazil produced 514 million metric tons of sugar cane, followed by
India at 356 million metric tons, each accounting for 33% and 23% of the total world
production respectively. Figure 2.2 shows the sugar cane production in the top twenty
producing countries for 2007. Barring the United States and Australia, most of the sugar
cane is mainly grown in the tropical regions of developing or Non-Annex I countries as
defined under the Kyoto Protocol.
10
Figure 2.2: Sugar cane production in the world’s top twenty sugar cane producing countries for 2007. Source: FAO, 2007a
Today, roughly three-quarters of world sugar production comes from sugar cane
and the rest from sugar beet (Illovo Sugar, 2008). Total world sugar production is
estimated to be 169 million metric tons for the harvest year 2007-08 (FAO, 2007b).
Figure 2.3 shows the estimated world sugar production by region for the harvest year
2007-2008. Much of the sugar production in the European Union, Russia and some in the
United States comes from sugar beet, due to these regions’ temperate climate. Brazil and
India are the world’s largest sugar producers, each accounting for approximately 30
million metric tons of sugar per year (FAO, 2007b). Nearly all of Brazil and India’s sugar
production is derived from sugar cane.
0
100
200
300
400
500
600
sug
ar
ca
ne
pro
du
ctio
n
(mill
ion
me
tric
to
ns)
Top twenty sugar cane producers
(2007)

11
Figure 2.3: World sugar production forecast in million tons for 2007-08. Source: FAO, 2007
Most of the world’s ethanol production is from sugar cane and corn, while the
contribution of other crops like sugar beet, cassava and sweet sorghum is relatively small.
The United States and Brazil are the two largest manufacturers of ethanol, each
producing approximately 160 billion liters in 2005 (F.O. Licht, 2006). The United States
derives most of its ethanol from corn and Brazil from sugar cane. Figure 2.4 shows the
ethanol production in 2005 for different countries.
Asia
68.5 (41%)
Africa
10.6 (6%)
Latin America
and
Carribean
52.7 (31%)
North
America 7.9
(5%)
Europe
23.9 (14%)
Oceania
5.5 (3%)

12
Figure 2.4: World ethanol production in million liters for 2005 Source: F.O. Licht, 2006
With world oil prices rising, demand for ethanol as a partial or complete substitute
for gasoline has gone up in the last decade. This has led to an increase in sugar cane
production, especially in countries like Brazil that have an active biofuels initiative.
Brazil’s sugar cane production has increased from 387 million tons in 2005-06 to 493
million tons in 2007-08 (UNICA, 2008), and is expected to go to 550 million tons in
2008-09 (Brazil Biofuels Ethanol Annual Report, 2008). Most of the increased
production of sugar cane is being used for ethanol production (Figure 2.5). Ethanol
production has increased from 16 billion liters in 2005-06 to 22.5 billion liters in 2007-08
(UNICA, 2008) and is forecasted to be 26.4 billion liters in 2008-09 (Brazil Biofuels
Ethanol Annual Report, 2008). Increased sugar cane processing leads to increased
bagasse outputs and more opportunities to generate surplus renewable electricity.
United States
16,200 (36%)
Brazil
16,100 (36%)
China
3,800 (9%)
India
1,700 (4%)
Rest
6,900 (15%)

13
Figure 2.5: Trends for sugar cane, sugar and ethanol production in Brazil. Source: Sugar cane, sugar and ethanol production data for 2005-2008 - UNICA, 2008
Sugar cane and ethanol production data - Brazil Biofuels Ethanol Annual Report, 2008
Sugar production data – Brazil Sugar Semi-annual Report, 2008
2.2 Sugar cane harvesting
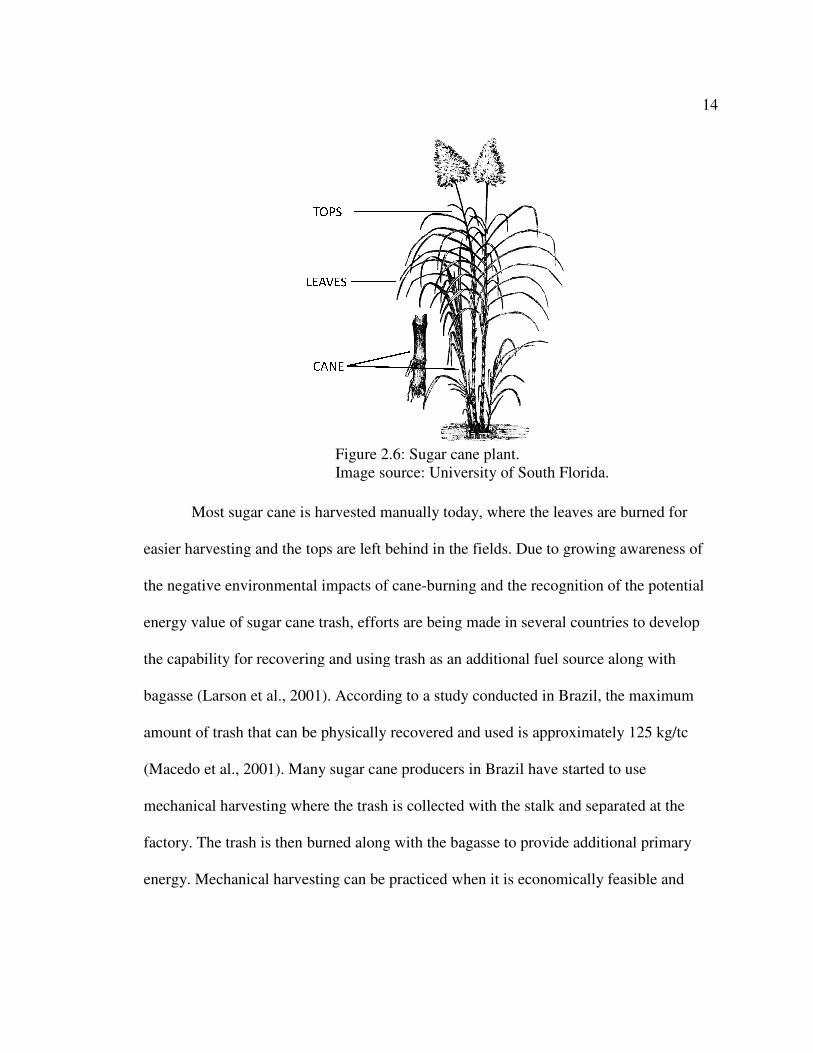
The stalk of the sugar cane grows 2-5 m tall and is harvested for its sucrose
(Barroso et al., 2003). This sucrose is used for sugar and ethanol production. Figure 2.6
shows a sugar cane plant. The tops and leaves of the sugar cane plant, otherwise known
as trash, can be a substantial energy resource. Bagasse and trash each account for about
one-third of the above-ground energy stored by sugar cane, with the remaining one-third
stored as sugar (Larson et al., 2001).
0
5
10
15
20
25
30
35
0
100
200
300
400
500
600
2005-06 2006-07 2007-08 2008-09
mill
ion
me
tric
to
ns
of
sug
ar
OR
bill
ion
lite
rs o
f e
tha
no
l
sug
ar
can
e p
rod
uct
ion
mill
ion
me
tric
to
ns
Sugar cane production Ethanol production Sugar production
Most sugar cane is harvested manually today, where the leaves are burned for
easier harvesting and the tops are left behind in the fields. Due to growing aware
the negative environmental impacts of cane
energy value of sugar cane trash, efforts are being made in several countries to develop
the capability for recovering and using trash as an additional fuel sou
bagasse (Larson et al., 2001). According to a study conducted in Brazil, the maximum
amount of trash that can be physically recovered and used is approximately 125
(Macedo et al., 2001). Many sugar cane producers in Brazil have
mechanical harvesting where the trash is
factory. The trash is then burned along with the bagasse to provide additional primary
energy. Mechanical harvesting can be practiced when it is economically fea
Figure 2.6: Sugar cane plant. Image source: University of South Florida.
sugar cane is harvested manually today, where the leaves are burned for
easier harvesting and the tops are left behind in the fields. Due to growing aware
the negative environmental impacts of cane-burning and the recognition of the potential
energy value of sugar cane trash, efforts are being made in several countries to develop
the capability for recovering and using trash as an additional fuel source along with
, 2001). According to a study conducted in Brazil, the maximum
amount of trash that can be physically recovered and used is approximately 125
Many sugar cane producers in Brazil have started
mechanical harvesting where the trash is collected with the stalk and separated at the
factory. The trash is then burned along with the bagasse to provide additional primary
energy. Mechanical harvesting can be practiced when it is economically fea
14
ource: University of South Florida.
sugar cane is harvested manually today, where the leaves are burned for
easier harvesting and the tops are left behind in the fields. Due to growing awareness of
burning and the recognition of the potential
energy value of sugar cane trash, efforts are being made in several countries to develop
rce along with
, 2001). According to a study conducted in Brazil, the maximum
amount of trash that can be physically recovered and used is approximately 125 kg/tc
to use
with the stalk and separated at the
factory. The trash is then burned along with the bagasse to provide additional primary
energy. Mechanical harvesting can be practiced when it is economically feasible and
15
where loss of jobs for sugar cane cutters is not a concern. However, in most developing
countries, sugar cane harvesting is a major source of livelihood. Even with manual
harvesting, the tops of the sugar cane could be recovered for their additional energy
value. As a counter point, there could be some benefit to leaving the tops in the field for
soil enhancement (Beeharry, 1996). I have limited my study to using only bagasse as a
primary energy source for cogeneration.
Typically, the sugar cane harvesting and crushing season is five to eight months
of the year depending on the region. Sugar manufacturing coincides with this season,
since sugar needs to be processed immediately after harvesting the sugar cane. However,
ethanol distilleries can operate during the whole year and production does not have to
coincide with the sugar cane harvesting season. This is made possible by the storage of
molasses, which is the byproduct of sugar processing and the raw material for ethanol.
2.3 Sugar and Ethanol Processing
After harvesting, the sugar cane is transported to the sugar factory. Figure 2.7
shows a block diagram of a sugar factory. The cane is often washed to remove excessive
amounts of soil and debris (Ensinas et al., 2007). After being washed, the cane enters the
extraction system where it is prepared using rotating cutters and shredders that reduce the
cane fed to the mills into small pieces. Subsequently, four to six mills in series separate
the bagasse and the juice by compression of the sugar cane. Bagasse constitutes
approximately 30 percent of the harvested sugar cane by mass basis and has a moisture
content of about 50 percent. The wet bagasse is sent to the factory’s cogeneration system,
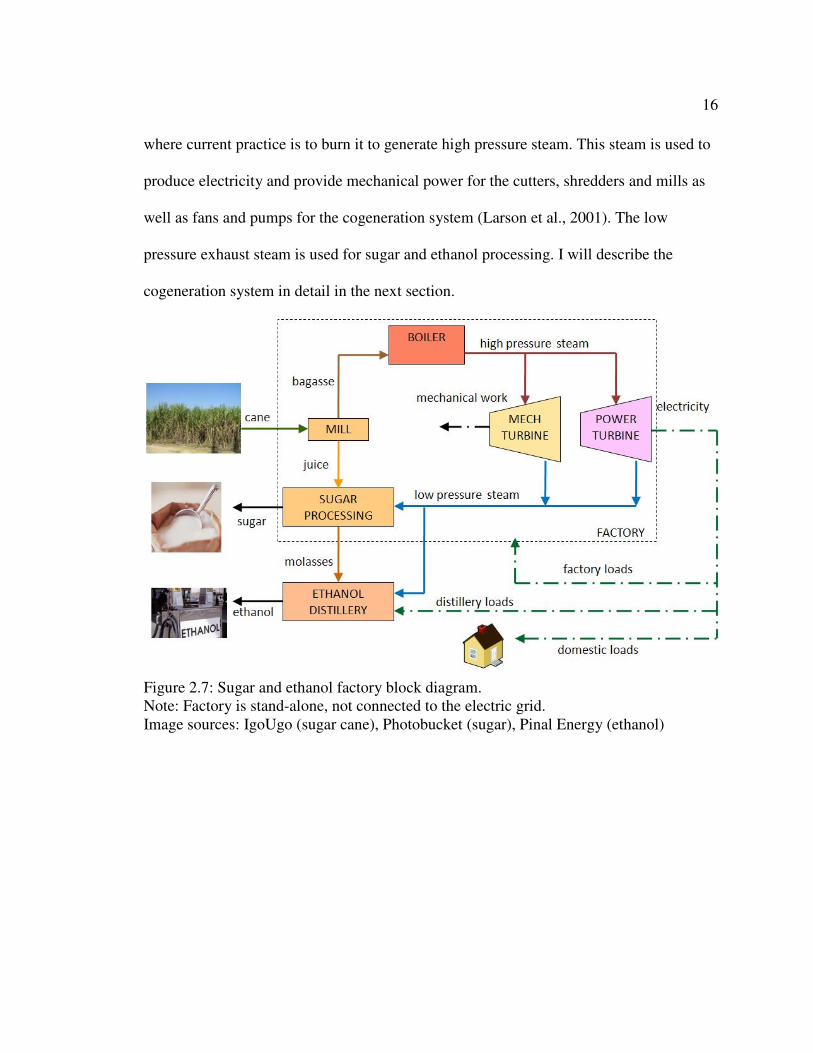
16
where current practice is to burn it to generate high pressure steam. This steam is used to
produce electricity and provide mechanical power for the cutters, shredders and mills as
well as fans and pumps for the cogeneration system (Larson et al., 2001). The low
pressure exhaust steam is used for sugar and ethanol processing. I will describe the
cogeneration system in detail in the next section.
Figure 2.7: Sugar and ethanol factory block diagram. Note: Factory is stand-alone, not connected to the electric grid. Image sources: IgoUgo (sugar cane), Photobucket (sugar), Pinal Energy (ethanol)

17
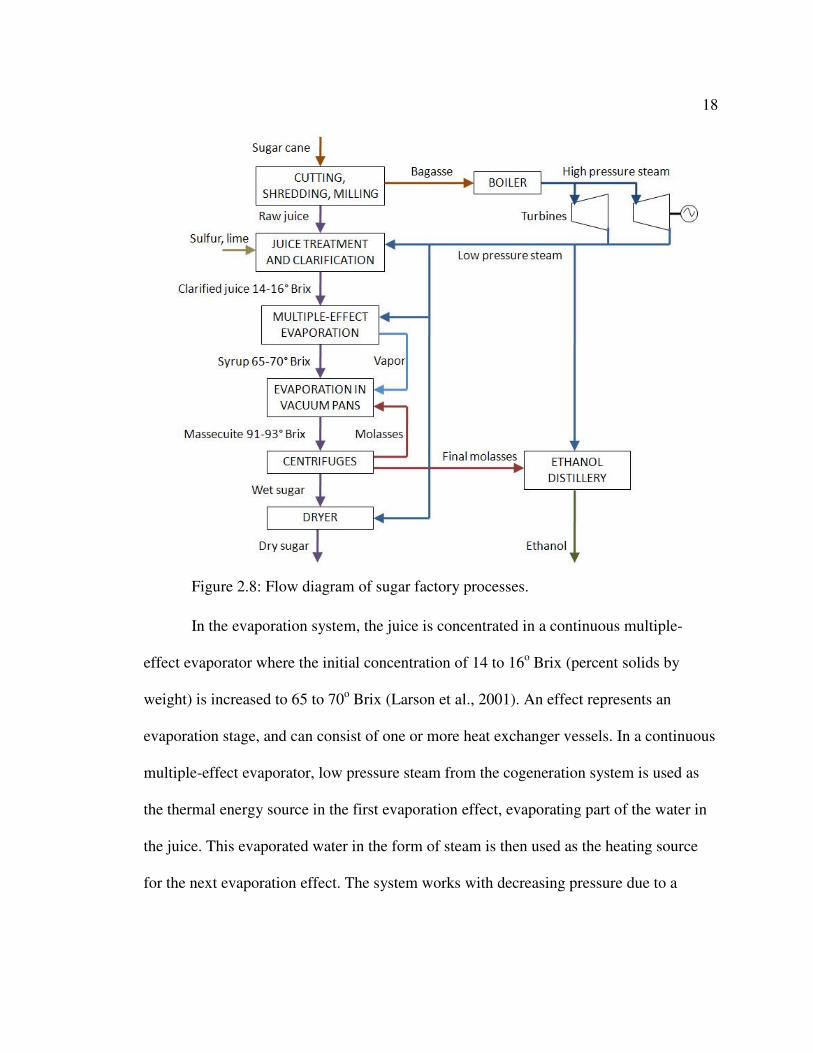
Figure 2.8 shows the flow diagram of the sugar factory processes that I describe
here. After the mills, the raw juice passes through a screen on its way to the juice
treatment system. Chemical reactants like sulfur and lime are added to the juice to
separate some of the non-sugar impurities from the juice. Here, some low pressure steam
from the cogeneration system is used to heat the juice to assist the chemical reactants in
separating the non-sugar impurities. The juice is then directed to a clarifier followed by a
filter to separate the juice and the “filter cake” or “mud”. The clarified juice is directed to
the evaporation system. Treatment of juice for ethanol and sugar can be very similar with
the exception of the sulfur addition step, which is used exclusively for sugar production
(Ensinas et al., 2007)
18
Figure 2.8: Flow diagram of sugar factory processes.
In the evaporation system, the juice is concentrated in a continuous multiple-
effect evaporator where the initial concentration of 14 to 16o Brix (percent solids by
weight) is increased to 65 to 70o Brix (Larson et al., 2001). An effect represents an
evaporation stage, and can consist of one or more heat exchanger vessels. In a continuous
multiple-effect evaporator, low pressure steam from the cogeneration system is used as
the thermal energy source in the first evaporation effect, evaporating part of the water in
the juice. This evaporated water in the form of steam is then used as the heating source
for the next evaporation effect. The system works with decreasing pressure due to a

19
vacuum imposed in the last effect, producing the necessary difference of temperature
between each effect (Ensinas et al., 2007). The vapor that results from evaporating water
in each effect is used as heating steam for the following effect. Some of the vapor is also
bled to provide heating steam for other processes like juice purification as well as sugar
boiling and crystallization. Normally four or five effects are used (Larson et al., 2001).
By increasing the number of effects, more water from the juice can be extracted due to
the temperature difference created by vacuum pressure. In addition, more amount of
vapor is available as heating steam for the other processes. Subsequently, less amount of
low pressure steam is required from the cogeneration system. Hence, five effects can
substantially reduce the low pressure steam demand of a sugar factory (Upadhiaya,
1992).
Next, the concentrated juice, called syrup, is directed to vacuum pans where it is
further concentrated under vacuum to around 91-93o Brix in either a continuous or batch
process. This step produces a mixture called massecuite, consisting of around 50 percent
crystals surrounded by molasses, which is a sugar solution with other non-sugar solids
like calcium, potassium, magnesium and iron (Larson et al., 2001). The massecuite is
slowly cooled down and sent to centrifuges where sugar crystals are separated from the
molasses. The crystals are then washed in the centrifuges and dried in a dryer. The sugar
dryer uses some of the low pressure steam from the cogeneration system as a heat source.
The sugar is then cooled and packaged for delivery to the market. The final dry sugar
constitutes approximately 10 percent of the total mass of the input sugar cane.

20
The molasses collected from the centrifuges can be returned to the vacuum pans
for recovery of residual dissolved sugar. Depending on the degree of sucrose recovery
desired, factories produce one, two or three massecuites (Larson et al., 2001). The
exhausted molasses, called final molasses, has several potential uses including ethanol
production, additive in the food and drinks industry and raw material in the chemical and
construction industries.
Many sugar plants have an ethanol distillery annexed to the sugar factory, which
uses the final molasses as a feedstock for the production of ethanol. The ethanol
production can be increased by blending raw juice with the molasses to increase the
concentration of sucrose in the fermentation feedstock. The resulting liquor after
fermentation has around 8 percent of ethanol concentration on a mass basis (Ensinas et
al., 2007). This ethanol is recovered by distillation.
The fermented liquor is heated to reach the adequate temperature for the
distillation process and then passed through the distillation columns. The thermal energy
needed for the ethanol process is again provided by the low pressure steam from the
cogeneration system. The hydrous ethanol that results from this process has a purity of
approximately 95-96 percent. This ethanol can be used directly in vehicles that can run
on 100 percent ethanol. However, hydrous ethanol is immiscible in gasoline. For
blending with gasoline, hydrous ethanol has to undergo a dehydration process to produce
anhydrous ethanol with approximately 99 percent purity.

21
The condensate from the low pressure exhaust steam used for the various
processes is returned to the cogeneration system. The condensate resulting from the
evaporation of vapor from the juice is used as imbibition water in the juice extraction
process and washing water in sugar and molasses centrifugal separation and in the juice
treatment filter. A water cooling system is used to reduce the condensate water
temperature and is used as cooling water for various processes within the sugar factory
(Ensinas et al., 2007).
2.4 Direct Combustion Steam Rankine Cycle Cogeneration System
The cogeneration system of a sugar factory uses bagasse as its primary energy
source. Bagasse is the fibrous biomass residue left over from sugar cane milling. The
typical properties of bagasse are given in Table 2.1 and Table 2.2.
Table 2.1: Typical ultimate analysis of bagasse (Rodrigues et al., 2007).4
Ultimate Analysis of Bagasse – Weight (%) Dry Basis
C 47% O 43% H 6% N 0% S 0% Cl 0%
Ash 4%
Lower Heating Value of Dry Bagasse 17.5 MJ/kg
4 Ultimate analysis is the determination of the percentages of carbon, hydrogen, nitrogen, sulfur, chlorine and (by difference) oxygen in the biomass sample. The heating value of a fuel is the amount of heat released by combusting a specified quantity of that fuel. The lower heating value (LHV) assumes that the latent heat of vaporization of water in the fuel and the reaction products is not recovered while the higher heating value (HHV) includes the heat of condensation of water in the combustion products.

22
Table 2.2: Typical physical characteristics of wet bagasse as it comes out of the juice extraction system (Rodrigues et al., 2007).
Physical Characteristics of Bagasse
Particle Size < 5 cm Bulk Density 50-75 kg/m3
Moisture Content – wet basis 48-52%
According to current practice, bagasse that comes out of the juice extraction
system is directly burned in boilers to generate high pressure steam. As the values in
Table 2.2 indicate, bagasse has a small particle size, low bulk density and is very wet.
Any excess bagasse is stored for off-season energy generation or is sold for other uses
like the production of paper, fiber board or animal feed. The high pressure steam is
expanded through multiple turbines. Some of the turbines run generators to produce
electricity for the factory and are usually multi-stage turbines. Other turbines provide
mechanical power to the cutters, shredders and mills for processing the sugar cane, as
well as auxiliary equipment for the cogeneration system like pumps, blowers and fans.
Most of the turbines that provide mechanical power are small in capacity and are usually
single-stage turbines. Only some equipment like the shredder need a large amount of
power and hence, require multi-stage turbines. Typically, for a stand-alone sugar factory
with no incentive to produce surplus electricity, most of the turbines are back-pressure
turbines (BPT). In a BPT, the steam exits at near atmospheric pressure. This low pressure
steam is used for sugar and/or ethanol processing. A cogeneration system serving a sugar
or sugar/ethanol factory must always satisfy the demand for process steam to run the
factory during the cane crushing season (Larson et al., 2001). A typical level of process

23
steam consumption for a sugar factory is 400 to 550 kg steam/ton of sugar cane crushed
(kg/tc) (Larson et al., 2001; Ensinas et al., 2007).
A stand-alone factory has a relatively fixed demand for electricity and mechanical
power for internal consumption and is based on its cane throughput. In many sugar
factories, the high pressure steam demand for electricity and mechanical power is lower
than the low pressure process steam demand. For a stand-alone factory, the additional
low pressure steam demand is made up by passing some high pressure steam through an
expansion valve, effectively bypassing the turbines without doing any useful work.
Whenever the high pressure steam demand is higher than the low pressure steam, the
excess high pressure steam is vented out.
Some advanced sugar factories use condensing-extraction steam turbines (CEST).
Unlike BPTs where all the steam exhausts at near atmospheric pressure and is used for
process needs, CESTs provide the ability to extract only the required amount of process
steam at the required pressure. The rest of the steam is expanded to below atmospheric
pressure for additional work. CESTs are usually installed when a sugar factory is
connected to an electric grid. Any surplus electricity is exported to the grid.
2.5 Efficient cogeneration for electricity export
With increasing demand for electricity in the developing countries and lack of
primary energy sources, utilities have been struggling to keep up with demand. By
improving their cogeneration systems, sugar factories have the potential to produce
surplus electricity for export to the utility grid. For the sugar factories, the sale of

24
electricity provides an additional revenue stream. Additionally, bagasse is a renewable
energy source. Bagasse-based electricity exported to the grid is assumed to displace
electricity with a carbon intensity equivalent to the local grid mix. This carbon intensity
depends on the amount of fossil fuel based energy generation on that grid. Under the
Clean Development Mechanism of the Kyoto Protocol, it is possible for sugar factories in
developing countries to receive carbon credits based on the amount of electricity they
export to the grid and the carbon intensity of that grid. These credits can be sold to
entities in Annex I countries for revenues in addition to those from electricity sales.
There are several different measures to increase the electricity generation in sugar
cane factories and these are well documented (Upadhiaya, 1992, Ensinas et al., 2007).
These measures all entail reduction of in-house demand for both high pressure and low
pressure steam.
Various measures can be taken to reduce the process steam demand in sugar
manufacturing and ethanol distillation. These include maximum evaporation in multiple
effect evaporators, use of quintuple evaporator effects, maximum utilization of vapor
bleeding, use of continuous sugar boiling pans and many others. In a sugar factory, these
measures can reduce the typical low pressure steam consumption of 400-550 kg-steam/tc
by approximately 30-50 percent to 280-300 kg-steam/tc (Upadhiaya, 1992, Ensinas et al.,
2007). A dual-pressure distillation system for hydrated ethanol production and molecular
sieves for the dehydration step can reduce the typical steam consumption for ethanol
production by approximately 50 percent, from 5 kg-steam/l-ethanol to 2.5 kg-steam/l-

25
ethanol (Ensinas et al., 2007). However, implementing these measures incurs additional
capital and operating costs.
When a sugar factory is connected to the electric grid, there is no hard upper limit
for high pressure steam demand. Hence, in a case where the in-house high pressure steam
demand is less than the low pressure steam demand, the high pressure steam passes
through the electricity generating turbines instead of expansion valves and the surplus
electricity is exported to the grid.
Upadhiaya states that the single-stage steam turbines used for providing
mechanical power for the sugar processing equipment as well as auxiliary equipment for
the cogeneration system can be replaced with variable speed electric drives. Single-stage
turbines providing the mechanical power need to operate at varying speeds and loads
depending on the cane throughput. They are much less efficient than the multi-stage
turbines used for electricity generation that operate at their rated speed and load, when
the factory is connected to the grid. It is true that variable speed electric drives require
multiple energy conversions to provide the final mechanical power. However, they
eliminate the heat losses through the steam lines required for steam turbines. They also
respond better to the varying load conditions of the sugar factory equipment. Hence, the
overall combination of the highly efficient variable speed electric drives and electricity
generation turbines proves to be more efficient than mechanical drive single-stage
turbines. Electric drives, however, have higher capital costs than steam turbines
(Upadhiaya, 1992).

26
For efficient cogeneration, sugar factories are installing higher pressure boilers
and CESTs operating at pressures of 45-65 bar. In a few cases, factories have used boilers
that operate at 100 bar. Higher pressure steam can do more work per unit mass. In these
systems, some steam is extracted at the required pressure for motive power and sugar
and/or ethanol processing. The rest of the steam is exhausted at a pressure well below
atmospheric to a condenser. This combination of high pressure boiler and CEST is
capable of generating much more surplus electricity for export to the electric grid.
However, high pressure systems, especially over 60 bar, require special construction
techniques and materials that withstand the high pressure and associated high
temperatures (over 450oC) (Upadhiaya, 1992). CESTs also require a condenser system
with a cooling tower and pump. These additional capital and operating costs need to be
considered to determine the actual revenues from surplus electricity generation.
Biomass integrated gasifier combined cycle (BIGCC) technology may have the potential
to generate electricity more efficiently than a conventional CEST system while being cost
competitive at the same time. In a BIGCC system, the product gases, after being cleaned
and filtered, are fed into a gas turbine to run a generator. The surplus heat in the exhaust
gases from the gas turbine is used to generate steam and run a steam Rankine bottoming
cycle for additional electricity generation. In the case of sugar factories, some steam can
be extracted from the bottoming CEST for the processing needs of sugar and/or ethanol.
A BIGCC cogeneration system converts a high fraction of the biomass fuel input into
electricity. This system correspondingly converts a smaller fraction of the fuel input into

27
process steam and cannot satisfy process steam demand via cogeneration unless measures
are taken to improve the low pressure process steam efficiency in sugar and ethanol
production (Larson et al., 2001).
Refinement of the direct combustion cogeneration system has yielded electricity
generation rates of 120 kWh per ton cane, compared to typical factory performance of
about 10 kWh per ton cane worldwide. According to some estimates, BIGCC
technologies under development are projected to attain even higher overall efficiencies,
yielding electricity generation rates greater than 200 kWh per ton cane (Turn, 1999a). It
is important to compare the electricity generation potential of the BIGCC technology
with that of CEST. But before that, it is useful to understand the details of the BIGCC
technology and its advantages and limitations. In the next section, I provide these details
as well as describe the various demonstration projects of some of the leading BIGCC
technology developers and their status.
CHAPTER 3. BIOMASS INTEGRATED G
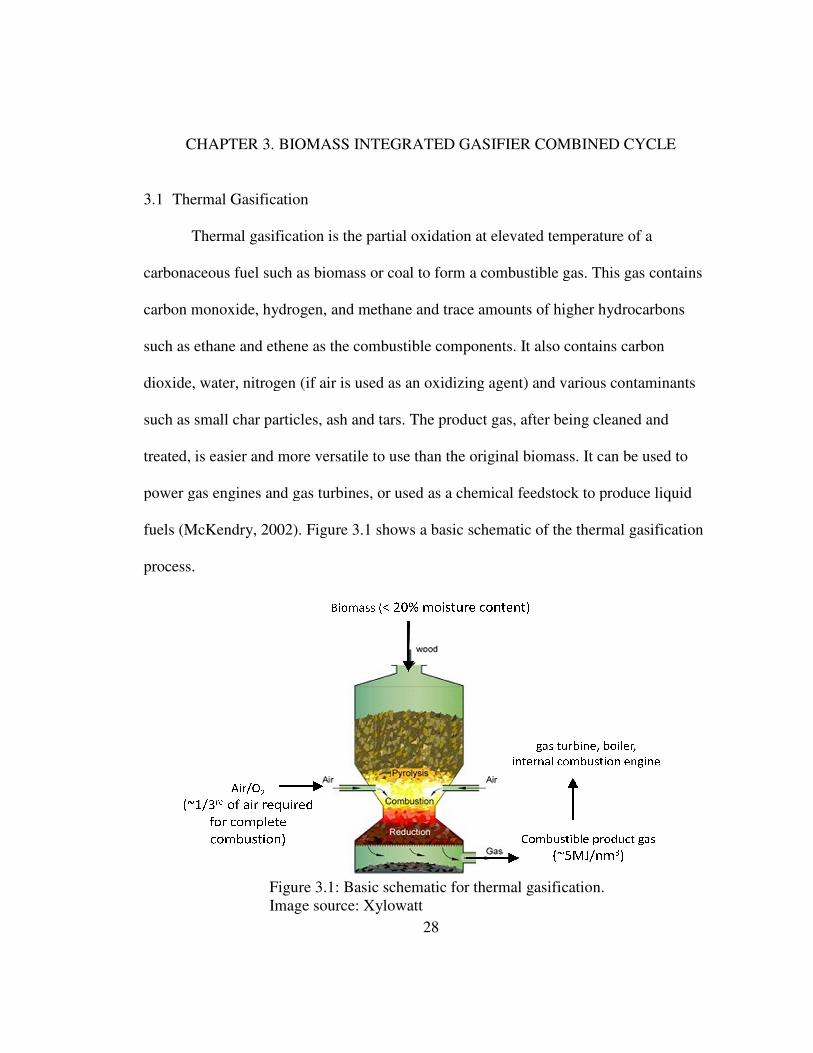
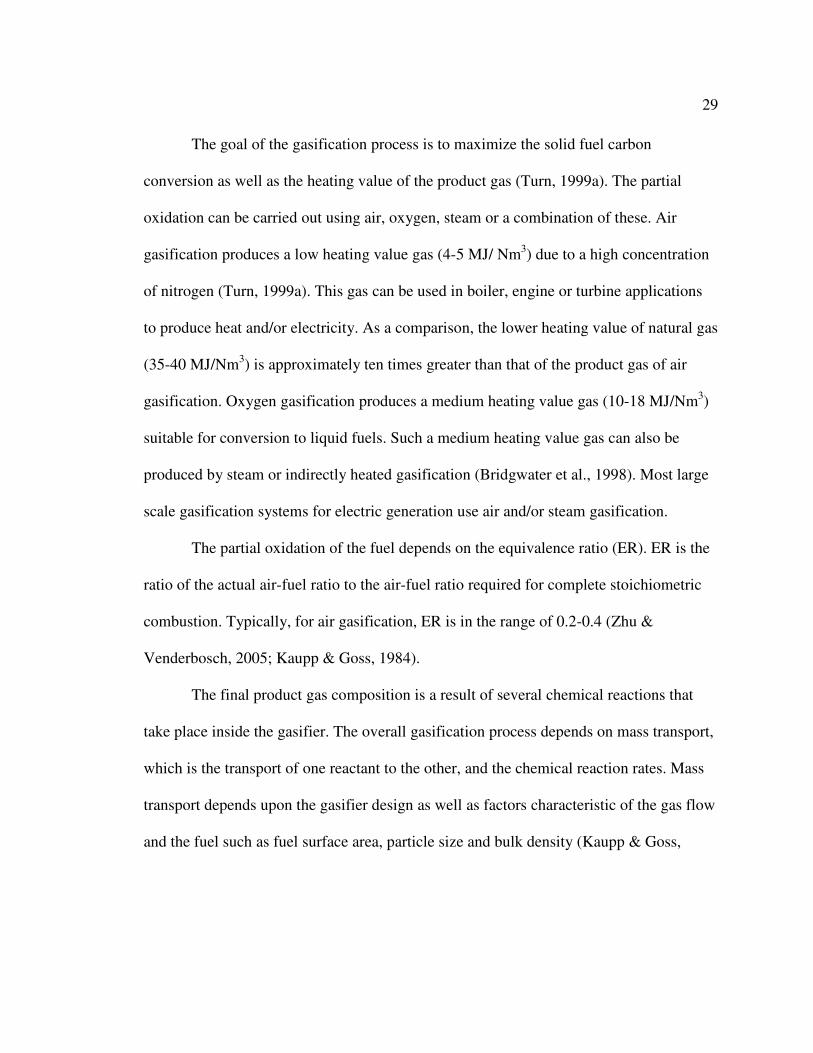
3.1 Thermal Gasification
Thermal gasification is the parti
carbonaceous fuel such as biomass or coal to form a comb
carbon monoxide, hydrogen, and methane and trace amounts of higher hydrocarbons
such as ethane and ethene as the combustible components. It also contains carbon
dioxide, water, nitrogen (if air is used as an oxidizing agent)
such as small char particles, ash and tars. The product gas, after being cleaned and
treated, is easier and more versatile to use than the original biomass. It can be used to
power gas engines and gas turbines, or used as a chemica
fuels (McKendry, 2002).
process.
Figure Image s
28
BIOMASS INTEGRATED GASIFIER COMBINED CYC
Gasification
gasification is the partial oxidation at elevated temperature of a
carbonaceous fuel such as biomass or coal to form a combustible gas. This gas contains
carbon monoxide, hydrogen, and methane and trace amounts of higher hydrocarbons
such as ethane and ethene as the combustible components. It also contains carbon
dioxide, water, nitrogen (if air is used as an oxidizing agent) and various contaminants
such as small char particles, ash and tars. The product gas, after being cleaned and
treated, is easier and more versatile to use than the original biomass. It can be used to
power gas engines and gas turbines, or used as a chemical feedstock to prod
). Figure 3.1 shows a basic schematic of the thermal gasification
Figure 3.1: Basic schematic for thermal gasification. Image source: Xylowatt
ASIFIER COMBINED CYCLE
al oxidation at elevated temperature of a
ustible gas. This gas contains
carbon monoxide, hydrogen, and methane and trace amounts of higher hydrocarbons
such as ethane and ethene as the combustible components. It also contains carbon
and various contaminants
such as small char particles, ash and tars. The product gas, after being cleaned and
treated, is easier and more versatile to use than the original biomass. It can be used to
l feedstock to produce liquid
shows a basic schematic of the thermal gasification
29
The goal of the gasification process is to maximize the solid fuel carbon
conversion as well as the heating value of the product gas (Turn, 1999a). The partial
oxidation can be carried out using air, oxygen, steam or a combination of these. Air
gasification produces a low heating value gas (4-5 MJ/ Nm3) due to a high concentration
of nitrogen (Turn, 1999a). This gas can be used in boiler, engine or turbine applications
to produce heat and/or electricity. As a comparison, the lower heating value of natural gas
(35-40 MJ/Nm3) is approximately ten times greater than that of the product gas of air
gasification. Oxygen gasification produces a medium heating value gas (10-18 MJ/Nm3)
suitable for conversion to liquid fuels. Such a medium heating value gas can also be
produced by steam or indirectly heated gasification (Bridgwater et al., 1998). Most large
scale gasification systems for electric generation use air and/or steam gasification.
The partial oxidation of the fuel depends on the equivalence ratio (ER). ER is the
ratio of the actual air-fuel ratio to the air-fuel ratio required for complete stoichiometric
combustion. Typically, for air gasification, ER is in the range of 0.2-0.4 (Zhu &
Venderbosch, 2005; Kaupp & Goss, 1984).
The final product gas composition is a result of several chemical reactions that
take place inside the gasifier. The overall gasification process depends on mass transport,
which is the transport of one reactant to the other, and the chemical reaction rates. Mass
transport depends upon the gasifier design as well as factors characteristic of the gas flow
and the fuel such as fuel surface area, particle size and bulk density (Kaupp & Goss,

30
1984). The chemical reaction rates depend on temperature and pressure inside the gasifier
(Kaup & Goss, 1984).
The five most important reactions are shown below. These chemical reactions
take place between the carbonaceous biomass, the moisture within the biomass and the
oxygen in the oxidizing agent. The exothermic reactions are indicated by the negative
sign of the change in enthalpy, ∆�. The principal combustion or exothermic reaction
between the carbon in the biomass and oxygen, resulting in carbon dioxide, provides
almost all the heat energy required to sustain the endothermic reactions in the gasification
process (Kaupp & Goss, 1984).
� � �� � ���, ∆� �393.5 ��/��� � � ��� � �� � ��, ∆� �131.4 ��/��� �� � ��� � ��� � ��, ∆� �41.2 ��/��� � � ��� � 2��, ∆� �172.6 ��/��� � � 2�� � ���, ∆� �74.9 ��/���
(Kaupp & Goss, 1984; Ptasinski et al., 2007).
Table 3.1 shows the typical percentages by volume of the main constituents of the
dry product gas from a gasifier using air as an oxidizing agent.
Table 3.1: Typical product gas composition from an air gasification process (Rodrigues et al., 2007, Ensinas et al., 2007).
Gas Component Volume
Carbon Monoxide, CO 15-20% Hydrogen, H2 15-20%
Carbon Dioxide, CO2 8-12% Methane, CH4 1-3% Nitrogen, N2 45-50%
31
3.2 Biomass Integrated Gasifier Combined Cycle
In a biomass integrated gasifier combined cycle (BIGCC), the product gas from
the gasifier is used to run a gas turbine to generate electricity. The heat from the exhaust
gas from the gas turbine is recovered to make steam and run a steam turbine to generate
additional electricity. The exhaust steam from this steam turbine can be used for
cogeneration applications, such as processing sugar and ethanol in the sugar industry.
Hence, the BIGCC technology is well suited for sugar industry applications due to the
demand for process steam. A BIGCC cogeneration system has the potential for increased
electricity generation over that of a conventional direct combustion system, while
satisfying the low pressure steam demand for sugar and/or ethanol processing. By some
estimates, BIGCC systems have the potential to generate up to twice as much electricity
per unit of biomass consumed than conventional direct combustion steam Rankine cycle
systems (Larson et al., 2001; Ensinas et al., 2007).
The basic elements of a BIGCC system include a biomass dryer to reduce the
moisture content of the bagasse; a feeding system to feed the bagasse into the gasifier; a
gasifier for converting the bagasse into a combustible gas; a gas cleanup system to
remove the tars and particulates from the gas; a gas turbine-generator where the gas
combusts and expands to run a generator; a heat recovery steam generator (HRSG) to
produce steam from the hot exhaust of the gas turbine; and a steam turbine-generator to
produce additional electricity. Figure 3.2 shows the block diagram for a BIGCC system.
The exhaust low pressure steam from the steam turbine-generator is used to satisfy the

32
process steam demand of the sugar/ethanol factory. The exhaust flue gases from the
HRSG can be used in the bagasse dryer to extract waste heat.
In the next section, I present the different components of the BIGCC system and
the challenges associated with their design and operation in the context of a bagasse-
based cogeneration system.
Figure 3.2: Block diagram of a biomass integrated gasification combined cycle cogeneration system for a sugar factory.
3.3 Fuel Pretreatment
The main pretreatment of the bagasse fuel for a BIGCC system is the reduction of
its moisture content. Fresh bagasse has a moisture content (wet basis) of approximately
50 percent. The moisture content of the fuel entering the gasifier strongly affects the
heating value of the produced gas, as energy is required for the vaporization of the
33
moisture (Hassuani et al., 2005; Turn, 1999b). Since the lower heating value of the gas is
quite low, especially from a gasifier using air as an oxidant, reducing the moisture
content of the fuel is critical for the successful operation of the turbine downstream.
According to one study that simulated the operation of a modified General Electric
LM2500 gas turbine coupled with a gasifier, the bagasse moisture content must be about
10 percent to produce gas with heating value of approximately 5.9 MJ/Nm3, which is
adequate for the operation stability of the turbine (Hassuani et al., 2005). Drying the
bagasse in a dryer prior to feeding it into the gasifier requires less energy than that
required inside the gasifier to evaporate the fuel moisture and heat it to the gasifier
operating temperature. Additionally, drying bagasse provides better gasifier control by
producing a more uniform fuel. A dryer also offers the opportunity to recover heat from
the flue gas exiting the HRSG and increase the overall system efficiency (Turn, 1999b).
However, some studies show that the HRSG flue gas may not have enough energy to dry
the bagasse to the required moisture content levels. A supplementary heat source may be
needed to provide the additional thermal energy (Hasssuani et al., 2005). Although
bagasse drying is advantageous from a system efficiency viewpoint, drying to levels
below 20 percent moisture content can introduce feeding problems, especially in
extrusion type feeders. This is mainly due to increased frictional characteristics and
abrasiveness of the fuel. A drying system also increases capital costs and parasitic loads
(Turn, 1999b).

34
Fuel pretreatment, other than drying, may include steps to increase the bulk
density of the bagasse, since feeding systems are limited by fuel volume. The bulk
density might be increased by chopping to reduce particle size, pelletizing, cubing and
baling. However, the associated processes introduce additional capital expenditures as
well as operation and maintenance costs, especially for large commercial operations such
as a sugar factory (Turn, 1999b).
3.4 Fuel Feeding Systems for Bagasse
After drying, the bagasse is fed into the gasifier using a feeding system. The type
of feeding system for a gasifier depends on whether the gasification system is pressurized
or nominally atmospheric. Feeding is more challenging in pressurized than atmospheric
pressure gasification systems.
For a pressurized gasification system, there are two main requirements of a
feeding system. First, it should provide the fuel consistently at a controlled feed rate.
Second, it should maintain a seal between the pressurized parts of the gasification system
and the parts of the feed system operating at atmospheric pressure. There are three
systems that have been tried and tested. The most popular is the lock hopper feed system,
where the lock hopper isolates the feed system from the reactor pressure. It is alternately
pressurized and depressurized using an inert gas, typically nitrogen, as it introduces fuel
into the reactor in a batch process. Due to the fibrous nature of bagasse and its tendency
to bridge, lock hopper feed systems have experienced issues with the bagasse not flowing
easily. The second system is a plug screw feeder where a tapered screw compresses the
35
bagasse in a dense plug, which provides the seal for the operating pressure of the reactor.
However, bagasse can cause severe abrasive wear on the inside surfaces of the feeder.
The third system is a piston feeder where a piston is deployed to push the bagasse into the
reactor in a batch process. In this system, the fibrous nature of bagasse can cause
difficulties in loading the piston cylinders and can also cause abrasion on the feed system
(Turn, 1999b).
Atmospheric pressure gasifiers are easier to feed since no pressure seal needs to
be maintained between the gasifier reactor and the feed system. Simple screw type
feeders can be used. Even then, the low bulk density and cohesive characteristics of
bagasse may cause an accumulation of the fuel in the feeding system, making it difficult
to flow into the gasifier (Rodrigues et al., 2007).
3.5 Gasifier
There are three main types of gasifier designs; fixed bed, fluidized bed and
entrained flow. The entrained flow gasifier was developed for coal gasification. Its need
for finely divided feed material makes it unsuitable for most biomass materials due to
their fibrous nature (McKendry, 2002). Hence, I have limited my discussion to the first
two types. The gasifier technology is selected based on the available fuel quality,
capacity range and gas quality conditions (Waldheim & Carpentieri, 2001).
3.5.1 Fixed Bed vs Fluidized Bed Gasifier Systems
Figure 3.3 shows the schematics of different gasifier designs. Fixed bed gasifiers
typically have a grate to support the fuel and maintain a stationary reaction zone. The two
36
main fixed bed gasifier designs are classified as downdraft and updraft depending on the
direction of the oxidant flow.
In a downdraft gasifier, the fuel and oxidant (in most cases air) move in the same
direction, from the top to the bottom. The product gas leaves the gasifier after passing
through a hot zone, enabling the partial cracking of the tars formed during gasification
(McKendry, 2002). This design was mainly developed for applications such as running
internal combustion engines that require low tar content gas. A major obstacle to scale-up
of the downdraft gasifier design above 1 MW thermal is the geometry of the throat
section (Waldheim & Carpentieri, 2001).
In an updraft gasifier, the fuel is fed from the top and the oxidant from the bottom,
moving in the opposite direction of each other. The product gas from an updraft gasifier
is usually directly burned in a close-coupled boiler or furnace, since its high tar content
limits its use in other applications like internal combustion engines or gas turbines. The
upper limit for the capacity of an updraft gasifier is approximately 20 MW thermal, due
to limits imposed by its diameter (Waldheim & Carpentieri, 2001).
In addition to limited scale-up potential, fixed bed gasifiers do not have a uniform
temperature distribution leading to possibilities for hot spots with ash fusion (Warnecke,
2000). Hence, both the downdraft and updraft gasifier designs are unsuitable for large
scale bagasse cogeneration systems.

Figure 3.3: Schematic of four different
The main advantage of fluidized bed gasifiers over fixed bed gasifiers is their
uniform temperature distribution in the gasification zone (McKendry, 2002). This is
achieved using fine particles of an inert material like sand or alumina. The inert particles
are heated at start-up, and then serve as an ignition source and thermal energy carrier at
steady state conditions. A stream of fluidizing agent (typically air or steam) is pa
through the bed from below. As it is forced with increasing velocity, a point is reached
when the frictional force between the particle and fluidizing agent counterbalances the
weight of the particle. This is the point of minimum fluidization. An incr
rate beyond this point results in bubbling and channeling of the fluidizing agent through
the bed media (Turn, 1999a). Bubbling fluidized beds are operated in this regime. The
: Schematic of four different gasifier designs.
The main advantage of fluidized bed gasifiers over fixed bed gasifiers is their
uniform temperature distribution in the gasification zone (McKendry, 2002). This is
ng fine particles of an inert material like sand or alumina. The inert particles
up, and then serve as an ignition source and thermal energy carrier at
steady state conditions. A stream of fluidizing agent (typically air or steam) is pa
through the bed from below. As it is forced with increasing velocity, a point is reached
when the frictional force between the particle and fluidizing agent counterbalances the
weight of the particle. This is the point of minimum fluidization. An incr
rate beyond this point results in bubbling and channeling of the fluidizing agent through
the bed media (Turn, 1999a). Bubbling fluidized beds are operated in this regime. The
37
The main advantage of fluidized bed gasifiers over fixed bed gasifiers is their
uniform temperature distribution in the gasification zone (McKendry, 2002). This is
ng fine particles of an inert material like sand or alumina. The inert particles
up, and then serve as an ignition source and thermal energy carrier at
steady state conditions. A stream of fluidizing agent (typically air or steam) is passed
through the bed from below. As it is forced with increasing velocity, a point is reached
when the frictional force between the particle and fluidizing agent counterbalances the
ease in the flow
rate beyond this point results in bubbling and channeling of the fluidizing agent through
the bed media (Turn, 1999a). Bubbling fluidized beds are operated in this regime. The
38
fuel is introduced at the bottom of the bed and is partially oxidized to produce the
combustible product gas as it travels through the bed. The air or steam acts as a fluidizing
medium as well as an oxidant for the combustion or exothermic reactions that provide the
thermal energy.
As the fluidizing agent flow rate is increased beyond the minimum fluidization
velocity, eventually the terminal velocity of char and bed particles is exceeded and the
particles become entrained in the air/steam flow. The char and bed particles exiting from
the top of the reactor are separated from the product gas flow in a cyclone and returned to
the bed. Circulating fluidized beds (CFB) are operated in this manner (Turn, 1999a).
CFB seems to be the most suitable technology for use with bagasse in a BIGCC system.
In general, the biomass particle size of bagasse (< 50 mm) allows for higher efficiency
conversion in fluidized bed gasifiers due to better mixing with the bed material and
greater carbon conversion rates (Rodrigues et al., 2007). CFBs allow for more complete
carbon conversion and permit higher specific throughputs than bubbling beds (Williams
& Larson, 1996). Hence, CFB is the more favorable technology for gasifiers with fuel
capacities greater than 10 MW thermal. Some of its additional benefits are:
- Good fuel flexibility
- Compact gasifier even at atmospheric pressure, cost-effective large scale
construction
- Good controllability and low load operation characteristics
- Uniform process temperature due to highly turbulent movement of solids

39
- Optimum gas quality due to high carbon conversion
(Waldheim & Carpentieri, 2001)
3.5.2 Atmospheric Pressure vs Pressurized Gasifier Systems
In a BIGCC system, the product gas from the gasifier is fired in a combustion gas
turbine to generate electricity. The gas turbine requires the fuel gas and combustion air
stream to be pressurized, based on the operating pressure of the turbine. Two approaches
have been developed to meet this requirement. The first approach involves pressurizing
the gasifier, maintaining the pressure through the gas cleanup/conditioning system, and
feeding the product gas to the combustor of the turbine at that elevated pressure. The gas
is filtered through the gas cleanup/conditioning system at a sufficiently high temperature
to maintain the tars in vapor phase (Waldheim & Carpentieri, 2001). The second
approach is to operate the gasifier and gas cleanup/conditioning system at nominally
atmospheric pressure, then compress the product gas to the required pressure before
feeding it to the combustor of the turbine. Compressing the product gas is most
efficiently done at a low temperature and after the condensation of the water vapor
contained in the gas (Waldheim & Carpentieri, 2001).
Both approaches have their advantages and disadvantages. In the pressurized
gasifier system, the fluidizing agent is compressed to the operating pressure of the
gasification system before introducing it in the gasifier. The product gas that exits is
already at the elevated pressure and does not need compression prior to the gas turbine.
On the other hand, the product gas from an atmospheric pressure gasifier needs to be

40
compressed before injecting into the gas turbine. Since the mass and volume of the
product gas is much more than the fluidizing agent (air or steam), the atmospheric
pressure gasification system has higher parasitic loads than the pressurized gasifier
system (Turn, 1999a; Consonni & Larson, 1996a). Additionally, the reactor size is
smaller and the reaction rates between solids and gas are higher for a pressurized gasifier
system. However, the gasifier and the gas cleanup/conditioning system need to be built to
withstand high pressure and temperature, thus increasing costs. Also, as highlighted in
section 3.4, feeding systems for a pressurized gasifier are difficult to design and operate,
and may need a supply of pressurized inert gas, further increasing capital and operation
costs (Turn, 1999a). The atmospheric pressure gasifier system has a simpler feeding
system but needs a more rigorous gas cleanup/conditioning system to remove the tars that
would otherwise condense at the low operating temperature.
3.5.3 Direct vs Indirect Heated Gasifier Systems
Biomass gasifiers operate in one of two ways; with heat supplied directly by
partial oxidation of the fuel or indirectly through a heat exchange mechanism. In directly
heated gasifiers, air or oxygen (the latter is rarely used due to its high costs) is used as the
gasifying agent. The air-blown pressurized or atmospheric pressure fluidized bed
gasifiers are the most promising directly heated gasifier designs for BIGCC systems
(Consonni & Larson, 1996a). The indirectly heated gasifier design operates at a much
lower temperature (700-850oC). In an indirectly heated fluidized bed design, steam or an
inert gas like nitrogen is used as the gasifying/fluidizing agent. Heat is provided

41
indirectly by combusting char and heating the inert bed material in another reactor and
circulating it back to the gasifier reactor. In-bed heat exchangers have also been used.
This design produces a gas with higher energy content since it is not diluted by the
nitrogen in the air (Consonni & Larson, 1996a). It is mainly suited for applications that
synthesize the product gas into other chemical compounds and liquid fuels (Turn, 1999a).
3.6 Gas Cleanup/Conditioning
Gas cleanup/conditioning is one of the biggest challenges of a BIGCC system. In
the sugar industry cogeneration case, the end use application for the product gas is a gas
turbine. Hence, the gas turbine hardware imposes constraints on the level of condensable
tars, particulates and alkali metals in the product gas. Sulfur and chlorine are also
potential contaminants, but their concentration in biomass feedstocks such as bagasse is
low (Barroso et al., 2003).
3.6.1 Particulates
Particulates consist principally of ash and char. Particulates, even in relatively
small quantities, can cause turbine blade erosion. Hence, gas turbines have stringent
particulate limits. As an example, General Electric specifications for its turbines require a
total concentration of particulates below 1ppmw at the turbine inlet, which translates to
approximately 3-5 ppmw in the raw product gas (Consonni & Larson, 1996a). Fluidized
bed gasifiers produce a product gas with a particulate concentration of approximately
5000-10,000 ppmw (Consonni & Larson, 1996a). Hence, a BIGCC system requires a
high efficiency filtration system that captures the particulates in filter media like ceramic
42
candles or baghouse filters. Wet scrubbers, where the particulates are captured in a spray
of water can also be effective. However, they create the additional burden of waste water
treatment. Filtration systems may consist of cyclones that provide the primary particulate
removal. These can be followed by secondary methods that include hot gas filtering using
media like ceramic candles that operate at high temperatures (> 500oC), or bag house
filters that operate at low temperatures (< 300oC) (Turn, 1999a).
3.6.2 Alkali metals
During biomass gasification, alkali metals such as sodium and potassium present
in the biomass fuel are vaporized and leave the gasifier as part of the product gas. Alkali
metals corrode turbine blades. The estimated tolerable concentration of alkali vapors in
fuel gas for gas-turbine applications is very low (100-200 ppbw or less) at the gasifier
exit with corresponding several fold lower concentration allowable at the turbine inlet
(Williams & Larson, 1996). The actual concentration of the alkali metals in the product
gas far exceeds this limit. The removal of these metals can be carried out by cooling the
gas to 350-400oC before particulate filtering. The alkali metals condense on the solids
and are removed along with them in the filter. Alternately, wet scrubbing can be used,
which ensures complete removal, but needs an additional step of waste water treatment
(Consonni & Larson, 1996a; Turn, 1999a).
3.6.3 Tars
Tars are a complex mixture of condensable hydrocarbons, which includes single
ring to five-ring aromatic compounds along with other oxygen containing hydrocarbons
43
and complex polycyclic aromatic hydrocarbons (Devi et al., 2003). Typically, tars are
defined as including all organic contaminants with a molecular weight larger than
benzene. The amount and composition of the tars is dependant on the fuel, the pyrolysis
conditions and the secondary gas phase reactions. In a typical fluidized bed gasifier, tars
account for 2 to 4 percent by mass of the fuel (Waldheim & Carpentieri, 2001) or 0.5 to
1.5 percent by mass of the product gas (Consonni & Larson, 1996a). Tars can condense
when the product gas is allowed to cool (< 400-500oC) and can cause operating
difficulties by fouling heat exchanger surfaces in gas coolers, plugging particulate filters,
and constricting pipes and valves (Turn, 1999a; Waldheim & Carpentieri, 2001). Tar
removal/mitigation methods have been widely reported in literature (Milne et al., 1998;
Devi et al., 2003; Han & Kim, 2008). These methods are fairly complex and detailed. I
will only provide a summary of them here. Figure 3.4 shows the tar removal methods as
classified by Han and Kim (2008). Devi et al. (2003) classify these methods depending
on the location where the tar is removed; either in the gasifier itself (primary) or
downstream of the gasifier (secondary). In most cases, depending on the application,
more than one method is applied to ensure that the tar content in the product gas is within
acceptable limits.

Figure 3.4: Tar removal methods for gasification systems (Han & Kim, 2008).
Primary methods
choosing the appropriate
cracking within the gasifier reactor. The most important operating parameters include
temperature, pressure, gasifying medium (air, steam, oxygen), equivalence ratio (ER) and
residence time. The selection of these parameters also depends on the type of gasifier. Fo
a fluidized bed gasifier, a homogenous bed temperature profile and a well
bed are important. A high operating temperature (above 800
high carbon conversion of biomass and low tar content in the resultant product g
et al., 2003). Pressure, temperature and gasifying medium affect the tar composition.
Increase in ER decreases the tar content, but also reduces the heating value of the gas.
The actual gasifier design influences the tar content in the product gas
: Tar removal methods for gasification systems (Han & Kim, 2008).
Primary methods for tar removal include adjusting gasifier operating parameters,
choosing the appropriate gasifier design and, implementing catalytic and/or thermal
within the gasifier reactor. The most important operating parameters include
temperature, pressure, gasifying medium (air, steam, oxygen), equivalence ratio (ER) and
residence time. The selection of these parameters also depends on the type of gasifier. Fo
a fluidized bed gasifier, a homogenous bed temperature profile and a well
bed are important. A high operating temperature (above 800oC) is preferred to achieve a
high carbon conversion of biomass and low tar content in the resultant product g
, 2003). Pressure, temperature and gasifying medium affect the tar composition.
Increase in ER decreases the tar content, but also reduces the heating value of the gas.
The actual gasifier design influences the tar content in the product gas. But the design
44
: Tar removal methods for gasification systems (Han & Kim, 2008).
gasifier operating parameters,
catalytic and/or thermal
within the gasifier reactor. The most important operating parameters include
temperature, pressure, gasifying medium (air, steam, oxygen), equivalence ratio (ER) and
residence time. The selection of these parameters also depends on the type of gasifier. For
a fluidized bed gasifier, a homogenous bed temperature profile and a well-functioning
C) is preferred to achieve a
high carbon conversion of biomass and low tar content in the resultant product gas (Devi
, 2003). Pressure, temperature and gasifying medium affect the tar composition.
Increase in ER decreases the tar content, but also reduces the heating value of the gas.
. But the design

45
also depends on the application. In the case of a CFB gasifier, experiments with two stage
gasifiers with separate pyrolysis and gasification zones have reduced the tar content in
the product gas. However, this design has the challenge of maintaining a stable pyrolysis
zone in addition to the successful transfer of solids between the two reactors (Devi et al.,
2003; Han & Kim, 2008).
Catalytic and thermal cracking can be both primary and secondary methods,
depending on whether these methods are deployed within the gasifier or downstream of
it. Catalysts include Nickle-based catalysts, Alkali metal catalysts, dolomite, and novel
metal catalysts (Han & Kim, 2008). Only a few of these have been tried as active bed
additives inside a gasifier. Dolomite, which is a calcium magnesium ore, is the most
popular catalyst. It has been extensively studied in the gasification context, both as an in-
bed additive and in a secondary reactor. Catalysts can convert tar into useful gases like
carbon monoxide and hydrogen. However, they have their own limitations. Dolomite is
not very effective in converting heavy tars. It is also soft and can be easily eroded by the
fluidized bed inert material. This can produce fines that can carry over in the product gas.
Both nickle-based catalysts and dolomite have the disadvantage of being deactivated
significantly by carbon deposition. Alkali metal catalysts are susceptible to sintering.
Novel metal catalysts are in development and could overcome some of these
disadvantages (Han & Kim, 2008). In general, catalysts need to be inexpensive, resistant
to attrition, and remain active.
46
In thermal cracking, the raw product gas is heated to a high temperature, which
makes the tar molecules crack into lighter gases. The increase in reactor temperature can
be achieved by partially combusting the product gas by adding more oxidant. However,
this comes at the expense of overall efficiency (Han & Kim, 2008). The mechanism
methods, which are secondary methods downstream of the gasifier, are the same as that
for particulate removal.
In general, there are many options for gas cleanup/conditioning. However, there
are no established norms or proven treatment trains, since there have been no
continuously running commercial BIGCC systems.
Finally, I want to highlight two different approaches to gas cleanup/conditioning
depending on whether the gasification system is pressurized or operated at atmospheric
pressure. A pressurized gasification system generally uses hot gas filtering and cleaning,
and the product gas can be fed to the gas turbine after just the particulate removal. This is
possible if the particulate removal can take place at a sufficiently low temperature to
remove the alkali metals from the gas and at a sufficiently high temperature to maintain
the tars in vapor phase. In an atmospheric pressure gasification system, compression of
the product gas needs to take place at lower temperatures (typically 200oC). Hence, a cold
gas filtering system is implemented using filter media like conventional bag house filters.
In this case, tar removal/mitigation before particulate filtering is more critical due to the
low temperature (Waldheim & Carpentieri, 2001).
47
3.7 Power Generation
In this section, I present the power generation part of the BIGCC system that
includes the Brayton cycle and the bottoming steam Rankine cycle (SRC). The product
gas, after leaving the gas cleanup/conditioning system, is combusted in the Brayton cycle
and expanded through its gas turbine to run a generator. The heat in the gas turbine
exhaust is recovered in the heat recovery steam generator (HRSG) where steam is
generated to run the bottoming SRC and generate additional power.
The gas turbine or Brayton cycle can achieve a higher thermodynamic efficiency
than the conventional SRC because the peak cycle temperature of gas turbines (about
1250oC on the high side) is far higher than that for steam turbines (about 540oC on the
high side), providing an inherent thermodynamic advantage for the gas turbine (Williams
& Larson, 1996). There are two main types of gas turbines; heavy duty industrial and
aeroderivative. An important distinction between the two turbine types is that the
combustors of aeroderivative turbines operate at much higher pressures (22 bar or higher)
compared to those of heavy duty industrial turbines (12-16 bar). For a given turbine inlet
temperature, the turbine exhaust of heavy duty industrial turbines is hotter and capable of
producing more steam than is possible with aeroderivatives. Typically, the bottoming
SRC provides about one third of the total output of combined cycles utilizing industrial
turbines. For aeroderivatives, the bottoming SRC accounts for about one-fifth the total
combined cycle output (Williams & Larson, 1996). Hence, in the context of a
cogeneration system for a sugar factory, industrial turbines may be better suited, since

48
their higher temperature exhaust would generate enough steam to satisfy the process
steam demand. However, aeroderivative turbines offer the advantages of higher
efficiency and lower capital costs, and should be considered if their use in a combined
cycle can satisfy the process steam demand of a sugar factory.
Most gas turbines today are designed for natural gas. The product gas from the
gasifier has much lower energy content (4-5 MJ/Nm3 for directly heated gasifiers and
~10 MJ/Nm3 for indirectly heated gasifiers) than natural gas (35-40 MJ/Nm3). Hence, gas
turbine combustors and control valves need modifications to accommodate larger
volumetric flows of gas to achieve an equivalent energy input (Turn, 1999a; Consonni &
Larson, 1996). There has been some history of industrial turbines running on low energy
content gas, with heating value as low as 3 MJ/Nm3 (Consonni & Larson, 1996). There
has been no commercial operating experience with low energy content gas in
aeroderivative gas turbines. General Electric has successfully tested the LM2500
aeroderivative gas turbine with a gas with a heating value as low as 3.9 MJ/Nm3.
Rodrigues et al. (2007) provide more strategies to successfully utilize low energy content
gas in gas turbines including derating, air extraction from the compressor and
modifications to the geometry of the turbines to accommodate the higher volumetric
flows of gas.
The HRSG for a BIGCC system is similar to that of a conventional natural gas
based combined cycle. Usually, in conventional medium to large combined cycles, steam
is produced at two or three pressure levels due to higher thermal efficiency gains.

49
However, for a BIGCC system, a higher temperature HRSG exhaust can be used to dry
the fuel. In that case, a single pressure HRSG could be used (Rodrigues et al., 2007).
The bottoming SRC for a BIGCC is similar to the one described in section 2.4. The size
of this SRC is much smaller that that in a direct combustion Rankine cycle system, since
it solely operates on the gas turbine exhaust. Both back-pressure and condensing-
extraction steam turbines could be used.
3.8 BIGCC Technologies and Projects
BIGCC is a relatively new technology and is still in its development stage. There
is no commercial BIGCC project currently running anywhere in the world. However,
there have been a few projects that have come close to commercialization. Some of the
projects were set up as demonstration and experimental projects, while others were set up
as commercial ventures but had to shut down for various reasons. In this section, I
describe the four major technology approaches and the projects associated with them. I
will also present the key players involved in these projects and their current status. This
will provide a sense of the status of the overall BIGCC technology if it were to be
adopted for cogeneration in the sugar sector.
3.8.1 Skydkraft-Foster Wheeler Technology
Sydkraft AB5 of Sweden and Foster Wheeler Energy International Inc.6 , under
the joint venture company of Bioflow Ltd. developed and built the first BIGCC plant in
5 Sydkraft is now E.ON Sverige AB, since it was acquired by E.ON AG in 2001. It is Sweden’s second largest utility company.

50
the world. The Värnamo demonstration plant (Figure 3.5) was commissioned in 1993 and
generated 6 MWe of electricity and 9 MWth of heat (Ducente, 2006).
Wood, which is the primary fuel, is delivered to the gasifier via a lock hopper
system, using pressurized nitrogen. This technology utilizes a refractory-lined,
pressurized, circulating fluidized bed gasifier operating at 950-1000oC and approximately
20 bar (Turn, 1999b). The product gas, after exiting the gasifier, is cooled in two stages
using radiant and convection coolers. It is then cleaned in a hot gas ceramic filter, before
being fed to the combustor of the gas turbine. The gas turbine has an electricity
generation potential of 4 MWe. The flue gas from the exhaust of the gas turbine passes
through a single-pressure type HRSG that operates at a pressure of 40 bar on the steam
side. The superheated steam at 40 bar generates 1.8 MWe of electricity in the bottoming
SRC and 9 MWth energy for district heating (Ducente, 2006).
Figure 3.5: The Värnamo biomass integrated gasifier combined cycle plant. Image source: Chrisgas
6 Development efforts were first started between Sydkraft and Ahlstrom Pyropower in 1991. Ahlstrom Pyropower was bought over by Foster Wheeler Energy International Inc. in 1995 (Turn, 1999b, Ståhl, 2004, Ducente, 2006)

51
The Värnamo plant was in operation from 1993-2000. The system was not
designed for optimal performance but to demonstrate the feasibility of the pressurized
BIGCC technology (Turn, 1999b). The plant accumulated 3600 hours with the gas
turbines operating entirely on the gasifier product gas (Ducente, 2006). Since 2004, the
plant is working with the Chrisgas project7 to demonstrate the production of a hydrogen-
rich gas from biomass feedstocks (Ståhl et al., 2004). The Sydkraft-Foster Wheeler
technology is one of the nearest to developing a commercial large scale BIGCC plant.
3.8.2 TPS Termiska Technology
TPS Termiska Processor AB is a Swedish research and development company. 8
The TPS technology uses an air-blown, circulating fluidized bed (CFB) gasifier that
operates at atmospheric pressure. The gasifier is followed by a catalytic tar cracker that
uses dolomite as the bed media. The product gas then passes through a gas filter and a
wet scrubber (Turn, 1999b).
The first large scale TPS plant was set up in Greve-in-Chianti, Italy. Two CFB
gasifier units, each with a capacity of 15 MWth produce product gas from refuse derived
fuels (RDF). This product gas is not used in a combined cycle, but burned in a boiler to
generate steam that runs a 6.7 MWe condensing steam turbine.
The first large scale BIGCC plant using TPS technology was the 8 MWe Arable
biomass renewable energy (ARBRE) project. Construction on the plant, located in Selby,
7 Chrisgas is a research and development project with the aim of demonstrating the production of a clean hydrogen-rich synthesis gas from biomass. The project is financed by the European Commission and the Swedish Energy Agency. www.chrisgas.com. 8 Since 2007, TPS is owned by ACAP Invest, a risk capital company based in Sweden.
52
United Kingdom, started in 1998. The plant used wood in the form of short rotation
willow coppices. The product gas was combusted in a modified Alstom Power Typhoon
gas turbine (Piterou et al., 2008). However, the plant never reached commercial operation
and work stopped in 2002 due to the withdrawal of the financial backers, bankruptcy of
the turnkey operator, and technical problems with the gasification technology, which
could not be resolved within the financial and time constraints of the project (Piterou et
al., 2008). The catalytic tar cracker of gas cleanup/conditioning system did not operate as
expected. There were also problems in integrating the individual systems that could not
be resolved within the time frame of the project (Piterou et al., 2008).
TPS was also involved in two major projects in Brazil. The first one was the 32
MWe Brazilian wood-fired BIGCC demonstration project. The initial project participants
were Electrobras, the government holding company for local utility companies;
Companhia Vale do Rio Doce, an iron ore producer and owner of large forest holdings;
Shell Brazil, an owner of a large plantation in north-eastern Brazil; and Companhia Hidro
Eletrica do Sao Franscisco, the government owned power generation and distribution
company in north-eastern Brazil; and Fundacao de Ciencia e Tecnologia, a state owned
research institute (Turn, 199b). Funds for the project were provided by the World Bank
and the United Nations through a program called Global Environment Facility. Both TPS
and Bioflow (Skydkraft AB) were selected for conducting pilot tests on eucalyptus wood
during the first two phases of the project. Based on these tests and their conceptual
design, TPS was selected to provide the gasification technology. General Electric was

53
selected to provide their LM 2500 gas turbine (Turn, 1999b). The project was to be
located in Southern Bahia. However, the project did not proceed beyond the design stage,
due to the high capital cost and a downturn in the economy (Williams, 2004).
The second TPS project in Brazil was to integrate the TPS BIGCC technology
into a Brazilian sugar/ethanol factory, using bagasse and cane trash as fuel. This project,
initiated in 1997, was an extension of the Brazilian wood-fired BIGCC project. The
Copersucar Technology Center (CTC) in Brazil was in charge of project technical
coordination (Hassuani et al., 2005). TPS ran several tests on bagasse and trash in its 2
MW pilot plant in Sweden. CTC conducted a comprehensive feasibility study on the
integration of BIGCC into a sugar factory. The scope of the study ranged from the
potential and economics of recovering cane trash to pilot tests on using bagasse and trash
in the TPS gasifier. The details are outlined by Hassuani et al. (2005). Unfortunately, this
project was discontinued after the failure of the Brazilian wood-fired BIGCC project
described above.
3.8.3 Institute of Gas Technology – Renugas Technology
The Renugas process, developed by the Institute of Gas Technology (IGT) is a
pressurized, bubbling fluidized bed gasifier, which utilizes both air and steam as
fluidizing agents. Two entities hold the license for the Renugas technology: Carbona Inc.
and Pacific International Center for High Technology Research (PICHTR) (Turn, 1999b).
The development of the Renugas technology was pursued at the Biomass Gasifier
Facility on the site of the HC&S sugar factory in Paia, Hawaii. The participants in the

54
project included PICHTR, IGT, HC&S, the Ralph M. Parsons Company, and the Hawaii
Natural Energy Institute (HNEI) at the University of Hawaii. The project, which began in
1993, was sponsored by the United States Department of Energy, the State of Hawaii,
and the University of Hawaii. The system was designed to consume approximately 90 dry
tons of bagasse per day. The bagasse would be dried to 20 percent moisture content
before being fed to the gasifier. Both plug screw as well as lock hopper feeders were tried
at the facility. Limited testing of the system determined that the desired fuel feed could
not be attained with the lock hopper feed system, while the plug screw feeder was not
designed to maintain the required 20 bar pressure of the gasifier (Turn, 1999b).
Eventually, due to financial and technical reasons, the plant was discontinued in 1998.
Carbona continues to operate a Renugas gasifier pilot plant in Tampere, Finland,
which was commissioned in 1993. The plant operates on coal and biomass including
wood, paper mill wood waste, forest residue, willow, and straw. The product gas is
burned for district heating and not power generation. Carbona is in the process of
planning and developing other large scale projects.
3.8.4 Batelle-Ferco Technology
Batelle Columbus Laboratories has been developing an indirectly-heated
gasification technology to produce a medium heating value gas from biomass. The
technology features two atmospheric pressure CFBs with solids exchange between the
two reactors. The biomass is fed to the first CFB, which is operated as a steam blown
gasifier. The bed material and unreacted char exiting the gasifier are directed to the
55
second CFB. This second CFB uses air as the fluidizing agent and operates as a
combustor to heat the bed material. The hot bed material is recirculated back to the
gasifier, where the fuel undergoes pyrolysis and gasification (Turn, 1999c).
The Batelle technology was demonstrated at the McNeil biomass power station in
Burlington, Vermont, with funding provided by Future Energy Resources Company
(FERCO). The gasification system with a 45 MW thermal input capacity was installed
next to the existing 50 MW wood-fired direct combustion SRC system. The product gas
was co-fired in the existing plant with wood chips to generate steam. Plans were being
made to operate an 8 MW turbine on the product gas (Turn 1999c). However, due to
financial reasons, the project is presently at a standstill.
The review of these four major gasification technologies and the status of their
projects indicate that BIGCC technology is still in the development stage. However,
BIGCC systems may have a much higher electricity generation potential than direct
combustion SRC systems (Ensinas et al., 2007; Larson et al., 2001). With that in mind, it
is important to evaluate the potential of BIGCC cogeneration systems in comparison to
advanced high pressure direct combustion SRC systems for a sugar factory.

56
CHAPTER 4. COGENERATION SYSTEM COMPARISON METHODOLOGY
In this chapter, I describe the methodology for the technical comparison between
the two advanced cogeneration systems for the sugar industry; a high pressure direct
combustion steam Rankine cycle (SRC) system and a biomass integrated gasifier
combined cycle (BIGCC) system. The criteria for the comparison are the net electricity
generation potential of the two systems and the subsequent export of surplus electricity to
the electric grid. In addition, it is important to understand the capability and limitations of
each system in satisfying the factory in-house demand for low pressure steam for sugar
and/or ethanol processing. For this purpose, I developed two steady-state thermodynamic
models that balance the mass and energy flows for a sugar and ethanol factory. The first
model simulates an SRC cogeneration system, while the second simulates a BIGCC
cogeneration system. I use these models to simulate an Indonesian sugar factory as well
as the two advanced cogeneration systems if they were implemented at that factory. I
compare these scenarios in terms of their efficiency and electricity generation potential as
well as the minimum bagasse required for each cogeneration option to satisfy the process
steam demand. In addition to a technical comparison, I provide an economic comparison
based on gross revenues for a sugar factory from its sales of surplus electricity.
4.1 Case Study of an Indonesian Sugar Factory
In modeling a typical factory, I have used data from an Indonesian sugar factory
integrated with an ethanol distillery. The factory processes 1.8 million tons of sugar cane
every year. It utilizes a direct combustion SRC cogeneration system. Back-pressure

57
turbines (BPT) provide power to the mechanical drives for two cutters, one shredder and
five mills, as well as to the auxiliary equipment of the cogeneration system - five fans and
three pumps. Except for the shredder, all of these turbines are single-stage. The
cumulative mechanical power generated by these turbines is approximately 8.9 MW.
BPTs also power three electric generators that provide electricity to the factory, ethanol
distillery and domestic loads like offices and housing. The total rated electricity
generation capacity is 14.4 MW, but the actual steady state electricity generation is
approximately 9 MW (Indonesian Sugar Factory, 2007). The factory is not connected to
the electric grid and does not generate surplus electricity. The nearest local grid is the
South Sumatran grid and the local utility is Perusahaan Listrik Negara (PLN). I present
the data from the sugar factory that are used as input parameters for the thermodynamic
models in the next chapter.
4.2 Thermodynamic model
In this section, I summarize the development of the two steady-state
thermodynamic models that simulate the mass and energy balances for a sugar and
ethanol factory. The first model is a SRC cogeneration system, while the second is a
BIGCC cogeneration system. To develop these models, I used Microsoft Excel® along
with three add-in programs: PowerSim9, Water9710 and Solver11. Using these models, I
9 PowerSim is an add-in program for Microsoft Excel® developed by FinnFuture Oy. It provides a set of functions for calculating thermodynamic and transport properties for water, steam and gases. 10 Water97_v13 is an add-in program for Microsoft Excel®, which provides a set of functions for calculating thermodynamic and transport properties of water and steam using the industrial standard IAPWS-IF97.

58
compared the two cogeneration systems in terms of efficiency, steam and power
generation for various input parameters. Please refer to Appendix A, Appendix B and
Appendix C for the detailed derivations of the mass and energy balances for these
models.
The main input to both models is the rate of bagasse delivered to the cogeneration
system. If this input quantity is lower than that required to meet the process steam
requirement, the macro subroutines12 in the models compute the minimum bagasse input
required and replace the initial input with the new computed bagasse input. The total
energy generation is computed based on this new quantity. If the initial input is higher
than the minimum bagasse input required, then the macros compute the total energy
generation based on that initial input. In either case, if the bagasse input, either the
minimum required to satisfy process steam requirement or that entered by the user, is
higher than the rate generated by the factory through cane crushing, then the solution is
unfeasible. For a balanced sugar/ethanol factory, the bagasse input to the cogeneration
system should be able to satisfy the process steam requirement and be less than or equal
to the rate of bagasse generated during cane crushing.
11 Solver is an add-in program developed by Microsoft Corporation for Microsoft Excel® and is part of a suite of commands called the what-if analysis tools. It is used to find an optimal value for a formula in one cell. 12 A macro subroutine is a series of commands and functions that can be created and run in Microsoft Excel®.

59
4.2.1 Rankine Cycle Model
Figure 4.1 shows the schematic of the direct combustion steam Rankine cycle
cogeneration system integrated with a sugar factory. The key for the schematic is
provided in Table 4.1.
This model uses either back-pressure turbines (BPTs) for electricity generation or
condensing-extraction steam turbines (CESTs) depending on the user input. The mass
and energy for the factory are balanced based on whether the factory is stand-alone or
exports electricity. In the stand-alone case, since the factory is not connected to the
electric grid, the demand for both high pressure and low pressure steam is fixed. If the
low pressure steam demand is higher, then a portion of the high pressure steam is
expanded through an exhaust valve to provide additional low pressure steam. If the high
pressure steam demand is higher, then the excess steam is vented out to the atmosphere in
the case of BPT or expanded to below atmospheric pressure in case of CEST. When the
factory is grid-connected, then the excess high pressure steam is used to generate surplus
electricity, which is exported.
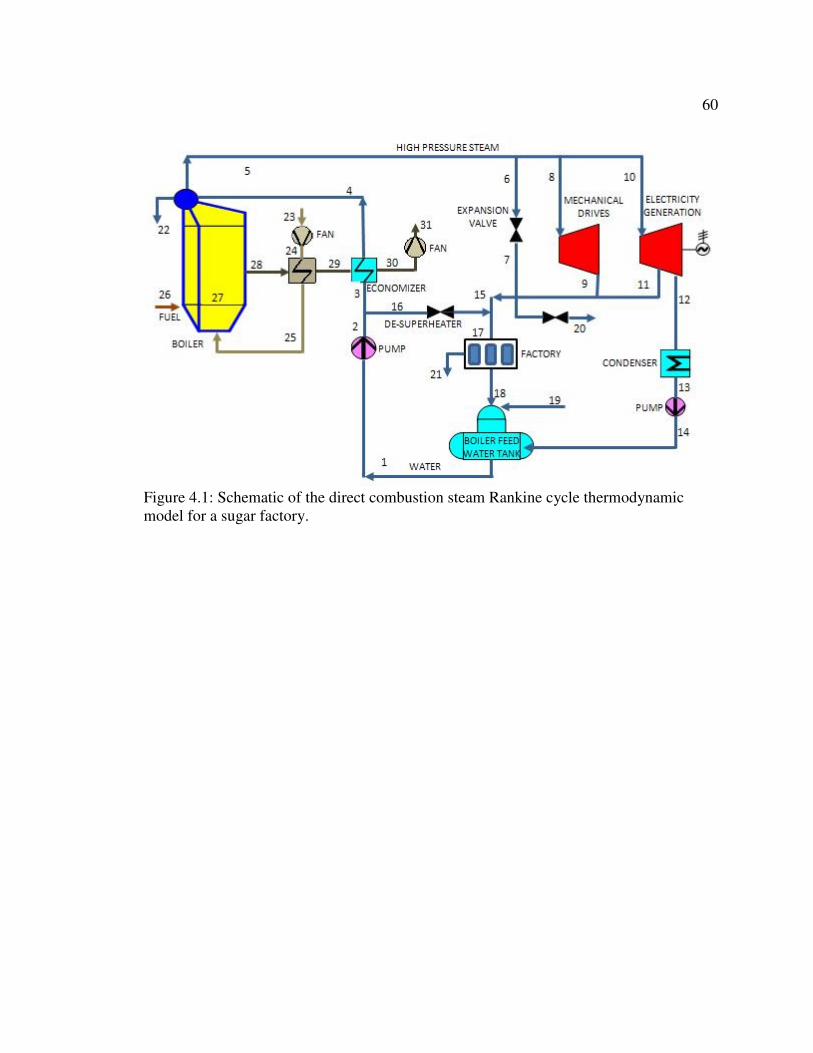
60
Figure 4.1: Schematic of the direct combustion steam Rankine cycle thermodynamic model for a sugar factory.
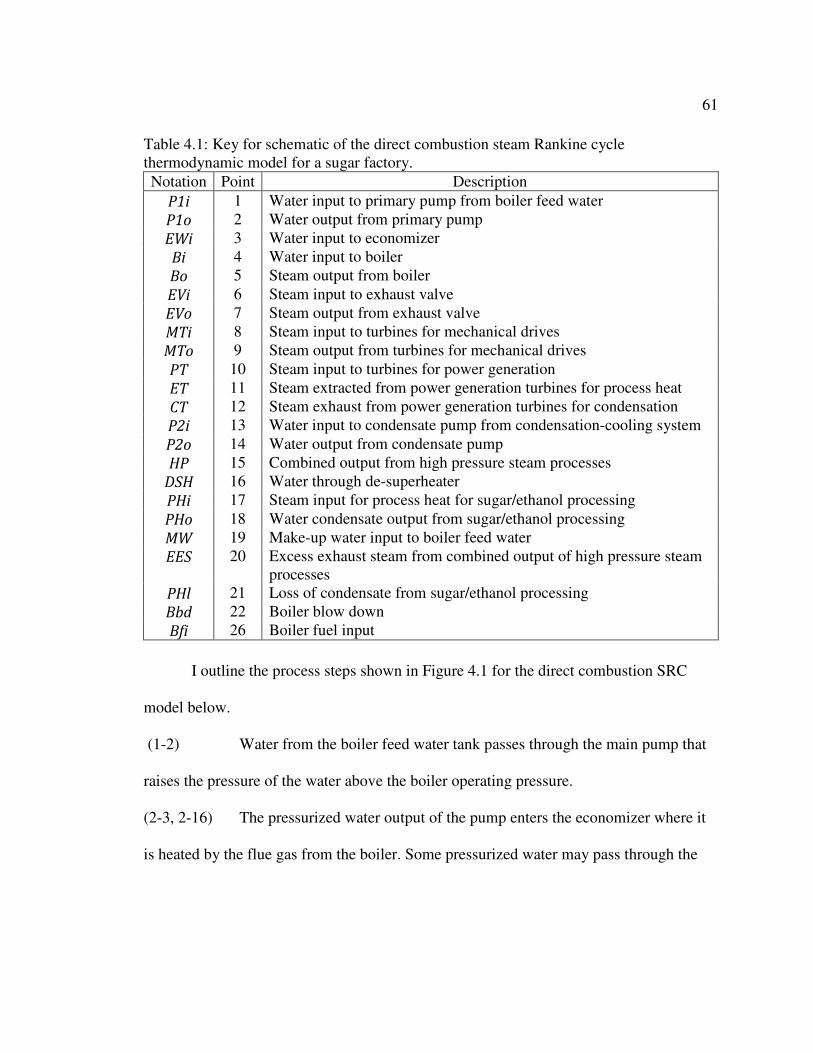
61
Table 4.1: Key for schematic of the direct combustion steam Rankine cycle thermodynamic model for a sugar factory.
Notation Point Description
P1i 1 Water input to primary pump from boiler feed water
P1o 2 Water output from primary pump
EWi 3 Water input to economizer
Bi 4 Water input to boiler
Bo 5 Steam output from boiler
EVi 6 Steam input to exhaust valve
EVo 7 Steam output from exhaust valve
MTi 8 Steam input to turbines for mechanical drives
MTo 9 Steam output from turbines for mechanical drives
PT 10 Steam input to turbines for power generation
ET 11 Steam extracted from power generation turbines for process heat
CT 12 Steam exhaust from power generation turbines for condensation
P2i 13 Water input to condensate pump from condensation-cooling system
P2o 14 Water output from condensate pump
HP 15 Combined output from high pressure steam processes
DSH 16 Water through de-superheater
PHi 17 Steam input for process heat for sugar/ethanol processing
PHo 18 Water condensate output from sugar/ethanol processing
MW 19 Make-up water input to boiler feed water
EES 20 Excess exhaust steam from combined output of high pressure steam processes
PHl 21 Loss of condensate from sugar/ethanol processing
Bbd 22 Boiler blow down
Bfi 26 Boiler fuel input
I outline the process steps shown in Figure 4.1 for the direct combustion SRC
model below.
(1-2) Water from the boiler feed water tank passes through the main pump that
raises the pressure of the water above the boiler operating pressure.
(2-3, 2-16) The pressurized water output of the pump enters the economizer where it
is heated by the flue gas from the boiler. Some pressurized water may pass through the

62
de-superheater valve to de-superheat the exhaust of the high pressure steam processes and
bring it to a saturated steam state for use in the sugar/ethanol factory.
(3-4) Pressurized water is heated in the economizer by the flue gas from the
boiler.
(4-5-22) Water is heated in the boiler to superheated state, from where it is split
between steam turbines for mechanical drives and power generation. A portion of it may
pass through an expansion valve. Some steam is lost via boiler blowdown. Boiler
blowdown is the removal and replacement of water from a boiler to minimize scaling and
corrosion, as well as to remove suspended solids in the system.
(6-7) Expansion valve/s are used in stand-alone sugar factories that are not
connected to the electric grid. When the demand for high pressure steam to run
mechanical drives and generate electricity for the factory is lower than the demand for
low pressure steam for sugar/ethanol processing, then the balance steam is expanded
through the expansion valve.
(8-9) This turbine represents all the turbines used to power mechanical drives
for equipment in the sugar factory like cutters, shredders and mills, as well as boiler feed
pumps, forced and induced draft fans. If variable speed electric drives are used to run this
equipment, then these turbines are not used.
(10-11-12) This turbine represents all the turbines that drive electric generators.
Steam may be extracted at 11 to provide process heat for the sugar/ethanol processing. In
63
case of a CEST scenario, the remaining steam is expanded to below atmospheric pressure
and exits at 12.
(12-13-14) The steam that exits at 12 is condensed to saturated water and is pumped
to the boiler feed water tank.
(7-9-11-20-15) Steam that exits from the high pressure equipment of expansion valves,
mechanical drive turbines and electricity generation turbines combines at 15. For stand-
alone sugar factories, if the high pressure steam demand is higher than that for low
pressure steam, then the excess steam can be vented out at 20.
(15-16-17) The combined exhaust of the high pressure steam equipment can be in
superheated state. The most effective heat transfer from steam to the various sugar and
ethanol processes takes place when process steam is near saturation and the latent heat of
the steam is transferred as it changes from vapor to liquid. Hence, the process steam
required at 17 is assumed to be in a dry saturated state. As explained earlier, the de-
superheater mixes pressurized water from the main pump with the high pressure steam
exhaust to bring it to a dry saturated steam state. If the combined exhaust of the high
pressure steam equipment is part liquid and part vapor, in other words, has a quality of
less than one, then the actual process steam consumption at 17 is higher such that its total
enthalpy is equal to that of the dry saturated process steam requirement of the
sugar/ethanol factory.
(17-21-18) Low pressure saturated steam enters the factory at 17 and exits at 18 in a
saturated liquid state. Condensate loss in the factory is accounted at 21.

64
(18-19-14-1) The condensate from the factory enters the boiler feed tank at 18. Make up
water is added to the tank to compensate for excess high pressure steam exhausted at 20,
loss of condensate in the factory at 21 and loss of steam via boiler blowdown at 22.
(23-24-25) Ambient air is blown into the boiler system using forced draft fans. The air
passes through the air pre-heater before entering the boiler, where it gets heated by the
flue gas from the boiler.
(26-27-28) Wet bagasse enters the boiler at 26 and is combusted inside the boiler at
27. The flue gas leaves the boiler at 28. For this thesis, I have not modeled the
combustion process. I have assumed a user defined fixed efficiency for the boiler.
(28-29-30-31) The flue gas passes through the air pre-heater heating the input air to the
boiler and then the economizer, where it heats the input water to the boiler. Induced draft
fans provide the draft for the flue gas through the system. The air pre-heater and
economizer are designed to recover waste heat from the flue gas. Both increase the
efficiency of the boiler. For this thesis, I have not included these components in the
model. However, their absence can be compensated by assuming a higher efficiency for
the boiler.
4.2.2 BIGCC model
Figure 4.2 shows the schematic of the BIGCC cogeneration system integrated into
a sugar factory. The key for the schematic is provided in Table 4.2. In modeling the
BIGCC system, I assume that the factory will always be connected to the electric grid and
be capable of exporting surplus electricity. I also assume that the sugar processing

65
equipment like cutters, shredders and mills, as well as the cogeneration auxiliary
equipment like pumps, fans and compressors are powered by variable speed electric
drives and not by steam. Although the model is capable of simulating a pressurized
gasifier system, I assume an atmospheric pressure gasifier with air as an oxidizing and
fluidization agent.
Figure 4.2: Schematic of the biomass integrated gasifier combined cycle thermodynamic model for a sugar factory.

66
Table 4.2: Key for schematic of the biomass integrated gasifier combined cycle thermodynamic model for a sugar factory.
Notation Point Description
ACi 1 Air input to main air compressor - Brayton cycle
ACo 2 Air output from main air compressor - Brayton cycle
PGCo 3 Product gas output from product gas compressor – Brayton cycle
GTi 4 Combusted air/gas input to gas turbine – Brayton cycle
GTo 5 Exhaust from gas turbine, Input to HRSG – Brayton cycle
HRSGe 6 Flue gas exhaust from HRSG, input to dryer
P1o 7 Water output from main pump
HRSGi 8 Water input to heat recovery steam generator
HRSGo 9 Steam output from heat recovery steam generator
PT 10 Steam input to turbines for power generation
ET 11 Steam extracted from power generation turbines for process heat
CT 12 Steam exhaust from power generation turbines for condensation
P2i 13 Water input to condensate pump from condensation-cooling system
P2o 14 Water output from condensate pump
HP 15 Combined output from high pressure steam processes
DSH 16 Water through de-superheater
PHi 17 Steam input for process heat for sugar/ethanol processing
PHo 18 Water condensate output from sugar/ethanol processing
MW 19 Make-up water input to boiler feed water
P1i 20 Water input to main pump from boiler feed water - SRC
EVi 21 Steam input to exhaust valve
EVo 22 Steam output from exhaust valve
PHl 23 Loss of condensate
FACi 24 Air input to fluidizing air compressor
FACo 25 Air output from fluidizing air compressor, input to gasifier
GFsi 26 Steam input to gasifier
GFgo 27 Product gas output from gasifier, input to gas cleanup system
PGCi 28 Product gas input to product gas compressor, output from gas cleanup system
GFslo 29 Slag output from gasifier
Dge 30 Flue gas exhaust from dryer
Dwfi 31 Wet fuel input to dryer
Dfb 32 Fuel burned in dryer
GFfi 33 Input fuel to gasifier
67
I provide a description of the process steps for the BIGCC model below.
(1-2) Ambient air is compressed in the main air compressor of the Brayton
cycle.
(2-3-4) The compressed product gas from the gasifier is mixed with the
compressed air and combusted in the combustor of the Brayton cycle.
(4-5) The combusted air-gas mixture is expanded through a gas turbine. The gas
turbine drives an electric generator to produce electricity. The hot air-gas mixture is
exhausted at near atmospheric pressure.
(5-6) The exhaust of the gas turbine, in other words the flue gas, passes through
the heat recovery steam generator (HRSG), providing heat to the bottoming SRC to
generate steam.
(8-9) Pressurized water enters the HRSG and is converted into steam to run the
bottoming SRC to generate additional electricity. Part of the low pressure exhaust steam
is extracted and used to provide process heat for sugar/ethanol processing. The rest of the
steam, if any, is expanded to below atmospheric pressure to provide additional work.
(7,10 to 23) The bottoming SRC of the BIGCC system and its integration into the
factory is the same as that of the direct combustion Rankine cycle model. Please note that
some of the points are numbered differently.
(24-25) Ambient air is compressed in the fluidizing air compressor and fed into the
gasifier as a fluidization and oxidizing agent. The pressure of the fluidizing air is above
the operating pressure of the gasifier.
68
(26) Steam can be fed into the gasifier. For the purpose of this research, I have
assumed zero steam input to the gasifier.
(27-28) Product gas exits the gasifier at the same pressure as the gasifier operating
pressure. It passes through the gas cleanup/conditioning system where tar compounds,
particulates and alkali metals are removed from the gas stream. For this model, I have
assumed a temperature or enthalpy drop in the product gas as it passes through this
system. For this thesis, I have not assumed any heat recovery from this enthalpy drop. In
effect, this energy is assumed as lost.
(29) This is the slag output from the gasifier. The slag consists of the ash
content from the bagasse and the leftover char from the gasifier.
(6-30, 31-32-33) The exhaust flue gas from the HRSG passes through the dryer, entering
at 6 and exiting at 30. Wet bagasse is fed to the dryer at 31. If the energy in the flue gas is
not enough to dry the bagasse to the required moisture content, some bagasse that has
been dried (32) is burned in the dryer to provide additional heat. The rest of the dried
bagasse is fed to the gasifier.
4.3 Scenarios
In developing the scenarios for the models, I have chosen the input parameters
based on various literature sources as well as some from the Indonesian sugar factory
specifications and annual reports. Please refer to Appendix D and Appendix E for details
of the input parameters and their sources. I compare these scenarios based on different
key output parameters to evaluate their advantages and disadvantages.

69
The full potential of the advanced cogeneration systems cannot be realized
without the utilization of CESTs and reductions in the high and low pressure steam
demands of a sugar factory. CESTs can extract more energy from steam than BPTs.
Unlike BPTs where all the steam exhausts at near atmospheric pressure and is used for
process needs, CESTs provide the ability to extract only the required amount of process
steam at the required pressure. The rest of the steam is expanded to below atmospheric
pressure for additional work. This is particularly relevant when the sugar factory is
connected to the grid and there is no fixed upper limit for electricity generation dictated
by a fixed demand.
The demand for high pressure steam within the sugar factory is reduced by
replacing steam turbines for mechanical drives with variable speed electric drives for
sugar processing and cogeneration equipment. As explained in section 2.5, using variable
speed electric drives in conjunction with the power turbines can be more efficient than
the single stage steam turbines used for mechanical drives.13 In addition, reductions in the
low pressure steam demand for sugar and ethanol production can translate to more steam
being available for electricity generation. This is especially true when CESTs are used.
Lower low pressure steam demand means less amount of steam is extracted from the
turbines and a higher amount of steam is expanded to below atmospheric pressure. For
these reasons, the use of CESTs, variable speed electric drives and reductions in process
steam consumption provide additional benefits to implementing advanced cogeneration
13 At the Indonesian sugar factory, all except one of the steam turbines powering the mechanical drives are single-stage. The shredder uses a multi-stage steam turbine, similar to the ones driving the electric generators.

70
systems. To illustrate the advantage of implementing these measures, I compare the
existing factory scenario to same pressure CEST cogeneration systems with each
additional steam reduction measure (Scenarios 1, 2 and 3 in Table 4.3).
Table 4.3: Scenarios for comparison between existing Indonesian sugar factory utlizing back-pressure turbines (BPTs) and grid connected factory scenarios with condensing-extraction steam turbines (CESTs), variable speed electric drives and reduced process steam consumption.
Scenario Steam Parameters Turbine
Type Drives for Equipment
Process Steam Demand
Existing Factory
Boiler – 30 bar, 340oC
BPT Mechanical/
Steam 530 kg/tc
1 SRC Boiler –
30 bar, 340oC CEST
Mechanical/ Steam
530 kg/tc
2 SRC Boiler –
30 bar, 340oC CEST
Variable speed electric
530 kg/tc
3 SRC Boiler –
30 bar, 340oC CEST
Variable speed electric
350 kg/tc
4 Advanced
SRC* Boiler –
80 bar, 480oC CEST
Variable speed electric
350 kg/tc
5 BIGCC** Heat Recovery
Steam Generator- 30 bar, 340oC
Gas Turbine + CEST
Variable speed electric
350 kg/tc
*Scenario 4 is an advanced high pressure direct combustion steam Rankine cycle (SRC) system. **Scenario 5 is a biomass integrated gasifier combined cycle (BIGCC) system. The pressure ratio for the gas turbine of the BIGCC system is 15. The factory is grid-connected for scenarios 1-5.
71
In addition, I compare these scenarios to two advanced cogeneration system
scenarios: a high pressure direct combustion SRC system and a BIGCC system. Both
advanced cogeneration systems use CESTs for steam turbines. I also assume a low
pressure process steam requirement of 350 kg/tc for the factory and the use of variable
speed electric drives for sugar processing and auxiliary cogeneration equipment. For the
high pressure direct combustion SRC system, I assume a boiler pressure of 80 bar, which
has been considered in many articles in the literature as a high pressure advanced
cogeneration system for a sugar factory (e.g. Larson et al., 2001, Ensinas et al., 2007,
Beeharry, 1996, Coelho et al., 1997). For the BIGCC scenario, I assume an air-based
atmospheric pressure gasification system, similar to the TPS technology. The gas turbine
pressure ratio of 15 that I use in the BIGCC base case scenario represents a relatively
high pressure ratio for an industrial turbine. Aero-derivative turbines have even higher
turbine pressure ratios (> 20). I assume a low pressure HRSG system operating at 30 bar,
340oC. I perform a sensitivity analysis to analyze the effect of turbine pressure ratios as
well as different HRSG pressures on the net electricity generation potential and the
minimum bagasse required to satisfy process steam demand.
4.4 Key Parameters for Scenario Comparisons
I compare the scenarios described in section 4.3 in terms of their electricity
generation potential by assuming the rate of bagasse consumption by the cogeneration
systems to be the same as the present steady-state rate of bagasse consumption of the
existing Indonesian sugar factory. I determined the steady-state rate of bagasse
72
consumption by computing the mass and energy balance for the existing stand-alone
factory using the SRC model. Assuming this rate of bagasse comsumption for all
scenarios allows a fair comparison between the five improved scenarios with the existing
Indonesian sugar factory.
The principal comparison explored in this thesis is between the two advanced
cogeneration systems. I use two methods for comparing the advanced cogeneration
scenarios. The first method compares the electricity generation potential of the
cogeneration systems by assuming the rate of bagasse consumption by the cogeneration
systems to be the same as the yield rate of bagasse from cane crushing. This is the
maximum possible rate of bagasse consumption by the cogeneration systems. In reality,
bagasse is not used at the same rate it is generated through cane crushing. Some of it is
stored for use during the off-season to provide steam and/or electricity to the distillery
and domestic loads. However, assuming this input rate provides a way to compare the
maximum electricity generation potential for the two scenarios. The second method of
comparison assesses the capability of the cogeneration system to deliver low pressure
steam for sugar and/or ethanol processing. For that, I compare the minimum rate of
bagasse input needed to satisfy the process steam demand. A smaller amount of bagasse
required to satisfy the process steam demand during the cane crushing season results in a
greater potential of that cogeneration system to run during the off-season to provide
steam and electricity for the distillery and domestic loads as well as possible additional
electricity exports.

73
Currently, the Indonesian sugar factory provides electricity for its own operations,
the ethanol distillery and domestic loads. In estimating the electricity export potential for
the various scenarios, I assume the same electricity consumption for the distillery and the
domestic loads (offices, housing etc). For the electricity consumption in the factory, I
assume two loads: one for the cogeneration system that includes pumps, fans and/or
compressors, and the other for sugar processing comprising of the original load as well as
the variable speed electric drives for the cutters, shredders and mills.
����� �� !"�#!#"$ � % �&"#�% '�( ) ��* % �&"#�% +$�" � ,&�&�#"#! -�&. � +/*&� ,��! ��#%* ��%�/�0"#�%� 1#�"#�� �$ ��%�/�0"#�% � 1�� �"#! ��%�/�0"#�% � �� !"�#!#"$ �20��"�
Since the electricity consumption for sugar processing, the distillery and domestic
loads is the same for all scenarios, I use the net electricity generation for each of the
scenarios as the principal comparative parameter to assess the potential for electricity
generation.
3 " �� !"�#!#"$ � % �&"#�% '�( ) ����� �� !"�#!#"$ � % �&"#�% � ��* % +$�" � ,&�&�#"#! -�&.
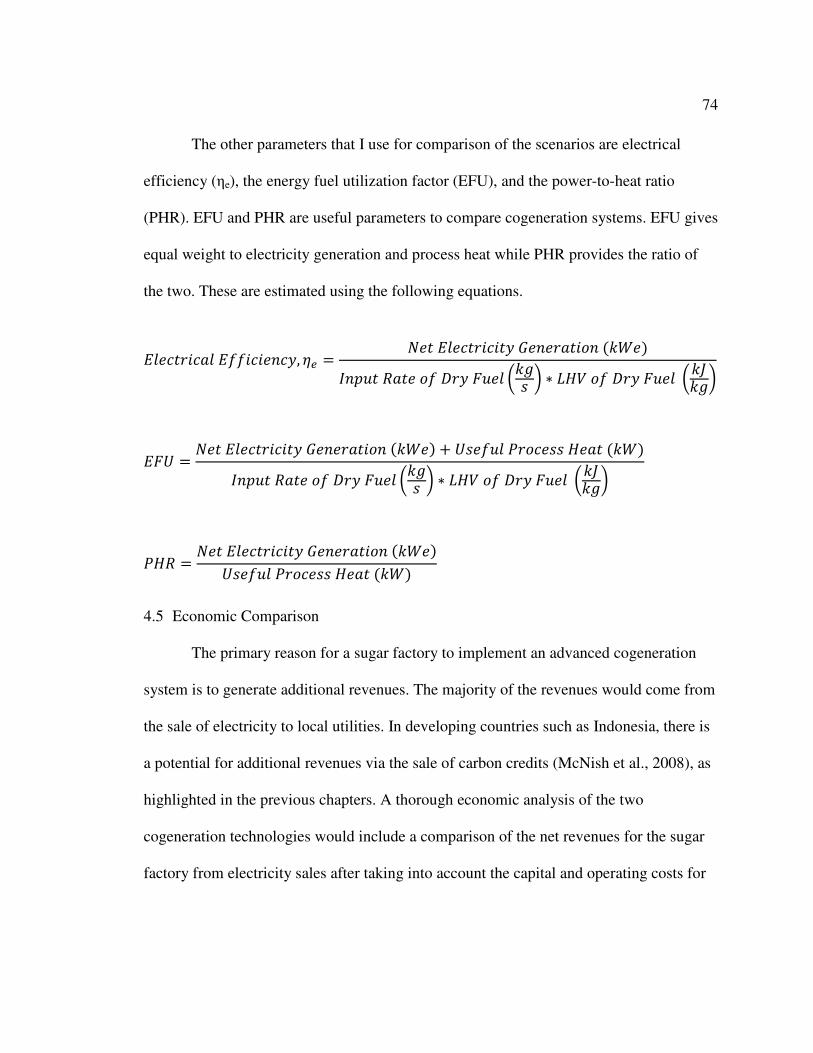
74
The other parameters that I use for comparison of the scenarios are electrical
efficiency (ηe), the energy fuel utilization factor (EFU), and the power-to-heat ratio
(PHR). EFU and PHR are useful parameters to compare cogeneration systems. EFU gives
equal weight to electricity generation and process heat while PHR provides the ratio of
the two. These are estimated using the following equations.
�� !"�#!&� �44#!# %!$, 56 3 " �� !"�#!#"$ � % �&"#�% '�( )7%0/" 8&" �4 1�$ 9/ � :�*� ; < -�= �4 1�$ 9/ � :���*;
�9> 3 " �� !"�#!#"$ � % �&"#�% '�( ) � >� 4/� ,��! �� � &" '�()7%0/" 8&" �4 1�$ 9/ � :�*� ; < -�= �4 1�$ 9/ � :���*;
,�8 3 " �� !"�#!#"$ � % �&"#�% '�( )>� 4/� ,��! �� � &" '�()
4.5 Economic Comparison
The primary reason for a sugar factory to implement an advanced cogeneration
system is to generate additional revenues. The majority of the revenues would come from
the sale of electricity to local utilities. In developing countries such as Indonesia, there is
a potential for additional revenues via the sale of carbon credits (McNish et al., 2008), as
highlighted in the previous chapters. A thorough economic analysis of the two
cogeneration technologies would include a comparison of the net revenues for the sugar
factory from electricity sales after taking into account the capital and operating costs for

75
each cogeneration system. However, as mentioned earlier, BIGCC is still not a
commercial technology, and its capital and operating costs are not well established.
Hence, in this thesis, I have limited the economic comparison to the gross revenues for
the sugar factory through electricity sales. These gross revenues would come from the
sale of electricity to the local utility based on the price decided via a power purchase
agreement (PPA) and the sale of certified emission reductions (CERs) on the
international carbon market. A CER is equal to one metric ton of carbon dioxide
equivalent. The electricity generated using bagasse is considered renewable and the
surplus electricity exported to the grid is believed to displace fossil fuel based electricity
in the regional electric grid. Under the Kyoto protocol, the sugar factory is qualified to
receive CERs for this exported electricity. The number of CERs depends on the amount
of electricity exported and the grid emissions factor (GEF) of the regional electric
network. GEF is the amount of carbon dioxide equivalent emitted in generating one
MWh of electricity (McNish et al., 2008).
����� 8 ? %/ � '$) �� !"�#!#"$ �20��"� :A(B$ ; < ,�#! �4 �� !"�#!#"$ C $A(BD
� �� !"�#!#"$ �20��"� :A(B$ ; < ��9 :"��� A(B; < ��8 0�#! C $"��� D
4.6 Limitations of the Models
Although the models used to analyze the energy systems in the sugar factories are
useful, they do not simulate system performance perfectly. Some of the key limitations of
the models are presented in this section.

76
The two thermodynamic models are steady-state steady-flow. They do not
account for variations associated with running an actual factory and its cogeneration
system.
The dryer module in the BIGCC model is simple, and considers only the latent
heat of water as the moisture vaporizes from the fuel. I ignore evaporation of water below
the boiling point. I also assume that the vapor leaving the dryer is in a saturated vapor
state.
In a direct combustion SRC system, the waste heat from the flue gas leaving the
boiler can be used in a dryer to dry the bagasse, similar to a BIGCC system. However, the
properties of the flue gas are not known since I do not include the combustion of fuel
inside the boiler in the model. Hence, no dryer is included in the direct combustion SRC
model.
Air pre-heaters and economizers can increase the overall efficiency of an SRC
cogeneration system by capturing some of the waste heat from the flue gas leaving the
boiler. Since the flue gas properties are not computed, I do not include these components
in the model. However, I compensate for their absence by assuming a higher efficiency
for the boiler.
A heat recovery system can recover the heat from the product gas as it is cooled in
the gas cleanup/conditioning system of a BIGCC system by preheating the water input to
the HRSG. However, I do not include this process in the model and the heat is assumed
to be lost as the gas is cooled.

77
I assume the electricity consumption for the sugar factory to be the same as the
existing factory. However, there is a possibility of increased electricity consumption due
to processes implemented to lower the low pressure steam demand in the factory.
The only parasitic loads on the cogeneration system that I assume are the pumps,
fans and/or compressors. I do not assume any electrical loads associated with fuel feeding
or drying systems. I also neglect any additional loads that may be required to operate the
advanced cogeneration systems.
Despite these limitations, the models provide a reasonable tool to simulate sugar
factories and their cogeneration systems. They are also useful in analyzing the sensitivity
of the final outputs such as electricity generation and steam production to different
parameters. In the following chapter, I present the results of the simulations and compare
the different scenarios. I also present a sensitivity analysis for the key input parameters.
78
CHAPTER 5. RESULTS
5.1 Summary of Results
The thermodynamic modeling exercise provides a comparison between two
advanced cogeneration systems integrated into the Indonesian sugar factory: the biomass
gasifier integrated combined cycle (BIGCC) cogeneration system and the high pressure
direct combustion steam Rankine cycle (SRC) cogeneration system. Assuming a reduced
process steam consumption of 350 kg/tc and the same bagasse input rate as the bagasse
yield rate from cane crushing, the BIGCC system has an estimated net electricity
generation potential of 180 kWh/tc, which is 38 percent higher than the potential of the
80 bar direct combustion SRC system (130 kWh/tc). The electricity export potential of
the BIGCC system is 50 percent higher than that of the SRC system. However, if each
cogeneration system were to consume bagasse at a minimum rate required to satisfy the
low pressure steam requirement for processing sugar and ethanol during the cane
crushing season, the BIGCC system needs 50 percent more bagasse than the SRC system.
This affects the BIGCC system’s ability to save bagasse during the cane crushing season
in order to generate electricity during the off-season if the only fuel it uses is the bagasse
generated at the factory. For the Indonesian sugar factory, the estimated annual revenue
potential of the BIGCC system is US$15 million per year, approximately 50 percent
higher than the US$10 million per year for the high pressure direct combustion SRC
system. This includes revenues from electricity as well as Certified Emissions Reduction
(CER) sales.
79
5.2 Indonesian Sugar Factory Inputs
In developing the different scenarios for comparison, some of the key inputs to
the models are data from the Indonesian sugar factory. These data are presented in Table
5.1. The sugar factory is integrated with an ethanol distillery. The cogeneration system of
the sugar factory provides process steam and electricity to both the sugar factory and the
distillery. Although the process steam consumption of the sugar factory is only 440 kg/tc,
the distillery requires 90 kg/tc based on its current ethanol production rate, raising the
total process steam requirement for the sugar and ethanol factory to 530 kg/tc. The sugar
factory usually operates for approximately five to six months, while the distillery
operates for about ten months. The distillery uses molasses from the adjoining sugar
factory as well as from two other sugar factories as a feedstock for ethanol. The important
aspect of this arrangement is that the factory cogeneration system needs to operate on a
reduced load during the off-season to provide steam and electricity to the distillery.
Hence, while evaluating the different scenarios for cogeneration, it is important to note
that a smaller amount of bagasse required to satisfy the process steam demand during the
cane crushing season would result in more bagasse left over to be used during the off-
season. Currently, the factory is not connected to the electric grid and therefore, has no
incentive to generate surplus electricity.
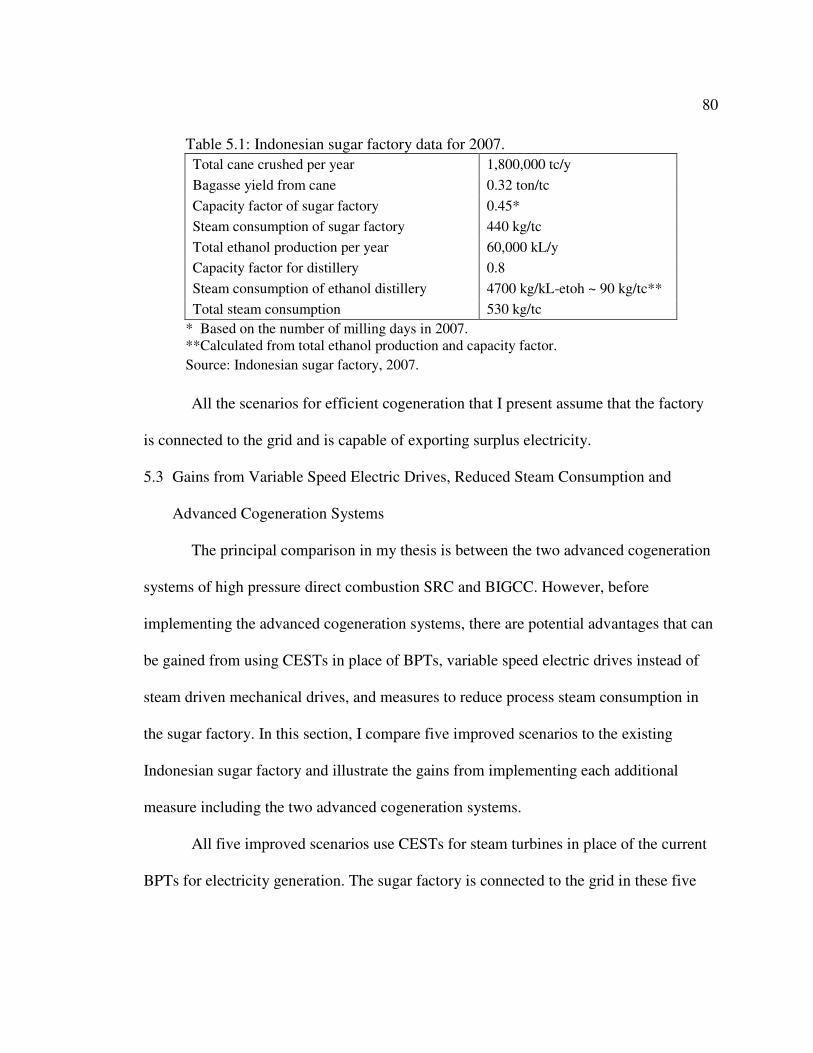
80
Table 5.1: Indonesian sugar factory data for 2007.
Total cane crushed per year 1,800,000 tc/y
Bagasse yield from cane 0.32 ton/tc
Capacity factor of sugar factory 0.45*
Steam consumption of sugar factory 440 kg/tc
Total ethanol production per year 60,000 kL/y
Capacity factor for distillery 0.8
Steam consumption of ethanol distillery 4700 kg/kL-etoh ~ 90 kg/tc**
Total steam consumption 530 kg/tc
* Based on the number of milling days in 2007. **Calculated from total ethanol production and capacity factor.
Source: Indonesian sugar factory, 2007.
All the scenarios for efficient cogeneration that I present assume that the factory
is connected to the grid and is capable of exporting surplus electricity.
5.3 Gains from Variable Speed Electric Drives, Reduced Steam Consumption and
Advanced Cogeneration Systems
The principal comparison in my thesis is between the two advanced cogeneration
systems of high pressure direct combustion SRC and BIGCC. However, before
implementing the advanced cogeneration systems, there are potential advantages that can
be gained from using CESTs in place of BPTs, variable speed electric drives instead of
steam driven mechanical drives, and measures to reduce process steam consumption in
the sugar factory. In this section, I compare five improved scenarios to the existing
Indonesian sugar factory and illustrate the gains from implementing each additional
measure including the two advanced cogeneration systems.
All five improved scenarios use CESTs for steam turbines in place of the current
BPTs for electricity generation. The sugar factory is connected to the grid in these five

81
scenarios and is capable of exporting surplus electricity. All scenarios assume the same
bagasse input rate of 36 kg/s, which is the approximate steady state input rate for the
Indonesian sugar factory during the cane crushing/ sugar processing season. This bagasse
input rate enables the comparison of the improved scenarios with the existing factory.
Table 5.2 shows the results for the existing Indonesian sugar factory and the five
improved scenarios in terms of net electricity generation and export potentials per ton of
cane, electrical efficiency and net electricity exported during the cane crushing season for
the factory. The five improved scenarios show a progressive increase in the net electricity
generation and subsequent increases in electricity export. All scenarios show relatively
low electrical efficiencies. The main reasons for these low efficiencies are the high
moisture content of the bagasse (~50 percent) and the process steam demands of the
factory.

82
Table 5.2: Comparison between existing Indonesian sugar factory (back-pressure steam turbines (BPT) and no grid connection) and grid connected factory scenarios with condensing-extraction steam turbines (CEST), variable speed electric drives and reduced process steam consumption, as well as high pressure direct combustion steam Rankine cycle and biomass integerated gasification combined cycle (BIGCC) systems.
Scenarios
Net Electricity Generation (kWh/tc)
Electricity Export
(kWh/tc)
Electrical efficiency
Energy Utilization
Factor
Power to Heat Ratio
Net Electricity Exported (MWh)
BPT / Stand-alone
30 bar, 340oC, 530kg-steam/tc,
Mech Drives 20 0 7.1% 0.54 0.06 0
CEST / Grid
Connect
30 bar, 340oC, 530kg-steam/tc,
Mech Drives 1 30 10 9.8% 0.55 0.09 18,000
30 bar, 340oC, 530kg-steam/tc, Var Elec Drives
2 60 24 8.7% 0.56 0.18 44,000
30 bar, 340oC, 350kg-steam/tc, Var Elec Drives
3 72 36 10.4% 0.42 0.33 64,000
Advanced CEST/ Grid
Connect
80 bar, 480oC, 350kg-steam/tc, Var Elec Drives
4 113 77 16.4% 0.48 0.52 138,000
BIGCC/ Grid
Connect
HRSG- 30 bar, 340oC,
350kg-steam/tc, Var Elec Drives
5 156 120 22.8% 0.54 0.73 217,000
The bagasse input rate is 36 kg/s, the 2007 steady state consumption rate for the Indonesian sugar factory. The net electricity exported is computed over the cane crushing season (~164 days).
The first improved scenario replaces the BPTs in the existing factory with CESTs.
The surplus high pressure steam, instead of expanding through an expansion valve, is
sent through the power generation turbine and expanded to below atmospheric pressure to
generate additional electricity. Also, since the factory is connected to the grid, the power
generation turbines can run at approximately constant speeds, operating close to their

83
rated outputs. Unlike the turbines in a stand-alone factory that operate at partial load,
turbines in grid-connected factories do not need to adjust their speed based on the
fluctuating electric loads within the factory. The electric grid may be able to absorb the
variations in the surplus electricity, allowing the turbines to operate at constant loads.
Hence, I assume a higher efficiency of 80 percent for the CESTs in the grid-connected
improved scenarios than that for BPTs in the existing factory (~67 percent). In this
scenario, the factory is able to generate 50 percent more electricity than the existing
factory and export 18,000 MWh during the cane crushing season. This improvement is
due to both the increased turbine efficiency and the replacement of the BPTs with
CESTs.
The second improved scenario illustrates the advantage of using variable speed
electric drives for sugar processing and auxiliary cogeneration equipment. Instead of
passing high pressure steam through the mostly single-stage turbines providing
mechanical drives, the steam is expanded through the multiple-stage power generation
turbines that in turn, run the variable speed electric drives. In this scenario, the factory
generates 60 kWh/tc, three times the electricity generated by the existing factory
cogeneration system. The power to heat ratio (PHR) doubles from the first improved
scenario to the second because more electricity is generated and no mechanical drives are
used. The electrical efficiency for the first scenario is higher than the second because the
boiler and other system losses are distributed between the turbines providing mechanical
drives and those driving the electrical generators in the first scenario. In the second
84
scenario, since all the steam passes through the electricity generating turbines, the boiler
and system losses are all attributed to the electricity generation cycle, thus reducing its
efficiency value. However, the net electricity generation potential increases when the
variable speed electric drives are implemented. Although the variable speed electric
drives increase the in-house factory electricity consumption, the factory has an export
potential of 44,000 MWh during the cane crushing season, which is 150 percent higher
than the first improved scenario. As explained in section 2.5, this higher potential is due
to the more efficienct variable speed electric drives that are able to cope better with the
fluctuating loads of the sugar processing equipment than the less efficient single-stage
turbines for mechanical drives.
The third improved scenario includes the reduction of low pressure steam demand
for sugar and ethanol processing to 350 kg/tc. As explained in section 2.5, the low
pressure steam consumption can be reduced by implementing measures such as addition
of evaporator effects, maximum utilization of vapor bleeding, and use of continuous
sugar boiling pans in sugar production, as well as dual-pressure distillation systems and
dehydration using molecular sieves for ethanol production. In this scenario, these
measures are implemented in addition to the use of CESTs and variable speed electric
drives. As shown in Table 5.2, a reduction in the process steam demand further increases
the electricity generation potential of the cogeneration system to 72 kWh/tc. This is 3.6
times the potential of the existing factory and 20 percent greater than the second scenario
with a process steam demand of 550 kg/tc. The reduction in process steam requirement

85
leads to less steam being extracted at the process steam pressure of two bar and more
steam expanded to below atmospheric pressure (0.1 bar in this scenario). The net
electricity export potential of the factory in this scenario is approximately 36 kWh/tc,
which translates to an export of 64,000 MWh during the cane crushing season.
Each of the two advanced cogeneration systems assumes the implementation of
CESTs, variable speed electric drives and measures for process steam reduction in the
sugar factory. The fourth improved scenario is an 80 bar high pressure direct combustion
cogeneration system. Due to the inherent advantages of a higher pressure higher
temperature thermodynamic cycle, the net electricity generation potential is 113 kWh/tc,
which is 57 percent greater than the 30 bar direct combustion system in scenario three,
and approximately 5.7 times the potential of the existing factory. The net electricity
export potential for this scenario is approximately 138,000 MWh during the cane
crushing season, more than double the export potential of the 30 bar system.
The fifth improved scenario is the BIGCC cogeneration system integrated into the
sugar factory. This scenario has the highest net electricity generation potential (156
kWh/tc) and export potential (120 kWh/tc) during the cane crushing season. The net
electricity generation potential is 38 perecent greater than the potential of the high
pressure direct combustion system of scenario four, and almost eight times the potential
of the existing factory. In addition, the electricity export potential of the BIGCC system is
217,000 MWh in the cane crushing season, which is approximately 57 percent greater

86
than the high pressure direct combustion system. Figure 5.1 shows the cumulative effect
of implementing the above scenarios on electricity export potential.
Figure 5.1: Electricity export potential for the Indonesian sugar factory in implementing condensing-extraction steam turbines, variable speed electric drives, reduced process steam consumption, a high pressure direct combustion steam Rankine cycle and a biomass integrated gasifier combined cycle. All five improved scenarios assume that factory is grid-connected. Bagasse input rate is 36kg/s, the 2007 steady state consumption rate for the Indonesian sugar factory.
0
20
40
60
80
100
120
Ele
ctri
city
Ex
po
rt P
ote
nti
al
(kW
h/t
c)
CEST 30bar, 340C, 350kg/tc, Var Sp Elec Drives
CEST 30bar, 340C, 530kg/tc, Steam Mech Drives
Existing Factory, BPT, 30bar, 340C, 530kg/tc, Steam Mech Drives
CEST 30bar, 340C, 530kg/tc, Var Sp Elec Drives
CEST 80bar, 480C, 350kg/tc, Var Sp Elec Drives
BIGCC Pressure Ratio 15, HRSG 30bar, 340C, 350kg/tc, Var Sp Elec Drives
87
5.4 Advanced Cogeneration Scenarios
In this section, I compare the two advanced cogeneration systems in terms of their
electricity generation potential, assuming the maximum possible bagasse input rate of 41
kg/s for both systems, which is the same as the bagasse yield rate from cane crushing.
This bagasse input rate allows the estimation of the maximum electricity generation
potential of the cogeneration systems where all the bagasse is used during the cane
crushing season and no bagasse is left over for the off-season.
Both advanced cogeneration system scenarios assume the implementation of
CESTs, variable speed electric drives and measures for process steam reduction in the
sugar factory, similar to scenarios 4 and 5 from section 5.3. Table 5.3 shows the results
for the two scenarios.
The BIGCC cogeneration system has a higher maximum net electricity generation
potential (180 kWh/tc) and a higher export potential (143 kWh/tc) than the high pressure
direct combustion SRC system. This system generates 38 percent more electricity and has
a 50 percent higher electricity export potential than the high pressure direct combustion
SRC system. The energy utilization factor (EUF) for BIGCC is higher than the direct
combustion SRC system, indicating higher cogeneration efficiency. Further, a higher
PHR of 0.8 indicates that the BIGCC system has a greater portion of energy cogeneration
in the form of electricity than the direct combustion SRC system. In the next section, I
present the energy balance for the two advanced cogeneration scenarios.
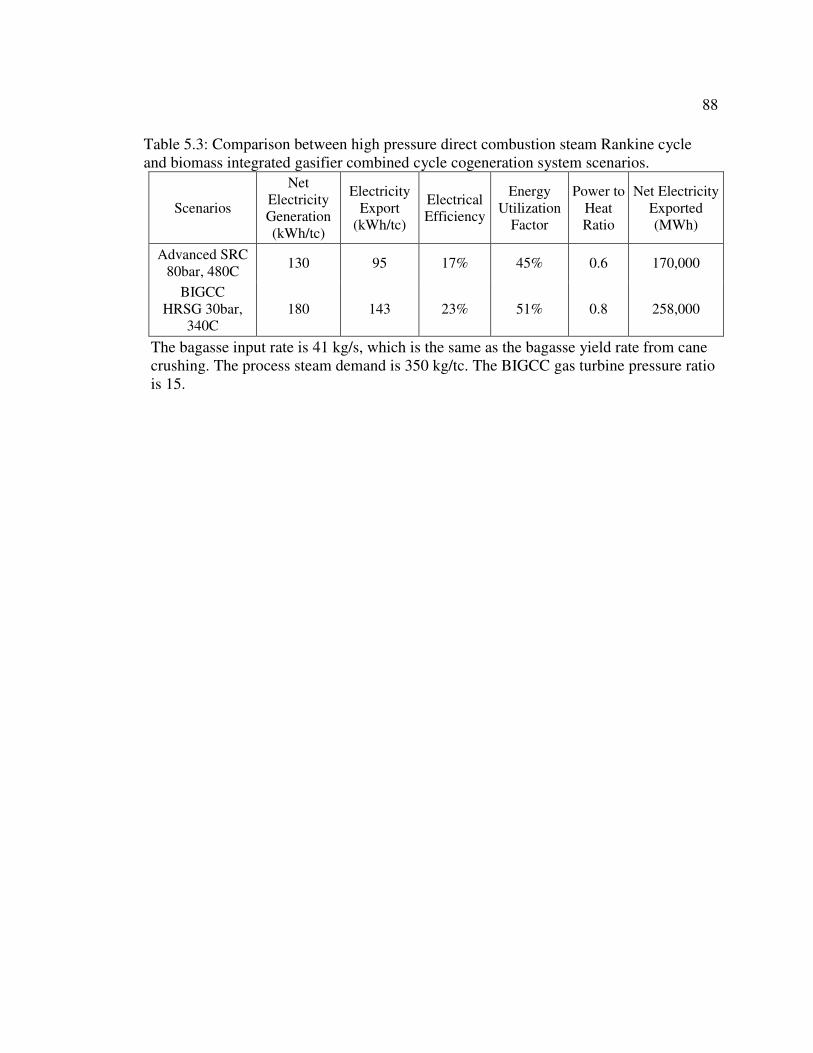
88
Table 5.3: Comparison between high pressure direct combustion steam Rankine cycle and biomass integrated gasifier combined cycle cogeneration system scenarios.
Scenarios
Net Electricity Generation (kWh/tc)
Electricity Export
(kWh/tc)
Electrical Efficiency
Energy Utilization
Factor
Power to Heat Ratio
Net Electricity Exported (MWh)
Advanced SRC 80bar, 480C
130 95 17% 45% 0.6 170,000
BIGCC HRSG 30bar,
340C 180 143 23% 51% 0.8 258,000
The bagasse input rate is 41 kg/s, which is the same as the bagasse yield rate from cane crushing. The process steam demand is 350 kg/tc. The BIGCC gas turbine pressure ratio is 15.
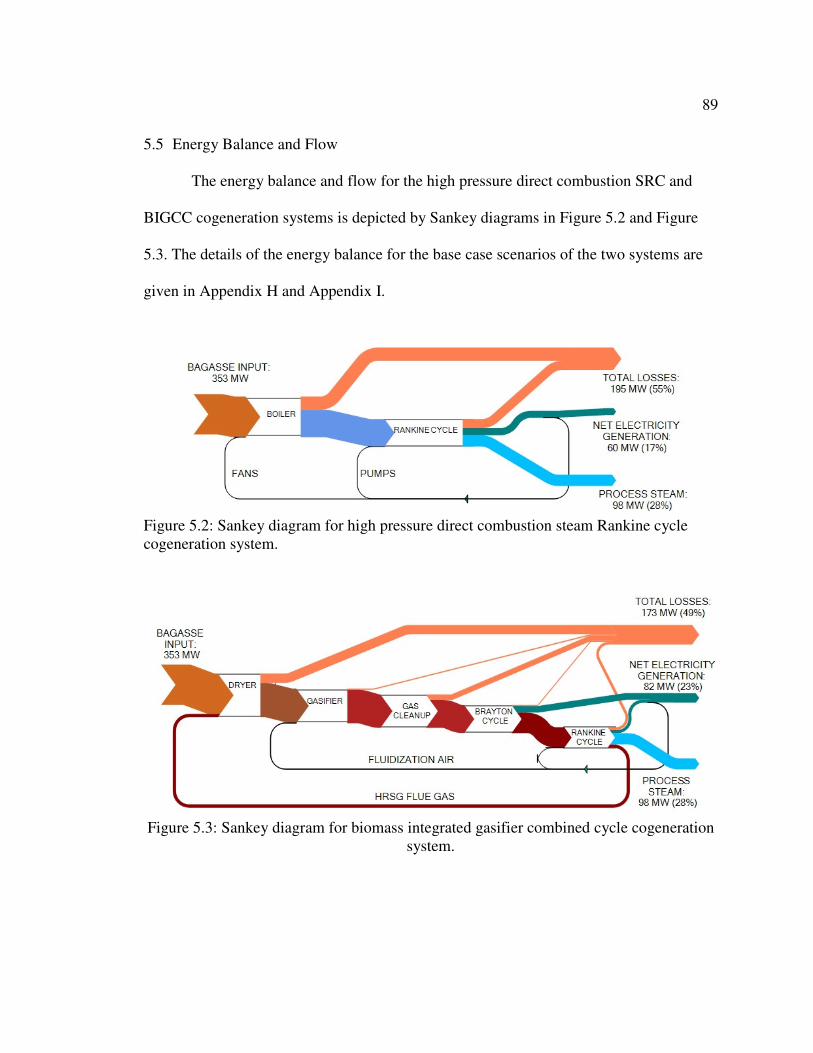
89
5.5 Energy Balance and Flow
The energy balance and flow for the high pressure direct combustion SRC and
BIGCC cogeneration systems is depicted by Sankey diagrams in Figure 5.2 and Figure
5.3. The details of the energy balance for the base case scenarios of the two systems are
given in Appendix H and Appendix I.
Figure 5.2: Sankey diagram for high pressure direct combustion steam Rankine cycle cogeneration system.
Figure 5.3: Sankey diagram for biomass integrated gasifier combined cycle cogeneration
system.
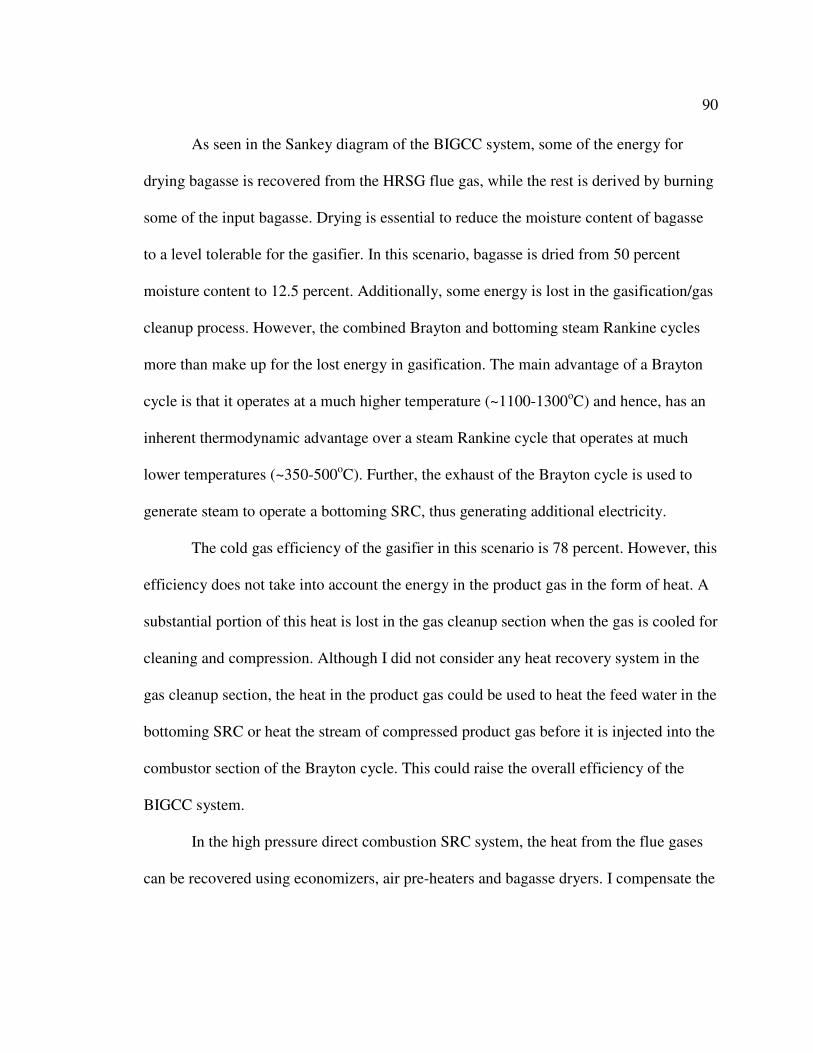
90
As seen in the Sankey diagram of the BIGCC system, some of the energy for
drying bagasse is recovered from the HRSG flue gas, while the rest is derived by burning
some of the input bagasse. Drying is essential to reduce the moisture content of bagasse
to a level tolerable for the gasifier. In this scenario, bagasse is dried from 50 percent
moisture content to 12.5 percent. Additionally, some energy is lost in the gasification/gas
cleanup process. However, the combined Brayton and bottoming steam Rankine cycles
more than make up for the lost energy in gasification. The main advantage of a Brayton
cycle is that it operates at a much higher temperature (~1100-1300oC) and hence, has an
inherent thermodynamic advantage over a steam Rankine cycle that operates at much
lower temperatures (~350-500oC). Further, the exhaust of the Brayton cycle is used to
generate steam to operate a bottoming SRC, thus generating additional electricity.
The cold gas efficiency of the gasifier in this scenario is 78 percent. However, this
efficiency does not take into account the energy in the product gas in the form of heat. A
substantial portion of this heat is lost in the gas cleanup section when the gas is cooled for
cleaning and compression. Although I did not consider any heat recovery system in the
gas cleanup section, the heat in the product gas could be used to heat the feed water in the
bottoming SRC or heat the stream of compressed product gas before it is injected into the
combustor section of the Brayton cycle. This could raise the overall efficiency of the
BIGCC system.
In the high pressure direct combustion SRC system, the heat from the flue gases
can be recovered using economizers, air pre-heaters and bagasse dryers. I compensate the

91
lack of these heat recovery systems in my model by assuming a high boiler efficiency of
80 percent for the base case scenario.
Table 5.4 summarizes the electricity and process heat consumption for the two
advanced cogeneration scenarios. The parasitic loads on the BIGCC cogeneration system
(~4 MW) are higher than those on the direct combustion SRC system (~2.5 MW) but are
more than compensated by the higher electricity generation. I assume the rest of the
electricity loads (electricity consumption for sugar processing, domestic housing and
community, and ethanol distillery) are the same for both scenarios. The net electricity
export potential of the BIGCC system (~65 MW) is approximately 50 percent higher than
that of the high pressure direct combustion SRC system (~43 MW). The thermal energy
consumption for sugar and ethanol processing is the same for the two scenarios.

92
Table 5.4: Electricity and process heat balance for the sugar factory base case scenarios using biomass integrated gasifier combined cycle and high pressure direct combustion steam Rankine cycle cogeneration systems.
BIGCC High Pressure SRC
Electricity balance
Pumps 270 kWe 940 kWe Fluidization air compressor/Fans 3,630 kWe 1,540 kWe Total cogeneration system parasitic loads 3,900 kWe 2,480 kWe
Variable speed electric drives for cutters, shredders, mills
7,370 kWe
Existing factory consumption* 5,940 kWe Total sugar factory consumption 13,310 kWe
Domestic housing and community* 1,980 kWe
Ethanol Distillery* 1,080 kWe
Total electricity consumption 20,270 kWe 18,850 kWe
Electricity export 65,370 kWe 43,170 kWe
Heat balance
Sugar and ethanol processing** 98,200 kWth
* Values are derived from the Indonesian sugar factory and distillery annual reports (Indonesian
Sugar Factory, 2007).
** Based on process steam consumption of 350 kg/tc.
5.6 Gasifier Results
In this section, I present the results of modeling the gasifier for the BIGCC
system. The gasifier is one of the most important components of the BIGCC system and
the most challenging to model. I have assumed an atmospheric pressure gasifier for the
BIGCC system. The moisture content of the input bagasse is 12.5 percent (between the
10 and 15 percent values reported in literature; see Appendix E). The three critical input
parameters to the gasifier model are the equivalence ratio, carbon conversion ratio, and
heat loss coefficient. The carbon conversion ratio determines the amount of carbon lost in
char, while the heat loss coefficient determines the heat lost in the gasification process. I
assumed a carbon conversion factor of 0.97 and a heat loss coefficient of 10 kW/oC. The
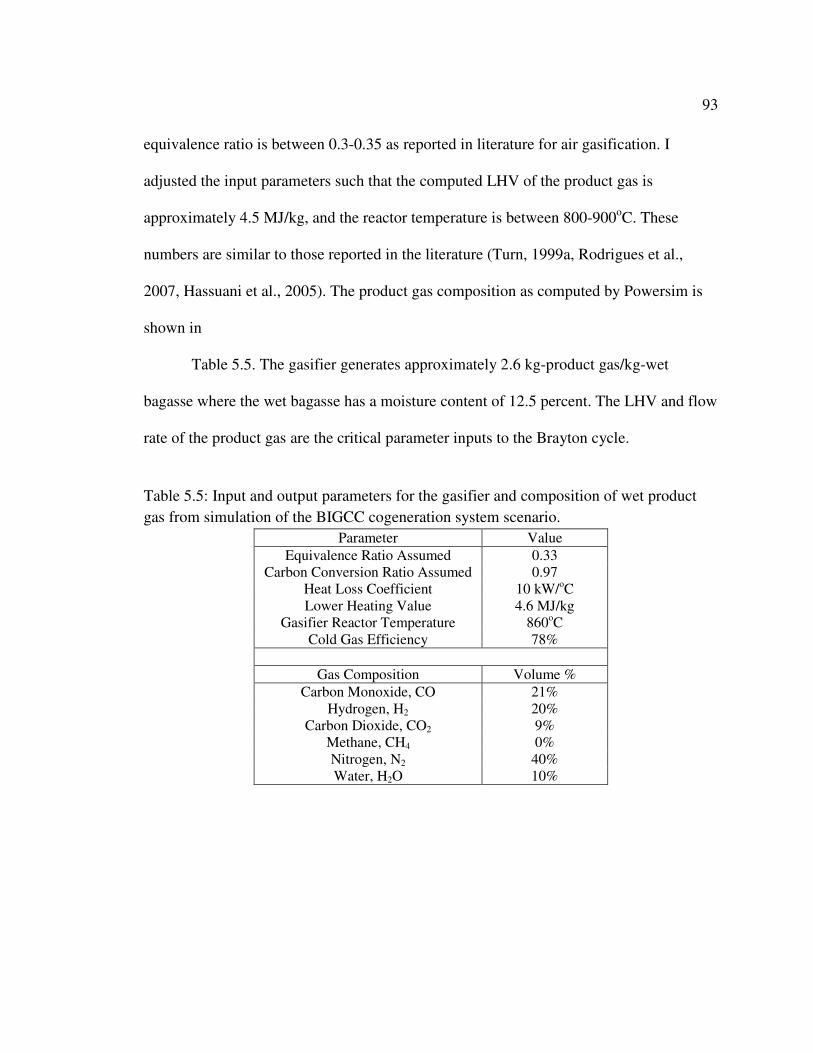
93
equivalence ratio is between 0.3-0.35 as reported in literature for air gasification. I
adjusted the input parameters such that the computed LHV of the product gas is
approximately 4.5 MJ/kg, and the reactor temperature is between 800-900oC. These
numbers are similar to those reported in the literature (Turn, 1999a, Rodrigues et al.,
2007, Hassuani et al., 2005). The product gas composition as computed by Powersim is
shown in
Table 5.5. The gasifier generates approximately 2.6 kg-product gas/kg-wet
bagasse where the wet bagasse has a moisture content of 12.5 percent. The LHV and flow
rate of the product gas are the critical parameter inputs to the Brayton cycle.
Table 5.5: Input and output parameters for the gasifier and composition of wet product
gas from simulation of the BIGCC cogeneration system scenario.
Parameter Value
Equivalence Ratio Assumed 0.33 Carbon Conversion Ratio Assumed 0.97
Heat Loss Coefficient 10 kW/oC Lower Heating Value 4.6 MJ/kg
Gasifier Reactor Temperature 860oC Cold Gas Efficiency 78%
Gas Composition Volume %
Carbon Monoxide, CO 21% Hydrogen, H2 20%
Carbon Dioxide, CO2 9% Methane, CH4 0% Nitrogen, N2 40% Water, H2O 10%
94
The stoichiometric equation for the gasifier is based on the composition of
bagasse (from ultimate analysis), the equivalence ratio, and the product gas components
computed by the PowerSim add-in program. The amount of water in the wet product gas
corresponds to a saturation temperature of approximately 50oC. Hence, the gas is not
saturated at the outlet of the gas cleanp/conditioning system, where the temperature of
200oC is assumed to be the lowest in the gasification system.
�E.F�G��.H3I � 0.8���( " L&*&�� � 1.34'�� � 3.763� � 0.08���)( " M#�� 2.61�� � 2.55�� � 0��� � 1.17��� � 5.063� � 1.3���( " ,��./!" �&� � �I.NE�I.IF�I.IN3I�B&� & P&�
5.7 Sensitivity Analysis
I performed a sensitivity analysis on the key output of the two models, i.e. the net
electricity generation, by varying each of the input parameters over a range of values
found in the literature. The details of the assumed ranges and the sources for the various
input parameters are provided in Appendix D and Appendix E. In this analysis, I varied
each input parameter between its upper and lower limits while keeping all other input
parameters at their base values. The percentage change in the net electricity generation
indicates the influence that particular input parameter has on the overall net electricity
generation potential of the cogeneration system. Table 5.6 and Table 5.7 show results for
input parameters where the net electricity generation potential changed by more than five
percent when the input parameters were varied. The details of the sensitivity analysis for
all input parameters to the two models are provided in Appendix F and Appendix G.

95
Table 5.6: Sensitivity analysis results for the direct combustion steam Rankine cycle model.
Direct Combustion Rankine Net Electricity
Generated (kWh/tc)
Parameter Base Value Upper Limit Lower Limit Range %
Boiler thermal efficiency 80% 85% 75% 16.8 15%
Fuel Moisture Content 50% 52% 48% -14.3 -13%
Power turbine isentropic efficiency
80% 85% 75% 13.3 12%
Process steam for sugar processing (kg/tc)
350 440 280 -11.3 -10%
Exhaust steam pressure from CEST turbine (bar)
0.1 0.4 0.08 -11.2 -10%
Negative values indicate a decrease in the net electricity generated.
Table 5.7: Sensitivity analysis results for the biomass integrated gasifier combined cycle
model.
Biomass Integrated Gasifier Combined Cycle Net Electricity
Generated (kWh/tc)
Parameter Base Value Upper Limit Lower Limit Range %
Gas Turbine Polytropic Efficiency
85% 90% 80% 28.2 15%
Compressor Polytropic Efficiency
85% 90% 80% 24.1 13%
Fuel Moisture content - initial 50% 52% 48% -23.1 -12%
Air ratio or Equivalence ratio 0.33 0.35 0.3 -18.4 -10%
Carbon conversion in gasifier 0.97 0.99 0.95 12.5 7%
Dryer Exhaust temperature (oC) 100 120 80 -10.9 -6%
Process steam for sugar processing (kg/tc)
350 440 280 -10.2 -5%
Pressure Ratio 15 19 11 8.6 5%
Gas Turbine Mechanical Efficiency
98% 99% 97% 8.5 5%
Negative values indicate a decrease in the net electricity generated.
96
Both models are very sensitive to the initial moisture content of bagasse, since a
substantial amount of energy is required to dry it. The low pressure process steam
consumption affects the net electricity generation potential as an increase in the amount
of steam extracted for process needs reduces the amount of steam available for expansion
to below atmospheric pressure in the CESTs. Boiler efficiency affects the net electricity
generation potential of a direct combustion SRC the most. Hence, the implementation of
economizers and air pre-heaters that can increase the overall efficiency of the boiler are
important to increase the overall efficiency of the system. For both models, an increase in
the efficiencies of the power generation equipment, the steam turbine in the case of SRC
and the gas turbine and compressor in the case of BIGCC, increase the net electricity
generation potential substantially.
In case of the BIGCC system, as the carbon conversion factor of the gasifier
increases, more carbon in the fuel is converted into useful product gas. As the
equivalence ratio for the gasifier decreases, less oxygen is available for combustion
reactions and subsequently, less carbon dioxide and more combustible carbon monoxide
can be produced. However, in reality, decreasing the equivalence ratio causes the
temperature in the gasifier reactor to drop due to lack of combustion or exothermic
reactions and the gasifier may not be able to sustain a steady state. Moreover, additional
air could be provided to raise the gasifier reactor temperature in order to thermally crack
the tars in the product gas. This would result in a lower energy content but cleaner
product gas. Hence, the equivalence ratio is dependent on the particular gasifier design,
97
and the strategies that are implemented to operate it successfully. The pressure ratio of
the Brayton cycle in the BIGCC system is also critical for the net electricity generation
potential. Increasing the pressure ratio increases the amount of work performed by the
cycle. However, a higher pressure ratio results in lower exhaust temperatures, which
affects the amount of steam that is available for process needs. Finally, the flue gas
exhaust temperature from the dryer is critical in a BIGCC system. Increasing the energy
that can be extracted from the flue gas to dry the fuel reduces the amount of bagasse that
must be burned in the dryer to achieve the target fuel moisture content.
Although the BIGCC system has a greater electricity generation potential, it is
important to evaluate its ability to satisfy the low pressure steam demand for sugar and
ethanol processing. Table 5.8 and Figure 5.4 show the minimum amount of bagasse
required by the advanced cogeneration systems to satisfy the different levels of process
steam demands. The present process steam demand for the Indonesian sugar factory is
530 kg/tc for sugar and ethanol processing, and 440 kg/tc for sugar processing alone. As
seen from the table, the direct combustion SRC system needs much smaller quantities of
bagasse to generate the required process steam than the BIGCC system. For the base case
scenario of 350 kg/tc process steam demand, the BIGCC system needs a bagasse feed
rate that is about 45 percent higher than the rate for the high pressure direct combustion
SRC system. The BIGCC system generates 440 kg/tc steam by consuming approximately
41 kg/s of bagasse, which is the same as the yield rate of bagasse from cane crushing. To
generate the present process steam demand of 530 kg/tc, the BIGCC system would need

98
an even higher bagasse feed rate, which is not plausible for a self-sufficient factory.
Hence, it is important to reduce the process steam demand in a sugar factory in
conjunction with the implementation of a BIGCC system, especially when there is no
source of fuel other than the bagasse generated via cane crushing.
Table 5.8: Sensitivity of minimum bagasse required to satisfy low pressure steam demand for sugar and ethanol processing for advanced cogeneration scenarios.
Scenarios Minimum Bagasse Required (kg/s)
Process Steam Consumption 530 kg/tc 440 kg/tc 350 kg/tc 280 kg/tc
SRC 80bar, 480C 33 27 22 17 BIGCC HRSG 30bar, 340C 49 41 32 26
Figure 5.4: Sensitivity of minimum bagasse required to satisfy low pressure steam demand for sugar and ethanol processing for advanced cogeneration scenarios.
0
10
20
30
40
50
60
SRC 80bar, 480C BIGCC HRSG 30bar, 340C
Min
imu
m B
ag
ass
e R
eq
uir
ed
(kg
/s)
530 kg/tc 440 kg/tc 350 kg/tc 280 kg/tc
Bagasse yield rate from cane crushing
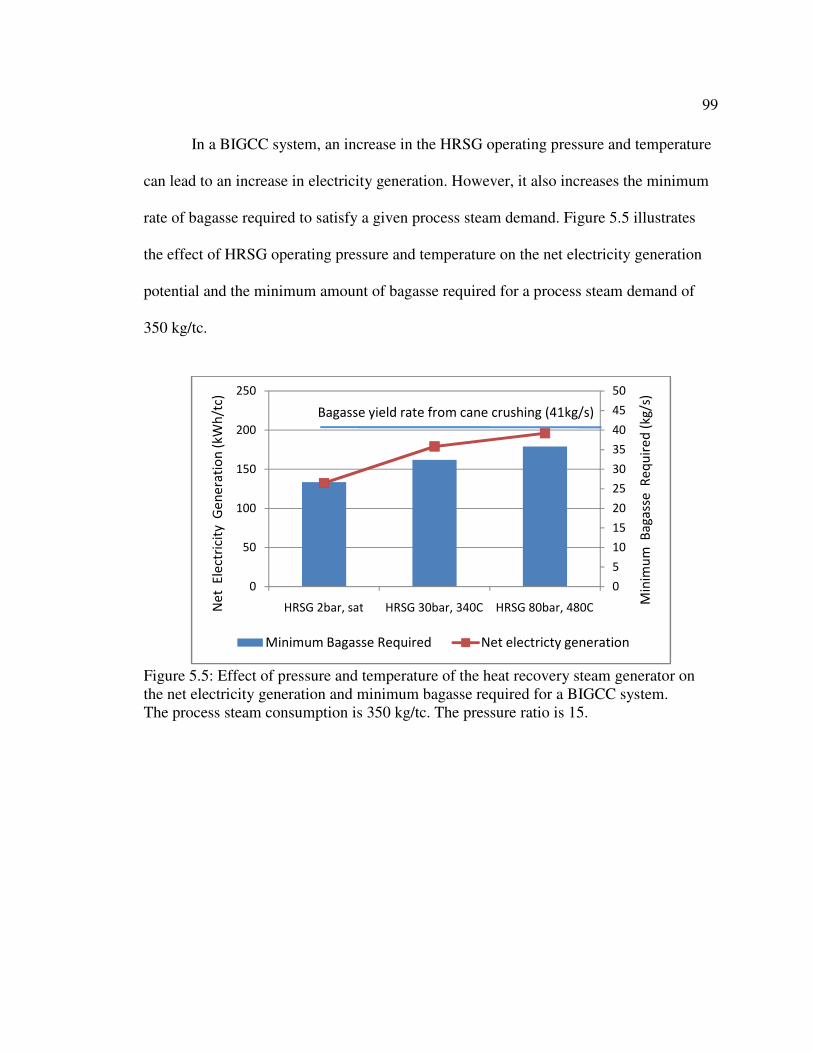
99
In a BIGCC system, an increase in the HRSG operating pressure and temperature
can lead to an increase in electricity generation. However, it also increases the minimum
rate of bagasse required to satisfy a given process steam demand. Figure 5.5 illustrates
the effect of HRSG operating pressure and temperature on the net electricity generation
potential and the minimum amount of bagasse required for a process steam demand of
350 kg/tc.
Figure 5.5: Effect of pressure and temperature of the heat recovery steam generator on the net electricity generation and minimum bagasse required for a BIGCC system. The process steam consumption is 350 kg/tc. The pressure ratio is 15.
0
5
10
15
20
25
30
35
40
45
50
0
50
100
150
200
250
HRSG 2bar, sat HRSG 30bar, 340C HRSG 80bar, 480C
Min
imu
m B
ag
ass
e R
eq
uir
ed
(kg
/s)
Ne
t E
lect
rici
ty G
en
era
tio
n (
kWh
/tc)
Minimum Bagasse Required Net electricty generation
Bagasse yield rate from cane crushing (41kg/s)
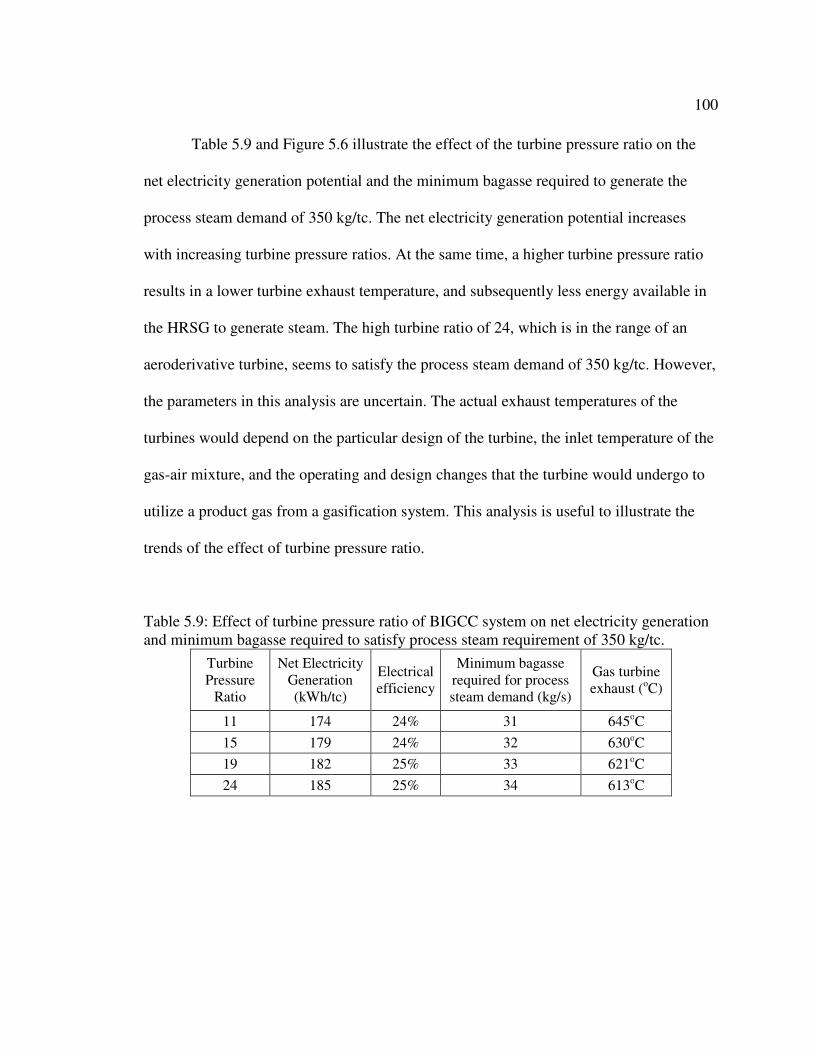
100
Table 5.9 and Figure 5.6 illustrate the effect of the turbine pressure ratio on the
net electricity generation potential and the minimum bagasse required to generate the
process steam demand of 350 kg/tc. The net electricity generation potential increases
with increasing turbine pressure ratios. At the same time, a higher turbine pressure ratio
results in a lower turbine exhaust temperature, and subsequently less energy available in
the HRSG to generate steam. The high turbine ratio of 24, which is in the range of an
aeroderivative turbine, seems to satisfy the process steam demand of 350 kg/tc. However,
the parameters in this analysis are uncertain. The actual exhaust temperatures of the
turbines would depend on the particular design of the turbine, the inlet temperature of the
gas-air mixture, and the operating and design changes that the turbine would undergo to
utilize a product gas from a gasification system. This analysis is useful to illustrate the
trends of the effect of turbine pressure ratio.
Table 5.9: Effect of turbine pressure ratio of BIGCC system on net electricity generation and minimum bagasse required to satisfy process steam requirement of 350 kg/tc.
Turbine Pressure
Ratio
Net Electricity Generation (kWh/tc)
Electrical efficiency
Minimum bagasse required for process steam demand (kg/s)
Gas turbine exhaust (oC)
11 174 24% 31 645oC
15 179 24% 32 630oC
19 182 25% 33 621oC
24 185 25% 34 613oC
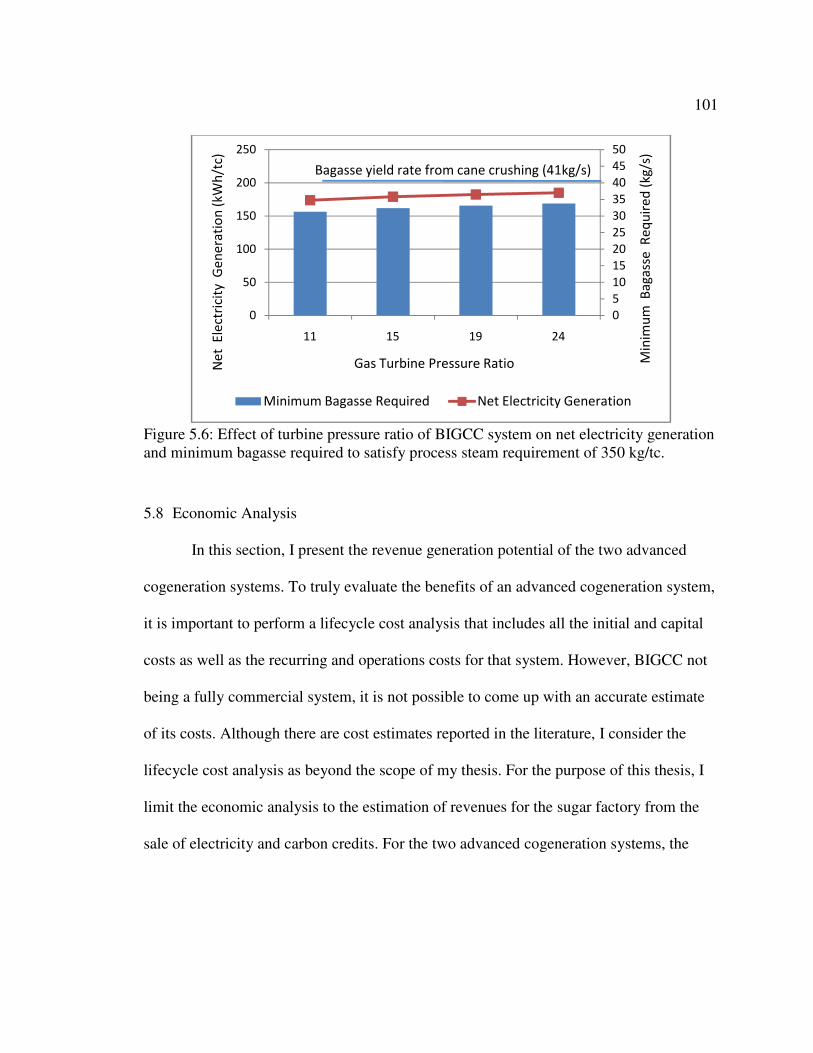
101
Figure 5.6: Effect of turbine pressure ratio of BIGCC system on net electricity generation and minimum bagasse required to satisfy process steam requirement of 350 kg/tc.
5.8 Economic Analysis
In this section, I present the revenue generation potential of the two advanced
cogeneration systems. To truly evaluate the benefits of an advanced cogeneration system,
it is important to perform a lifecycle cost analysis that includes all the initial and capital
costs as well as the recurring and operations costs for that system. However, BIGCC not
being a fully commercial system, it is not possible to come up with an accurate estimate
of its costs. Although there are cost estimates reported in the literature, I consider the
lifecycle cost analysis as beyond the scope of my thesis. For the purpose of this thesis, I
limit the economic analysis to the estimation of revenues for the sugar factory from the
sale of electricity and carbon credits. For the two advanced cogeneration systems, the
0
5
10
15
20
25
30
35
40
45
50
0
50
100
150
200
250
11 15 19 24
Min
imu
m B
ag
ass
e R
eq
uir
ed
(kg
/s)
Ne
t E
lect
rici
ty G
en
era
tio
n (
kWh
/tc)
Gas Turbine Pressure Ratio
Minimum Bagasse Required Net Electricity Generation
Bagasse yield rate from cane crushing (41kg/s)

102
potential revenues provide a way to evaluate how much additional cost would be
acceptable to make implementation profitable.
For the owners of the sugar factory, the principal purpose of implementing an
advanced cogeneration system is to provide revenues for the sugar factory from
electricity sales, in addition to their existing revenue streams from sugar and ethanol
sales. The fact that the exported electricity has the potential to displace fossil fuel based
electricity generation makes this option even more attractive. I present the potential
revenues for the Indonesian sugar factory in Table 5.10.
Table 5.10: Revenues for sugar factory from the sale of electricity and Certified Emissions Reductions (carbon credits).
Price of Electricity = $45/MWh
Grid Emissions Factor = 1.05 tCO2e/MWh
CER Price = $13.60/tCO2e
Electricity Exports
(MWh/y)
Certified Emissions Reductions (tCO2e/y)
Revenues from Electricity Sales
($1000/y)
Revenues from CERs ($1000/y)
Total Revenues ($1000/y)
SRC 80bar, 480C
170,200 178,700 $7,660 $2,430 $10,090
BIGCC HRSG 30bar, 340C
257,700 270,600 $11,600 $3,680 $15,280

103
In estimating the annual revenues from electricity sales, I assume the price of
US$45/MWh. This price is within the tariff range of US$42-49.3/MWh that was
negotiated by the local Indonesian utility (PLN) with 14 independent power producers by
2003 (Wu & Sulistiyanto, 2006).
The second revenue stream is through the sale of certified emission reductions
(CERs). The sugar factory, being located in Indonesia, has the potential to receive CERs
under the Clean Development Mechanism of the Kyoto Protocol. The number of CERs
depends on the local grid emissions factor (GEF) to which the electricity is exported.
Indonesia has an overall GEF of between 0.85-0.87 tCO2/MWh (Restuti & Michaelowa,
2007). However, the local South Sumatran grid where the sugar factory is located has a
GEF of 1.05 tCO2/MWh (Restuti & Michaelowa, 2007) indicating that there is more
fossil fuel based electricity generation in the local grid mix than the overall Indonesian
grid mix. Hence, the sugar factory has the potential to receive more CERs per MWh of
electricity exported to the local grid. Recent prices for contracted CERs were reported in
the range of US$12-20, with an average price of US$13.60 (McNish et al., 2008). I
assume this average price in estimating the potential revenues from the sale of CERs.
The annual revenue potential for a BIGCC cogeneration system is US$15 million
per year, approximately 50 percent higher than the US$10 million per year for the high
pressure direct combustion SRC system. The revenues from the sale of CERs are
approximately a fourth of the total revenues for both cogeneration systems. Figure 5.7
shows the revenues from the two systems in graphical form.

104
Figure 5.7: Revenues for sugar factory from sale of electricity and certified emissions reductions.
$0
$5,000
$10,000
$15,000
$20,000
SRC 80bar, 480C BIGCC HRSG 30bar, 340C
Re
ven
ue
s f
or
su
ga
r f
act
ory
($1
00
0/y
)
Revenues from Electricity Sales ($1000/y)
Revenues from CERs ($1000/y)
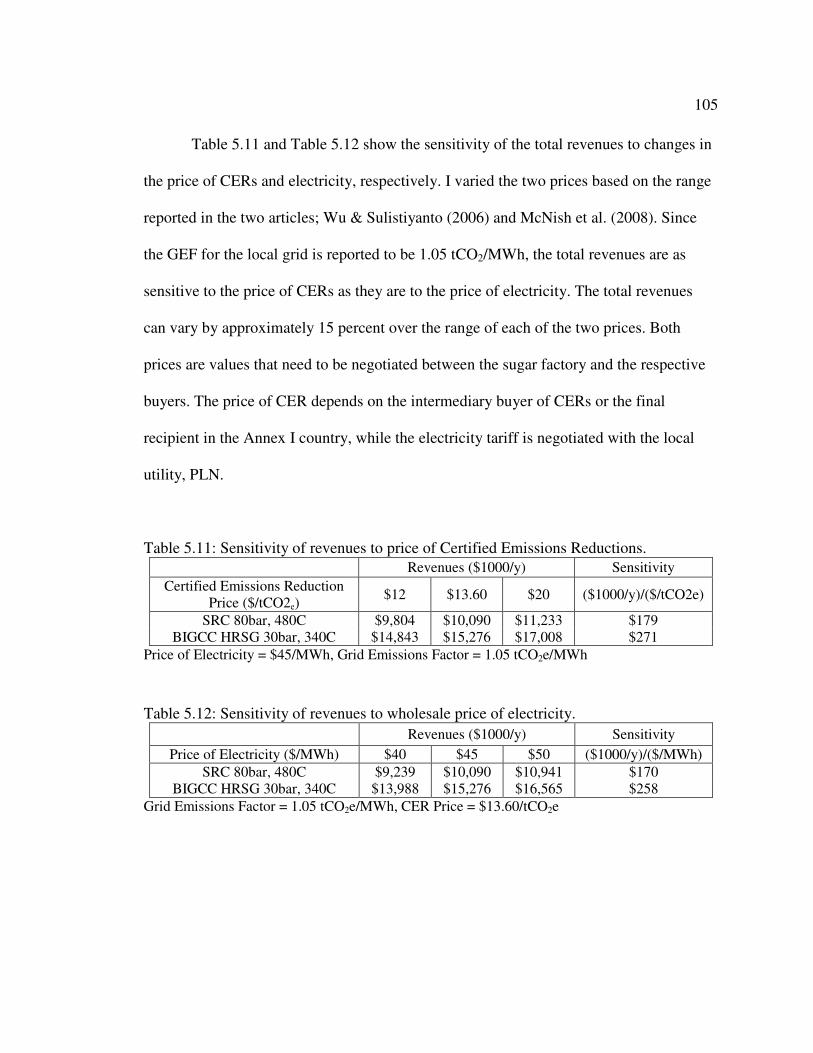
105
Table 5.11 and Table 5.12 show the sensitivity of the total revenues to changes in
the price of CERs and electricity, respectively. I varied the two prices based on the range
reported in the two articles; Wu & Sulistiyanto (2006) and McNish et al. (2008). Since
the GEF for the local grid is reported to be 1.05 tCO2/MWh, the total revenues are as
sensitive to the price of CERs as they are to the price of electricity. The total revenues
can vary by approximately 15 percent over the range of each of the two prices. Both
prices are values that need to be negotiated between the sugar factory and the respective
buyers. The price of CER depends on the intermediary buyer of CERs or the final
recipient in the Annex I country, while the electricity tariff is negotiated with the local
utility, PLN.
Table 5.11: Sensitivity of revenues to price of Certified Emissions Reductions.
Revenues ($1000/y) Sensitivity
Certified Emissions Reduction Price ($/tCO2e)
$12 $13.60 $20 ($1000/y)/($/tCO2e)
SRC 80bar, 480C $9,804 $10,090 $11,233 $179 BIGCC HRSG 30bar, 340C $14,843 $15,276 $17,008 $271
Price of Electricity = $45/MWh, Grid Emissions Factor = 1.05 tCO2e/MWh
Table 5.12: Sensitivity of revenues to wholesale price of electricity.
Revenues ($1000/y) Sensitivity
Price of Electricity ($/MWh) $40 $45 $50 ($1000/y)/($/MWh)
SRC 80bar, 480C $9,239 $10,090 $10,941 $170 BIGCC HRSG 30bar, 340C $13,988 $15,276 $16,565 $258
Grid Emissions Factor = 1.05 tCO2e/MWh, CER Price = $13.60/tCO2e

106
CHAPTER 6. DISCUSSION
A biomass gasifier integrated combined cycle (BIGCC) cogeneration system for a
sugar factory has a larger net electricity generation potential than a high pressure direct
combustion steam Rankine cycle (SRC) system. For the case of the Indonesian sugar
factory, the BIGCC system has a net electricity generation potential of 180 kWh/tc, 38
percent greater than that for the high pressure direct combustion SRC system.14 However,
there are other factors that require close consideration to evaluate the feasibility of
implementing a BIGCC system at the Indonesian sugar factory.
Presently, besides electricity generation, the Indonesian sugar factory has a high
pressure steam demand for running the mechanical drives for its sugar processing
equipment as well as auxiliary equipment for the cogeneration system. This can be
replaced by variable speed electric drives that can be much more efficient overall than the
steam turbine driven drives. Condensing-extraction steam turbines (CESTs) do more
work per quantity of steam than back-pressure turbines, and hence have a greater
electricity generation potential. The low pressure process steam consumption can be
reduced from 530 kg/tc to 350 kg/tc and even up to 280 kg/tc (Ensinas et al., 2007) for an
integrated sugar and ethanol factory by implementing measures outlined in section 2.5.
Implementing CESTs, variable speed electric drives, and reducing the process steam
consumption to 350 kg/tc can increase the net electricity generation potential of the
14 Main assumptions: low process steam consumption = 350 kg/tc, bagasse feed rate = 41 kg/s, same as bagasse yield rate from cane crushing, high pressure direct combustion SRC system – 80bar, 480oC, gas turbine pressure ratio for BIGCC system = 15, heat recovery steam generator – 30bar, 340oC.

107
factory by 260 percent, assuming the same efficiencies for boilers and pumps as the
existing factory. Implementation of these measures is important for realizing the full
potential of advanced cogeneration systems. These measures are especially critical for a
BIGCC system since it is so sensitive to the factory steam demand.
Although the BIGCC system has a greater electricity generation potential than the
high pressure direct combustion SRC system, it needs a 50 percent higher minium
bagasse feed rate to satisfy the low pressure steam demand for sugar and ethanol
processing. In fact, the BIGCC system would be unable to satisfy the present process
steam consumption of 530 kg/tc of the Indonesian factory if the system were to consume
bagasse at the same rate as it is generated through cane crushing. Hence, it is critical to
reduce the process steam demand of the sugar factory before considering a BIGCC
system.
Often, the cogeneration system needs to operate during the off-season, like in the
case of the Indonesian sugar factory, which provides process steam and electricity to the
ethanol distillery as well as other domestic loads. Besides, in terms of return on
investment, it would be beneficial for the sugar factory to operate the BIGCC system
during the off-season and export electricity to the grid. The higher minimum bagasse feed
rate requirement for the BIGCC system reduces its ability to operate during the off-
season when no sugar cane is crushed and no fresh bagasse is generated. Reducing the
process steam consumption of the factory means that less bagasse is required during the

108
sugar cane crushing season. This results in more bagasse availability during the off-
season.
If adequate fuel is not available during the off-season, additional fuel other than
the bagasse generated through cane crushing at the factory would need to be acquired.
This additional fuel could be in the form of bagasse from other factories, cane trash
collected through mechanical harvesting or waste biomass from other agricultural
industries. By some estimates, up to 125 kg/tc (dry weight) of cane trash could be
recovered from the fields (Macedo et al., 2001), adding an extra 90 percent of potential
input energy. While mechanical harvesting eliminates the harmful practice of burning
fields, it could lead to loss of jobs for sugar cane cutters. This could have wider
repercussions in the sugar cane regions of Indonesia where sugar cane cutting is a major
source of employment. At the same time, a Brazilian report evaluating the
implementation of BIGCC cogeneration systems in the sugar industry claims that the
possible use of cane trash to extend power generation to year round operation would
create approximately the same number of jobs in the cogeneration plants as the sugar
cane cutting jobs that would be lost due to mechanical harvesting (Hassuani et al., 2005).
However, the nature of jobs would be different.
Both advanced cogeneration systems have the potential to generate substantial
revenues for the Indonesian sugar factory. The annual revenue potential of the BIGCC
system is US$15 million per year, while that for the high pressure direct combustion SRC
109
system is US$10 million per year.15 The revenues from the sale of CERs are
approximately a fourth of the total revenues for both cogeneration systems. These
revenues from CER sales are relatively large due to the high grid emissions factor (GEF)
of 1.05 kg-CO2/MWh for the local South Sumatran grid. A high GEF translates to greater
number of CERs available per MWh of renewable electricity exported to the grid. In
addition to estimating revenue generation, a lifecycle cost analysis of both systems taking
into account their capital and operating expenses is needed to truly evaluate the economic
benefits of implementing an advanced cogeneration system.
Last but not the least, having highlighted all the potentials of a BIGCC system, it
is important to acknowledge that the BIGCC technology is still in the development stage.
Although a few large scale demonstration projects were set up and run, no commercial
systems are in operation today. More importantly, there has not been any large scale
BIGCC system operated on bagasse and integrated with a sugar factory yet. Given the
challenges facing different aspects of the BIGCC technology, from fuel feeding and gas
cleanup to operating the turbine on low energy content gas, it may be risky for an
Indonesian sugar factory to implement a BIGCC system without adequate expertise in
gasification and relatively complex associated power generation equipment. If BIGCC
were to be a commercial technology, which some claim that it is close to becoming; it
would be a lower risk to invest in this high potential cogeneration system. However, for
15 Assumptions: electricity sale rate = US$45/MWh, CER price = US$13.60.
110
the Indonesian sugar factory, it may be more prudent to implement a high pressure direct
combustion SRC system in the near future.
Although the thermodynamic models provide a reasonable tool to simulate sugar
factories and their cogeneration systems, it is important to note that the main assumption
behind these models is that the sugar factories operate at steady state. Steady state
operation is not possible in reality due to reasons ranging from variation in the sugar cane
input to shutdowns for maintenance. It is possible to tune the input parameters of the SRC
model to simulate the existing factory. However, I assume the input parameters for the
improved cogeneration scenarios based on values reported in the literature. The models
are most sensitive to the efficiencies of the different components of the cogeneration
systems like the boiler efficiency, steam turbine isentropic efficiency, gas turbine
isentropic efficiency and compressor efficiency. The actual efficiencies depend on the
design and specifications of the individual components as well as their operating
conditions. The assumptions for the values of these efficiencies introduce the most
uncertainty in the results. In addition, the models are very sensitive to the moisture
content of bagasse and the low pressure steam requirement for sugar and ethanol
processing.
Future work will involve improving the two thermodynamic models. Simulating
the combustion process in the boiler for the SRC model will enable the computation of
properties of the flue gas. This will further enable the modeling of heat recovery systems
like air preheaters and economizers as well as a dryer for direct combustion SRC

111
cogeneration systems. In this exercise, I assume an atmospheric pressure gasification
system. An analysis of a pressurized gasification system in addition to the atmospheric
pressure gasification system assumed in this exercise will help to evaluate the benefits
and limitations of the two types of gasification systems. Also, modeling of a system to
recover heat from the product gas in the gas cleanup/conditioning system will further
refine the BIGCC model. Finally, future work will include a lifecycle cost analysis for
both advanced cogeneration systems to estimate their true economic benefits.
112
CHAPTER 7. CONCLUSIONS
Steady state thermodynamic models provide a reasonable tool for the comparison
of advanced cogeneration system options for sugar industries. Both advanced
cogeneration systems, the biomass integrated gasifier combined cycle (BIGCC) system
and the 80 bar high pressure direct combustion steam Rankine cycle (SRC) system, offer
substantially greater potential for electricity generation than the existing cogeneration
system of the Indonesian sugar factory. Assuming the same bagasse input to the advanced
cogeneration systems as the present steady state input to the existing factory during the
cane crushing season, the net electricity generation potentials of the BIGCC and SRC
systems are approximately eight and six times the potential of the existing factory,
respectively.
The BIGCC cogeneration system has an estimated net electricity generation
potential of 180 kWh/tc, which is 38 percent greater than the potential of the high
pressure direct combustion SRC system (130 kWh/tc). This potential is estimated
assuming a process steam consumption of 350 kg/tc and the same bagasse input rate as
the bagasse yield rate from cane crushing. The electricity export potential of the BIGCC
system is 50 percent higher than that of the SRC system.
However, if each cogeneration system were to consume bagasse at a minimum
rate required to satisfy the low pressure steam requirement for processing sugar and
ethanol during the cane crushing season, the BIGCC system needs 50 percent more
bagasse than the SRC system. This affects the BIGCC system’s ability to save bagasse

113
during the cane crushing season in order to provide steam and electricity for domestic and
distillery use during the off-season. Hence, it is critical to reduce the low pressure steam
requirement of the factory before implementing a BIGCC system. Additional fuel
supplies in the form of bagasse from other factories, sugar cane trash recovered from the
fields, or any other suitable biomass may also increase the ability of the BIGCC system to
operate beyond the cane crushing season.
For the Indonesian sugar factory, the estimated annual revenue potential of the
BIGCC system is US$15 million per year, approximately 50 percent higher than the
US$10 million per year for the high pressure direct combustion SRC system. This
includes revenues from electricity as well as sales of carbon credits.
The BIGCC technology is still in its development stage, with no commercial
systems in operation today. More importantly, there has been no large scale BIGCC
system integrated into a sugar factory. Given these risks, a high pressure direct
combustion SRC cogeneration system may be more suitable for efficient cogeneration at
the Indonesian sugar factory in the near future.

114
REFERENCES
Barroso, J., Barreras, F., Amaveda, H. and Lozano, A., 2003. “On the optimization of
boiler efficiency using bagasse as fuel,” Fuel 82 (2003) 1451-1463.
Beeharry, R.P., 1996. “Extended sugarcane biomass utilization for exportable electricity
production in Mauritius,” Biomass and Bioenergy, Vol.11, No.6, pp.441-449
Brazil Biofuels Ethanol Annual Report, 2008.
http://www.thebioenergysite.com/articles/118/brazil-biofuels-ethanol-annual-report-
2008, site accessed on 22 November, 2008.
Brazil Sugar Semi-annual Report, 2008.
http://www.thebioenergysite.com/articles/156/brazil-sugar-semi-annual-report-2008,
site accessed on 22 November, 2008.
Bridgwater, A.V., Beenackers, A.A.C.M. and Sipila, K., 1998. “An assessment of the possibilities for transfer of European biomass gasification technology to China – Part I,” International Energy Agency, Task 33/ Thermal Gasification of Biomass.
British Sugar, Map of the world showing the cane producing areas.jpg,
http://www.britishsugar.co.uk/RVE759fc523b5b2437b82f2622dc81f3c2d,,.aspx, site
accessed on 22 November, 2008.
Chrisgas, Värnamo biomass-fuelled pressurized IGCC plant,
http://www.chrisgas.com/imageLib/F_1106821889.jpg, site accessed on 22 November,
2008.
Coelho, S., Prado, A., Junior, S.O., Zylbersztajn, D. and Cintra, R.B., 1997.
“Thermoeconomic analysis of electricity cogeneration from sugarcane origin,” Third
biomass conference of the Americas, Motreal, August 24-29, 1997, Elsevier Science Ltd.,
Vol. II, pp 1631-1640.
Consonni, S. and Larson, E.D., 1996a. “Biomass gasifier/aeroderivative gas turbine
combined cycles: Part A – Technologies and Performance Modelling,” Journal of
Engineering for Gas Turbines and Power, Vol.118, No.3, pp.507-515.
115
Consonni, S. and Larson, E.D., 1996b. “Biomass gasifier/aeroderivative gas turbine
combined cycles: Part B –Performance calculations and economic assessment,” Journal
of Engineering for Gas Turbines and Power, Vol.118, No.3, pp.516-525.
Devi, L., Ptasinski, K.J. and Janssen, F.J.J.G., 2003. “A review of the primary measures
for tar elimination in biomass gasification processes,” Biomass and Bioenergy, 24 (2003)
125-140.
Ducente AB, 2006. “Large scale gasification of biomass for biofuels and power,” A
report prepared by Ducente AB for the European Commission Directorate-General
Energy and Transport.
Ensinas, A.V., Silvia, A.N., Lozano, M.A. and Serra, L.M., 2007. “Analysis of process
steam demand reduction and electricity generation in sugar and ethanol production from
sugarcane,” Energy Conversion and Management, 48 (2007) 2978-2987.
F.O.Licht, 2006, World Ethanol and Biofuels Report, F.O.Licht.
Food and Agriculture Organization (FAO), 2007a. FAOSTAT, The Statistics Division,
Economic and Social Department, Food and Agriculture Organization of the United
Nations, http://faostat.fao.org/site/567/DesktopDefault.aspx?PageID=567#ancor, site
accessed on 22 November, 2008.
Food and Agriculture Organization (FAO), 2007b. Food Outlook, Global Market
Analysis, November 2007.
Hassuani, S.J., Leal, M.R.L.V. and Macedo, I.C., 2005. “Biomass power generation:
sugar cane bagasse and trash,” Programa das Nacoes Unidas para o Desenvolvimento
(PNUD) and Centro de Tecnologia Canavieira (CTC), Piracicaba, Brazil, 2005.
IgoUgo, Sugarcane, http://photos.igougo.com/pictures-photos-l10054-s2-p160988-
Sugarcane.html, site accessed on 22 November, 2008.
Illovo Sugar, 2008. http://www.illovo.co.za/worldofsugar/internationalSugarStats.htm,
site accessed on 22 November, 2008.

116
Indonesian Sugar Factory, 2007. Factory Department, Final Monthly Report, November
2007.
Kaupp, A. and Goss, J., 1984. “Small scale gas producer-engine systems,” First published
by the German Appropriate Technology Exchange, Reissued by the Biomass Energy
Foundation Press.
Larson, E.D., Williams, R.H. and Leal, M.R.L.V., 2001. “A review of biomass
integrated-gasifier/ gas turbine combined cycle technology and its application in
sugarcane industries, with an analysis for Cuba,” Energy for Sustainable Development,
March 2001, Volume V No.1.
Macedo, I.C., Leal, M.R.L.V. and Hassuani, S.J., 2001. “Sugar cane residues for power
generation in the sugar/ethanol mills in Brazil,” Energy for Sustainable Development, V
No.1, pp77-82.
McKendry, P., 2002. “Energy production from biomass (part 3): gasification
technologies,” Bioresource Technology, 83 (2002) 55-63
McNish, T., Gopal, A., Deshmukh, R., Jacobson, A. and Kammen, D., 2008. “Carbon
Markets Research – Prepared for the Sugar Group Companies,” Report developed for the
Indonesian Sugar Group Companies.
Photobucket, Sugar, file name: bag-of-sugar.jpg,
http://s273.photobucket.com/albums/jj219/alohanema/weight-
loss/200805/?action=view¤t=bag-of-sugar.jpg, site accessed on 22 November,
2008.
Pinal Energy, Ethanol, file name: ethanol_gas_pump.jpg,
http://www.pinalenergyllc.com/index.cfm?show=10&mid=8, site accessed on 22
November, 2008.
Piterou, A., Shackley, S. and Upham, P., 2008. “Project ARBRE: Lessons for bio-energy
developed and project-makers,” Energy Policy, 36 (2008) 2044-2050.
Ptasinski, K.J., Prins, M.J. and Pierik, A., 2007. “Exergetic evaluation of biomass
gasification,” Energy, Vol 32, pp.568-574.

117
Restuti, D. and Michaelowa, A., 2007. “The economic potential of bagasse cogeneration
as CDM projects in Indonesia,” Energy Policy, 35 (2007) 3952-3966.
Rodrigues, M., Walter, A. and Faaij, A., 2007. “Performance evaluation of atmospheric
biomass integrated gasfier combined cycle systems under different strategies for the use
of low calorific gases,” Energy Conversion and Management, 48 (2007) 1289-1301.
Rowlands, Ian H., 2001. "The Kyoto Protocol’s ‘Clean Development Mechanism’: a sustainability assessment." Third World Quarterly 22:795-811. Ståhl, K., Waldheim, L., Morris, M., Johnsson, U. and Gårdmark, L., 2004. “Biomass IGCC at Värnamo, Sweden – Past and Future,” GCEP Energy Workshop, April 27, 2004, Standford University, CA, USA.
Sugar Engineers’ Library (a),
http://www.sugartech.co.za/extraction/bagasseCV/index.php, site accessed on 22
November, 2008.
Sugar Engineers’ Library (b), http://www.sugartech.co.za/turbinecalcs/index.php, site
accessed on 22 November, 2008.
Turn, S.Q., 1999a, “Biomass integrated gasifier combined cycle technology: Application
in the cane sugar industry, Part I,” International Sugar Journal, Vol. 101, No. 1205.
Turn, S.Q., 1999b, “Biomass integrated gasifier combined cycle technology: Application
in the cane sugar industry, Part II,” International Sugar Journal, Vol. 101, No. 1206.
Turn, S.Q., 1999c. “Biomass integrated gasifier combined cycle technology: Application
in the cane sugar industry, Part III,” International Sugar Journal, Vol. 101, No. 1207.
UNICA, 2008. Brazilian sugarcane production, sugar production and ethanol production
reports, Brazilian sugarcane industry association – UNICA and Ministry of Agriculture,
Livestock and Food Supply – MAPA, www.unica.com.br, site accessed on 22 November,
2008.

118
University of South Florida, Tall grasses native to the warm temperate and tropical
climates, file name: sugar_cane_25751, Florida Center for Instructional Technology,
College of Education, University of South Florida,
http://etc.usf.edu/clipart/25700/25751/sugar_cane_25751.htm, site accessed on 22
November, 2008.
Upadhiaya, U.C., 1992. “Cogeneration of steam and electric power,” International Sugar
Journal, Vol. 93, No. 1117, pp.2-10.
Waldheim, L. and Carpentieri, E., 2001. “Update on the progress of the Brazilian wood
BIG-GT demonstration project,” Journal of Engineering for Gas Turbines and Power,
Vol.123, No.3, pp.525-536.
Warnecke, R., 2000. “Gasification of biomass: comparison of fixed bed and fluidized bed
gasifier,” Biomass and Bioenergy, 18 (2000) 489-497.
Williams, R., 2004. “Technology assessment for biomass power generation-UC Davis,”
Final report, SMUD Regen program.
Williams, R.H. and Larson, E.D., 1996. “Biomass Gasifier Gas Turbine Power
Generating Technology,” Biomass and Bioenergy, Vol.10, Nos 2-3, pp. 149-166.
Wu, X. and Sulistiyanto, P., 2006. “Independent Power Producer (IPP) debacle in
Indonesia and Phillippines: Path dependence and spillover effects,” in De-regulation and
its discontents: Rewriting the rules in Asia, Howitt, M. and M. Ramesh (eds), pp.109-
123.
Xylowatt, Gasifier, file name: gasification.jpg,
http://www.xylowatt.com/gasificationEN.htm, site accessed on 22 November, 2008.
Zhu, X. and Venderbosch, R., 2005. “A correlation between stoichiometrical ratio of fuel
and its higher heating value,” Fuel, 84 (2005) 1007-1010.
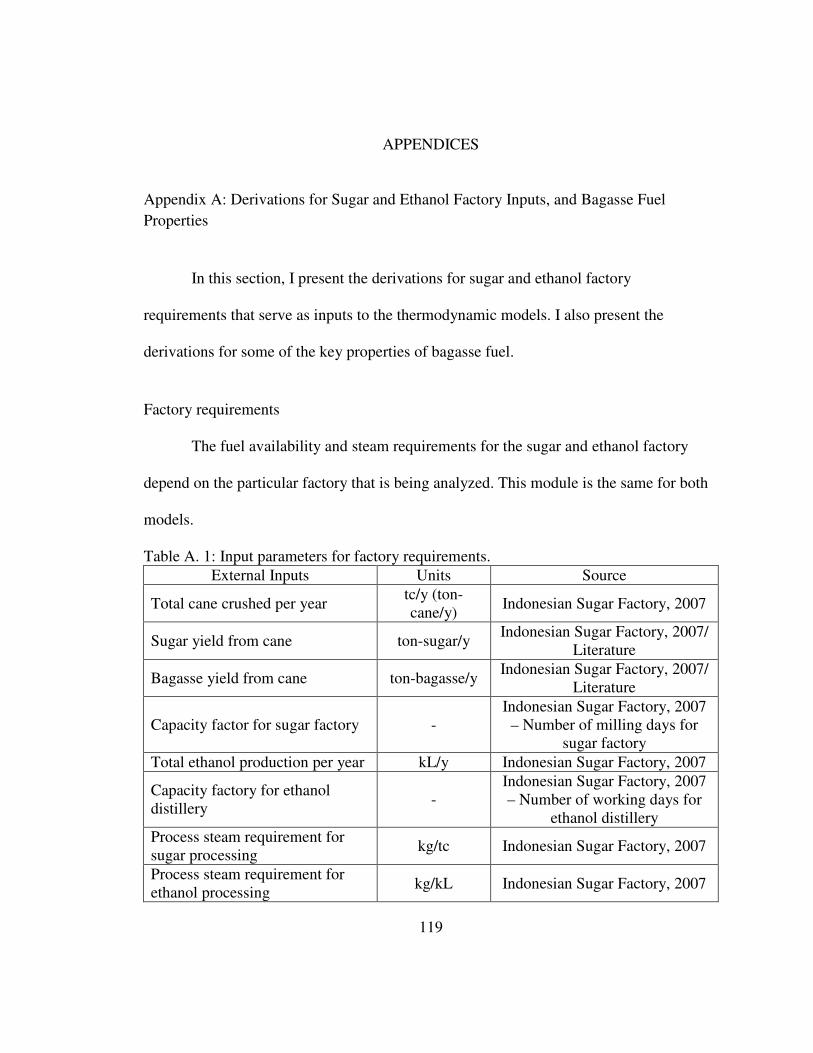
119
APPENDICES
Appendix A: Derivations for Sugar and Ethanol Factory Inputs, and Bagasse Fuel
Properties
In this section, I present the derivations for sugar and ethanol factory
requirements that serve as inputs to the thermodynamic models. I also present the
derivations for some of the key properties of bagasse fuel.
Factory requirements
The fuel availability and steam requirements for the sugar and ethanol factory
depend on the particular factory that is being analyzed. This module is the same for both
models.
Table A. 1: Input parameters for factory requirements.
External Inputs Units Source
Total cane crushed per year tc/y (ton-cane/y)
Indonesian Sugar Factory, 2007
Sugar yield from cane ton-sugar/y Indonesian Sugar Factory, 2007/
Literature
Bagasse yield from cane ton-bagasse/y Indonesian Sugar Factory, 2007/
Literature
Capacity factor for sugar factory - Indonesian Sugar Factory, 2007
– Number of milling days for sugar factory
Total ethanol production per year kL/y Indonesian Sugar Factory, 2007
Capacity factory for ethanol distillery
- Indonesian Sugar Factory, 2007 – Number of working days for
ethanol distillery
Process steam requirement for sugar processing
kg/tc Indonesian Sugar Factory, 2007
Process steam requirement for ethanol processing
kg/kL Indonesian Sugar Factory, 2007
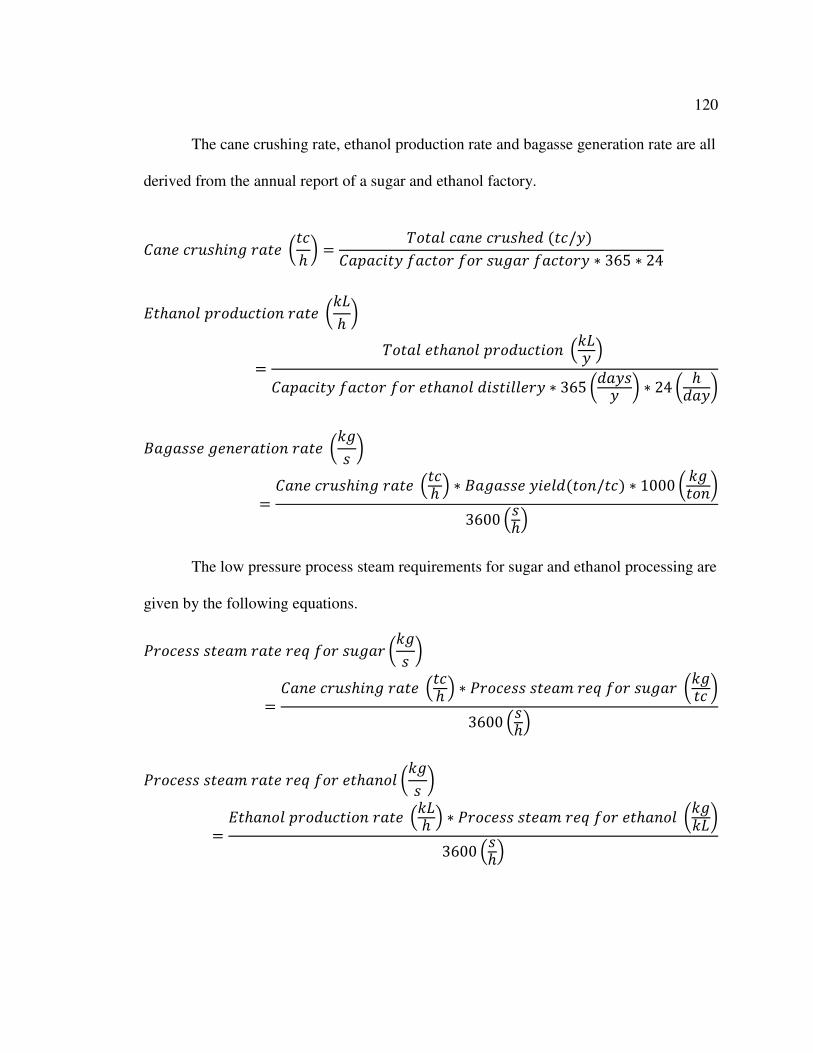
120
The cane crushing rate, ethanol production rate and bagasse generation rate are all
derived from the annual report of a sugar and ethanol factory.
�&% !�/�B#%* �&" :"!B ; P�"&� !&% !�/�B . '"!/$) �&0&!#"$ 4&!"�� 4�� �/*&� 4&!"��$ < 365 < 24
�"B&%�� 0��./!"#�% �&" :�-B ; P�"&� "B&%�� 0��./!"#�% Q�-$ R
�&0&!#"$ 4&!"�� 4�� "B&%�� .#�"#�� �$ < 365 :.&$�$ ; < 24 : B.&$;
L&*&�� * % �&"#�% �&" :�*� ; �&% !�/�B#%* �&" Q"!B R < L&*&�� $# �.'"�%/"!) < 1000 : �*"�%;
3600 Q�BR
The low pressure process steam requirements for sugar and ethanol processing are
given by the following equations.
,��! �� �" &� �&" � S 4�� �/*&� :�*� ; �&% !�/�B#%* �&" Q"!B R < ,��! �� �" &� � S 4�� �/*&� :�*"! ;
3600 Q�BR
,��! �� �" &� �&" � S 4�� "B&%�� :�*� ; �"B&%�� 0��./!"#�% �&" Q�-B R < ,��! �� �" &� � S 4�� "B&%�� :�*�-;
3600 Q�BR
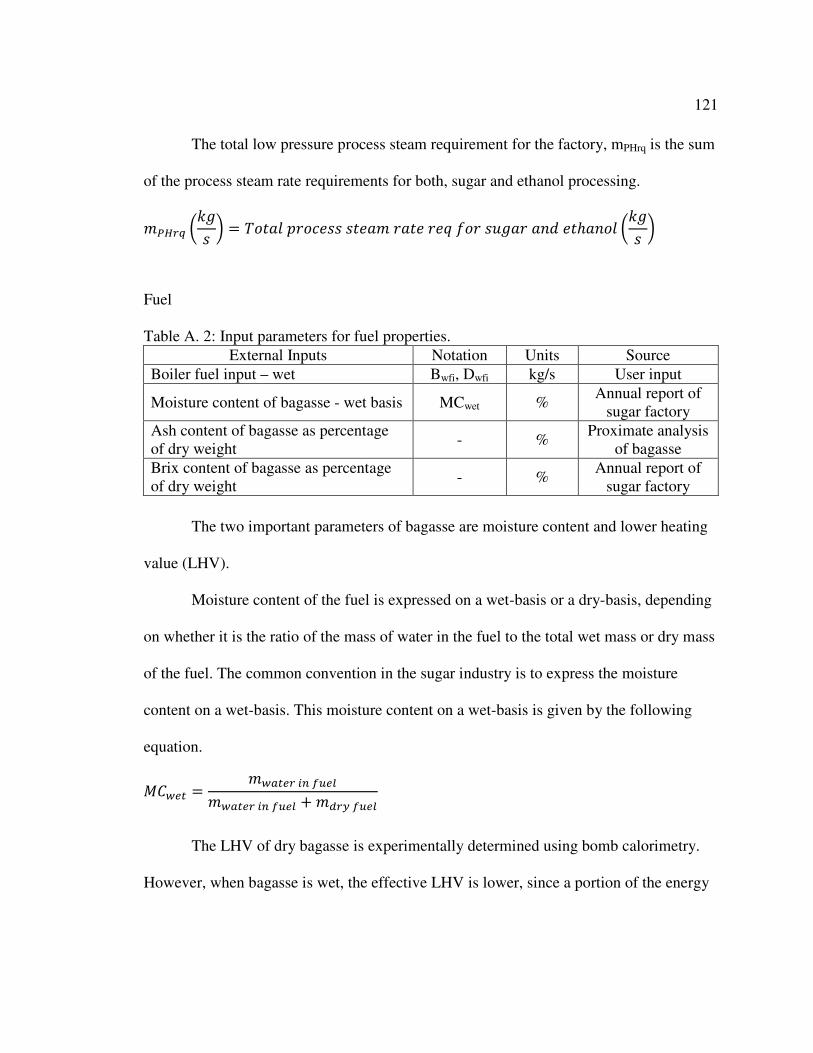
121
The total low pressure process steam requirement for the factory, mPHrq is the sum
of the process steam rate requirements for both, sugar and ethanol processing.
�TUVW :�*� ; P�"&� 0��! �� �" &� �&" � S 4�� �/*&� &%. "B&%�� :�*� ;
Fuel
Table A. 2: Input parameters for fuel properties.
External Inputs Notation Units Source
Boiler fuel input – wet Bwfi, Dwfi kg/s User input
Moisture content of bagasse - wet basis MCwet % Annual report of
sugar factory
Ash content of bagasse as percentage of dry weight
- % Proximate analysis
of bagasse
Brix content of bagasse as percentage of dry weight
- % Annual report of
sugar factory
The two important parameters of bagasse are moisture content and lower heating
value (LHV).
Moisture content of the fuel is expressed on a wet-basis or a dry-basis, depending
on whether it is the ratio of the mass of water in the fuel to the total wet mass or dry mass
of the fuel. The common convention in the sugar industry is to express the moisture
content on a wet-basis. This moisture content on a wet-basis is given by the following
equation.
A�X6Y �XZY6V [\ ]^6_�XZY6V [\ ]^6_ ��`Va ]^6_
The LHV of dry bagasse is experimentally determined using bomb calorimetry.
However, when bagasse is wet, the effective LHV is lower, since a portion of the energy
122
is lost to evaporating the moisture from the bagasse. The Sugar Engineers’ Library
provides a relationship between the HHV and LHV of wet bagasse, and its moisture, ash
and brix content.
��= '19605 � 196.05 < %A�X6Y � 196.05 < %M�BX6Y � 31.14 < %L�#2X6Y)��/�*
-�= '18309 � 207.6 < %A�X6Y � 196.05 < %M�BX6Y � 31.14 < %L�#2X6Y)��/�*
- (Sugar Engineers’ Library (a))
Since both Brix and Ash contents are analyzed as a percentage of dry fuel, it is
necessary to compute their percentages as part of wet bagasse to determine the lower
heating value.
%L�#2X6Y %L�#2`Va < '1 � A�X6Y) %M�BX6Y %M�B`Va < '1 � A�X6Y)
1�$ �&�� �4 c&*&�� :�*� ; ( " �&�� �4 c&*&�� :�*� ; < '1 � A�X6Y)

123
Appendix B: Derivations for Mass, Energy and Other Properties for the Direct Combustion Steam Rankine Cycle Model
In Appendix B and Appendix C, I provide the details of the mass and energy
balances of the direct combustion steam Rankine cycle and the biomass integrated
gasifier combined cycle models. I developed the two models in Microsoft Excel® using
functions from the Powersim, Water97 and Solver add-in programs. In this section, I
provide the detailed derivations of the states of the working fluids (gas, steam etc) at each
of the points within the models. Many of the detailed calculations in the model were
made much simpler by using functions from the above mentioned add-in programs.
Table B. 1: Parameter notations and units.
Description Notation Units
Rate of mass flow �d kg/s Temperature P
oC Pressure , bar
Specific enthalpy B kJ/kg Specific entropy � kJ/kg-K Specific volume ? m3/kg Quality of steam 2 -
Efficiency 5 %
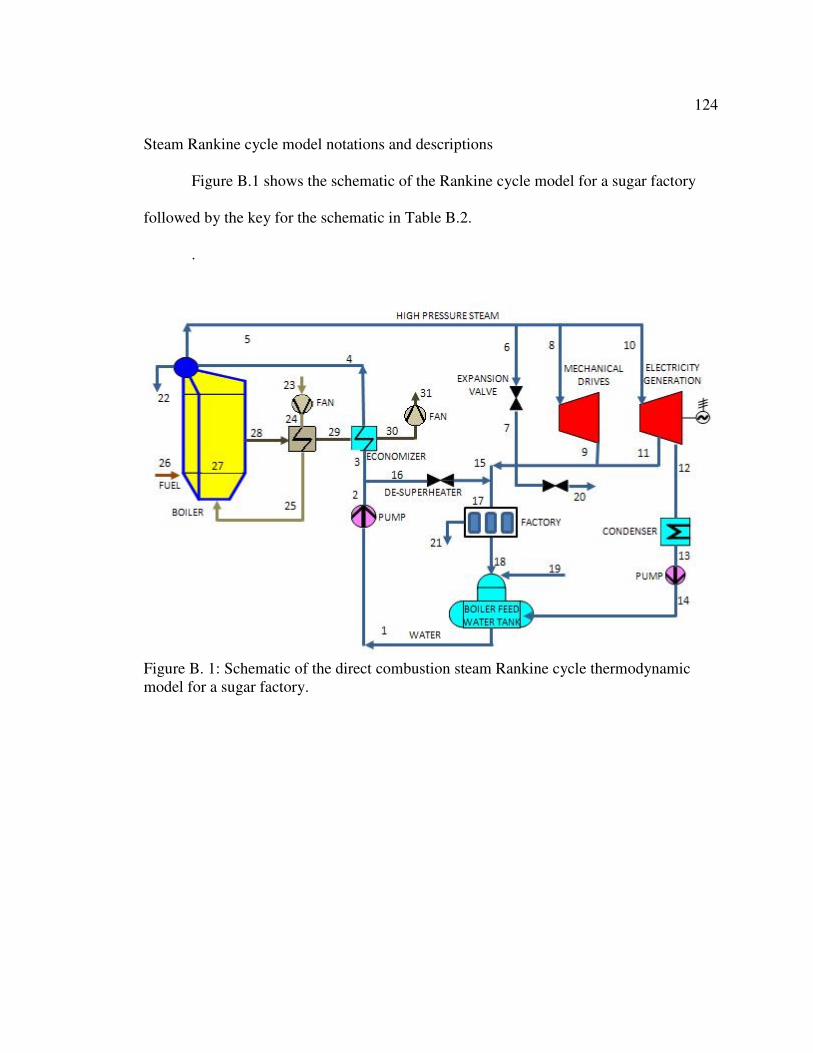
124
Steam Rankine cycle model notations and descriptions
Figure B.1 shows the schematic of the Rankine cycle model for a sugar factory
followed by the key for the schematic in Table B.2.
.
Figure B. 1: Schematic of the direct combustion steam Rankine cycle thermodynamic model for a sugar factory.
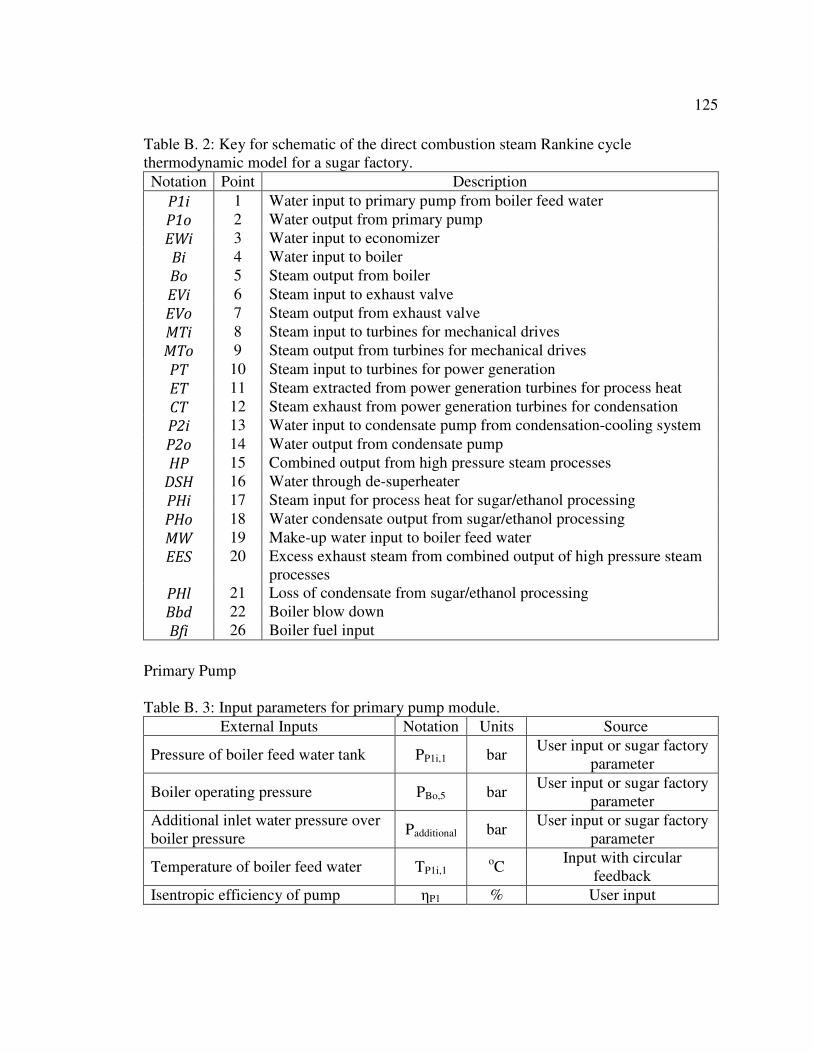
125
Table B. 2: Key for schematic of the direct combustion steam Rankine cycle thermodynamic model for a sugar factory.
Notation Point Description
P1i 1 Water input to primary pump from boiler feed water
P1o 2 Water output from primary pump
EWi 3 Water input to economizer
Bi 4 Water input to boiler
Bo 5 Steam output from boiler
EVi 6 Steam input to exhaust valve
EVo 7 Steam output from exhaust valve
MTi 8 Steam input to turbines for mechanical drives
MTo 9 Steam output from turbines for mechanical drives
PT 10 Steam input to turbines for power generation
ET 11 Steam extracted from power generation turbines for process heat
CT 12 Steam exhaust from power generation turbines for condensation
P2i 13 Water input to condensate pump from condensation-cooling system
P2o 14 Water output from condensate pump
HP 15 Combined output from high pressure steam processes
DSH 16 Water through de-superheater
PHi 17 Steam input for process heat for sugar/ethanol processing
PHo 18 Water condensate output from sugar/ethanol processing
MW 19 Make-up water input to boiler feed water
EES 20 Excess exhaust steam from combined output of high pressure steam processes
PHl 21 Loss of condensate from sugar/ethanol processing
Bbd 22 Boiler blow down
Bfi 26 Boiler fuel input
Primary Pump
Table B. 3: Input parameters for primary pump module.
External Inputs Notation Units Source
Pressure of boiler feed water tank PP1i,1 bar User input or sugar factory
parameter
Boiler operating pressure PBo,5 bar User input or sugar factory
parameter
Additional inlet water pressure over boiler pressure
Padditional bar User input or sugar factory
parameter
Temperature of boiler feed water TP1i,1 oC
Input with circular feedback
Isentropic efficiency of pump ηP1 % User input

126
Specific volume of water at primary pump inlet, ?TN[,N 4ePTN[,Nf Pressure of water at primary pump outlet,
,TNg,� ,hg,i � ,Z``[Y[g\Z_ Specific work done by primary pump,
jTN ?TN[,N < ',TNg,� � ,TN[,N)5TN
Specific enthalpy of boiler feed water/pump inlet, BTN[,N 4e,TN[,N, PTN[,Nf, from steam
tables.
Specific enthalpy of water at main pump outlet, BTNg,� BTN[,N � jTN
The primary pump supplies water to the boiler as well as the de-superheater.
Hence, the state of the water (pressure, temperature and enthalpy) through the de-
superheater is the same as the outlet of the pump.
PklU,NG PTNg,�; ,klU,NG ,TNg,�; BklU,NG BTNg,�
Boiler
Table B. 4: Input parameters for boiler module.
External Inputs Notation Units Source
Boiler fuel input – wet �d h][,�G kg/s User input
Temperature of outlet steam TBo,5 oC
User input or sugar factory parameter
Thermal efficiency of boiler ηB % User input
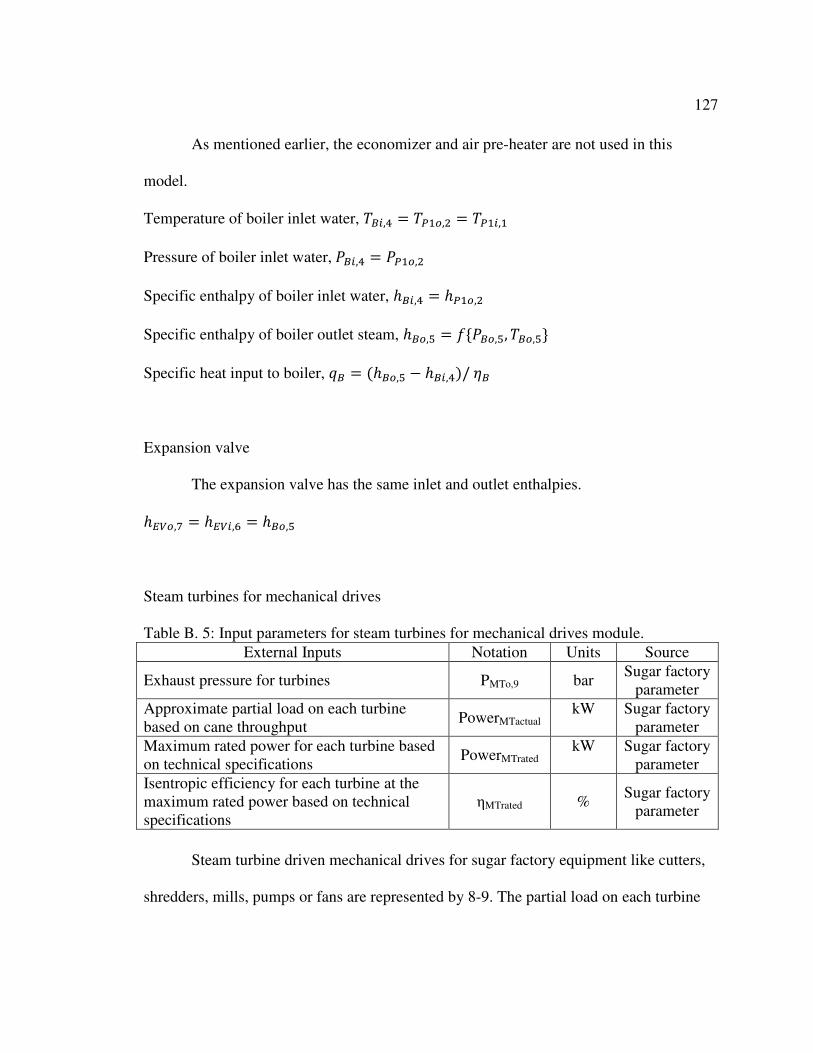
127
As mentioned earlier, the economizer and air pre-heater are not used in this
model.
Temperature of boiler inlet water, Ph[,� PTNg,� PTN[,N
Pressure of boiler inlet water, ,h[,� ,TNg,�
Specific enthalpy of boiler inlet water, Bh[,� BTNg,�
Specific enthalpy of boiler outlet steam, Bhg,i 4e,hg,i, Phg,if Specific heat input to boiler, Sh 'Bhg,i � Bh[,�)/ 5h
Expansion valve
The expansion valve has the same inlet and outlet enthalpies.
Bmng,H Bmn[,G Bhg,i
Steam turbines for mechanical drives
Table B. 5: Input parameters for steam turbines for mechanical drives module.
External Inputs Notation Units Source
Exhaust pressure for turbines PMTo,9 bar Sugar factory
parameter
Approximate partial load on each turbine based on cane throughput
PowerMTactual kW
Sugar factory
parameter
Maximum rated power for each turbine based on technical specifications
PowerMTrated kW
Sugar factory
parameter
Isentropic efficiency for each turbine at the maximum rated power based on technical specifications
ηMTrated % Sugar factory
parameter
Steam turbine driven mechanical drives for sugar factory equipment like cutters,
shredders, mills, pumps or fans are represented by 8-9. The partial load on each turbine

128
depends on the cane throughput through the particular piece of equipment. The Sugar
Engineers’ Library (Sugar Engineers’ Library (b)) provides a function to derate the
isentropic efficiency of steam turbines based on their partial load and their maximum
rated power.
5op`6VZY6` : 5opVZY6`1 � 5opVZY6`; <,�j �opZqY^Z_
r,�j �opVZY6` � Q 5opVZY6`1 � 5opVZY6`R < ,�j �opZqY^Z_s
The temperature, pressure and specific enthalpy of steam input to turbines for
mechanical drives are assumed equal to those at the boiler outlet.
Pop[,t Phg,i ; ,op[,t ,hg,i; Bop[,t Bhg,i
The specific entropy of the steam input to the turbines is a function of pressure
and temperature.
�op[,t 4e,op[,t, Pop[,tf For an ideal turbine, the specific entropies of the steam at inlet and outlet are
equal.
�opg,F[`6Z_ �op[,t
The ideal quality of the steam at outlet of turbine, xMTo,9ideal is a function of the
ideal specific entropy and exhaust pressure.
2opg,F[`6Z_ 4e�opg,F[`6Z_, ,opg,Ff The ideal specific enthalpy of the steam at outlet of turbine is a function of the
ideal quality and exhaust pressure.
Bopg,F[`6Z_ 4e2opg,F[`6Z_, ,opg,Ff

129
The actual enthalpy of the steam at outlet of turbine takes into account the
isentropic efficiency of the turbine.
Bopg,F Bop[,t � 5op`6VZY6` < 'Bop[,t � Bopg,F[`6Z_) Actual specific work done by the turbine is given by the following equation.
jop Bop[,t � Bopg,F
The rate of steam consumption for each of these turbines depends on the actual
estimated power consumption of that turbine, which in turn is based on the cane
throughput for that equipment.
�d op,F ,�j �opZqY^Z_jop
The total power consumption, specific enthalpy and rate of steam consumption for
‘n’ number of turbines are the sums for all the turbines.
P�"&� ,�j �op ',�j �op)N � ',�j �op)� �u� ',�j �op)\
P�"&� �d op,F '�d op,F)N � '�d op,F)� �u� '�d op,F)\
P�"&� Bopg,F r'�d op,F)N < vBopg,FwN � '�d op,F)� < vBopg,Fw� �u� '�d op,F)\ < vBopg,Fw\sr'�d op,F)N � '�d op,F)� �u� '�d op,F)\s
When variable speed electric drives are used in place of steam turbines, the above
parameters are reduced to zero.
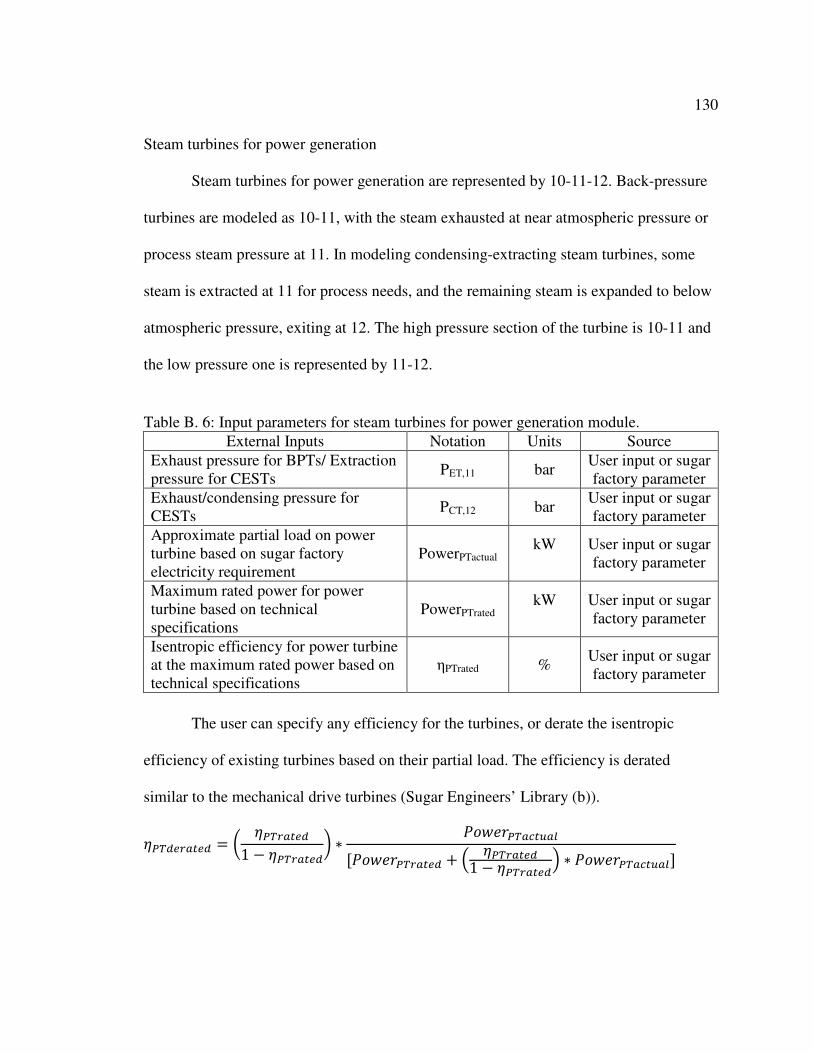
130
Steam turbines for power generation
Steam turbines for power generation are represented by 10-11-12. Back-pressure
turbines are modeled as 10-11, with the steam exhausted at near atmospheric pressure or
process steam pressure at 11. In modeling condensing-extracting steam turbines, some
steam is extracted at 11 for process needs, and the remaining steam is expanded to below
atmospheric pressure, exiting at 12. The high pressure section of the turbine is 10-11 and
the low pressure one is represented by 11-12.
Table B. 6: Input parameters for steam turbines for power generation module.
External Inputs Notation Units Source
Exhaust pressure for BPTs/ Extraction pressure for CESTs
PET,11 bar User input or sugar factory parameter
Exhaust/condensing pressure for CESTs
PCT,12 bar User input or sugar factory parameter
Approximate partial load on power turbine based on sugar factory electricity requirement
PowerPTactual kW
User input or sugar factory parameter
Maximum rated power for power turbine based on technical specifications
PowerPTrated kW
User input or sugar factory parameter
Isentropic efficiency for power turbine at the maximum rated power based on technical specifications
ηPTrated % User input or sugar factory parameter
The user can specify any efficiency for the turbines, or derate the isentropic
efficiency of existing turbines based on their partial load. The efficiency is derated
similar to the mechanical drive turbines (Sugar Engineers’ Library (b)).
5Tp`6VZY6` : 5TpVZY6`1 � 5TpVZY6`; <,�j �TpZqY^Z_
r,�j �TpVZY6` � Q 5TpVZY6`1 � 5TpVZY6`R < ,�j �TpZqY^Z_s
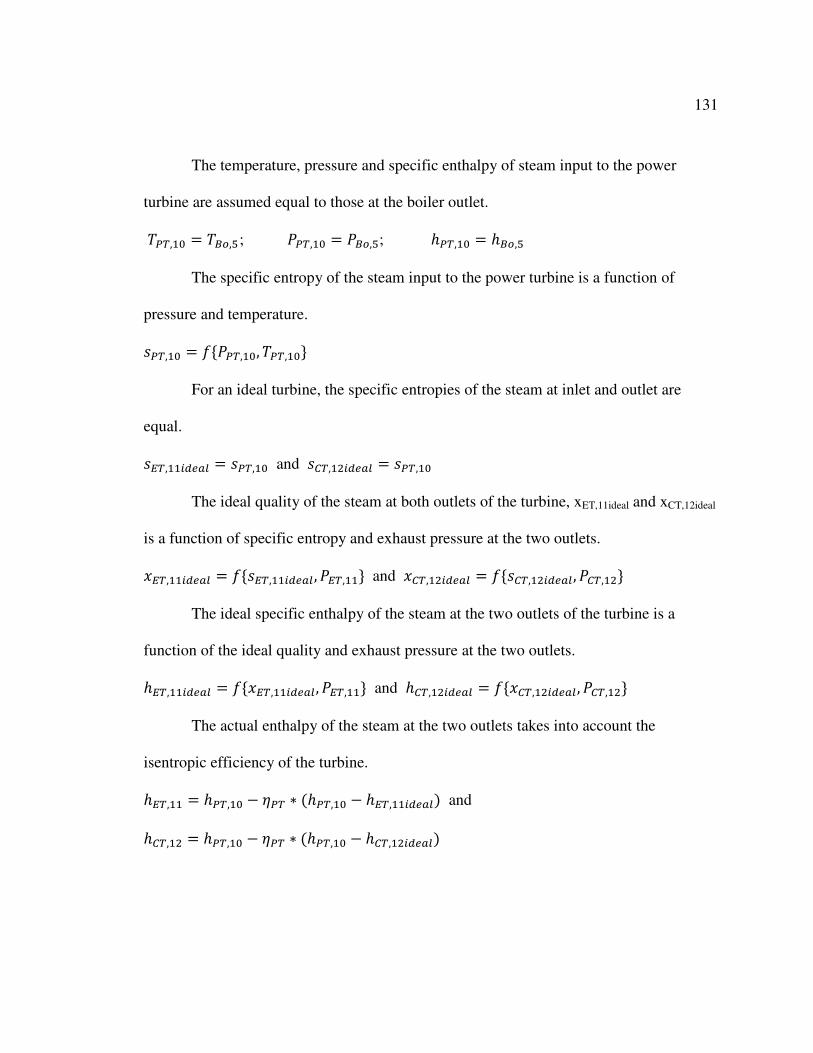
131
The temperature, pressure and specific enthalpy of steam input to the power
turbine are assumed equal to those at the boiler outlet.
PTp,NI Phg,i ; ,Tp,NI ,hg,i; BTp,NI Bhg,i
The specific entropy of the steam input to the power turbine is a function of
pressure and temperature.
�Tp,NI 4e,Tp,NI, PTp,NIf For an ideal turbine, the specific entropies of the steam at inlet and outlet are
equal.
�mp,NN[`6Z_ �Tp,NI and �xp,N�[`6Z_ �Tp,NI
The ideal quality of the steam at both outlets of the turbine, xET,11ideal and xCT,12ideal
is a function of specific entropy and exhaust pressure at the two outlets.
2mp,NN[`6Z_ 4e�mp,NN[`6Z_, ,mp,NNf and 2xp,N�[`6Z_ 4e�xp,N�[`6Z_, ,xp,N�f The ideal specific enthalpy of the steam at the two outlets of the turbine is a
function of the ideal quality and exhaust pressure at the two outlets.
Bmp,NN[`6Z_ 4e2mp,NN[`6Z_, ,mp,NNf and Bxp,N�[`6Z_ 4e2xp,N�[`6Z_, ,xp,N�f The actual enthalpy of the steam at the two outlets takes into account the
isentropic efficiency of the turbine.
Bmp,NN BTp,NI � 5Tp < 'BTp,NI � Bmp,NN[`6Z_) and
Bxp,N� BTp,NI � 5Tp < 'BTp,NI � Bxp,N�[`6Z_)
132
Actual specific work done by the high pressure and low pressure sections of the
turbine are given by the following equations.
jmp,NIyNN BTp,NI � Bmp,NN and jxp,NNyN� Bmp,NN � Bxp,N�
In case of a stand-alone factory with back-pressure turbines, the actual specific
work is given by wET. For electricity export using back-pressure turbines, PCT,12 is
assumed to be equal to PET,11, and the excess high pressure steam passes through 11-12.
However, this configuration is seldom used in practice. Back-pressure turbines tend to
use less or about the same amount of steam as low pressure process steam. Any
imbalance is either passed through the expansion valve or vented through the exhaust
valve at 20.
Condenser and Condensate Pump
Table B. 7: Input parameters for condenser and condensate pump module.
External Inputs Notation Units Source
Output pressure of condensate pump PP2o,14 bar User input
Isentropic efficiency for pump ηP2 % User input
The exhaust steam from the steam turbine exits at 12 passes through a condenser
and is condensed to saturated liquid. The condenser operates at the same pressure as the
exit pressure of the turbine.
,xp,N� ,T�[,NE
The enthalpy and temperature of the saturated liquid at 13 are a function of
pressure and are derived from the steam tables.
BT�[,NE 4e,T�,NEf, PT�[,NE 4e,T�,NEf
133
The condensate pump, P2, then pumps the liquid to a user defined pressure, PP2o,14
higher than the boiler feed water pressure.
Specific volume of water at condensate pump inlet, ?T�[,NE 4ePT�[,NEf Specific work done by condensate pump,
jT� ?T�[,NE < ',T�g,N� � ,T�[,NE)5T�
Specific enthalpy of water at condensate pump outlet, BT�g,N� BT�[,NE � jT�
Mass and Energy Balance for high and low pressure steam
The main premise of the models is that the low pressure process steam demand
for the sugar/ethanol factory needs to be satisfied. This required process steam is in a
saturated vapor state, since the most effective heat transfer to the various sugar/ethanol
processes occurs when the saturated vapor condenses into saturated liquid. This
requirement is calculated based on the sugar factory cane throughput and the ethanol
produced.
Table B. 8: Input parameter for mass and energy balance for steam Rankine cycle model.
External Inputs Notation Units Source
Process steam pressure PPH,17 bar User input or sugar factory parameter
The required mass of process steam, mPhi,rq is derived in the Factory Requirements
section of Appendix A.

134
The enthalpy of the required process steam is a function of the process steam
pressure.
BTU[VW,NH 4e,TU,NHf However, the quality of the steam at 17 could be less than one, indicating that it is
not in a saturated vapor state but a ‘wet’ state. In that case, the model adjusts or increases
the mass of the wet process steam such that the total enthalpy of the steam would be the
same as that of the required process steam in saturated state.
As explained in earlier text, the assumptions for a stand-alone factory with BPTs
are different than a factory with CESTs. For an electricity exporting factory with back-
pressure turbine/s, the logic is the same as an electricity exporting factory with
condensing-extraction turbine/s with the condensing turbine exit pressure the same as the
extraction pressure for process heat steam. Here, I present the mass and energy balance
for the high and low pressure steam for the two different options.
Stand-alone factory with back-pressure power turbines
In this case, the main assumption is that the bagasse input provided to the factory
exactly satisfies the low pressure process steam demand as well as high pressure demand
for power generation and mechanical drives. If low pressure steam demand is higher than
high pressure steam requirement, the additional high pressure steam is passed through the
expansion valve at 6. If the opposite is true, then the excess high pressure steam is
135
exhausted at 20. The macros in the model calculate the exact amount of bagasse input
required to satisfy both the high and low pressure demands.
The process steam requirement is met by the high pressure steam exhaust at 15
and the de-superheater water that brings the steam at 17 to saturated vapor state.
�d UT,Ni ��d klU,NG �d TU[VW,NH
In a stand-alone factory, the steam requirements for mechanical drives and power
turbines are known based on its fixed consumption.
For low pressure steam > high pressure steam, �d TU[VW,NH z �d op,F ��d mp,NN
�d UT,Ni �d mn,H ��d op,F ��d mp,NN
�d klU,NG �d TU[VW,NH � '�d mn,H ��d op,F ��d mp,NN) Enthalpy balance
�d mn,H < Bmng,H ��d op,F < Bopg,F ��d mp,NN < Bmp,NN ��d klU,NG < BklU,NG �d TU[VW,NH < BTU[VW,NH
�d mn,H < Bmng,H ��d op,F < Bopg,F ��d mp,NN < Bmp,NN� {�d TU[VW,NH � v�d mn,H ��d op,F ��d mp,NNw| < BklU,NG �d TU[VW,NH < BTU[VW,NH
�d mn,H }�d TU[VW,NH < BTU[VW,NH ��d op,F < Bopg,F ��d mp,NN < Bmpg,NN �v�d TU[VW,NH ��d op,H ��d mp,Fw < BklU,NG ~'Bmng,H � BklU,NG)
If �d mn,H � 0, then set �d mn,H 0
When low pressure steam demand is less than high pressure steam demand, the
above equation will yield �d mn,H � 0. This means that no steam passes through the
expansion valve.

136
For low pressure steam < high pressure steam, �d TU[VW,NH � �d op,F ��d mp,NN
�d UT,Ni ��d mml,�I ��d op,F ��d mp,NN
�d klU,NG �d TU[VW,NH � '��d mml,�I ��d op,F ��d mp,NN) Enthalpy balance
��d mml,�I < Bmml,�I ��d op,F < Bopg,F ��d mp,NN < Bmp,NN ��d klU,NG < BklU,NG �d TU[VW,NH < BTU[VW,NH
�d mn,H < Bmn,H ��d op,F < Bopg,F ��d mp,NN < Bmp,NN� {�d TU[VW,NH � v��d mml,�I ��d op,F ��d mp,NNw| < BklU,NG �d TU[VW,NH < BTU[VW,NH
�d mml,�I }�d TU[VW,NH < BTU[VW,NH ��d op,F < Bopg,F ��d mp,NN < Bmp,NN �v�d TU[VW,NH ��d op,F ��d mp,NNw < BklU,NGs ~'BklU,NG � Bmml,�I)
If �d mml,�I � 0, then set �d mml,�I 0
When low pressure steam demand is higher than high pressure steam demand, the
above equation will yield �d mml,�I � 0. This means that no steam is exhausted.
BUT,Ni �d mn,H < BmngH ��d op,F < Bopg,F ��d mp,NN < Bmp,NN ��d mml,�I < Bmml,�I'�d mn,H ��d op,F ��d mp,NN ��d mml,�I)
�d UT,Ni �d TU[VW,NH < 'BTU[VW,NH � BklU,NG)'BUT,Ni � BklU,NG)
�d klU,NG �d TU[VW,NH ��d UT,Ni
If �d klU,NG � 0, then set �d klU,NG 0
137
�d klU,NG will be less than zero if the quality of the steam at 15 is less than one, i.e. the
steam is wet. In that case, �d TU[ZqY^Z_,NH and BTU[ZqY^Z_,NH would differ from the required
mass and enthalpy of saturated steam.
�d TU[ZqY^Z_,NH �d UT,Ni ��d klU,NG
BTU[ZqY^Z_,NH �d UT,Ni < BUT,Ni ��d klU,NG < BklU,NG�d TU[ZqY^Z_,NH
Stand-alone and electricity exporting factory with condensing-extraction power turbines
The main assumption in modeling a factory with CESTs is that no steam passes
through the expansion valve or is exhausted to atmosphere. Since all scenarios that use
CESTs in my thesis are electricity exporting factories, the assumption is that any excess
high pressure steam is expanded through the turbines to below atmospheric.
In this case, the mass of steam being extracted at 11 is unknown.
�d mp,NN ��d op,F ��d klU,NG �d TUVW,NH
�d mp,NN �d TUVW,NH ��d op,F ��d klU,NG
�d op,F < Bopg,F ��d mp,NN < Bmp,NN ��d klU,NG < BklU,NG �d TUVW,NH < BTUVW,NH
Substituting �d mp,NN in the above equation, �d op,F < Bopg,F � '�d TUVW,NH ��d op,F ��d klU,NG) < Bmp,NN ��d klU,NG < BklU,NG
�d TUVW,NH < BTUVW,NH �d klU,NG �d TUVW,NH < BTUVW,NH ��d op,F < Bopg,F � '�d TUVW,NH��d op,F) < Bmp,NN'BklU,NG � Bmp,NN)
138
If �d klU,NG � 0, then set �d klU,NG 0
Again, �d klU,NG will be less than zero if the quality of the steam at 15 is less than
one, i.e. the steam is wet.
Solving for �d mp,NN,
�d op,F < Bopg,F ��d mp,NN < Bmp,NN ��d klU,NG < BklU,NG �d TUVW,NH < BTUVW,NH
�d mp,NN �d TUVW,NH < BTUVW,NH ��d op,F < Bopg,F ��d klU,NG < BklU,NGBmp,NN
BUT,Ni �d op,F < Bopg,F ��d mp,NN < Bmp,NN'�d op,F ��d mp,NN)
�d UT,Ni �d op,F ��d mp,NN
The remaining excess high pressure steam, if any, is expanded through 12.
�d xp,N� �d hg,i ��d UT,Ni
Also, �d xp,N� �d T�[,NE �d T�g,N�
The total high pressure steam passing through the CEST is total steam exhausted
at 11 and 12.
�d Tp,NI �d mp,NN ��d xp,N�
�d TUZqY^Z_,NH �d UT,Ni ��d klU,NG
BTUZqY^Z_,NH �d UT,Ni < BUT,Ni ��d klU,NG < BklU,NG�d TUZqY^Z_,NH
�d TUZqY^Z_,NH and BTUZqY^Z_,NH will be the same as required if the quality of steam
is one, but would differ if the steam is wet.

139
Balance between steam generated in boiler and high pressure steam requirement
The steam generated in the boiler depends on the bagasse input to the boiler, the
lower heating value of the wet bagasse and the specific heat input to the boiler (qb) as
derived in the Boiler section.
�d h[,� L�#� � #%0/" :�*� ; < -�= :���*;S� :���*;
Some steam is lost in blowdown, a requirement for the boiler. The output of the
boiler reflects this loss.
�d hg,i �d h[,� < '1 � L��j.�j%'%)) �d h�`,�� �d h[,� < L��j.�j%'%)
For a stand-alone factory with BPTs, this steam generation at the output of the
boiler needs to be equal to the sum of the high pressure steam at 15 and the exhausted
high pressure steam in case of excess. For a factory with CESTs, the steam generation
needs to be at least equal to if not higher than the high pressure steam at 15. No steam is
exhausted for this option, since the excess steam is expanded through the CESTs. This
ensures that the bagasse input generates enough steam to satisfy the process steam
demand of the factory.
�d hg,i �d UT,Ni ��d mml,�I
The macros in the model are capable of adjusting the bagasse input value to
ensure that this requirement is met. For a stand-alone factory case, the macros calculate
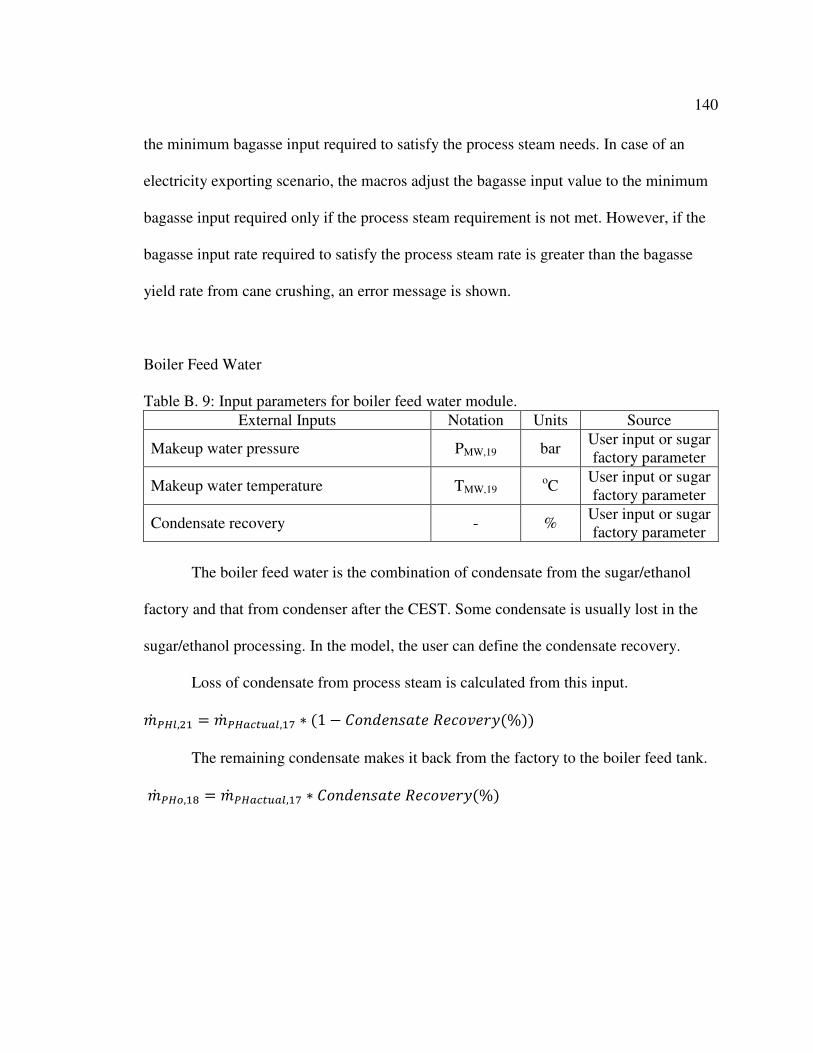
140
the minimum bagasse input required to satisfy the process steam needs. In case of an
electricity exporting scenario, the macros adjust the bagasse input value to the minimum
bagasse input required only if the process steam requirement is not met. However, if the
bagasse input rate required to satisfy the process steam rate is greater than the bagasse
yield rate from cane crushing, an error message is shown.
Boiler Feed Water
Table B. 9: Input parameters for boiler feed water module.
External Inputs Notation Units Source
Makeup water pressure PMW,19 bar User input or sugar factory parameter
Makeup water temperature TMW,19 oC
User input or sugar factory parameter
Condensate recovery - % User input or sugar factory parameter
The boiler feed water is the combination of condensate from the sugar/ethanol
factory and that from condenser after the CEST. Some condensate is usually lost in the
sugar/ethanol processing. In the model, the user can define the condensate recovery.
Loss of condensate from process steam is calculated from this input.
�d TU_,�N �d TUZqY^Z_,NH < '1 � ��%. %�&" 8 !�? �$'%)) The remaining condensate makes it back from the factory to the boiler feed tank.
�d TUg,Nt �d TUZqY^Z_,NH < ��%. %�&" 8 !�? �$'%)
141
The makeup water at 19 is added to the boiler feed water tank to make for the
condensate loss, loss due to boiler blowdown and the excess exhausted high pressure
steam, if any. Its enthalpy is a function of the user defined pressure and temperature.
�d o�,NF �d TU_,�N ��d h�`,�� ��d mml,�I; Bo�,NF 4e,o�,NF, Po�,NFf The total mass of the boiler feed water, which is the input to the primary pump is
the sum of all the recovered condensate and the makeup water.
�d TN[,N �d TUg,Nt ��d T�g,N� ��d o�,NF
The specific enthalpy depends on the cumulative enthalpies of the three inputs.
BTN[,N �d TUg,Nt < BTUg,Nt ��d T�g,N� < BT�g,N� ��d o�,NF < Bo�,NF�d TN[,N
The temperature of the boiler feed water is a function of this enthalpy and the
pressure of the boiler feed water tank.
PTN[,N 4eBTN[,N, ,TN[,Nf As mentioned in the primary pump section, this temperature is an input to the
model. It is recalculated as above, and is provided as a circular input the model. The
macros recalculate all the mass and energy balances till there is no difference between the
initial boiler feed water temperature input and the final calculated temperature.

142
Energy generation and consumption
Table B. 10: Input parameters for energy generation and consumption module for steam Rankine cycle model.
External Inputs Notation Units Source
Mechanical efficiency for power turbine ηPTmech % User input or sugar factory parameter
Electrical/generator efficiency for power turbine
ηPTelec % User input or sugar factory parameter
Variable speed electric drive efficiency ηvarelec % User input
Approximate partial load on fans based on sugar factory data
Powerfans kW User input or sugar factory parameter
The gross electricity generation is the total electricity generated by the
cogeneration system, after accounting for mechanical and generator efficiencies.
����� � !"�#!#"$ * % �&"#�% '�( ) '�d mp,NN < jmp,NIyNN ��d xp,N� < jxp,NNyN�) < 5Tp�6q� < 5Tp6_6q
When pumps and fans are electric driven, they are considered a parasitic load on
the cogeneration system and their consumption is determined by the following equations.
Powerfans is determined based on existing sugar factory data or boiler system
specification. The variable speed electric drive efficiency is assumed to be the same for
all electric driven equipment including pumps and fans.
�� !"�#!#"$ !�%�/�0"#�% c$ 0/�0�'�( ) 'jTN �jT�) < 5�ZV6_6q
�� !"�#!#"$ !�%�/�0"#�% c$ 4&%�'�( ) ,�j �]Z\� < 5�ZV6_6q
I have assumed only these two loads as the total parasitic load on the cogeneration
system. Any additional parasitic load is accounted for in the sugar processing load of the
existing factory.

143
��* % +$�" � ,&�&�#"#! -�&.'�( ) �� !"�#!#"$ !�%�/�0"#�% c$ 0/�0� � �� !"�#!#"$ !�%�/�0"#�% c$ 4&%�
The net electricity generation, a key parameter for cogeneration systems is the net
amount of electricity generation out of a cogeneration system after taking the parasitic
loads into account.
3 " �� !"�#!#"$ � % �&"#�% '�( ) ����� �� !"�#!#"$ � % �&"#�% � ��* % +$�" � ,&�&�#"#! -�&.

144
Appendix C: Derivations for Mass, Energy and Other Properties for the Biomass Integrated Gasifier Combined Cycle Model
Figure C.1 shows the schematic of the biomass integrated gasifier combined cycle
model for a sugar factory followed by the key for the schematic in Table C.1.
Figure C. 1: Schematic of the biomass integrated gasifier combined cycle thermodynamic model for a sugar factory.

145
Table C. 1: Key for schematic of the Biomass integrated gasifier combined cycle thermodynamic model for a sugar factory.
Notation Point Description
ACi 1 Air input to main air compressor - Brayton cycle
ACo 2 Air output from main air compressor - Brayton cycle
PGCo 3 Product gas output from product gas compressor – Brayton cycle
GTi 4 Combusted air/gas input to gas turbine – Brayton cycle
GTo 5 Exhaust from gas turbine, Input to HRSG – Brayton cycle
HRSGe 6 Flue gas exhaust from HRSG, input to dryer
P1o 7 Water output from main pump
HRSGi 8 Water input to heat recovery steam generator
HRSGo 9 Steam output from heat recovery steam generator
PT 10 Steam input to turbines for power generation
ET 11 Steam extracted from power generation turbines for process heat
CT 12 Steam exhaust from power generation turbines for condensation
P2i 13 Water input to condensate pump from condensation-cooling system
P2o 14 Water output from condensate pump
HP 15 Combined output from high pressure steam processes
DSH 16 Water through de-superheater
PHi 17 Steam input for process heat for sugar/ethanol processing
PHo 18 Water condensate output from sugar/ethanol processing
MW 19 Make-up water input to boiler feed water
P1i 20 Water input to main pump from boiler feed water - SRC
EVi 21 Steam input to exhaust valve
EVo 22 Steam output from exhaust valve
PHl 23 Loss of condensate
FACi 24 Air input to fluidizing air compressor
FACo 25 Air output from fluidizing air compressor, input to gasifier
GFsi 26 Steam input to gasifier, not used in this thesis’ analysis
GFgo 27 Product gas output from gasifier, input to gas cleanup system
PGCi 28 Product gas input to product gas compressor, output from gas cleanup system
GFslo 29 Slag output from gasifier
Dge 30 Flue gas exhaust from dryer
Dwfi 31 Wet fuel input to dryer
Dfb 32 Fuel burned in dryer
GFfi 33 Input fuel to gasifier

146
Ambient air
Table C. 2: Input parameters for ambient air module.
External Inputs Notation Units Source
Atmospheric pressure Pair bar Average for sugar factory location
Ambient temperature Tair oC Average for sugar factory location
Relative humidity φair % Average for sugar factory location
Relative humidity, φair is the ratio of the partial pressure of the vapor as it exists in
the air mixture, Pv, to the saturation pressure of the vapor at the same temperature, Pg
(determined from steam tables).
,�'c&�) �Z[V'%) < ,�'c&�), jB � ,� 4ePZ[Vf +0 !#4#! B/�#.#"$, �Z[V : �*����*.�$&#�; 0.622 < ,�'c&�),Z[V'c&�)
The factor of 0.622 is the ratio of the molecular weight of water to the molecular
weight of air.
Dryer
Table C. 3: Input parameters for dryer module.
External Inputs Notation Units Source
Efficiency of dryer ηdryer % User input
Dryer exhaust temperature TDge oC User input
Wet bagasse input to dryer �d kX][,EN kg/s User input
Dried bagasse burned in dryer – starting number
�d k]�,E�[\[Y[Z_ kg/s Input with circular
feedback
Initial moisture content of fuel, input to dryer
MCwet fuel % User input
Target moisture content of fuel out of dryer, input to gasifier
MCdried fuel % User input
Specific heat of bagasse Cpbagasse kJ/kg-K User input
Specific heat of water Cpwater kJ/kg-K User input

147
The dry mass of bagasse fuel fed into the dryer is an important parameter from
which other parameters can be derived.
�d `Va [\�^Y ]^6_ �d kX][,EN'1 � A�X6Y ]^6_) The mass of water in the wet input fuel as well as the dried fuel is calculated by
the following equations.
�d XZY6V [\ [\�^Y ]^6_ �d `Va [\�^Y ]^6_ < C A�X6Y ]^6_1 �A�X6Y ]^6_D
�d XZY6V [\ `V[6` ]^6_ �d `Va [\�^Y ]^6_ < C A�`V[6` ]^6_1 �A�`V[6` ]^6_D
The dryer utilizes two sources of energy: the exhaust flue gas from the HRSG and
by burning some of the dried bagasse fuel. The rest of the dried fuel is fed into the
gasifier. The temperature of the wet input fuel is the same as ambient, while its specific
enthalpy is equal to the LHV of the wet fuel, computed using equations from
Appendix A.
PkX][,EN PZ[V
BkX][,EN -�=X6Y [\�^Y �Z�Z��6
I assumed the temperature of the dried fuel from the dryer as equal to the exhaust
temperature of the flue gas from the dryer. The exhaust temperature is a user defined
input. The specific enthalpy of the dried fuel depends on the specific heat of the fuel,
temperature rise and LHV of the dried fuel.
Pk]�,E� P��][,EE Pk�6,EI

148
Bk]�,E� B��][,EE ���Z�Z��6 < vPk]�,E� � PZ[Vw � -�=̀ V[6` �Z�Z��6
The mass and energy balance of the dryer is calculated in a circular feedback
loop. The rate of dried fuel input to the gasifier, �d ��][,EE is computed using a starting
dried fuel input rate to the dryer, �d k]�,E�[\[Y[Z_. �d ��][,EE �d `Va [\�^Y ]^6_v1 � A�`V[6` ]^6_w � �d k]�,E�[\[Y[Z_
The �d ��][,EE, B��][,EE and P��][,EEserve as inputs to the gasifier module. The
mass and energy balances are computed in a loop till the HRSG. The flue gas
composition, rate of mass flow of the flue gas and the specific enthalpy of the flue gas
from the HRSG output at 6 serve as inputs to the dryer module.
�d k�6,EI �d U�l�6,G
Bk�6,EI 4e9�/ *&� !��0��#"#�%, Pk�6,EIf The actual dried fuel input rate to the dryer, �d k]�,E�ZqY^Z_is calculated from the
following equation. The energy from this dried fuel and the energy from the flue gas,
after taking into account the efficiency of the dryer, is equal to the energy required to
raise the temperature of the dry fuel as well as the water in the fuel to the exhaust
temperature of the flue gas, and the latent heat of vaporization for the water that is
evaporated. Most of the energy required to dry the fuel is the latent heat of vaporization.
Hence, I neglected the energy needed to raise the vapor temperature to an exhaust
temperature that may be higher than the vaporization temperature. I also assumed that all
water is evaporated at the exhaust temperature of the flue gas, when in reality,
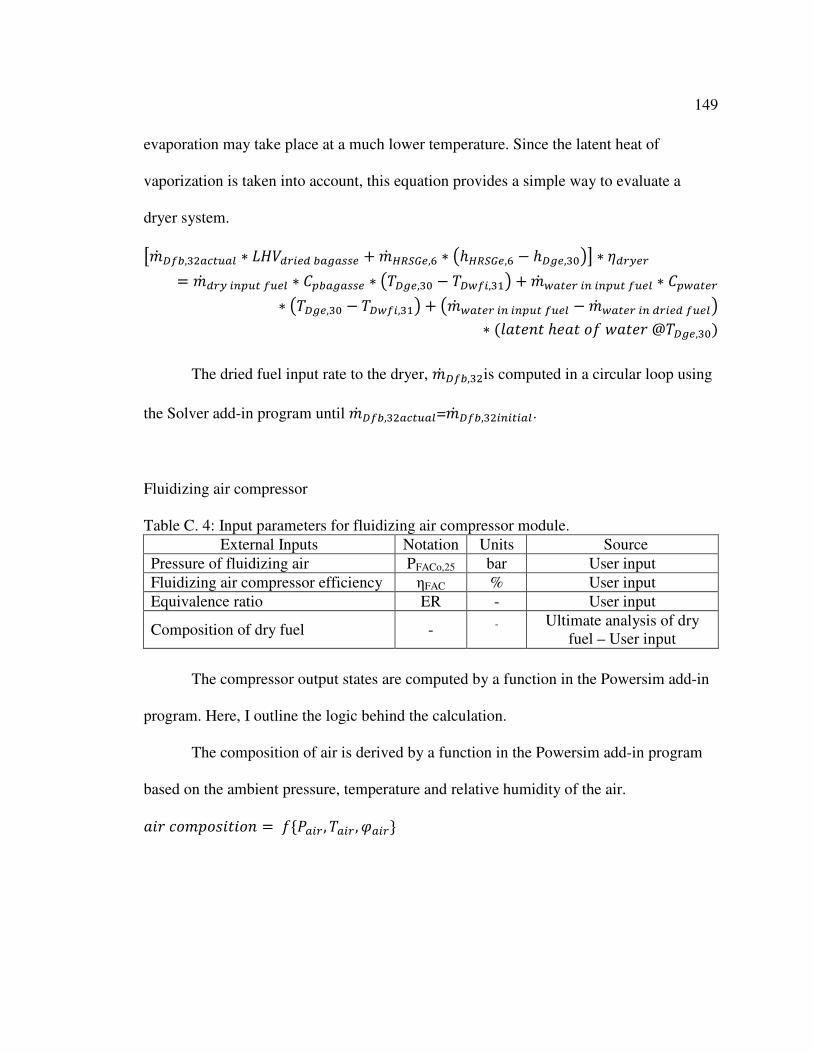
149
evaporation may take place at a much lower temperature. Since the latent heat of
vaporization is taken into account, this equation provides a simple way to evaluate a
dryer system.
{�d k]�,E�ZqY^Z_ < -�=̀ V[6` �Z�Z��6 ��d U�l�6,G < vBU�l�6,G � Bk�6,EIw| < 5`Va6V �d `Va [\�^Y ]^6_ < ���Z�Z��6 < vPk�6,EI � PkX][,ENw � �d XZY6V [\ [\�^Y ]^6_ < ��XZY6V< vPk�6,EI � PkX][,ENw � v�d XZY6V [\ [\�^Y ]^6_ ��d XZY6V [\ `V[6` ]^6_w< '�&" %" B &" �4 j&" � @Pk�6,EI)
The dried fuel input rate to the dryer, �d k]�,E�is computed in a circular loop using
the Solver add-in program until �d k]�,E�ZqY^Z_=�d k]�,E�[\[Y[Z_.
Fluidizing air compressor
Table C. 4: Input parameters for fluidizing air compressor module.
External Inputs Notation Units Source
Pressure of fluidizing air PFACo,25 bar User input
Fluidizing air compressor efficiency ηFAC % User input
Equivalence ratio ER - User input
Composition of dry fuel - -
Ultimate analysis of dry fuel – User input
The compressor output states are computed by a function in the Powersim add-in
program. Here, I outline the logic behind the calculation.
The composition of air is derived by a function in the Powersim add-in program
based on the ambient pressure, temperature and relative humidity of the air.
&#� !��0��#"#�% 4e,Z[V , PZ[V , �Z[Vf

150
The specific heat at constant pressure, Cpair and the ratio of specific heats for air,
kair are a function of the composition of air and the average temperature between the input
and output states of the compressor.
��Z[V 4e&#� !��0��#"#�%, P���'��y�i)f �Z[V 4e&#� !��0��#"#�%, P���'��y�i)f The inlet temperature and pressure are equal to those of ambient air.
P��x[,�� PZ[V and ,��x[,�� ,Z[V
The ideal temperature of the output of the fluidizing air compressor is derived
from the ideal Brayton cycle equation. Note that all temperatures in this equation are in
Kelvin.
P��xg[`6Z_,�i'�) P��x[,��'�) < �',��xg,�i/ ,��x[,�� )����yN���� �
The actual temperature of the output of the fluidizing air compressor after the
efficiency losses is given by the following equation.
P��xgZqY^Z_,�i'�) P��x[,��'�) � }{P��xg[`6Z_,�i'�) � P��x[,��'�)|5��x ~
The specific work done by the compressor,
j��x ��Z[V < rP��xgZqY^Z_,�i'�) � P��x[,��'�)s B��xg,�i 4e&#� !��0��#"#�%, P��xgZqY^Z_,�if

151
The dry mass of the bagasse fuel input to the gasifier is calculated based on the
dried bagasse input to the gasifier from the dryer and the moisture content of the dried
bagasse.
�d `Va [\�^Y ]^6_ Yg �Z�[][6V �d ��][,EE'1 � A�`V[6` ]^6_) The stoichiometric air is the amount of air required to completely combust a given
quantity of dry fuel. It depends on the composition of the dry fuel, which determined by
the ultimate analysis of the fuel.
+"�#!B#�� "�#! &#� : �* &#��* .�$ 4/ �; 4e���0��#"#�% �4 .�$ 4/ �f
The mass of air flow through the fluidizing air compressor depends on the
stoichiometric air, equivalence ratio and the dry mass of bagasse fuel input to the gasifier.
�d ��x[,�� :�*&#�� ; �d ��xg,�i :�*&#�� ; �d `Va [\�^Y ]^6_ Yg �Z�[][6V :�* .�$4/ �� ; < +"�#!B#�� "�#! &#� : �* &#��* .�$4/ �; < �8
Gasifier
Table C. 5: Input parameters for gasifier module.
External Inputs Notation Units Source
Gasifier operating pressure PGFgo,27 bar User input
Gasifier operating temperature TGFgo,27 oC
Input with circular feedback
Carbon conversion ratio Xc - User input
% of ash in dry fuel composition ash% % User input
% C in dry fuel composition C% % User input
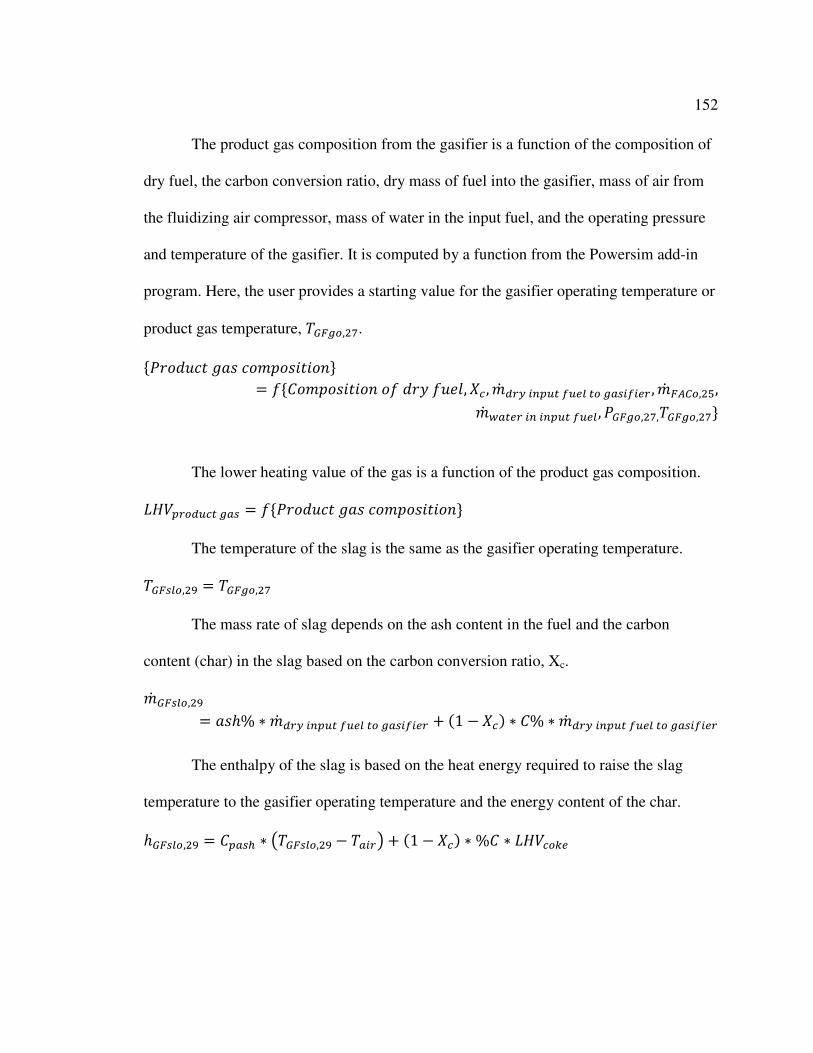
152
The product gas composition from the gasifier is a function of the composition of
dry fuel, the carbon conversion ratio, dry mass of fuel into the gasifier, mass of air from
the fluidizing air compressor, mass of water in the input fuel, and the operating pressure
and temperature of the gasifier. It is computed by a function from the Powersim add-in
program. Here, the user provides a starting value for the gasifier operating temperature or
product gas temperature, P���g,�H.
e,��./!" *&� !��0��#"#�%f 4e���0��#"#�% �4 .�$ 4/ �, �q , �d `Va [\�^Y ]^6_ Yg �Z�[][6V , �d ��xg,�i, �d XZY6V [\ [\�^Y ]^6_ , ,���g,�H,P���g,�Hf
The lower heating value of the gas is a function of the product gas composition.
-�=�Vg`^qY �Z� 4e,��./!" *&� !��0��#"#�%f The temperature of the slag is the same as the gasifier operating temperature.
P���_g,�F P���g,�H
The mass rate of slag depends on the ash content in the fuel and the carbon
content (char) in the slag based on the carbon conversion ratio, Xc.
�d ���_g,�F &�B% < �d `Va [\�^Y ]^6_ Yg �Z�[][6V � '1 � �q) < �% < �d `Va [\�^Y ]^6_ Yg �Z�[][6V
The enthalpy of the slag is based on the heat energy required to raise the slag
temperature to the gasifier operating temperature and the energy content of the char.
B���_g,�F ��Z�� < vP���_g,�F � PZ[Vw � '1 � �q) < %� < -�=qg�6

153
The product gas output from the gasifier is computed by balancing mass flows
between the input fuel, input air and output slag.
�d ���g,�H �d ��][,EE ��d ��xg,�i ��d ���_g,�F
The enthalpy of the product gas is calculated from two directions. The first one is
based on the energy balance between the input fuel, input air and output slag. The second
one is based on the energy content of the product gas and its temperature dependant
energy. The temperature of the product gas, P���g,�His adjusted so that equations a and b
yield the same product gas enthalpy, B���g,�H.
B���g,�H '�d ��][,EE < B��][,EE ��d ��xg,�i < B��xg,�i ��d ���_g,�F < B���_g,�F � � &" ����)�d ���g,�H … . . &
B���g,�H -�=�Vg`^qY �Z� � %"B&�0$4�,��./!" *&� !��0��#"#�%, P���g,�H�… . . c
Gas cleanup/conditioning system
Table C. 6: Input parameter for gas cleanup/conditioning module.
External Inputs Notation Units Source
Output temperature of clean product gas
TPGCi,28 oC User input
I assume the product gas loses heat in the gas cleanup system. This heat, in
practice can be recovered to heat water in the bottoming SRC or heating the compressed
product gas before injection in the combustor of the turbine. However, for this thesis, I
assume that this energy is lost.

154
�d T�x[,�t �d ���g,�H
BT�x[,�t -�=�Vg`^qY �Z� � %"B&�0$4�,��./!" *&� !��0��#"#�%, PT�x[,�t� The energy lost is vB���g,�H � BT�x[,�tw��/�*
Air compressor for Brayton cycle
Table C. 7: Input parameters for air compressor module for Brayton cycle.
External Inputs Notation Units Source
Brayton cycle pressure ratio Pbrayton - User input
Air compressor pressure drop - % User input
Air ratio for turbine - - User input
Air compressor efficiency ηAC % User input
The air compressor output states are computed by a function in the Powersim add-
in program, similar to the fluidizing air compressor. The logic behind the calculation is
also similar to the fluidizing air compressor.
The specific heat at constant pressure, Cpair and the ratio of specific heats for air,
kair are a function of the composition of air and the average temperature between the input
and output states of the compressor.
��Z[V 4e&#� !��0��#"#�%, P���'Ny�)f �Z[V 4e&#� !��0��#"#�%, P���'Ny�)f The inlet temperature and pressure are equal to those of ambient air.
P�x[,N PZ[V and ,�x[,N ,Z[V

155
The enthalpy of the air at the inlet of the compressor is a function of the air
composition and ambient temperature.
B�x[,N 4e&#� !��0��#"#�%, P�x[,Nf The output pressure of the air compressor is calculated after taking into account
the pressure drop in the compressor.
,�xg,� ,�x[,N < L�&$"�% !$!� 0� ��/� �&"#� < r1 � M#� !��0� ���� 0� ��/� .��0 '%)s The ideal temperature of the output of the air compressor is derived from the ideal
Brayton cycle equation. Note that all temperatures in this equation are in Kelvin.
P�xg[`6Z_,�'�) P�x[,N'�) < �',�xg,�/ ,�x[,N )����yN���� �
The actual temperature of the output of the fluidizing air compressor after the
efficiency losses is given by the following equation.
P�xgZqY^Z_,�'�) P�x[,N'�) � }{P�xg[`6Z_,�'�) � P�x[,N'�)|5�x ~
The enthalpy at the compressor outlet, B�xg,� 4e&#� !��0��#"#�%, P�xgZqY^Z_,�f The specific work done by the compressor, j�x B�xg,� � B�x[,N
The mass flow rate of air through the compressor is based on the air ratio input
from the user. This air ratio is the ratio of the mass flow rate of air through the
compressor to the stoichiometric air flow rate required for complete combustion of the
product gas.

156
+"�#!B#�� "�#! &#� 4�� 0��./!" *&� : �* &#��* 0��./!" *&�; 4e,��./!" *&� !��0��#"#�%f
�d �x[,N :�*� ; �d �xg,� :�*� ; �d ���g,�H :�*� ; < �"�#!B#�� "�#! &#� 4�� 0��./!" *&� : �* &#��* 0��./!" *&�;< &#� �&"#�
Product gas compressor
Table C. 8: Input parameters for product gas compressor module.
External Inputs Notation Units Source
Combustion chamber pressure drop - % User input
Product gas compressor efficiency ηPGC % User input
The product gas compressor output states are computed by a function in the
Powersim add-in program, similar to the fluidizing air compressor. The logic behind the
calculation is also similar to the the two compressors described above.
The specific heat at constant pressure for the product gas, Cp-product-gas and the
ratio of specific heats for air, kproduct-gas are a function of the composition of air and the
average temperature between the input and output states of the compressor.
�� �Vg`^qY �Z� 4e0��./!" *&� !��0��#"#�%, P���'�tyE)f ��Vg`^qY �Z� 4e0��./!" *&� !��0��#"#�%, P���'�tyE)f

157
The inlet temperature to the product gas compressor is a user input for the gas
cleanup/conditioning system module. The inlet pressure is the same as that of the
gasification system.
,T�x[,�t ,���g,�H
The output pressure of the air compressor is calculated after taking into account
the pressure drop in the combustion chamber of the turbine.
,T�xg,E'c&�) ,�xg,�'c&�) < r1 � ���c/�"#�% !B&�c � 0� ��/� .��0 '%)s The ideal temperature of the output of the product gas compressor is derived from
the ideal Brayton cycle equation. Note that all temperatures in this equation are in Kelvin.
PT�xg[`6Z_,E'�) PT�x[,�t'�) < �',T�xg,E/ ,T�x[,�t ):������� ¡�¢yN������� ¡�¢ ;£
The actual temperature of the output of the fluidizing air compressor after the
efficiency losses is given by the following equation.
PT�xgZqY^Z_,E'�) PT�x[,�t'�) � }{PT�xg[`6Z_,E'�) � PT�x[,�t'�)|5T�x ~
The enthalpy at the compressor outlet,
BT�xg,E 4e0��./!" *&� !��0��#"#�%, PT�xgZqY^Z_,Ef The specific work done by the compressor,
jT�x BT�xg,E � BT�x[,�t

158
The mass flow rate of air through the product gas compressor is the same as the
product gas output from the gasifier.
�d T�xg,E �d T�x[,�t �d ���g,�H
Gas turbine of Brayton cycle
Table C. 9: Input parameters for gas turbine module of Brayton cycle.
External Inputs Notation Units Source
Gas turbine pressure drop - % User input
Gas turbine efficiency ηGT % User input
The gas turbine output states are computed by a function in the Powersim add-in
program. The logic behind the calculation is described above.
The product gas is combusted with the compressed air in the combustion chamber. The
flue gas compostion is derived from the product gas composition, air ratio, which is a
user input from the air compressor module, the moisture content of the product gas and
the specific humidity of air.
e9�/ *&� !��0��#"#�%f 4e,��./!" *&� !��0��#"#�%, &#� �&"#�,A��Vg`^qY �Z�, �Z[Vf
The specific heat at constant pressure for the flue gas, Cp-flue-gas and the ratio of
specific heats for air, kflue-gas are functions of the composition of the flue gas and the
average temperature between the input and output states of the turbine.
�� ]_^6 �Z� 4e4�/ *&� !��0��#"#�%, P���'�yi)f �]_^6 �Z� 4e4�/ *&� !��0��#"#�%, P���'�yi)f

159
The mass flow rate of the flue gas is the sum of the air and product gas flow rates.
�d �p[,� �d �pg,i �d �xg,� ��d T�xg,E
The enthalpy of the flue gas at the inlet of the gas turbine is derived from the
enthalpies of the air and product gas inputs to the combustion chamber.
B�p[,� '�d �xg,� < B�xg,� ��d T�xg,E < BT�xg,E)/�d �p[,�
The temperature of the flue gas at the inlet of the gas turbine is a function of the
flue gas compostion and its enthalpy.
P�p[,�'�) 4e4�/ *&� !��0��#"#�%, B�p[,�f The air ratio, which is the user input to the air compressor module, is adjusted so
as to get this turbine inlet temperature to be within the range of the actual gas turbine
specifications.
The inlet pressure to the gas turbine is the output of the combustion chamber.
,�p[,� ,T�xg,E
The output pressure of the gas turbine is computed after taking into account the
turbine pressure drop.
,�pg,i'c&�) ,�p[,�'c&�) < r1 � �&� "/�c#% 0� ��/� .��0 '%)s The ideal temperature of the output of the gas turbine is derived from the ideal
Brayton cycle equation. Note that all temperatures in this equation are in Kelvin.
P�pg[`6Z_,i'�) P�p[,�'�)�',�p[,�/ ,�pg,i ):
�¤¥�¦¡�¢yN�¤¥�¦¡�¢ ;£
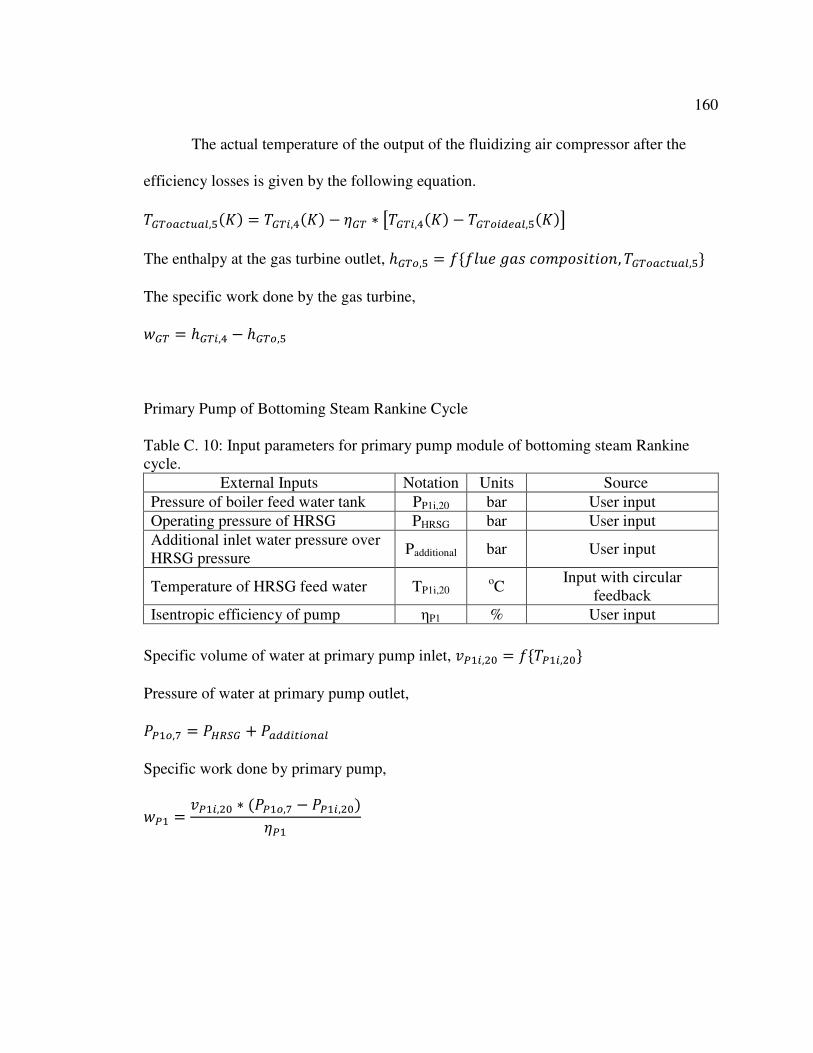
160
The actual temperature of the output of the fluidizing air compressor after the
efficiency losses is given by the following equation.
P�pgZqY^Z_,i'�) P�p[,�'�) � 5�p < {P�p[,�'�) � P�pg[`6Z_,i'�)| The enthalpy at the gas turbine outlet, B�pg,i 4e4�/ *&� !��0��#"#�%, P�pgZqY^Z_,if The specific work done by the gas turbine,
j�p B�p[,� � B�pg,i
Primary Pump of Bottoming Steam Rankine Cycle
Table C. 10: Input parameters for primary pump module of bottoming steam Rankine cycle.
External Inputs Notation Units Source
Pressure of boiler feed water tank PP1i,20 bar User input
Operating pressure of HRSG PHRSG bar User input
Additional inlet water pressure over HRSG pressure
Padditional bar User input
Temperature of HRSG feed water TP1i,20 oC
Input with circular feedback
Isentropic efficiency of pump ηP1 % User input
Specific volume of water at primary pump inlet, ?TN[,�I 4ePTN[,�If Pressure of water at primary pump outlet,
,TNg,H ,U�l� � ,Z``[Y[g\Z_ Specific work done by primary pump,
jTN ?TN[,�I < ',TNg,H � ,TN[,�I)5TN

161
Specific enthalpy of HRSG feed water/pump inlet, BTN[,�I 4e,TN[,�I, PTN[,�If, from
steam tables.
Specific enthalpy of water at main pump outlet, BTNg,H BTN[,�I � jTN
The primary pump supplies water to the HRSG as well as the de-superheater.
Hence, the state of the water (pressure, temperature and enthalpy) through the de-
superheater is the same as the outlet of the pump.
PklU,NG PTNg,H; ,klU,NG ,TNg,H; BklU,NG BTNg,H
Heat Recovery Steam Generator
The HRSG usually consists of the economizer, evaporator and superheater
sections. The evaporator pinch, or approach temperature, is what limits the amount of
heat that can be recovered in most HRSG designs. The closer the pinch, or approach, the
less reliable the results are. The higher the approach temperature, the less surface it takes
to exchange heat. Hence, most HRSGs are designed to provide water/steam flow counter
current to the flue gas flow, which provides a higher approach temperature. Please refer
to Figure C. 2.

162
Figure C. 2: Temperature profile in a heat recovery steam generator.
Table C. 11: Input parameters for heat recovery steam generator module.
External Inputs Notation Units Source
Difference between flue gas and water temperatures at pinch point
∆Tpinch oC User input
Difference between required superheated temperature of steam and saturation temperature
∆Tsuperheat oC User input
Water at pinch point is assumed to be in a saturated liquid state at the operating
pressure of the HRSG, PHRSG. Hence, the temperature, Tw,pinch and enthalpy, hw,pinch are
derived using steam tables for that operating pressure.
PX,�[\q� 4e,U�l�f, BX,�[\q� 4ePX,�[\q�f Temperature of flue gas at the pinch point, P�,�[\q� PX,�[\q� � ∆P�[\q�
Enthalpy of flue gas at the pinch point, B�,�[\q� 4e�&� !��0��#"#�%, P�,�[\q�f Required temperature of superheated steam at HRSG exit,
PU�l�g,F PX,�[\q� � ∆P�^�6V�6ZY
0
100
200
300
400
500
600
700
Te
mp
era
ture
Flue gas Water/Steam
economizer
evaporator superheater
pinch point

163
Enthalpy of superheated steam at HRSG exit, BU�l�g,F 4e,U�l� , PU�l�g,Ff For a counter-flow HRSG, the energy required by water at the pinch point to
reach superheated state at the exit of the HRSG is equal to the difference between the
enthalpies of the flue gas at the inlet of the HRSG and the pinch point.
Hence, the amount of steam that can be generated in the HRSG, mHRSGo is derived
as follows.
�d U�l�g,F �d �pg,i < 'B�pg,i � B�,�[\q�)'BU�l�g,F � BX,�[\q�)
Expansion valve
The expansion valve has the same inlet and outlet enthalpies.
Bmng,�� Bmn[,�N BU�l�g,F
Bottoming Steam Rankine Cycle Turbines for Power Generation
For the BIGCC system, I assumed a condensing-extracting steam turbine for the
bottoming SRC. The derivations in this section are the same as that in the Rankine cycle
model.
Table C. 12: Input parameters for bottoming steam Rankine cycle turbines for power generation module.
External Inputs Notation Units Source
Extraction pressure for CESTs PET,11 bar User input or sugar factory parameter
Exhaust/condensing pressure for CESTs
PCT,12 bar User input
Isentropic efficiency for power turbine ηPT % User input

164
The temperature, pressure and specific enthalpy of steam input to the power
turbine are assumed equal to those at the HRSG outlet.
PTp,NI PU�l�g,F; ,Tp,NI ,U�l�g,F; BTp,NI BU�l�g,F
The specific entropy of the steam input to the power turbine is a function of
pressure and temperature.
�Tp,NI 4e,Tp,NI, PTp,NIf For an ideal turbine, the specific entropies of the steam at inlet and outlet are
equal.
�mp,NN[`6Z_ �Tp,NI and �xp,N�[`6Z_ �Tp,NI
The ideal quality of the steam at both outlets of the turbine, xET,11ideal and xCT,12ideal
is a function of specific entropy and exhaust pressure at the two outlets.
2mp,NN[`6Z_ 4e�mp,NN[`6Z_, ,mp,NNf and 2xp,N�[`6Z_ 4e�xp,N�[`6Z_, ,xp,N�f The ideal specific enthalpy of the steam at the two outlets of the turbine is a
function of the ideal quality and exhaust pressure at the two outlets.
Bmp,NN[`6Z_ 4e2mp,NN[`6Z_, ,mp,NNf and Bxp,N�[`6Z_ 4e2xp,N�[`6Z_, ,xp,N�f The actual enthalpy of the steam at the two outlets takes into account the
isentropic efficiency of the turbine.
Bmp,NN BTp,NI � 5Tp < 'BTp,NI � Bmp,NN[`6Z_) and
Bxp,N� BTp,NI � 5Tp < 'BTp,NI � Bxp,N�[`6Z_)

165
Actual specific work done by the high pressure and low pressure sections of the
turbine are given by the following equations.
jmp,NIyNN BTp,NI � Bmp,NN and jxp,NNyN� Bmp,NN � Bxp,N�
Condenser and Condensate Pump
Table C. 13: Input parameters for condenser and condensate pump module for bottoming steam Rankine cycle.
External Inputs Notation Units Source
Output pressure of condensate pump PP2o,14 bar User input
Isentropic efficiency for pump ηP2 % User input
The exhaust steam from the steam turbine exits at 12 passes through a condenser
and is condensed to saturated liquid. The condenser operates at the same pressure as the
exit pressure of the turbine.
,xp,N� ,T�[,NE
The enthalpy and temperature of the saturated liquid at 13 are a function of
pressure and are derived from the steam tables.
BT�[,NE 4e,T�,NEf, PT�[,NE 4e,T�,NEf The condensate pump, P2, then pumps the liquid to a user defined pressure, PP2o,14
higher than the HRSG feed water pressure.
Specific volume of water at condensate pump inlet, ?T�[,NE 4ePT�[,NEf

166
Specific work done by condensate pump,
jT� ?T�[,NE < ',T�g,N� � ,T�[,NE)5T�
Specific enthalpy of water at condensate pump outlet, BT�g,N� BT�[,NE � jT�
Mass and Energy Balance for high and low pressure steam
The main premise of the model is the same as the Rankine cycle model. The low
pressure process steam demand for the sugar/ethanol factory is required to be satisfied.
This required process steam is in a saturated vapor state, since the most effective heat
transfer to the various sugar/ethanol processes occurs when the saturated vapor condenses
into saturated liquid. This requirement is calculated based on the sugar factory cane
throughput and the ethanol produced.
Table C. 14: Input parameter for mass and energy balance for biomass integrated gasifier combined cycle model.
External Inputs Notation Units Source
Process steam pressure PPH,17 bar User input or sugar factory parameter
The required mass of process steam, mPhi,rq is derived in the Factory Requirements
section of Appendix A. The enthalpy of the required process steam is a function of the
process steam pressure.
BTU[VW,NH 4e,TU,NHf However, the quality of the steam at 17 could be less than one, indicating that it is
not in a saturated vapor state but a ‘wet’ state. In that case, the model adjusts or increases
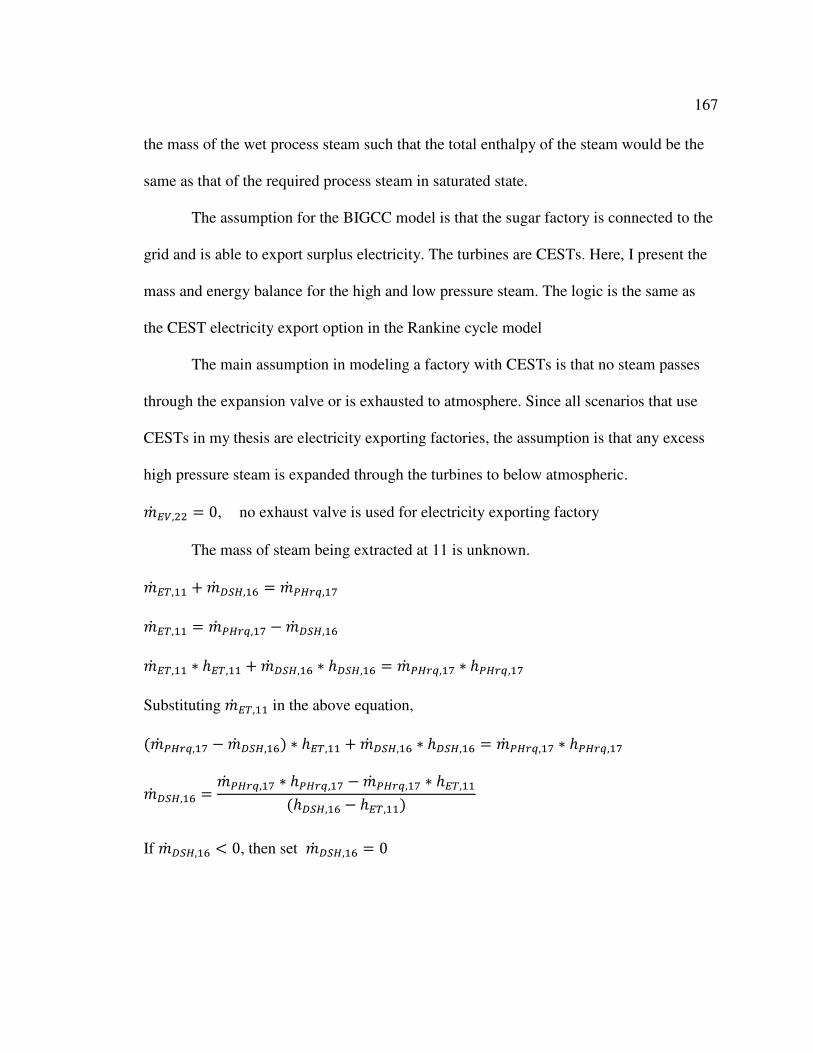
167
the mass of the wet process steam such that the total enthalpy of the steam would be the
same as that of the required process steam in saturated state.
The assumption for the BIGCC model is that the sugar factory is connected to the
grid and is able to export surplus electricity. The turbines are CESTs. Here, I present the
mass and energy balance for the high and low pressure steam. The logic is the same as
the CEST electricity export option in the Rankine cycle model
The main assumption in modeling a factory with CESTs is that no steam passes
through the expansion valve or is exhausted to atmosphere. Since all scenarios that use
CESTs in my thesis are electricity exporting factories, the assumption is that any excess
high pressure steam is expanded through the turbines to below atmospheric.
�d mn,�� 0, no exhaust valve is used for electricity exporting factory
The mass of steam being extracted at 11 is unknown.
�d mp,NN ��d klU,NG �d TUVW,NH
�d mp,NN �d TUVW,NH ��d klU,NG
�d mp,NN < Bmp,NN ��d klU,NG < BklU,NG �d TUVW,NH < BTUVW,NH
Substituting �d mp,NN in the above equation, '�d TUVW,NH ��d klU,NG) < Bmp,NN ��d klU,NG < BklU,NG �d TUVW,NH < BTUVW,NH
�d klU,NG �d TUVW,NH < BTUVW,NH ��d TUVW,NH < Bmp,NN'BklU,NG � Bmp,NN)
If �d klU,NG � 0, then set �d klU,NG 0

168
�d klU,NG will be less than zero if the quality of the steam at 15 is less than one, i.e.
the steam is wet.
Solving for �d mp,NN,
�d mp,NN < Bmp,NN ��d klU,NG < BklU,NG �d TUVW,NH < BTUVW,NH
�d mp,NN �d TUVW,NH < BTUVW,NH ��d klU,NG < BklU,NGBmp,NN
BUT,Ni Bmp,NN
�d UT,Ni �d mp,NN
The remaining excess high pressure steam, if any, is expanded through 12.
�d xp,N� �d U�l�g,F ��d UT,Ni
The total high pressure steam passing through the CEST is total steam exhausted
at 11 and 12.
�d Tp,NI �d mp,NN ��d xp,N�
�d TUZqY^Z_,NH �d UT,Ni ��d klU,NG
BTUZqY^Z_,NH �d UT,Ni < BUT,Ni ��d klU,NG < BklU,NG�d TUZqY^Z_,NH
�d TUZqY^Z_,NH and BTUZqY^Z_,NH will be the same as required if the quality of steam
is one, but would differ if the steam is wet.

169
Balance between steam generated in HRSG and low pressure steam requirement
If �d TUZqY^Z_,NH z �d U�l�g,F, then the macros in the model adjust the fuel input to
the model such that the process steam requirement is satisfied.
If �d TUZqY^Z_,NH � �d U�l�g,F, then the model computes the surplus electricity that
is exported to the grid.
HRSG Feed Water
Table C. 15: Input parameters for heat recovery steam generator feed water module.
External Inputs Notation Units Source
Makeup water pressure PMW,19 bar User input or sugar factory parameter
Makeup water temperature TMW,19 oC
User input or sugar factory parameter
Condensate recovery - % User input or sugar factory parameter
The HRSG feed water is the combination of condensate from the sugar/ethanol
factory and that from condenser after the CEST. Some condensate is usually lost in the
sugar/ethanol processing. In the model, the user can define the condensate recovery.
Loss of condensate from process steam is calculated from this input.
�d TU_,�E �d TUZqY^Z_,NH < '1 � ��%. %�&" 8 !�? �$'%)) The remaining condensate makes it back from the factory to the HRSG feed tank.
�d TUg,Nt �d TUZqY^Z_,NH < ��%. %�&" 8 !�? �$'%)
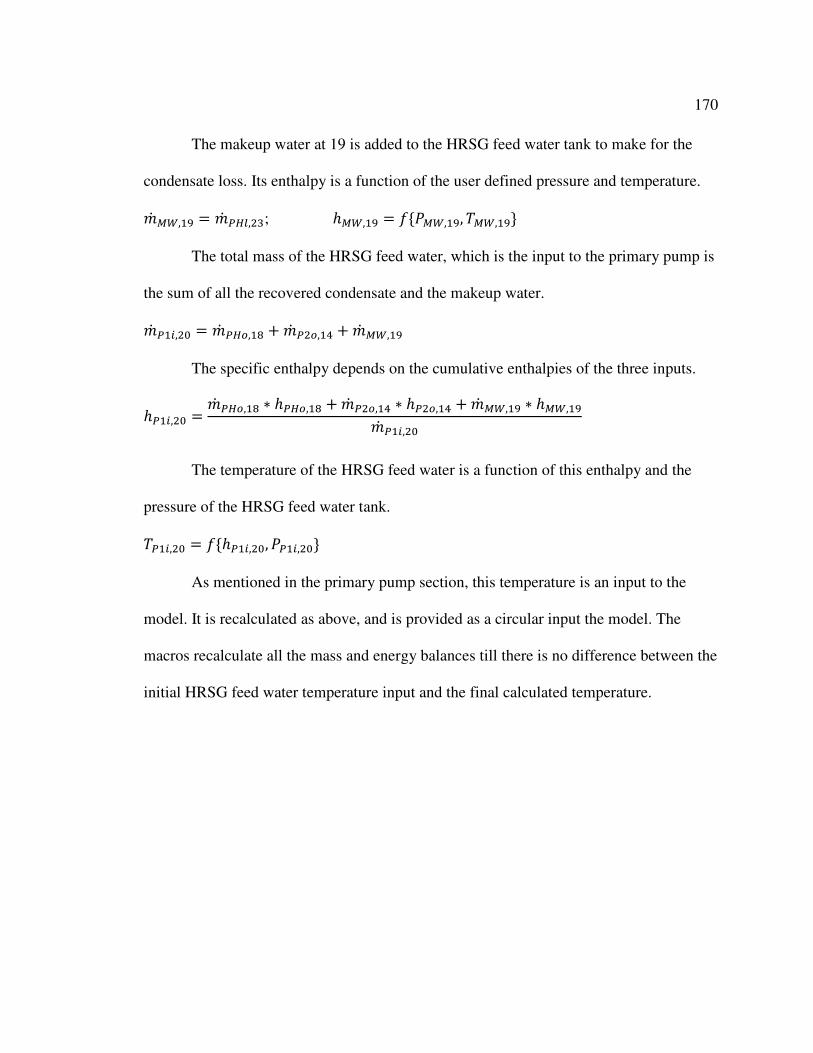
170
The makeup water at 19 is added to the HRSG feed water tank to make for the
condensate loss. Its enthalpy is a function of the user defined pressure and temperature.
�d o�,NF �d TU_,�E; Bo�,NF 4e,o�,NF, Po�,NFf The total mass of the HRSG feed water, which is the input to the primary pump is
the sum of all the recovered condensate and the makeup water.
�d TN[,�I �d TUg,Nt ��d T�g,N� ��d o�,NF
The specific enthalpy depends on the cumulative enthalpies of the three inputs.
BTN[,�I �d TUg,Nt < BTUg,Nt ��d T�g,N� < BT�g,N� ��d o�,NF < Bo�,NF�d TN[,�I
The temperature of the HRSG feed water is a function of this enthalpy and the
pressure of the HRSG feed water tank.
PTN[,�I 4eBTN[,�I, ,TN[,�If As mentioned in the primary pump section, this temperature is an input to the
model. It is recalculated as above, and is provided as a circular input the model. The
macros recalculate all the mass and energy balances till there is no difference between the
initial HRSG feed water temperature input and the final calculated temperature.
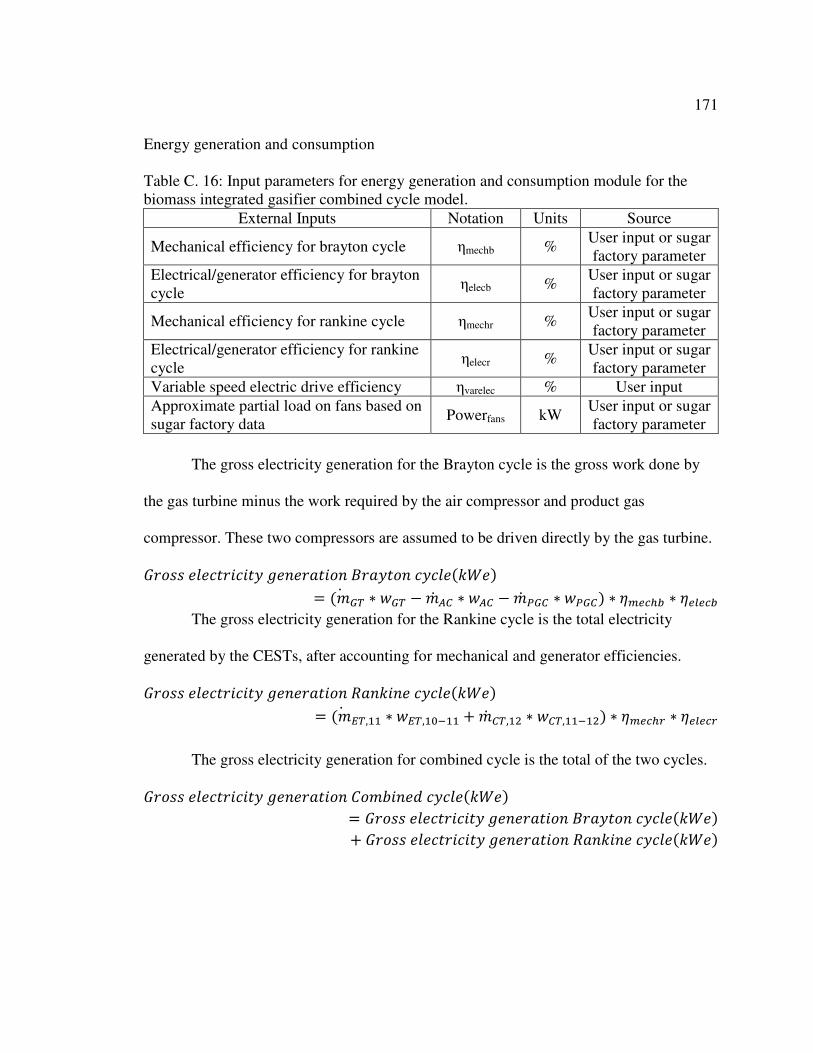
171
Energy generation and consumption
Table C. 16: Input parameters for energy generation and consumption module for the biomass integrated gasifier combined cycle model.
External Inputs Notation Units Source
Mechanical efficiency for brayton cycle ηmechb % User input or sugar factory parameter
Electrical/generator efficiency for brayton cycle
ηelecb % User input or sugar factory parameter
Mechanical efficiency for rankine cycle ηmechr % User input or sugar factory parameter
Electrical/generator efficiency for rankine cycle
ηelecr % User input or sugar factory parameter
Variable speed electric drive efficiency ηvarelec % User input
Approximate partial load on fans based on sugar factory data
Powerfans kW User input or sugar factory parameter
The gross electricity generation for the Brayton cycle is the gross work done by
the gas turbine minus the work required by the air compressor and product gas
compressor. These two compressors are assumed to be driven directly by the gas turbine.
����� � !"�#!#"$ * % �&"#�% L�&$"�% !$!� '�( ) '�d �p < j�p ��d �x < j�x ��d T�x < jT�x) < 5�6q�� < 56_6q�
The gross electricity generation for the Rankine cycle is the total electricity
generated by the CESTs, after accounting for mechanical and generator efficiencies.
����� � !"�#!#"$ * % �&"#�% 8&%�#% !$!� '�( ) '�d mp,NN < jmp,NIyNN ��d xp,N� < jxp,NNyN�) < 5�6q�V < 56_6qV
The gross electricity generation for combined cycle is the total of the two cycles.
����� � !"�#!#"$ * % �&"#�% ���c#% . !$!� '�( ) ����� � !"�#!#"$ * % �&"#�% L�&$"�% !$!� '�( )� ����� � !"�#!#"$ * % �&"#�% 8&%�#% !$!� '�( )

172
The fluidizing air compressor and pumps are electric driven, and are considered a
parasitic load on the cogeneration system.
�� !"�#!#"$ !�%�/�0"#�% c$ 4�/#.#§#%* &#� !��0� ����'�( ) j��x < 5�ZV6_6q
�� !"�#!#"$ !�%�/�0"#�% c$ 0/�0�'�( ) 'jTN �jT�) < 5�ZV6_6q
I have assumed only these two loads as the total parasitic load on the BIGCC
cogeneration system. Any additional parasitic load is accounted for in the sugar
processing load of the existing factory.
��* % +$�" � ,&�&�#"#! -�&.'�( ) �� !"�#!#"$ !�%�/�0"#�% c$ 4�/#.#§#%* &#� !��0� ����� �� !"�#!#"$ !�%�/�0"#�% c$ 0/�0�
The net electricity generation, a key parameter for cogeneration systems is the net
amount of electricity generation out of a cogeneration system after taking the parasitic
loads into account.
3 " �� !"�#!#"$ � % �&"#�% '�( ) ����� �� !"�#!#"$ � % �&"#�% � ��* % +$�" � ,&�&�#"#! -�&.

173
Appendix D: Input Parameters for Direct Combustion Steam Rankine Cycle Model along with Representative Values from the Literature.
Direct Combustion Rankine
Base Value
Upper
Limit
Lower
Limit
Existing
Factory
Ensinas
et al.,
2007
Hassuani
et al.,
2005
Larson
et al.,
2001
Rodrigues
et al.,
2007
Consonni
&Larson,
1996a
Turn,
1999a
Var speed electric drive efficiency
95% 98% 90% - 96%
Process steam for sugar processing
(kg/tc) 350 - - 440 440 540/278
530,340,
280
500,340,
280
Process steam for Distillery (kg/kL-
etoh) 0 - - 4700
Condensate recovery
98% 100% 95% 98% 98%
Fuel Moisture Content
50% 52% 48% 50% 50% 50% 50% 50%
Brix in dry fuel (wt%)
4% 5% 3% 4%
Ash in dry fuel (wt%)
4% 5% 3% 4% 6.53% 4% 4%
Boiler thermal efficiency
80% 85% 75% 64% 85% 85%
Boiler blow down 2% 2% 1% 2%
Pump isentropic efficiency
80% 85% 75% 65% 65% 80% 65% 65%
Pump additional pressure over
boiler pressure (bar)
5 8 2 5 5
Power turbine isentropic efficiency
80% 85% 75% 67% 67% 80% 75% 75%
Power turbine mechanical efficiency
98% 99% 97% 94% 94%
Power turbine electrical efficiency
98% 99% 97% 97% 97% 96%
Exhaust steam pressure from EC
turbine (bar) 0.1 0.4 0.08 - 0.085 0.11 0.096
Output pressure of condenser pump
(bar) 3 - -
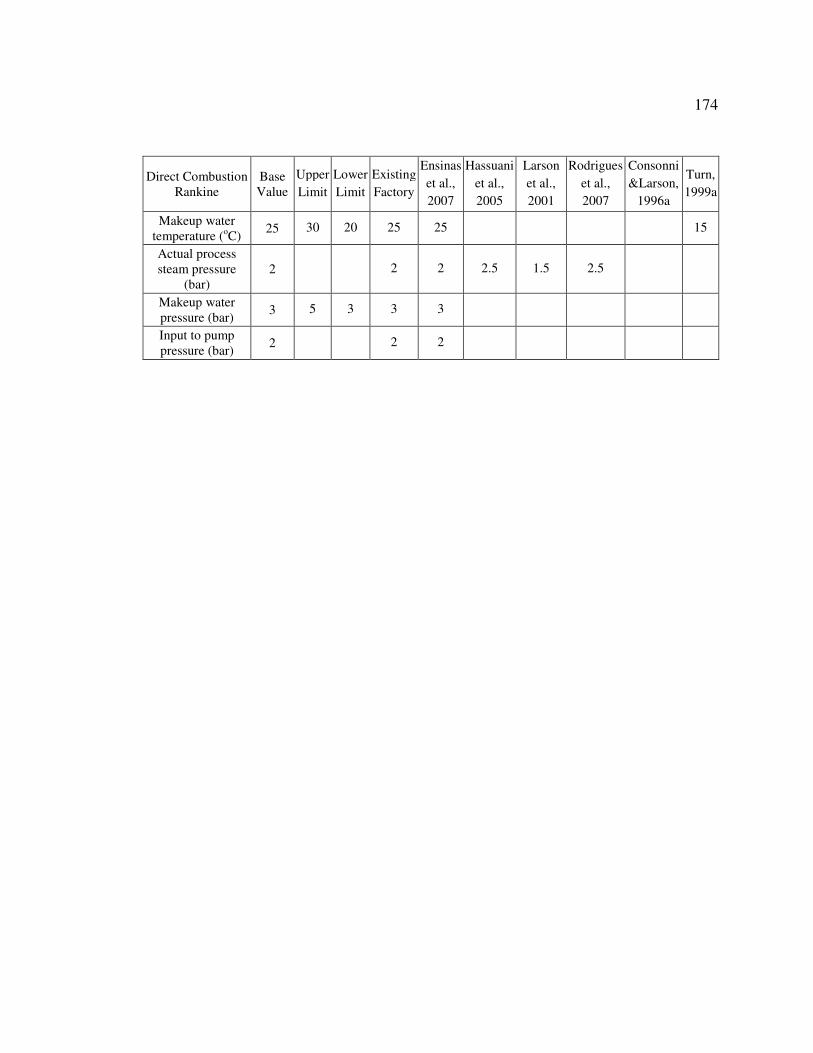
174
Direct Combustion Rankine
Base Value
Upper
Limit
Lower
Limit
Existing
Factory
Ensinas
et al.,
2007
Hassuani
et al.,
2005
Larson
et al.,
2001
Rodrigues
et al.,
2007
Consonni
&Larson,
1996a
Turn,
1999a
Makeup water temperature (oC)
25 30 20 25 25 15
Actual process steam pressure
(bar) 2 2 2 2.5 1.5 2.5
Makeup water pressure (bar)
3 5 3 3 3
Input to pump pressure (bar)
2 2 2
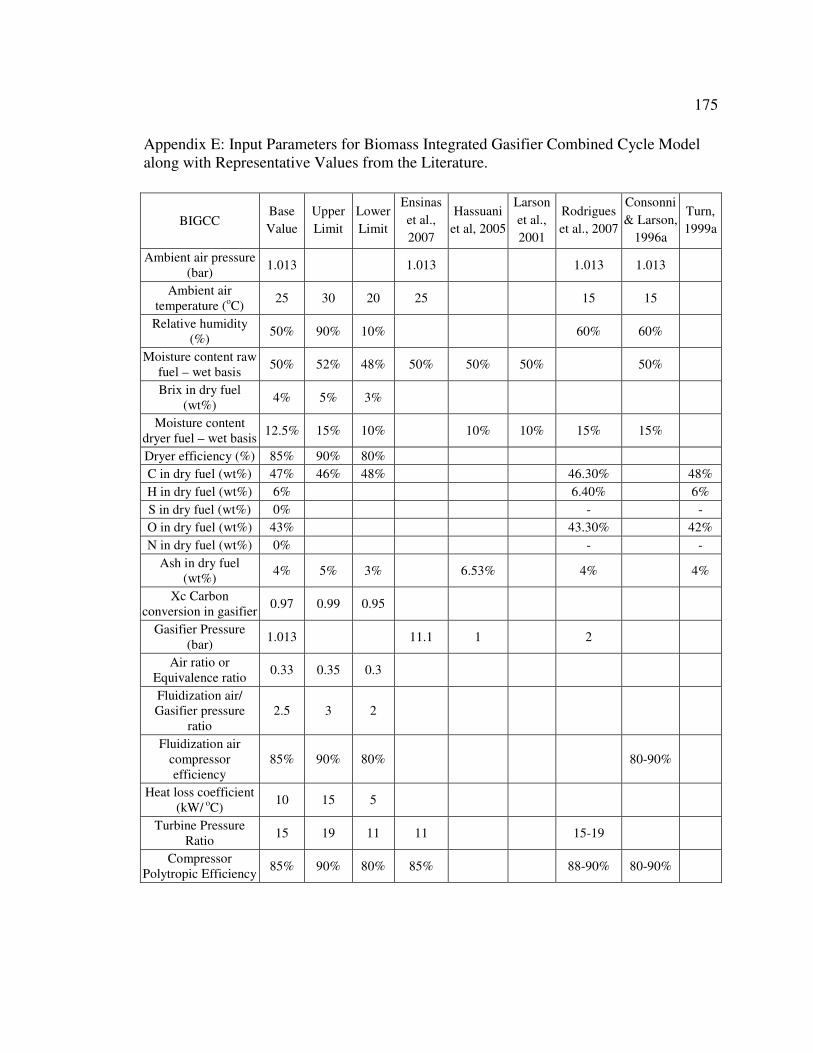
175
Appendix E: Input Parameters for Biomass Integrated Gasifier Combined Cycle Model along with Representative Values from the Literature.
BIGCC Base
Value
Upper
Limit
Lower
Limit
Ensinas
et al.,
2007
Hassuani
et al, 2005
Larson
et al.,
2001
Rodrigues
et al., 2007
Consonni
& Larson,
1996a
Turn,
1999a
Ambient air pressure (bar)
1.013 1.013 1.013 1.013
Ambient air temperature (oC)
25 30 20 25 15 15
Relative humidity (%)
50% 90% 10% 60% 60%
Moisture content raw fuel – wet basis
50% 52% 48% 50% 50% 50% 50%
Brix in dry fuel (wt%)
4% 5% 3%
Moisture content dryer fuel – wet basis
12.5% 15% 10% 10% 10% 15% 15%
Dryer efficiency (%) 85% 90% 80%
C in dry fuel (wt%) 47% 46% 48% 46.30% 48%
H in dry fuel (wt%) 6% 6.40% 6%
S in dry fuel (wt%) 0% - -
O in dry fuel (wt%) 43% 43.30% 42%
N in dry fuel (wt%) 0% - -
Ash in dry fuel (wt%)
4% 5% 3% 6.53% 4% 4%
Xc Carbon conversion in gasifier
0.97 0.99 0.95
Gasifier Pressure (bar)
1.013 11.1 1 2
Air ratio or Equivalence ratio
0.33 0.35 0.3
Fluidization air/ Gasifier pressure
ratio 2.5 3 2
Fluidization air compressor efficiency
85% 90% 80% 80-90%
Heat loss coefficient (kW/ oC)
10 15 5
Turbine Pressure Ratio
15 19 11 11 15-19
Compressor Polytropic Efficiency
85% 90% 80% 85% 88-90% 80-90%
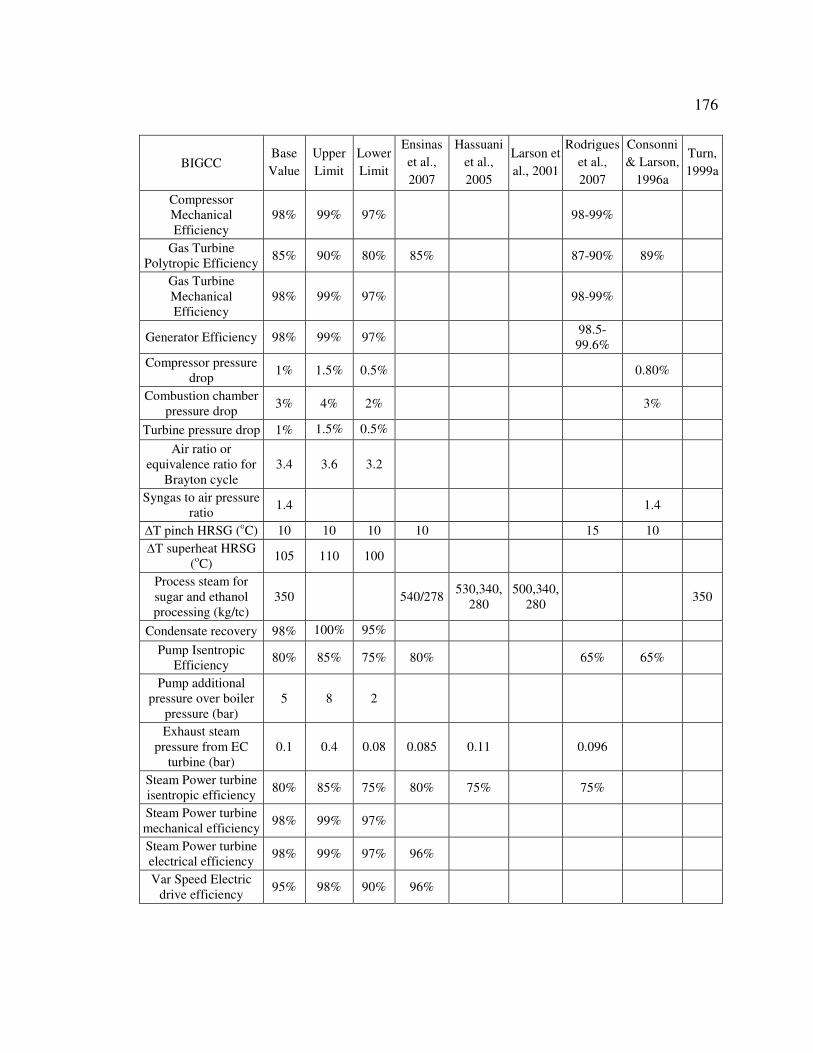
176
BIGCC Base
Value
Upper
Limit
Lower
Limit
Ensinas
et al.,
2007
Hassuani
et al.,
2005
Larson et
al., 2001
Rodrigues
et al.,
2007
Consonni
& Larson,
1996a
Turn,
1999a
Compressor Mechanical Efficiency
98% 99% 97% 98-99%
Gas Turbine Polytropic Efficiency
85% 90% 80% 85% 87-90% 89%
Gas Turbine Mechanical Efficiency
98% 99% 97% 98-99%
Generator Efficiency 98% 99% 97% 98.5-99.6%
Compressor pressure drop
1% 1.5% 0.5% 0.80%
Combustion chamber pressure drop
3% 4% 2% 3%
Turbine pressure drop 1% 1.5% 0.5%
Air ratio or equivalence ratio for
Brayton cycle 3.4 3.6 3.2
Syngas to air pressure ratio
1.4 1.4
∆T pinch HRSG (oC) 10 10 10 10 15 10
∆T superheat HRSG (oC)
105 110 100
Process steam for sugar and ethanol processing (kg/tc)
350 540/278 530,340,
280 500,340,
280 350
Condensate recovery 98% 100% 95%
Pump Isentropic Efficiency
80% 85% 75% 80% 65% 65%
Pump additional pressure over boiler
pressure (bar) 5 8 2
Exhaust steam pressure from EC
turbine (bar) 0.1 0.4 0.08 0.085 0.11 0.096
Steam Power turbine isentropic efficiency
80% 85% 75% 80% 75% 75%
Steam Power turbine mechanical efficiency
98% 99% 97%
Steam Power turbine electrical efficiency
98% 99% 97% 96%
Var Speed Electric drive efficiency
95% 98% 90% 96%
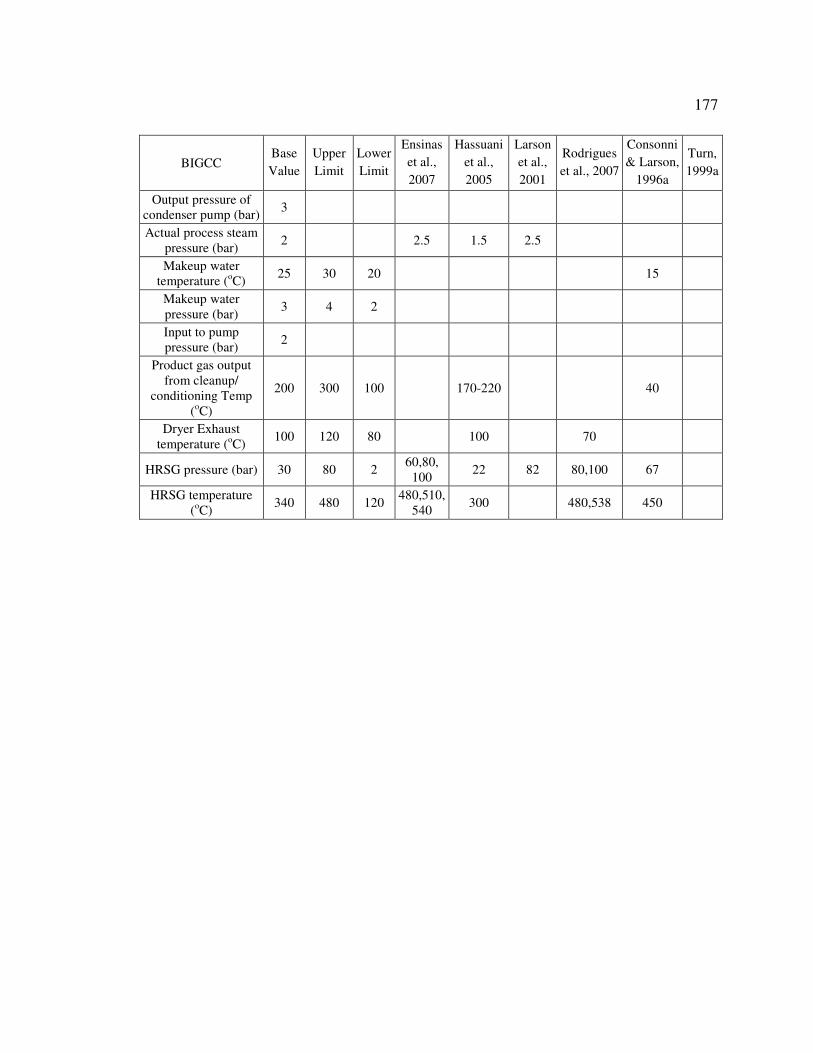
177
BIGCC Base
Value
Upper
Limit
Lower
Limit
Ensinas
et al.,
2007
Hassuani
et al.,
2005
Larson
et al.,
2001
Rodrigues
et al., 2007
Consonni
& Larson,
1996a
Turn,
1999a
Output pressure of condenser pump (bar)
3
Actual process steam pressure (bar)
2 2.5 1.5 2.5
Makeup water temperature (oC)
25 30 20 15
Makeup water pressure (bar)
3 4 2
Input to pump pressure (bar)
2
Product gas output from cleanup/
conditioning Temp (oC)
200 300 100 170-220 40
Dryer Exhaust temperature (oC)
100 120 80 100 70
HRSG pressure (bar) 30 80 2 60,80,
100 22 82 80,100 67
HRSG temperature (oC)
340 480 120 480,510,
540 300 480,538 450

178
Appendix F: Sensitivity Analysis for Direct Combustion Steam Rankine Cycle Model
Parameter Base Value Upper Limit Lower Limit
Net Electricity
Generated (kWh/tc)
Range %
Variable speed electric drive efficiency 95% 98% 90% 0.4 0%
Process steam for sugar processing (kg/tc) 350 440 280 -11.3 -10%
Condensate recovery 98% 100% 95% 0.5 0%
Fuel Moisture Content 50% 52% 48% -14.3 -13%
Brix in dry fuel (wt%) 4% 5% 3% -3.5 -3%
Ash in dry fuel (wt%) 4% 5% 3% 0.0 0%
Boiler thermal efficiency 80% 85% 75% 16.8 15%
Boiler blow down 1.5% 2% 1% -1.5 -1%
Pump isentropic efficiency 80% 85% 75% 0.1 0%
Pump additional pressure over boiler pressure (bar)
5 8 2 -0.1 0%
Power turbine isentropic efficiency 80% 85% 75% 13.3 12%
Power turbine mechanical efficiency 98% 99% 97% 2.3 2%
Power turbine electrical efficiency 98% 99% 97% 2.3 2%
Exhaust steam pressure from EC turbine (bar)
0.1 0.4 0.08 -11.2 -10%
Makeup water temperature (oC) 25 30 20 0.1 0%
Makeup water pressure (bar) 3 5 3 0.0 0%
Parameters with sensitivities equal to or greater than ±5 percent are highlighted.
Negative values indicate a decrease in the net electricity generated.
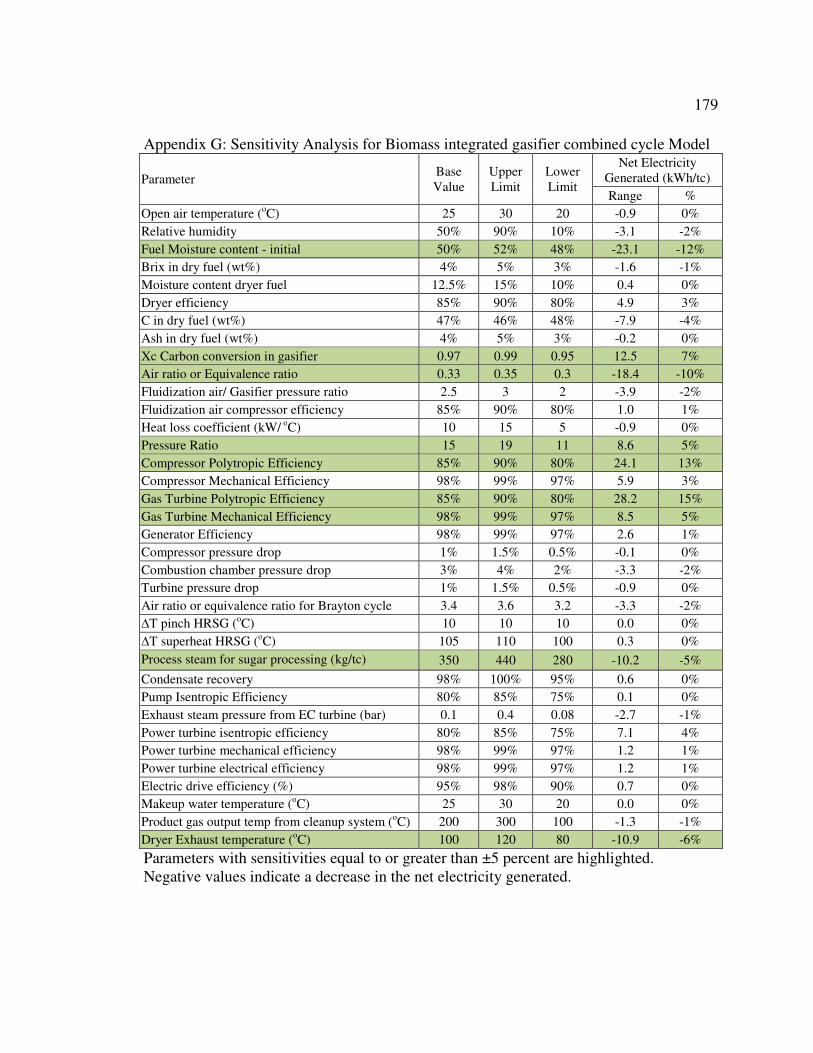
179
Appendix G: Sensitivity Analysis for Biomass integrated gasifier combined cycle Model
Parameter Base Value
Upper Limit
Lower Limit
Net Electricity Generated (kWh/tc)
Range %
Open air temperature (oC) 25 30 20 -0.9 0%
Relative humidity 50% 90% 10% -3.1 -2%
Fuel Moisture content - initial 50% 52% 48% -23.1 -12%
Brix in dry fuel (wt%) 4% 5% 3% -1.6 -1%
Moisture content dryer fuel 12.5% 15% 10% 0.4 0%
Dryer efficiency 85% 90% 80% 4.9 3%
C in dry fuel (wt%) 47% 46% 48% -7.9 -4%
Ash in dry fuel (wt%) 4% 5% 3% -0.2 0%
Xc Carbon conversion in gasifier 0.97 0.99 0.95 12.5 7%
Air ratio or Equivalence ratio 0.33 0.35 0.3 -18.4 -10%
Fluidization air/ Gasifier pressure ratio 2.5 3 2 -3.9 -2%
Fluidization air compressor efficiency 85% 90% 80% 1.0 1%
Heat loss coefficient (kW/ oC) 10 15 5 -0.9 0%
Pressure Ratio 15 19 11 8.6 5%
Compressor Polytropic Efficiency 85% 90% 80% 24.1 13%
Compressor Mechanical Efficiency 98% 99% 97% 5.9 3%
Gas Turbine Polytropic Efficiency 85% 90% 80% 28.2 15%
Gas Turbine Mechanical Efficiency 98% 99% 97% 8.5 5%
Generator Efficiency 98% 99% 97% 2.6 1%
Compressor pressure drop 1% 1.5% 0.5% -0.1 0%
Combustion chamber pressure drop 3% 4% 2% -3.3 -2%
Turbine pressure drop 1% 1.5% 0.5% -0.9 0%
Air ratio or equivalence ratio for Brayton cycle 3.4 3.6 3.2 -3.3 -2%
∆T pinch HRSG (oC) 10 10 10 0.0 0%
∆T superheat HRSG (oC) 105 110 100 0.3 0%
Process steam for sugar processing (kg/tc) 350 440 280 -10.2 -5%
Condensate recovery 98% 100% 95% 0.6 0%
Pump Isentropic Efficiency 80% 85% 75% 0.1 0%
Exhaust steam pressure from EC turbine (bar) 0.1 0.4 0.08 -2.7 -1%
Power turbine isentropic efficiency 80% 85% 75% 7.1 4%
Power turbine mechanical efficiency 98% 99% 97% 1.2 1%
Power turbine electrical efficiency 98% 99% 97% 1.2 1%
Electric drive efficiency (%) 95% 98% 90% 0.7 0%
Makeup water temperature (oC) 25 30 20 0.0 0%
Product gas output temp from cleanup system (oC) 200 300 100 -1.3 -1%
Dryer Exhaust temperature (oC) 100 120 80 -10.9 -6%
Parameters with sensitivities equal to or greater than ±5 percent are highlighted. Negative values indicate a decrease in the net electricity generated.
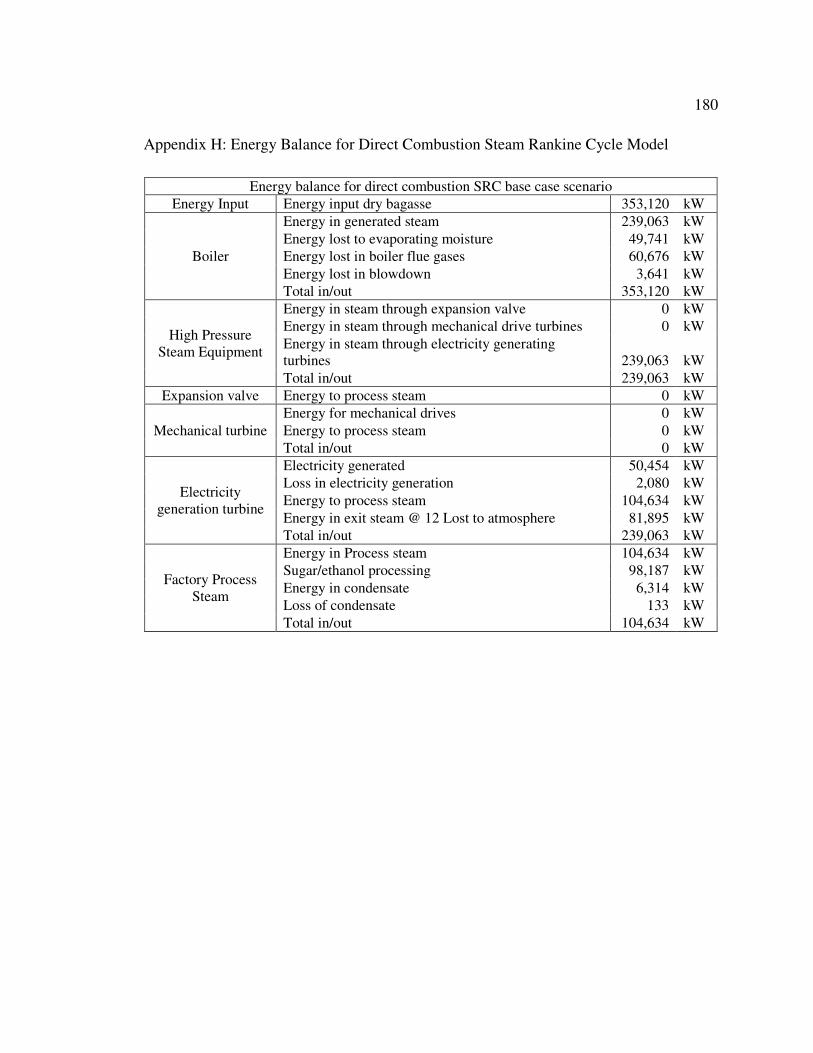
180
Appendix H: Energy Balance for Direct Combustion Steam Rankine Cycle Model
Energy balance for direct combustion SRC base case scenario
Energy Input Energy input dry bagasse 353,120 kW
Boiler
Energy in generated steam 239,063 kW
Energy lost to evaporating moisture 49,741 kW
Energy lost in boiler flue gases 60,676 kW
Energy lost in blowdown 3,641 kW
Total in/out 353,120 kW
High Pressure Steam Equipment
Energy in steam through expansion valve 0 kW
Energy in steam through mechanical drive turbines 0 kW
Energy in steam through electricity generating turbines 239,063 kW
Total in/out 239,063 kW
Expansion valve Energy to process steam 0 kW
Mechanical turbine
Energy for mechanical drives 0 kW
Energy to process steam 0 kW
Total in/out 0 kW
Electricity generation turbine
Electricity generated 50,454 kW
Loss in electricity generation 2,080 kW
Energy to process steam 104,634 kW
Energy in exit steam @ 12 Lost to atmosphere 81,895 kW
Total in/out 239,063 kW
Factory Process Steam
Energy in Process steam 104,634 kW
Sugar/ethanol processing 98,187 kW
Energy in condensate 6,314 kW
Loss of condensate 133 kW
Total in/out 104,634 kW
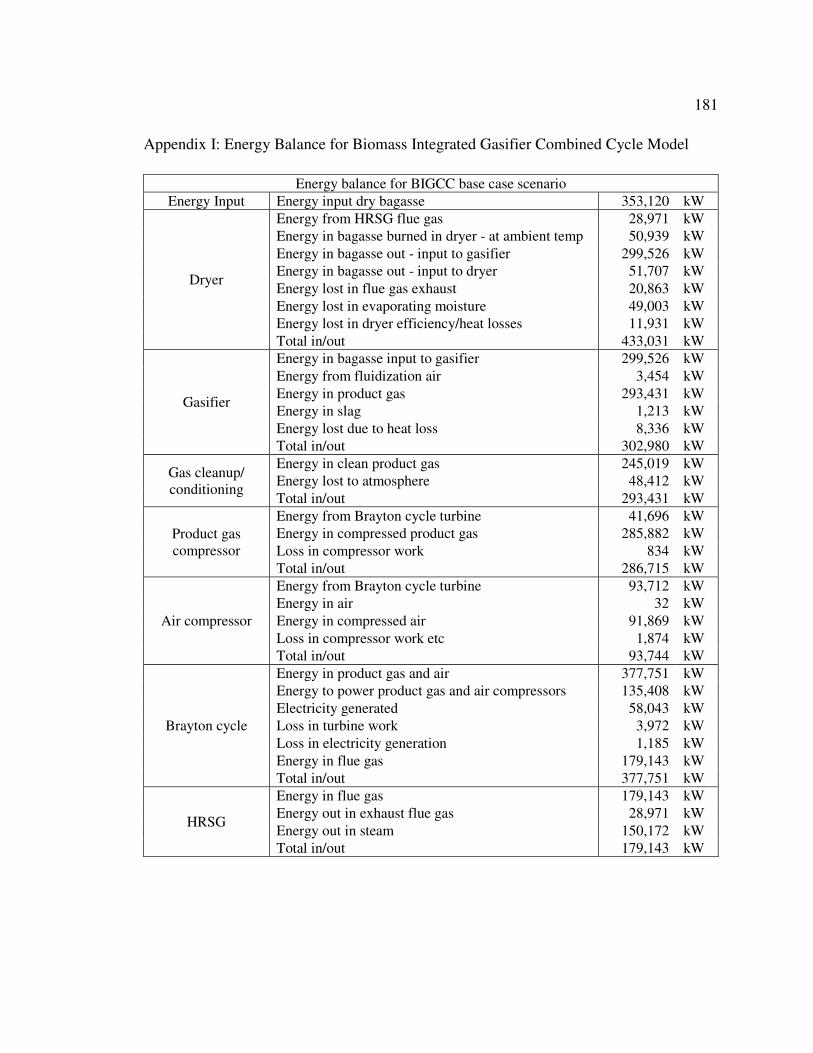
181
Appendix I: Energy Balance for Biomass Integrated Gasifier Combined Cycle Model
Energy balance for BIGCC base case scenario
Energy Input Energy input dry bagasse 353,120 kW
Dryer
Energy from HRSG flue gas 28,971 kW
Energy in bagasse burned in dryer - at ambient temp 50,939 kW
Energy in bagasse out - input to gasifier 299,526 kW
Energy in bagasse out - input to dryer 51,707 kW
Energy lost in flue gas exhaust 20,863 kW
Energy lost in evaporating moisture 49,003 kW
Energy lost in dryer efficiency/heat losses 11,931 kW
Total in/out 433,031 kW
Gasifier
Energy in bagasse input to gasifier 299,526 kW
Energy from fluidization air 3,454 kW
Energy in product gas 293,431 kW
Energy in slag 1,213 kW
Energy lost due to heat loss 8,336 kW
Total in/out 302,980 kW
Gas cleanup/ conditioning
Energy in clean product gas 245,019 kW
Energy lost to atmosphere 48,412 kW
Total in/out 293,431 kW
Product gas compressor
Energy from Brayton cycle turbine 41,696 kW
Energy in compressed product gas 285,882 kW
Loss in compressor work 834 kW
Total in/out 286,715 kW
Air compressor
Energy from Brayton cycle turbine 93,712 kW
Energy in air 32 kW
Energy in compressed air 91,869 kW
Loss in compressor work etc 1,874 kW
Total in/out 93,744 kW
Brayton cycle
Energy in product gas and air 377,751 kW
Energy to power product gas and air compressors 135,408 kW
Electricity generated 58,043 kW
Loss in turbine work 3,972 kW
Loss in electricity generation 1,185 kW
Energy in flue gas 179,143 kW
Total in/out 377,751 kW
HRSG
Energy in flue gas 179,143 kW
Energy out in exhaust flue gas 28,971 kW
Energy out in steam 150,172 kW
Total in/out 179,143 kW

182
Energy balance for BIGCC base case scenario
Bottoming Steam Rankine cycle
Electricity generated 27,590 kW
Loss in electricity generation 1,138 kW
Energy to process steam 100,835 kW
Energy in exit steam @ 12 Lost to atmosphere 20,610 kW
Total in/out 150,172 kW
Factory Process Steam
Energy in Process steam 100,835 kW
Sugar/ethanol processing 98,197 kW
Energy in condensate 2,581 kW
Loss of condensate 57 kW
Total in/out 100,835 kW