thermal error prediction of ball screws based on pso-lstm
TRANSCRIPT

Thermal Error Prediction of Ball Screws Based onPSO-LSTMXiangsheng Gao ( [email protected] )
Beijing University of Technology https://orcid.org/0000-0001-5947-5826Yueyang Guo Dzonu Ambrose Hanson Zhihao Liu Min Wang Tao Zan
Research Article
Keywords: Thermal error, Ball screw, Modeling, PSO-LSTM, Data-driven
Posted Date: March 23rd, 2021
DOI: https://doi.org/10.21203/rs.3.rs-328258/v1
License: This work is licensed under a Creative Commons Attribution 4.0 International License. Read Full License

Thermal error prediction of ball screws based on PSO-LSTM
Xiangsheng Gao*, Yueyang Guo, Dzonu Ambrose Hanson, Zhihao Liu,
Min Wang, Tao Zan
Beijing Key Laboratory of Advanced Manufacturing Technology, Faculty of Materials and Manufacturing, Beijing University of Technology, Beijing 100124, China.
*Corresponding author: Xiangsheng Gao, [email protected]; Tel.: +86-10-6739-2137/+86-130-3106-5766
Present address: Key Laboratory of Advanced Manufacturing Technology, Beijing University of Technology, No. 100 Pingleyuan, Chaoyang District, Beijing, China (Mail code in China:
100124).
Abstract:
Thermal error of ball screws seriously affects the machining precision of CNC machine tools
especially in high speed and precision machining. Compensation technology is one of the most
effective methods to address the thermal issue, and the effect of compensation depends on the
accuracy and robustness of the thermal error model. Traditional modeling approaches have major
challenges in time-series thermal error prediction. In this paper, a novel thermal error model based
on Long Short-Term Memory (LSTM) neural network and Particle Swarm Optimization (PSO)
algorithm is proposed. A data-driven model based on LSTM neural network is established according to the time-series collected data. The hyperparameters of LSTM neural network are
optimized by PSO and then a PSO-LSTM model is established to precisely predict the thermal
error of ball screws. In order to verify the effectiveness and robustness of the proposed model, two
thermal characteristic experiments based on step and random speed are conducted on a self-designed test bench. The results show that the PSO-LSTM model has higher accuracy
compared with the RBF model and BP model with high robustness. The proposed method can be
implemented to predict the thermal error of ball screws, and provide a foundation for thermal error
compensation.
Keywords Thermal error · Ball screw · Modeling · PSO-LSTM · Data-driven

1 Introduction
Ball screws, an important transmission component which converts the rotary motion into the
linear motion, have been widely applied in CNC machine tools owing to its high efficiency,
precision and stiffness [1]. The productive efficiency of the machine tool is determined by the
speed and feed rate of the machine tool, and it shows an obvious high-speed trend in recent years.
However, severe thermal issues will follow the high speed and feed rate. The temperature rise
results in thermally induced error of ball screws, which seriously affects the machining precision
of CNC machine tools especially in high speed and precision machining. It is reported that thermal
error represents 40-70% of the total error of machine tools [1-2]. Generally, the heat generation of
ball screws is mainly from the motor, nuts and bearings, which causes the thermal elastic
deformation of the screw resulting in loss of position accuracy [3]. Moreover, with the increasing
of manufacturing precision, it is extremely important to reduce the influence of thermal issue of
ball screws on position accuracy. Therefore, it is essential to implement the study on the thermal
characteristic mechanism and the accurate modeling.
Reduction and compensation of the thermal deformation are the two main technical
measures to address the thermal issues of ball screws. In terms of the thermal errors reduction, air
cooling system, liquid cooling system and the adaptive method based on advanced materials have
been developed in the past few years. Xu et al. [4-5], and Shi et al. [6] discussed the placement of
an air/liquid cooling system in a ball screw shaft to overcome thermal errors and achieve
temperature equilibrium faster. A series of tests were carried out and the results showed the
position accuracy would be significantly improved. Nevertheless, the systems become more
complicated and cause the loss of stiffness. Gao et al. [7] proposed an adaptive method based on
carbon fiber reinforced plastics (CFRP) to reduce thermal deformation, where the fiber is mounted
in the hollow along with the axial direction of the screw. When the temperature rises, the CFRP
will contract the screw and reduce the thermal deformation due to the negative thermal expansion
coefficient. But, the structure of ball screws in the research is difficult to implement in engineering
practice because of the oversized clamping structure in the two ends. Guo et al. [8] proposed a
bio-inspired graphene-coated ball screws inspired by the Saharan silver ant to reduce the thermal
deformation. The high thermal emissivity of graphene coating on the screw is employed to quickly
transfer the heat and radiate heat to the environment to reduce the temperature rise and thermal
deformation. However, the coating may peel off from the surface of ball screw resulting in failure
of the method.
Thermal error compensation is a cost-effective method to solve this problem, which merely
depends on the exact measurement and the accurate prediction of thermal error during machining.
Exact modeling of thermal errors is crucial to errors compensation and leads to good effect in
compensation. Therefore, many researches have been carried out to address thermal errors
prediction by using various methodologies. In the last decades, the most widely-used algorithms in
the thermal error modeling were the multivariate linear regression analysis. Yang et al. [9]
proposed a thermal error model based on cerebellar model articulation controller (CMAC) neural
network which can search for the nonlinear and interaction characteristics between the thermal
errors and temperature field on the machine tools. However, the convergence rates and prediction
accuracy are not suitable since parameters of the model are not optimized. Yang et al. [10]
decreased the errors due to temperature measuring noise and the adverse effect of environmental

changes, and reduced the number of sensors according to thermal expansion and thermal bending
mode analysis, and established the multivariate linear regression model to compensate the thermal
error on a CNC turning center. Nevertheless, a practical regression model with high accuracy and
robustness is difficult to establish by the method. Zhao et al. [11] proposed a method for
determining the convection heat transfer coefficient, and then the temperature field and thermal
errors were dynamically simulated using the finite element analysis (FEA) method satisfying to
replace the experiment results. Zhu et al. [12] developed a temperature sensor placement scheme
and thermal error modeling strategy based on simulations and experiments by using the finite
element analysis, thermal mode concept and linear regression models. But the boundary
conditions in actual working conditions haven’t been mentioned in these studies. Some
researchers focused on the mathematical model to reveal the error generation mechanism and
established the analytical relationship between temperature rise of the temperature measurement
points and thermal deformation for determining thermal error. However, the modeling method is
less compatible since the variation of temperature rise is complicated leading to the analytic
relationship variation with the working condition [13-14]. In recent years, with the development of
computer technology and intelligent algorithm, gray theory, support vector machine, artificial
neural network and some hybrid approaches were gradually employed by many researchers.
Ramesh et al. [15-16] employed Bayesian networks to classify the thermal error in different
parameter settings and adopted the support vector machine algorithm to determine the thermal
error of each class. Wu et al. [17] established a GA-BPN-based thermal error model for online
prediction of the thermal errors and developed a real-time compensation system to compensate for
the thermal drift errors, while the performance of the model under complex conditions was not
revealed. Zhang et al. [18] proposed a thermal error model by using the artificial neural networks
and gray theory to enhance the robustness and the prediction accuracy of the model, but the weight coefficients seem difficult to be adjusted in real-time depending on the accuracy requirement and the actual model output. Wang et al. [19], Miao et al. [20-21] and Yang et al. [22]
used a combination of fuzzy clustering analysis and advanced algorithm to establish the thermal
error model. Abdulshahed et al. [23-24] used the ANFIS method and ANN with a
back-propagation algorithm and ANN with a PSO algorithm combined with grey system theory to
establish the thermal error prediction model. Liu et al. [25] established a thermal error model by
using the ridge regression algorithm to inhibit the bad influence of collinearity on the thermal
error predicted robustness. Dos Santos et al. [26] established physical models with data-driven
models based on the ANN and the FEM simulation to predict the thermal error of a five-axis CNC
machining center. Huang et al. [27] used a genetic algorithm (GA) to optimize initial weights and
thresholds of BP network for training the thermal error sample data and modeling of the thermal
error. Rojek et al. [28] used single-directional multi-layered neural networks with error
back-propagation (MLP), radial basis function neural networks (RBF) and Kohonen networks to
establish the predictive compensation model of ball screws. Li et al. [29] proposed a novel thermal
error compensation model by using genetic algorithm to optimize wavelet neural network, which
combines the advantages of adaptive global optimization searching ability of genetic algorithm
and good time-frequency local characteristics of wavelet neural network. The robustness of
thermal error model, variable searching and modeling time can be further optimized theoretically.
Although these methods can enhance the predicted robustness of the model, the predicted
accuracy reduced at the same time [23]. The thermal errors of machine tools can be predicted
using these models by the mapping relationship between thermal error and temperature of selected
sensitive points at certain moment. However, the robustness and accuracy of the model need to be
improved since the thermal errors are not only related to temperature of selected sensitive points at
some certain moment but also vary with historical temperature value. Therefore, it is necessary to
establish an accurate real-time and historical mapping relationship between temperature fields and
thermal errors. Long Short-Term Memory (LSTM) network as one of the modern deep learning
models, has a strong ability for time series forecast in various fields, since it can dynamically learn
new information while maintaining a persistent memory of historical information. Sagheer et al.
[30] implemented time series forecasting of petroleum production based on LSTM recurrent
networks optimized by genetic algorithm (GA), the empirical results showed that the LSTM
model outperforms other standard approaches. Zhang et al. [31] employed the LSTM network to
predict remaining useful life (RUL) of lithium-ion batteries. Zhang et al. [32] developed a LSTM
model to predict water table depth in agricultural areas, evaluated and discussed the ability of the
proposed model, and the results showed that the LSTM model had a satisfactory performance. Qin
et al. [33] employed the LSTM model to predict gear remaining life. In a word, LSTM network
has both the short-term correlation and long-term dependence characteristics. However, the
research on thermal errors prediction of machine tools by using LSTM network is rarely reported,
especially in the field of ball screws.
In this research, a novel thermal errors model of ball screws is proposed. Initially, a LSTM
model is developed to forecast the time-series thermal errors of ball screws. In order to establish
an accurate mapping relationship with time-varying between temperature fields and thermal errors,
Particle swarm optimization algorithm (PSO) is employed to optimize the hyperparameters of
LSTM network for improving the performance of the model. Furthermore, the effectiveness and
robustness of the PSO-LSTM model are verified according to the collected experimental data.
Finally, performance of the proposed model and traditional ones are compared. The rest of this
paper is organized as follows. In Section 2, the modeling process and relevant theory of the
proposed method are introduced. In Section 3, the thermal mode analysis and experiments are
conducted, and the performance of proposed data-driven model is discussed and compared with
other methods. Section 4 summarizes the main conclusions.
2 Thermal error prediction of ball screws based on PSO-LSTM
A deep learning model based on PSO-LSTM to predict thermally induced error of ball screws
according to temperature and deformation data measured by temperature sensor and eddy current
displacement sensor, respectively, is proposed in this research. And then the essential
configuration of the deep learning model is optimized by Particle Swarm Optimization algorithm
(PSO). The model is intended to quickly determine the thermal deformation and is used to
compensate online thermal error in the working status. It is established and optimized by the
Matlab deep learning toolbox and global optimization toolbox respectively.
2.1 LSTM neural network
Long short-term memory (LSTM) network, one of popular deep learning architectures in

recent years, is developed specially to learn and handle long-term dependencies presented in
sequential data such as temperature rise and thermal deformation of machine tools in the machining process. The exploding/vanishing gradient problem, which directly leads to the
recurrent neural network (RNN) learning stopping or becoming too slow, can be solved by
introducing a memory cell and three gating mechanism into the architecture of LSTM which
modifies the RNN structure. Fig. 1 shows the framework of a LSTM neural network. The core of
LSTM network is a cell memory state represented by the horizontal line through the cell which is
similar to a conveyor belt running through the entire cell, but it only has few branches. It also
includes three gates which called forget gate, input gate and output gate, to control and update cell
status. Therefore, the network can ensure the entire information passes through the cell and update
information to maintain its memory state with time. Based on the above characteristic, LSTM can
not only address variable length time-series data and capture long-term dependencies, but also
memorize historical information dynamically and learn new information while maintaining a
persistent memory of historical information [34-37].
+×
σ tanhσ σ
××
tanh
tC
th
th
1th
1tC
tx
Fig. 1 Framework of the LSTM neural network
The first step of LSTM is removing unimportant information operated by a unit called forget
gate, which can be derived as
1,t f t t ff W h x b
(1)
Where tf is on behalf of forget gate, is the activation function, fW is the weight matric of
forget gate, 1th is the output at the previous time 1t , tx is the current input, and fb is a
bias vector.
The next step is to select and add valuable information to the network through input gate, and
to produce new cell information waiting to be selected. This process can be expressed as
1,t i t t ii W h x b
(2)
1tanh ,t C t t CC W h x b %
(3)
Where ti and tC% are the input gate and the intermediate value during the calculation, iW and
CW are weight matrixes of input gate and internal state, ib and Cb are biases of input gate and
internal state.
Subsequently, new cell information is updated in the network through input gate and forget
gate, which is formulated as
1t t t t tC f C i C % (4)
Where tC and 1tC are the cell state at the current time t and the previous time 1t ,

respectively.
Finally, the outcome and cell state of LSTM is determined by updating and selecting the new
cell information and the input, which is written as
1,t o t t oo W h x b
(5)
tanht t th o C
(6) Where to , , oW and ob are the output gate, activation function, the weight matrix of output gate and the bias of output gate, respectively. th is the output at the current time t .
The above equations reveal the internal calculation mechanism of LSTM where the network output of each time step is associated with previous input and cell state to predict future information by addressing variable length time-series data and capturing long-term dependencies. Therefore, LSTM can dynamically memorize historical information and learn new information
while maintain a persistent memory of historical information.
2.2 Thermal error modeling by LSTM
Thermally induced error of ball screws can be processed by LSTM network as the
temperature and deformation is time-series data increasing or dropping with time once the
machine tool is working. Firstly, the essential configuration of LSTM network is designed based
on the input data set and output data where the number of features is just in correspondence with
temperature measurement point and thermal deformation respectively. The multi-layer LSTM and
added full-connected layer are introduced into the network model. In the model training process,
weighs and bias are updated by Adam optimizer and the root mean square error (RMSE) as fitness
function is used to evaluate the performance of the LSTM. Additionally, the hyperparameters of
LSTM is adjusted by optimization algorithm due to the ability to quickly find the best solution.
2.3 Hyperparameter optimization algorithm
In order to establish an ideal network with accurate performance, it is necessary to search
optimal parameters of the model. Particle Swarm Optimization algorithm (PSO) is derived from
the imitation of bird predation behavior. As one of the evolutionary calculation technologies, PSO
can collaborate and share information between individuals in the group to find the optimal
solution quickly so that it is suitable to be used for searching the optimal parameters. Therefore,
PSO is applied in this study to optimize the network hyperparameters for better results. This
algorithm is conducted by continuously searching and updating the personal best and global best
of swarm while simultaneously the position and velocity of each particle are updating for the next
optimization process. The search process of this algorithm is summarized in Fig. 2.

1t
idx
Velocity toward
t
idp
-1t
idp
-1t
idx
t
idx
t
bestg
-1t
jdx
t
jdx
1t
jdx
-1t
bestg
-1t
jdp
t
jdp
idp
Velocity toward bestg
Resultant velocity
Personal best position of particle
Global best position of particles
Resultant position
Fig. 2 Search process of particles
2.4 Evaluation metrics of the model
RMSE, MAE, MSE and MAPE are four metrics for evaluating the performance of the model. The smaller value of the metric indicates the better performance with the model, which are expressed as
$ 2
1
1= ( )
n
i i
i
RMSE y yn
(7)
$
1
1=
n
i i
i
MAE y yn
(8)
$ 2
1
1= ( )
n
i i
i
MSE y yn
(9)
$
1
100=
ni i
i i
y yMAPE
n y
(10)
Where n is the number of samples, and i
y
and $
iy are the actual and predictive values of i
-th sample, respectively.
2.5 Thermal error prediction based on PSO-LSTM model
Learning rate is the most crucial hyperparameters, followed by the network size [38]. In this
paper, the hyperparameters of LSTM network, learning rate and unit number, were searched by
PSO intelligent optimization algorithm by using the fitness function of root mean square error to
search the optimal learning rate and unit number under the best fitness value. Simultaneously, the
time window size of data set is designed by using PSO where the time window is introduced into
the data set to improve the accuracy of the model. In this research, the relationship between
thermal deformation and temperature rise of measured points is given by
1 1 2, , , ,t t t t t nY f Y T T T
(11) Where tY and 1tY is on behalf of the predicted thermal error at the current time t and the
previous time 1t , 1tT , 2tT , , t nT is the previous temperatures and the number n is the
time window size.

The time-series data of temperature and thermal deformation in axial direction are measured
by temperature sensor and eddy current displacement sensor respectively. And then these data are
imported into the LSTM network to train the data-driven LSTM model. Sequentially, the optimal
learning rate and unit number determined by PSO intelligent optimization algorithm are input into
the network for obtaining the optimal configuration of the model to predict thermally induced
error. The flow chart of proposed PSO-LSTM model is shown in Fig. 3.
Calculate fitness (RMSE)
of particles
Get personal best(pbest) fitness
of particles
Get global best (gbest) fitness
of particles
Optimization of the position and
velocities vectors
Meet the evaluation
criterion
YESYESNONO
Initialize the position
and velocities vectors of particles
Data
Determine LSTM network structure
Set initial parameters (learning rate,
unit number, et al) as particles
Get the optimal parameters
of particles
Train the LSTM network through
training samples data
Test the LSTM network through
test samples data
Output the results of prediction
and errors
Fig. 3 Flow chart of the thermal error prediction modeling process
Software: Matlab R2019a, Deep learning and global optimization toolbox, Win7 64-bit
operating system; Hardware: RAM 8 GB, Inter (R) Core (TM) i5-5200U CPU 2.20GHz.
3 Results and Validation
In order to validate the PSO-LSTM model for predicting thermally induced error of ball
screws, thermal characteristic experiments for the time-series thermal error forecast are
implemented in this paper. Firstly, thermal sensitive points of ball screws are captured according
to thermal modal analysis (TMA) to determine the key temperature measurement point. Secondly,
a thermal experiment with step speed of the motor for obtaining the data of temperature and
deformation is carried out to validate the effectiveness of PSO-LSTM model, and then another
thermal experiment with random speed is carried out to verify the robustness of the proposed
model further. Finally, the performance of the proposed model is compared with that of RBF
model and BP model.
3.1 Thermal sensitive point
Ball screws feed drive systems mainly include motor, coupling, bearings and ball screws. In
the working status, the thermal deformation of ball screws is mainly caused by temperature rises
of bearings, nuts and a screw. With the purpose of thermal error modeling, it is required to

establish a correlation between the temperature rise of components and deformation. Therefore,
the selection of temperature sensitive points based on thermal mode is introduced in this section.
The thermal modes of the system represent the distribution of the temperature field under the
corresponding eigenvalues, which is the reciprocal of the time constant. The corresponding
transient response of temperature field can be acquired by superposition of each order thermal
mode. Additionally, the areas with significant temperature changes can be identified rely on the
shape of low order thermal modes. In order to analyze the thermal sensitive point of ball screws, a
finite element (FE) model of ball screws is established and the thermal modal analysis is carried
out.
To perform the thermal modal analysis, the finite element solution of the underlying heat
transfer problem needs to be solved [12], which requires the integration of coupled differential
equations of the form
T TC T t K T t Q t &
(12)
Where TC and TK are the heat capacity matrix and the heat conductivity matrix,
respectively, T t is the nodal temperature vector, and Q t is the nodal thermal load
vector.
The eigen-problem associated with Eq. (13) is
T T T TK C
(13)
Where is a diagonal matrix composed of all the eigenvalues, i , and T are the
corresponding eigenvector matrix. Theoretically, i is the reciprocal of the corresponding time
constant
1i
i
(14)
Where i and i are the i -th eigenvalue and time constant, respectively. The time constant
describes how quickly the mode responds to thermal loads.
The first four thermal modes with the time constants and the corresponding temperature field
distributions are calculated by thermal modal analysis, the magnitudes of the temperature for each
mode are normalized. The first four thermal modes with temperature fields and thermal time
constant are shown in Fig. 4. It is seen that the thermal time constant of ball screws is greater,
indicating that the variation of temperature field is slow. It is depicted significant temperature rise
occurs on the fixed bearing, the support bearing, the nut/screw interface. Therefore, the
temperature sensitive points are determined and three temperature measuring points are arranged
on the surface of the nut and the end surface of two bearings in this research.

0.0 0.2 0.4 0.6 0.8 1.0 1.2
-1.0
-0.8
-0.6
-0.4
-0.2
0.0
0.2
0.4
0.6
0.8
1.0
Slave nutMain nut
1st order: τ =1457.7s
No
rmali
zed
tem
pera
ture
Position/m
0.0 0.2 0.4 0.6 0.8 1.0 1.2
-1.0
-0.8
-0.6
-0.4
-0.2
0.0
0.2
0.4
0.6
0.8
1.0
2nd order: τ =1418.4s
Slave nutMain nut
Norm
ali
zed t
em
pera
ture
Position/m
0.0 0.2 0.4 0.6 0.8 1.0 1.2
-1.0
-0.8
-0.6
-0.4
-0.2
0.0
0.2
0.4
0.6
0.8
1.0
3rd order: τ =740.7s
Norm
aliz
ed t
emper
ature
Position/m
Fixed bearing
0.0 0.2 0.4 0.6 0.8 1.0 1.2
-1.0
-0.8
-0.6
-0.4
-0.2
0.0
0.2
0.4
0.6
0.8
1.0 4th order: τ =649.4s
No
rmali
zed
tem
pera
ture
Position/m
Surport bearing
Fig. 4 First four thermal modes with temperature fields and time constants
3.2 Experimental results and validation
To verify the effectiveness and robustness of this proposed model and to compare with the
performance of other models in this study, two thermal characteristic experiments with step speed
and random speed are conducted on the high-speed precision ball screw test bench in our
laboratory. The experimental setup is shown in Fig. 5(a-e). Parameters of the measuring
instrument are shown in Table 1. Three temperature sensors are mounted on the feed drive system
to obtain the temperature data, where they are arranged on the front bearing seating, the rear
bearing seating and the nut, respectively. An eddy current displacement sensor is installed on the
end face of the screw to measure the thermal deformation. Additionally, the ambient temperature
is monitored during the experiment so as to consider the effect of ambient temperature on thermal
deformation.

Table 1 Parameters of experimental instrument.
Type Product description
Temperature sensors KYW-TC, Kunlunyuanyang, Beijing, China
Eddy current displacement sensor ML33-01-00-03, Milang, Shenzhen, China
Temperature inspection instrument Kunlunyuanyang, Beijing, China
Displacement inspection instrument XSAE-CHVB1M2V0, Milang, Shenzhen, China
First of all, the ball screw runs as reciprocating cycle at a rotational speed of 500r/min for
10min, where the purpose is to avoid the influence of gap between the parts of ball screws and
instability of the machine at the startup stage, and the accuracy of experimental results is
guaranteed. Ten minutes later the experiment is carried out according to the speed spectrum and
the nut moves along with the screw as the reciprocating cycle. The temperature of the front
bearing housing, the rear bearing housing and the nut, the ambient temperature and the thermal
deformation of the screw are in real-time collected where the data is recorded by a self-designed
data acquisition system and sampling period assigned as 600ms. After the experiment, the
temperature of components should be naturally cooled to the ambient temperature and then
another experiment continues.
Motor
Coupling
Bearing
Nut
Worktable
Screw
(a) Test bench of ball screws

Temperature sensor
Nut
Temperature sensor
Fixed bearing housing
(b) Temperature sensor mounted on nut (c) Temperature sensor mounted near fixed bearing
Eddy current
displacement sensor
Temperature sensor
Supporting
bearing housing
Displacement
inspection instrument
Temperature data Displacement data
Temperature inspection
instrumenttrument
(d) Temperature and thermal deformation test (e) Data acquisition system
Fig. 5 Experiment setup
A thermal characteristic experiment with step speed of the motor is carried out to validate
the effectiveness of PSO-LSTM model. The speed of the motor is changed on every 20 minutes
and increases from 300r/min to 1000r/min then decreases to 300r/min (See Fig. 6). The
experimental result based on step speed is shown in Fig. 7. According to experimental results, the
data of temperature rise and thermal deformation is normalized and feed the neural network
models. The first 80% data is taken as a training set and the last 20% data is assigned as a testing
set. The PSO searching result shows the time window size, learning rate and unit number is 5,
0.0037 and 88 respectively. In order to verify the advantage of this proposed model, the results of
this model is compared with that of other models. The parameters of each network model are
fairly assigned. Comparative results of each model under the step speed are shown in Fig. 8. It is
clear that the result of PSO-LSTM model is almost entirely consistent with the experimental result.
The RBF and BP can reasonably predict the values that never appeared, but the error between
predictive result and experimental result of both two models is greater than PSO-LSTM one. The
result of the testing set can indicate the performance of model and is most critical for validating
the model. Fig. 9 illustrates the relative error distribution characteristics of the three models. It is
concluded that the results of PSO-LSTM model and BP model are better than RBF model. The
PSO-LSTM model and BP model are both with high accuracy while the PSO-LSTM is more
accurate than the BP model. Fig. 10 presents the absolute error distribution characteristics of the
three methods. It can be found that many error points of RBF and BP are beyond 10μm and some
of them even close to 20-30μm. In contrast, the absolute error of data obtained from PSO-LSTM
are mostly controlled within 5μm, only a little of points outside of 5μm but not larger than 8μm.

Fig. 11 shows the results of regression state analysis for the three models. The regression
prediction performance of PSO-LSTM model is better than others. To quantify the predictive
performance of the models, the four criterias, RMSE, MAE, MSE and MAPE of the testing set of
the three models are listed in Table 2. It is concluded that the PSO-LSTM model has the smallest
RMSE, MAE, MSE and MAPE with the highest precision, followed by the BP model, and then
the RBF model. Consequently, the proposed model provides an exact global trend prediction of
thermal error, meanwhile the thermal error at a certain time also can be accurately determined. As
the predictive results well agree with the experimental one, the PSO-LSTM model is validated.
Via comparisons with other models, It is concluded that the PSO-LSTM model has the advantage
in prediction accuracy.
300
500
600
800
900
1000
900
800
600
500
300
0 20 40 60 80 100 120 140 160 180 200 220
0
200
400
600
800
1000
Rota
tional
spee
d/(
r/m
in)
Time/min
Rotational speed
Fig. 6 Step speed spectrum
0 2000 4000 6000 8000 10000 12000
26
28
30
32
34
36
38
40
42 results of temperature
Nuts Fixed Bearing
Support Bearing Room
Tem
pera
ture
/℃
Time/s
0
50
100
150
200
250
300
350
400
450
Deformation
Defo
rmati
on/μ
m
Fig. 7 Experimental results of thermal error in step speed

0 2000 4000 6000 8000 10000 12000 14000
0
20
40
60
80
100
120
140
160
180
200
220
240
260
280
300
320
340
360
Ther
mal
def
orm
atio
n/μm
Time/s
Experimental result
Predictive result
0 2000 4000 6000 8000 10000 12000 14000
0
20
40
60
80
100
120
140
160
180
200
220
240
260
280
300
320
340
360
Ther
mal
def
orm
atio
n/μm
Time/s
Experimental result
Predictive result
(a) Predictive results of the PSO-LSTM model (b) Predictive results of the RBF model
0 2000 4000 6000 8000 10000 12000 14000
0
20
40
60
80
100
120
140
160
180
200
220
240
260
280
300
320
340
360
Ther
mal
def
orm
atio
n/μm
Time/s
Experimental result
Predictive result
(c) The predictive results of the BP model
Fig. 8 Comparative results between the experiment and the prediction of the three models
PSO-LSTM RBF BP
-2
0
2
4
6
8
10
12
Rel
ativ
e er
ror/
%
PSO-LSTM
RBF
BP
Fig. 9 Absolute relative error of the three models

10500 11000 11500 12000 12500 13000
-20
-10
0
10
20
30
Abs
olut
e er
ror/
μm
Time/s10500 11000 11500 12000 12500 13000
-20
-10
0
10
20
30
Abs
olut
e er
ror/
μm
Time/s
10500 11000 11500 12000 12500 13000
-10
0
10
20
Abs
ulut
e er
ror/
μm
Time/s
(a) PSO-LSTM model (b) RBF model (c) BP model
Fig. 10 Absolute error scatterplot of the testing set
(a) PSO-LSTM model (b) RBF model (c) BP model
Fig. 11 Regression analysis
Table 2 Comparison among different predictive models
Models RMSE MAE MSE MAPE
PSO-LSTM 3.7755 3.5557 14.2541 1.4281
RBF 7.2715 5.9230 52.8746 2.4339
BP 5.5459 4.0659 30.7569 1.7565
According to the random speed spectrum (See Fig. 12), another thermal experiment is carried
out to verify the robustness of the proposed model. The experimental results based on step speed
are shown in Fig. 13. The experimental data is normalized and imported to the neural network.
The first 80% data is taken as a training set and the last 20% data is assigned as a testing set. The
PSO searches that the time window size is 5, the learning rate is 0.0029 and the unit number is 86.
In order to compare fairly, RBF and BP are set with the same structure. The prediction results of
three models are shown in Fig. 14. It can be seen from Fig. 14 that the LSTM model outperform
others, and the RBF model and the BP model have an obvious decline in their accuracy. Although
the results of RBF and BP are acceptable for the training set, a certain data of the testing set are
with large error and even some of them close to 6%. The results of RBF and BP for the testing set
are both with obvious errors, which indicate that the generalizability is not strong enough to
predict the data that never appear in the training stage. In contrast, the proposed PSO-LSTM
model can predict the thermal error variation more accurately.
The relative error obtained by the PSO-LSTM model is smaller than that of other two models,
as depicted in Fig. 15. The absolute error distribution characteristics of the three methods are
shown in Fig. 16. It is concluded that the PSO-LSTM model has a smaller and narrower error

band. Most error points of RBF and BP in testing set are beyond 10μm and some of them even
close to 20μm. In contrast, the absolute error of data from PSO-LSTM is all controlled within 5μm,
which shows the excellent performance of this proposed model. The results of regression state
analysis for the three models are shown in Fig. 17. The regression prediction performance of
PSO-LSTM model is better than others. The statistic evaluation indexes of the testing set of the
three models are given in Table 3. The PSO-LSTM model still has the smallest RMSE, MAE,
MSE and MAPE with the highest precision. The PSO-LSTM model has higher accuracy and
lower error compared with the RBF model and BP model in two thermal characteristic
experiments based on step speed and random speed. The generalization ability of the PSO-LSTM
model is superior to the other two models according to the experimental results. The proposed
model can not only provide an accuracy predictive result of thermal error but also maintain a
stable and satisfactory performance even in complex work condition. Therefore, the effectiveness
and robustness of this proposed model are verified. The proposed method in this paper can be
implemented to predict the thermal error of ball screws, and provide a foundation for thermal error
compensation.
500
300
900
600
400
800
500
700
1000
900
600
0 20 40 60 80 100 120 140 160 180 200 220
0
200
400
600
800
1000
Rot
atio
nal s
peed
/(r/
min
)
Time/min
Rotational speed
Fig. 12 The random speed spectrum
0 2000 4000 6000 8000 10000 12000
26
28
30
32
34
36
38 Results of temperature
Nuts Fixed Bearing
Support Bearing Room
Tem
pera
ture
/℃
Time/s
0
50
100
150
200
250
300
350
400
450
Deformation
Defo
rmati
on/μ
m
Fig. 13 Experimental results of thermal error in random speed

0 2000 4000 6000 8000 10000 12000
0
20
40
60
80
100
120
140
160
180
200
220
240
260
280
300
320
340
360
Ther
mal
def
orm
atio
n/μm
Time/s
Experimental result
Predictive result
0 2000 4000 6000 8000 10000 12000 14000
0
20
40
60
80
100
120
140
160
180
200
220
240
260
280
300
320
340
360
Ther
mal
def
orm
atio
n/μm
Time/s
Experimental result
Predictive result
(a) The predictive results of the PSO-LSTM model (b) The predictive results of the RBF model
0 2000 4000 6000 8000 10000 12000 14000
0
20
40
60
80
100
120
140
160
180
200
220
240
260
280
300
320
340
360
Ther
mal
def
orm
atio
n/μm
Time/s
Experimental result
Predictive result
(c) The predictive results of the BP model Fig. 14 Comparative results between the experiment and the prediction of the three models.
PSO-LSTM RBF BP
-2
0
2
4
6
8
Rel
ativ
e er
ror/
%
PSO-LSTM
RBF
BP
Fig.15 Absolute relative error of the three models

10500 11000 11500 12000 12500 13000
-20
-10
0
10
20A
bsol
ute
erro
r/μm
Time/s
10500 11000 11500 12000 12500 13000
-20
-10
0
10
20
Abs
olut
e er
ror/
μm
Time/s
10500 11000 11500 12000 12500 13000
-20
-10
0
10
20
Abs
olut
e er
ror/
μm
Time/s
(a) PSO-LSTM model (b) RBF model (c) BP model
Fig. 16 Absolute error scatterplot the testing set
(a) PSO-LSTM model (b) RBF model (c) BP model
Fig. 17 Regression analysis curve
Table 3 Comparison among different prediction models
Models RMSE MAE MSE MAPE
PSO-LSTM 1.7217 1.3866 2.9644 0.4636
RBF 8.3665 7.0474 69.9985 2.4349
BP 7.8532 6.6345 61.6720 2.1513
4 Conclusions and future work
In this paper, a novel data-driven model based on PSO-LSTM is proposed for predicting
thermally induced error of ball screws, where the deep learning model combining with intelligent
optimization algorithm is established based on experimental results. The thermal error of ball
screws can be accurately predicted based on this proposed method, which provides a foundation
for thermal error compensation to improve the machining accuracy. The effectiveness and
robustness of this proposed model are validated by thermal error obtained from experiments based
on step speed and random speed. The comparison between the proposed model and traditional
models is implemented. The conclusions can be drawn as follow.
(1) A novel data-driven thermal errors model of ball screws based on PSO-LSTM is proposed,
and the effectiveness of this model is validated by a thermal characteristic experiment at step
speed on a self-designed ball screw test bench. Comparison between PSO-LSTM model and experiment shows that thermal error of ball screws can be accurately predicted by this proposed model, which can provide a foundation for thermal error compensation.
(2) Robustness of this proposed model is verified based on another thermal characteristic
experiment at random speed. By comparison between predictive results and experimental ones, the
PSO-LSTM model can not only provide an accuracy predictive result of thermal error but also
maintain a stable and satisfactory robustness even in complex work conditions.
(3) Comparative results between this proposed model and the traditional models are analyzed.
In terms of predicting thermally induced error of ball screws in this paper, it reveals that the
PSO-LSTM model has higher accuracy and lower error compared with the RBF model and BP
model, and has the smallest RMSE, MAE, MSE and MAPE. It is concluded that the PSO-LSTM
model outperforms the others.
Although the predictive thermal error model of ball screws is established, the effect of thermal error compensation hasn’t been checked yet. The thermal compensation based on this proposed model will be conducted and its effects will be checked in the next stage of our research work.
Declarations
Authors’ Contributions Xiangsheng Gao conceived the experiment and modeling, and wrote the manuscript as well. Yueyang Guo conducted the experiment and modeling. Dzonu Ambrose Hanson conducted the data analysis and the English editing. Zhihao Liu conducted the experiment. Min Wang and Tao Zan supervised this work and revised the manuscript.
Funding The author(s) disclosed receipt of the following financial support for the research, authorship, and/or publication of this article: This study was supported by the National Natural Science Foundation of China (grant numbers: 51875008, 51505012 and 51575014).
Ethical Approval The article follows the guidelines of the Committee on Publication Ethics (COPE) and involves no studies on human or animal subjects.
Consent to Participate Not applicable.
Consent to Publish Not applicable.
Competing Interests The authors declare no competing interests.
Availability of Data and Materials All data generated or analyzed in this study are included in the present article.
References
1. W.S. Yun, S.K. Kim, D.W. Cho (1999) Thermal error analysis for a CNC lathe feed drive system. Int J Mach Tools Manuf 39: 1087-1101
2. J. Bryan (1990) International status of thermal error research. CIRP Annals-Manuf Technol 39: 645-656
3. P.C. Tsai, C.C. Cheng, Y.C. Hwang (2014) Ball screw preload loss detection using ball pass frequency. Mech Syst Signal Process 48: 77-91

4. Z.Z. Xu, X.J. Liu, H.K. Kim, J.H. Shin, S.K. Lyu (2011) Thermal error forecast and performance evaluation for an air-cooling ball screw system. Int J Mach Tools Manuf 51: 605-611
5. Z.Z. Xu, X.J. Liu, C.H. Choi, S.K. Lyu (2012) A study on improvement of ball screw system positioning error with liquid-cooling. Int J Precis Eng Manuf 13: 2173-2181
6. H. Shi, B. He, Y. Yue, C. Min, X. Mei (2019) Cooling effect and temperature regulation of oil cooling system for ball screw feed drive system of precision machine tool. Appl Therm Eng 161: 114150
7. X.S. Gao, Z.Y. Qin, Y.Y. Guo, M. Wang, T. Zan (2019) Adaptive method to reduce thermal deformation of ball screws based on carbon fiber reinforced plastics. Materials 12: 3113
8. Y.Y. Guo, X.S. Gao, M. Wang, T. Zan (2020) Bio-inspired graphene-coated ball screws: Novel approach to reduce the thermal deformation of ball screws. Proc Inst Mech Eng Part C J Mech Eng Sci 0: 1-11
9. S. Yang, J. Yuan, J. Ni (1996) The improvement of thermal error modeling and compensation on machine tools by CMAC neural network. Int J Mach Tools Manuf 36: 527-537
10. J.G. Yang, J.X. Yuan, J. Ni (1999) Thermal error mode analysis and robust modeling for error compensation on a CNC turning center. Int J Mach Tools Manuf 39: 1367-1381
11. H.T. Zhao, J.G. Yang, J.H. Shen (2007) Simulation of thermal behavior of a CNC machine tool spindle. Int J Mach Tools Manuf 47: 1003-1010
12. J. Zhu, J. Ni, A.J. Shih (2008) Robust Machine Tool Thermal Error Modeling Through Thermal Mode Concept. J Manuf Sci E-T ASME 130 (6): 061006
13. T.J. Li, C.Y. Zhao, Y.M. Zhang (2018) Adaptive real-time model on thermal error of ball screw feed drive systems of CNC machine tools. Int J Adv Manuf Technol 94: 3853-3861
14. H. Shi, C. Ma, J. Yang (2015) Investigation into effect of thermal expansion on thermally induced error of ball screw feed drive system of precision machine tools. Int J Mach Tool Manuf 97: 60-71
15. R. Ramesh, M.A. Mannan, A.N. Poo (2003) Thermal error measurement and modelling in machine tools. : Part I. Influence of varying operation condition. Int J Mach Tools Manuf 43: 391-404
16. R. Ramesh, M.A. Mannan, A.N. Poo, S.S. Keerthi (2003) Thermal error measurement and modelling in machine tools, : Part II. Hybrid Bayesian Network - Support vector machine model. Int J Mach Tools Manuf 43: 405-419
17. H. Wu, H.T. Zhang, Q.J. Guo, X.S. Wang, J.G. Yang (2008) Thermal error optimization modeling and real-time compensation on a CNC turning center. J Mater Process Technol 207: 172-179
18. Y. Zhang, J.G. Yang, H. Jiang (2012) Machine tool thermal error modeling and prediction by grey neural network. Int J Adv Manuf Technol 59: 1065-1072
19. H.T. Wang, L.P. Wang, T.M. Li, J. Han (2013) Thermal sensor selection for the thermal error modeling of machine tool based on the fuzzy clustering method. Int J Adv Manuf Technol 69: 121-126
20. E.M. Miao, Y.Y. Gong, L.C. Dang, J.C. Miao (2014) Temperature-sensitive point selection of thermal error model of CNC machining center. Int J Adv Manuf Technol 74: 681-691
21. E.M. Miao, Y.Y. Gong, P.C. Niu, C.Z. Ji, H.D. Chen (2013) Robustness of thermal error compensation modeling models of CNC machine tools. Int J Adv Manuf Technol 69:

2593-2603
22. J. Yang, H. Shi, B. Feng, L. Zhao, C. Ma, X. Mei (2014) Applying neural network based on fuzzy cluster pre-processing to thermal error modeling for coordinate boring machine. Procedia CIRP 17: 698-703
23. A. M. Abdulshahed, A. Longstaff, S. Fletcher, A. Myers (2013) Comparative study of ANN and ANFIS prediction models for thermal error compensation on CNC machine tools, in: Laser Metrology and Machine Performance X, Buckinghamshire. 79-89
24. A.M. Abdulshahed, A.P. Longstaff, S. Fletcher (2015) The application of ANFIS prediction models for thermal error compensation on CNC machine tools. Appl Soft Comput 27: 158-168
25. H. Liu, E.M. Miao, X.Y. Wei, X.D. Zhuang (2017) Robust modeling method for thermal error of CNC machine tools based on ridge regression algorithm. Int J Mach Tools Manuf 113: 35-48
26. M.O. Dos Santos, G.F. Batalha, E.C. Bordinassi, G.F. Miori (2018) Numerical and experimental modeling of thermal errors in a five-axis CNC machining center. Int J Adv Manuf Technol 96: 2619-2642
27. Y.Q. Huang, J. Zhang, X. Li, L.J. Tian (2014) Thermal error modeling by integrating GA and BP algorithms for the high-speed spindle. Int J Adv Manuf Technol 71: 1669-1675
28. I. Rojek, M. Kowal, A. Stoic, Predictive compensation of thermal deformations of ball screws in cnc machines using neural networks, Teh. Vjesn. 24 (2017) 1697-1703.
29. B. Li, Y. Zhang, L. Wang, X. Li (2019) Modeling for CNC Machine tool thermal error based on genetic algorithm optimization wavelet neural networks. Journal Mech Eng 55: 215-220 (In Chinese)
30. A. Sagheer, M. Kotb (2019) Time series forecasting of petroleum production using deep LSTM recurrent networks. Neurocomputing 323: 203-213
31. Y.Z. Zhang, R. Xiong, H.W. He, M.G. Pecht (2018) Long short-term memory recurrent neural network for remaining useful life prediction of lithium-ion batteries. IEEE Trans Veh Technol 67: 5695-5705
32. J.F. Zhang, Y. Zhu, X.P. Zhang, M. Ye, J.Z. Yang (2018) Developing a long short-term memory (LSTM) based model for predicting water table depth in agricultural areas. J Hydrol 561: 918-929
33. Y. Qin, S. Xiang, Y. Chai, H.Z. Chen (2020) Macroscopic–microscopic attention in LSTM networks Based on fusion features for gear remaining life prediction. IEEE Trans Ind Electron 67: 10865-10875
34. Y. Lecun, Y. Bengio, G. Hinton (2015) Deep learning. Nature 521: 436-444
35. R. Zhao, R.Q. Yan, Z.H. Chen, K.Z. Mao, P. Wang, R.X. Gao (2019) Deep learning and its applications to machine health monitoring. Mech Syst Signal Proc 115: 213-237
36. R. Yang, S.K. Singh, M. Tavakkoli, N. Amiri, Y. Yang, M.A. Karami, R. Rai (2020) CNN-LSTM deep learning architecture for computer vision-based modal frequency detection. Mech Syst Signal Process 144: 106885
37. R.B. Sun, Z.B. Yang, L.D. Yang, B.J. Qiao, X.F. Chen, K. Gryllias (2020) Planetary gearbox spectral modeling based on the hybrid method of dynamics and LSTM. Mech Syst Signal Process 138: 106611
38. K. Greff, R.K. Srivastava, J. Koutnik, B.R. Steunebrink, J. Schmidhuber (2017) LSTM: A

search space odyssey. IEEE Trans Neural Networks Learn Syst 28: 2222-2232

Figures
Figure 1
Framework of the LSTM neural network
Figure 2
Search process of particles

Figure 3
Flow chart of the thermal error prediction modeling process

Figure 4
First four thermal modes with temperature �elds and time constants

Figure 5
Experiment setup
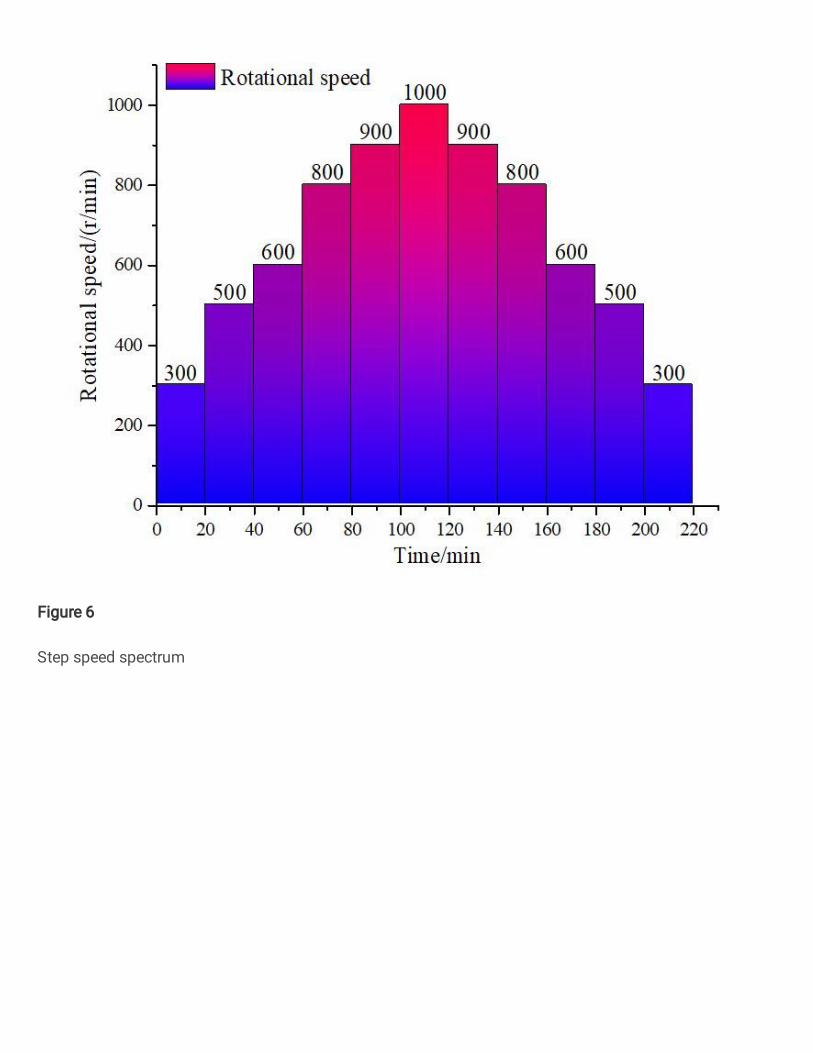
Figure 6
Step speed spectrum

Figure 7
Experimental results of thermal error in step speed

Figure 8
Comparative results between the experiment and the prediction of the three models

Figure 9
Absolute relative error of the three models
Figure 10
Absolute error scatterplot of the testing set

Figure 11
Regression analysis
Figure 12
The random speed spectrum

Figure 13
Experimental results of thermal error in random speed

Figure 14
Comparative results between the experiment and the prediction of the three models.

Figure 15
Absolute relative error of the three models
Figure 16

Absolute error scatterplot the testing set
Figure 17
Regression analysis curve
Supplementary Files
This is a list of supplementary �les associated with this preprint. Click to download.
Highlights.docx