thermal design verification testing of the solar array
TRANSCRIPT
48th International Conference on Environmental Systems ICES-2018-295 8-12 July 2018, Albuquerque, New Mexico
Copyright © 2018 The Johns Hopkins University Applied Physics Laboratory LLC
Thermal Design Verification Testing of the Solar Array
Cooling System for Parker Solar Probe
Carl J. Ercol1, Elisabeth D. Abel
2, G. Allan Holtzman
3, and Eric R. Wallis
3
The Johns Hopkins University Applied Physics Laboratory, Laurel, MD 20723-6099
Parker Solar Probe (PSP) will explore the inner region of the heliosphere through in situ
and remote sensing observations of the magnetic field, plasma, and accelerated particles.
PSP will travel closer to the sun (9.86 solar radii [(RS)]) than any previous spacecraft in
order to obtain repeated coronal magnetic field and plasma measurements in the region of
the sun that generates the solar wind. The baseline mission will entail 7 years from launch in
2018 until the completion of the 24th orbit; if delays necessitate, a backup 8-year, 26-orbit
mission will be flown, with launch in 2019. During its lifetime, the spacecraft will be exposed
to wide-ranging thermal environments, from the cold of Venus eclipse to exposures to the
sun’s corona, which produces a perihelion solar constant in excess of 480 suns. Spacecraft
power is generated using photovoltaic solar arrays that are actively cooled by the solar array
cooling system (SACS), manufactured by Hamilton Sundstrand, Windsor Locks, CT. This
paper will describe the equivalent “test-like-you-fly” environments that were simulated and
the results achieved during the SACS qualification and thermal design verification vacuum
testing that took place at Goddard Space Flight Center between 1 March and 16 March
2017.
Nomenclature
APL = Johns Hopkins University Applied Physics Laboratory
AU = astronomical unit (the distance between the center of the Earth and the center of the sun)
C-1 = thermal vacuum test configuration 1
C-2 = thermal vacuum test configuration 2
CSPR = cooling system primary radiator
GSFC = Goddard Space Flight Center
ISO = latching-type isolation valve (designated 1, 2, or 3)
I&T = Integration and Testing
ITVT = integrated thermal vacuum test
m = meter
MLI = multilayer insulation
MOC = Mission Operations Center
PBA = Phase B accumulator
PSP = Parker Solar Probe
RIU = Remote Interface Unit
RS = Solar Radii
SA = Solar Array
SACS = solar array cooling system
SES = Space Environment Simulator
SOC = Science Operations Center
TPS = Thermal Protection System
TSA = truss structure assembly
1PSP Lead SACS and Spacecraft Thermal Engineer, Space Exploration Sector, 11100 Johns Hopkins Road, Laurel,
MD 20723-6099. 2PSP Deputy Spacecraft Thermal Engineer, Space Exploration Sector, 11100 Johns Hopkins Road, Laurel, MD
20723-6099. 3PSP Spacecraft Thermal Engineer, Space Exploration Sector, 11100 Johns Hopkins Road, Laurel, MD 20723-6099

International Conference on Environmental Systems
2
V = volt
W = watt
I. Introduction
ARKER Solar Probe (PSP) will be launched from Cape Canaveral Air Force Station on a Delta IV expendable
launch vehicle, including a third stage. Immediately after separation from the third stage, the spacecraft will
begin the post-separation sequence, which includes spacecraft orientation relative to the sun and Earth, solar-array
deployment, and partial activation of the cooling system (two platens and two of the four radiators). The time to first
perihelion will be devoted to early operations, including:
• Launch correction maneuver
• Subsystem checkouts
• Deployments
• Instrument checkouts and in-flight calibrations
• Warm-up and activation of the remaining two radiators
• Preparation for first solar encounter period
• First Venus flyby to target for the first solar perihelia
Approximately 3 months after launch, PSP will conduct the first of 24 solar encounters, with perihelion of this
first orbit at 35.7 solar radii (RS). The six Venus flybys planned for the mission will decrease the perihelion of
subsequent orbits, leading to an eventual minimum orbit of 9.86 RS for the final three encounters.
PSP is a three-axis stabilized spacecraft, and its most prominent feature is the thermal protection system (TPS)
designed to protect the spacecraft bus and most of the payload within its umbra during solar encounters. The TPS
will always be pointed toward the sun, except during the cooling system activation, communications, thermal
control, specified instrument calibrations, pre-Venus eclipse maneuvers, and the trajectory-correction maneuvers
that occur at solar distances > 0.7 AU.
The central feature of each solar orbit will be the solar encounter period, centered roughly ±5.5 days around
perihelion when the observatory is within a solar distance of 54 RS. During this time, the observatory will primarily
be devoted to the scientific measurement campaigns. Because communications with the observatory will be limited
during solar encounter, the science data and the bulk of housekeeping data will be stored on a solid-state recorder.
After each solar encounter (solar distance > 0.25 AU), mission highlights include cruise/downlink segments, science
data downlinks, spacecraft-to-ground communications, and flight-path correction maneuvers.
The Deep Space Network will be used to communicate with PSP to collect data required for navigation. Mission
operations will be conducted at the Johns Hopkins University Applied Physics Laboratory (APL) from a single
Mission Operations Center (MOC). The MOC will be responsible for the operation of the spacecraft and for
providing the necessary data to the instrument teams, such as attitude, ephemeris, and precise time. PSP uses a
decoupled approach that allows each instrument team to manage its own instruments, including commanding and
telemetry management. The MOC is responsible for transmitting commands provided by the Science Operations
Centers (SOCs) to the spacecraft and providing science telemetry data to the SOCs in a timely manner. This
decoupled approach was successful during previous spacecraft operations controlled from APL (TIMED
[Thermosphere, Ionosphere, Mesosphere Energetics and Dynamics], MESSENGER [MErcury Surface, Space
ENvironment, GEochemistry, and Ranging], STEREO [Solar TErrestrial RElations Observatory], and Van Allen
Probes programs), allowing for simpler interfaces between spacecraft and science operations mission configurations.
II. Test Objectives
The overarching objective of the integrated thermal vacuum test (ITVT) described in this paper is to verify the
thermal design of the PSP spacecraft before launch by exposing the spacecraft’s solar array cooling system (SACS)
to environments simulating those expected to be encountered during flight. Thermal boundary conditions relevant to
critical SACS operation will be provided by the TPS simulator, the spacecraft simulator, and the warming plate
located between the central spacecraft and platens. Tests will be executed for the two solar-array deployment
configurations characteristic of near- and distant-helios operation. All of the operational aspects of the SACS
expected in flight, including transient operations (i.e., radiator activation, launch corrections, and Venus eclipse),
will be replicated and verified during the ground test. The most visible portion of the PSP spacecraft is the SACS,
which is illustrated in Figure 1. The SACS is a pump-driven closed-loop single-phase system that uses water under
pressure as the working fluid to actively cool solar cells, which are mounted to custom-made platens, and transport
the waste heat to either two or four active radiators.
P

International Conference on Environmental Systems
3
Figure 1. The PSP SACS.
The major components of the ITVT hardware are the flight TPS simulator, the four flight primary radiators, two
test solar-array platens, and the SACS flight components located on both sides of the spacecraft top deck (Figure 2).
The SACS top-deck components consist of the following:
• a redundant pump package, total and redundant delta pressure transducers, three latching valves, and the
accumulator
• three latching valves that allow for the initial system activation and the strategic wetting of the final two
radiators

International Conference on Environmental Systems
4
Figure 2. The PSP SACS top-deck components.
The spacecraft and its components are designed to operate within the wide range of thermal environments
defined in Table 1. The SACS budget at perihelion has been reduced from the original design capacity of 6400 W
(no fin multilayer insulation [MLI]) to ~5900 W because of the addition of MLI over fins on radiators 1 and 4. The
fin MLI was added to reduce low-temperature risk at aphelion; however, it will also decrease the perihelion
maximum capacity from 64001,2
to 5900 W (illustrated in Figure 3) by reducing the unallocated margin. The test
configuration has ~0.53 m2 of MLI over the top and bottom fins on radiators 1 and 4 to warm bias the system during
the time when only two radiators are active. This configuration represents the first 42 days of the mission when the
solar flux is the lowest. From Figure 3, the estimated thermal load from the TPS to the PSP cooling system will be
~533 W, and the thermal load from the TPS and truss structure assembly (TSA) to the spacecraft bus, represented by
the spacecraft simulator during this test, will be ~30 W. These quantities were directly measured and will be
discussed further in section VII:
• Configuration 1 (C-1): the minimum, with two active radiators, SACS temperature achieved when applying
the expected aphelion condition input power (933-W solar-array waste heat)
• C-1: the maximum SACS thermal capacity (SACS at 125°C)
• C-1 and configuration 2 (C-2): the heat leaks into the spacecraft simulator (SACS at 125°C/TPS simulator at
300°C)
• C-2: the TPS simulator heat leak into the SACS (SACS at 125°C/TPS simulator at 300°C)
Table 1. Variation in environmental heat load.
Orbit Location Heat Flux
Maximum solar flux at solar encounter (9.86 RS) 651 kW/m2
Minimum solar flux at aphelion (1.02 AU) 1314 W/m2
Maximum solar flux during communication slew (0.7 AU) 2790 W/m2
Venus albedo 0.8 ± 0.02
Venus infrared emission 153 W/m2
Coronal heating at solar encounter (9.86 RS) <3 W/m2
The operation of the SACS will begin before launch when the water in the accumulator is heated to a
temperature of ~50°C to overcome any cold spots in the inlet/outlet tubing when the system is initially activated
after launch. The accumulator heater will be powered by the launch vehicle umbilical at L-24 hours and only be
used prior to L-4 minutes. The temperature will be controlled by three series redundant thermostats (Tlow =
40°C/Thigh = 50°C), ensuring that the temperature will not exceed 65°C during pre-launch heating when the pressure
is highest. Postlaunch, this heater will never be used again.
The TPS will be pointed directly at the sun except for communication slews, scientific instrument calibration,
and instances when the spacecraft is purposely slewed to point specified radiators toward the sun for warming.
Approximately 1 hour after launch, the spacecraft will slew to allow solar warming of radiators 1 and 4 before

International Conference on Environmental Systems
5
wetting. Similarly, radiators 2 and 3 will be warmed by the sun, enabling wetting around 41 days after launch to
enable the totality of SACS operation. Between perihelion and 0.7 AU, the flap angle of the solar arrays will be
autonomously controlled. As the spacecraft approaches the sun and requires ever-diminishing solar-array surface
areas for power generation, the solar arrays will be tucked into the shadow of the TPS until only the secondary solar
arrays are exposed to the sun during near perihelion operations. PSP will encounter Venus on several occasions to
allow reduced perihelion distances, and before and after each 11-minute-long Venus eclipse, the spacecraft will slew
to warm radiators 2 and 3.
Figure 3. Pre-ITVT SACS thermal budget at perihelion (SACS system temperature at 125°C). EOL, end of
life.
III. SACS Requirements
The primary requirement of the thermal control system is to provide solar-array cooling from 9.86 RS to 1.02-
AU solar distances. The system will provide this cooling with an operating fluid (water) temperature of +10°C (test
minimum) to +150°C (test maximum/platen) depending on heat load and mission timeline. The system is designed
for a survival fluid temperature of +200°C. A custom-designed accumulator is used to store the water from launch
until initial system activation (~90 minutes after launch) as well as maintain a pressure cap on the system to prevent
boiling for temperatures up to 210°C. At 9.86 RS, the cooling system must be able to accommodate ~5900 W of
solar load over two solar-array platen “wings.” The maximum platen surface temperature at that heat load cannot
exceed 150°C at the platen surface where the solar cells will mount. The highest portion of this heat load will occur
on the tips of the solar platen; the heat load is equivalent to 35 suns. A second cooling capacity case occurs at the
0.7-AU hot slew; in that case, the spacecraft is slewed toward the sun and additional heat load is imparted to the
solar array. In addition, the total heat load is ~4500 W on the two solar arrays, with an additional 800 W on two of
the four radiators.
After a thorough trade study, deionized water was selected as the working fluid for the cooling system. Water
provides the best thermal properties for this mission. However, after launch the spacecraft will go through an
eclipse, and its temperature will drop below freezing for a period of time. To ensure the system will survive, it will
be launched dry with the water stored in the accumulator, which will not be exposed to the harsh temperatures.
However, other components in the system will become rather cold, thus driving the survival temperatures of the
radiator and cold plate down to –130°C and –80°C, respectively. To ensure the system does not freeze, it will be
activated as it is warmed up after the eclipse. The solar arrays will be deployed and heated by the sun at the same
time that one or two radiators are heated. Referring to Figure 4, once the components are sufficiently warmed,
isolation valve 1 (ISO1) will be opened to flood the pumps, the two solar-array platens, and two of the four cooling
system primary radiators (CSPRs) (radiators 1 and 4). With one-half of the system loaded with water, spacecraft

International Conference on Environmental Systems
6
operation will commence, eventually warming and flooding the final two radiators (radiators 2 and 3) ~42 days after
launch.
Figure 4. SACS flight system schematic.
The final system driving requirement is a Venus flyby eclipse. The eclipse is expected to last 11 minutes. During
this time, the system will have no solar heat load, and fluid temperatures are expected to drop. The system must be
able to maintain a minimum water temperature of 10°C in order to ensure that freezing will not occur.
As mentioned previously, the fluid for the cooling system is water. To survive the 7-year mission requirement
and the 3-year ground life, the majority of the wetted materials will be titanium. This will reduce the chance of
corrosion-induced contamination in the system. All other materials in the system are water and temperature
compatible. To ensure the correct positions of the solar cells and the protection provided by the spacecraft TPS, the
solar platens will need to be held to tight tolerance for flatness, which must be maintained within 0.006” over any
10” × 10” area, and 0.012” over the wing width over the temperature range of –80°C to 200°C.
IV. ITVT Hardware
The ITVT was the system verification test for the SACS and provided performance data and configuration
verification before the observatory system-level vacuum test to follow. The overarching objective of this test was to
verify the thermal design of the PSP spacecraft on the ground by exposing the spacecraft cooling system and its
interfaces to environments simulating those to be encountered during flight. These operations include the post-
launch maneuvers, activation of the cooling system, Venus eclipse maneuvers, in-transit operations, and perihelion
configuration management. As shown in Figure 5, two basic hardware configurations were tested: one with the
platens on (C-1) and one with the platens removed (C-2). C-1 represents the most realistic flight hardware
arrangement that properly simulates heat input, radiating area, and cooling system resistance (pressure drop). Tests
with this configuration will be used to verify critical thermal requirements and characterize system performance as a
function of temperature, flow rate, and active radiator status (either two or four panels in operation). C-2 represents
the observatory thermal vacuum configuration that allows the solar-array actuators to move the solar-array booms
(not possible due to 1-g with platens on). Testing of C-2 in the ITVT enables comparison to C-1 to support the
observatory testing. During C-1 and C-2 testing, data will be gathered to allow the development of critical flight
software related to solar-array control and safing; this software will be subsequently flight certified during the
observatory-level thermal vacuum testing. The hardware modifications allowing the switch from C-1 to C-2 will be
accomplished within the Space Environment Simulator (SES) 290 vacuum chamber.

International Conference on Environmental Systems
7
Figure 5. ITVT Configurations
V. Test-Like-You-Fly Considerations
The ITVT article consisted of both actual flight and non-flight hardware elements. Actual flight hardware
evaluated during the ground test consisted of the radiators, the radiator heaters (included for the ground test but not
used in flight), the TSA, and the cooling water supply system. Electric heaters were used to emulate various PSP
mission environments (see Figure 6). These heaters were energized by a combination of high-power (100 V/50 A)
and low-power (60 V/5 A) supplies. Low-power heaters were used to provide energy to the radiator panels, the
spacecraft simulator, the solar-array boom heater, the plumbing electronics box, and the water connection lines. A
combination of low- and high-power heaters will be used to warm the platens. Additionally, high-power heaters will
be used to provide energy to the TPS thermal simulator. The TPS thermal simulator provided back-side temperatures
in the range of 300°C to 350°C. The “test-like-you-fly” environmental simulation for the test platens, TPS, SACS
radiators, and spacecraft simulator heater plate is described in a bit more detail in the following sections.

International Conference on Environmental Systems
8
Figure 6. SACS test configuration. Radiators 2 and 3 are fully visible. S/A, solar array; S/C, spacecraft.
A. Test Platens
To properly simulate the high-intensity solar load experienced by the flight solar arrays, the test platens were
heated using a combination of ceramic heaters in high-heat-flux areas (the angled platen areas) and Kapton heaters
in low-heat-flux regions (Figure 7). For completeness, Figure 8 shows the tested configuration with the back-side
MLI installed. For cases following pump down and cooling system initial activation, only the ceramic heaters were
used because they have a more reliable heat path and are capable of simulating the high heat flux need to properly
simulate solar-array heating. Figure 9 illustrates the environments experienced by the solar arrays over the mission,
and Figure 10 illustrates the heat profile applied to each platen simulating the solar heating at closest approach
(9.8 RS). The test and flight solar-array platens are fabricated from diffusion bonded CP Grade-4 titanium and utilize
internal mini-channels to collect the waste heat from the solar cells (or heaters). The mini-channel design is different
for the secondary and primary segments of the flight and test platens to minimize pressure drop during maximum
flow. The short secondary segment (254 mm in length) uses a small-diameter densely packed mini-channel design
that efficiently removes the waste heat when at the highest flux; however, this comes with a pressure-drop penalty.
To reduce the pressure-drop penalty, the primary segment (864 mm in length) transitions to a larger-diameter mini-
channel design, in the region of the plane change, because the heat flux profile is very benign (see Figures 9 and 10)
and the pressure drop would be more substantial due to the greater length. For transient considerations, the mass of
the test platens matches the as-built mass of the flight solar arrays to within 1%. As reference, the test and flight
platens are uniform in width, measuring 635 mm and 686 mm, respectively, and both are 1118 mm in length.

International Conference on Environmental Systems
9
Figure 7. Typical solar-array test platen populated with test heaters. For clarity, the back side is shown with
the MLI removed.
Figure 8. A typical test platen with MLI installed. Note that, by design, the inlet and outlet manifolds are
uncovered.

International Conference on Environmental Systems
10
Figure 9. Solar-array heat load based on position and solar distance.

International Conference on Environmental Systems
11
Figure 10. Solar-array applied heat load and platen temperature predictions simulating closest approach
(9.8 RS).
B. TPS Simulator
Approximately 90” in diameter, the flight TPS points toward the sun during closest solar approach, and shields
the spacecraft bus from direct solar impingement. The top (i.e., sun-facing) surface of the TPS is predicted to reach
temperatures in excess of 1200°C. To sustain these high temperatures, the TPS is made of lightweight carbon–
carbon foam sandwiched between two carbon–carbon facesheets. The top facesheet is coated with a specialized
coating, but the bottom facesheet is uncoated. The bottom (i.e., bus-facing) surface of the TPS is predicted to reach
temperatures near 300°C, creating an important source of incident infrared heating on the bus. Because the very high
incident heat load and temperature of the top surface of the TPS cannot be replicated in available test facilities, the
verification of the PSP spacecraft thermal design is performed in stages.
The thermal simulator was designed and tested to meet the thermal design requirements and contamination limits
of the bottom TPS surface. The TPS simulator was successfully used during the ITVT and will be used again during
final spacecraft thermal vacuum testing to enable testing of the spacecraft in thermal vacuum with the predicted
infrared heat load. Figure 11 illustrates the mechanical and thermal structural and packaging design, and Figure 12
shows the thermal predictions and expected power required as a function of temperature that were verified during
ITVT.

International Conference on Environmental Systems
12
Figure 11. TPS simulator mechanical and thermal design.
Figure 12. TPS simulator thermal zones and predicted power and bottom temperature at 350°C.
C. SACS Radiators
The SACS radiators (shown in Figure 13) were heated in symmetric pairs using nine circuits per radiator pair.
Uneven fin heat loading was applied as prescribed by thermal modeling of the conical solar illumination geometry
and was critical for verification of the warm-up scenarios that will be experienced during initial system activation,
final system wetting (R23), and the pre-Venus eclipse heating of the SACS. Titanium 3Al-2.5V tubes, 6.35 mm in
diameter, are bonded to a 6061 aluminum facesheet and saddle using EA9394 epoxy to create each fin assembly.
Nine fin assemblies make up a completed radiator assembly. Each radiator assembly is 1 m2 and weighs ~5 kg.

International Conference on Environmental Systems
13
Figure 13. Typical wiring and heater layout for the SACS radiators.
D. Spacecraft Simulator
The spacecraft simulator utilized two plates, with ten Kapton heaters per plate to measure the heat leak into the
simulated spacecraft bus from the SACS and TPS simulator. The simulated spacecraft boundary condition of 20°C
was held for both test configurations (C-1 or C-2), and the power needed to maintain this temperature setting was
measured. As the SACS and TPS simulator warmed, the conducted and radiated heat caused the input power needed
by the spacecraft simulator to decrease. Delta changes in control heater power needed to maintain 20°C on the plates
provided direct measurements of heat flow into the underlying structure. Figure 14 illustrates the relationship of the
simulator to the flight top deck that is populated with SACS components.
Figure 14. The spacecraft simulator plate as seen by the spacecraft top deck.

International Conference on Environmental Systems
14
E. Test-Like-You-Fly Deviation: Use of the Phase B Accumulator
1. Flight Accumulator Failure
On 26 December 2016, the PSP flight accumulator failed during the second of three (planned) expulsion tests
(pre-vibration) at UTC Aerospace Systems. The failure occurred during the fill process. APL was notified
immediately, and a Failure Review Board was convened the next day. The root cause was determined to be
insufficient bonding to the titanium center tube shell, which caused blisters to form at voids in the Rulon liner that
created an interference with the bellows sweeper guide leading edge while stroking, causing the bellows to fail
(Figure 15). The sweeper guide with the leading edge intolerant of imperfections in the Rulon bonding also
contributed to the failure. The initial program impact was enormous; this was viewed as a catastrophic failure, and
the risk to the July 2018 launch was very high. Plans were being made to absorb a slip and begin preparing for the
21 May to 3 June 2019 launch backup. Goddard Space Flight Center (GSFC) was informed and put on standby for
the SACS ITVT that was scheduled to start in late February 2017. The SES shroud replacement (April 2017 and
lasts 6 months) and PSP observatory thermal vacuum testing (December 2017) were in series with this test. Cost
impact to NASA was expected be exceptionally high, and mission risk would increase due to the longer flight time
and no viable backup mission. The accumulator was scheduled to be installed into the SACS in mid-January 2017,
and the completed SACS was to be delivered to APL (GSFC) the first week of February 2017. This was the last
major component requiring integration before subsystem delivery.
Figure 15. Flight accumulator failure.
2. The Accumulator Function
The flight accumulator stores the fluid required for the mission and is used for initial post-launch system
activation (solar arrays + two radiators) and final radiator activation (L+42 days). A fixed gas charge provides
system pressure to prevent cavitation at the pump, and the nominal maximum system water temperature is 135°C
(designed for a maximum temperature of 210°C). The accumulator compensates for fluid volume changes due to
thermal excursions for the expected operating range of the SACS.

International Conference on Environmental Systems
15
Before launch, water in the accumulator is heated by an external heater to a temperature between 40°C and 50°C
to overcome any cold spots in the radiators and tubing and ensure that the system does not freeze when it is initially
wetted. The heater is controlled by three thermostats in series for fault tolerance, and power is supplied by the
launch vehicle (Figure 16).
3. Preserving the 2018 Launch Date
Before the failure, there were eight Dynatube connections being used on the SACS:
• Two per each solar array
• Two per each 1/2” latch valve (ISO2 and ISO3)
Adding an additional mechanical field joint was programmatically viewed as low risk and divorced the nearly
integrated SACS from the redesign and manufacture of the replacement flight accumulator.
APL and UTC Aerospace Systems worked together to define the orientation of the mating Dynatubes and
verified that this installation could be readily done at APL during a predetermined segment of integration and testing
(I&T). This decision also allowed for the implementation of the Phase B accumulator (PBA) during ITVT.
Figure 16. The flight accumulator in the SACS.
4. Using the Phase B Accumulator
During Phase B (2012–2013), a development accumulator was built to demonstrate the bellows design, and this
accumulator was successfully used during the SACS half system thermal vacuum test (October to November 2013).
Functionally, the PBA (Figure 17) provides the same expulsion and pressure functions as the flight unit. However,
the PBA thick-walled aluminum shell is cylindrical and larger, and the bellows can hold ~20% more fluid (a good
thing because there is more ground support equipment volume); PBA can only be stroked vertically; and the PBA
cannot be physically substituted for the flight accumulator because of its size and form factor. The SACS and PBA
arrived at GSFC on 21 February 2017 (~7 days later than was scheduled before the failure).
During the test, the PBA was positioned external to the SACS and temperature controlled to the levels expected
during the different conditions set forth by the test cases. Thermal vacuum testing started on 2 March and concluded
on 15 March 2017. The SACS was removed from SES 290 on 20 March and arrived at APL on 28 March (on
schedule). The replacement flight accumulator was eventually completed and was integrated with the SACS using

International Conference on Environmental Systems
16
the Dynatube interface on 14 June 2017. Since its integration, several expulsions and re-fills have been successfully
completed during I&T. The accumulator was present for the system-level observatory mechanical (mass properties,
vibration, and acoustic) and thermal vacuum testing, where its performance was verified.
Figure 17. The PBA installed for ITVT. GSE, ground support equipment.
VI. Test Profiles
The ITVT simulated the flight environment of the spacecraft from the coldest point of the Venus eclipse, as well
as aphelion conditions before activation of the full cooling system, to the hottest perihelion approach in the sun’s
corona. Testing verified the thermal performance of the SACS during steady-state and critical transient operational
scenarios. The testing also verified the heat flow from the TPS into the SACS radiators and into the spacecraft top
deck.
During ITVT, the thermal performance of the SACS was evaluated using test configuration 1 (C-1) (test platens
installed) and test configuration 2 (C-2) (test platens removed), which were designed to bracket the entire mission
phases expected during flight, including the critical transients.
Critical mission cases were simulated by applying the calculated heat load to the radiators in order to achieve the
desired water temperature. The critical mission cases are as follows:
A1: Cold case at 10°C with two active radiators and no heat into active radiators/platen heating olny
B2: Cold case super aphelion slew at ~20°C with four active radiators and heat added to two of the four
active radiators and the two platens

International Conference on Environmental Systems
17
B5: Hot case 0.7-AU communication slew at ~95°C with four active radiators and heat added to two of
the four radiators and the two platens
B6: Hot case at perihelion (9.8 RS) with four active radiators and simulating the maximum SACS water
temperature at the maximum system heat input through the platens (no radiator heating)
The C-1 configuration was used to verify critical thermal requirements and characterize system performance as a
function of temperature and water flow rate for both the two and four active radiator configurations with the
equivalent of two radiator fins per radiator blanketed on radiators 1 and 4. This configuration will also be used to
demonstrate solar-array-related autonomy responses to heat flux and measure temperatures.
The C-2 configuration represents the configuration that will be used during observatory testing to allow test
cases with solar-array gimbal motion, including solar-array flap-angle control, solar-array feathering at aphelion
conditions, solar-array motion during the post-separation sequence, and solar-array safing. The data gathered during
these tests will be used to help set future SACS parameters and verify proper SACS operation for operational
scenarios without the platens. All SACS thermal control (heating) was done using the four radiators in a symmetric
manor.
The platens or radiator heaters were used to provide water at prescribed temperature levels at the exit of the
pump for configurations C-1 and C-2, respectively.
A. Definition of SACS Water Temperature
The SACS water temperature was measured at the pump check valve outlet, and this will represent the SACS
temperature (see Figure 18 for reference). During the test, the water temperature was controlled within ±2°C of the
desired target temperature.
Figure 18. The “as-run” test profiles for the two configurations.
B. Configuration 1 Summary
The C-1 profiles shown in Figure 18 are labeled A, B, and C. Profile A corresponds to spacecraft simulations
with two active radiators (radiators 1 and 4), and profiles B and C represent spacecraft configurations with four
active radiators. Profile C repeats selected SACS temperature set points from profile B but with the TPS simulator in
operation. Before profiles A and B, spacecraft transients will be simulated.
Before profile A, the initial dip (on the left part of Figure 18) corresponds to the transition to vacuum
experienced during launch, and the flat portion of the profile before the first ramp corresponds to the mission
timeline where the post-launch wetting of radiators 1 and 4 will be simulated. Before profile B, the wetting of the
remaining two radiators (radiators 2 and 3 on day 41 of the mission) will be evaluated. The Venus eclipse and pre-
and post-Venus eclipse maneuvers will be evaluated in profile B.
Each of the initial states A1–A4 and B1–B4 corresponds to a water temperature downstream of pump 1
bracketing the expected temperature during flight, which is set by varying the power level of the platens. The
profile C tests in Figure 18 are executed with the TPS simulator on, in part, to evaluate energy flow from the TPS
into the SACS and spacecraft simulator. Changes in spacecraft simulator power were measured and quantified as
SACS inputs (at temperatures >20°C during profile B) and combined SACS and TPS (during profile C). The
requirement is that the combined thermal load into the spacecraft must be < 40 W (30 SACS/10 TPS).
Critical mission transients executed during C-1 are defined as follows:

International Conference on Environmental Systems
18
• Post-launch cooldown and initial SACS wetting
• Final system activation: wetting of radiators 2 and 3
• Venus eclipse
Figure 19 summarizes graphically the implementation of each of the described critical transient cases tested.
Figure 19. Critical transients during C-1.
C. C-2 Summary
The C-2 configuration profiles shown in Figure 18 are labeled B, C, and D and represent temperature conditions
expected during observatory-level thermal vacuum testing. Testing is simplified by eliminating the need for a flight-
like fill after the C-1 configuration testing by removing profile A. Unlike C-1, the SACS was fully wetted at the start
of C-2 before the initiation of the testing depicted in Figure 18. Profiles B and C are essentially repeats of those
without the platens. Any testing accomplished in profile D will be to-be-determined tests that do not require the use
of the platens. During profile C, CSPR heater power levels will be adjusted down to attain the same initial
temperatures from profile B (e.g., C5 = B5 and C6 = B6), and the differences in the required power setting to reach
these temperatures (comparisons between profiles C and B) will provide a direct assessment of the heat introduced
into the SACS by the TPS simulator, as illustrated in Figure 3 (SACS thermal margin at perihelion). The spacecraft
simulator was operated in the same manner as was done during C-1.
Table 2 summarizes the implementation of each steady-state case tested during C-2.
Table 2. C-2 case list.
Configuration CSPRs Active Case Number Description
C-2 All
B1 CSPRs heated to achieve 10°C water
B3 CSPRs heated to achieve 37°C water
B4 CSPRs heated to achieve 75°C water
B5 CSPRs heated to achieve 95°C water
B6 CSPRs heated to achieve 125°C water
C5
TPS simulator heated to 300°C and CSPRs heated to achieve
95°C water
C6
TPS simulator heated to 300°C and CSPRs heated to achieve
125°C water

International Conference on Environmental Systems
19
VII. Test Results Summary
Summary results for the Venus eclipse transient, C-1 and C-2, are represented by Figures 20–26. Overall the
testing was very successful and provided valuable data that verified the SACS Level 4 requirements and were used
to better refine the SACS and spacecraft thermal models. For the majority of the test, the results were as expected,
except for the spacecraft simulator power measurement over the operational temperature range for the SACS.
Spacecraft simulator power verified that particularly with C-1/profile B during SACS hot operation (+125°C), the
heat load into the simulator plate was on the order of 100 W (three times greater than the requirement). This
anomaly will be discussed further in the following section.
A. Venus Eclipse
During C-1 and before the start of the steady-state cases run during profile B, the last two critical transients (the
activation of radiators 2 and 3 and the Venus eclipse) were performed. The Venus eclipse was important to verify
that during the 11-minute eclipse, the unheated SACS would remain above 15°C. To mimic flight operations, 1 hour
before the start of eclipse, the test heaters on radiators 2 and 3 were powered to simulate the spacecraft slew to 45°,
increasing the SACS heat load to drive the system water temperature to ~70°C. At the end of 1 hour, all SACS
heaters were powered off for 12 minutes to represent the eclipse. As shown in Figure 20, the minimum water
temperature realized during the eclipse was 38°C, well above the required minimum 15°C. As shown, the slew
heating is necessary because the temperature drop during the eclipse was ~40°C; before the slew, the SACS water
temperature was ~53°C.
Figure 20. Venus eclipse transient simulation. S/C, spacecraft.
B. Configuration 1/Profile A
C-1/profile A represents the first 42 days of the mission when only the solar-array platens and radiators 1 and 4
are active and the spacecraft is farthest from the sun. Understanding the SACS temperature as a function of input
power is essential to verify the minimum heat load to keep the SACS above ~15°C when in this configuration.
During spaceflight, radiators 1 and 4 cannot be slewed (other than during initial activation) toward the sun, so the

International Conference on Environmental Systems
20
only system heating is a result of the waste heat from the solar arrays, estimated to be 933 W. As a result of this
constraint, ~0.53 m2 of MLI was added to the top and bottom of the fins on radiators 1 and 4 to reduce the effective
radiator area. From the results of the test it is shown, in Figure 21, that for 934 W (case A2) of thermal input, the
SACS water temperature was measured to be 14°C. Because the desired water temperature is >15°C with 933 W of
thermal input, based on the correlated thermal model, the MLI coverage will be increased to 0.63 m2 for observatory
thermal vacuum testing. Further “area tailoring” will be applied as needed based on results achieved during the
observatory thermal vacuum test.
Figure 21. C-1/profile A summary. The fin MLI and back-side MLI coverage of radiators 2 and 3 is also
shown. S/C, spacecraft.
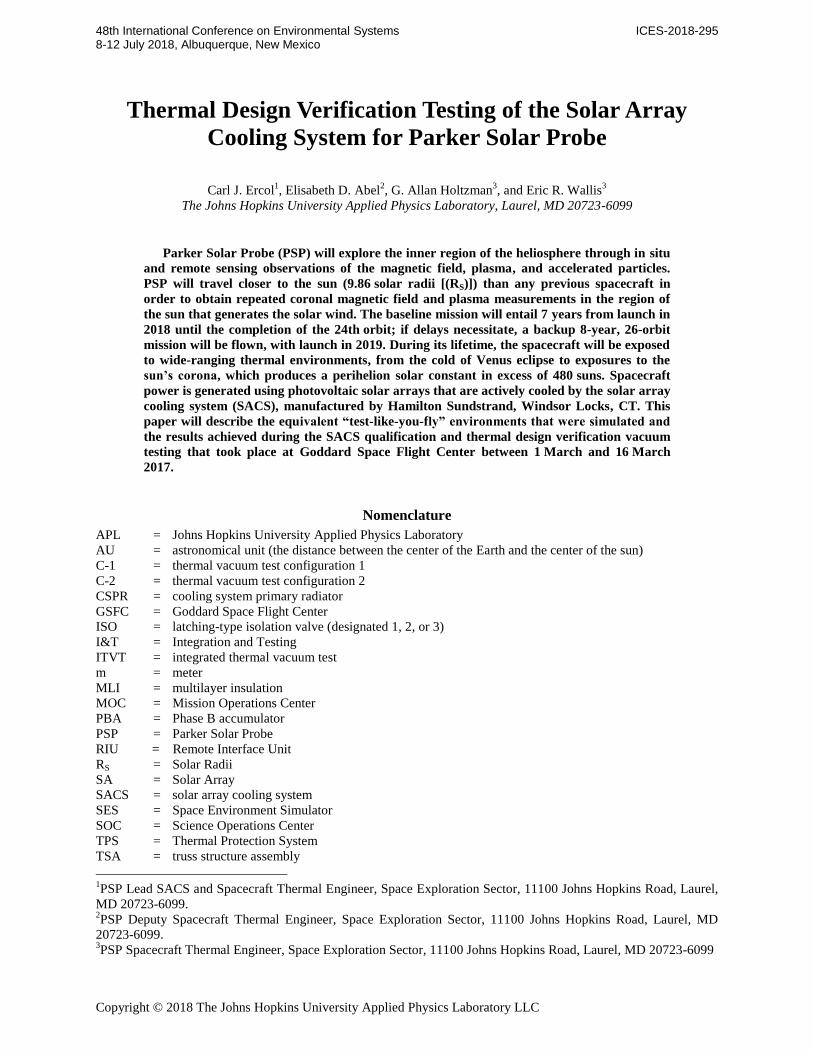
C. Configuration 1/Profile B
As C-1/profile A represents the first 42 days of the mission when only the solar-array platens and radiators 1 and
4 are active, C-1/profile B represents the fully activated system that is the long-term mission configuration. Unlike
the heating constraints with only two active radiators, radiators 2 and 3 can be slewed into the sun to augment the
solar-array waste heat and keep the SACS comfortably above 20°C, as shown in Figure 22, case B2, so cold-case
concerns related to a fully active system are somewhat mitigated. However, the driving hot case is represented by
the perihelion environments where the TPS, solar arrays, and TSA mounted instruments are at maximum heat flux
and temperature; the predicted SACS capacity is shown in Figure 3, with the SACS temperature at 125°C. As shown
in Figure 22, the measured heat capacity of the SACS when at 125°C and with 0.53 m2 of fin MLI was 6153 W, or
~253 W better than expected when compared to the pre-ITVT predictions illustrated by Figure 3 (5900 W).
International Conference on Environmental Systems
21
Figure 22. C-1/profile B summary. S/C, spacecraft.
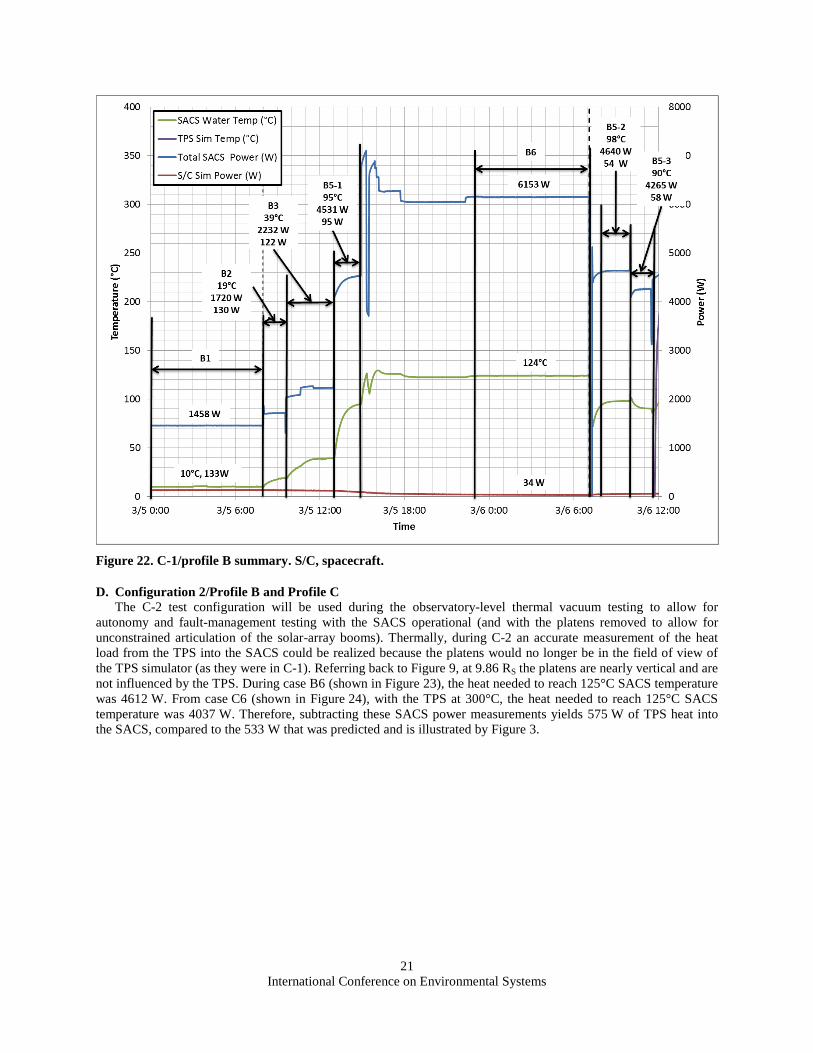
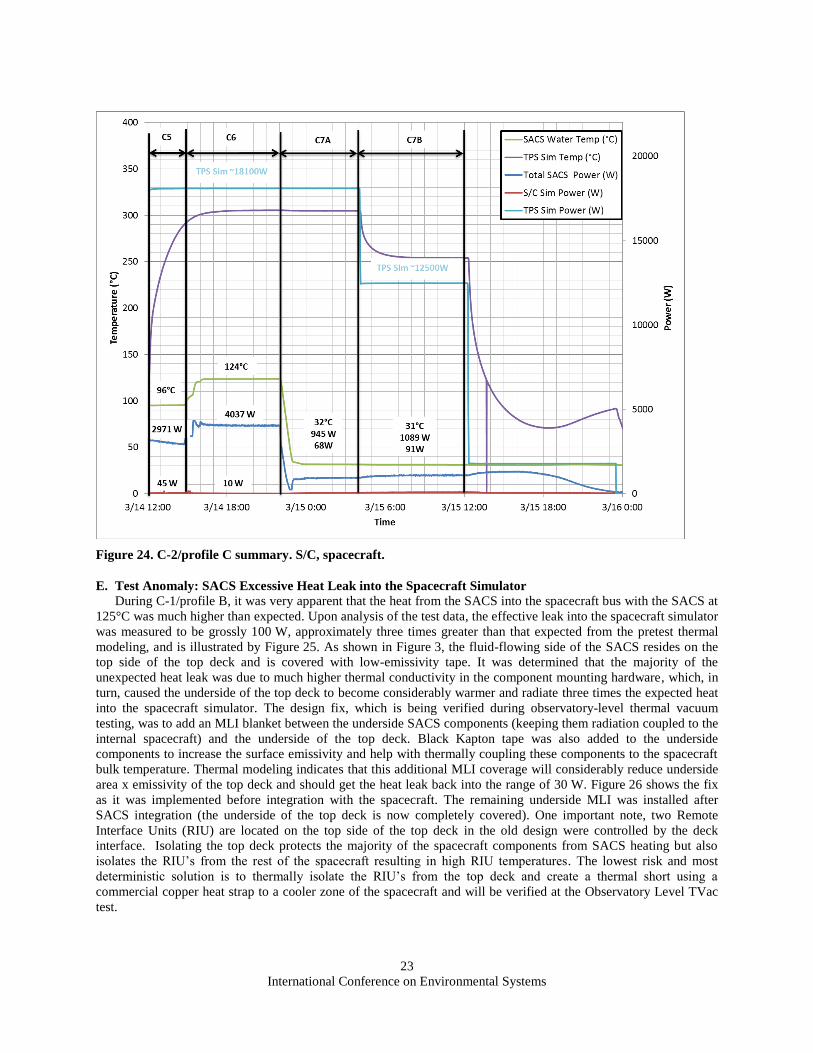
D. Configuration 2/Profile B and Profile C
The C-2 test configuration will be used during the observatory-level thermal vacuum testing to allow for
autonomy and fault-management testing with the SACS operational (and with the platens removed to allow for
unconstrained articulation of the solar-array booms). Thermally, during C-2 an accurate measurement of the heat
load from the TPS into the SACS could be realized because the platens would no longer be in the field of view of
the TPS simulator (as they were in C-1). Referring back to Figure 9, at 9.86 RS the platens are nearly vertical and are
not influenced by the TPS. During case B6 (shown in Figure 23), the heat needed to reach 125°C SACS temperature
was 4612 W. From case C6 (shown in Figure 24), with the TPS at 300°C, the heat needed to reach 125°C SACS
temperature was 4037 W. Therefore, subtracting these SACS power measurements yields 575 W of TPS heat into
the SACS, compared to the 533 W that was predicted and is illustrated by Figure 3.

International Conference on Environmental Systems
22
Figure 23. C-2/profile B summary. S/C, spacecraft.
International Conference on Environmental Systems
23
Figure 24. C-2/profile C summary. S/C, spacecraft.
E. Test Anomaly: SACS Excessive Heat Leak into the Spacecraft Simulator
During C-1/profile B, it was very apparent that the heat from the SACS into the spacecraft bus with the SACS at
125°C was much higher than expected. Upon analysis of the test data, the effective leak into the spacecraft simulator
was measured to be grossly 100 W, approximately three times greater than that expected from the pretest thermal
modeling, and is illustrated by Figure 25. As shown in Figure 3, the fluid-flowing side of the SACS resides on the
top side of the top deck and is covered with low-emissivity tape. It was determined that the majority of the
unexpected heat leak was due to much higher thermal conductivity in the component mounting hardware, which, in
turn, caused the underside of the top deck to become considerably warmer and radiate three times the expected heat
into the spacecraft simulator. The design fix, which is being verified during observatory-level thermal vacuum
testing, was to add an MLI blanket between the underside SACS components (keeping them radiation coupled to the
internal spacecraft) and the underside of the top deck. Black Kapton tape was also added to the underside
components to increase the surface emissivity and help with thermally coupling these components to the spacecraft
bulk temperature. Thermal modeling indicates that this additional MLI coverage will considerably reduce underside
area x emissivity of the top deck and should get the heat leak back into the range of 30 W. Figure 26 shows the fix
as it was implemented before integration with the spacecraft. The remaining underside MLI was installed after
SACS integration (the underside of the top deck is now completely covered). One important note, two Remote
Interface Units (RIU) are located on the top side of the top deck in the old design were controlled by the deck
interface. Isolating the top deck protects the majority of the spacecraft components from SACS heating but also
isolates the RIU’s from the rest of the spacecraft resulting in high RIU temperatures. The lowest risk and most
deterministic solution is to thermally isolate the RIU’s from the top deck and create a thermal short using a
commercial copper heat strap to a cooler zone of the spacecraft and will be verified at the Observatory Level TVac
test.

International Conference on Environmental Systems
24
Figure 25. SACS heat leak into the spacecraft simulator is quantified to be ~100 W. S/C, spacecraft.
Figure 26. Top and undersides of the top deck before SACS integration with the spacecraft.
VIII. Conclusion
The very successful ITVT provided verification that the SACS subsystem performed as expected over a broad
range of active radiators, temperatures, input power, and transient responses, both thermal and electrical. The test
helped to close a majority of the Level 4 requirements that were based on hot and cold system performance with two
and four active radiators, hot and cold expected heat loads, and the aggregate system time constant. It also provided
an end-to-end functional test that allowed all of the flight hardware to be integrated and operated together over a
wide range of temperatures, radiator configurations, and pump speeds. Data gathered for the two different test
configurations provided the flight system with measured parameters regarding system delta-P and pump and
electronics power usage as a function of temperature and pump speed, flight temperature sensor verification, and
transient timing parameters associated with the initial system warm-up and activation.
The design flaw regarding anomalous top-deck heat leak was unambiguously exposed and quantified, and a
simple fix was implemented before SACS integration. Without performing an “integrated thermal test” where the
spacecraft was thermally represented by the simulator plate, this problem would not have been found until the

International Conference on Environmental Systems
25
observatory-level thermal vacuum test, and implementing the fix would have been an enormous undertaking from a
technical (the fix would have needed to be made during the chamber break so that the fix was tested in C-2,
probably requiring the spacecraft being removed from the SES) and schedule perspective.
As a comparison to ITVT, Figure 27 shows the integrated PSP spacecraft with the flight solar arrays installed
(left) along with the solar-array booms being articulated during flight system software testing during C-2. Also
evident is the MLI covering the fins on radiators 1 and 4.
Figure 27. The PSP spacecraft before observatory thermal vacuum testing. C-1 is on the left, and C-2 is on
the right.
Finally, Figure 28 shows the SACS assembly being removed from the SES on 20 March 2017 after ~3 weeks in
the SES 290 thermal vacuum chamber. The authors would like to thank all of the various support individuals at
GSFC who helped to make this test smooth and very successful. The authors would also like to thank Neal Bachtell
and Tony Ahan from APL and Gary Stewart, Christopher Miller, Eric Bechard, Jonathan O’Neill, Tom Davis and
Kevin Aceves from United Technologies for test setup and MLI support and SACS operations.
Black Kapton
MLI covering
radiator fins

International Conference on Environmental Systems
26
Figure 28. The SACS assembly is lifted out of the SES 290 on 20 March 2017.
Acknowledgments
The PSP mission is supported by the NASA Science Mission Directorate Heliophysics Division and is under the
direction of the GSFC Living With a Star Program Office and APL. The authors acknowledge the GSFC Living
With a Star Program Office and Andrew Driesman, the PSP spacecraft Project Manager at APL, for their support in
the preparation and presentation of this paper.
References 1Ercol, C. J., “Solar Probe Plus Array Cooling System T-Vac Test,” 28th Space Simulation Conference 2014: Extreme
Environments: Pushing the Boundaries Proceedings, Baltimore, MD, 3–6 November 2014, pp. 330–340 2Ercol, C. J., “Active Solar Array Thermal Control System for the Solar Probe Plus Spacecraft,” 42nd International
Conference on Environmental Systems, paper ICES-2012-3604, San Diego, CA, 15–19 July 2012.