thermal coal - anglo american plc mines and has a 50% interest in the mafube colliery and phola...
TRANSCRIPT

Thermal CoalAnglo American’s thermal coal business, with operations in South Africa and Colombia, features a diverse, high quality asset portfolio and aims to be a long term, reliable supplier of thermal coal.
Stacker and stockpile – New Denmark Colliery, Anglo Thermal Coal, South Africa

Share of Group operating profit(%)
0
5
10
15
20
15
11
0908
Underlying earnings($m)
0
152
304
456
608
760
517
754
0908
Operating margin(%)
0
5
10
15
20
25
30
35
40
29.0
35.3
0908
Share of Group net operating assets(%)
0
1
2
3
4
5
4
3
0908
80
70
60
50
40
30
20
10
0
Anglo Coal production (Mt)
05Year 09080706
EskomTrade – Thermal South Africa(1)
Trade – Metallurgical South AfricaTrade – Thermal South America(2)
Forecast conceptual production 10+ year outlook
Thermal coal potential attributable production (Mt)
80
100
Year
60
40
20
0
Existing and approvedMajor unapproved growth pipeline
Source: Anglo American
09 11 12 1310 F
F
100 Anglo American plc Fact Book 2009/10
Financial highlights(1)Thermal Coal
(1) Due to the portfolio and management structure changes announced in October 2009, the segments have changed from those reported at 31 December 2008. 2008 comparatives have been reclassified to align with current year presentation. The segment results include an allocation of corporate costs.

Anglo American plc Fact Book 2009/10 101
Thermal C
oal
Financial data
US$m 2009 2008
TurnoverSubsidiaries 1,748 2,210 Joint ventures – – Associates 742 841Total turnover 2,490 3,051 Of which: South Africa 1,748 2,210 South America 742 841 EBITDA 875 1,200 Of which: South Africa 550 814 South America 352 419 Projects and corporate (27) (33) Depreciation and amortisation 154 293 Operating profit before special items and remeasurements 721 1,078 Of which: South Africa 442 736South America 305 375Projects and corporate (26) (33)
Operating special items and remeasurements (6) 2
Operating profit after special items and remeasurements 715 1,080 Net interest, tax and minority interests (204) (324) Underlying earnings 517 754Of which: South Africa 328 543 South America 215 243 Projects and corporate (26) (32) Net operating assets 1,707 1,018 Capital expenditure 400 365

IndicatedProbable
Zibulo
Isibonelo
New Vaal
Mafube
Cerrejón
New Denmark 31
23
20
17
18
17
Life of Mine and Thermal Coal Reserves and Resources
0Year 3520 25 3015105
Proved Measured
417 Mt 1,126 Mt
Reserves* Resources*
1,366 Mt 2,094 Mt
Source: Anglo American
* Saleable tonnes including Colombian export thermal and South African export thermal, other metallurgical, domestic power and Synfuel coal reserves. The figures reported represent 100% of the Saleable Ore Reserves and Mineral Resources; the percentage attributable to Anglo American plc is stated separately on pages 109-113. Coal Reserves are additional to Coal Resources.
102 Anglo American plc Fact Book 2009/10
Business overview
Financial highlights: Thermal Coal$ million (unless otherwise stated) 2009 2008
Operating profit 721 1,078South Africa 442 736South America 305 375Projects and corporate (26) (33)
EBITDA 875 1,200Net operating assets 1,707 1,018Capital expenditure 400 365
Share of Group operating profit 15% 11%Share of Group net operating assets 4% 3%
69.3Mt 2009 production from Thermal Coal
9wholly owned mines in South Africa
512$ m – cost of Zibulo project due to come fully on stream in 2012
Thermal Coal

11
3
9
7
86
1
2 104
5
1
Anglo American plc Fact Book 2009/10 103
Thermal C
oal
Key Underground Open Cut Other
●●
In South Africa, Thermal Coal owns and operates nine mines and has a 50% interest in the Mafube colliery and Phola washing plant. Five of the mines together supply 22 Mtpa of thermal coal to both export and local markets. New Vaal, New Denmark and Kriel collieries are domestic product operations supplying 32 Mtpa of thermal coal to Eskom, the state-owned power utility. Isibonelo mine produces 5 Mtpa of thermal coal for Sasol Synthetic Fuels, the coal to liquids producer, under a 20 year supply contract.
Anglo Inyosi Coal, a broad-based black economic empowerment (BBBEE) company valued at approximately $1 billion, is 73% held by Anglo American, with the remaining 27% held by Inyosi, a BEE consortium led by the Pamodzi and Lithemba consortia (66%), with the Women’s Development Bank and a community trust holding the remaining equity. Anglo Inyosi Coal, in turn, holds Kriel colliery, the new Zibulo multi-product project (previously known as the Zondagsfontein project) and the greenfield projects of Elders, New Largo and Heidelberg. The outstanding conditions precedent to the Anglo Inyosi Coal transaction are expected to be fulfilled in the first half of 2010, following which the transaction will complete.
Thermal Coal’s South African operations currently route all export thermal coal through the Richards Bay Coal Terminal (RBCT), in which it has a 27% shareholding, to customers throughout the Med-Atlantic and Asia-Pacific regions. Within South Africa, 61% of total sales are made to Eskom on long term (i.e. life of mine) cost-plus contracts. A further 9% is sold to Sasol and 3% to industrial sector consumers. The remaining 27% is exported through RBCT.
●●●●
●
●●●●●
South AfricaExport/Industrial1 100% Goedehoop2 100% Greenside3 100% Kleinkopje4 100% Landau5 27.5% Richards Bay Coal Terminal6 Zibulo
Eskom/Other domestic7 73% Kriel8 100% New Denmark 9 100% New Vaal 10 50% Mafube 11 100% Isibonelo
●In South America, Anglo American has a 33.3% shareholding in Cerrejón, a 32 Mtpa capacity (10.7 Mtpa attributable) opencast operation in Colombia. Cerrejón owns and operates its own rail and deep water port facilities and sells into the export thermal and PCI coal markets.
Production from Anglo Coal’s South American operations is sold predominantly to Med-Atlantic region customers.
South America1 33% Cerrejón (Colombia)

104 Anglo American plc Fact Book 2009/10
was 41%, compared with 18% in 2008, with 29% going to India. In the absence of European demand, this ability to deploy coal eastwards gave support to both South African export volumes and prices. With the Pacific market driving the API4 price as 2009 progressed, the flow of coal away from the Atlantic became increasingly evident. Colombian and US exports were generally not as competitive in the Asian markets as in the Atlantic market due to comparatively higher freight costs during the year.
Coal is the most abundant source of fossil fuel energy in the world, considerably exceeding known reserves of oil and gas. The bulk of coal produced worldwide is thermal coal, which is used as a fuel for power generation and other industries, notably the cement sector. The seaborne thermal coal market comprises nearly 700 Mt and is supplied from a large number of countries, with coal producers operating in a highly competitive global marketplace.
Thermal coal usage is driven by the demand for electricity and is influenced by the price of competing fuels, such as oil and gas and, increasingly, the cost of carbon. Global thermal coal demand is also affected by the availability of alternative generating technologies, including gas, nuclear, hydroelectricity and renewables. The market for export thermal coal is further impacted by the varying degrees of privatisation and deregulation in electricity markets, with customers focused on securing the lowest cost fuel supply in order to produce power at a competitive price. This has resulted in a move away from longer term contracts towards shorter term contracts priced against various coal price indices, which has given rise to the development of an increasingly active financial market for hedging and derivative instruments. The extent to which these pricing instruments are used, however, varies from region to region.
MarketsAnglo American weighted average achieved FOB prices ($/tonne) 2009 2008
RSA export thermal 64.46 84.54
RSA domestic thermal 18.48 20.41South American export thermal 72.98 81.33
Attributable sales volumes (thousand tonnes) 2009 2008
RSA export thermal 15,857 15,916
RSA domestic thermal 6,251 7,046South American export thermal 10,854 11,568
2009 saw considerable price and market trend changes compared with 2008. The average 2009 FOB index price for South African thermal coal exports (API4) was $65 per tonne, compared with $120 per tonne in 2008.
Driven by a suppressed industrial sector, European power demand in 2009 decreased significantly. The softer oil price and an abundance of cheap gas contributed to lower demand for imported coal, resulting in increased stockpiles. In contrast, the Pacific market continued to see growth, with increasing demand for imported thermal coal. As China was able to accommodate large volumes of Indonesian and Australian exports, India turned to South Africa to meet its escalating demand for thermal coal. The proportion of South African coal exports shipped to Asia in 2009
Industry overviewThermal Coal

Estimated seaborne thermal coal demand(Mt)
700
600
500
400
100
200
300
0
Rest of worldChina India USA EU 15 Japan
Source: AME
03Year 04 05 06 07 08 09
50
60
70
80
90
100
110
Jan 09 Apr 09Year Aug 09 Dec 09 Apr 10
Jan 00 Jan 02 Jan 04 Jan 06 Jan 08
2.0
3.5
2.5
3.0
1.5
1.0
0.5
0
160
310
210
260
110
60
Historical Prices Thermal Coal (USD/mt)
LME Stocks, weeksPrice
Total LME stocks(1) and base metals price index (shown to April 2008)
(1) Al, Cu, Zn, Pb, Ni, Sn, and Cu Comex
NEWC Index Monthly RB Index Montly DES ARA Index Montly
Source: globalCOAL
Anglo American Rio TintoBHP Billiton Xstrata Other
Internationally traded thermal coal export production by company (2009) (%)
Notes:1. Anglo American market share shown relative to diversified majors peer group2. 2009 forecast based on equity holdings and production estimates as at January 2010
Source: AME
8.7%4.4%
4.7%
2.9%
79.3%
World estimated 2009 seaborne thermal coal = 673.1 Mt
Europe Middle East IndiaOther Asia Others
03 04 05 06 07 08 09
686868 70 67
71
75
Export Thermal Coal from South Africa (Mt)
Source: Anglo American
Anglo American plc Fact Book 2009/10 105
Thermal C
oal
Market information
106 Anglo American plc Fact Book 2009/10
Thermal Coal’s strategy is focused on serving the power generation and industrial sectors from large, low cost coal basins. The business unit has a diverse, high quality asset portfolio in South Africa and South America and aims to be a long term, reliable supplier. It also strives to be an industry leader in the pursuit of cleaner coal solutions to the world’s energy needs.
Thermal Coal is focused on expanding its strong standing in the export market, while maintaining a significant position in the domestic market in South Africa. This strategy will be delivered through its extensive portfolio of expansion projects, supported by targeted acquisitions. In addition, it has substantially completed a major programme of investment, which includes expansions at Cerrejón and the development of Zibulo. The business unit is in the process of completing its pre-feasibility study on New Largo, which has been identified by Eskom as a primary coal supplier to its Kusile power station which is under construction. Kusile’s first units are scheduled to be operating in 2013 and Thermal Coal is confident that it will be able to deliver coal on time.
India is an ever growing market for South African-sourced coal, with 2009 showing a pronounced swing from the Med-Atlantic to the
Asia-Pacific market. For the year as a whole, 29% of South Africa’s coal exports, and a similar proportion of Thermal Coal’s own exports, through the RBCT were destined for India. Thermal Coal is evaluating opportunities to increase its exports to India by producing lower quality products suitable for the Indian market to supplement the higher grade product currently being sold to the country.
At Cerrejón, the growth strategy encompasses multiple options based on the capital investment for expansion that will be required by the port and logistics chain and thereafter for pit expansion and reserve access. Expansions such as the P40 (targeting 40 Mtpa) and P500 (targeting 50-60 Mtpa) projects are currently under consideration by the operation’s shareholders.
Although Thermal Coal continues to develop operations in its existing geographies, it is also continually evaluating potential opportunities in new regions. Following the establishment of an office in Gaborone to manage its coal bed methane (CBM) exploration programme in Botswana in 2008, the business unit spent $20 million in 2009 on exploration and new business development activities, investigating thermal and coking coal and CBM resources mainly in southern Africa.
Thermal Coal continues to pursue business development opportunities on a range of projects that offer potential exposure to the broader energy markets, while building on the business’s core capability in coal, namely CBM exploration in South Africa and Botswana. Although these projects remain at an early stage and have demanding economics, they ensure that Thermal Coal is equipped with a diverse range of options to meet changing market demands over the long term.
ProjectsIn South Africa, the $512 million, 6.6 Mtpa Zibulo project is under construction, including the building of a 50:50 joint venture coal washing plant with BHP Billiton Energy Coal South Africa. The project is on schedule, with first coal produced during the third quarter of 2009 and it will continue to ramp up during the course of 2010, reaching full production in 2012.
In Colombia, the $130 million expansion at Cerrejón to 32 Mtpa was completed and full production was achieved early in 2009. Feasibility studies are under way to expand the operation to around 40 Mtpa.
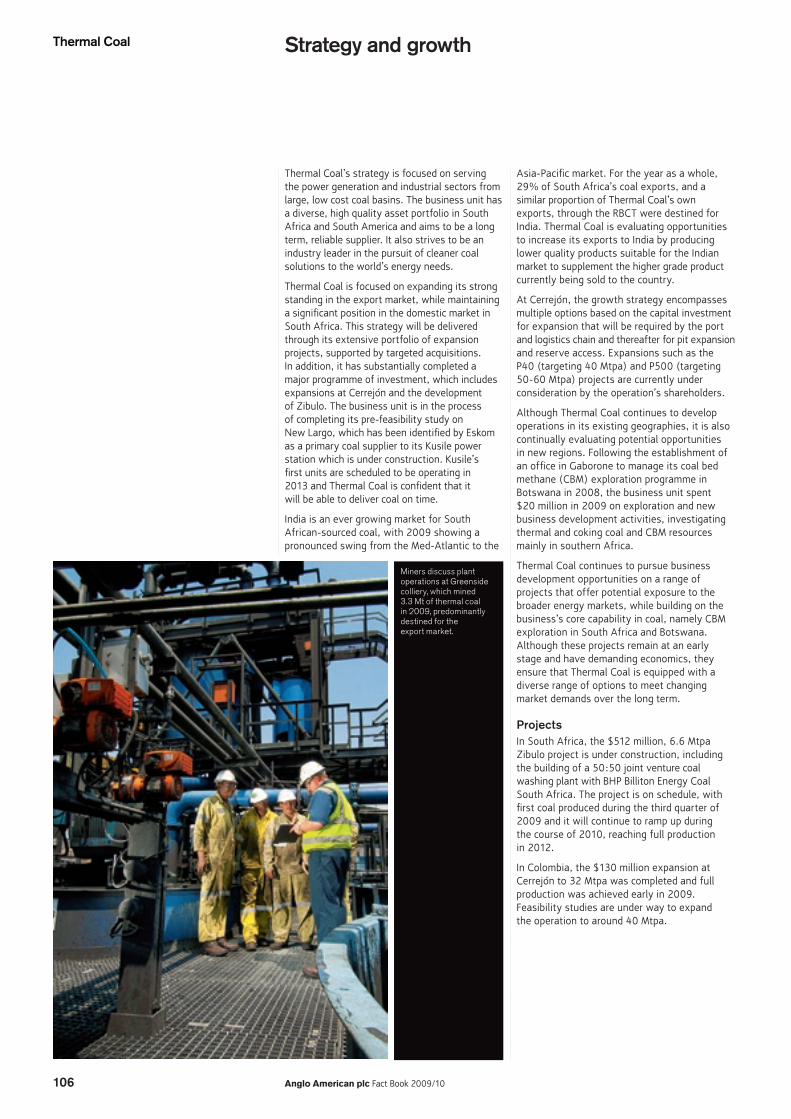
Miners discuss plant operations at Greenside colliery, which mined 3.3 Mt of thermal coal in 2009, predominantly destined for the export market.
Strategy and growthThermal Coal

Anglo American plc Fact Book 2009/10 107
Thermal C
oal
In South Africa the Zibulo project is under construction and includes a 50:50 joint venture plant (Phola) with BHP Billiton Energy coal South Africa. The project is on schedule, with first coal produced during the third quarter of 2009 and it will continue to ramp up during the course of 2010, reaching full production of 6.6 Mtpa of thermal coal in 2012.
Country South AfricaOwnership 73% Anglo Coal Production volume 6.6 Mtpa thermal (100%)Full project capex $512m (100%)Full production Q4 2012
Zibulo (previously Zondagsfontein) Overall capex: $512m (100%)
Project pipeline

108 Anglo American plc Fact Book 2009/10
Production data
Production (tonnes) 2009 2008 2007 2006 2005
South AfricaEskom 36,225,100 36,158,100 34,064,000 34,821,200 34,327,900Trade Thermal 22,185,900(1) 22,286,800 23,952,400 22,754,000 20,281,100Trade Metallurgical 747,100 971,900 1,143,700 1,768,200 2,268,800South Africa Total 59,158,100(1) 59,416,800 59,160,100 59,343,400 56,877,800South America(2)
Thermal 10,189,600 10,410,300 9,875,400 9,477,200 8,656,300Total Thermal Coal segment 69,347,700(1) 69,827,100 69,035,500 68,820,600 65,534,100
South AfricaBank – – 51,900 477,600 3,202,200Greenside 3,294,600 3,401,100 3,314,900 2,778,100 2,730,000Goedehoop 6,905,000 7,449,400 8,456,200 8,534,500 6,298,600Isibonelo 5,061,900 5,152,100 5,001,000 4,020,100 1,358,300Kriel 11,161,700 10,344,400 11,210,100 12,318,400 12,030,900Kleinkopje 4,414,000 4,545,600 3,490,700 3,898,400 4,483,500Landau 4,231,500 4,089,300 4,058,200 4,102,400 3,682,900New Denmark 3,728,900 5,272,500 5,134,700 5,508,500 4,139,400New Vaal 17,553,700 17,034,400 17,119,500 16,275,000 17,100,000Nooitgedacht 475,000 454,600 565,700 711,000 794,400Mafube 2,212,800 1,673,400 757,200 719,400 1,057,600Zibulo 119,000 – – – –Total 59,158,100(1) 59,416,800 59,160,100 59,343,400 56,877,800South America(2)
Carbones Del Cerrejón 10,189,600 10,410,300 9,875,400 9,477,200 8,656,300Total 10,189,600 10,410,300 9,875,400 9,477,200 8,656,300
(1) Zibulo (previously Zondagsfontein) is currently not in commercial production and therefore all revenue and related costs associated with 119,000 tonnes of production have been capitalised.(2) South American production excludes Carbones del Guasare which was identified as non-core in 2009.
Thermal Coal

Anglo American plc Fact Book 2009/10 109
Thermal C
oal
Ore Reserve and Mineral Resource estimates as at 31 December 2009
The Coal Reserve and Coal Resource estimates were compiled in accordance with the Australasian Code for Reporting of Mineral Resources and Ore Reserves (The JORC Code, 2004) as a minimum standard. Where relevant, the estimates were also prepared in compliance with regional codes and requirements (e.g. The SAMREC Code, 2007). The figures reported represent 100% of the Ore Reserves and Mineral Resources, the percentage attributable to Anglo American plc is stated separately. Rounding of figures may cause computational discrepancies. During 2009, Anglo Coal was restructured into three discrete business units: Anglo American Metallurgical Coal representing the dominantly export metallurgical coal business located in Australia; Anglo American Thermal Coal representing the dominantly export and domestic thermal coal business, located in South Africa and Colombia; and the Remaining Coal mines and projects located in Canada and Venezuela. THE COAL RESOURCES ARE REPORTED AS ADDITIONAL TO THE COAL RESERVES.
Thermal Coal Reserves(1) ROM Tonnes(3) Yield(4) Saleable Tonnes(3) Saleable Quality(5)
Colombia Attributable %(2) LOM Classification 2009 2008 2009 2008 2009 2008 2009 2008
Cerréjon (OC) 33.3 23 Mt Mt % % Mt Mt kcal/kg kcal/kg
Export Thermal Proved 646.6 519.3 96.2 96.9 621.4 502.9 6,210 6,200
Probable 50.7 241.0 96.2 96.9 48.9 233.4 6,210 6,200
Total 697.3 760.2 96.2 96.9 670.3 736.3 6,210 6,200
Colombia Export Thermal 33.3 kcal/kg kcal/kg
Proved 646.6 519.3 96.2 96.9 621.4 502.9 6,210 6,200
Probable 50.7 241.0 96.2 96.9 48.9 233.4 6,210 6,200
Total 697.3 760.2 96.2 96.9 670.3 736.3 6,210 6,200
Thermal Coal Reserves(1) ROM Tonnes(3) Yield(4) Saleable Tonnes(3) Saleable Quality(5)
South Africa Attributable %(2) LOM Classification 2009 2008 2009 2008 2009 2008 2009 2008
Goedehoop (UG&OC) 100 10 Mt Mt % % Mt Mt kcal/kg kcal/kg
Export Thermal Proved 25.5 50.5 59.9 49.9 15.5 26.3 6,240 6,200
Probable 85.6 81.2 54.5 54.2 47.5 45.1 6,180 6,130
Total 111.1 131.7 55.7 52.6 63.0 71.4 6,190 6,150
Other Metallurgical Proved – 2.0 – 1.0 – 6,990
Probable – – – – – –
Total – 0.8 – 1.0 – 6,990
Greenside (UG) 100 12
Export Thermal Proved 39.8 19.5 59.0 63.2 24.3 12.6 6,190 6,240
Probable 2.4 12.2 63.0 60.3 1.5 7.5 6,190 6,220
Total 42.1 31.7 59.2 62.1 25.8 20.1 6,190 6,230
Isibonelo (OC) 100 17
Synfuel Proved 84.5 90.6 100 100 84.6 90.6 4,560 4,660
Probable – – – – – – – –
Total 84.5 90.6 100 100 84.6 90.6 4,560 4,660
Kleinkopje (OC) 100 14
Export Thermal Proved 77.1 81.9 33.8 32.9 26.4 27.3 6,220 6,220
Probable 21.3 25.4 48.4 49.0 10.4 12.6 6,230 6,230
Total 98.4 107.4 37.0 36.7 36.8 39.9 6,220 6,220
Domestic Power Proved 37.5 40.6 29.5 33.2 4,490 4,530
Probable – – – – – –
Total 29.4 31.0 29.5 33.2 4,490 4,530
Kriel (UG&OC) 73.0 16
Domestic Power Proved 67.0 82.1 100 100 67.0 82.1 4,790 4,800
Probable 64.3 62.4 100 100 64.3 62.4 4,500 4,500
Total 131.3 144.5 100 100 131.3 144.5 4,650 4,670
Landau (OC) 100 11
Export Thermal Proved 48.0 37.5 52.8 50.1 25.1 18.8 6,300 6,270
Probable 21.4 27.8 50.7 48.4 11.0 13.4 6,370 6,260
Total 69.5 65.3 52.2 49.4 36.1 32.3 6,320 6,270
Domestic Power Proved 7.0 10.6 3.4 4.0 4,450 3,340
Probable 9.1 15.3 2.0 4.2 3,900 4,690
Total 7.6 12.6 5.4 8.2 4,250 4,040
Mafube (OC) 50.0 20
Export Thermal Proved 35.6 40.6 51.6 54.2 18.4 22.0 6,300 6,290
Probable 67.3 66.8 36.9 36.9 25.1 24.7 6,280 6,270
Total 103.0 107.3 42.0 43.4 43.5 46.7 6,290 6,280
Domestic Power Proved 23.0 28.0 8.2 11.4 5,450 5,380
Probable 31.3 31.3 21.2 20.9 5,080 5,080
Total 28.4 30.1 29.4 32.3 5,180 5,190

110 Anglo American plc Fact Book 2009/10
Ore Reserve and Mineral Resource estimates as at 31 December 2009continued
Thermal Coal Reserves(1) ROM Tonnes(3) Yield(4) Saleable Tonnes(3) Saleable Quality(5)
South Africa continued Attributable %(2) LOM Classification 2009 2008 2009 2008 2009 2008 2009 2008
New Denmark (UG) 100 31
Domestic Power Proved 37.0 41.9 100 100 37.0 41.9 5,090 4,900
Probable 106.7 87.6 100 100 106.7 87.6 4,940 4,850
Total 143.7 129.5 100 100 143.7 129.5 4,980 4,870
New Vaal (OC) 100 18 Mt Mt % % Mt Mt kcal/kg kcal/kg
Domestic Power Proved 423.4 444.9 92.1 91.2 404.0 417.6 3,490 3,500
Probable – – – – – – – –
Total 423.4 444.9 92.1 91.2 404.0 417.6 3,490 3,500
Nooitgedacht 5 Seam (UG) 100 3
Export Thermal Proved 1.9 2.9 34.6 39.9 0.7 1.2 6,360 6,200
Probable – – – – – – – –
Total 1.9 2.9 34.6 39.9 0.7 1.2 6,360 6,200
Other Metallurgical Proved 27.0 30.5 0.5 0.9 6,300 6,510
Probable – – – – – –
Total 27.0 30.5 0.5 0.9 6,300 6,510
Zibulo (UG&OC) 73.0 17
Export Thermal Proved – – – – – – – –
Probable 99.3 117.7 39.7 40.1 39.5 47.5 6,350 6,340
Total 99.3 117.7 39.7 40.1 39.5 47.5 6,350 6,340
Domestic Power Proved – – – – – –
Probable 37.0 40.5 38.5 49.8 4,880 4,880
Total 37.0 40.5 38.5 49.8 4,880 4,880
South Africa Export Thermal 86.8 kcal/kg kcal/kg
Proved 839.8 892.4 50.3 48.0 110.3 108.2 6,250 6,240
Probable 468.3 481.0 46.2 46.3 135.0 150.9 6,270 6,240Total 1,308.1 1,373.4 47.7 46.5 245.3 259.1 6,260 6,240
South Africa Other Metallurgical 100 kcal/kg kcal/kg
Proved 27.0 15.8 0.5 1.9 6,300 6,760
Probable – – – – – –Total 27.0 15.2 0.5 1.9 6,300 6,760
South Africa Domestic Power 92.3 kcal/kg kcal/kg
Proved 89.1 88.4 549.1 590.1 3,850 3,870
Probable 82.5 78.8 232.7 225.0 4,810 4,780Total 86.8 85.4 781.8 815.1 4,130 4,120
South Africa Synfuel 100 kcal/kg kcal/kg
Proved 100 100 84.6 90.6 4,560 4,660
Probable – – – – – –
Total 100 100 84.6 90.6 4,560 4,660
Thermal Coal Reserves(1) ROM Tonnes(3) Yield(4) Saleable Tonnes(3) Saleable Quality(5)
Total Attributable %(2) Classification 2009 2008 2009 2008 2009 2008 2009 2008
Export Thermal 47.4 Mt Mt % % Mt Mt kcal/kg kcal/kg
Proved 1,486.4 1,411.6 89.3 88.2 731.7 611.1 6,220 6,500Probable 519.0 722.0 59.5 77.0 183.9 384.3 6,250 6,360
Total 2,005.4 2,133.6 83.2 83.8 915.6 995.4 6,230 6,450Other Metallurgical 100 kcal/kg kcal/kg
Proved 27.0 15.8 0.5 1.9 6,300 6,760Probable – – – – – –
Total 27.0 15.2 0.5 1.9 6,300 6,760Domestic Power 92.3 kcal/kg kcal/kg
Proved 89.1 88.4 549.1 590.1 3,850 3,870Probable 82.5 78.8 232.7 225.0 4,810 4,780
Total 86.8 85.4 781.8 815.1 4,130 4,120Synfuel 100 kcal/kg kcal/kg
Proved 100 100 84.6 90.6 4,560 4,660Probable – – – – – –
Total 100 100 84.6 90.6 4,560 4,660
Mining method: OC = Open Cast, UG = Underground. LOM = Life of Mine in years based on scheduled Ore Reserves. For the multi-product operations, the ROM tonnage figures apply to each product. The Saleable tonnage cannot be calculated directly from the ROM reserve tonnage using the air dried yields as presented since the difference in moisture content is not taken into account. Attributable percentages for country totals are weighted by Saleable tonnes and should not be directly applied to the ROM tonnage. Additional footnotes appear at the end of the section.
Export Thermal refers to low- to high-volatile thermal coal primarily for export in the use of power generation; quality measured by calorific value (CV). Other Metallurgical refers to semi soft, soft, hard, semi-hard or anthracite coal, other than Coking Coal, such as pulverized coal injection (PCI) or other general metallurgical coal for the export or domestic market with a wider range of properties than Coking Coal. Domestic Power refers to low- to high-volatile thermal or semi-soft coal primarily for domestic consumption for power generation; quality measured by calorific value (CV). Synfuel refers to a coal specifically for the domestic production of synthetic fuel and chemicals; quality measured by calorific value (CV).
Thermal Coal

Anglo American plc Fact Book 2009/10 111
Thermal C
oal
Thermal Coal Resources – Mine Leases(6) Tonnes Coal Quality
Colombia Attributable %(2) Classification 2009 2008 2009 2008
Cerréjon 33.3 MTIS(6) MTIS(6) kcal/kg(7) kcal/kg (7)
Measured 1,051.6 667.1 6,480 6,400Indicated 270.3 712.8 6,480 6,290
Measured and Indicated 1,321.9 1,379.9 6,480 6,340Inferred (in LOM)(8) 40.3 – 6,960 –
Colombia – Mine Leases 33.3 kcal/kg(7) kcal/kg (7)
Measured 1,051.6 667.1 6,480 6,400Indicated 270.3 712.8 6,480 6,290
Measured and Indicated 1,321.9 1,379.9 6,480 6,340Inferred (in LOM)(8) 40.3 – 6,960 –
Thermal Coal Resources – Mine Leases(6) Tonnes Coal Quality
South Africa Attributable %(2) Classification 2009 2008 2009 2008
Goedehoop 100 MTIS(6) MTIS(6) kcal/kg(7) kcal/kg (7)
Measured 115.3 135.4 5,030 5,010Indicated 82.4 83.8 5,270 5,320
Measured and Indicated 197.7 219.2 5,130 5,130Inferred (in LOM)(8) – – – –
Greenside 100 Measured – – – –Indicated – – – –
Measured and Indicated – – – –Inferred (in LOM)(8) 13.3 27.7 5,470 5,120
Isibonelo 100 Measured – – – –Indicated 25.8 25.8 5,250 5,330
Measured and Indicated 25.8 25.8 5,250 5,330Inferred (in LOM)(8) – – – –
Kleinkopje 100 Measured 28.6 31.9 4,990 4,960Indicated – – – –
Measured and Indicated 28.6 31.9 4,990 4,960Inferred (in LOM)(8) – – – –
Kriel 73.0 Measured 61.8 61.8 5,280 5,280Indicated 34.7 34.7 4,710 4,710
Measured and Indicated 96.5 96.5 5,080 5,080Inferred (in LOM)(8) – – – –
Landau 100 Measured 30.4 34.0 5,730 5,750Indicated 41.7 66.3 4,600 6,050
Measured and Indicated 72.1 100.2 5,080 5,950Inferred (in LOM)(8) – – – –
Mafube 50.0 Measured 3.8 4.2 5,230 5,300Indicated – – – –
Measured and Indicated 3.8 4.2 5,230 5,300Inferred (in LOM)(8) 10.7 10.7 5,420 5,420
New Denmark 100 Measured – – – –Indicated – – – –
Measured and Indicated – – – –Inferred (in LOM)(8) 30.6 78.7 5,310 5,840
New Vaal 100 Measured – 2.5 – 4,230Indicated – – – –
Measured and Indicated – 2.5 – 4,230Inferred (in LOM)(8) – – – –
Nooitgedacht 5 Seam 100 Measured 1.1 1.1 4,750 6,240Indicated – – – –
Measured and Indicated 1.1 1.1 4,750 6,240Inferred (in LOM)(8) – – – –
Zibulo 73.0 Measured 98.0 90.8 4,810 4,480Indicated 174.2 220.3 4,910 5,200
Measured and Indicated 272.2 311.2 4,870 4,990Inferred (in LOM)(8) 59.2 – 5,430 –
South Africa – Mine Leases 84.9 Measured 339.1 361.7 5,070 4,990Indicated 358.8 430.9 4,960 5,320
Measured and Indicated 697.8 792.6 5,020 5,170Inferred (in LOM)(8) 113.8 117.1 5,400 5,630

112 Anglo American plc Fact Book 2009/10
Ore Reserve and Mineral Resource estimates as at 31 December 2009continued
Thermal Coal Resources Tonnes Coal Quality
Mine Leases Attributable %(2) Classification 2009 2008 2009 2008
Total 52.6 MTIS(6) MTIS(6) kcal/kg(7) kcal/kg (7)
Measured 1,390.7 1,028.8 6,130 5,900Indicated 629.1 1,143.7 5,620 5,930
Measured and Indicated 2,019.7 2,172.6 5,970 5,920Inferred (in LOM)(8) 154.0 117.1 5,810 5,630
Thermal Coal Resources – Projects(6) Tonnes Coal Quality
South Africa Attributable %(2) Classification 2009 2008 2009 2008
Elders 73.0 MTIS(6) MTIS(6) kcal/kg(7) kcal/kg (7)
Measured 183.4 87.7 4,940 5,200Indicated 30.6 36.6 4,960 5,170
Measured and Indicated 213.9 124.3 4,940 5,190Kriel East 73.0 Measured 97.9 41.4 4,930 4,980
Indicated 22.8 50.8 4,900 4,940Measured and Indicated 120.8 92.2 4,920 4,960
New Largo 73.0 Measured 247.1 199.9 4,430 4,000Indicated 246.1 186.3 4,230 4,050
Measured and Indicated 493.2 386.3 4,330 4,020Nooitgedacht 2+4 Seam 100 Measured 29.9 – 5,320 –
Indicated 17.1 61.6 5,320 5,320Measured and Indicated 47.0 61.6 5,320 5,320
South Rand 73.0 Measured 90.7 36.4 4,780 5,560Indicated 156.5 220.7 4,710 5,590
Measured and Indicated 247.2 257.1 4,740 5,590Vaalbank 100 Measured 54.6 54.6 3,570 3,900
Indicated 23.4 23.4 4,440 3,900Measured and Indicated 77.9 77.9 3,830 3,900
South Africa – Projects 75.8 kcal/kg(7) kcal/kg (7)
Measured 703.6 420.0 4,650 4,470Indicated 496.4 579.4 4,500 4,910
Measured and Indicated 1,200.0 999.5 4,590 4,730
Thermal Coal Resources(6) Tonnes Coal Quality
Projects Attributable %(2) Classification 2009 2008 2009 2008
Total 75.8 MTIS(6) MTIS(6) kcal/kg(7) kcal/kg (7)
Measured 703.6 420.0 4,650 4,470Indicated 496.4 579.4 4,500 4,910
Measured and Indicated 1,200.0 999.5 4,590 4,730
Thermal Coal

Anglo American plc Fact Book 2009/10 113
Thermal C
oal
Thermal Coal Resources(6) Tonnes Coal Quality
Mine Leases and Projects Attributable %(2) Classification 2009 2008 2009 2008
Total 60.8 MTIS(6) MTIS(6) kcal/kg(7) kcal/kg (7)
Measured 2,094.3 1,448.9 5,640 5,490Indicated 1,125.5 1,723.1 5,130 5,590
Measured and Indicated 3,219.7 3,172.0 5,460 5,540Inferred (in LOM)(8) 154.0 117.1 5,810 5,630
Attributable percentages for country totals are weighted by Measured and Indicated MTIS.
(1) Coal Reserves are quoted on a Run Of Mine (ROM) reserve tonnage basis which represents the tonnes delivered to the plant. Saleable reserve tonnage represents the product tonnes produced. Coal Reserves (ROM and Saleable) are on the applicable moisture basis.
(2) Attributable (%) refers to 2009 only. For the 2008 Reported and Attributable figures, please refer to the 2008 Annual Report.(3) The tonnage is quoted as metric tonnes. ROM tonnages on an As Delivered moisture basis, and Saleable tonnages on a Product moisture basis.(4) Yield (%) represents the ratio of Saleable reserve tonnes to ROM reserve tonnes and is quoted on a constant moisture basis or on an air dried to air dried basis.
The product yields for Proved, Probable and Total are calculated by dividing the individual Saleable reserves by the total ROM reserves per classification.(5) The coal quality for the Coal Reserves is quoted as either Calorific Value (CV) using kilo-calories per kilogram (kcal/kg) units on a Gross As Received (GAR) basis or Crucible Swell Number (CSN).
Coal quality parameters for the Coal Reserves for Coking, Other Metallurgical and Export Thermal collieries meet the contractual specifications for coking coal, PCI, metallurgical coal, steam coal and domestic coal. Coal quality parameters for the Coal Reserves for Domestic Power and Domestic Synfuels collieries meet the specifications of the individual supply contracts. CV is rounded to the nearest 10 kcal/kg and CSN to the nearest 0.5 index.
(6) Coal Resources are quoted on a Mineable Tonnage In-Situ (MTIS) basis in million tonnes which are in addition to those resources which have been modified to produce the reported Coal Reserves. Coal Resources are on an in-situ moisture basis.
(7) The coal quality for the Coal Resources is quoted on an in-situ heat content as Calorific Value (CV) using kilo-calories per kilogram (kcal/kg) units on a Gross As Received (GAR) basis. CV is rounded to the nearest 10 kcal/kg,
(8) Inferred (in LOM) refers to Inferred Coal Resources that are included in the life of mine extraction schedule of the respective collieries and are not reported as Coal Reserves. Inferred Coal Resources outside the LOM plan but within the mine lease area are not reported due to a) the uncertainty attached to such resources in that it cannot be assumed that all or part of the Inferred Resource will necessarily be upgraded to Indicated or Measured categories through continued exploration, b) such Inferred Resources do not necessarily meet the requirements of reasonable prospects for eventual economic extraction, particularly in respect of future mining and processing economics.
Summary of material changes (±10%) at reporting level
Colombia Cerréjon: Resources: a gain of 40 Mt Inferred Resources in Mine Plan due to changes in methodology.
South Africa Goedehoop: Reserves: a gain of 19 Mt due to inclusion of Vlaklaagte resources in mine plan; a loss of 20 Mt resulting from changes in modifying factors Greenside: Reserves: a gain of 15 Mt due to changes in mine plan, increased drilling density, and correction for under reporting in 2008. Resources: a loss of 14 Mt due to exclusion of resources underlying pan pending environmental approval for mining.Kleinkopje: Resources: a loss of 3 Mt due to changes in pit shell layout. Landau: Reserves: a gain of 11 Mt due to conversion of Navigation West and Schoonie opencast resources. Resources: a loss of 9 Mt due to infrastructure sterilisation. New Denmark: Reserves: reclassification of 48 Mt Resources to 25 Mt Reserves due to additional information. New Vaal: Reserves: a loss of 3 Mt due to the exclusion of low volatile material and 3 Mt due to operational mining losses. Zibulo: Zibulo comprises the Zibulo Mine (formerly Zondagsfontein), the Zondagsfontein West project area and the Oogiesfontein Mine. Proved Reserves have been reclassified as Probable Reserves pending the granting of a mining right. Reserves: a loss of 13 Mt at Zibulo due to change in mining extraction percentage and 3 Mt at Oogiesfontein due to reclassification of reserves following changes in mine planning. Resources: a gain of 59 Mt of S2M Seam at Zibulo due to inclusion of Inferred Resources in the mine plan and a gain of 3 Mt Measured Resources at Oogiesfontein due to reclassification of reserves. A loss of 42 Mt of S5 Seam at Zibulo due to reclassification and change to minimum cut-off thickness, and re-modelling of a transgressive sill.Elders: A gain of 51 Mt due to additional information; a gain of 39 Mt due to change from raw to washed product. Kriel East: A gain of 29 Mt due to additional exploration information. New Largo: A gain of 107 Mt due to additional exploration information. Nooitgedacht: A loss of 15 Mt due to reduced interpretation confidence in data combined with a change of cut-off parameters.
Assumption with respect to Mineral Tenure South Africa: Granting of 3 remaining Prospecting Rights to Anglo American Thermal Coal for the Vaalbank project is pending. Anglo American Thermal Coal has reasonable expectation that these rights will be granted
in due course, and the relevant Project Coal resources have been included in the statement. Granting of the mining rights for Zibulo Colliery (formerly Zondagsfontein and Oogiesfontein) are currently pending. Anglo Inyosi Coal (Pty) Limited has reasonable expectation that these rights will be granted in due course. Anglo American Thermal Coal has been granted Section 11 cession of the Kriel mining right to Anglo Inyosi Coal (Pty) Limited but has not concluded the final agreement. The attributable percentage (73%) reflects therefore the anticipated ownership following conclusion of this agreement.
Royalty Payment South Africa: Royalty payments are scheduled to commence in April 2010 and have been taken into consideration in economic assessment of the reserves.
Reviews by independent third parties were carried out in 2009 on the following Operations and Project areas: Goedehoop South, Isibonelo, Zibulo, Elders

114 Anglo American plc Fact Book 2009/10
Thermal Coal