theoretical limits of hydrogen storage in metal...
TRANSCRIPT
Theoretical Limits of Hydrogen Storage in Metal−OrganicFrameworks: Opportunities and Trade-OffsJacob Goldsmith,† Antek G. Wong-Foy,‡ Michael J. Cafarella,§ and Donald J. Siegel*,†,⊥
†Mechanical Engineering Department, ‡Department of Chemistry, §Computer Science and Engineering, and ⊥Applied PhysicsProgram, University of Michigan, Ann Arbor, Michigan, 48109, United States
*S Supporting Information
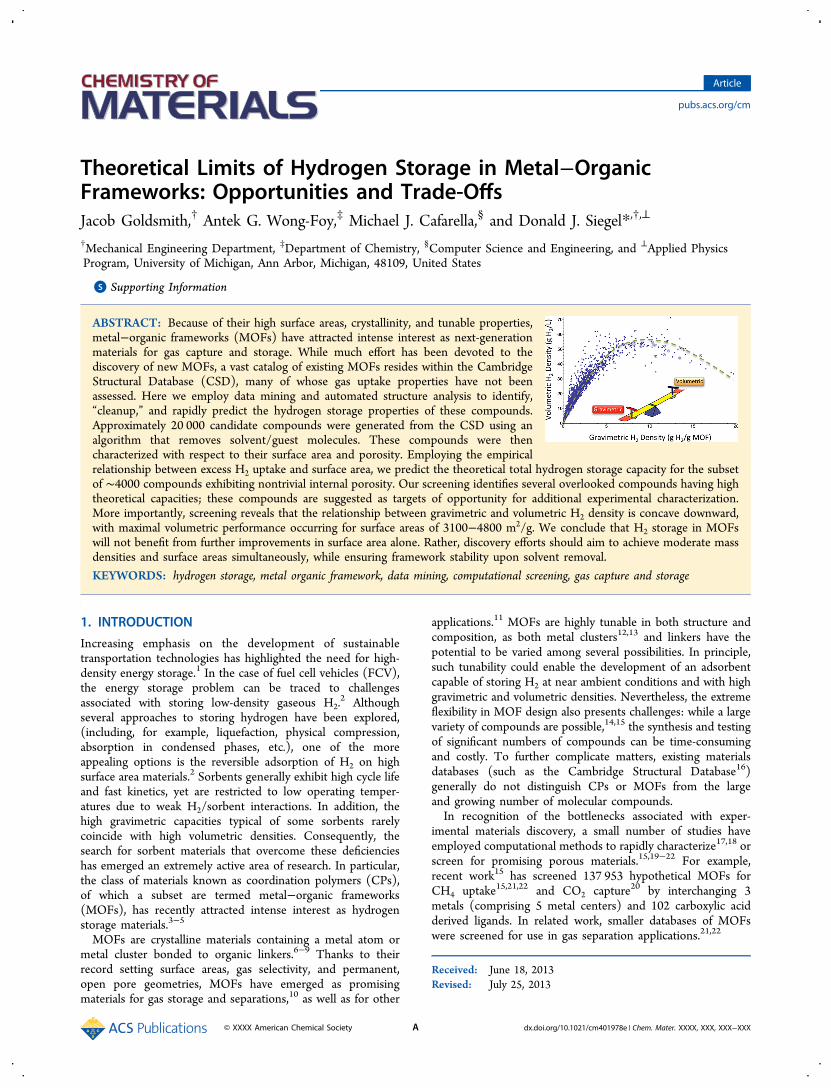
ABSTRACT: Because of their high surface areas, crystallinity, and tunable properties,metal−organic frameworks (MOFs) have attracted intense interest as next-generationmaterials for gas capture and storage. While much effort has been devoted to thediscovery of new MOFs, a vast catalog of existing MOFs resides within the CambridgeStructural Database (CSD), many of whose gas uptake properties have not beenassessed. Here we employ data mining and automated structure analysis to identify,“cleanup,” and rapidly predict the hydrogen storage properties of these compounds.Approximately 20 000 candidate compounds were generated from the CSD using analgorithm that removes solvent/guest molecules. These compounds were thencharacterized with respect to their surface area and porosity. Employing the empiricalrelationship between excess H2 uptake and surface area, we predict the theoretical total hydrogen storage capacity for the subsetof ∼4000 compounds exhibiting nontrivial internal porosity. Our screening identifies several overlooked compounds having hightheoretical capacities; these compounds are suggested as targets of opportunity for additional experimental characterization.More importantly, screening reveals that the relationship between gravimetric and volumetric H2 density is concave downward,with maximal volumetric performance occurring for surface areas of 3100−4800 m2/g. We conclude that H2 storage in MOFswill not benefit from further improvements in surface area alone. Rather, discovery efforts should aim to achieve moderate massdensities and surface areas simultaneously, while ensuring framework stability upon solvent removal.
KEYWORDS: hydrogen storage, metal organic framework, data mining, computational screening, gas capture and storage
1. INTRODUCTION
Increasing emphasis on the development of sustainabletransportation technologies has highlighted the need for high-density energy storage.1 In the case of fuel cell vehicles (FCV),the energy storage problem can be traced to challengesassociated with storing low-density gaseous H2.
2 Althoughseveral approaches to storing hydrogen have been explored,(including, for example, liquefaction, physical compression,absorption in condensed phases, etc.), one of the moreappealing options is the reversible adsorption of H2 on highsurface area materials.2 Sorbents generally exhibit high cycle lifeand fast kinetics, yet are restricted to low operating temper-atures due to weak H2/sorbent interactions. In addition, thehigh gravimetric capacities typical of some sorbents rarelycoincide with high volumetric densities. Consequently, thesearch for sorbent materials that overcome these deficiencieshas emerged an extremely active area of research. In particular,the class of materials known as coordination polymers (CPs),of which a subset are termed metal−organic frameworks(MOFs), has recently attracted intense interest as hydrogenstorage materials.3−5
MOFs are crystalline materials containing a metal atom ormetal cluster bonded to organic linkers.6−9 Thanks to theirrecord setting surface areas, gas selectivity, and permanent,open pore geometries, MOFs have emerged as promisingmaterials for gas storage and separations,10 as well as for other
applications.11 MOFs are highly tunable in both structure andcomposition, as both metal clusters12,13 and linkers have thepotential to be varied among several possibilities. In principle,such tunability could enable the development of an adsorbentcapable of storing H2 at near ambient conditions and with highgravimetric and volumetric densities. Nevertheless, the extremeflexibility in MOF design also presents challenges: while a largevariety of compounds are possible,14,15 the synthesis and testingof significant numbers of compounds can be time-consumingand costly. To further complicate matters, existing materialsdatabases (such as the Cambridge Structural Database16)generally do not distinguish CPs or MOFs from the largeand growing number of molecular compounds.In recognition of the bottlenecks associated with exper-
imental materials discovery, a small number of studies haveemployed computational methods to rapidly characterize17,18 orscreen for promising porous materials.15,19−22 For example,recent work15 has screened 137 953 hypothetical MOFs forCH4 uptake15,21,22 and CO2 capture20 by interchanging 3metals (comprising 5 metal centers) and 102 carboxylic acidderived ligands. In related work, smaller databases of MOFswere screened for use in gas separation applications.21,22
Received: June 18, 2013Revised: July 25, 2013
Article
pubs.acs.org/cm
© XXXX American Chemical Society A dx.doi.org/10.1021/cm401978e | Chem. Mater. XXXX, XXX, XXX−XXX
In the present study, we significantly expand the space ofscreened compounds by exploiting the 550,000+ knownorganic compounds contained within the Cambridge StructuralDatabase (CSD).16 The CSD contains thousands of MOFs,14
yet it appears that many of these have not been tested for gasstorage applications. An advantage of this approach is that itrelies on existing compounds rather than on hypotheticalmaterials that may prove difficult to synthesize. (Nevertheless,as we describe below, achieving high hydrogen capacities inknown compounds still requires the synthesis of stable, solvent-free versions of these materials, a feat which is not alwaysstraightforward.) To facilitate a computational assessment ofthese properties, we use data mining and structural routines toidentify, “cleanup,” and rapidly characterize MOFs within theCSD. The isolation of such structures enables rapid predictionof their performance and allows us to address fundamentalquestions regarding their properties. For example: WhichMOFs have the highest theoretical H2 capacity, and whatcommon features do they share? Can high surface and highvolumetric density of stored H2 be achieved simultaneously?Answering these questions will accelerate the discovery ofoptimal MOFs for hydrogen storage applications.Here we demonstrate such an approach by searching for
MOFs exhibiting high hydrogen storage capacities.2 A subset of∼22 700 compounds is generated from the CSD using searchand filtering algorithms, followed by routines for the removal ofguest molecules or fragments thereof. The resulting structuresare characterized with respect to their surface area23 and porevolume. Application of the empirical correlation between H2excess uptake and surface area allows for the theoretical totalhydrogen storage capacity to be estimated for the subset of∼4000 compounds exhibiting nontrivial internal porosity. Thisapproach is relatively efficient as it does not require theevaluation of interatomic potentials or expensive isothermsimulations − only geometric features of the crystal structureneed to be assessed. Moreover, by comparing theoreticalcapacities we avoid experimental complications associated withincomplete solvent removal; this allows for consistentcomparisons across compounds and analysis of trade-offs andtrends that could be difficult to isolate using (potentially noisy)experimental data.Our screening identifies several known, yet overlooked
compounds having high hydrogen storage densities exceeding10 wt % (g H2/g MOF basis) and 58 g/L (total H2, at 77K and35 bar). These compounds are suggested as promisingcandidates worthy of additional experimental characterization.More importantly, screening also reveals a maximum in thedistribution of volumetric vs gravimetric uptake data, beyondwhich additional increases in surface area result in decreasingvolumetric capacity. Such a trade-off implies that H2 storage inMOFs will not benefit from further improvements in surfacearea alone. Rather, materials development efforts should aim tosimultaneously achieve moderate mass densities and surfaceareas, while ensuring framework rubustness upon solventremoval.
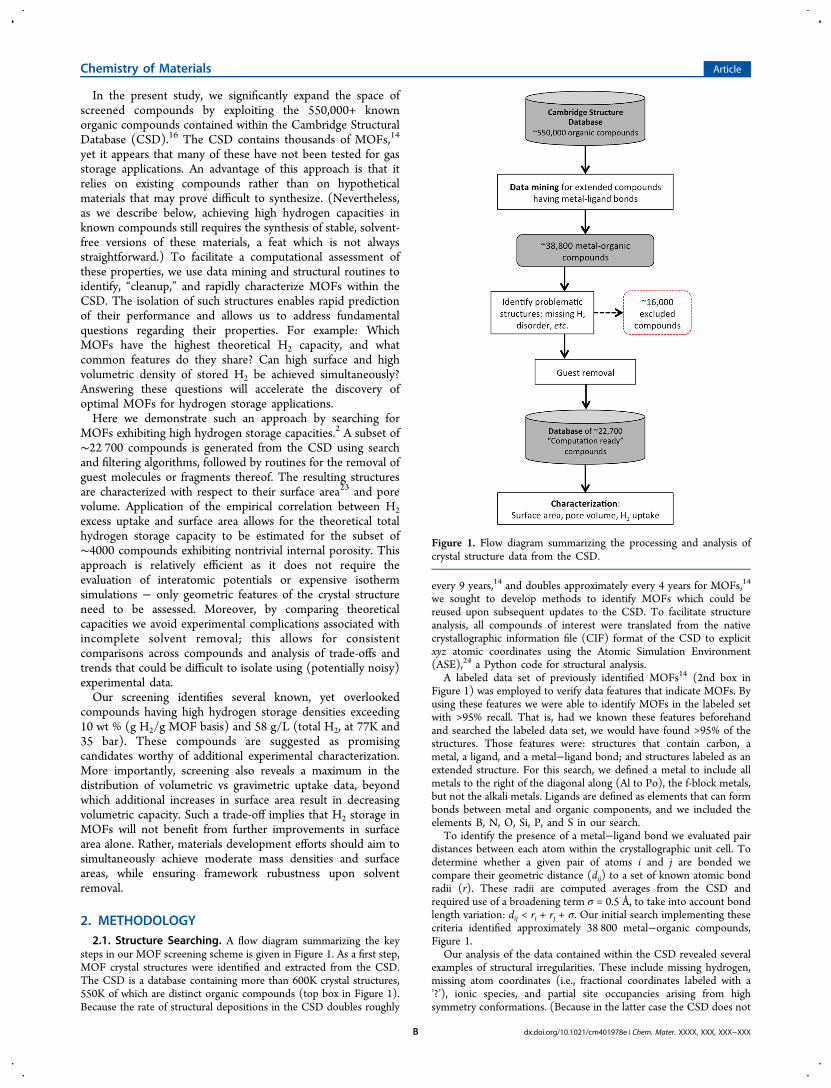
2. METHODOLOGY2.1. Structure Searching. A flow diagram summarizing the key
steps in our MOF screening scheme is given in Figure 1. As a first step,MOF crystal structures were identified and extracted from the CSD.The CSD is a database containing more than 600K crystal structures,550K of which are distinct organic compounds (top box in Figure 1).Because the rate of structural depositions in the CSD doubles roughly
every 9 years,14 and doubles approximately every 4 years for MOFs,14
we sought to develop methods to identify MOFs which could bereused upon subsequent updates to the CSD. To facilitate structureanalysis, all compounds of interest were translated from the nativecrystallographic information file (CIF) format of the CSD to explicitxyz atomic coordinates using the Atomic Simulation Environment(ASE),24 a Python code for structural analysis.
A labeled data set of previously identified MOFs14 (2nd box inFigure 1) was employed to verify data features that indicate MOFs. Byusing these features we were able to identify MOFs in the labeled setwith >95% recall. That is, had we known these features beforehandand searched the labeled data set, we would have found >95% of thestructures. Those features were: structures that contain carbon, ametal, a ligand, and a metal−ligand bond; and structures labeled as anextended structure. For this search, we defined a metal to include allmetals to the right of the diagonal along (Al to Po), the f-block metals,but not the alkali metals. Ligands are defined as elements that can formbonds between metal and organic components, and we included theelements B, N, O, Si, P, and S in our search.
To identify the presence of a metal−ligand bond we evaluated pairdistances between each atom within the crystallographic unit cell. Todetermine whether a given pair of atoms i and j are bonded wecompare their geometric distance (dij) to a set of known atomic bondradii (r). These radii are computed averages from the CSD andrequired use of a broadening term σ = 0.5 Å, to take into account bondlength variation: dij < ri + rj + σ. Our initial search implementing thesecriteria identified approximately 38 800 metal−organic compounds,Figure 1.
Our analysis of the data contained within the CSD revealed severalexamples of structural irregularities. These include missing hydrogen,missing atom coordinates (i.e., fractional coordinates labeled with a’?’), ionic species, and partial site occupancies arising from highsymmetry conformations. (Because in the latter case the CSD does not
Figure 1. Flow diagram summarizing the processing and analysis ofcrystal structure data from the CSD.
Chemistry of Materials Article
dx.doi.org/10.1021/cm401978e | Chem. Mater. XXXX, XXX, XXX−XXXB

generally provide site occupancies, we found that atomic coordinatesthat are too close to be physically bonded (<0.7 A) often served as agood indicator of symmetry-related disorder.) We observe thatdisorder is often present in structures having large unit cells orthermal conformational degrees of freedom, both traits common toMOFs. Missing atoms are often solvent or hydrogen. Compoundscontaining ionic species were also excluded from the database to avoidcharge imbalance; these ionic species often appear in conjunction withguest molecules that are later removed (see section 2.2). Because ourprocedure examines more files than a human can realistically process,automated identification and isolation of potentially troublesomestructures was necessary. Scanning for these problematic featuresresulted in the identification and isolation (i.e., removal) of ∼16Kcompounds (see red box in Figure 1).2.2. Guest Removal. The next step in our processing involved the
removal of unbounded guest molecules from the remaining structures.Guests typically consist of residual solvent incorporated into the MOFpores during crystallization. To maximize porosity and surface area, itis desirable to remove guests from the structure, for example, byevacuation and heating. In some cases, guest removal is not complete;hence, the crystal structure data within the CSD can contain (partiallyresolved) positions of solvent atoms. As our goal is to estimate themaximum theoretical capacity of MOFs for H2 storage, we developedan algorithm to remove these guests and thereby create pristine (i.e.,solvent free) MOFs.Our guest removal algorithm operates by constructing a molecular
graph of the structure by processing the distances dij between each pairof atoms, then expanding the connectivity to a periodic cell. In thisway the connectivity of the metal organic framework and all otherbonded components were identified. We postulated that the set ofbonded atoms could be split into two distinct sets, one containing themetal−organic framework and the other containing all othercomponents. Those components not part of the metal’s bondednetwork are presumed to be guest molecules and are removed.For gas storage applications it is desirable that the adsorbent
material consist of a semirigid, 3D periodic framework of covalentlybonded atoms. However, less interesting compounds consisting of 1Dor 2D building blocks that are held together by hydrogen bondnetworks or van der Waals forces can also appear in the data set. Thesecompounds contain multiple connected components lists containingmetals, and may complicate the guest removal algorithm. To filter outthe 1D and 2D compounds, we reasoned that a 3D framework shouldhave a single connected component list containing all metals in theunit cell. To test this hypothesis, we applied this assumption to ourlabeled set, and found it true for >95% of the set cases. (Of course,interpenetrated MOFs can have multiple metal lists, and onedisadvantage of this approach is that it excludes these compoundsfrom our data set.) We found that so long as the structure was anextended 3D MOF, our method removed solvents and guestscorrectly. As a further check on the method’s accuracy, we examinedthe most promising MOF structures by hand to ensure these were freeof errors. An example of successful guest removal is shown in Figure 2,where the guests are comprised of water molecules. More generally, weobserve that structures whose authors used the PLATONSQUEEZE25 function to refine their structures before submission tothe CSD typically produced a crystal structure free from guestmolecules. The final step in cleaning up the structures involvedremoving terminal oxygen atoms bonded to metal sites. These atomsappear to be components of incompletely resolved water moleculesthat are missing H atoms.2.3. Surface Area, Porosity, and Theoretical H2 Uptake. With
the removal of unbounded guests we have amassed a database ofapproximately 22,700 “computation ready” compounds amenable toproperty characterization (Figure 1). For gas storage applications, twokey properties of an adsorbent are surface area and porosity. Surfacearea is significant because it relates to the number of possible sites atwhich adsorption can take place. In fact, the excess gravimetric uptakearising from adsorption correlates strongly with surface area in a widerange of porous materials.26 Likewise, porosity determines the amountof free space available to host gas phase (or “bulk”) molecules of the
adsorbate. By combining the adsorbed and bulk quantities of adsorbateone can estimate the total amount of a gas stored within a givenadsorbent. Thus as a next step we calculate the surface areas andporosities for all compounds in our database.
For surface area calculations we adopt the geometric accessiblesurface area approach described in ref 23. The method was validatedby comparing calculated surface areas from the data set compoundsagainst previous applications of the method.23 Following convention,we use a probe of N2 of 3.681 Å diameter; unit-cell lattice parameterswere read from the CIF file without further modification. Figure 2demonstrates how the calculated surface area increases after theremoval of guest molecules. To calculate the porosity we used theCALC SOLV function within the PLATON code25 and a H2 probemolecule.
In previous work on H2 adsorption in microporous carbons, a linearrelationship (i.e., the so-called “Chahine rule”)26 was observedbetween surface area and excess hydrogen uptake, nexcess, at 77 Kand 35 bar. Upon further investigation, this relationship was found tohold across a wide class of porous materials, including MOFs.27,28 It ispossible to estimate the total amount of H2 stored by a given MOF byaugmenting nexcess with ngas, the amount of gas phase hydrogen presentin the MOF’s pore, ngas = ρH2
Vpore. Here ρH2is the density of hydrogen
at 77 K and 35 bar (11.5 kg/m3), and Vpore is the volume within thepores of the crystallographic unit cell as calculated by PLATON. Thetotal uptake can be described by the following equation
ρ= + = · +n n n C VSAtot excess gas H pore2 (1)
where C is the proportionality constant (0.021 mg H2/m2) linking
surface area (SA) with excess uptake.28 We note that thisproportionality constant is valid only for a specific temperature andpressure, in this case 77 K and 35 bar. Dividing ntot by the mass orvolume of the unit cell yields, respectively, the total gravimetric (unitsof g H2 per g MOF) and total volumetric uptake (units of g H2 per Lof MOF) of H2.
We emphasize that our estimate of total H2 uptake refers to themaximum theoretical uptake on a materials basis. That is, we assume apristine MOF in which all solvent molecules have been removed, andfurthermore take Vpore to be the micropore volume within a single-crystal monolith of the MOF. (In other words, the theoreticalvolumetric density of stored H2 is based on the single crystal MOFdensity: Volumetric density = gravimetric density × single-crystaldensity.) Although MOF synthesis procedures are continuallyimproving (resulting in less solvent retained within the pores),29 anddensification has shown promise for improving MOF density,30,31 it isunlikely that MOF media used in a commercial storage system willadopt a single crystal morphology and be completely free from guest
Figure 2. Example of the automated removal of guest molecules fromthe compound FIFPAM, and the resulting increase in surface area. Thecircles indicate unconnected components (water molecules) in theMOF’s molecular graph.
Chemistry of Materials Article
dx.doi.org/10.1021/cm401978e | Chem. Mater. XXXX, XXX, XXX−XXXC
molecules. In addition, gravimetric and volumetric losses will arisefrom the mass and volume associated with the storage system: e.g.,pressure vessel, balance of plant components, etc. Hence, ourestimates represent an upper bound to the H2 storage performance.Nevertheless, such estimates are of value because they can distinguish“dead-end” materials, i.e., materials that do not at least exceed system-level targets on a materials-only basis, from those that show promise.Moreover, the use of theoretical capacities facilitates comparisonsbetween compounds by avoiding experimental complicationsassociated with incomplete (or inconsistent) solvent removal. Thisallows for the identification of trade-offs and trends that may bedifficult to isolate using experimental data derived from differentsynthesis conditions.
3. RESULTS AND DISCUSSION3.1. Surface Area, Density, and Porosity. After the
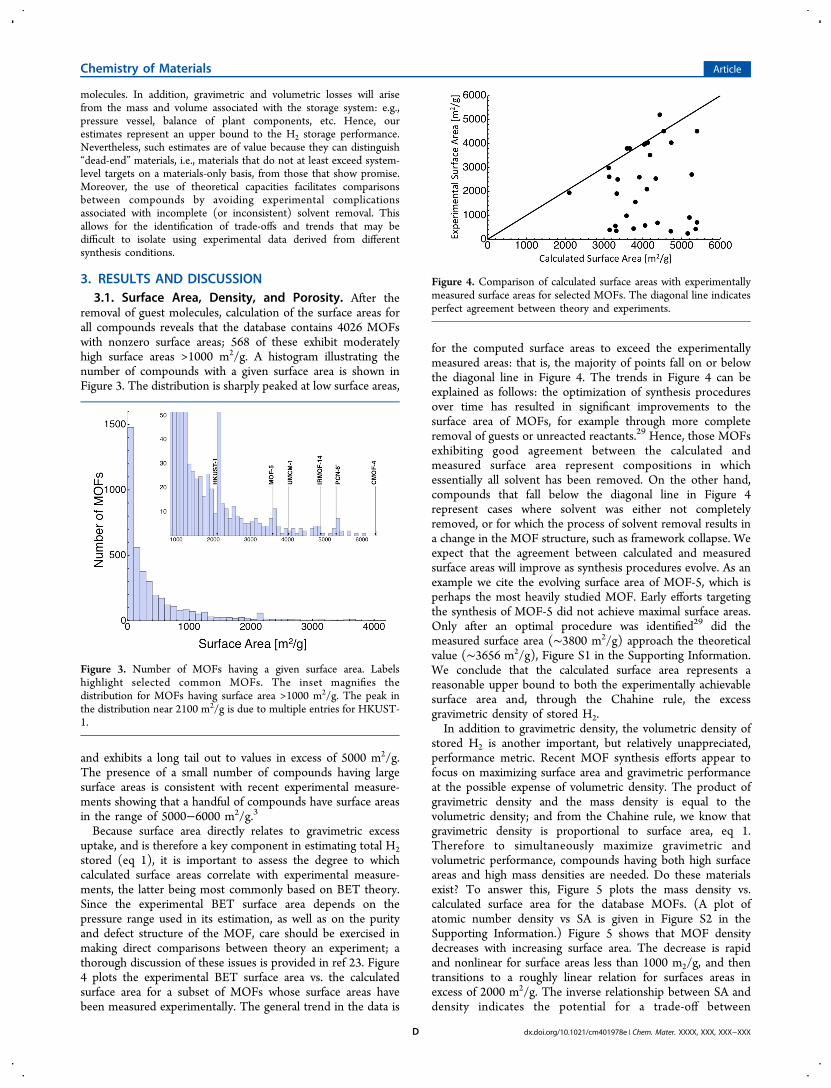
removal of guest molecules, calculation of the surface areas forall compounds reveals that the database contains 4026 MOFswith nonzero surface areas; 568 of these exhibit moderatelyhigh surface areas >1000 m2/g. A histogram illustrating thenumber of compounds with a given surface area is shown inFigure 3. The distribution is sharply peaked at low surface areas,
and exhibits a long tail out to values in excess of 5000 m2/g.The presence of a small number of compounds having largesurface areas is consistent with recent experimental measure-ments showing that a handful of compounds have surface areasin the range of 5000−6000 m2/g.3
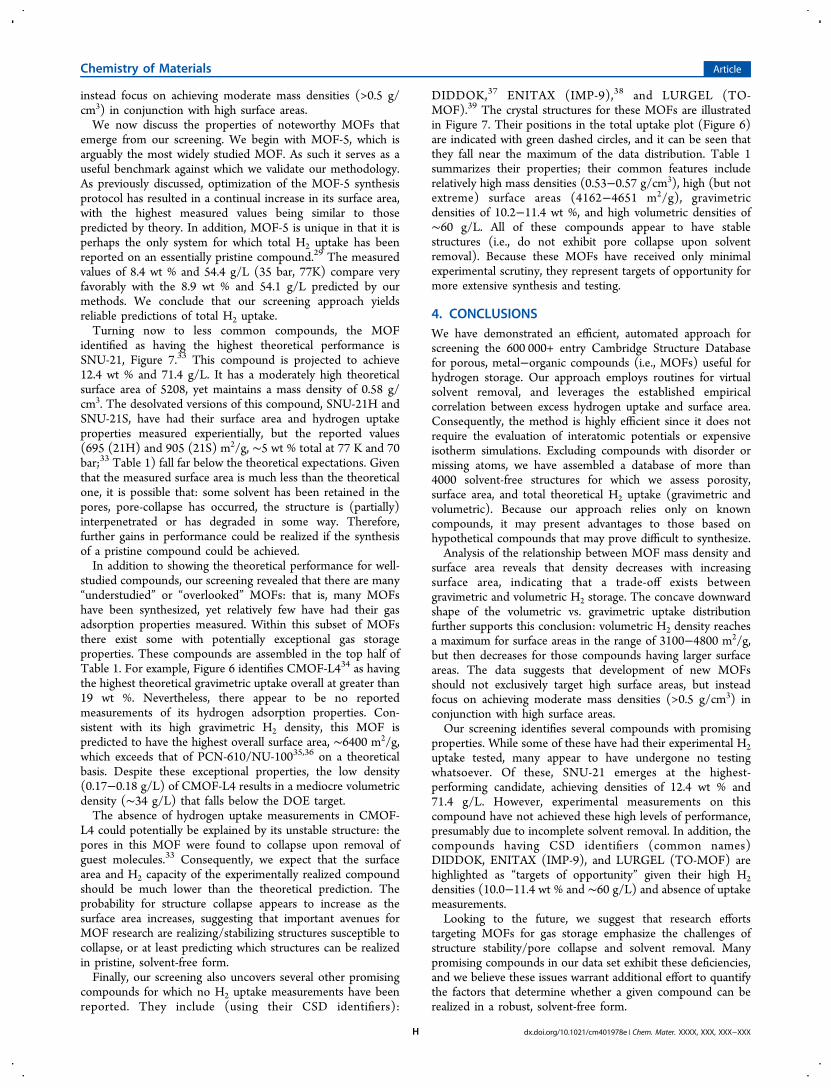
Because surface area directly relates to gravimetric excessuptake, and is therefore a key component in estimating total H2stored (eq 1), it is important to assess the degree to whichcalculated surface areas correlate with experimental measure-ments, the latter being most commonly based on BET theory.Since the experimental BET surface area depends on thepressure range used in its estimation, as well as on the purityand defect structure of the MOF, care should be exercised inmaking direct comparisons between theory an experiment; athorough discussion of these issues is provided in ref 23. Figure4 plots the experimental BET surface area vs. the calculatedsurface area for a subset of MOFs whose surface areas havebeen measured experimentally. The general trend in the data is
for the computed surface areas to exceed the experimentallymeasured areas: that is, the majority of points fall on or belowthe diagonal line in Figure 4. The trends in Figure 4 can beexplained as follows: the optimization of synthesis proceduresover time has resulted in significant improvements to thesurface area of MOFs, for example through more completeremoval of guests or unreacted reactants.29 Hence, those MOFsexhibiting good agreement between the calculated andmeasured surface area represent compositions in whichessentially all solvent has been removed. On the other hand,compounds that fall below the diagonal line in Figure 4represent cases where solvent was either not completelyremoved, or for which the process of solvent removal results ina change in the MOF structure, such as framework collapse. Weexpect that the agreement between calculated and measuredsurface areas will improve as synthesis procedures evolve. As anexample we cite the evolving surface area of MOF-5, which isperhaps the most heavily studied MOF. Early efforts targetingthe synthesis of MOF-5 did not achieve maximal surface areas.Only after an optimal procedure was identified29 did themeasured surface area (∼3800 m2/g) approach the theoreticalvalue (∼3656 m2/g), Figure S1 in the Supporting Information.We conclude that the calculated surface area represents areasonable upper bound to both the experimentally achievablesurface area and, through the Chahine rule, the excessgravimetric density of stored H2.In addition to gravimetric density, the volumetric density of
stored H2 is another important, but relatively unappreciated,performance metric. Recent MOF synthesis efforts appear tofocus on maximizing surface area and gravimetric performanceat the possible expense of volumetric density. The product ofgravimetric density and the mass density is equal to thevolumetric density; and from the Chahine rule, we know thatgravimetric density is proportional to surface area, eq 1.Therefore to simultaneously maximize gravimetric andvolumetric performance, compounds having both high surfaceareas and high mass densities are needed. Do these materialsexist? To answer this, Figure 5 plots the mass density vs.calculated surface area for the database MOFs. (A plot ofatomic number density vs SA is given in Figure S2 in theSupporting Information.) Figure 5 shows that MOF densitydecreases with increasing surface area. The decrease is rapidand nonlinear for surface areas less than 1000 m2/g, and thentransitions to a roughly linear relation for surfaces areas inexcess of 2000 m2/g. The inverse relationship between SA anddensity indicates the potential for a trade-off between
Figure 3. Number of MOFs having a given surface area. Labelshighlight selected common MOFs. The inset magnifies thedistribution for MOFs having surface area >1000 m2/g. The peak inthe distribution near 2100 m2/g is due to multiple entries for HKUST-1.
Figure 4. Comparison of calculated surface areas with experimentallymeasured surface areas for selected MOFs. The diagonal line indicatesperfect agreement between theory and experiments.
Chemistry of Materials Article
dx.doi.org/10.1021/cm401978e | Chem. Mater. XXXX, XXX, XXX−XXXD

volumetric and gravimetric H2 density; this will be discussed inmore detail below. Interestingly, extrapolation of the linearrelationship between density and surface area results in anintercept of ∼7750 m2/g, corresponding to the surface area of ahypothetical MOF having a density of zero. This value issomewhat smaller than the ∼10 500 m2/g upper limit for ahypothetical MOF consisting of infinitely long linkers derivedfrom benzene rings,32 and may represent a more realisticestimate of the maximum surface area attainable by MOFs.To estimate the total H2 contained within a MOF, it is
necessary to quantify the amount of pore space available for gasphase (bulk) H2. Histograms of the calculated porosity andvoid percentage of the data set compounds are shown in FigureS3 in the Supporting Information. Similar to surface area, thesedistributions are peaked at moderate values for pore volume or
void fraction, with very long tails extending out to highervalues. The data confirm that very few compounds exhibitextremely high porosity.
3.2. Theoretical H2 Storage. Figure 6 plots the theoreticaltotal H2 uptake (at 77 K and 35 bar) for the databasecompounds having nonzero surface areas. In several cases thedata points corresponding to noteworthy compounds arehighlighted. The calculated values are compared with the DOE2017 hydrogen storage system targets of 5.5 wt % and 40 g H2/L, depicted as the rectangular region in the upper-right cornerof the plot.2 Table 1 summarizes the properties of 78 high-performing compounds identified by screening with gravimetriccapacities greater than 7.5 wt % [(g H2/g MOF) × 100].(Figure S4 in the Supporting Information contains analternative version of Figure 6 in which gravimetric density isreported in units of g H2/(g H2 + g MOF) × 100.) Of thesehigh gravimetric compounds, nearly 8% appear to be variants ofMOF-5, whereas 52% contain Zn-based clusters and 28%contain Cu clusters. The limited diversity in metal contentsuggests that opportunities may exist to expand thecomposition space via metal substitution.Several features of Figure 6 are noteworthy. First, it is clear
that the vast majority of porous compounds exhibit relativelylow H2 uptake. Nevertheless, our screening identifies severaldozen that surpass the targets on a theoretical, materials-onlybasis (Table 1). Second, and perhaps more importantly, thedistribution of volumetric capacities exhibits a concavedownward shape when plotted vs. wt %. That is, at capacitiesbelow ∼5 wt % the volumetric and gravimetric densities arepositively correlated. However, upon continuing to higher wt %the volumetric density approaches a maximum of ∼64 g/L at
Figure 5. MOF mass density vs. calculated surface area.
Figure 6. Theoretical total (adsorbed + gas phase H2 at 77 K and 35 bar) volumetric and gravimetric density of stored H2 in ∼4000 MOFs minedfrom the CSD. The data account only for the mass and volume of the MOF media; mass and volume contributions from the system are neglected.For comparison, the region bounded by the dashed lines represents the DOE 2017 targets for H2 storage systems. Crossed circles represent commonMOFs with incomplete or disordered crystal data in the CSD; structures for these compounds were constructed by hand. Additional data for the top-performing MOFs is given in Table 1.
Chemistry of Materials Article
dx.doi.org/10.1021/cm401978e | Chem. Mater. XXXX, XXX, XXX−XXXE

Table 1. Calculated Properties of Selected Database MOFs Having Gravimetric Capacities Greater than 7.5 wt %a
CSD identifier, commonname, and reference
density(g/cm3)
S.A. calcd/expt(m2/g)
porosity(cm3/g)
calcd total grav. density(g H2/g MOF)
calcd total vol.density (g H2/L)
notes regarding prior experimentalmeasurements, if available
Compounds for Which H2 Uptake Has Not Been ReportedCMOF-L4b (XAHQAA34) 0.17 6424 5.39 19.7 33.5 pores collapse upon solvent removalCMOF-L4 (XAHPUT34) 0.18 6451 5.10 19.4 34.7 pores collapse upon solvent removalMOF-HTB (NIBJAK40) 0.22 5648 4.04 16.5 36.9mesoMOF-1 (HEXVEM41) 0.25 5623 3.53 15.9 39.9CMOF-L3 (XAHPON34) 0.28 5405 3.05 14.9 42.2 pores collapse upon solvent removalDUT-10(Co) (XAFFIV42) 0.36 5474 2.31 14.2 50.7 likely similar uptake to DUT-10(Zn)DUT-11 (XAFFER42) 0.36 5397 2.30 14.0 50.3DUT-10(Cu) (XAFFOB42) 0.37 5350 2.27 13.8 50.7 uptake likely similar to DUT-10(Zn)CMOF-L2 (XAHPED34) 0.37 5250 2.19 13.6 50.7 pores collapse upon solvent removalCMOF-L1b (XAHPIH34) 0.36 4723/343 2.37 12.6 45.0 pores collapse upon solvent removalUMCM-151 (ANUGEW43) 0.44 4621 1.82 11.8 52.3PUZLOM44 0.45 4494 1.73 11.4 51.3 C60 uptake measuredDIDDOK37 0.53 4651 1.42 11.4 60.0WAGYUA45 0.47 4305 1.70 11.0 51.7TO-MOF (LURGEL39) 0.53 4386/680 1.36 10.8 57.3 CO2 uptake measuredECOKAJ46 0.33 3680 2.60 10.7 34.9XUTQEI47 0.49 4284 1.51 10.7 53.0LIHFAK48 0.50 4066/580 1.52 10.3 51.7 luminescence measuredDUT-28 (AXINAX0149) 0.40 3767/450 1.98 10.2 41.0IMP-9 (ENITAX38) 0.57 4162 1.31 10.2 58.7UiO-68 (UVUFEX50) 0.54 3909 1.42 9.8 52.7FUNBOG51 0.58 3583/980 1.28 9.0 52.3 CO2 uptake measuredALUKOI52 0.74 3531 0.87 8.4 62.6 magnetic properties measuredWONZUV53 0.61 3317 1.14 8.3 50.3ALULAV52 0.76 3466 0.86 8.3 62.5PPF-5 (QOQBOO54) 0.63 3274 1.18 8.2 52.0XOXMED55 0.55 3150/400 1.27 8.0 44.6IRMOF-3 α (VURMOL56) 0.69 3212 1.05 8.0 54.5AMOFAK57 0.74 3313 0.86 7.9 58.9 luminescence measuredQATCUJ58 0.69 3245 0.93 7.9 54.2OKERAY59 0.63 3005 1.15 7.6 47.7 pores collapse upon solvent removal
High-Performing Compounds for Which H2 Uptake Has Been MeasuredPCN-610 or NU-10035 0.29 5723/6143 3.37 15.9 46.2 1.82; 16.4 wt % (77 K, 1; 70 bar)PCN-6′ (NIBHOW)40 0.28 5258/2700 3.15 14.7 41.0 1.35 wt % (77 K, 1 bar)DUT-12(Cu) (XAFFUH)42 0.33 5312 2.58 14.1 46.5 1.3 wt % (77 K, 1 bar)SNU-30SC (VAGMEX)60 0.37 5416 2.26 14.0 51.2 similar to SNU-30DUT-10(Zn) (XAFFAN)42 0.37 5370/423 2.26 13.9 50.7 0.7 wt % (77 K, 1 bar)SNU-30 (VAGMAT)60 0.38 5402/704 2.16 13.8 52.5 1.42; 3.27 (77 K, 1 bar; 77 K, 62 bar)IRMOF-1061 0.33 5026 2.60 13.6 44.6 12 wt %; 43 g/L (77K, 80 bar, GCMC)XOVPUU62 0.42 5392/1217L 1.90 13.5 57.1 1.1 wt % (77 K, 1 bar, GCMC)OWIZAW45 0.38 5155/252 2.12 13.3 50.2 1.1 wt % (77 K, 1 bar)IRMOF-14 (EDUVOO)63 0.37 4891 2.27 12.9 48.0 ∼1.7; ∼10 wt %
(77 K; 300 K, 100 bar, GCMC)SNU-21(S,H) (EPOTAF)33 0.58 5208/905 (S),
695(H)1.29 12.4 71.4 5 wt % (77K, 70 bar)
FJI-14 0.41 4731/4043 1.95 12.2 49.4 1.02; 9.08 wt % (77K, 1; 62 bar), 0.43wt % (298 K, 65 bar)
XAWVUN64 0.46 4833/626L 1.71 12.1 56.2 1.4 wt % (77 K, 1 bar)SNU-31 (VAGMIB)60 0.46 4804 1.69 12.0 55.2 0.2 wt % (77 K, 1 bar)XEBHOC64 0.47 4784/504L 1.70 12.0 55.8 1.2 wt % (77 K, 1 bar)SNU-31 MeCN(VAGMIB01)60
0.46 4767 1.67 11.9 55.3 similar to SNU-31
OHUKIM65 0.42 4645 1.82 11.9 50.2 6.0; 9.2 (43 g/L) wt%(77 K, 20; 100 bar)
SNU-31SC (VAGMOH)60 0.49 4742 1.53 11.7 58.0 similar to SNU-31UMCM-23 0.40 4436/5200 2.09 11.7 46.9 6.9 wt % (77 K, 46 bar)MOF-177 (ERIRIG)4 0.45 4547/4750 1.78 11.6 52.3 1.25; 7 .5 wt % (77 K, 1; 90 bar)DUT-13 (EHIJAH)66 0.41 4332/2532 2.01 11.4 46.8 5.23 wt % (77K, 56 bar)SUKYON67 0.55 4577/1020 1.34 11.2 60.7 1.73 wt % (77 K, 1 bar)UMCM-13 0.43 4041/3971 1.90 10.7 45.8 1.35 wt % (77 K, 1 bar)
Chemistry of Materials Article
dx.doi.org/10.1021/cm401978e | Chem. Mater. XXXX, XXX, XXX−XXXF

8−12 wt %, and then decreases for gravimetric densities greaterthan ∼12 wt %. The decrease in volumetric density at highgravimetric densities is consistent with the density/surface areatrade-off suggested in Figure 5, and is similar to what waspredicted for CH4 uptake in MOFs as a function of surfacearea.15 We conclude that MOFs having extreme surface areasgreater than ∼5500 m2/g cannot meet the DOE volumetric
target (assuming the storage system will have a nonzero
volume). Instead, the most promising compounds occur at
lower surface areas of 3100−4800 m2/g (Table 1), resulting in
both high gravimetric values of 8−12 wt % and volumetric
densities of 50−64 g/L. This suggests that development of newMOFs should not exclusively target high surface areas, but
Table 1. continued
CSD identifier, commonname, and reference
density(g/cm3)
S.A. calcd/expt(m2/g)
porosity(cm3/g)
calcd total grav. density(g H2/g MOF)
calcd total vol.density (g H2/L)
notes regarding prior experimentalmeasurements, if available
High-Performing Compounds for Which H2 Uptake Has Been MeasuredPCN-20 (LUKLIN)68 0.49 4185/3525 1.58 10.6 52.4 6 wt % (77 K, 35 bar)UMCM-869 0.51 4131/4030 1.55 10.5 53.5 1.23 wt % (77 K, 1 bar)PCN-664 0.54 4078/4000 1.49 10.3 55.3 1.79; 6.65 wt % (77 K, 1; 45 bar), 0.78
wt % (298 K, 90 bar)JEJWEB70 0.54 4104/2095 1.39 10.2 55.6 0.8 wt % (77 K, 1 bar)GAHWIX71 0.60 3878 1.61 10.0 60.3 pores collapse; no gas uptakeSNU-6 (ROGMEG)72 0.54 3912/2590 1.38 9.8 52.7 1.68; 10 wt % (77 K, 1; 70 bar)SNU-6 (HOHMIB)72 0.54 3790/2910L 1.51 9.7 52.2 1.68; 10.0 wt % (77 K, 1 atm, 70 bar)UMCM-152 (ANUGIA)73 0.57 3726 1.34 9.4 53.2 5.7 wt % max excess (77 K)SUKYIH67 0.63 3809/1560 1.14 9.3 58.7 1.42 wt % (77 K, 1 bar)MOF-505 (RUVKAV)74 0.60 3644/3110L 1.27 9.1 54.8 4.60;4.82 wt %; 41;43 g/L
(77 K, 17; 38 bar)PCN-64 0.58 3592/3800 1.26 9.0 52.4 1.9 excess wt% (77K, 1 bar)MOF-5 (SAHYOQ01−05)4 0.590 3656/3800 1.31 8.9 54.1 7.1 wt % (77 K, 40 bar)MOF-5 Inter(HIFTOG01)4
0.63 3434/1130L 1.23 8.6 54.0 2.0 wt %; 23.3 g/L (77 K, 1 bar)
UMCM-154 (ANUGUM)73 0.68 3452 1.02 8.4 57.3 5.8 wt % max excess (77 K)MFU-4L (UPOZAB)75 0.56 3184/2750 1.41 8.3 46.5 4 wt % excess (77 K, 20 bar)NJU-Bai2 (OLOGEC)76 0.59 3299/549 1.19 8.3 49.4 1.9 wt % (77 K, 20 bar)PCN-46 (LUYHAP)77 0.66 3351/2500 1.08 8.3 54.9 7.2 wt % (77 K, 60 bar)SNU-15 (COZMUA)78 0.64 3315/356 1.09 8.2 52.4 0.74 wt % (77 K, 1 bar)IRMOF-94 0.66 3326/1904 1.06 8.2 53.9 1.17 excess wt % (77 K, 1 bar)UMCM-150 (OKABAE)79 0.65 3126/2980 1.16 7.9 51.3 2.2; 5.0 wt % (77 K, 1; 30 bar)FUNBEW80 0.67 3179 1.05 7.9 52.8 1.6 wt % (77 K, 20 bar)NOTT-140 (EPISOM)81 0.68 3132/2620 1.05 7.8 52.7 6 wt % (77 K, 20 bar)HKUST-15 0.89 2100/1944 0.78 4.5 39.9 3.3 excess wt %; 29 g/L (77 K, 77 bar)UiO-6682 1.24 936 0.42 2.4 30.3 2.4 wt % (77 K, 31 bar)aData are sorted by gravimetric density, and assembled into two groups: (1) compounds for which no H2 measurements have been reported (topportion of table), and (2) compounds whose H2 uptake has been previously assessed (bottom of table). Data includes common names, CSD indexcodes, density, surface area (S.A.), porosity, calculated total weight percent (wt %, g of H2 per g of MOF), and calculated total volumetric capacity(vol. cap.) at 77 K and 35 bar. When possible, calculated surface areas are compared to experimental (exp.) data. BET surface areas are reportedunless otherwise noted (“L” is used to identify Langmuir values). For experiments we use the highest reported surface area. When available,experimental uptake data and the conditions at which those measurements were taken, are reported in the far right column. Unless otherwiseindicated, experimental data refer to total uptake.
Figure 7. Crystal structures, CSD identifiers, and MOF names (if known) for four of the top performing MOFs identified by screening.
Chemistry of Materials Article
dx.doi.org/10.1021/cm401978e | Chem. Mater. XXXX, XXX, XXX−XXXG
instead focus on achieving moderate mass densities (>0.5 g/cm3) in conjunction with high surface areas.We now discuss the properties of noteworthy MOFs that
emerge from our screening. We begin with MOF-5, which isarguably the most widely studied MOF. As such it serves as auseful benchmark against which we validate our methodology.As previously discussed, optimization of the MOF-5 synthesisprotocol has resulted in a continual increase in its surface area,with the highest measured values being similar to thosepredicted by theory. In addition, MOF-5 is unique in that it isperhaps the only system for which total H2 uptake has beenreported on an essentially pristine compound.29 The measuredvalues of 8.4 wt % and 54.4 g/L (35 bar, 77K) compare veryfavorably with the 8.9 wt % and 54.1 g/L predicted by ourmethods. We conclude that our screening approach yieldsreliable predictions of total H2 uptake.Turning now to less common compounds, the MOF
identified as having the highest theoretical performance isSNU-21, Figure 7.33 This compound is projected to achieve12.4 wt % and 71.4 g/L. It has a moderately high theoreticalsurface area of 5208, yet maintains a mass density of 0.58 g/cm3. The desolvated versions of this compound, SNU-21H andSNU-21S, have had their surface area and hydrogen uptakeproperties measured experientially, but the reported values(695 (21H) and 905 (21S) m2/g, ∼5 wt % total at 77 K and 70bar;33 Table 1) fall far below the theoretical expectations. Giventhat the measured surface area is much less than the theoreticalone, it is possible that: some solvent has been retained in thepores, pore-collapse has occurred, the structure is (partially)interpenetrated or has degraded in some way. Therefore,further gains in performance could be realized if the synthesisof a pristine compound could be achieved.In addition to showing the theoretical performance for well-
studied compounds, our screening revealed that there are many“understudied” or “overlooked” MOFs: that is, many MOFshave been synthesized, yet relatively few have had their gasadsorption properties measured. Within this subset of MOFsthere exist some with potentially exceptional gas storageproperties. These compounds are assembled in the top half ofTable 1. For example, Figure 6 identifies CMOF-L434 as havingthe highest theoretical gravimetric uptake overall at greater than19 wt %. Nevertheless, there appear to be no reportedmeasurements of its hydrogen adsorption properties. Con-sistent with its high gravimetric H2 density, this MOF ispredicted to have the highest overall surface area, ∼6400 m2/g,which exceeds that of PCN-610/NU-10035,36 on a theoreticalbasis. Despite these exceptional properties, the low density(0.17−0.18 g/L) of CMOF-L4 results in a mediocre volumetricdensity (∼34 g/L) that falls below the DOE target.The absence of hydrogen uptake measurements in CMOF-
L4 could potentially be explained by its unstable structure: thepores in this MOF were found to collapse upon removal ofguest molecules.33 Consequently, we expect that the surfacearea and H2 capacity of the experimentally realized compoundshould be much lower than the theoretical prediction. Theprobability for structure collapse appears to increase as thesurface area increases, suggesting that important avenues forMOF research are realizing/stabilizing structures susceptible tocollapse, or at least predicting which structures can be realizedin pristine, solvent-free form.Finally, our screening also uncovers several other promising
compounds for which no H2 uptake measurements have beenreported. They include (using their CSD identifiers):
DIDDOK,37 ENITAX (IMP-9),38 and LURGEL (TO-MOF).39 The crystal structures for these MOFs are illustratedin Figure 7. Their positions in the total uptake plot (Figure 6)are indicated with green dashed circles, and it can be seen thatthey fall near the maximum of the data distribution. Table 1summarizes their properties; their common features includerelatively high mass densities (0.53−0.57 g/cm3), high (but notextreme) surface areas (4162−4651 m2/g), gravimetricdensities of 10.2−11.4 wt %, and high volumetric densities of∼60 g/L. All of these compounds appear to have stablestructures (i.e., do not exhibit pore collapse upon solventremoval). Because these MOFs have received only minimalexperimental scrutiny, they represent targets of opportunity formore extensive synthesis and testing.
4. CONCLUSIONSWe have demonstrated an efficient, automated approach forscreening the 600 000+ entry Cambridge Structure Databasefor porous, metal−organic compounds (i.e., MOFs) useful forhydrogen storage. Our approach employs routines for virtualsolvent removal, and leverages the established empiricalcorrelation between excess hydrogen uptake and surface area.Consequently, the method is highly efficient since it does notrequire the evaluation of interatomic potentials or expensiveisotherm simulations. Excluding compounds with disorder ormissing atoms, we have assembled a database of more than4000 solvent-free structures for which we assess porosity,surface area, and total theoretical H2 uptake (gravimetric andvolumetric). Because our approach relies only on knowncompounds, it may present advantages to those based onhypothetical compounds that may prove difficult to synthesize.Analysis of the relationship between MOF mass density and
surface area reveals that density decreases with increasingsurface area, indicating that a trade-off exists betweengravimetric and volumetric H2 storage. The concave downwardshape of the volumetric vs. gravimetric uptake distributionfurther supports this conclusion: volumetric H2 density reachesa maximum for surface areas in the range of 3100−4800 m2/g,but then decreases for those compounds having larger surfaceareas. The data suggests that development of new MOFsshould not exclusively target high surface areas, but insteadfocus on achieving moderate mass densities (>0.5 g/cm3) inconjunction with high surface areas.Our screening identifies several compounds with promising
properties. While some of these have had their experimental H2uptake tested, many appear to have undergone no testingwhatsoever. Of these, SNU-21 emerges at the highest-performing candidate, achieving densities of 12.4 wt % and71.4 g/L. However, experimental measurements on thiscompound have not achieved these high levels of performance,presumably due to incomplete solvent removal. In addition, thecompounds having CSD identifiers (common names)DIDDOK, ENITAX (IMP-9), and LURGEL (TO-MOF) arehighlighted as “targets of opportunity” given their high H2densities (10.0−11.4 wt % and ∼60 g/L) and absence of uptakemeasurements.Looking to the future, we suggest that research efforts
targeting MOFs for gas storage emphasize the challenges ofstructure stability/pore collapse and solvent removal. Manypromising compounds in our data set exhibit these deficiencies,and we believe these issues warrant additional effort to quantifythe factors that determine whether a given compound can berealized in a robust, solvent-free form.
Chemistry of Materials Article
dx.doi.org/10.1021/cm401978e | Chem. Mater. XXXX, XXX, XXX−XXXH
■ ASSOCIATED CONTENT*S Supporting InformationAtomic number density of database MOFs versus surface area;MOF-5 surface area vs publication year; histograms of porevolume and void %. This material is available free of charge viathe Internet at http://pubs.acs.org.
■ AUTHOR INFORMATIONCorresponding Author*E-mail: [email protected] authors declare no competing financial interest.
■ ACKNOWLEDGMENTSPartial funding for this work was provided by the University ofMichigan Energy Institute and from the U.S. Department ofEnergy, Office of Energy Efficiency and Renewable Energy,Grant DE-FC36-GO19002. We also thank Hyun Seung Koh,Malay Kumar Rana, Ye Li, the University of Michigan’s HPCstaff, and the ASE group for assistance and helpful discussions.
■ REFERENCES(1) Chu, S.; Majumdar, A. Nature 2012, 488, 294.(2) Yang, J.; Sudik, A.; Wolverton, C.; Siegel, D. J. Chem. Soc. Rev.2010, 39, 656.(3) Sculley, J.; Yuan, D.; Zhou, H.-C. Energy Environ. Sci. 2011, 4,2721.(4) Suh, M. P.; Park, H. J.; Prasad, T. K.; Lim, D. W. Chem. Rev.2012, 112, 782.(5) Murray, L. J.; Dinca, M.; Long, J. R. Chem. Soc. Rev. 2009, 38,1294.(6) Ferey, G. Chem. Soc. Rev. 2008, 37, 191.(7) Rowsell, J. L. C. Y.; O., M. Microporous Mesoporous Mater. 2004,73, 3.(8) Batten, S. R. N., S. M.; Turner, D. R. Coordination Polymers:Design, Synthesis, and Application; Royal Society of Chemistry:Cambridge, U.K., 2009.(9) Design and Construction of Coordination Polymers; Hong, M.-C. C.,L., Ed.; John Wiley & Sons: Hoboken, NJ, 2009.(10) Li, J.-R.; Kuppler, R. J.; Zhou, H.-C. Chem. Soc. Rev. 2009, 38,1477.(11) Meek, S. T.; Greathouse, J. A.; Allendorf, M. D. Adv. Mater.2011, 23, 249.(12) Koh, H. S.; Rana, M. K.; Hwang, J.; Siegel, D. J. Phys. Chem.Chem. Phys. 2013, 15, 4573.(13) Caskey, S. R.; Wong-Foy, A. G.; Matzger, A. J. J. Am. Chem. Soc.2008, 130, 10870.(14) Ockwig, N. W.; Delgado-Friedrichs, O.; O’Keeffe, M.; Yaghi, O.M. Acc. Chem. Res. 2005, 38, 176.(15) Wilmer, C. E.; Leaf, M.; Lee, C. Y.; Farha, O. K.; Hauser, B. G.;Hupp, J. T.; Snurr, R. Q. Nat Chem 2012, 4, 83.(16) Allen, F. H. Acta Crystallogr., Sect. B 2002, 58, 380.(17) First, E. L.; Floudas, C. A. Microporous Mesoporous Mater. 2013,165, 32.(18) Haldoupis, E.; Nair, S.; Sholl, D. S. Phys. Chem. Chem. Phys.2011, 13, 5053.(19) Lin, L.-C.; Berger, A. H.; Martin, R. L.; Kim, J.; Swisher, J. A.;Jariwala, K.; Rycroft, C. H.; Bhown, A. S.; Deem, M. W.; Haranczyk,M.; Smit, B. Nat. Mater. 2012, 11, 633.(20) Wilmer, C. E.; Farha, O. K.; Bae, Y.-S.; Hupp, J. T.; Snurr, R. Q.Energy Environ. Sci. 2012, 5, 9849.(21) Haldoupis, E.; Nair, S.; Sholl, D. S. J. Am. Chem. Soc. 2010, 132,7528.(22) Watanabe, T.; Sholl, D. S. Langmuir 2012, 28, 14114.(23) Duren, T.; Millange, F.; Ferey, G.; Walton, K. S.; Snurr, R. Q. J.Phys. Chem. C 2007, 111, 15350.
(24) Bahn, S. R; Jacobsen, K. W. Comput. Sci. Eng. 2002, 4, 56.(25) Spek, A. L. J. Appl. Crystallogr. 2003, 36, 7.(26) Panella, B.; Hirscher, M.; Roth, S. Carbon 2005, 43, 2209.(27) Kolotilov, S. V.; Pavlishchuk, V. V. Theor. Exp. Chem. 2009, 45,75.(28) Gross, K. J.; Carrington, K. R.; Barcelo, S.; Karkamkar, A.;Purewal, J.; Ma, S.; Zhou, H.-C.; Dantzer, P.; Ott, K.; Burrell, T.;Semeslberger, T.; Pivak, Y.; Dam, B.; Chandra, D. Recommended BestPractices for the Characterization of Storage Properties of HydrogenStorage Materials; Department of Energy: Washington, D.C., 2012(29) Kaye, S. S.; D., A.; Yaghi, O. M.; Long, J. R. J. Am. Chem. Soc.2007, 129, 14176.(30) Purewal, J.; Liu, D.; Sudik, A.; Veenstra, M.; Yang, J.; Maurer, S.;Muller, U.; Siegel, D. J. J. Phys. Chem. C 2012, 116, 20199.(31) Purewal, J. J.; Liu, D.; Yang, J.; Sudik, A.; Siegel, D. J.; Maurer,S.; Muller, U. Int. J. Hydrogen Energy 2012, 37, 2723.(32) Schnobrich, J. K.; Koh, K.; Sura, K. N.; Matzger, A. J. Langmuir2010, 26, 5808.(33) Kim, T. K.; Suh, M. P. Chem. Commun. 2011, 47, 4258.(34) Liqing Ma, J. M. F.; Abney, C.; Lin, W. Nat. Chem. 2010, 2, 838.(35) Farha, O. K.; Yazadyn, A. O.; Eryazici, I.; Malliakas, C. D.;Hauser, B. G.; Kanatzidis, M. G.; Nguyen, S. T.; Snurr, R. Q.; Hupp, J.T. Nat. Chem. 2010, 2, 944.(36) Yuan, D.; Zhao, D.; Sun, D.; Zhou, H.-C. Angew. Chem., Int. Ed.2010, 49, 5357.(37) Kondo, M.; Irie, Y.; Miyazawa, M.; Kawaguchi, H.; Yasue, S.;Maeda, K.; Uchida, F. J. Organomet. Chem. 2007, 692, 136.(38) Davies, R. P.; L., R.; Lickiss, P. D.; Robertson, K.; White, J. J. P.Cryst. Growth Des. 2010, 10, 4571.(39) Gadzikwa, T.; F., O. K.; Malliakas, C. D.; Kanatzidis, M. G.;Hupp, J. T.; Nguyen, S. T. J. Am. Chem. Soc. 2009, 131, 13613.(40) Ma, S.; S., D.; Ambrogio, M.; Fillinger, J. A.; Parkin, S.; Zhou,H.-C. J. Am. Chem. Soc. 2007, 129, 1858.(41) Wang, X.-S.; M., S.; Sun, D.; Parkin, S.; Zhou, H.-C. J. Am.Chem. Soc. 2006, 128, 16474.(42) Grunker, R.; Senkovska, I.; Biedermann, R.; Klein, N.; Klausch,A.; Baburin, I. A.; Mueller, U.; Kaskel, S. Eur. J. Inorg. Chem. 2010,2010, 3835.(43) Schnobrich, J. K.; Lebel, O.; Cychosz, K. A.; Dailly, A.; Wong-Foy, A. G.; Matzger, A. J. J. Am. Chem. Soc. 2010, 132, 13941.(44) Inokuma, Y.; Arai, T.; Fujita, M. Nat. Chem. 2010, 2, 780.(45) Liu, T. F.; Lu, J.; Lin, X.; Cao, R. Chem. Commun. 2010, 46,8439.(46) Yanxiong, K.; C., D. J.; Sun, D.; Zhou, H.-C. Inorg. Chem.Commun. 2006, 45, 1897.(47) Prior, T. J.; Bradshaw, D.; Teat, S. J.; Rosseinsky, M. J. Chem.Commun. 2003, 500.(48) Bauer, C. A.; T., T. V.; Settersten, T. B.; Patterson, B. D.; Liu, V.H.; Simmons, B. A.; Allendorf, M. D. J. Am. Chem. Soc. 2007, 129,7136.(49) Wollmann, P.; Leistner, M.; Stoeck, U.; Grunker, R.; Gedrich,K.; Klein, N.; Throl, O.; Grahlert, W.; Senkovska, I.; Dreisbach, F.;Kaskel, S. Chem. Commun. 2011, 47, 5151.(50) Schaate, A.; Roy, P.; Godt, A.; Lippke, J.; Waltz, F.; Wiebcke,M.; Behrens, P. Chemistry 2011, 17, 6643.(51) Farha, O. K.; M., C. D.; Kanatzidis, M. G.; Hupp, J. T. J. Am.Chem. Soc. 2010, 132, 950.(52) Han, Y.; Li, X.; Li, L.; Ma, C.; Shen, Z.; Song, Y.; You, X. Inorg.Chem. 2010, 49, 10781.(53) Mei-Jin Lin, A. J.; Kyritsakas, N.; Hosseini, M. W.CrystEngComm 2009, 11, 189.(54) Choi, E.-Y.; B., P. M.; Novotny, R. W.; Son, H.-T.; Hu, C.;Choe, W. Inorg. Chem. Commun. 2009, 48, 426.(55) Nelson, A. P.; F., O. K.; Mulfort, K. L.; Hupp, J. T. J. Am. Chem.Soc. 2009, 131.(56) Haneul Yim, E. K.; Kim, J. Bull. Kor. Chem. Soc. 2010, 31, 1041.(57) Li, Y.; Song, D. CrystEngComm 2011, 13, 1821.(58) Biradha, K.; Fujita, M. Chem. Commun. 2001, 0, 15.
Chemistry of Materials Article
dx.doi.org/10.1021/cm401978e | Chem. Mater. XXXX, XXX, XXX−XXXI
(59) Norberto Masciocchi, S. G.; Colombo, V.; Maspero, A.;Palmisano, G.; Seyyedi, B.; Lamberti, C.; Silvia, B. J. Am. Chem. Soc.2010, 132, 7902.(60) Park, H. J.; Cheon, Y. E.; Suh, M. P. Chemistry 2010, 16, 11662.(61) Stergiannakos, T.; Tylianakis, E.; Klontzas, E.; Froudakis, G. E. J.Phys. Chem. C 2010, 114, 16855.(62) Shuting, W.; M., L.; Long, L.-S.; Zheng, L.-S.; Lin, W. Inorg.Chem. 2009, 48, 2436.(63) Eddaoudi, M.; Kim, J.; Rosi, N.; Vodak, D.; Wachter, J.;O’Keeffe, M.; Yaghi, O. M. Science 2002, 295, 469.(64) Sun, D.; Ke, Y.; Mattox, T. M.; Ooro, B. A.; Zhou, H. C. ChemCommun 2005, 5447.(65) Sumida, K.; H., M. R.; Horike, S.; Dailly, A.; Long, J. R. J. Am.Chem. Soc. 2009, 131, 15120.(66) Grunker, R.; Senkovska, I.; Biedermann, R.; Klein, N.; Lohe, M.R.; Muller, P.; Kaskel, S. Chem. Commun. 2011, 47, 490.(67) Ma, L.; Jin, A.; Xie, Z.; Lin, W. Angew. Chem., Int. Ed. 2009, 48,9905.(68) Wang, X. S.; Ma, S.; Yuan, D.; Yoon, J. W.; Hwang, Y. K.;Chang, J. S.; Wang, X.; Jorgensen, M. R.; Chen, Y. S.; Zhou, H. C.Inorg. Chem. 2009, 48, 7519.(69) Koh, K.; Van Oosterhout, J. D.; Roy, S.; Wong-Foy, A. G.;Matzger, A. J. Chemical Science 2012, 3, 2429.(70) Sun, D.; Collins, D. J.; Ke, Y.; Zuo, J. L.; Zhou, H. C. Chemistry2006, 12, 3768.(71) Song, X.; Zou, Y.; Liu, X.; Oh, M.; Lah, M. S. New J. Chem.2010, 34, 2396.(72) Park, H. J.; Suh, M. P. Chemistry 2008, 14, 8812.(73) Schnobrich, J. K.; L., O.; Cychosz, K. A.; Dailly, A.; Wong-Foy,A. G.; Matzger, A. J. J. Am. Chem. Soc. 2010, 132, 13941.(74) Zheng, B.; Liang, Z.; Li, G.; Huo, Q.; Liu, Y. Cryst. Growth Des.2010, 10, 3405.(75) Denysenko, D.; Grzywa, M.; Tonigold, M.; Streppel, B.; Krkljus,I.; Hirscher, M.; Mugnaioli, E.; Kolb, U.; Hanss, J.; Volkmer, D.Chem.Eur. J. 2011, 17, 1837.(76) Duan, J.; Bai, J.; Zheng, B.; Li, Y.; Ren, W. Chem. Commun.2011, 47, 2556.(77) Zhao, D.; Yuan, D.; Yakovenko, A.; Zhou, H. C. Chem. Commun.2010, 46, 4196.(78) Cheon, Y. E.; Suh, M. P. Chem. Commun. 2009, 2296.(79) Park, T. H.; Cychosz, K. A.; Wong-Foy, A. G.; Dailly, A.;Matzger, A. J. Chem. Commun. 2011, 47, 1452.(80) Liu, B.; Sun, C.; Chen, G. Chem. Eng. Sci. 2011, 66, 3012.(81) Tan, C.; Yang, S.; Champness, N. R.; Lin, X.; Blake, A. J.; Lewis,W.; Schroder, M. Chem. Commun. 2011, 47, 4487.(82) Chavan, S.; Vitillo, J. G.; Gianolio, D.; Zavorotynska, O.;Civalleri, B.; Jakobsen, S.; Nilsen, M. H.; Valenzano, L.; Lamberti, C.;Lillerud, K. P.; Bordiga, S. Phys. Chem. Chem. Phys. 2012, 14, 1614.
Chemistry of Materials Article
dx.doi.org/10.1021/cm401978e | Chem. Mater. XXXX, XXX, XXX−XXXJ