theodore roosevelt college & career academy ... - … steps for theodore roosevelt college and...
TRANSCRIPT

Theodore Roosevelt College & Career Academy
Update August 2014
By: Teresa Brown, IDOE

Monitoring and Oversight Process:
• Site Visits: Coordinators and IDOE Staff • Classroom Observations • Monthly Reports • Quarterly Progress Meetings and Reviewing the
Data, Progress, and Next Steps with IDOE Staff • Ongoing Communication with Title 1 and
Outreach Offices

Core Question # 1: Is the educational program a success? Goal 1 – 92% student attendance (78% 2012-13; 64.49 6/14) Goal 2 – 90% staff attendance (98% 2012-13; 93.8% 6/14) Goal 3 – Reduce office discipline referrals by 10% (17.5 daily incidents 5/13; 10.9 daily incidents 5/14)

Goal 4 – Reduce out of school suspension by 10% (OSS incidents: 119 in 5/14) Goal 5 – Reduce under credited students by 10% Currently: • 10th – 67% • 11th – 52% • 12th – 56% Goal 6 – Improve the graduation rate to 73% (Currently 47% 2012 41.3% 2013) Goal 7 – At least 65% of graduating students will enroll in vocational or 2/4 year college (Currently 60%)

Goal 8 – Increase by 5% students passing ISTEP 2012-13: 7th ELA: 28.6%; 7th Math: 19.7% 8th ELA: 29.6%; 8th Math: 23.6% 2013-14: 7th ELA: 36%; 7th Math: 18% 8th ELA: 37%; 8th Math: 22% Goal 9 – Increase % passing End of Course Assessments by 5% Currently: (first time test-takers) • 2013: 13.5% Algebra 1 2014: 31.4% Algebra 1 (Gr. 9) • 2013: 23.8% English 2014: 24% English (Gr. 10) • Goal 10 – Increase % passing Advanced Placement Exams Currently: • 0%

Core Question #2: Is your school providing
appropriate conditions for success?
Indicator
April 30, 2014
May 31, 2014
June 30, 2014
Student
Enrollment
618
9/13/13
540
-78
543
-75
543
-75

Core Question #2: Is your school providing
appropriate conditions for success?
Indicator
April 30, 2014
May 31, 2014
June 30, 2014
Student
Attendance
92% Goal
70%
Withdrawals: 9 students
Transferred during the
month
Enrolled: 13 students
enrolled this month
Dropouts: 2
Other (explain):
56% mobility
72.0%
Withdrawals: 6 students
Transferred during the month
Enrolled: 3 students
enrolled during the month
Dropouts: 0
Other(explain):
56% mobility
64.49%
Withdrawals: 0 students
Transferred during the
month
Enrolled: 0 students
enrolled during the month
Dropouts: 1
Other (explain):
56% mobility

Core Question #2: Is your school providing appropriate conditions for success?
Indicator
April 30, 2014
May 31, 2014
June 30, 2014
Student
Suspensions
118
Drugs: 2
Attendance: 0
119
Drugs: 0
Attendance: 0
0
Drugs: 0
Attendance: 0
Student
Expulsions
0 0 0

Core Question #3: Is the organization effective and well run?
• Professional Development 104 minutes weekly • Administrator Support of Instruction 63 informal
observations
Indicator
April 30, 2014
May 31, 2014
June 30, 2014
Staff Attendance 98.5% 97.5% 93.8%
Staff Retention New Hires: 0
Resignations: 0
Terminations: 2
New Hires: 0
Resignations: 0
Terminations: 0
New Hires: 0
Resignations:0
Terminations: 23

Core Question #4: Is the organization in sound fiscal health?
• Enrollment Variance 618 9/13/13 • February Enrollment Variance 595 2/14/14 • May Enrollment Count 550 (using for current
payments) • Decline of 68 from 9/13/13 x $5,053.19 • Enrollment Decline Fiscal Impact $343,616.92

On-site Monitoring Observations Strengths: • Safe and Orderly Environment • Routines Clearly Established • Positive Relationships Between Students and
Staff • Academic Culture Established • Ongoing Professional Learning • Principal as Instructional Leader • Staff Attendance • Reduction in Office Referrals • Increase in ELA 7th and 8th Grade ISTEP scores

On-site Monitoring Observations Areas Needing Developed: • Level of Rigor of Instruction and Learning Activities • Increase Opportunities for Critical Thinking and
Application of Learning • Expand Differentiated Learning Opportunities • Continue to work on Active Engagement of Students • Ensure Students Own Their Data • Improve Student Achievement Results: ECAs, ISTEP,
AP, Graduation Rate • Reduce Under-Credited Students • Improve OSS Rates • Improve Student Attendance

Next Steps for Theodore Roosevelt College and Career Academy • Continue Ongoing Monitoring • Continue Collaborative Progress Meetings • Discussion with Roosevelt Regarding Student
Attendance (High School) and Partnering with Gary PD; Offer DOE Resources
• 2014-15 Implement a new Research-Based Benchmark Assessment System (i-Ready) to assess student performance levels and provide staff with immediate information on skill mastery and next steps for instruction.

TRCCA - SBOE Monthly Performance Meeting – 04/30/2014 Page 1 of 11
Monthly Performance Report for Schools, Lead Partners and TSO Federal funds are designed to support school improvement plans that take a new, innovative and systemic approach to improving student
achievement and school quality. As a school or school partner working towards swift and sustainable improvement you are required to submit a monthly update to the IDOE Outreach Office for School Improvement and the State Board of Education.
The report is designed to meet the federal requirement for schools in priority and focus status as well as provide information that is based on school and student data.
The report template allows for personalization that matches the school improvement plan you have submitted but also forces the alignment of goals to research based Turnaround Principles from the USDoE (Core Question 1). The Turnaround Principles are classified into three domains:
Readiness to Learn, Readiness to Teach and Readiness to Act. Information on these three domains and association nine turnaround principles can be found on the IDOE website at www.doe.in.gov. Core Questions 2 & 3 also align to Turnaround Principles, and Core Question 4 is for TSO
operators only. Your regional outreach coordinator will be available to assist you on behalf of the IDOE as you complete this monthly report.
Please use the reference numbers (1-9) associated with the Turnaround Principles below in each response for Core Questions 1-4. Readiness to Learn
1. Strong Instructional Program: Implementation of instruction system that is research based, rigorous and aligned with State academic content standards
2. School Environment: Creation of a school climate that is safe and disciplined. 3. Supportive School Culture: System that supports students’ social, emotional and health needs that improves school safety and supports 4. Family & Community Involvement: School provides a mechanism for engaging family and community

TRCCA - SBOE Monthly Performance Meeting – 04/30/2014 Page 2 of 11
Readiness to Teach
5. Effective Teaching and Instruction: Creation of a system that supports teacher growth though multiple opportunities of professional development.
6. Data Informed Instruction: System that holds teachers and staff accountable for student achievement and allows for differentiated support for all students.
7. Data Driven Decision Making: System of collaboration exists that allows for consistent, on-going opportunities for staff to use data to inform instruction.
Readiness to Act 8. Strong Leadership: Ability to make mission-driven decisions about people, time, money and program.
9. Time: Redesign of the School Day, Week or year to allow for additional time for student learning and teacher collaboration
Directions for Report Completion and Submission Expectations: Please submit to Outreach Office for School Improvement by the third Friday of the Month September- June. Email delivery is preferred to [email protected] and [email protected]. If called upon to present at the State Board of Education meeting the data in this template should be accompanied by a power point representation of information. At a minimum you will be called upon to present at least once a year. Core Question 1: Is the educational program a success? This question allows for you to articulate each goal in the School Improvement Plan. The expectation is for data to accompany your communication “performance indicators.” The data when possible should be broken down into disaggregated student groups. This data will serve as evidence of the success towards each goal. Core Question 2: Is the school providing appropriate conditions for success? Data submitted with this core question may also be data used if aligned to a school goal around appropriate school conditions. Please indicate *see SIP goal #___” within column 1 if this is exists. Core Questions 3: Is the organization effective and well run? Data submitted with this core question may also be data used if aligned to a school goal around appropriate school conditions. Please indicate *see SIP goal #___” within column 1 if this is exists. Core Question 4: Is the organization in sound fiscal health? To be answered by TSO partners only
TRCCA - SBOE Monthly Performance Meeting – 04/30/2014 Page 3 of 11
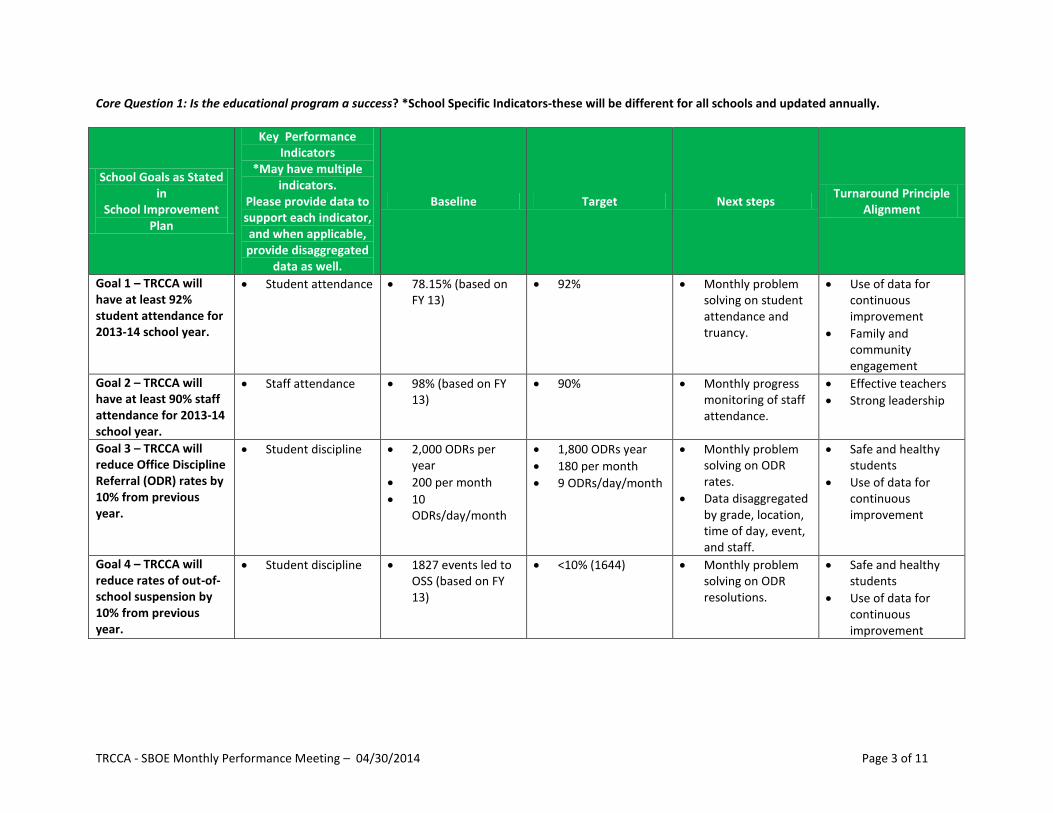
Core Question 1: Is the educational program a success? *School Specific Indicators-these will be different for all schools and updated annually.
School Goals as Stated in
School Improvement Plan
Key Performance Indicators
*May have multiple indicators.
Please provide data to support each indicator, and when applicable, provide disaggregated
data as well.
Baseline Target Next steps Turnaround Principle
Alignment
Goal 1 – TRCCA will have at least 92% student attendance for 2013-14 school year.
Student attendance 78.15% (based on FY 13)
92% Monthly problem solving on student attendance and truancy.
Use of data for continuous improvement
Family and community engagement
Goal 2 – TRCCA will have at least 90% staff attendance for 2013-14 school year.
Staff attendance 98% (based on FY 13)
90% Monthly progress monitoring of staff attendance.
Effective teachers
Strong leadership
Goal 3 – TRCCA will reduce Office Discipline Referral (ODR) rates by 10% from previous year.
Student discipline 2,000 ODRs per year
200 per month
10 ODRs/day/month
1,800 ODRs year
180 per month
9 ODRs/day/month
Monthly problem solving on ODR rates.
Data disaggregated by grade, location, time of day, event, and staff.
Safe and healthy students
Use of data for continuous improvement
Goal 4 – TRCCA will reduce rates of out-of-school suspension by 10% from previous year.
Student discipline 1827 events led to OSS (based on FY 13)
<10% (1644) Monthly problem solving on ODR resolutions.
Safe and healthy students
Use of data for continuous improvement

TRCCA - SBOE Monthly Performance Meeting – 04/30/2014 Page 4 of 11
School Goals as Stated in
School Improvement Plan
Key Performance Indicators
*May have multiple indicators.
Please provide data to support each indicator, and when applicable, provide disaggregated
data as well.
Baseline Target Next steps Turnaround Principle
Alignment
Goal 5 – TRCCA will reduce % of students who are under-credited by 10% from previous year.
Graduation rate 10th
– 67%
11th
– 52%
12th
– 56%
Will update in October as transcripts arrive.
10th
– 57%
11th
- 42%
12th
– 46%
Quarterly monitoring of on-track status of students in grades 7-10.
Use of data for continuous improvement
Redesigned schedules for additional time
Goal 6 – TRCCA will have a graduation rate of at least 73%.
Graduation rate 47% 73% On-line credit recovery
Quarterly monitoring of on-track status for students in grades 9 and 10.
Redesigned schedules for additional time
Rigorous and aligned instructional program
Goal 7 – TRCCA will have at least 65% of graduating seniors enroll in a vocational school or 2/4 yr. college or university.
Postsecondary transition
60% (36 out of 60 graduating seniors)
65% College site visits.
School counselor meets regularly with students on track for graduation to explore postsecondary options.
Rigorous and aligned instructional program
Family and community engagement

TRCCA - SBOE Monthly Performance Meeting – 04/30/2014 Page 5 of 11
School Goals as Stated in
School Improvement Plan
Key Performance Indicators
*May have multiple indicators.
Please provide data to support each indicator, and when applicable, provide disaggregated
data as well.
Baseline Target Next steps Turnaround Principle
Alignment
Goal 8 – TRCCA will increase the percent of students passing ISTEP by 5% from previous year.
Student achievement
Gary 2012
Grade 7 ELA – 14.3%
Grade 7 Math – 22.4%
Grade 8 ELA –23.8%
Grade 8 Math – 14.5%
TRCCA 2013
Grade 7 ELA – 28.6% (+14.3%)
Grade 7 Math – 19.7% (-2.7%)
Grade 7 SS – 20%
Grade 8 ELA – 29.6% (+5.8%)
Grade 8 Math – 23.6% (+9.1%)
Increase all ISTEP scores by 5%
Monthly benchmark assessments and problem solving on end of year standards.
Strong leadership
Effective teachers
Rigorous and aligned instructional program

TRCCA - SBOE Monthly Performance Meeting – 04/30/2014 Page 6 of 11
School Goals as Stated in
School Improvement Plan
Key Performance Indicators
*May have multiple indicators.
Please provide data to support each indicator, and when applicable, provide disaggregated
data as well.
Baseline Target Next steps Turnaround Principle
Alignment
Goal 9 – TRCCA will increase the percent of students passing ECA by 5% from previous year.
Student achievement
Gary School Corp 2012
Grade 9 Algebra I – 14.4%
Grade 10 Eng 10 –28.9%
TRCCA 2013 First time test takers)
Grade 9 Algebra I – 13.5%
Grade 10 Eng 10 – 23.8%
Increase both ECA scores by 5%
Monthly benchmark assessments and problem solving on end of year standards.
Strong leadership
Effective teachers
Rigorous and aligned instructional program
Goal 10 - TRCCA will increase percent of students passing AP tests by 10% from previous year.
Student achievement
0% 10% School offers 2 AP classes.
On-going PD for AP teachers.
Training for teachers identified to teach AP
Strong leadership
Effective teachers
Rigorous and aligned instructional program

TRCCA - SBOE Monthly Performance Meeting – 04/30/2014 Page 7 of 11
Core Question 2: Is your school providing appropriate conditions for success? *Common School Indicators
Indicator Date Data/Comments Challenges Successes Next steps Turnaround
Principle Alignment
Student Enrollment*
April 30, 2014 540 students are actively enrolled
These are active students
Student mobility a major issue in Gary.
Repeat pattern of students transferring without notifying school of transfer.
Schoolwide recruiting effort
School Attendance Officer
Monthly monitoring and problem solving of enrollment.
Parents notified at 3, 6, 10+ days of unexcused absences.
Use of data for continuous improvement
Family and community engagement
Student Attendance*
April 30, 2014 ADA – 70%
56% mobility YTD
Enrolled – 13
Transfers – 9
Drops – 2
Other (explain):
Coordinating school and community resources.
Parent follow through with regular student attendance.
Parent contact information frequently changes.
Students come and go during the day (i.e., ditching classes).
Tiered attendance intervention process.
Learning coaches review attendance with students 2x per week.
Grade-level problem solving meetings occur monthly.
On-going review of truancy referrals with Gary PD.
Continue monthly problem solving meetings.
On-going follow up with Gary PD on truancy referrals.
Continue to closely adhere to truancy referral procedures set forth by Gary PD.
Use of data for continuous improvement
Family and community engagement
TRCCA - SBOE Monthly Performance Meeting – 04/30/2014 Page 8 of 11
Indicator Date Data/Comments Challenges Successes Next steps Turnaround Principle Alignment
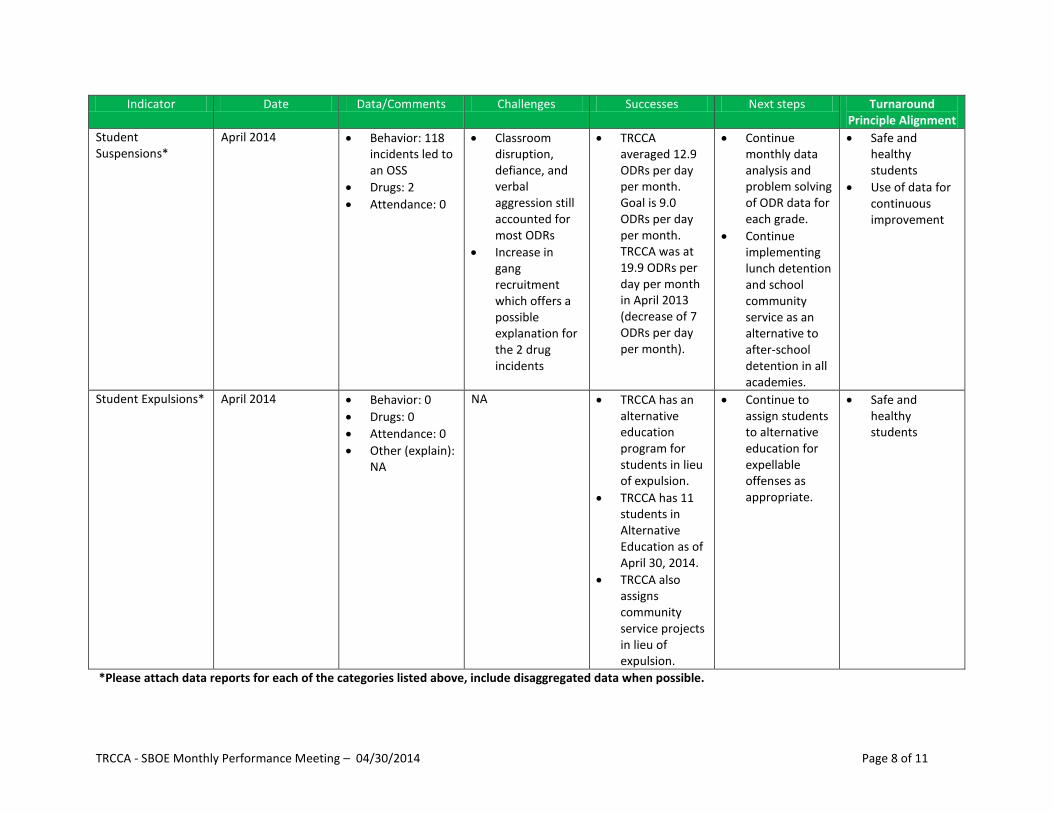
Student Suspensions*
April 2014 Behavior: 118 incidents led to an OSS
Drugs: 2
Attendance: 0
Classroom disruption, defiance, and verbal aggression still accounted for most ODRs
Increase in gang recruitment which offers a possible explanation for the 2 drug incidents
TRCCA averaged 12.9 ODRs per day per month. Goal is 9.0 ODRs per day per month. TRCCA was at 19.9 ODRs per day per month in April 2013 (decrease of 7 ODRs per day per month).
Continue monthly data analysis and problem solving of ODR data for each grade.
Continue implementing lunch detention and school community service as an alternative to after-school detention in all academies.
Safe and healthy students
Use of data for continuous improvement
Student Expulsions* April 2014 Behavior: 0
Drugs: 0
Attendance: 0
Other (explain): NA
NA TRCCA has an alternative education program for students in lieu of expulsion.
TRCCA has 11 students in Alternative Education as of April 30, 2014.
TRCCA also assigns community service projects in lieu of expulsion.
Continue to assign students to alternative education for expellable offenses as appropriate.
Safe and healthy students
*Please attach data reports for each of the categories listed above, include disaggregated data when possible.

TRCCA - SBOE Monthly Performance Meeting – 04/30/2014 Page 9 of 11
Core Question 3: Is the organization effective and well-run? *Common School Indicators
Indicator Date Data/Comments Challenges Celebrations Next steps Turnaround Principle Alignment
Staff Attendance Previous month
April 2014 98.5% Meeting yearly goal at this time.
Staff is highly engaged.
Staff members with perfect attendance are acknowledged at monthly staff meetings.
Effective teachers
Strong leadership
Staff Retention
April 2014 New Hires: 0
Resignations: 0
Terminations: 2
Terminations as a result of a lack of professionalism and failure
Staff continue to stay employed at school and maintain good attendance despite turnaround challenges.
Continue recruiting for HQ special education teachers (2 new teachers are not HQ yet).
Effective teachers
Strong leadership
Professional Development Opportunities
April 2014 PD Schedule Attached
Prioritizing pd topics and focus
100% of staff participated in differentiated pre-service training.
Weekly PD for teachers focused on Academic Rigor, Differentiation and Scaffolding Concepts & Constructed Response
Leadership team will continue to prioritize topics.
Strong leadership
Administrative Support of Instruction
April 2014 Informal observations by school
Additional time needed to realize key
All classrooms visited daily.
Observation
Follow classroom observation
Strong leadership
TRCCA - SBOE Monthly Performance Meeting – 04/30/2014 Page 10 of 11
Indicator Date Data/Comments Challenges Celebrations Next steps Turnaround Principle Alignment
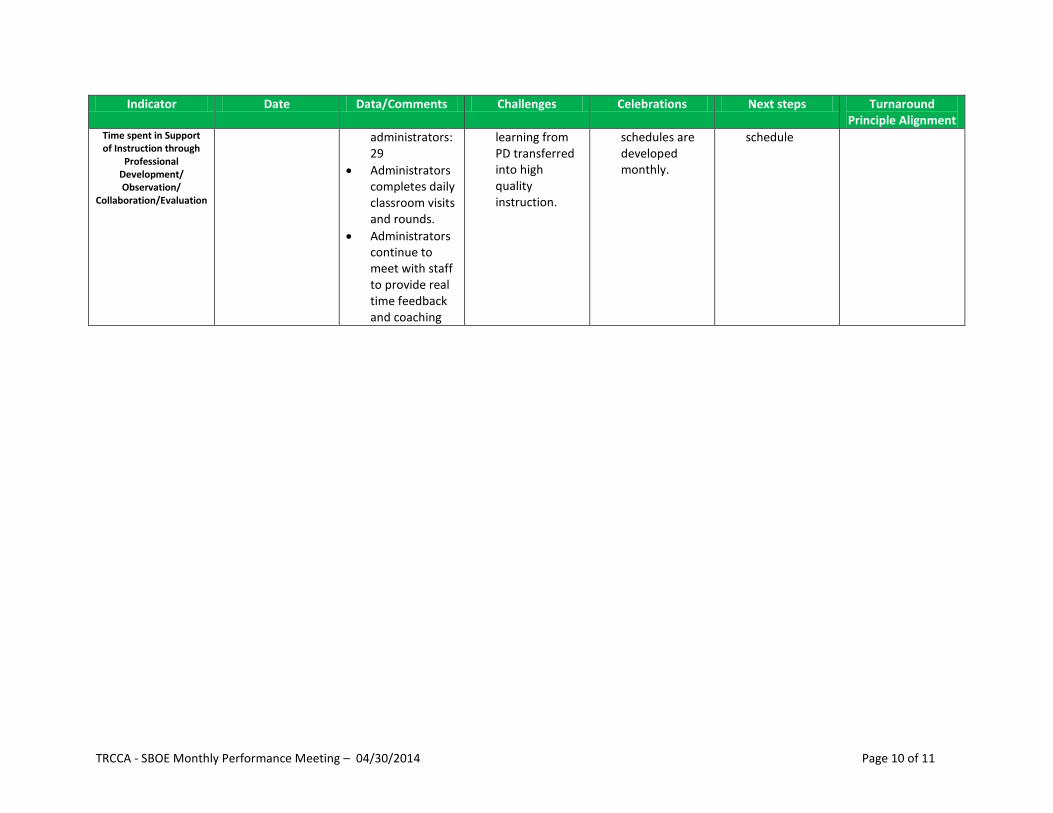
Time spent in Support of Instruction through
Professional Development/ Observation/
Collaboration/Evaluation
administrators: 29
Administrators completes daily classroom visits and rounds.
Administrators continue to meet with staff to provide real time feedback and coaching
learning from PD transferred into high quality instruction.
schedules are developed monthly.
schedule

TRCCA - SBOE Monthly Performance Meeting – 04/30/2014 Page 11 of 11
Core Question 4: Is the organization in sound fiscal health? TSO operators only
Date Comments Challenges Celebrations Next steps Turnaround Principle Alignment
Enrollment Variance
February Count Day Enrollment Variance
Financial Audit Findings

TRCCA - SBOE Monthly Performance Meeting – 05/31/2014 Page 1 of 12
Monthly Performance Report for Schools, Lead Partners and TSO Federal funds are designed to support school improvement plans that take a new, innovative and systemic approach to improving student
achievement and school quality. As a school or school partner working towards swift and sustainable improvement you are required to submit a monthly update to the IDOE Outreach Office for School Improvement and the State Board of Education.
The report is designed to meet the federal requirement for schools in priority and focus status as well as provide information that is based on school and student data.
The report template allows for personalization that matches the school improvement plan you have submitted but also forces the alignment of goals to research based Turnaround Principles from the USDoE (Core Question 1). The Turnaround Principles are classified into three domains:
Readiness to Learn, Readiness to Teach and Readiness to Act. Information on these three domains and association nine turnaround principles can be found on the IDOE website at www.doe.in.gov. Core Questions 2 & 3 also align to Turnaround Principles, and Core Question 4 is for TSO
operators only. Your regional outreach coordinator will be available to assist you on behalf of the IDOE as you complete this monthly report.
Please use the reference numbers (1-9) associated with the Turnaround Principles below in each response for Core Questions 1-4. Readiness to Learn
1. Strong Instructional Program: Implementation of instruction system that is research based, rigorous and aligned with State academic content standards
2. School Environment: Creation of a school climate that is safe and disciplined. 3. Supportive School Culture: System that supports students’ social, emotional and health needs that improves school safety and supports 4. Family & Community Involvement: School provides a mechanism for engaging family and community

TRCCA - SBOE Monthly Performance Meeting – 05/31/2014 Page 2 of 12
Readiness to Teach
5. Effective Teaching and Instruction: Creation of a system that supports teacher growth though multiple opportunities of professional development.
6. Data Informed Instruction: System that holds teachers and staff accountable for student achievement and allows for differentiated support for all students.
7. Data Driven Decision Making: System of collaboration exists that allows for consistent, on-going opportunities for staff to use data to inform instruction.
Readiness to Act 8. Strong Leadership: Ability to make mission-driven decisions about people, time, money and program.
9. Time: Redesign of the School Day, Week or year to allow for additional time for student learning and teacher collaboration
Directions for Report Completion and Submission Expectations: Please submit to Outreach Office for School Improvement by the third Friday of the Month September- June. Email delivery is preferred to [email protected] and [email protected]. If called upon to present at the State Board of Education meeting the data in this template should be accompanied by a power point representation of information. At a minimum you will be called upon to present at least once a year. Core Question 1: Is the educational program a success? This question allows for you to articulate each goal in the School Improvement Plan. The expectation is for data to accompany your communication “performance indicators.” The data when possible should be broken down into disaggregated student groups. This data will serve as evidence of the success towards each goal. Core Question 2: Is the school providing appropriate conditions for success? Data submitted with this core question may also be data used if aligned to a school goal around appropriate school conditions. Please indicate *see SIP goal #___” within column 1 if this is exists. Core Questions 3: Is the organization effective and well run? Data submitted with this core question may also be data used if aligned to a school goal around appropriate school conditions. Please indicate *see SIP goal #___” within column 1 if this is exists. Core Question 4: Is the organization in sound fiscal health? To be answered by TSO partners only

TRCCA - SBOE Monthly Performance Meeting – 05/31/2014 Page 3 of 12
Core Question 1: Is the educational program a success? *School Specific Indicators-these will be different for all schools and updated annually.
School Goals as Stated in
School Improvement Plan
Key Performance Indicators
*May have multiple indicators.
Please provide data to support each indicator, and when applicable, provide disaggregated
data as well.
Baseline Target Next steps Turnaround Principle
Alignment
Goal 1 – TRCCA will have at least 92% student attendance for 2013-14 school year.
Student attendance 78.15% (based on FY 13)
92% Monthly problem solving on student attendance and truancy.
Use of data for continuous improvement
Family and community engagement
Goal 2 – TRCCA will have at least 90% staff attendance for 2013-14 school year.
Staff attendance 98% (based on FY 13)
90% Monthly progress monitoring of staff attendance.
Effective teachers
Strong leadership
Goal 3 – TRCCA will reduce Office Discipline Referral (ODR) rates by 10% from previous year.
Student discipline 2,000 ODRs per year
200 per month
10 ODRs/day/month
1,800 ODRs year
180 per month
9 ODRs/day/month
Monthly problem solving on ODR rates.
Data disaggregated by grade, location, time of day, event, and staff.
Safe and healthy students
Use of data for continuous improvement
Goal 4 – TRCCA will reduce rates of out-of-school suspension by 10% from previous year.
Student discipline 1827 events led to OSS (based on FY 13)
<10% (1644) Monthly problem solving on ODR resolutions.
Safe and healthy students
Use of data for continuous improvement

TRCCA - SBOE Monthly Performance Meeting – 05/31/2014 Page 4 of 12
School Goals as Stated in
School Improvement Plan
Key Performance Indicators
*May have multiple indicators.
Please provide data to support each indicator, and when applicable, provide disaggregated
data as well.
Baseline Target Next steps Turnaround Principle
Alignment
Goal 5 – TRCCA will reduce % of students who are under-credited by 10% from previous year.
Graduation rate 10th
– 67%
11th
– 52%
12th
– 56%
Will update in October as transcripts arrive.
10th
– 57%
11th
- 42%
12th
– 46%
Quarterly monitoring of on-track status of students in grades 7-10.
Use of data for continuous improvement
Redesigned schedules for additional time
Goal 6 – TRCCA will have a graduation rate of at least 73%.
Graduation rate 47% 73% On-line credit recovery
Quarterly monitoring of on-track status for students in grades 9 and 10.
Redesigned schedules for additional time
Rigorous and aligned instructional program
Goal 7 – TRCCA will have at least 65% of graduating seniors enroll in a vocational school or 2/4 yr. college or university.
Postsecondary transition
60% (36 out of 60 graduating seniors)
65% College site visits.
School counselor meets regularly with students on track for graduation to explore postsecondary options.
Rigorous and aligned instructional program
Family and community engagement

TRCCA - SBOE Monthly Performance Meeting – 05/31/2014 Page 5 of 12
School Goals as Stated in
School Improvement Plan
Key Performance Indicators
*May have multiple indicators.
Please provide data to support each indicator, and when applicable, provide disaggregated
data as well.
Baseline Target Next steps Turnaround Principle
Alignment
Goal 8 – TRCCA will increase the percent of students passing ISTEP by 5% from previous year.
Student achievement
Gary 2012
Grade 7 ELA – 14.3%
Grade 7 Math – 22.4%
Grade 8 ELA –23.8%
Grade 8 Math – 14.5%
TRCCA 2013
Grade 7 ELA – 28.6% (+14.3%)
Grade 7 Math – 19.7% (-2.7%)
Grade 7 SS – 20%
Grade 8 ELA – 29.6% (+5.8%)
Grade 8 Math – 23.6% (+9.1%)
Increase all ISTEP scores by 5%
Monthly benchmark assessments and problem solving on end of year standards.
Strong leadership
Effective teachers
Rigorous and aligned instructional program

TRCCA - SBOE Monthly Performance Meeting – 05/31/2014 Page 6 of 12
School Goals as Stated in
School Improvement Plan
Key Performance Indicators
*May have multiple indicators.
Please provide data to support each indicator, and when applicable, provide disaggregated
data as well.
Baseline Target Next steps Turnaround Principle
Alignment
Goal 9 – TRCCA will increase the percent of students passing ECA by 5% from previous year.
Student achievement
Gary School Corp 2012
Grade 9 Algebra I – 14.4%
Grade 10 Eng 10 –28.9%
TRCCA 2013 First time test takers)
Grade 9 Algebra I – 13.5%
Grade 10 Eng 10 – 23.8%
Increase both ECA scores by 5%
Monthly benchmark assessments and problem solving on end of year standards.
Strong leadership
Effective teachers
Rigorous and aligned instructional program
Goal 10 - TRCCA will increase percent of students passing AP tests by 10% from previous year.
Student achievement
0% 10% School offers 2 AP classes.
On-going PD for AP teachers.
Training for teachers identified to teach AP
Strong leadership
Effective teachers
Rigorous and aligned instructional program

TRCCA - SBOE Monthly Performance Meeting – 05/31/2014 Page 7 of 12
Core Question 2: Is your school providing appropriate conditions for success? *Common School Indicators
Indicator Date Data/Comments Challenges Successes Next steps Turnaround
Principle Alignment
Student Enrollment*
May 31, 2014 543 students are actively enrolled
These are active students
Student mobility a major issue in Gary.
Repeat pattern of students transferring without notifying school of transfer.
Schoolwide recruiting effort
School Attendance Officer
Monthly monitoring and problem solving of enrollment.
Launch Intent to return and enroll campaign to encourage early registration and engagement
Plan and implement Summer Robust Transitions and Credit Recovery Program
Use of data for continuous improvement
Family and community engagement

TRCCA - SBOE Monthly Performance Meeting – 05/31/2014 Page 8 of 12
Indicator Date Data/Comments Challenges Successes Next steps Turnaround Principle Alignment
Student Attendance*
May 31, 2014 ADA – 72.02%
56% mobility YTD
Enrolled – 3
Transfers – 6
Drops – 0
Other (explain):
Coordinating school and community resources.
Parent follow through with regular student attendance.
Parent contact information frequently changes.
Students come and go during the day (i.e., ditching classes and older students signing themselves out legally).
Tiered attendance intervention process.
Learning coaches review attendance with students 2x per week.
Grade-level problem solving meetings occur monthly.
On-going review of truancy referrals with Gary PD.
Continue monthly problem solving meetings.
On-going follow up with Gary PD on truancy referrals.
Continue to closely adhere to truancy referral procedures set forth by Gary PD.
Use of data for continuous improvement
Family and community engagement

TRCCA - SBOE Monthly Performance Meeting – 05/31/2014 Page 9 of 12
Indicator Date Data/Comments Challenges Successes Next steps Turnaround Principle Alignment
Student Suspensions*
May, 2014 Behavior: 119 incidents led to an OSS
Drugs: 0
Attendance: 0
Classroom disruption, defiance, and verbal aggression still accounted for most ODRs
TRCCA averaged 10.9 ODRs per day per month. Goal is 9.0 ODRs per day per month. TRCCA was at 17.5 ODRs per day per month in May 2013 (decrease of 6.6 ODRs per day per month).
Continue monthly data analysis and problem solving of ODR data for each grade.
Continue implementing lunch detention and school community service as an alternative to after-school detention in all academies.
Safe and healthy students
Use of data for continuous improvement
Student Expulsions* May, 2014 Behavior: 0
Drugs: 0
Attendance: 0
Other (explain): NA
NA TRCCA has an alternative education program for students in lieu of expulsion.
TRCCA has 11 students in Alternative Education as of April 30, 2014.
TRCCA also assigns community service projects in lieu of expulsion.
Continue to assign students to alternative education for expellable offenses as appropriate.
Safe and healthy students
*Please attach data reports for each of the categories listed above, include disaggregated data when possible.
TRCCA - SBOE Monthly Performance Meeting – 05/31/2014 Page 10 of 12
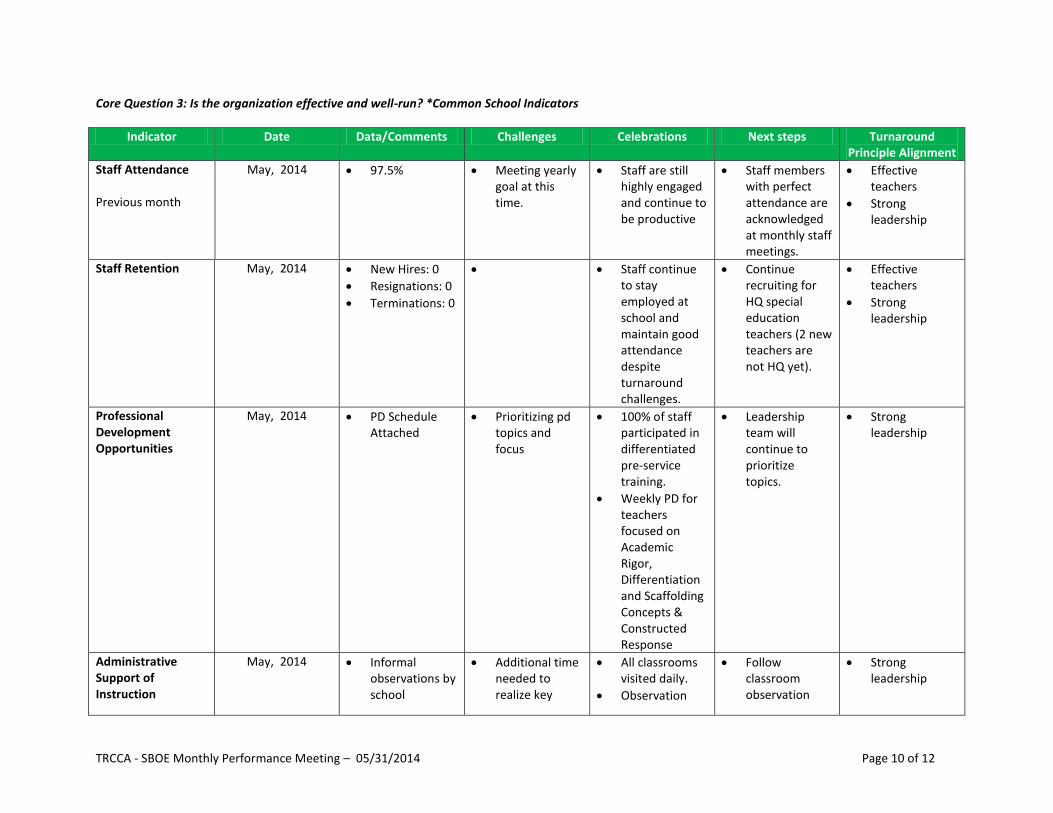
Core Question 3: Is the organization effective and well-run? *Common School Indicators
Indicator Date Data/Comments Challenges Celebrations Next steps Turnaround Principle Alignment
Staff Attendance Previous month
May, 2014 97.5% Meeting yearly goal at this time.
Staff are still highly engaged and continue to be productive
Staff members with perfect attendance are acknowledged at monthly staff meetings.
Effective teachers
Strong leadership
Staff Retention
May, 2014 New Hires: 0
Resignations: 0
Terminations: 0
Staff continue to stay employed at school and maintain good attendance despite turnaround challenges.
Continue recruiting for HQ special education teachers (2 new teachers are not HQ yet).
Effective teachers
Strong leadership
Professional Development Opportunities
May, 2014 PD Schedule Attached
Prioritizing pd topics and focus
100% of staff participated in differentiated pre-service training.
Weekly PD for teachers focused on Academic Rigor, Differentiation and Scaffolding Concepts & Constructed Response
Leadership team will continue to prioritize topics.
Strong leadership
Administrative Support of Instruction
May, 2014 Informal observations by school
Additional time needed to realize key
All classrooms visited daily.
Observation
Follow classroom observation
Strong leadership

TRCCA - SBOE Monthly Performance Meeting – 05/31/2014 Page 11 of 12
Indicator Date Data/Comments Challenges Celebrations Next steps Turnaround Principle Alignment
Time spent in Support of Instruction through
Professional Development/ Observation/
Collaboration/Evaluation
administrators: 17
Administrative team completes daily classroom visits and rounds (fewer observations this month due to standardized testing and graduation/end of year activities.
Administrators continue to meet with staff to provide real time feedback and coaching
learning from PD transferred into high quality instruction.
schedules are developed monthly.
schedule

TRCCA - SBOE Monthly Performance Meeting – 05/31/2014 Page 12 of 12
Core Question 4: Is the organization in sound fiscal health? TSO operators only
Date Comments Challenges Celebrations Next steps Turnaround Principle Alignment
Enrollment Variance
February Count Day Enrollment Variance
Financial Audit Findings

TRCCA - SBOE Monthly Performance Meeting – 06/30/2014 Page 1 of 13
Monthly Performance Report for Schools, Lead Partners and TSO Federal funds are designed to support school improvement plans that take a new, innovative and systemic approach to improving student
achievement and school quality. As a school or school partner working towards swift and sustainable improvement you are required to submit a monthly update to the IDOE Outreach Office for School Improvement and the State Board of Education.
The report is designed to meet the federal requirement for schools in priority and focus status as well as provide information that is based on school and student data.
The report template allows for personalization that matches the school improvement plan you have submitted but also forces the alignment of goals to research based Turnaround Principles from the USDoE (Core Question 1). The Turnaround Principles are classified into three domains:
Readiness to Learn, Readiness to Teach and Readiness to Act. Information on these three domains and association nine turnaround principles can be found on the IDOE website at www.doe.in.gov. Core Questions 2 & 3 also align to Turnaround Principles, and Core Question 4 is for TSO
operators only. Your regional outreach coordinator will be available to assist you on behalf of the IDOE as you complete this monthly report.
Please use the reference numbers (1-9) associated with the Turnaround Principles below in each response for Core Questions 1-4. Readiness to Learn
1. Strong Instructional Program: Implementation of instruction system that is research based, rigorous and aligned with State academic content standards
2. School Environment: Creation of a school climate that is safe and disciplined. 3. Supportive School Culture: System that supports students’ social, emotional and health needs that improves school safety and supports 4. Family & Community Involvement: School provides a mechanism for engaging family and community
TRCCA - SBOE Monthly Performance Meeting – 06/30/2014 Page 2 of 13
Readiness to Teach
5. Effective Teaching and Instruction: Creation of a system that supports teacher growth though multiple opportunities of professional development.
6. Data Informed Instruction: System that holds teachers and staff accountable for student achievement and allows for differentiated support for all students.
7. Data Driven Decision Making: System of collaboration exists that allows for consistent, on-going opportunities for staff to use data to inform instruction.
Readiness to Act 8. Strong Leadership: Ability to make mission-driven decisions about people, time, money and program.
9. Time: Redesign of the School Day, Week or year to allow for additional time for student learning and teacher collaboration
Directions for Report Completion and Submission Expectations: Please submit to Outreach Office for School Improvement by the third Friday of the Month September- June. Email delivery is preferred to [email protected] and [email protected]. If called upon to present at the State Board of Education meeting the data in this template should be accompanied by a power point representation of information. At a minimum you will be called upon to present at least once a year. Core Question 1: Is the educational program a success? This question allows for you to articulate each goal in the School Improvement Plan. The expectation is for data to accompany your communication “performance indicators.” The data when possible should be broken down into disaggregated student groups. This data will serve as evidence of the success towards each goal. Core Question 2: Is the school providing appropriate conditions for success? Data submitted with this core question may also be data used if aligned to a school goal around appropriate school conditions. Please indicate *see SIP goal #___” within column 1 if this is exists. Core Questions 3: Is the organization effective and well run? Data submitted with this core question may also be data used if aligned to a school goal around appropriate school conditions. Please indicate *see SIP goal #___” within column 1 if this is exists. Core Question 4: Is the organization in sound fiscal health? To be answered by TSO partners only

TRCCA - SBOE Monthly Performance Meeting – 06/30/2014 Page 3 of 13
Core Question 1: Is the educational program a success? *School Specific Indicators-these will be different for all schools and updated annually.
School Goals as Stated in
School Improvement Plan
Key Performance Indicators
*May have multiple indicators.
Please provide data to support each indicator, and when applicable, provide disaggregated
data as well.
Baseline Target Next steps Turnaround Principle
Alignment
Goal 1 – TRCCA will have at least 92% student attendance for 2013-14 school year.
Student attendance 78.15% (based on FY 13)
92% Monthly problem solving on student attendance and truancy.
Use of data for continuous improvement
Family and community engagement
Goal 2 – TRCCA will have at least 90% staff attendance for 2013-14 school year.
Staff attendance 98% (based on FY 13)
90% Monthly progress monitoring of staff attendance.
Effective teachers
Strong leadership
Goal 3 – TRCCA will reduce Office Discipline Referral (ODR) rates by 10% from previous year.
Student discipline 2,000 ODRs per year
200 per month
10 ODRs/day/month
1,800 ODRs year
180 per month
9 ODRs/day/month
Monthly problem solving on ODR rates.
Data disaggregated by grade, location, time of day, event, and staff.
Safe and healthy students
Use of data for continuous improvement
Goal 4 – TRCCA will reduce rates of out-of-school suspension by 10% from previous year.
Student discipline 1827 events led to OSS (based on FY 13)
<10% (1644) Monthly problem solving on ODR resolutions.
Safe and healthy students
Use of data for continuous improvement

TRCCA - SBOE Monthly Performance Meeting – 06/30/2014 Page 4 of 13
School Goals as Stated in
School Improvement Plan
Key Performance Indicators
*May have multiple indicators.
Please provide data to support each indicator, and when applicable, provide disaggregated
data as well.
Baseline Target Next steps Turnaround Principle
Alignment
Goal 5 – TRCCA will reduce % of students who are under-credited by 10% from previous year.
Graduation rate 10th
– 67%
11th
– 52%
12th
– 56%
Will update in October as transcripts arrive.
10th
– 57%
11th
- 42%
12th
– 46%
Quarterly monitoring of on-track status of students in grades 7-10.
Use of data for continuous improvement
Redesigned schedules for additional time
Goal 6 – TRCCA will have a graduation rate of at least 73%.
Graduation rate 47% 73% On-line credit recovery
Quarterly monitoring of on-track status for students in grades 9 and 10.
Redesigned schedules for additional time
Rigorous and aligned instructional program
Goal 7 – TRCCA will have at least 65% of graduating seniors enroll in a vocational school or 2/4 yr. college or university.
Postsecondary transition
60% (36 out of 60 graduating seniors)
65% College site visits.
School counselor meets regularly with students on track for graduation to explore postsecondary options.
Rigorous and aligned instructional program
Family and community engagement

TRCCA - SBOE Monthly Performance Meeting – 06/30/2014 Page 5 of 13
School Goals as Stated in
School Improvement Plan
Key Performance Indicators
*May have multiple indicators.
Please provide data to support each indicator, and when applicable, provide disaggregated
data as well.
Baseline Target Next steps Turnaround Principle
Alignment
Goal 8 – TRCCA will increase the percent of students passing ISTEP by 5% from previous year.
Student achievement
Gary 2012
Grade 7 ELA – 14.3%
Grade 7 Math – 22.4%
Grade 8 ELA –23.8%
Grade 8 Math – 14.5%
TRCCA 2013
Grade 7 ELA – 28.6% (+14.3%)
Grade 7 Math – 19.7% (-2.7%)
Grade 7 SS – 20%
Grade 8 ELA – 29.6% (+5.8%)
Grade 8 Math – 23.6% (+9.1%)
Increase all ISTEP scores by 5%
Monthly benchmark assessments and problem solving on end of year standards.
Strong leadership
Effective teachers
Rigorous and aligned instructional program

TRCCA - SBOE Monthly Performance Meeting – 06/30/2014 Page 6 of 13
School Goals as Stated in
School Improvement Plan
Key Performance Indicators
*May have multiple indicators.
Please provide data to support each indicator, and when applicable, provide disaggregated
data as well.
Baseline Target Next steps Turnaround Principle
Alignment
Goal 9 – TRCCA will increase the percent of students passing ECA by 5% from previous year.
Student achievement
Gary School Corp 2012
Grade 9 Algebra I – 14.4%
Grade 10 Eng 10 –28.9%
TRCCA 2013 First time test takers)
Grade 9 Algebra I – 13.5%
Grade 10 Eng 10 – 23.8%
Increase both ECA scores by 5%
Monthly benchmark assessments and problem solving on end of year standards.
Strong leadership
Effective teachers
Rigorous and aligned instructional program
Goal 10 - TRCCA will increase percent of students passing AP tests by 10% from previous year.
Student achievement
0% 10% School offers 2 AP classes.
On-going PD for AP teachers.
Training for teachers identified to teach AP
Strong leadership
Effective teachers
Rigorous and aligned instructional program

TRCCA - SBOE Monthly Performance Meeting – 06/30/2014 Page 7 of 13
Core Question 2: Is your school providing appropriate conditions for success? *Common School Indicators
Indicator Date Data/Comments Challenges Successes Next steps Turnaround
Principle Alignment
Student Enrollment*
June, 2014 543 students are actively enrolled
These are active students
Student mobility a major issue in Gary.
Repeat pattern of students transferring without notifying school of transfer.
Schoolwide recruiting effort
School Attendance Officer
Monthly monitoring and problem solving of enrollment.
Enrollment team will engage in an aggressive recruitment campaign and seek to retrieve Intent to Return and Enroll campaign to encourage early registration and engagement
Implement Summer Robust Transitions and Credit Recovery Program to attract students from the city of Gary and present additional educational opportunities
Use of data for continuous improvement
Family and community engagement

TRCCA - SBOE Monthly Performance Meeting – 06/30/2014 Page 8 of 13
Indicator Date Data/Comments Challenges Successes Next steps Turnaround Principle Alignment
Student Attendance*
June, 2014 ADA – 64.49%
56% mobility YTD
Enrolled – 0
Transfers – 0
Drops – 1
Other (explain):
Coordinating school and community resources.
Parent follow through with regular student attendance.
Parent contact information frequently changes.
Historically, TRCCA has maintained low attendance rates when the school year has been extended past May 31
st;
family priorities (i.e., traveling outside of Gary) has also been a prohibiting factor in high attendance beyond the school calendar year.
Tiered attendance intervention process.
Learning coaches review attendance with students 2x per week.
Grade-level problem solving meetings occur monthly.
Community engagement around the importance of making up instructional time due to unforeseen circumstances
Continue monthly problem solving meetings over the summer and during pre-service
Truancy officer will continue to take a proactive role in collaborating with the Gary PD on decreasing truancy and making any necessary truancy referrals in the next school year.
Continue to closely adhere to truancy referral procedures set forth by Gary PD.
Use of data for continuous improvement
Family and community engagement of returning students and new students matriculating from Gary Community Schools as a result of school closures in Gary.

TRCCA - SBOE Monthly Performance Meeting – 06/30/2014 Page 9 of 13
Indicator Date Data/Comments Challenges Successes Next steps Turnaround Principle Alignment
Student Suspensions*
June, 2014 Behavior: 0 incidents led to an OSS
Drugs: 0
Attendance: 0
None to report for June.
TRCCA was not in session in June in 2013 and therefore has no comparison data at this time
Continue monthly data analysis and problem solving of ODR data for each grade.
Safe and healthy students
Use of data for continuous improvement
Student Expulsions* June, 2014 Behavior: 0
Drugs: 0
Attendance: 0
Other (explain): NA
NA TRCCA has an alternative education program for students in lieu of expulsion.
TRCCA has 11 students in Alternative Education as of June 30, 2014.
TRCCA also assigns community service projects in lieu of expulsion.
Continue to assign students to alternative education for expellable offenses as appropriate.
Safe and healthy students
*Please attach data reports for each of the categories listed above, include disaggregated data when possible.

TRCCA - SBOE Monthly Performance Meeting – 06/30/2014 Page 10 of 13
Core Question 3: Is the organization effective and well-run? *Common School Indicators
Indicator Date Data/Comments Challenges Celebrations Next steps Turnaround Principle Alignment
Staff Attendance Previous month
June, 2014 93.8% Meeting yearly goal at this time of year especially following the issuance of non-renewal letters
Returning staff are still highly engaged and continue to be productive
Staff members with perfect attendance are acknowledged at monthly staff meetings.
Effective teachers
Strong leadership
Staff Retention
June, 2014 New Hires: 0
Resignations: 0
Terminations: 23
Budget – Lack of Funding to retain staff and lack of funding in the continuance of Turnaround Efforts (funding should at least be consistent for the first 3 years in a turnaround school according to research)
Staff who continue to stay employed at TRCCA maintain good attendance despite turnaround challenges.
Continue recruiting for HQ special education teachers.
Effective teachers
Strong leadership
Professional Development Opportunities
June, 2014 PD Schedule Attached
Prioritizing pd topics and focus for the upcoming school year according to year end data which is not official yet
100% of staff participated in differentiated pd through the end of May despite the myriad of end of year activities
Leadership team will continue to prioritize topics.
Strong leadership

TRCCA - SBOE Monthly Performance Meeting – 06/30/2014 Page 11 of 13
Indicator Date Data/Comments Challenges Celebrations Next steps Turnaround Principle Alignment
Teacher expressed that they felt prepared and confident in their ability to begin the new school year strong as a result of the hands-on pd around pedagogical strategies including the 5-Step Literacy Routine, Writing Constructed and Extended Responses, Academic Rigor, Differentiation and Scaffolding Concepts
Administrative Support of Instruction
Time spent in Support of Instruction through
Professional Development/ Observation/
Collaboration/Evaluation
June, 2014 Informal observations by school administrators: 17
Administrative team completes daily classroom visits and rounds
Additional time needed to realize key learning from PD transferred into high quality instruction.
All classrooms visited daily.
Observation schedules are developed monthly.
Follow classroom observation schedule
Strong leadership
TRCCA - SBOE Monthly Performance Meeting – 06/30/2014 Page 12 of 13
Indicator Date Data/Comments Challenges Celebrations Next steps Turnaround Principle Alignment
(fewer observations this month – 2 weeks of instructional time)
Administrators continue to meet with staff to provide real time feedback and coaching

TRCCA - SBOE Monthly Performance Meeting – 06/30/2014 Page 13 of 13
Core Question 4: Is the organization in sound fiscal health? TSO operators only
Date Comments Challenges Celebrations Next steps Turnaround Principle Alignment
Enrollment Variance
February Count Day Enrollment Variance
Financial Audit Findings