theme: project period: project group: …vbn.aau.dk/files/44515782/l7gtmb_2010_01_compl.pdf · ·...
TRANSCRIPT

Aalborg Universitet Institut for Samfundsudvikling og Planlægning Lautrupvang 2B 2750Ballerup
TITLE: WebGIS solution for Roskilde Festival
THEME: Geographic Services and Geovisualisation
PROJECT PERIOD:1. Semester. GeoinformationTechnology & Management
PROJECT GROUP:L7gtmb_2010-01 ABSTRACT:
GROUP MEMBERS:
___________________________________ Isaac NiiNoiTetteyfio(20053283) ___________________________________ Morten Klindt (20072983) ___________________________________ Simon Kamp Danielsen (20101027) SUPERVISORS:
Henning Sten Hansen Morten Fuglsang NUMBER OF DUPLICATES:6 NUMBER OF PAGES:Report: 105, Appendix: 24 ENCLOSURES:1 report, 1 appendix, 1CD containing code and an electronic copy of the report enclosed. COMPLETED:19/01 - 2011 Rapportens indhold er frit tilgængeligt, men offentliggørelse (med kildeangivelse) må kun ske efter aftale med forfatterne.
The project implements a WebGIS solu-tion for Roskilde Festival using their data and open source solutions. The preferred design and implementation of the system was analyzed. The theory is based on sys-tem design, spatial databases, web archi-tecture and web based GIS. The imple-mentation process involved client-server application framework, web mapping supporting cartographic rendering and basic GIS capabilities, storage solutions and additional tools extending the basic GIS capabilities. The implementation should be straightforward with the de-sign strategies, but we did not achieve all the desired results due to limitations of our programming skills and open source software. Therefore further development is required.

Preface This project is made on the 7th semester of the Master in Geoinformation Technology & Management, at
the Institut for Samfundsudvikling og planlægning on Aalborg University Copenhagen. By group
L7gtmb_2010-01. At semester start, the group consisted of four group members, but along the way a
group member decided to quit, so this resulted in a group consisting of three members.
The project theme is Geographic Services and Geovisualisation. The project was undertaken between the
08th September and the 19th January. Through the project, we worked with the different aspects of creating
a WebGIS solution for Roskilde Festival. These include creating a geospatial database and making it our
primary data provider for our web map portal and designed a system aimed to solve the Festivals needs.
The report is made based on the courses: Distributed GIS – Web Mapping Technology, Geographic System
Design, Geodata and Spatial Databases. The Course in Geographic System Design has unfortunately
postponed because of external factors, so it has not been part of the basis for the project.
January 2011
Isaac Nii Noi Tettefio, Morten Klindt and Simon Kamp Danielsen

L7gtmb_2010-01
WebGIS solution for
Roskilde Festival 7. semester project of GTM
Isaac Nii Noi Tetteyfio, Morten Klindt and Simon Kamp Danielsen
1/19/2011

WebGIS solution for Roskilde festival GTM Group 1 7. semester project, AAU
1
Table of Contents
1 Introduction ............................................................................................................................................... 5
1.1 Initiating problem description ........................................................................................................... 7
1.2 Problem statement ............................................................................................................................ 8
1.3 System basics ..................................................................................................................................... 9
1.3.1 Database Management System (DBMS) ................................................................................... 9
1.3.2 Mapping Engine ......................................................................................................................... 9
1.4 Requirement specification............................................................................................................... 11
2 Theory ...................................................................................................................................................... 12
2.1 System design strategies ................................................................................................................. 12
2.1.1 The Waterfall method ............................................................................................................. 12
2.1.2 Agile Methodology .................................................................................................................. 14
2.2 Representation of geographic data ................................................................................................. 16
2.2.1 Geographic Coordinate Systems ............................................................................................. 16
2.2.2 Projected Coordinate Systems ................................................................................................ 17
2.3 Spatial databases ............................................................................................................................. 19
2.3.1 Database management systems .............................................................................................. 19
2.3.2 Types of DBMS ......................................................................................................................... 20
2.4 FOT Danmark ................................................................................................................................... 23
2.5 Web architecture ............................................................................................................................. 26
2.5.1 HTML - Hypertext Markup Language ...................................................................................... 26
2.5.2 CSS – Cascading Style Sheets ................................................................................................... 27
2.5.3 XML - Extensible Markup Language ........................................................................................ 27
2.5.4 GML – Geography Markup Language ...................................................................................... 28
2.5.5 PHP – Hypertext Preprocessor ................................................................................................ 28
2.5.6 API - Application Programming Interfaces .............................................................................. 29
2.5.7 JavaScript ................................................................................................................................. 30
2.5.8 Client side technology ............................................................................................................. 31
2.5.9 Server side technology ............................................................................................................ 32
2.5.10 Hybrid strategies ...................................................................................................................... 34
2.6 Web based GIS ................................................................................................................................. 34
2.6.1 Opensource WebGIS ................................................................................................................ 36
2.6.2 WMS: Web Map Service .......................................................................................................... 36
2.6.3 WMS scripting.......................................................................................................................... 38

WebGIS solution for Roskilde festival GTM Group 1 7. semester project, AAU
2
2.6.4 WFS and Transactional WFS .................................................................................................... 40
2.7 Geovisualization and online cartography ........................................................................................ 43
2.7.1 The graphical variables in cartography .................................................................................... 43
2.7.2 Styling in GeoServer................................................................................................................. 45
3 Software .................................................................................................................................................. 46
3.1 ArcMap version 9.3.1....................................................................................................................... 46
3.2 Apache http server 2.2 .................................................................................................................... 46
3.3 FME - Feature Manipulation Engine ................................................................................................ 46
3.4 GeoExt 1.0 ....................................................................................................................................... 47
3.5 GeoServer 2.0.2 ............................................................................................................................... 47
3.6 OpenLayers 2.1 ................................................................................................................................ 48
3.7 PostGreSQL 8.4.4 ............................................................................................................................. 50
3.8 PostGIS 1.4.2 .................................................................................................................................... 51
4 Methodology ........................................................................................................................................... 52
4.1 Introduction ..................................................................................................................................... 52
4.2 Detailed system design .................................................................................................................... 52
4.3 Implementation plan ....................................................................................................................... 53
4.4 Data preparation ............................................................................................................................. 54
4.4.2 Data translation and conversion ............................................................................................. 55
4.4.3 Data acquisition ....................................................................................................................... 56
4.4.4 Shapefile structure .................................................................................................................. 56
4.4.5 Data conversion ....................................................................................................................... 56
4.5 Setting up GeoServer, PostgreSQL and PostGIS .............................................................................. 57
4.5.1 Installation and configuration of PostgreSQL and PostGIS ..................................................... 57
4.5.2 Setting up GeoServer ............................................................................................................... 59
4.6 Styling in GeoServer ........................................................................................................................ 62
4.7 User interface and HTML scripting .................................................................................................. 64
4.7.1 General .................................................................................................................................... 64
4.7.2 Colors and web design ............................................................................................................. 64
4.7.3 Design ...................................................................................................................................... 64
4.7.4 Content .................................................................................................................................... 65
4.7.5 Print functionality .................................................................................................................... 67
4.7.6 Logo ......................................................................................................................................... 67
4.8 Styling .............................................................................................................................................. 68

WebGIS solution for Roskilde festival GTM Group 1 7. semester project, AAU
3
4.9 The PHP forum ................................................................................................................................. 68
4.10 OpenLayers and GeoExt .................................................................................................................. 69
4.10.1 Programming the OpenLayers and its functionalities ............................................................. 70
4.11 Concluding system design ............................................................................................................... 75
5 Product description ................................................................................................................................. 76
5.1 Webpage .......................................................................................................................................... 76
5.1.1 Content .................................................................................................................................... 77
5.2 The Map window ............................................................................................................................. 78
5.2.1 FOT data................................................................................................................................... 78
5.2.2 Background map ...................................................................................................................... 78
5.3 The data groups ............................................................................................................................... 78
5.3.1 Camping ................................................................................................................................... 79
5.3.2 Emergency Management ........................................................................................................ 80
5.3.3 Merchants ................................................................................................................................ 81
5.3.4 Waste Management ................................................................................................................ 82
5.3.5 The PHP forum ......................................................................................................................... 83
5.4 OpenLayers functionalities .............................................................................................................. 83
5.4.1 Mouseposition, Scale and ScaleLine ........................................................................................ 83
5.4.2 LayerSwitcher .......................................................................................................................... 84
5.4.3 Overview Map ......................................................................................................................... 84
5.5 GeoExt functionalities ..................................................................................................................... 85
5.5.1 Draw ........................................................................................................................................ 85
5.5.2 Navigate ................................................................................................................................... 86
5.5.3 Print ......................................................................................................................................... 86
6 Discussion ................................................................................................................................................ 87
6.1 Project data ..................................................................................................................................... 87
6.2 The process of building a WebGIS ................................................................................................... 87
6.3 Implementations problems of WebGIS ........................................................................................... 89
6.3.1 Technical and performance problems ..................................................................................... 89
6.3.2 Coordinate system ................................................................................................................... 89
6.3.3 WFS-T ....................................................................................................................................... 91
6.3.4 Toolbar and Print functionalities ............................................................................................. 92
6.4 Opensource software ...................................................................................................................... 95
7 Perspectives ............................................................................................................................................. 96

WebGIS solution for Roskilde festival GTM Group 1 7. semester project, AAU
4
7.1 Further development of the product .............................................................................................. 96
7.1.1 General WMS ........................................................................................................................... 96
7.1.2 Functionalities of GeoExt ......................................................................................................... 97
7.1.3 WFS-T ....................................................................................................................................... 97
7.1.4 Data ......................................................................................................................................... 97
7.1.5 Ideas......................................................................................................................................... 97
7.2 The future of GIS.............................................................................................................................. 98
7.2.1 3D GIS ...................................................................................................................................... 99
8 Conclusion ............................................................................................................................................. 100
9 Bibliography ........................................................................................................................................... 101

WebGIS solution for Roskilde festival GTM Group 1 7. semester project, AAU
5
1 Introduction The evolution of Geographical Information Systems (GIS) has been very blistering over the past decades
from a have evolved from a uncommon profession to a technology that affects almost every aspect of our
daily lives, from the management of natural disasters to finding the best or the shortest routes to specific
destinations. Just in about a few years ago not so many people were involved with GIS work or application,
but today, almost everyone is using GIS. People can now create customized maps or overlay GIS data.
Until in recent times, the most practical way to use GIS in problem solving was to combine all the essential
requirements (data, software, etc.) in one location, and in most cases ones desktop computer. The devel-
opment of GIS has been highly influenced by the progress of and advancement in Information Technology
(IT). As a matter of fact, development of GIS technology has really mirrored the advancement of computer
technology (Peng & Tsou, 2003). This has affected GIS in three major areas: GIS data access, spatial infor-
mation dissemination, and GIS modeling / processing. It has evolved from a Mainframe GIS through Desk-
top GIS to Distributed GIS. In a Mainframe GIS, analysis functions and data are stored on the same equip-
ment and users access these facilities via terminals over Local Area Networks (LANs). Desktop GIS can ei-
ther be stand-alone where all the functions, user interface, and data are on stand-alone computer without
any data communication with other computers or network-based where data, applications and other re-
sources are shared within LANs or via Wide Area Networks (WANs). Figure 1 illustrates this.
Figure 1 The GIS evolution
Distributed GIS was made possible by the recent development of the internet and wireless data communi-
cation technologies. It refers to GIS programs working on the internet (Internet GIS) or wireless network
environment (mobile GIS). Distributed GIS relies on the internet and wireless networks for data and pro-
cessing communication. The mainframe GIS and the desktop GIS are traditionally referred to GIS systems
(Peng & Tsou, 2003)
Distributed GIS offer numerous advantages over the traditional GIS systems. Its platform and operating
system independent, as long as one has access to the internet, everyone could access and use Distributed

WebGIS solution for Roskilde festival GTM Group 1 7. semester project, AAU
6
GIS from everywhere since it is object oriented, distributed, and interoperable. End users do not necessarily
need to have GIS data and software installed locally on their computers because all the data and applica-
tions are available on the network servers which when requested by the user can be delivered on demand.
Today, most GIS applications are the combination of both Desktop GIS and Distributed GIS. These applica-
tions can either be open source or commercial. Open source means that the source code is available to the
general public for use, distribution, and modification from its original design free of charge whereas the
commercial applications have substantial price tags on their licenses. Open source has extensive tools and
libraries using synergies in order to avoid duplications. Some open source GIS applications rival the capabili-
ties of their commercial counterparts. Open Source GIS play an important role in adaptation of GIS tech-
nology in that, it stimulates new experimental approaches by providing access to GIS for the users who
cannot or do not want to use proprietary or commercial products. It has numerous freedoms such as run-
ning the program for any purpose, study how the program works, and adapt it to your needs, redistribute
copies, freedom to improve the program, and release your improvements to the public. Also the use of
open source tools implies the use of the corresponding open standards, such as those supported by the
Open Geospatial Consortium (OGC) (Camara & Onsrud, 2004)
In 2003, David Schell, then President of OGC and one of the 20 most influential innovators in the IT com-
munity according to the editors of CIO Magazine has this to say about open source GIS “It is most important
for us to realize the far reaching cultural impact of geospatial interoperability, in particular its influence on
the way we conceptualize the challenges of policy and management in the modern industrialized world.
Without such a capability, we would still be wasting most of our creative energies laboring in the dark ages
of time-consuming and laborious data conversion and hand-made application stove-pipes. Now it is possible
for scientists and thinkers in every field to focus their energies on problems of real intellectual merit, instead
of having to wrestle exhaustingly to reconcile the peculiarities of data imposed by diverse spatial constructs
and vendor limited software architectures. As our open interfaces make geospatial data and services dis-
coverable and accessible in the context of the World Wide Web, geospatial information becomes truly more
useful to more people and its potential for enabling progress and enlightenment in many domains of human
activity can be more fully realized”.(Longley, 2004)

WebGIS solution for Roskilde festival GTM Group 1 7. semester project, AAU
7
1.1 Initiating problem description Roskilde Festival is the largest North European culture and music festival and has existed since 1971. It is a
non-profit organization consisting of about 25 full-time employees and thousands of volunteers. Figure 2
shows the organization of the festival. The different sections (Trade, Information, Safety & Access, Site
planning etc. have different subsections not shown here (for instance is Map & Survey, which is the group
that produces maps and geodata at the festival, a part of “Site Planning”). Altogether there are a total of
approx. 35 subsections.
Figure 2 The Roskilde Festival Organization http://www.roskilde-festival.dk/uk/about_the_festival/organizational_structure/
Due to their different needs and to the fact that data being constantly updated, altered and removed, hun-
dreds or even thousands of different kinds of paper maps are printed every year by Map & Survey. Until
now, the conclusion on how to distribute maps was easily taken: There was no alternative to paper maps.
First of all, in the case of “worst case scenario” paper maps wins (and in cases where police and fire de-
partments are involved, it is necessary to work with “worst case scenarios”) secondly, the technology (both
the IT and the distributed GIS) was not matured enough at the given moment to create a satisfying solu-
tion. Today, as described in the introduction, the technology has matured and it´s now possible to do a
WebGIS solution as a supplement to the paper maps. Thirdly, people are getting used to GIS solutions in
their everyday lives – Google Maps, Google Earth, krak.dk etc. as examples. This also makes the use of a
distributed GIS solution easier from the end-users point of view. Other advantages are that the WebGIS
solution will be up to date, and will be easily distributed to the different departments. This should in the
end make the decision process less complicated, and hopefully create and support a good collaboration
between the different groups.
Figure 3 illustrates how data and maps are distributed currently using the existing solution.

WebGIS solution for Roskilde festival GTM Group 1 7. semester project, AAU
8
Figure 3 The organization and distribution regarding the different maps at the Roskilde Festival
Currently, the data is produced using surveying equipment’s and the maps are produced with a computer-
aided design (CAD) solution (Microstation).
1.2 Problem statement In this report we would like to test the possibilities of making a WebGIS-solution to Roskilde Festival. Creat-
ing a WebGIS for Roskilde Festival can ease the work routines of the GIS-department and the practical
groups of the festival, and it is therefore highly relevant for the festival to have a decent solution for their
data. Furthermore we would like to investigate the effects of working with opensource software.
Behind a major research question, we will investigate three minor questions:
How can a WebGIS solution for Roskilde Festival be implemented, and what are the limitations to
this solution?
o What is the process of designing a WebGIS solution?
o What are the technical challenges of creating a WebGIS system?
o How can open source software be used to create a web-mapping interface?
These problems are investigated by working with the development of a WebGIS solution based on dataset
from the Roskilde Festival and the official FOT data. One of the steps of data management is to setup a
webserver and a spatial database to store the data. In the developing process we must analyze practical
possible solutions, advantages and limitations with opensource software in a WebGIS development. After
this we must discuss the strategies of different WebGIS solutions such as WMS and WFS-T, and look into
different perspectives of WebGIS.
WebGIS solution for Roskilde festival GTM Group 1 7. semester project, AAU
9
1.3 System basics To fulfill the requirements of the project it is necessary to decide what software setup that will suit our
goals best. Since the Roskilde Festival is a non-profit organization it would be desirable if the solution could
be developed only using opensource software for the project.
So in order to create a spatial data infrastructure for the web mapping solution we need a spatial Database
Management System (DBMS), a Mapping Engine and a Client Interface. Additionally we might want to in-
clude a Web Feature Service (WFS) and Web Map Service (WMS).
1.3.1 Database Management System (DBMS)
There are currently two options for an opensource spatially enabled database: PostgreSQL with PostGIS
and MySQL. Of the two, PostgreSQL/PostGIS are most mature and feature rich. MySQL has just recently
added basic support for geometries. Although the MySQL implementation contains many of the OGC spa-
tial functions, not all of them are implemented according to the specification. This means that although
the function can be used, the result will be less accurate. MySQL has acceptable functionality if we want
to store spatial features in a database, but since we want to use the database to do spatial processing
and queries, PostgreSQL with PostGIS is the best choice. PostGIS also provides a complete and robust im-
plementation of the standard, along with additional features not in the specification (Sherman, 2004)
1.3.2 Mapping Engine
There are several open source mapping engines such as MapServer (C), GeoServer (Java), Mapnik (C), etc.
But the most commonly used mapping engines are MapServer and GeoServer. MapServer is one of the
most mature open source projects and also written in C programming language whileGeoServer is newer
development than MapServer, and written in Java programming language. The mapping engines have al-
most the same capabilities but differ in two ways. GeoServer’s configuration web-based graphical user in-
terface (GUI) is stored as xml whiles that of MapServer is a map/layer configuration text file. GeoServer
supports WFS-transactional capabilities for shared editing whiles MapServer do not(GeoServer, 2010).
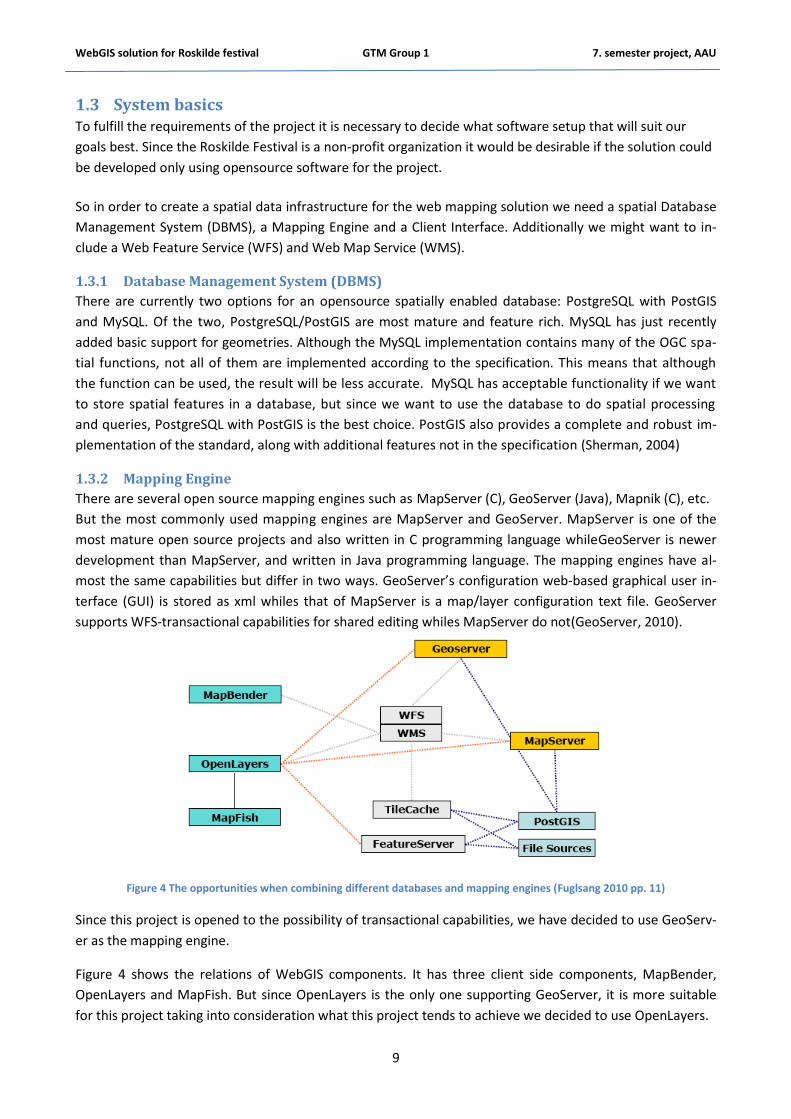
Figure 4 The opportunities when combining different databases and mapping engines (Fuglsang 2010 pp. 11)
Since this project is opened to the possibility of transactional capabilities, we have decided to use GeoServ-
er as the mapping engine.
Figure 4 shows the relations of WebGIS components. It has three client side components, MapBender,
OpenLayers and MapFish. But since OpenLayers is the only one supporting GeoServer, it is more suitable
for this project taking into consideration what this project tends to achieve we decided to use OpenLayers.
WebGIS solution for Roskilde festival GTM Group 1 7. semester project, AAU
10
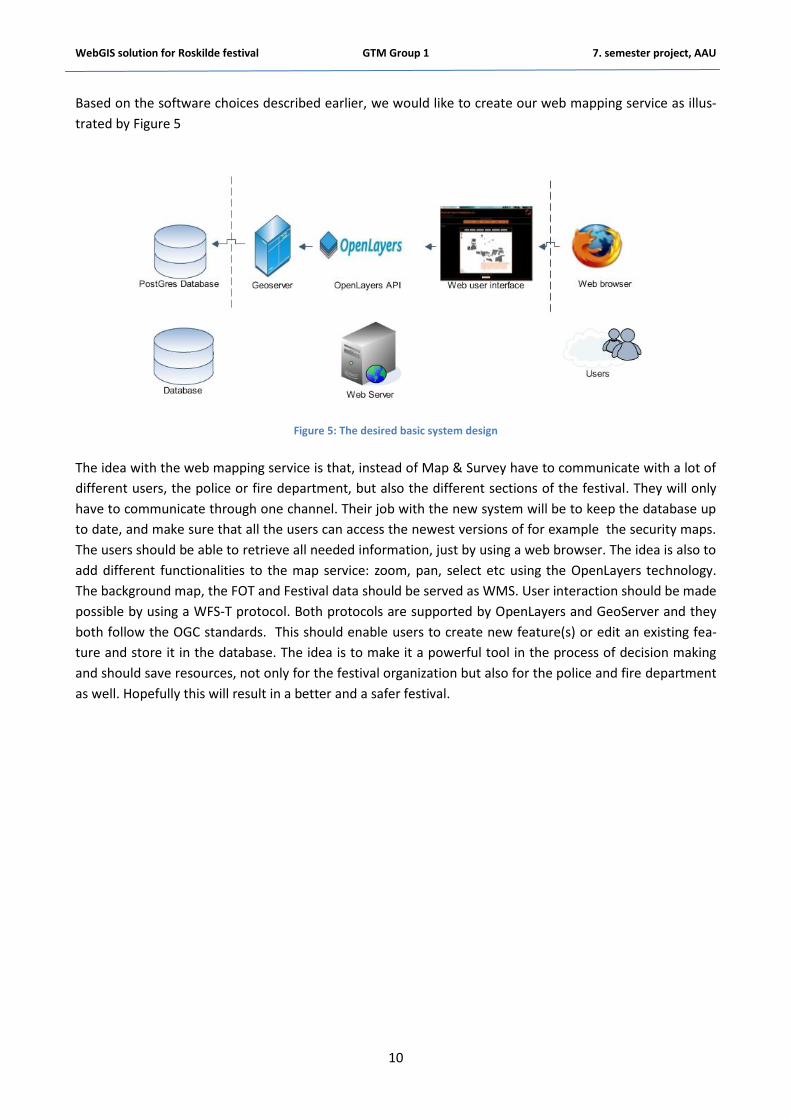
Based on the software choices described earlier, we would like to create our web mapping service as illus-
trated by Figure 5
Figure 5: The desired basic system design
The idea with the web mapping service is that, instead of Map & Survey have to communicate with a lot of
different users, the police or fire department, but also the different sections of the festival. They will only
have to communicate through one channel. Their job with the new system will be to keep the database up
to date, and make sure that all the users can access the newest versions of for example the security maps.
The users should be able to retrieve all needed information, just by using a web browser. The idea is also to
add different functionalities to the map service: zoom, pan, select etc using the OpenLayers technology.
The background map, the FOT and Festival data should be served as WMS. User interaction should be made
possible by using a WFS-T protocol. Both protocols are supported by OpenLayers and GeoServer and they
both follow the OGC standards. This should enable users to create new feature(s) or edit an existing fea-
ture and store it in the database. The idea is to make it a powerful tool in the process of decision making
and should save resources, not only for the festival organization but also for the police and fire department
as well. Hopefully this will result in a better and a safer festival.

WebGIS solution for Roskilde festival GTM Group 1 7. semester project, AAU
11
1.4 Requirement specification Before moving on with the actual system development, it is important to decide what requirements the
system should be able to fulfill.
The requirement specifications will comprise of: functional requirements, non-functional requirements
subdivided into; project limitations and solution targets. The three solutions targets are based on our esti-
mation of what is possible based on the functional requirements and the project limitations.
1.4.1.1 Functional requirements
The system must be able to host WMS and WFS/WFS-T service.
The web user interface must provide access to different theme maps.
The Map-service must have different functions, zoom, pan, coordinates
The user should be able to use the system independent of platform.
The user should be able to add features to the database and store them.
The user should be able to print out maps from the web user interface.
User forum
1.4.1.2 Non Functional requirements
Project limitations
Limited programming experience.
The use of opensource software.
Development phase is only five weeks.
Festival data was acquired from external source, and as such there is no data standard.
1.4.1.3 Solutions
1.4.1.3.1 Must have (Core product)
Spatial database
GeoServer
Web user interface
OpenLayers with WMS layers
OpenLayers functions: Zoom, Pan, coordinates
1.4.1.3.2 Should have
WFS-T services supporting create, edit and delete feature requests
OpenLayers functions: create edit and delete features
1.4.1.3.3 Could have
User forum
Print functionality
With the basic setup in place the system development can move into the phase. The different aspects of
the desired solution have to be investigated into detail to create the optimal solution.

WebGIS solution for Roskilde festival GTM Group 1 7. semester project, AAU
12
2 Theory In order to really understand Web GIS and how it will meet the needs of this project it is necessary to un-
derstand the concepts, theoretical aspects, and some basic components of Web GIS and that’s the main
objective of this chapter. It specifically deals with geographic data and spatial databases, web architecture,
and web based GIS. We go further to describe the various software used, their drawbacks and strengths.
2.1 System design strategies In this section two different system design approaches will be described. The two methods described have
different approach to system design. The waterfall model is sequential and the agile methodology is an
iterative process. Describing the different approaches will lead to some pros and cons for each strategy.
These pros and cons will be taken into consideration in the process of deciding development strategy.
2.1.1 The Waterfall method
The Waterfall model was introduced in the 70’s by Winston W. Royce, and was one of the first models to be
widely used by software companies. It is a sequential or a top down model, which divides the whole system
development into different parts and defines goals for each step. There are several steps in the Waterfall
model ass illustrated in Figure 6 (Buzzle A, 2010) and (Buzzle B, 2010).
Figure 6 Basic Waterfall model (http://commons.wikimedia.org/wiki/File:Waterfall_model.png)
None of the steps in the model can be executed simultaneously, the goals for each step must be 100% done
before moving on to the next one. After completion of a step, the process is documented.

WebGIS solution for Roskilde festival GTM Group 1 7. semester project, AAU
13
The steps in the model:
Requirements The developer and the client have to discuss all the possible requirements that the client wants the system
to fulfill. All the client’s requirements must further be validated as possible to incorporate in the system.
This step results in a requirement specification.
Design The requirement specification is studied into detail, to ensure that nothing goes unseen before doing the
coding for the software. Moving on, the system design is done to specify what hardware is needed, and
what the requirements are for the system. This step results in a system design specification.
Implementation The system design specification is used to start the work process. At this step, the system is divided, devel-
oped, and tested in a number of small units.
Verification All the units from the previous steps are tested together and integrated as one system. This phase also
tests if the system fulfills the requirement specification. If so, the product is delivered to the client.
Maintenance The last step of the Waterfall model is almost never ending, because when the system is put to practical
use and not just tested, the problems start showing up, and they will keep arising over time (Buzzle A,
2010) and (Buzzle B, 2010).
2.1.1.1 Pros and Cons – The Waterfall method
Pros - The linearity makes it simple and low cost to implement.
- A great advantage is that every stage brings documentation; this makes the designing phase easier
to understand.
- After every stage of programming, the code is tested to check if the code is running.
Cons - There is no turning back, if something in the requirement or design step went wrong. It can be
complicated to smooth out in the implementation step
- If the client you work for comes up with additional requirements to the software, it can cause a lot
of confusion. Additionally the environment can change also leading to new requirements.
- Changes made later in the completed software, can result in a lot of problems.
- The biggest drawback is that there is no working system until the final stage of the development is
over. So it is not possible for the client to make comment in the process, or even check if the sys-
tem meets the requirements (Buzzle C, 2010).
WebGIS solution for Roskilde festival GTM Group 1 7. semester project, AAU
14
2.1.2 Agile Methodology
The Agile methodology started its first development in the early 90’s, where lightweight methods like
scrum, extreme programming etc. was developed. But in 2001, 17 developers had a conference where the
agile methodology was born. Today the scrum and Extreme programming methods are also referred to as
Agile.
The Agile approach comprises of a Manifesto and 12 underlying principles.
The Manifesto:
We are uncovering better ways of developing software by doing it and helping others do it. Through this work we have
come to value:
Individuals and interactions over processes and tools
Working software over comprehensive documentation
Customer collaboration over contract negotiation
Responding to change over following a plan
That is, while there is value in the items on the right, we value the items on the left more.
(Agile Manifesto A,2001)
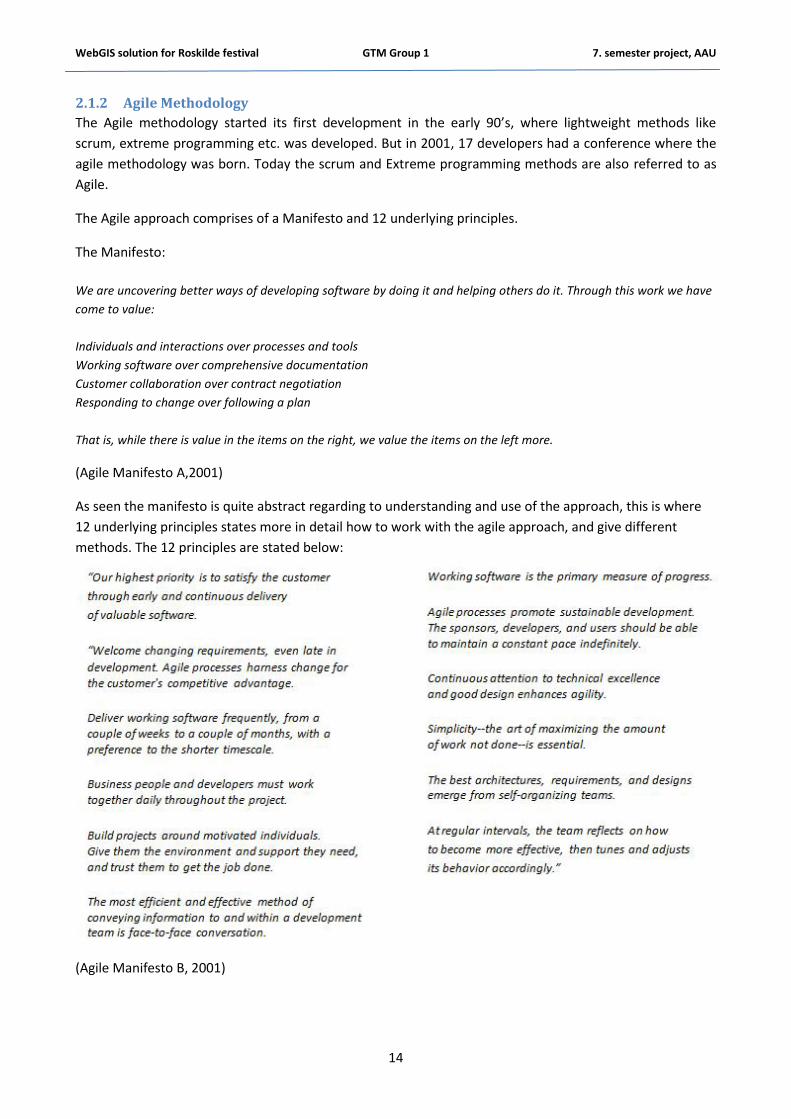
As seen the manifesto is quite abstract regarding to understanding and use of the approach, this is where
12 underlying principles states more in detail how to work with the agile approach, and give different
methods. The 12 principles are stated below:
(Agile Manifesto B, 2001)
WebGIS solution for Roskilde festival GTM Group 1 7. semester project, AAU
15
The agile approach should result in little planning at the beginning of the project, and it should deliver pro-
totypes of working software fast.
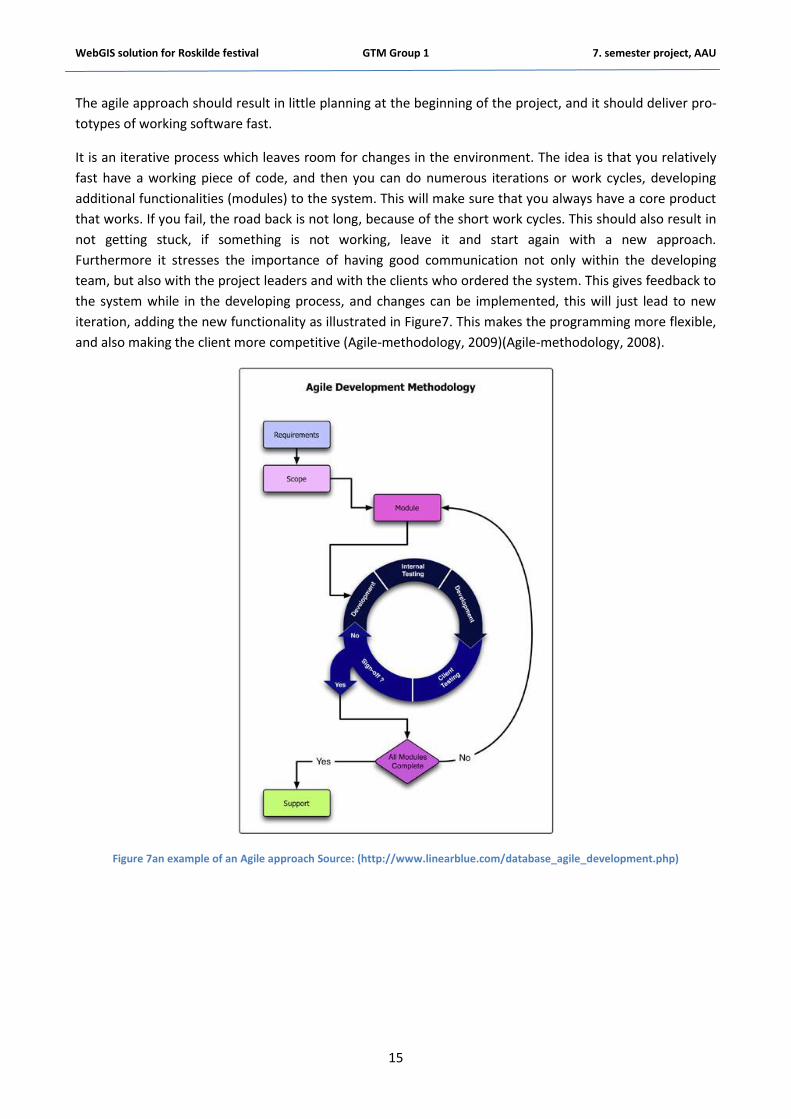
It is an iterative process which leaves room for changes in the environment. The idea is that you relatively
fast have a working piece of code, and then you can do numerous iterations or work cycles, developing
additional functionalities (modules) to the system. This will make sure that you always have a core product
that works. If you fail, the road back is not long, because of the short work cycles. This should also result in
not getting stuck, if something is not working, leave it and start again with a new approach.
Furthermore it stresses the importance of having good communication not only within the developing
team, but also with the project leaders and with the clients who ordered the system. This gives feedback to
the system while in the developing process, and changes can be implemented, this will just lead to new
iteration, adding the new functionality as illustrated in Figure7. This makes the programming more flexible,
and also making the client more competitive (Agile-methodology, 2009)(Agile-methodology, 2008).
Figure 7an example of an Agile approach Source: (http://www.linearblue.com/database_agile_development.php)
WebGIS solution for Roskilde festival GTM Group 1 7. semester project, AAU
16
2.1.2.1 Pros and Cons – The Agile methodology
Pros - Delivers value fast (fist iteration/work cycle can be demonstrated)
- High flexibility
- No significant rework
- Product is tested early, because of the short iterations
- Risk decreased by always having working software
- Good if end state is unknown
Cons - May lead to unrealistic expectations
- Not process orientated, which can lead to the lack of documentation
(Nuwave tech,2010), (Dale Olson Consulting,2009)
2.2 Representation of geographic data Geographic location is the element that distinguishes spatial information from any other kind of infor-
mation, so the specific method chosen to represent geographic location is imperative to the establishment
of practical GIS systems. One of the biggest benefits of GIS is location which means that different kinds of
information can be tied together provided they refer to the same geographic location. Distances and areas
can be also computed. Any data which has no location is referred to as a non-spatial and have no im-
portance within geographic information context. In GIS fundamental principles in order to analyzed data
accurately data layers must be aligned to each other spatially. If there is no alignment between the layers, a
common spatial reference system must be chosen.
In a spatial reference system, we specify projection, coordinate system, and datum. Locations of features
on the surface of the earth are based on geographic coordinates whereas most GIS applications data is
usually visualized on a plane surface with the map features representing spatial objects on the surface of
the earth. So in this case, the map features are based on a plane coordinate system which is usually ex-
pressed in x and y coordinates, whereas object located on the surface of the earth are based on geographic
coordinate system which usually expressed in longitude and latitude values. This is where map projections
become very important, to bridge the two types of coordinate systems. The principle of projections is to
transform spherical surface into a plane. Usually in most GIS projects the data acquired may have been
generated using different systems, therefore they may be required to be projected or reprojected before
being used together. In projection the data sets is converted from a geographic coordinates to a projected
coordinates where as in reprojection, there is a transformation from one projected coordinates to another.
In this section we discuss the various concepts of coordinate systems and projections. (Lab{vl} 2010)
2.2.1 Geographic Coordinate Systems
We represent geographic coordinates by using latitudes and longitudes on the earth surface. The reference
lines for the representation of geographic coordinates system are the Prime Meridian and Equator as
shown in fig 1d. Geographic coordinates notation is like that of plane coordinates with longitude as x and
latitude as y values. These coordinates can be either positive or negative with respect to the reference
lines. Longitude values measured in the eastern hemisphere are positive and negative in the western.
Latitude values are positive when measured north of the equator and negative to the south. Angular
measurements can also be expressed in degrees-minutes-seconds, or radians.
WebGIS solution for Roskilde festival GTM Group 1 7. semester project, AAU
17
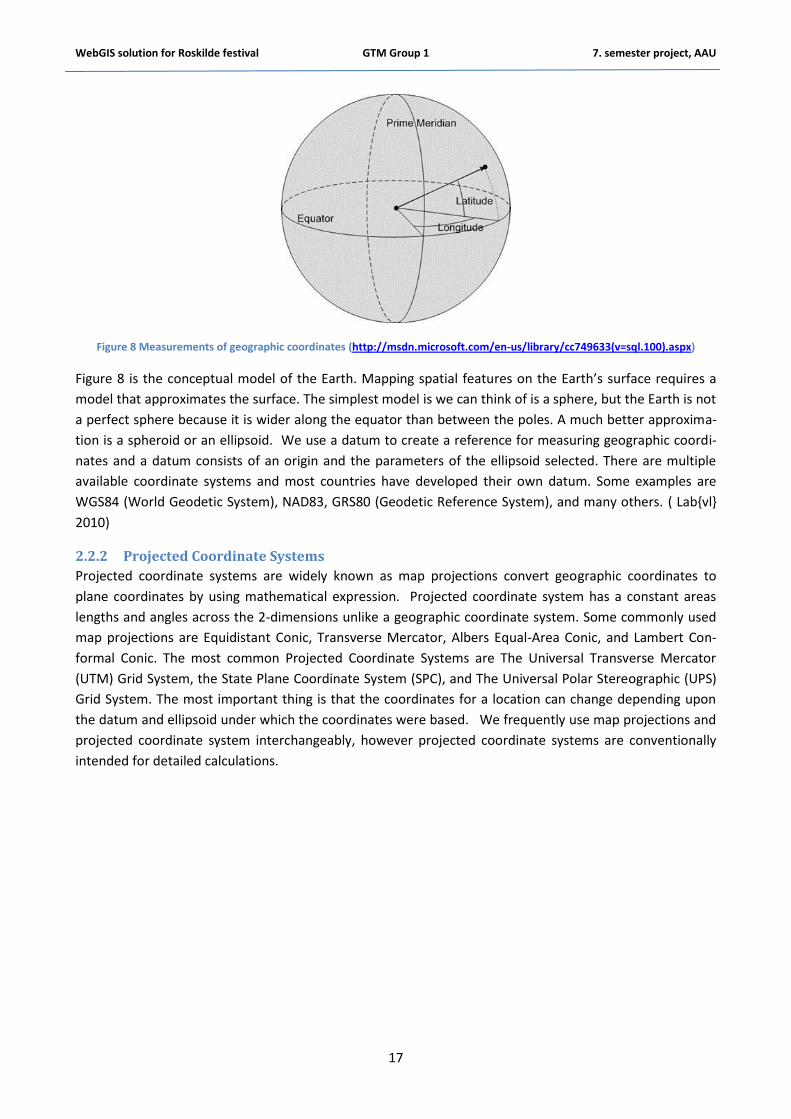
Figure 8 Measurements of geographic coordinates (http://msdn.microsoft.com/en-us/library/cc749633(v=sql.100).aspx)
Figure 8 is the conceptual model of the Earth. Mapping spatial features on the Earth’s surface requires a
model that approximates the surface. The simplest model is we can think of is a sphere, but the Earth is not
a perfect sphere because it is wider along the equator than between the poles. A much better approxima-
tion is a spheroid or an ellipsoid. We use a datum to create a reference for measuring geographic coordi-
nates and a datum consists of an origin and the parameters of the ellipsoid selected. There are multiple
available coordinate systems and most countries have developed their own datum. Some examples are
WGS84 (World Geodetic System), NAD83, GRS80 (Geodetic Reference System), and many others. ( Lab{vl}
2010)
2.2.2 Projected Coordinate Systems
Projected coordinate systems are widely known as map projections convert geographic coordinates to
plane coordinates by using mathematical expression. Projected coordinate system has a constant areas
lengths and angles across the 2-dimensions unlike a geographic coordinate system. Some commonly used
map projections are Equidistant Conic, Transverse Mercator, Albers Equal-Area Conic, and Lambert Con-
formal Conic. The most common Projected Coordinate Systems are The Universal Transverse Mercator
(UTM) Grid System, the State Plane Coordinate System (SPC), and The Universal Polar Stereographic (UPS)
Grid System. The most important thing is that the coordinates for a location can change depending upon
the datum and ellipsoid under which the coordinates were based. We frequently use map projections and
projected coordinate system interchangeably, however projected coordinate systems are conventionally
intended for detailed calculations.

WebGIS solution for Roskilde festival GTM Group 1 7. semester project, AAU
18
For GIS applications, it is essential to realize that each UTM zone is a different projection using a different
system of coordinates. If maps from different UTM zones are merged together to form a single map by
using only one UTM zone, some distortions may occur. To overcome the problem, a different coordinate
system should be used and the data re-projected. In the case of this project, this is not an issue since the
area of interest is very small and falls only within one UTM zone. Figure 9 shows the worlds UTM zones.
(Lab{vl} 2010)
Figure 9 World UTM zones. Source (http://www.utas.edu.au/spatial/locations/spautm.html)
2.2.2.1 European Petroleum Survey Group (EPSG) Geodetic Parameter Dataset
“The European Petroleum Survey Group (EPSG) has a huge set of predefined spatial references; each given a
unique ID. The EPSG geodetic parameter dataset is a structured repository of data required to
Identify coordinates such that those coordinates describe position unambiguously. This is through
a coordinate reference system (CRS) definition. It also defines transformations and conversions that allow
coordinates to be changed from one CRS to another CRS. Transformations and conversions are collectively
called coordinate operations.
The Geodetic Parameter Set contains a unique code for each coordinate system, as well as details about the
projection. EPSG tables define numeric identifiers (the EPSG code) for many common projections and associ-
ate projection or coordinate metadata (such as measurement units or central meridian) for each identifier.
The EPSG codes can be used to identify the CRS for coordinates used in dataset encoded in GML (Geography
Markup Language). They can also be used to request the desired map projection for a Web Map Ser-
vice (WMS) GetMap request”. (http://en.wikipedia.org/wiki/European_Petroleum_Survey_Group)
Projection specifications in GeoServer are defined in EPSG codes. If the data to be published in GeoServer
do not have the equivalent of its projected coordinates in EPSG code, then a custom EPSG code can be cre-
ated. Since the data used in the project has a well-defined EPSG code, discussing how to create custom
EPSG codes is therefore irrelevant in this project.
WebGIS solution for Roskilde festival GTM Group 1 7. semester project, AAU
19
2.3 Spatial databases Spatial databases are simply databases containing georeferenced data and they form an integral part of any
GIS project. This is because it influences GIS as a result of creation cost and maintenance. Spatial databases
also have an impact on analysis, modeling and decision making activities.
A Database Management System (DBMS) is a software program you use to create, maintain, modify, and
manipulate a database (Hernandez, 2003). Storing spatial data in a database have quite a number of ad-
vantages over a traditional way of storing files. Below are some of the advantages:
Because of the reduction in data duplication maintenance cost is greatly decreased duplica-
tion.
Because a database is meant to be accessed by large concurrent users, Using DBMS help to
better manage the system.
Security and standards for data and data access can be established and enforced.
Since multiple applications can use the same data set, applications become data independ-
ent and can evolve in a separate way over a time period.
Reduction in data redundancy as a result of storing data in one location.
One of the biggest benefits is the enforcement of standards and security.
As a result of data remaining constant in the system there is a transfer of user knowledge
between different applications.
Databases have disadvantages compared to the file system, some of these are
The initial cost of acquiring and maintaining DBMS software can be quite high.
In some cases for example in small projects, a DBMS can be quite complex in data man-
agement.
(Longley, 2004)
2.3.1 Database management systems
Small, simple databases that are used by a small number of people can be stored locally on a computer.
However, larger, more complex databases with many hundreds or thousands of users require specialist
DBMS software to ensure database integrity and longevity. DBMS provides a number of important capabili-
ties and some of these are:
• All DBMS include standard general-purpose core data models suitable for representing
several types of object. In most cases DBMS can be extended to support geographic object
types.
• A data load capability. DBMS provide tools to load data into databases. Simple tools are
available to load standard supported data types in well-structured formats. Other non-
standard data formats can be loaded by writing custom software programs that convert the
data into a structure that can be read by the standard loaders.
• Indexes. An index is a data structure used to speed up searching. All databases include
tools to index standard database data types.
• A query language. One of the major advantages of DBMS is that they support a standard
data query/manipulation language called SQL (Structured/Standard Query Language).

WebGIS solution for Roskilde festival GTM Group 1 7. semester project, AAU
20
• Security. A key characteristic of DBMS is that they provide controlled access to data. This
includes restricting user access to all or part of a database. For example, a casual GIS user
might have read-only access to just part of a database, but a specialist user might have read
and write (create, update, and delete) access to the entire database.
• Controlled update. Updates to databases are controlled through a transaction manager re-
sponsible for managing multi-user access and ensuring that updates affecting more than
one part of the database are coordinated.
• Application programming interfaces (APIs). Although most DBMS have good general-
purpose applications for standard use, most large, specialist applications will require fur-
ther customization using a commercial off-the-shelf programming language and a DBMS
programmable API.
As it can be seen from the above, almost all GIS database requirements fits perfectly into DBMS capabili-
ties so almost all GIS databases are based on DBMS technology. (Longley, 2004)
2.3.2 Types of DBMS
DBMS can be classified based on their way of data storage and manipulation. There are currently three
main types in GIS applications and these are relational (RDBMS), object (ODBMS), and object-relational
(ORDBMS).
A relational database stores data in relations which is perceived by the user as tables. Each relation is com-
posed of records and their attributes, or fields. The physical order of the records or fields in a table is irrele-
vant, and each record in the table can be identified by a field of a unique value. Users are not required to
know how the data is stored in the system in order to retrieve any data because in a relational database
data exist independently in manner it is physically stored in the system. A Relational Database Manage-
ment System (RDBMS) is a software program used for data creation, maintenance, modification, and ma-
nipulation in a relational database. This has amazingly proven to be very flexible and also useful in a lot of
application areas such that today over 95 % of the data in DBMS are stored in RDBMS (Longley, 2004)
Although RDBMSs is widely used today, its initial development was primarily for business applications and
they were never in any way designed to deal with rich data types such as geographic objects and other
multimedia applications. RDBMS has no support for processing spatial data which obviously limits their
adoption for GIS applications. In order to address these weaknesses, the object-oriented model was initially
developed. The object-oriented model displaces the relational database to a data store status by embody-
ing all the features an object-oriented programming language. The basic principles is that developers who
handle database can incorporate sets of operations which can be able to manipulate the data set stored in
the database from object-oriented programming perspective. The relational model has strong theoretical
background but that of the object- oriented database has no firm mathematical backing and in this way
there is no unanimous agreement to its description.

WebGIS solution for Roskilde festival GTM Group 1 7. semester project, AAU
21
In the relational model, there are various levels of relationships. These can be one-to-one, one-to-many,
and manyto-many.Figure 10 illustrates a model with the Roskilde festival as an example.
Figure 10 An example of entity relational diagram for the Roskilde Festival.
Establishing a relationship among table pairs can be achieved through corresponding values of the filed
being shared. ODBMS capabilities has now been integrated into RDBMS software systems to create hybrid
object-relational DBMS (ORDBMS) with its compositions being an RDBMS engine with an extension which
is capable of handling objects as well. (Longley, 2004)
In this project we can think of PostgreSQL as the RDBMS software with PostGIS taking advantage of Post-
greSQL’s extensibility to provide a solution for a solid spatial database. After the installation and configura-
tion of it quite not easy to ascertain where PostgreSQL ends and PostGIS.
In a relational database, data can be retrieved by using Structured Query Language (SQL). SQL is the stand-
ard language used to create, modify, maintain, and query relational databases. It has three fundamental
components of its query. These are SELECT…FROM statement, the WHERE clause, and the ORDER BY
clause. The SELECT clause is used to imply the fields one would like to query and the FROM clause is used
to also indicate which table(s) to get the fields from. After querying any database, the results acquired can
be given specific criteria for filtering if one or more fields are returned. This is done by using the WHERE
clause. The ORDER BY clause is used to sort queried results either in ascending order or the opposite.
WebGIS solution for Roskilde festival GTM Group 1 7. semester project, AAU
22
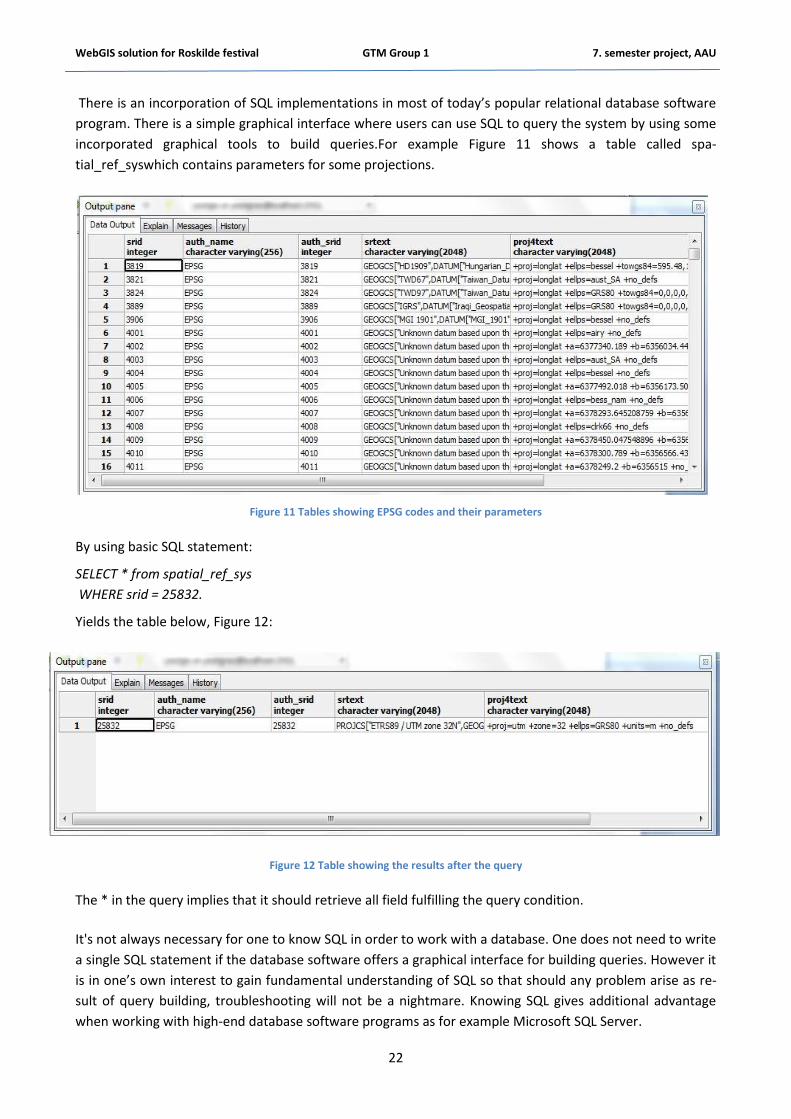
There is an incorporation of SQL implementations in most of today’s popular relational database software
program. There is a simple graphical interface where users can use SQL to query the system by using some
incorporated graphical tools to build queries.For example Figure 11 shows a table called spa-
tial_ref_syswhich contains parameters for some projections.
Figure 11 Tables showing EPSG codes and their parameters
By using basic SQL statement:
SELECT * from spatial_ref_sys
WHERE srid = 25832.
Yields the table below, Figure 12:
Figure 12 Table showing the results after the query
The * in the query implies that it should retrieve all field fulfilling the query condition.
It's not always necessary for one to know SQL in order to work with a database. One does not need to write
a single SQL statement if the database software offers a graphical interface for building queries. However it
is in one’s own interest to gain fundamental understanding of SQL so that should any problem arise as re-
sult of query building, troubleshooting will not be a nightmare. Knowing SQL gives additional advantage
when working with high-end database software programs as for example Microsoft SQL Server.
WebGIS solution for Roskilde festival GTM Group 1 7. semester project, AAU
23
2.4 FOT Danmark The FOT Danmark is a public project to create a concerted map and concerted technical data for the Danish
municipalities and the Danish state. At the moment only five Danish municipalities are not in the FOT DK
Corporation. The object of the FOT project is to create a geographical administration base for the digital
management in Denmark. All data will be stored centrally in the FOT2007 database. (www.fotdanmark.dk)
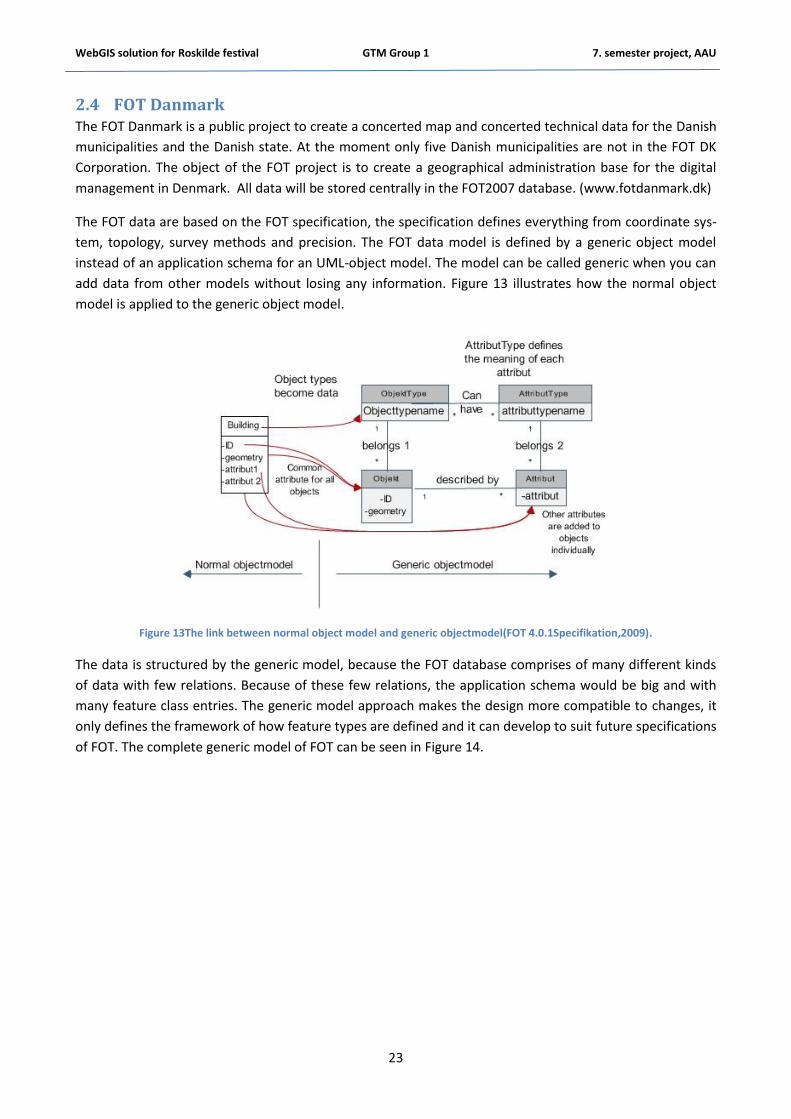
The FOT data are based on the FOT specification, the specification defines everything from coordinate sys-
tem, topology, survey methods and precision. The FOT data model is defined by a generic object model
instead of an application schema for an UML-object model. The model can be called generic when you can
add data from other models without losing any information. Figure 13 illustrates how the normal object
model is applied to the generic object model.
Figure 13The link between normal object model and generic objectmodel(FOT 4.0.1Specifikation,2009).
The data is structured by the generic model, because the FOT database comprises of many different kinds
of data with few relations. Because of these few relations, the application schema would be big and with
many feature class entries. The generic model approach makes the design more compatible to changes, it
only defines the framework of how feature types are defined and it can develop to suit future specifications
of FOT. The complete generic model of FOT can be seen in Figure 14.
WebGIS solution for Roskilde festival GTM Group 1 7. semester project, AAU
24
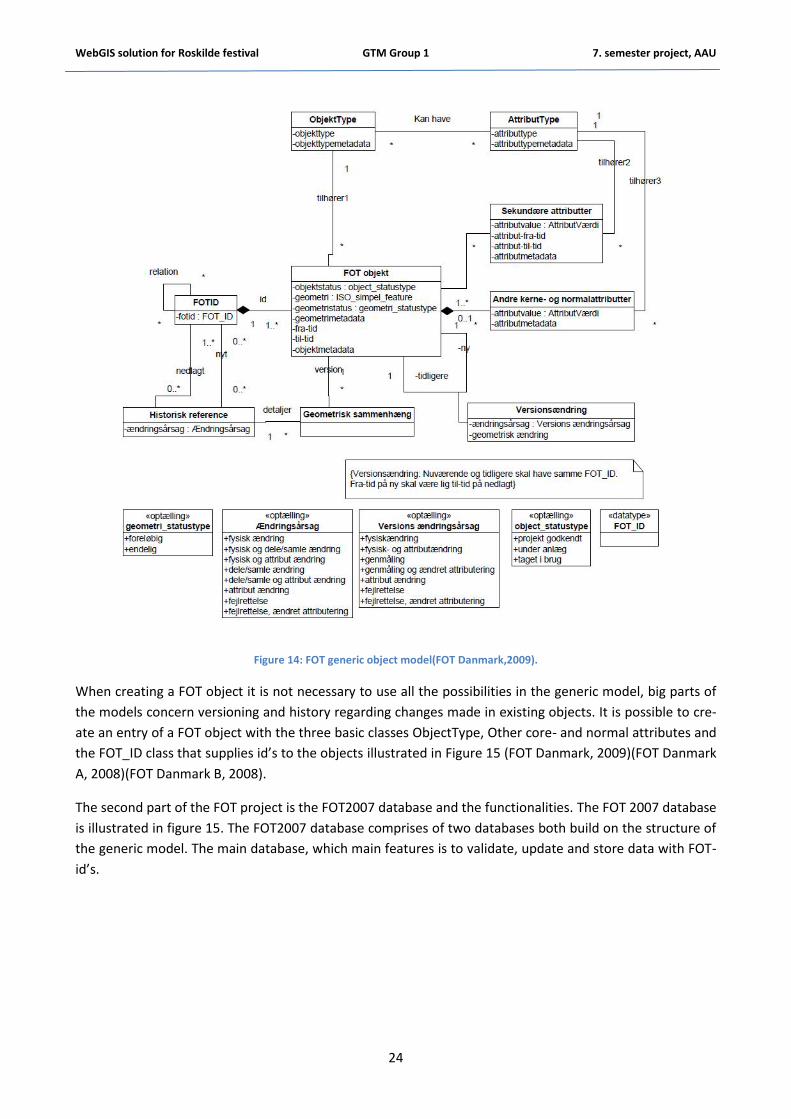
Figure 14: FOT generic object model(FOT Danmark,2009).
When creating a FOT object it is not necessary to use all the possibilities in the generic model, big parts of
the models concern versioning and history regarding changes made in existing objects. It is possible to cre-
ate an entry of a FOT object with the three basic classes ObjectType, Other core- and normal attributes and
the FOT_ID class that supplies id’s to the objects illustrated in Figure 15 (FOT Danmark, 2009)(FOT Danmark
A, 2008)(FOT Danmark B, 2008).
The second part of the FOT project is the FOT2007 database and the functionalities. The FOT 2007 database
is illustrated in figure 15. The FOT2007 database comprises of two databases both build on the structure of
the generic model. The main database, which main features is to validate, update and store data with FOT-
id’s.

WebGIS solution for Roskilde festival GTM Group 1 7. semester project, AAU
25
The communication between authorized users and the FOT2007 main database is possible in two different
ways. Either by the FOT UPLOAD, where you upload a complete GML file with the features you want to add.
The GML file must fulfill the certain standards to be validated and stored in the main database KMS (Kort&
Matrikelstyrelsen). KMS and FOT have developed their own GML application schema for the purpose. There
is also a tool that allows you to validate your file before uploading it. This is a quite smart feature; hence
the GML file can be relatively big.
Figure 15 The FOT2007 Database and it functionalities (FOT Danmark A,2008)(FOT Danmark B,2008).
The other type of functionality is feature editing, which can be done by using the FOT BROWSER? Here it is
possible to make smaller geometry changes or update attributes etc. When a feature has been updated,
the main database assigns a new timestamp but keeps the FOT id and stores the edited feature in the data-
base the old one is still saved in the database. This is also done in/with GML files. When adding new fea-
tures or updating, the main database will lock all other features within the polygon surrounding the fea-
tures being edited or uploaded. Outside this polygon, other data can be updated simultaneously.
The supply database is optimized for delivering data to users either as download, WFS (GML3) or WMS.
The two databases are separated to ensure a fast system response, and every time the main database is
updated, it instantly updates the supply server. The download function is like the WFS based on GML, but
the download can both deliver the data as GML2 and GML3-files. The GML2 is simpler, and supported by
more GIS systems, but you can only submit changes to features in the GML3 format. Otherwise it will fail
the validation when re-uploading it to the server (FOT Danmark A, 2008)(FOT Danmark B,2008).

WebGIS solution for Roskilde festival GTM Group 1 7. semester project, AAU
26
2.5 Web architecture
2.5.1 HTML - Hypertext Markup Language
The language is the instructions that tell a browser how to lay out information (text, images, etc.) in the
browser window. The language is a markup language, where you markup text in a document with tags to
give it a special meaning. In that way, you add the structure of the document, where the markup indicates
the different parts of the product. For example you can use an opening tag <html> and a closing tag
</html> with the content that the tag is applied to, in between them, and the slash is the only marker of
the closing of the tag (Duckett 2004) (Peng & Tsou 2003). Like a tree, each element is contained inside a
parent element, where each element can be specified by any number of attributes. An example of a HTML
structure is seen in Figure 16.
Figure 16 Example of the structure in HTML with opening and closing tags.
Document Structure:
<html> <head><title>My First Web Page</title></head> <body bgcolor="red"> <h1>This is a header </h1> <p>A Paragraph of Text</p> </body> </html>
This markup allows letting a web browser display the document in turns, because the script tells the web
browser how to display this structure. Important HTML Tags is:
<head></head>found at the beginning of an html document, and will contain information such as
the title, keywords, CSS and Java script information.
<body></body>the substance of your web page is found between these two tags, and contains the
information you actually can see.
<font></font> applies font type and size to text, and <b></b>-creates bold text and<i></i> italicize
it.
<ahref=“www.link.com”></a> makes a hyperlink to for example an email or webpage.
<p></p>paragraph
<br>line break(Peng & Tsou, 2003)
A HTML page allows the user to send a model (for example FORM) with data to the web server, in order to
be processed by a server-side application, which generates and sends a page in response. The client (user)
can send data to the server through the main interface elements:
WebGIS solution for Roskilde festival GTM Group 1 7. semester project, AAU
27
GET: the parameters are encoded in the URI
POST: the parameters are communicated through the HTTP message
ACTION: specifies the URI where data are processed (name of the server and location of the CGI
software)
Commonly used form elements: Text fields, Radio buttons, Checkboxes, Submit buttons. (Duckett, 2004)
(Peng & Tsou, 2003)
2.5.2 CSS – Cascading Style Sheets
The stylistic markup tags <style> are usually not enough to make a more advanced design. CSS is an extra
way to control the styling of a webpage. It is a separate language to styling-purposes where you specify
rules for the contents of the page, rather than editing attributes or elements. The language is implemented
within the page’s content, or is referred to in a separate document. Each CSS rules is made of a selector
which indicates which element to make rules for, and then declarations which indicates which properties to
change in an element (e.g. font, body, form etc.) – in the script this will be within the { }, and after the colon
is the declaration for a property and the value or setting for this. An example:
<head>
<style type="text/css">
h1 {font-size: 40px; font-family:Arial; color:#F36113}
A {font-size: 14px; font-family:Arial; text-decoration:none;}
table{font-size: 13px; font-family:Arial; color:#000000}
</style>
</head>
Here we decide which size and family we want for the font e.g. headers (h1), and which color the font
should have. This means that all elements on the pages within these opening and closing tag will apply the-
se properties – this language then makes a cascade of the properties applied, and we don’t have to do the
same styling again and again in the script. The CSS can appear two places in the HTML script; inside the
<head> as the above example or as styles attributes on any element that can carry style attributes. An ex-
ample:
<table border="3" width="50%" style="font-color:black;background-color:#F36113;">
When having large sites with different styling it is more common and manageable to have a separate styling
sheet which the page will link to. This link is done with the usual href functionality. (e.g. <a
href=“www.link.com”></a> ). Other advantages of this can be the eased change of the appearance of sev-
eral sites, or that the rules only have to be written once. (Duckett 2004)
2.5.3 XML - Extensible Markup Language
With binary encodings, users and programmers must spend many hours reading and understanding docu-
mentation. XML “documents” are self-documenting, where people can read and understand the data. XML
is a kind of umbrella language for all kinds of elements (such as GML), which you can use to create your
own language – for example the new versions of HTML is rewritten in XML. The different languages written
in XML is very similar, the largest changes is what attributes the elements in the languages can carry and
the order of them. XML is used for many different purposes, e.g. displaying graphical information or writing
complex mathematical formula or e.g. purchase economical orders between businesses.
An XML-document can contain markup from more than one language, so it is important to distinguish be-
tween each element and what language they belong to. New types of documents can be created by com-

WebGIS solution for Roskilde festival GTM Group 1 7. semester project, AAU
28
bining parts of different languages, known as hybrid document types. These languages have extended pos-
sibilities of form and modules to implement.
Processing applications such as browsers need to know to which language an element belongs to, and
therefore each language is defined by a namespace. A namespace is an URI (Uniform Resource Identifier),
which acts a unique identifier for the language. It only tells the program that the elements and attributes in
this document belong to that namespace, and they won’t be mistaken to be elements from another lan-
guage. The namespace is declared as the root element of a document, which indicates that it is the default
namespace for the document and that all elements in the document belong to the specified namespace.
However if another namespace is defined in elements inside the document it will belong to those elements,
unless there is even more specific rules. An example of an XML-document with a namespace can be:
<html xmlns="http://www.namespace.org""> <head>
<title>An XML site</title> </head> <body> </body> </html>
(Duckett,2004)
2.5.4 GML – Geography Markup Language
GML is a modeling and encoding language for geographic information, and supports spatial and non-spatial
properties of objects. The OGC Implementation Specification is from April 2004 (3.1). ISO DIS 19136 is from
October 2005 (3.2), which implements concepts of the ISO 19100 series. GML is designed for the web and
web-based services which is based on XML technologies. The structure is defined as XML Schema, as a ge-
ometry model with fixed tags. GML is open and vendor-neutral, and enables vendor neutral exchange of
spatial data. It is extensible and supports the definition of profiles (proper subsets) of the full GML capabili-
ties. GML is not a presentation language for data display. To display GML data a program need to interpret
the GML and style it with a styling engine. This styling allow the user to have unlimited design possibilities
to the provider of the data(Kraak, 2004).
2.5.5 PHP – Hypertext Preprocessor
We have as well represented a PHP site with a forum in our project. PHP is a robust general purpose object-
oriented server side programming language, especially suited for doing dynamic webpages in HTML and
web development. PHP is used in three main areas:
Server side scripting. This is the main target of PHP, which works by having a CGI (Common Gate-
way Interface (server module)) a webserver and a web browser. You can access the server output
(the page) with the browser.
Command line scripting. Runs PHP with a parser, and is usually used for scheduling or simple text
processing.
Writing desktop applications. It is possible to make applications with a graphical interface
(PHP group, 2011)
We focus on the server side scripting.
PHP language is very simple for newcomers, and offers many advanced features for experienced program-
mers. It is open source and has a very open form of technology, which has a very broad community where

WebGIS solution for Roskilde festival GTM Group 1 7. semester project, AAU
29
developers share their code. PHP is a matured language and therefore very easy to combine with a wide
range of web programming languages such as AJAX and Java, furthermore it connects very well with a wide
range of databases, servers and countless protocol services. This combination makes the language strong,
because they can supplement and merge each other’s functionalities. E.g. a JavaScript can have some cal-
endar functionality, where the PHP is usable to make that query on the server for e.g. a date, with its serv-
er-side functionality (Babin, 2007) (PHP group 2011).
We won’t go into the explanation of a PHP script, because it is out the bounds of this project, but an exam-
ple of a PHP script could look like:
<!DOCTYPE HTML PUBLIC "-//W3C//DTD HTML 4.01 Transitional//EN"
"http://www.w3.org/TR/html4/loose.dtd">
<html>
<head>
<title>Example</title>
</head><
<body>
<?php echo "Hi, I'm a PHP script!";?>
</body>
</html>
(PHP group, 2011)
In this piece of script it can be noticed that the PHP contains some HTML code, and that the PHP is enclosed
in the <?php which allow to jump in and out of PHP. What separates the code from client-side scripting
(e.g. JavaScript) is that it is executed on the server, so the HTML is processed on the server, and no user can
see what code is behind (PHP group 2011). The output doesn’t have to be HTML, but can also be auto gen-
erated images, PDF’s, XML’s or even Flash movies. The language has as well very good possibilities when
entering terms in a form on a webpage, which can be directly presented on a new page which will contain
what you have entered. E.g. the making of subjects to, or posting in a forum; or when adding groceries to
your shopping basket when doing online shopping. The key aspect here is a content management system,
which updates a page without having to create a new page for each new post or information. The infor-
mation is based on relational databases, where the attributes are stored in tables. Instead of requesting a
specific page, the viewItem.asp is requested in the URI e.g. like:
http://www.printerspost.com.au/app/classifieds/viewItem.asp?ID=5269(Duckett, 2004)
The interesting part is the viewItem.asp, which is referring to table ID number 5269 in the database, which
is a template created in the database where it is possible to create the required attributes without having
to modify the page each time. (Duckett, 2004)
2.5.6 API - Application Programming Interfaces
The API is a defined interface between the user-interface and the applications needed – e.g. between
OpenLayers and the webpage. It connects applications with the client requests. The API is a language and
message format used by an application program (e.g. OpenLayers) to make access to an application on the
DBMS or communications protocol by the requests send from the client. It is triggered by some kind of
action (e.g. click button, pan, hit a key, submit a form) on the webpage or in an application, and is totally
defined by the user (Duckett, 2004)
The API is a major part of programming writing due to the important quick access andcommunication be-
tween the functions and a DBMS. Software without an API has very short terms and possibilities. The API’s

WebGIS solution for Roskilde festival GTM Group 1 7. semester project, AAU
30
are implemented by writing function calls in the program which provide the links requested when execut-
ed. The developers include calls in the code of their application, where they give access to open applica-
tions on the DBMS. When operating with opensource, the code of the API is exposed and therefore offers
high flexibility for subsequent development or rationalization. When this is the case a good API is character-
ized by:
Easy to understand and read (names matter)
Documented
Easy to learn
Simple functionality and straight requirements
Powerful
Easy accessible
Good design coincides good performance
(Bloch)
This makes it easy to extend - and this creates users (customers). The opposite of this is the Windows API
which is secret and undocumented (Orenstein, 2000)
API for Web pages is known as the DOM – Document Object Model. The DOM is a standard for API’s that
defines what properties and methods of a document that can be accessed and exchanged between applica-
tion and web browser. En example can be that a JavaScript ensures that you enter appropriate values for a
form; then the JavaScript does the calculations and the DOM explains how to access the request in the da-
tabase (Duckett, 2004).
2.5.7 JavaScript
Java language can achieve all manner of tasks from writing new elements into documents to practical appli-
cation calculations to visual effects on the page. The script is very useful for applica-
tions and client (user) server actions. The language is used to enable programmatic
access to objects within both client applications and other applications (see Figure 17).
Since OpenLayers uses JavaScript, knowledge of java code construction is required.
However, usually it’s enough just to modify existing code. Java needs to be enabled in
the browser, so one need to bear in mind that users not necessarily have java - either
the java application should be an enhancement of the page, or there should be relevant information to the
installation of java (Duckett 2004) (Peng & Tsou, 2003).
Figure 17: Java grants access to data to be displayed in the browser.
WebGIS solution for Roskilde festival GTM Group 1 7. semester project, AAU
31
2.5.7.1 JavaScript basics
Java is a light scripting language, which is primarily used in the form of client-side JavaScript, implemented
as an integrated component of the web browser, allowing the development of enhanced features and user
interfaces for dynamic websites. The code consists of objects, each of which have properties and methods
which perform actions. Different objects have many different properties. Code sits between <script>in
HTML documents. For example:
<script language=”javascript”>
var k = here is some code;
document.write(“Some javascript”)
</script>
In the sentence: document.write(“Some javascript”), we access the document object, and here the JavaS-
cript use the write() property, to write text into the document. If we put in a parameter in the write proper-
ty, we can make a statement by combining two properties into one result. This can be edited by arithmetic
(+-*/) or comparison (<>=) operators as well. Finally we can write the attribute (the text) in the code. We
have also declared a variable k, in the code. This is used to store some information, e.g. numbers, strings or
references to objects. One can perform calculations on the data held by the variable within the code. Fur-
thermore the scripts elements are case-sensitive, even to capitalized letters, and (,{,*,’ and “-symbols must
always have a closing symbol during the script. The placement of commas and semicolons also has a high
sensitiveness; this is necessary to control the activity of the applications or elements.
To execute HTML documents with links to scripts inside, we need a webserver, for example Apache (Duck-
ett, 2004).
2.5.8 Client side technology
The client is the place for users to interact with data and services in Internet GIS. A simple client is built on
HTML and Forms. Interactive clients include dynamic HTML and client-side applications which are built on
framework as Java Applets and ActiveX controls. The applications work with the script of the webpage
through the API.
You distinguish between the thin and thick client. The thin client has little or no processing at the client side
and is only used for user interface - most processing is performed on the server. The thick client where
most processing is performed at the client side and the server usually sends data to the client. Executable
Java code is downloadable from the server and executed on the client at runtime. They are executed when
a user connects to the page and invokes the HTML document containing a reference to the Java applet
which is send from the server when requested, as an answer to request from the client (Peng & Tsou,
2003) (Duckett, 2004).
2.5.8.1 Client Side Strategies
Client-side applications attempt to shift some of the work of processing requests to the user's computer
(the thick client) and allow the users to perform some data manipulation and analysis locally. Instead of
making the server do most of the work, some of the GIS capabilities are downloaded to the client, or reside
there, and data is processed locally. Example illustrated in Figure 18.
Client Side strategies have diverse advantages:
Applications take advantage of the processing power of the user's own computer
The user can be given greater control of the data analysis process.
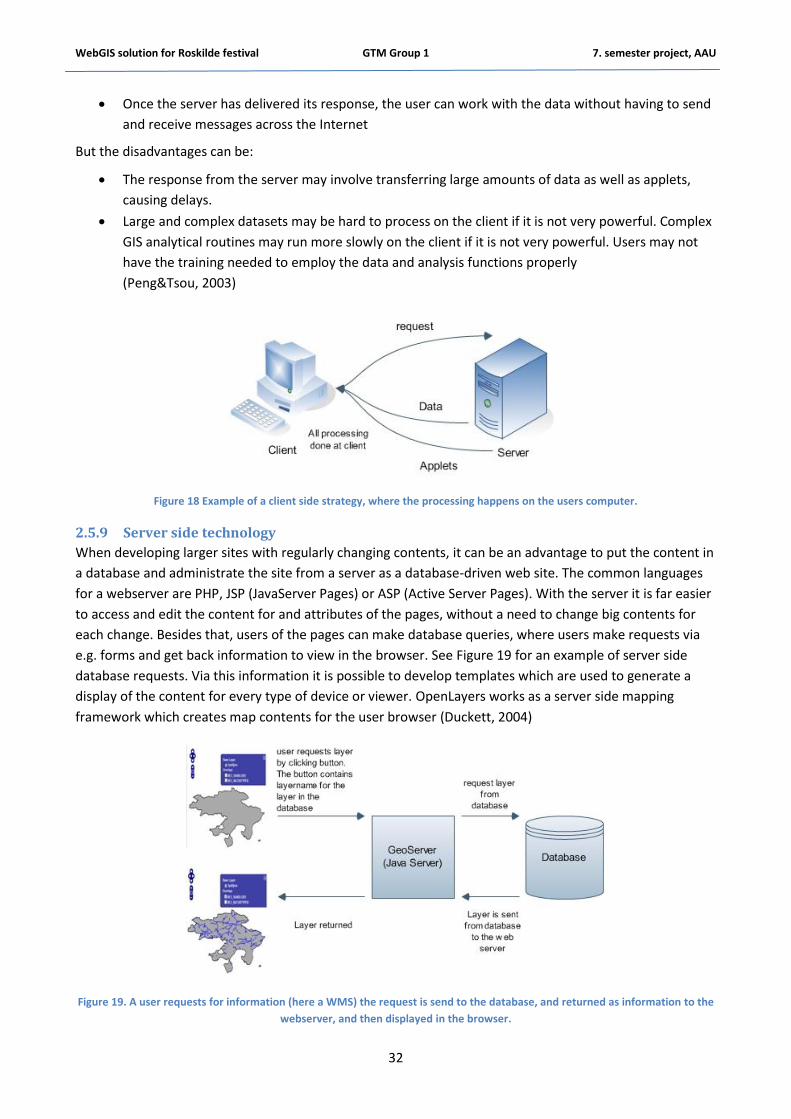
WebGIS solution for Roskilde festival GTM Group 1 7. semester project, AAU
32
Once the server has delivered its response, the user can work with the data without having to send
and receive messages across the Internet
But the disadvantages can be:
The response from the server may involve transferring large amounts of data as well as applets,
causing delays.
Large and complex datasets may be hard to process on the client if it is not very powerful. Complex
GIS analytical routines may run more slowly on the client if it is not very powerful. Users may not
have the training needed to employ the data and analysis functions properly
(Peng&Tsou, 2003)
Figure 18 Example of a client side strategy, where the processing happens on the users computer.
2.5.9 Server side technology
When developing larger sites with regularly changing contents, it can be an advantage to put the content in
a database and administrate the site from a server as a database-driven web site. The common languages
for a webserver are PHP, JSP (JavaServer Pages) or ASP (Active Server Pages). With the server it is far easier
to access and edit the content for and attributes of the pages, without a need to change big contents for
each change. Besides that, users of the pages can make database queries, where users make requests via
e.g. forms and get back information to view in the browser. See Figure 19 for an example of server side
database requests. Via this information it is possible to develop templates which are used to generate a
display of the content for every type of device or viewer. OpenLayers works as a server side mapping
framework which creates map contents for the user browser (Duckett, 2004)
Figure 19. A user requests for information (here a WMS) the request is send to the database, and returned as information to the
webserver, and then displayed in the browser.
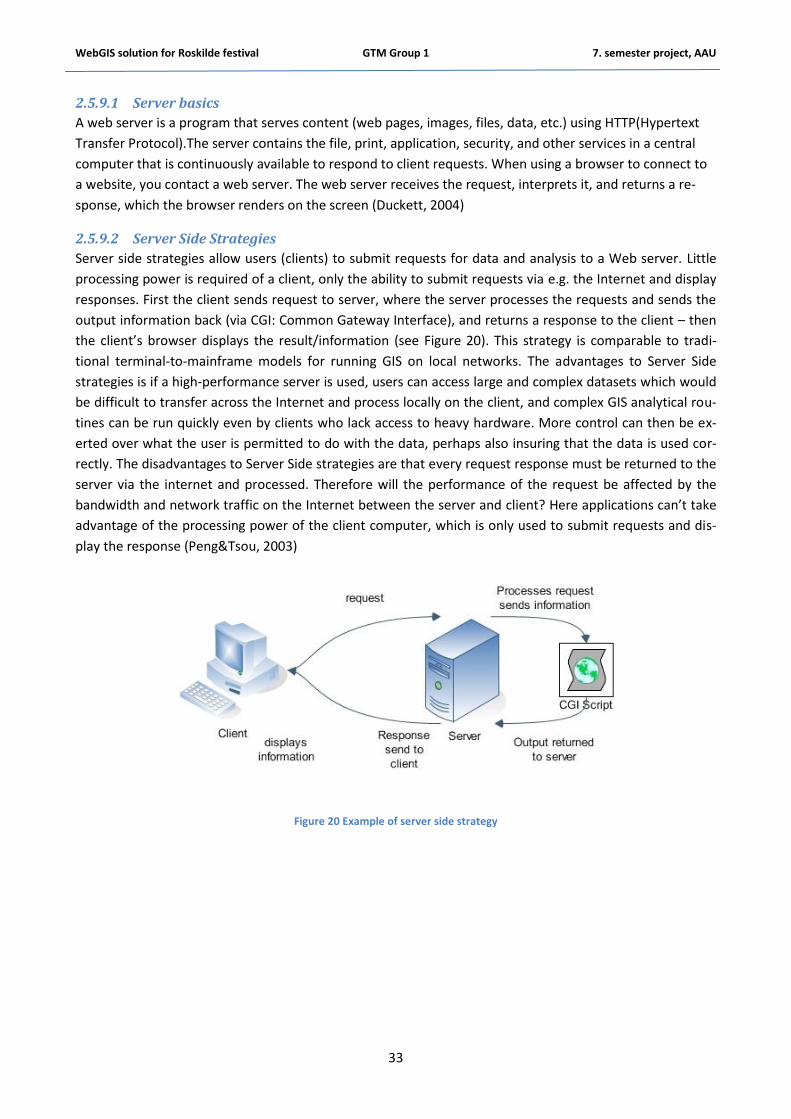
WebGIS solution for Roskilde festival GTM Group 1 7. semester project, AAU
33
2.5.9.1 Server basics
A web server is a program that serves content (web pages, images, files, data, etc.) using HTTP(Hypertext
Transfer Protocol).The server contains the file, print, application, security, and other services in a central
computer that is continuously available to respond to client requests. When using a browser to connect to
a website, you contact a web server. The web server receives the request, interprets it, and returns a re-
sponse, which the browser renders on the screen (Duckett, 2004)
2.5.9.2 Server Side Strategies
Server side strategies allow users (clients) to submit requests for data and analysis to a Web server. Little
processing power is required of a client, only the ability to submit requests via e.g. the Internet and display
responses. First the client sends request to server, where the server processes the requests and sends the
output information back (via CGI: Common Gateway Interface), and returns a response to the client – then
the client’s browser displays the result/information (see Figure 20). This strategy is comparable to tradi-
tional terminal-to-mainframe models for running GIS on local networks. The advantages to Server Side
strategies is if a high-performance server is used, users can access large and complex datasets which would
be difficult to transfer across the Internet and process locally on the client, and complex GIS analytical rou-
tines can be run quickly even by clients who lack access to heavy hardware. More control can then be ex-
erted over what the user is permitted to do with the data, perhaps also insuring that the data is used cor-
rectly. The disadvantages to Server Side strategies are that every request response must be returned to the
server via the internet and processed. Therefore will the performance of the request be affected by the
bandwidth and network traffic on the Internet between the server and client? Here applications can’t take
advantage of the processing power of the client computer, which is only used to submit requests and dis-
play the response (Peng&Tsou, 2003)
Figure 20 Example of server side strategy

WebGIS solution for Roskilde festival GTM Group 1 7. semester project, AAU
34
2.5.10 Hybrid strategies
Server and client processes can be combined in hybrid strategies that optimize performance and meet spe-
cial user needs. The Hybrid strategy builds on continuing client server communication throughout the
whole process. So client and server must be connected by with high bandwidth to make the strategy suc-
cessful. See Figure 21.
Figure 21 Example of a hybrid strategy, where the processing Is shared with interaction between client and server.
2.6 Web based GIS WebGIS holds the potential to make distributed geographic information available to a wide range of audi-
ence. Internet users are able to access GIS applications from their browsers without purchasing proprietary
software. Map services allow GIS applications to access data layers without hosting them locally. The users
of the map service will also have access to the latest updates, because the data is administered at one place
(the server). Often other services like open access to filtered feature data to be sent to the client for user
manipulation like www.miljoeportalen.dk is a popular form of WebGIS.
WebGIS has employed three strategies (as seen in the above section): Server-side, Client-side and hybrid
strategies. In a client/server network arrangement the network services are located in a dedicated comput-
er whose only function is to respond to the requests of clients. The other components in WebGIS are con-
sists of the Web (HTTP) server and the Application server:
The Web server can:
Send ready-made map images to the client.
Send applets (JavaScript program) to the client.
Pass requests to CGI programs for further processing.
The application server’s tasks:
Manage connection between Web server and Map server.
Interpreting requests and pass the to the Map server.
Handle transaction and security.
The challenges of WebGIS lies in creating software systems that are platform independent and that any
computer connected to the internet must be capable of accessing through a web browser (Peng & Tsou,
2003).
The Map server is a major component in Internet GIS by fulfilling spatial queries, performing spatial analy-
sis, and generating and delivering maps to the client. A map service has two primary functions: Represent a
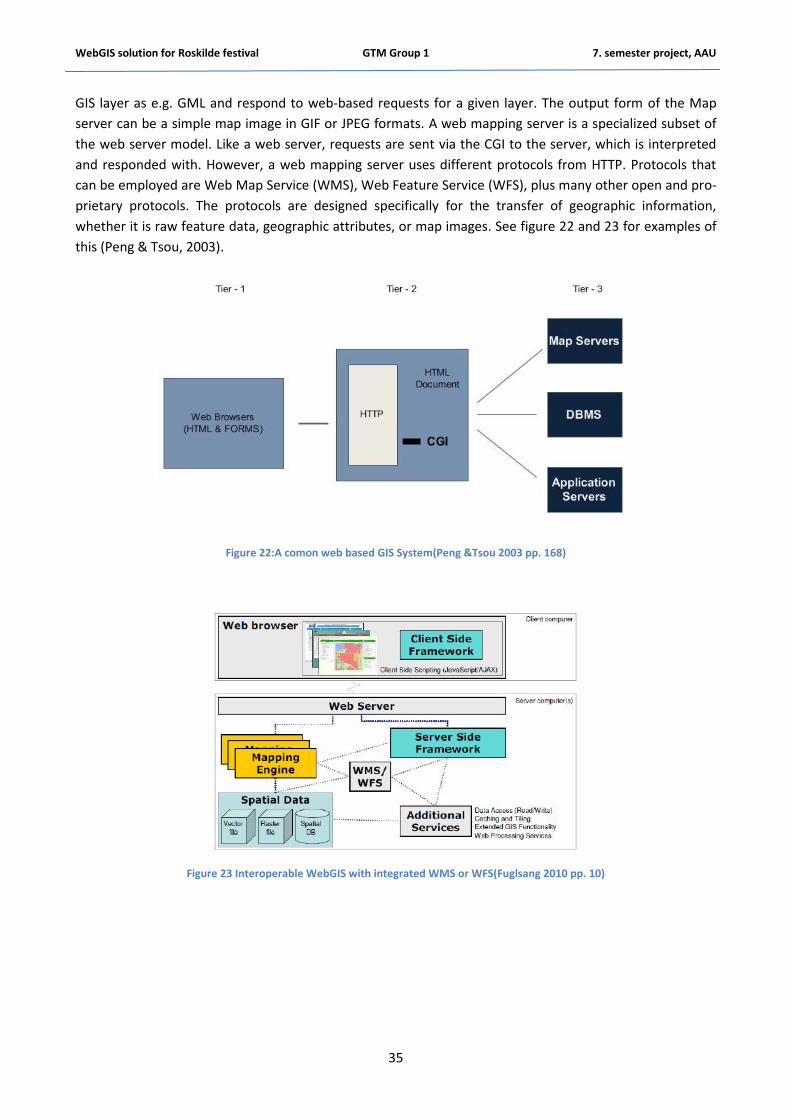
WebGIS solution for Roskilde festival GTM Group 1 7. semester project, AAU
35
GIS layer as e.g. GML and respond to web-based requests for a given layer. The output form of the Map
server can be a simple map image in GIF or JPEG formats. A web mapping server is a specialized subset of
the web server model. Like a web server, requests are sent via the CGI to the server, which is interpreted
and responded with. However, a web mapping server uses different protocols from HTTP. Protocols that
can be employed are Web Map Service (WMS), Web Feature Service (WFS), plus many other open and pro-
prietary protocols. The protocols are designed specifically for the transfer of geographic information,
whether it is raw feature data, geographic attributes, or map images. See figure 22 and 23 for examples of
this (Peng & Tsou, 2003).
Figure 22:A comon web based GIS System(Peng &Tsou 2003 pp. 168)
Figure 23 Interoperable WebGIS with integrated WMS or WFS(Fuglsang 2010 pp. 10)

WebGIS solution for Roskilde festival GTM Group 1 7. semester project, AAU
36
2.6.1 Opensource WebGIS
Opensource WebGIS focuses mostly on the server side applications. Users can access large and complex
datasets that would be difficult to transfer over the internet and present them locally. Complex GIS analyti-
cal routines can be performed quickly even by thin clients (Peng & Tsou 2003).Common Web mapping
components are seen in Figure 24.
Figure 24 The connection between different Opensource components (Fuglsang, M. 2010 pp. 11)
The Opensource applications are characterized by being open code free to access and free to use and ma-
nipulate as desired.
2.6.2 WMS: Web Map Service
The purpose of WMS is to serve geographic data rendered as images (being maps as e.g. JPEG format) but
with no actual data values. But the streamed data is geospatially referenced. WMS has:
Advantages: As the image files are small, a geographic area can be streamed quickly. The maps can
be easy integrated in a webpage.
Disadvantages: The data is good for viewing, but it is only an image so it cannot be used for analysis
like GIS vector data.
WMS builds on a server-side and client-side. When the mapserver receives a request from the client, it
sends back an image which is returned to the client. Web-mapping therefore has two approaches:
Static (maps are stored as static images). A static map refers to embedding maps as graphic images
inside an HTML page.
Dynamic (access to dynamic GIS databases). Interactive maps, where there is possibility to choose
the section, styling or specific layers.(Peng & Tsou, 2003)
To be able to use the WMS, the user need a WMS-client, which simply can be a browser with some JavaS-
cript. All information is generated at the server, and therefore the user will receive standardized services
(see Figure 25). The WMS client can use several services at the same time, e.g. when using a background
map behind some specific layers picked from another mapserver (E.g. OpenLayers having a KMS back-
ground map behind).
In the WMS you distinguish between the thin and the thick client as in the client side strategies. The thin
client collects one or several maps from the mapserver to one map image. The thick client collects maps
from several servers and collects them direct at the client. In our project we use both the layers processed
through the localhost server in OpenLayers, and combine them with maps from the KMS server as back-
ground images. When having a thick client the requirements for the client (e.g. the web browser) are high-
er, where e.g. applications (e.g. Java) can be needed to have possibilities to turn layers on and off, or choos-
ing a level of transparency (Peng & Tsou 2003).

WebGIS solution for Roskilde festival GTM Group 1 7. semester project, AAU
37
Figure 25 Example of a WMS request where a map image is rendered (Fuglsang, M. 2010 pp. 22).
2.6.2.1 WMS and OGC standards
WMS has a matured and well-established specification, and the first version 1.0 was issued in 2000 by OGC
(Open GIS Consortium). OGC is administering this standard, and try to make it an ISO-standard. They are
working to make standards and integrate web geoprocessing and locations services with standard technol-
ogies like XML and HTTP. This can ease a flexible system integration and system development (Nørmølle et.
al.).OGC defines the terms and definitions of the WMS in their implementation specification:
“Client: software component that can invoke an operation from a server
Coordinate reference system: Coordinate system that is related to the real world by a datum [ISO 19111]
Coordinate system: set of mathematical rules for specifying how coordinates are to be assigned to points [ISO 19111]
Geographic information: Information concerning phenomena implicitly or explicitly associated with a location relative to the Earth [ISO 19101]
Interface: Named set of operations that characterize the behavior of an entity [ISO 19119]
Layer: Basic unit of geographic information that may be requested as a map from a server
Map: Portrayal of geographic information as a digital image file suitable for display on a computer screen
Operation: Specification of a transformation or query that an object may be called to execute [ISO 19119]
Portrayal: presentation of information to humans [ISO 19117]
Request: Invocation of an operation by a client
Response: Result of an operation returned from a server to a client
Server: a particular instance of a service
Service: Distinct part of the functionality that is provided by an entity through interfaces [ISO 14252]
Service metadata: Metadata describing the operations and geographic information available at a
server”
(Beaujardiere,2006, pp. 7-8)
WebGIS solution for Roskilde festival GTM Group 1 7. semester project, AAU
38
2.6.3 WMS scripting
WMS has three important basic calls: GetCapabilities, GetMap and GetFeatureInfo.
2.6.3.1 GetCapabilities
Allows the server to describe what services and parameters the WMS can provide. This is:
Available layers.
Supported output projections.
Supported output formats.
Scale hints.
Extent of the data.
The service is returned as metadata in an XML format, which contains a description of the given WMS ser-
vices, available data. Since the WMS can be a part of an OGC Web Service it is necessary to state what ser-
vice the call is made of , and therefore the Service=WMSstring must occur in the call.
A call could look like:
http://planforsyningen.dk/scripts/mapserv.pl?service=wms&REQUEST=GetCapabilities&VERSION=1.1.0
This will return several pages of XML script, with theinformation listed above, available layers etc.
(Nørmølle et al)
2.6.3.2 GetMap
This call allows the retrieval of a map from a web server, and it is the most common call. Server responds
with an image which typically can be a web-ready format like gif, png, tiff . The call is dependent of the
requested parameters supplied by the user e.g.
VERSION=version: The WMS version.
REQUEST=GetMap: The type of call.
LAYERS=layer_list : Comma separated file which determines what layers to show.
SRS=namespace:identifier : Comma separated file which determines how to show the layers.
BBOX=minx,miny,maxx,maxy : The map extent, given in SRS (Spatial Reference System) coordi-
nates.
WIDTH=output_width : The pixel width of the map.
HEIGHT=output_height : The pixel height of the map.
FORMAT=output_format : Bitmap format like JPEG, GIF etc..
STYLE=style : Usually this is set to default.
A GetMap request can look like this:
http://planforsyningen.dk/scripts/mapserv.pl?service=wms&VERSION=1.1.0&REQUEST=GetMap&LAYERS
=plandk,zonekortdk&STYLES=default,default&BBOX=544918.551591,6198319.468000,597875.237574,623
1380.534000&SRS=EPSG:32632&FORMAT=GIF&WIDTH=600&HEIGHT=450
This return a map, seen in Figure 26A:

WebGIS solution for Roskilde festival GTM Group 1 7. semester project, AAU
39
Figure 26A GetMap call of Community and zonal plan of the area around Århus(Nørmølle et al).
As seen in the URI the parameters are separated using the “&”. Because of that it is easy to adjust e.g. the
height and width of this map window, just by editing the text in the URI. When calling a service like this we
can’t control the styling of the given layers, and must accept how it is shown. When making our own WMS,
we control the styling on our server – using GeoServer (Nørmølle et al).
2.6.3.3 GetFeatureInfo
This service provides information of the attributes in a given map object. It is not necessarily provided by a
WMS, and only available for layers made available to that call. This will appear from the GetCapabilities call.
It is up to the host of the data what information is put in the call, but usually it follows the GML standards
(WMS vejl). You call for the specific layer like the GetMap call, where the BBOX and the WIDTH and HEIGHT
parameters are given. An example:
http://planforsyningen.dk/scripts/mapserv.pl?service=wms&VERSION=1.1.0&REQUEST=GetFeatureInfo&W
IDTH=800&HEIGHT=500&SRS=EPSG:32632&BBOX=556484.045246,6210589.593878,557208.289973,62
11064.359893&QUERY_LAYERS=plandk_r&X=267&Y=297&INFO_FORMAT=GML
The URI and the first parameters are the same like the GetMap call. The QUERY_LAYERS=plandk_r states
the layer, and the X=267&Y=297 is where we want the information and finally states INFO_FORMAT=GML
that the output is a GML(Nørmølle et al).
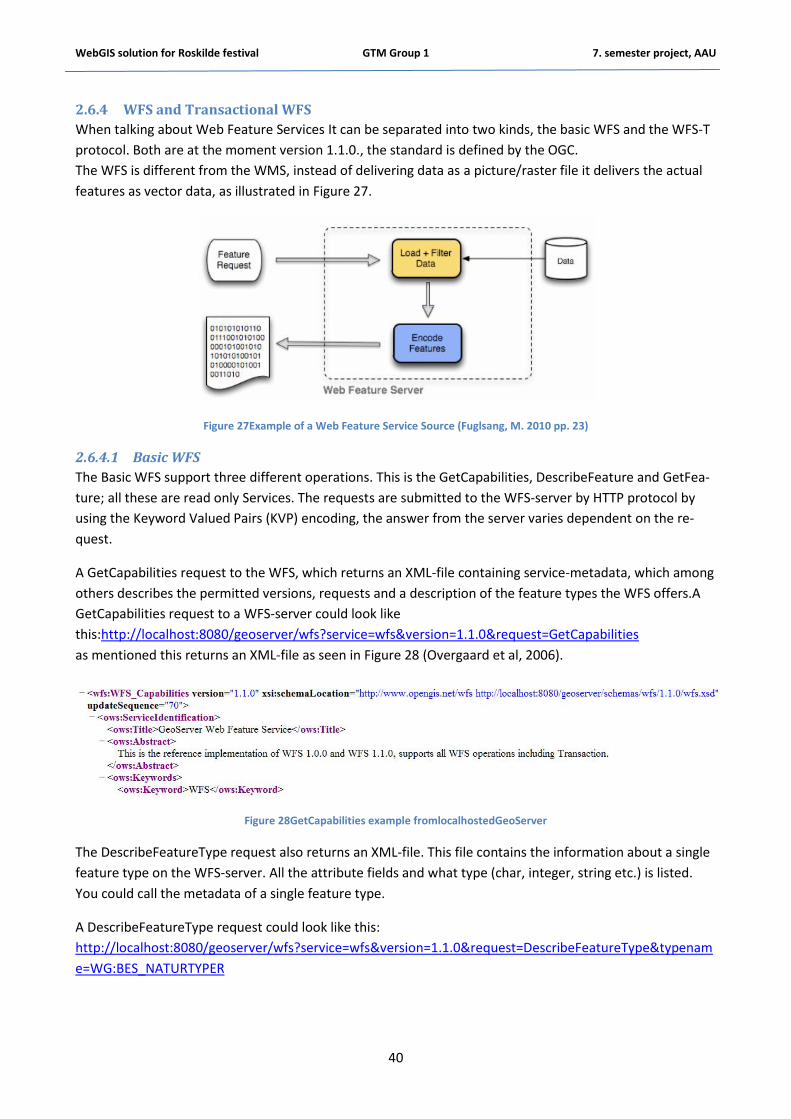
WebGIS solution for Roskilde festival GTM Group 1 7. semester project, AAU
40
2.6.4 WFS and Transactional WFS
When talking about Web Feature Services It can be separated into two kinds, the basic WFS and the WFS-T
protocol. Both are at the moment version 1.1.0., the standard is defined by the OGC.
The WFS is different from the WMS, instead of delivering data as a picture/raster file it delivers the actual
features as vector data, as illustrated in Figure 27.
Figure 27Example of a Web Feature Service Source (Fuglsang, M. 2010 pp. 23)
2.6.4.1 Basic WFS
The Basic WFS support three different operations. This is the GetCapabilities, DescribeFeature and GetFea-
ture; all these are read only Services. The requests are submitted to the WFS-server by HTTP protocol by
using the Keyword Valued Pairs (KVP) encoding, the answer from the server varies dependent on the re-
quest.
A GetCapabilities request to the WFS, which returns an XML-file containing service-metadata, which among
others describes the permitted versions, requests and a description of the feature types the WFS offers.A
GetCapabilities request to a WFS-server could look like
this:http://localhost:8080/geoserver/wfs?service=wfs&version=1.1.0&request=GetCapabilities
as mentioned this returns an XML-file as seen in Figure 28 (Overgaard et al, 2006).
Figure 28GetCapabilities example fromlocalhostedGeoServer
The DescribeFeatureType request also returns an XML-file. This file contains the information about a single
feature type on the WFS-server. All the attribute fields and what type (char, integer, string etc.) is listed.
You could call the metadata of a single feature type.
A DescribeFeatureType request could look like this:
http://localhost:8080/geoserver/wfs?service=wfs&version=1.1.0&request=DescribeFeatureType&typenam
e=WG:BES_NATURTYPER

WebGIS solution for Roskilde festival GTM Group 1 7. semester project, AAU
41
To make the DescribeFeatureType request you need to know type name, if you are not familiar with this,
you just have to make a GetCapabilities request and locate the different feature types in that document.
The XML-file returned from the DescribeFeatureType can be seen in Figure 29 (Overgaard et al, 2006).
Figure 29Example of DescribeFeatureType request from localhosted GeoServer.
The GetFeature request returns unlike the other two request, actual vector data as a GML-file. This file you
can import to your own GIS application.
A GetFeature Request could look like this:
http://localhost:8080/geoserver/wfs?service=wfs&version=1.1.0&request=GetFeature&typeName=WG:BE
S_NATURTYPER
The answer would for example result in the XML based GML-file as seen in Figure 30
Figure 30GetFeature example from localhosted GeoServer. At the bottom the figure you see the coordinates to the first feature
in the whole dataset.
With the GetFeature request, you have numerous possibilities to filter your request, for example you can
select data in a specific location, by adding a BoundingBox this is done by adding:
?BBOX(xmin,ymin,xmax,ymax) to your HTTP request. Or you can choose a specific feature if you are aware
of the featureid, you can also choose only to get the five first features for a specific feature type, this is
done with ?MaxFeatures=5 at the end of HTTP request(Vretanos, 2005) (Overgaard et al, 2006).

WebGIS solution for Roskilde festival GTM Group 1 7. semester project, AAU
42
That was the operations of the basic WFS service, the requests and returns can be seen in Figure 31.
Figure 31 The Basic WFS request and the format of the server answer.
2.6.4.2 The transactional WFS
The Transactional WFS (WFS-T) has the same functionalities as the basic WFS. But in addition to these it
should also have the ability to Lock Features, and support the three transactional insert, update and delete
feature. With the WFS transactional it should enable clients on various platforms to edit in a geodatabase,
the only requirement is the use of the WFS-Standard protocol to communicate with servers and exchange
XML/GML-files (Overgaard et al, 2006).
The LockFeature request makes it possible to ensure that only one user edits or delete data. It is possible to
lock features by using a HTTP protocol to request operations like with the basic requests. An example of a
LockFeature request:
http://localhost:8080/geoserver/wfs/LockFeature?SERVICE=WFS&VERSION=1.1.0&EXPIRY=5&REQUEST=Lo
ckFeature&TYPENAME=WG:BES_NATURTYPER&FEATUREID=BES_NATURTYPER.1
The server then returns an answer that the feature is locked. When the server is LockFeature enabled, it
should also be possible to GetFeatureWithLock. This should result in a GML3 is sent to the client; simulta-
neously the server locks the feature. The feature can then be updated at client and returned to server, re-
sulting in an unlock of the edited feature (Vretanos, 2005).
The Three Transactional operations are a little different.
The DeleteFeature operations can also be done using the KVP to do the request. See the example below.
http://localhost:8080/geoserver/wfs/TRANSACTION?SERVICE=WFS& VERSI-
SI-
ON=1.1.0TYPENAME=WG:BES_NATURTYPER&&REQUEST=TRANSACTION&OPERATION=DELETE&FEATUREI
D=BES_NATURTYPER.1
The server should confirm that the selected feature is deleted.
The insert and update operations, are slightly different. They don’t support the KVL requests; they can only
be executed by sending the WFS server an XML-file. The XML-file has to fulfill the WFS-Servers application

WebGIS solution for Roskilde festival GTM Group 1 7. semester project, AAU
43
Schema for the different feature types. Otherwise a conflict can occur, and it will not be possible for the
database to store or update the feature in the right way, if the received file isn’t structured as expected.
In appendix E there is an example from Overgaard et al, 2006 where two new objects are added to a WFS
server by an xml-file (Overgaard et al, 2006) (Vretanos, 2005).The additional functionalities and the client
server communication can be seen in Figure 32.
Figure 32The WFS-T requests and server answers
2.7 Geovisualization and online cartography
2.7.1 The graphical variables in cartography
When working with the visual expression of e.g. a map. We have six different graphical variables we can
use affect the layout and expression. The six tools are: Size, Color, Saturation, Shape, Orientation and Tex-
ture. The graphical variables are illustrated in Figure 33.
Figure 33 The graphical variables. Source: (Brodersen, 2008, pp. 100)
These elemental elements can illustrate different values. From experience, these six elements trigger the
same associations among many users. Colors are often associated with belonging to the same group. The
use of hue is known to be associated as an illustrator of increasing or decreasing value. These associations
and the effects of the variables are important to keep in mind if you want to create a good map, because
the lack of a formal language of how to style maps (Brodersen, 2008).
The data worked with in the project, is based on different survey methods, so they represent an area (poly-
gon), a single place (point) or a connections between two points (line). So we can’t use size, orientation or
shape as variables, since we want to map the real world in detail without any level of generalization. So we
will mainly focus on the Color as a tool for our visualization.

WebGIS solution for Roskilde festival GTM Group 1 7. semester project, AAU
44
Color as a variable is good at grouping features. The variable color is also associated with different things
dependent on culture, and to some point you must pay attention to this. Figure 34 illustrates some exam-
ples:
Figure 34 Different associations of colors (Brodersen 2008 pp. 113).
When working with colors you have different opportunities of symbolizing features, whether they should
be grouped, separated, illustrated by scale or qualitative information. Figure 35 illustrates different kinds of
color scales.
Figure 35 The different applications of the variable color (Brodersen, 2008 pp. 113).
2.7.1.1 Pros and Cons when using color:
Pros The best variable to illustrate/separate qualitative data.
Good in combination with other variables
Easy to remember
Can sometimes be related to a symbolic
Cons Problem for color blinds
Use of color limits the contrast volume
Hard to reproduce if not on a IT system
Expensive to reproduce if not on a IT system
(Brodersen, 2008)

WebGIS solution for Roskilde festival GTM Group 1 7. semester project, AAU
45
2.7.2 Styling in GeoServer
Visually Portraying spatial data is very important in any GIS application and the skills involve in portraying
that data is what transforms raw information decision-support tool with common explanations. Spatially
referenced data has no proper visual component, In order to visualize the data; we need to style it first. The
styling is process involves specifying color, thickness, and other attributes which can be visualized. One of
the important features of a map for users is the texture and the feel of the map. In these sections, aesthetic
issues will be our main focus which explains the visual portrayal of the data with which we had worked
with.
There are two basic ways in which we can style a dataset. One of the simplest ways is to make all features
belonging to the same feature types appear visually in the same way in terms of color. As for example, a
data class “hydrography” consisting of lines (rivers and streams) and polygons (lakes, ponds, oceans, etc.).
We might decide to color the insides of all polygons with a light blue, and color the boundaries of all poly-
gons in a darker blue. Lines are also colored in dark blue. Styling this way does not require one to have
knowledge of the various attributes or feature type of the data of interest (GeoServer, 2010).
A more complicated requirement can arise when styling features of the data in a different way depending
on some attribute. For instance, we can style a road dataset according to the class of road the feature be-
longs, we can choose for example to style highways with a four-pixel magenta line; style four-lane roads in
a three-pixel brown line; and style two-lane roads in a two-pixel black line. In order to be able to achieve
this objective we must ascertain which attribute of the data is associated with which road type.
Dataset that is loaded into GeoServer is usually assigned a default style depending on which feature type.In
order to properly visualize the data a style specific to that data must be created. This is done using Styled
Layer Descriptor (SLD) which is an XML. We can move styles easily from server to another because all the
SLD files are standardized across all OGC implementations which define how data is visualized and por-
trayed. We normally add the styles first in order to associate it with the new layer to be served by GeoServ-
er. Every layer which is to be published using GeoServer must possess at least one style GeoServer normal-
ly comes with many basic styles but these SLD files can be modified for one’s use. We can easily do this at
the Web Administration interface (GeoServer, 2010).
There are three basic different classes of data which can be served by GeoServer and these are points,
lines, and polygons. The method involved in styling each of these data class is quite different
Styling lines is the simplest amongst them since it is one dimensional and have only an edge to style The
edge in styling terminology is also known as “stroke”. However when it comes to Polygons styling, is quite
different since we need to consider the edge as well as the inside which is also known as “fill” and both of
which can be styled in a different way. Even though points lack dimension, they have both an edge and a fill
and in some cases we need to style their sizes also to appear differently depending on our needs. We can
specify color for the fills but for strokes we can specify both color thickness (GeoServer, 2010).

WebGIS solution for Roskilde festival GTM Group 1 7. semester project, AAU
46
3 Software This is a presentation of the major software used in this project. The software is described and we present
how we have used it. It is named in alphabetical order.
3.1 ArcMap version 9.3.1 ArcMap is well-known heavy analyst software for handling spatial data among a
lot of other functionalities in the ArcGIS software packages by ESRI. It has many
advanced data editing and analyzing tools, with many possibilities of application programming and model
building as well. In this project we only use this software for an overview of data and let the program work
with the FME to the data conversion from CAD to shape format. For that reason, we don’t get into a thor-
ough description of the software here (ESRI 2011).
3.2 Apache http server 2.2 Apache is an opensource HTTP server written in C, which provides HTTP services up
to the current HTTP standards. Apache run about 120 million webservers worldwide
and is therefore a well-tested piece of software. It is a collaborative development
and maintained by volunteers around the world. It is very configurable and very
open to add modules, by using the Apache module API. Apache support many varieties of features, com-
piled as modules to extent the core functionality, done with different server-side programming languages.
Even though Apache is an opensource server, it has good speed performance compared to others because
it uses modules multiprocessing to match each particular server infrastructure. Apache has no limits on the
numbers of redirects or aliasing with the URL, and can use virtual hosts to distinguish between requests
made to different IP-addresses.
Usually this software is used to create a webserver to connect with a database on a dedicated computer. It
supports various databases, e.g. PostGIS. In this project we use the Apache software to create a virtual local
host server, on our dedicated computer. It connects with our PostGIS database and services the HTML
(Apache A 2011) (Apache B, 2011).
3.3 FME - Feature Manipulation Engine FME is a collection of tools made to easily convert and translate more than 250 different
spatial and non-spatial data formats – which both can be read and written. The program
supports 400 different transformers and 5300 different coordinate systems, and can be accessed directly
from spatial applications such as ESRI’s ArcGIS, Google Earth or PostGIS. We use this software to convert
Roskilde Festivals own CAD-data to shapefile readable by e.g. ArcGIS and OpenLayers. Our result of this
conversion is not good, but more can be found in the discussion section. Since we haven’t done the conver-
sion, we are not sure which build the FME is based on. But the latest version is a 2010 release (Safe 2011).

WebGIS solution for Roskilde festival GTM Group 1 7. semester project, AAU
47
3.4 GeoExt 1.0 GeoExt is an opensource extension to OpenLayers used as an application, with different widgets data han-
dling support similar to the OpenLayers application MapFish. It supports widgets like toolbars, map panel,
legends, print, zoom level, layer selection, scale etc. We choose to use GeoExt as it seems easier to incorpo-
rate in the OpenLayers script that we have built. GeoExt is built with JavaScript and are typically configured
with OpenLayers objects, which make it possible to build applications, customize widgets or do data han-
dling. The GeoExt community names its application as:
“JavaScript Toolkit for Rich Web Mapping Applications: GeoExt brings together the geospatial know how of
OpenLayers with the user interface savvy of Ext JS to help you build powerful desktop style GIS apps on the
web with JavaScript.”(Geoext B 2011)
Version 1.0 of this software was released 11-10-2010, and is therefore a new development, and can still
have limited options and must be expected not to be tested thorough (first release was in June 2009, com-
pared to e.g. MapFish which started up in summer of 2007).
We use this application to create controls in OpenLayers, where the GeoExt. Action class provides objects
for an Ext toolbar. Furthermore we have used the GeoExt print functionality, which prints out a .pdf file
containing selected layers and comments on a GeoExt standard document (Geoext A 11-01-2011).
3.5 GeoServer 2.0.2 GeoServer is an opensource software server written in the JavaScript language that allows users to view,
share and edit geospatial data with WMS or WFS standards. It is designed for interoperability and can read
from many different data sources. This can be from files on the local disk to external databases; it publishes
data from the major spatial data sources using open standards e.g. Google Maps. Through web protocols,
GeoServer acts as an abstraction layer, allowing a standard method of serving geospatial data regardless of
the source data type. GeoServer administrate data through layers, workspaces and stores.
GeoServer supports these formats:
Databases: PostGIS, Shapefile, ArcSDE, DB2, Oracle spatial, SQL server
Files: JPEG, GIF, PNG, SVG, KML/KMZ, GML, SHP, GeoJSON, GeoRSS, GeoTIFF, ArcGrid, GDAL for-
mats
WMS and WFS-outputs.
A workspace is the name for a hypothetical separate isolated container to group similar data of a project.
Using workspaces, it is possible to use identical layers in different places without having name conflicts.
Usually the workspaces are denoted by a prefix to a layer name or store name. For example, a layer called
streets with a workspace prefix called “road” would be referred to by road: streets in GeoServer. Stores,
layers, and layer groups all must have an associated workspace.
A store is the name for a container of geographic data in GeoServer. A store refers to a specific data source;
a shape file, database, or another data source that GeoServer supports. It can contain many layers, as in the
case of a database that contains many tables, but can also have a single layer in the case of a shapefile,
which only contains one layer. GeoServer saves the connection parameters to each store (e.g. path to the
shapefile), and must be associated with a workspace.

WebGIS solution for Roskilde festival GTM Group 1 7. semester project, AAU
48
A layer is a collection of geospatial features or coverage, and must be associated with a workspace. Aside
from individual features, a layer is the smallest grouping of geospatial data. Usually a layer contains one
type of data (points, lines, polygons, raster) and has a single identifiable content (type – e.g. roads, lakes or
mills). A layer corresponds to a table or view from a database, or an individual file. GeoServer stores infor-
mation associated with a layer, such as projection information, bounding box, associated styles etc.
A layer group is a collection of layers, which makes it possible to request multiple layers with a single WMS.
A layer group contains information about the given layers, order, projection, associated styles etc. This in-
formation can be different from the defaults for each individual layer. Each layer group must be associated
with a workspace. Every layer must be associated with at least one style, and GeoServer recognizes styles in
Styled Layer Descriptor (SLD)(Geoserver B, 2011).
3.6 OpenLayers 2.1 Open Layers is a client-side JavaScript framework which makes it possible to put a dynamic map in most
modern web browsers. Since it is a purely client-side application, it is independent of any server. It is capa-
ble of supporting various mapping APIs such as Google, Yahoo, OGC WMS, OGC WFS, KaMap, Text layers to
name just a few. One big advantage of OpenLayers as compared to its commercial counterparts is that its
JavaScript library is an open source making it free for any user. It can be driven easily with any server lan-
guage such as PHP, PERL since it’s a pure client-side application. Maps can also be embedded directly into a
plain HTML file in order to build one’s own map as required. Basically, OpenLayers API has two concepts
which are imperative to understand. These concepts are ‘Map’, and ‘Layer’. Even though OpenLayers is
JavaScript based, it does not require one to be an expert in java scripting before using it even though
knowledge of it will be very helpful in handling errors in the script should there be any.
An OpenLayers Map stores information about the default projection, extents, units, and so on of the map.
Data is displayed within map via Layer and a Layer is just an information source for data about how
OpenLayers should request data and display it. In order to build OpenLayers viewer, we need to craft HTML
to be seen by the viewer and a map can be put inside any block level element. This means that we can put a
map in almost any HTML element on a page. One is required to include a script tag pointing to the Open
Layers library to the page in addition to a single level element as shown in Figure 36
Figure 36 Sample of OpenLayers script crafted in HTML.
It is not always necessary for the location of the OpenLayers library to point to the OpenLayers.js file on the
OpenLayers server. We can download the full OpenLayers code and run it locally by using the script
src="..." equal to the location of the OpenLayers library on the local hard drive. (OpenLayers, 2011)

WebGIS solution for Roskilde festival GTM Group 1 7. semester project, AAU
49
3.6.1.1 Basic Openlayers terminologies
In this subsection we define some basic OpenLayers terminologies.
3.6.1.2 Base Layers
Base Layers are mutually exclusive layers which mean that at any given time, only one can be enabled. The
base layer which is enabled determines the projection and other factors such as zoom level on the map.
Any layer added which is in different projection other than the base layer can result in distortion. Any layer
can be a base layer only if it is given the isBaselayer property but in most raster layers, the isBaselayer
property set to true by default even though it can be changed in the layer options (Openlayers, 2010).
3.6.1.3 Non Base Layers
These are sometimes called overlays and are the alternative to Base Layers. Unlike Base Layers, they are
not mutually exclusive therefore multiple of them can be enabled at a time. Non Base Layers do not control
the zoom levels of the map; however, they can be enabled or disabled at certain scales and resolutions
parameters so that they are only enabled at a certain level. Some Non base layers can support reprojection
to the base layer projection at layer load time. Most overlay layers default to non-base overlays (Openlay-
ers, 2010).
3.6.1.4 Raster Layers
This category of layers is made up imageries and therefore composed of pixels. Their projections are fixed;
therefore it cannot be altered at the client side (Openlayers, 2010).
3.6.1.5 Overlays
In OpenLayers, there can be 2 different feature rendering. These are Vector Overlays and Marker Over-
lays. Vector Overlays uses vector drawing capabilities in the browser to display data whilst Marker Overlays
displays HTML image objects inside the DOM.
Amongst these two overlays described above, The Vector Overlays have more capabilities than the Marker
Overlays. With the Vector overlays, we can draw lines, polygons, and other features. They can also be
better maintained and this is the main area where most of the OpenLayers development is taking place.
More support for styling options and configurability is available and it is also easy to interact with remote
severs when dealing with Vector Overlays.
However, the Markers layer is maintained for backwards compatibility, because there are some things
which cannot be done with vectors as they are currently implemented, and they provide a different type of
interface for event registration (Openlayers, 2010).

WebGIS solution for Roskilde festival GTM Group 1 7. semester project, AAU
50
Figure 37 Example of OpenLayers script
Figure 37 shows part of the code in the HTML file for this project. Further down the lines contain all the
JavaScript code necessary to embed a map in the web page. In the code above, line 31 creates a
new map object having all the properties of the OpenLayers. Map function. We are passing in 'map', which
is a string having the name of element we want OpenLayers map to appear in on the webpage op-
tions object as one of the arguments we have set in line 26 which specifies the value of any API property in
the options argument. In this case we defined the projection to be used. OpenLayers is able to work with
any projection on a condition that different projections are not mixed together. In this scenario, we are
creating a WMS variable which will hold an OpenLayers layer object by calling GeoServer to create an
OpenLayers Layer WMS object (Openlayers, 2010).
3.6.1.6 Styling in Openlayers
Styling in OpenLayers is also possible and it’s a way of controlling how vector features should appear on a
webpage. We can style points, lines, and polygons. It capable of providing standards such as SLD which can
also allow advanced features to be styled based on certain rules (Openlayers, 2010).
3.7 PostGreSQL 8.4.4 PostgreSQL is an object relational database management system (ORDBMS). The
software is open-source, is easily modified or extended and has a wide supporting
community. It supports most of the SQL standard and e.g. complex queries, triggers,
backup, and views - among a large number of other advanced database features.
Furthermore the software can easily be extended by adding e.g.: New data type,
functions, operators etc. It has native programming interface for a number of differ-
ent languages e.g. C, java, python etc.
The PostgreSQL uses a client/server model where a session consists of two cooperating processes:
A server process: It manages the database files, accepts the connections to the database from the
client applications, and performs database actions on behalf of the clients.
WebGIS solution for Roskilde festival GTM Group 1 7. semester project, AAU
51
The user client’s applications request: Client applications can be very diverse (e.g. a text-oriented
tool, graphical application, web server, or a specialized database maintenance tool). Some client
applications are supplied with the PostgreSQL distribution, but most of them are developed by the
user.
A typical client/server application is typically on different hosts which must communicate via Internet. We
use the Apache server as a local host to our data, but also connect to a remote server from KMS when using
the background maps. The software can handle multiple connections and therefore the master server is
always opened to run client requests for a connection. We use the PostgreSQL as our database manage-
ment system, and let the PostgreSQL database load data to the server (GeoServer). In this matter, we install
an application called PostGIS to the software. It is an application which makes PostgreSQL support geo-
graphical data
PostgreSQL is a well-established database program; the first Postgre95 release 0.01 was released the 01-
05-1995. The 8.4 version was released at 05-17-2009, and is a stable version working on our desktop (win-
dows 7 OS) (PostgreSQL2009)(PostgreSQL 2010).
3.8 PostGIS 1.4.2 PostGIS is an extension which adds support to store geographical objects in the PostgreSQL database, and
we use it as such. It enables the PostgreSQL server to be used as a backend spatial database for geograph-
ical information systems, where spatial operations and analysis makes (spatial) SQL queries in the database.
PostGIS follows the Simple Features for SQL specification made by the OGC, as such it includes:
Geographical data types (polygon, points etc.).
Determines geographical geometries.
Spatial operators for determining geographical set operations.
Spatial indexes for spatial querying.
It has many similar core functionalities as ArcGIS SDE or Oracle’s spatial extensions and
supports the GeoServer WFS. The implementation index of PostGIS optimizes the geometries for reduced
physical disk and memory use on the computer, which can enhance query performances. It is open-source
and has a large developer community which continues to develop features such as topology and geodetic
support, raster support, 3D, programming API etc. The first version is a release from 2001; we use a stable
version 1.4 made for PostgreSQL 8.4 from March 2010.
We have small extension from PostGIS installed called “Shape File to PostGIS” made by PostGIS, version
shp2pgsql-gui 5181 (GUI = Graphical User Interface). This application imports normal GIS shapefiles into the
PostGIS, so PostgreSQL can read those(PostGIS 2010)(PostGIS 2011).
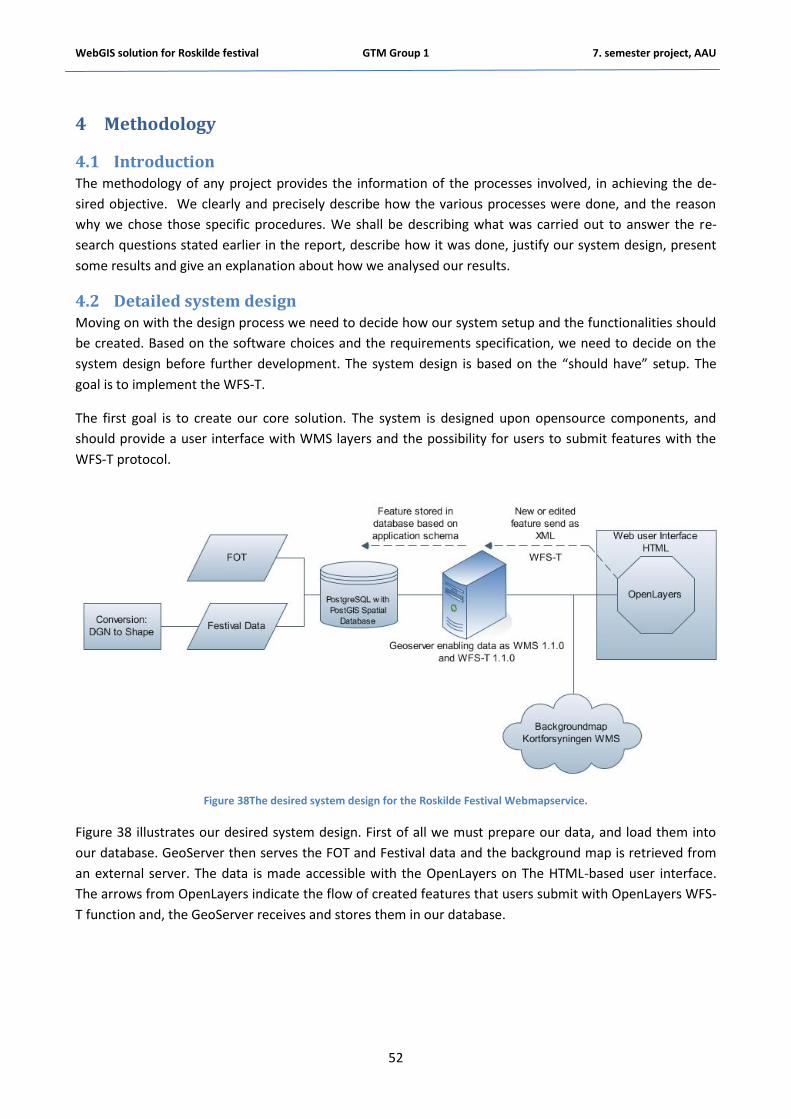
WebGIS solution for Roskilde festival GTM Group 1 7. semester project, AAU
52
4 Methodology
4.1 Introduction The methodology of any project provides the information of the processes involved, in achieving the de-
sired objective. We clearly and precisely describe how the various processes were done, and the reason
why we chose those specific procedures. We shall be describing what was carried out to answer the re-
search questions stated earlier in the report, describe how it was done, justify our system design, present
some results and give an explanation about how we analysed our results.
4.2 Detailed system design Moving on with the design process we need to decide how our system setup and the functionalities should
be created. Based on the software choices and the requirements specification, we need to decide on the
system design before further development. The system design is based on the “should have” setup. The
goal is to implement the WFS-T.
The first goal is to create our core solution. The system is designed upon opensource components, and
should provide a user interface with WMS layers and the possibility for users to submit features with the
WFS-T protocol.
Figure 38The desired system design for the Roskilde Festival Webmapservice.
Figure 38 illustrates our desired system design. First of all we must prepare our data, and load them into
our database. GeoServer then serves the FOT and Festival data and the background map is retrieved from
an external server. The data is made accessible with the OpenLayers on The HTML-based user interface.
The arrows from OpenLayers indicate the flow of created features that users submit with OpenLayers WFS-
T function and, the GeoServer receives and stores them in our database.

WebGIS solution for Roskilde festival GTM Group 1 7. semester project, AAU
53
4.3 Implementation plan When designing our system, the first is to decide what approach we would like to use in the developing
phase. In the theory part of the report two different design strategies were described, the strategies have
different strengths and weaknesses, based on these we will decide our approach.
The Waterfall approach is good if you are aware of the processes you have to go through, to get from A to
B. It is fairly simple to implement, it is a linear model and well documented, as you document everything
when each step is completed. The problem is that you have to complete every step 100% before moving on
to the next one, and if you fail one step it is hard to reverse the process and go back. Also if you need to
make changes to an earlier step, this will be hard to implement.
The agile approach is good if you don’t have that much experience in the developing phase. The agile ap-
proach consists of a number of small work cycles, so it is possible in a short time to build a core product and
then do numerous iterations until the product is satisfying or you reach your deadline. Even though you do
not succeed in all the iterations you had imagined, you will have a working core system. The problem is that
you can get high expectations on what is possible, and there is very little focus on documentation, as the
agile manifesto states, rather working with coding than documentation.
Since this is our first project dealing with designing a system, it seems that the agile approach would suit
our project best. First off all we don’t know how we are going from A to B, and we don’t have the experi-
ence to plan as detailed as the waterfall methods demands to be successful. What we can use from the
waterfall method is the focus towards documentation of the programming and development. Since this is a
scientific project, documentation is mandatory.
Looking at the pros and cons regarding the two methods, the agile approach meets most of our demands. It
is good at adapting to changing demands, and since we work with different types of opensource software,
where some parts are not very well documented. It should be an advantage to use a method that suits a
volatile environment. If getting stuck, we can start a new iteration, and not much time has been lost. This
should be a major advantage since our developing stage is relatively short. The agile approaches also let us
divide the different tasks between different group members. Which again should result in a relatively short
scope we will have developed minimum working solution. Figure 39 illustrates the different phases that our
programming phase went through, and what changes that we had to implement in the process as a conse-
quence of not being able to make the system work.
Since we have decided to use the agile approach, we want to divide the system development into small
iterations, with a core product and steps for further development. The development phase is based on the
“must have”, “should have” and “could have” from the requirement specification.
Figure 39 shows the how the development phase evolved. The two first iterations were planned from the
start as the Figure 39 illustrates. The third iteration with GeoExt was a consequence of a failure in an earlier
iteration. So the figure describes both the planned process (iteration one and two) and how it actually
evolved due to different events.

WebGIS solution for Roskilde festival GTM Group 1 7. semester project, AAU
54
Figure 39: The actual system design process. This illustrates the actual workflow of each iteration - the work with different parts
of the system is going on simultaneously.
4.4 Data preparation
4.4.1.1 Background
Most of GIS’s strength lies in integrating large amount of data retrieved from different sources and formats.
Data planning is imperative in any project and collection of data falls within this category. This includes
developing project requirements and planning in detailed. Collection of data is as important as the data
itself in any project. It can involve many tasks as for example, data acquisition, editing, and noise removal.
But this can really create problems in the management of the data, so therefore effective data manage-
ment is very essential no matter how big the project may be (Longley, 2004).
4.4.1.2 Feature Data Types
A feature is made up of geometry with attributes, styles and other metadata. Metadata contains infor-
mation about the composition of data. It consists of the information needed in order for someone else
to understand all the important issues involved in the generation of that data. E.g. description of the
composition of the data set, precision, the kind of reference system the data was generated in and so
on. Feature types consist of two major basic types. These are; Simple features and Complex features
according to GeoServer’s web page (GeoServer A 2011).

WebGIS solution for Roskilde festival GTM Group 1 7. semester project, AAU
55
4.4.1.3 Simple Features
Simple features mostly contain a list of properties with each having one piece of simple information for
example such as a string or number. Simple feature can be defined in three profiles according to the OGC.
There are some benefits of feature types according to GeoServer’s webpage.
Benefits: 1. They support queries on attributes and these include spatial queries on geometries.
2. They are quite fast to use.
3. They are not difficult to implement.
Drawbacks: 1. Since modification of only part of the schema is not allowed, interoperability becomes a prob-
lem. 2. In order to share data with GeoServers simple features, users must either use a database of the
same schema or translate between different schemes. 3. Columns in databases can be quite huge, as result of more data owners adding a lot of data to a
single database schema. (GeoServer A 2011)
4.4.1.4 Complex features
These feature properties can contain extended nested properties to arbitrary depth. Meaning complex
features can accommodate properties that are other complex features. They have the capability to be used
in representing information as a set of related objects of various kinds and not as an XML view of a single
table.
Benefits: 1. Modeling of information is not a single table but a collection of objects which are related and their
associations and types may vary from feature to feature, this permits rich expression of content. 2. They are able to define information models, as an object-oriented structure, an application
schema. 3. Since the schema can be broken into a collection of independent types, users may only extend
those types they need to modify.This permits interoperability between related users and make governance simpler.
Drawbacks of complex features: 1. They are difficult to implement. 2. They can be quite slow, as result of more database queries being required for each feature. 3. Effort is required from the user community, because an application schema requires Infor-
mation modeling to standardize. (GeoServer A 2011).
4.4.2 Data translation and conversion
Nowadays, a large most of the spatial data used in GIS analysis is distributed through Internet based
GIS where the data sets are stored on servers and users can be able to access the data and use some
analysis tools through the internet. With all these technology, even as of writing this project, data col-
lection is till tedious and time consuming. Using data structured for GIS projects gives a lot of capabili-
ties, until we have to create our own or convert it to other formats. This conversion can be done either
by using a translation scripts or third- party translation software.
Geographic data translation software must address both syntactic and semantic translation issues. Syn-
tactic translation involves converting specific digital symbols (letters and numbers) between systems.
WebGIS solution for Roskilde festival GTM Group 1 7. semester project, AAU
56
Semantic translation is concerned with converting the meaning inherent in geographic information.
While the former is relatively simple to encode and decode, the latter is much more difficult. Transla-
tion scripts are time-consuming to write, and the resulting data set is often not structured the way we
might need it. A smart alternative to writing such code is Feature Manipulation Engine (FME) Desktop
software. It makes translation between multiple data formats quick and simple (Longley, 2004) (safe
2011).
The input data type is highly influenced by the type of software choices and the purpose of the GIS project.
In this section we describe data acquisition, conversion process and the problems encountered in the pro-
cess.
4.4.3 Data acquisition
The initial dataset obtained from Roskilde Festival, was in MicroStation dgn format and was mapped in
"System34 Sjælland" projection. It was not structured in for GIS purposes. It had over 100 levels (layers)
and it was difficult to figure out which features belonged which levels. Different levels could e.g. contain
information about both buildings and campsites. This is a consequence of the ad hoc updating of data in
the cad and having no defined structure. Structuring data for our project was hard and required a lot of
skills and expertise. The grouping process was more or less an iterative process based on the names of the
layers. Throughout this process it is possible that features have been lost.
4.4.4 Shapefile structure
To understand the conversion process, we briefly describe the shapefile structure. A correct structure of
shapefiles has three related separate files, a file ending in .shp, another ending with .shx, and a third ending
in .dbf. The .shp file is composed of the vector geometries. Shapefiles must contain the same type of geo-
graphic features, which means that points, lines, and polygons cannot be mixed in the same file. The .shx
file is an index file which for each record in the .shp file has an entry which corresponds to the .shx which
gives the offset and the length of the record. All the non-spatial attributes are contained in the .dbf file.
There is also a fourth shapefile appendage which is very popular and that is the .prj file which is optional.
This file tells the user what projection the data is in.
4.4.5 Data conversion
It is necessary to convert the data to the native format of PostgreSQL / PostGIS. Splines, arcs, etc. has to be
converted to OGC simple feature types because PostgreSQL / PostGIS cannot handle other feature types
apart from those. Using FME, we input the required settings, and the data was converted to shapefiles with
projection EPSG: 25832 (utm32 euref89).
After conversion, we obtained several feature classes for the same type of data. For instance after convert-
ing layer called “B-handel Bodnumme.dgn” we obtained the same layer in five shapefile forms: B-
handelBodnumme_line, B-handelBodnumme_point, B-handel Bodnumme_shape, B-handel Bod-
numme_solid. In some cases, we even have data as B-handel_ellipse, Brandmateriel_S_arc. Thisjust shows
that for some layers there is a mixture of points, lines, polygons and other complex features within thedgn
files.Hencethe reason we had a conversion with the various forms of the shapefiles. A descriptions of the
conversion process can be seen in Figure 40.

WebGIS solution for Roskilde festival GTM Group 1 7. semester project, AAU
57
Figure 40 Schematic diagram of data acquisition, conversion and to PostGIS.
4.5 Setting up GeoServer, PostgreSQL and PostGIS In this section we briefly describe how GeoServer and PostgreSQL/ PostGIS was installed and configured for
the project. We also describe how the data was projected and styled in GeoServer.
4.5.1 Installation and configuration of PostgreSQL and PostGIS
Even though shapefile format can be loaded directly into GeoServer, in practice, first of all we would like to
initially load the vector data into database because of the reasons stated below:
1. Performance Speed: In terms of performance, data from a database is better than loading it direct-
ly into GeoServer and spatial data perfectly fits this description.
2. Supporting multi users: Since storing it in a database gives the benefit of remote access through a
standard interface. It gives us additional capability of adding security to the equation by blocking
unauthorized use of data.
3. Data querying: We can query spatial database in the same as non-spatial databases. This makes it
one of the most important benefits in the same way that we can query a traditional database. This
is by far the biggest benefit.
(Davis, 2007)
PostgreSQL is an opensource object-relational database system designed to run on all major Operating
systems.Thereare several sources and binary formats available forming the coreof the PostgreSQL object-
relational database management system.
PostGIS add support for geographic objects to the PostgreSQL database. The PostGIS spatially enables the
PostgreSQL database, making it possible to use it as spatial database for GIS. Both PostgreSQL and PostGIS
have really straightforward installation varieties. The binaries and installation instructions can be found on
their web pages. The version used in this project is PostgreSQL 8.4.4 and PostGIS 1.4. The latest PostgreSQL
installers include an option to install PostGIS. Once we have finished with the installation, it becomes now
ready for a database and the tables and PostGIS extension can now be added.
The database window after the installation is as shown in Figure 41.
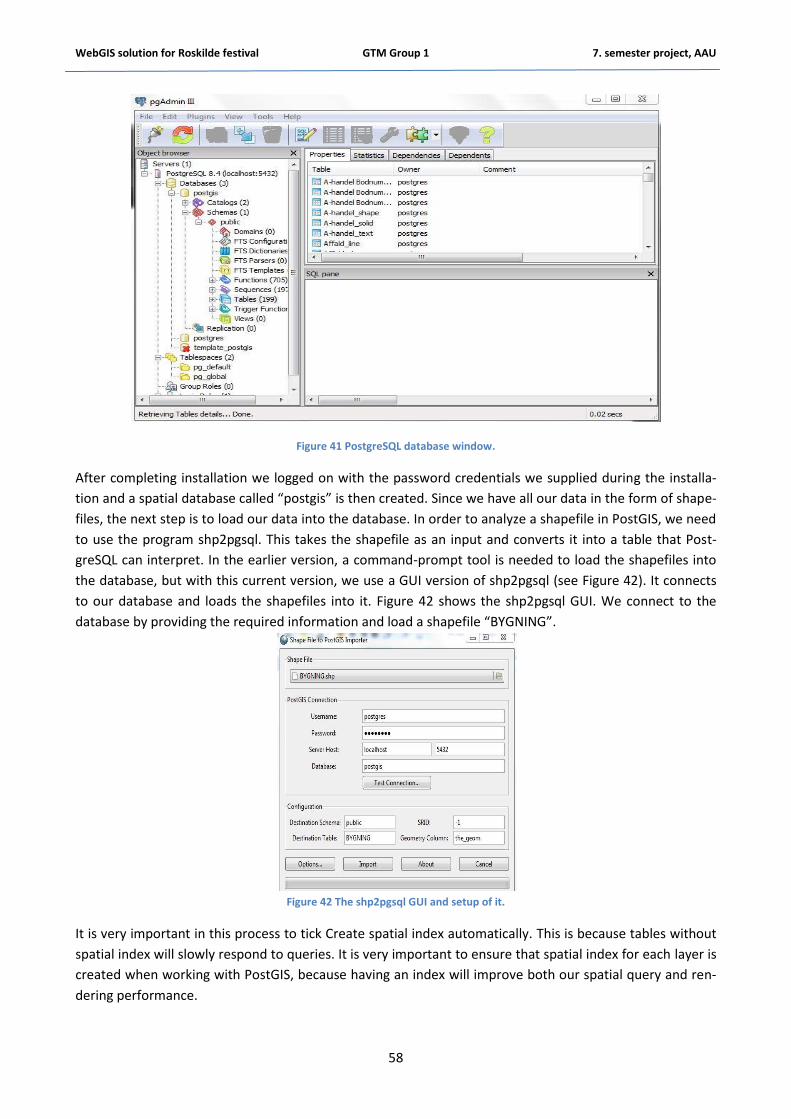
WebGIS solution for Roskilde festival GTM Group 1 7. semester project, AAU
58
Figure 41 PostgreSQL database window.
After completing installation we logged on with the password credentials we supplied during the installa-
tion and a spatial database called “postgis” is then created. Since we have all our data in the form of shape-
files, the next step is to load our data into the database. In order to analyze a shapefile in PostGIS, we need
to use the program shp2pgsql. This takes the shapefile as an input and converts it into a table that Post-
greSQL can interpret. In the earlier version, a command-prompt tool is needed to load the shapefiles into
the database, but with this current version, we use a GUI version of shp2pgsql (see Figure 42). It connects
to our database and loads the shapefiles into it. Figure 42 shows the shp2pgsql GUI. We connect to the
database by providing the required information and load a shapefile “BYGNING”.
Figure 42 The shp2pgsql GUI and setup of it.
It is very important in this process to tick Create spatial index automatically. This is because tables without
spatial index will slowly respond to queries. It is very important to ensure that spatial index for each layer is
created when working with PostGIS, because having an index will improve both our spatial query and ren-
dering performance.

WebGIS solution for Roskilde festival GTM Group 1 7. semester project, AAU
59
It must be emphasized that with this method, importing several shapefiles at the same time is not possible.
So we have to go through the process of importing one shapefile at a time. This is very tedious, when work-
ing with large amount of data. We have only focused on vector data, because that is the only option with
opensource. However we cannot say the same thing with their commercial counterparts, almost all of the
commercial spatial databases allow storage of imagery in tables. Even though PostGIS is not capable of
handling raster right now, it is under development (PostGIS, 2010).
Now that we have our data in a database, we are ready to visualize our data.
4.5.2 Setting up GeoServer
As mentioned earlier, GeoServer is an open source software server written in Java that allows users to
share and edit geospatial data. Designed for interoperability, it publishes data from any major spatial data
source using open standards.
Even though GeoServer is implemented in Java, one doesn’t need to have a lot of experience in Java pro-
gramming in order to use it effectively. Its installation and instructions can be found on the software’s web
page. In this project we installed and used GeoServer version 2.0.2.
After installation, we then opened the GeoServer Web Admin Page as shown in the Figure 43.
Figure 43GeoServer’s admin web page.
We then logged on with the credentials we chose during the installation but the default username is admin,
and the password is GeoServer. In order to load our data into GeoServer, we need to create a new work-
space and configure it for the data. Workspaces are a way of logically grouping our data sets. We are
prompted to enter a roskilde_festival as Workspace Name and www.roskilde.dkasNamespace URI as show
in Figure 44A. Although the Namespace does not have to be a web page or even a web server connecting to
that address, it is just meant to uniquely identify it.

WebGIS solution for Roskilde festival GTM Group 1 7. semester project, AAU
60
Figure 44A new workspace window.
We then add our data to the Roskilde_festival workspace by creating a new Store. A data store is able to
host many feature types. In order that we host shapefiles, it is mandatory to create a new data store for
each file. But since our main data source is from PostGIS, we need to just create a single data store for our
PostGIS instance, and subsequently it will be possible to use multiple tables from the same one.
We then select PostGIS as data source under Vector Data Source. From the workspace menu we select ros-
kilde_festivaland inputs a Data Source Name “roskilde”. We input our Connection Parameters to the Post-
GIS database then save.
It is now ready for us to input our data from the PostGIS database. We navigate to Layers> Add a new re-
source which then open the GUI, we then choose roskilde as the source to add the layer. All the tables in
the database should be visible to GeoServer if it is properly loaded. But we need to configure them individ-
ually before it can be served by GeoServer. We can now start loading the PostGIS data into GeoServer
Before loading the data into GeoServer, we need to specify the spatial reference system (SRS) and the
manner in which we prefer to visualize our data in terms of styles. GeoServer tries to look for an EPSG code
by checking the data header when a data is being added. If the data already possesses a SRS with an un-
ambiguous EPSG code and the whole SRS definition with the code matches the one in GeoServer, then the
SRS will be already set for the data. If the data has a SRS but no EPSG code, then we can navigate to the find
option page for GeoServer to search where the data SRS is compared with every other known SRS. If this
becomes successful, we can select the specified EPSG code. On the contrary, either there is no proper ref-
erence system for the data or it is not recognized by GeoServer. We have few options with regard to this
case. We can either force the declared SRS, ignore the native one which is the best solution if the native
SRS is found to be nonexistent the native to the declared SRS. This is the best solution if the native SRS is
correct, we cannot match it to an EPSG number.
Figure 45 Window to choose SRS
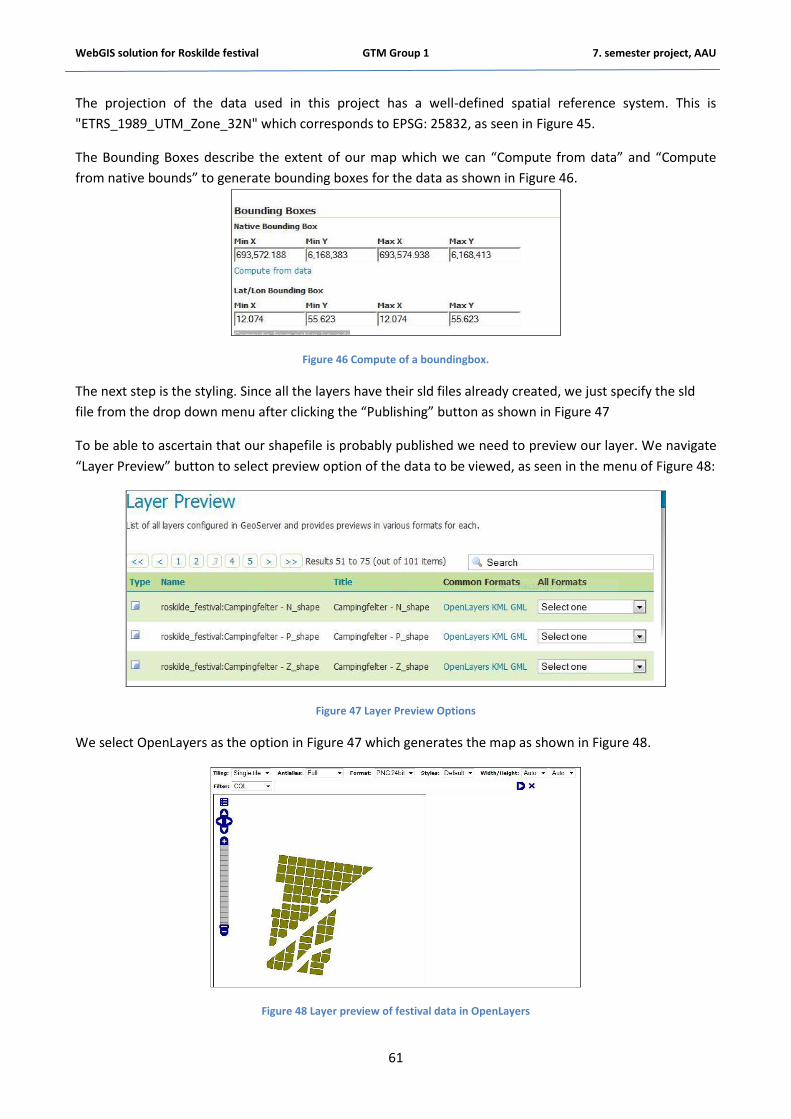
WebGIS solution for Roskilde festival GTM Group 1 7. semester project, AAU
61
The projection of the data used in this project has a well-defined spatial reference system. This is
"ETRS_1989_UTM_Zone_32N" which corresponds to EPSG: 25832, as seen in Figure 45.
The Bounding Boxes describe the extent of our map which we can “Compute from data” and “Compute
from native bounds” to generate bounding boxes for the data as shown in Figure 46.
Figure 46 Compute of a boundingbox.
The next step is the styling. Since all the layers have their sld files already created, we just specify the sld
file from the drop down menu after clicking the “Publishing” button as shown in Figure 47
To be able to ascertain that our shapefile is probably published we need to preview our layer. We navigate
“Layer Preview” button to select preview option of the data to be viewed, as seen in the menu of Figure 48:
Figure 47 Layer Preview Options
We select OpenLayers as the option in Figure 47 which generates the map as shown in Figure 48.
Figure 48 Layer preview of festival data in OpenLayers

WebGIS solution for Roskilde festival GTM Group 1 7. semester project, AAU
62
The Layer Preview page is capable of supporting different output formats further use or data sharing. Lay-
ers can be previewed in common OpenLayers and KML formats. Using the “All formats” drop down menu
we can preview all layer types in other additional output formats.
All of the shapefiles contained in the directory store is loaded as part of the directory store, but they will
need to be configured individually as new layers before GeoServer can publish them. It must be empha-
sized that, when publishing shapefiles in GeoServer, the right style must be chosen otherwise GeoServer
will use a default style which can have an effect on the published data. For instance a line can appear as a
point if GeoServer uses a point style as a default.
Going through the same process, each of the layers is added and published in GeoServer. An overview of
all the layers can be previewed by grouping them together. Each of the layers is added to a layer group. We
can change the layer order by moving them either up or down depending on our preferences. Lower layers
can be obscured completely if the one above is its opaque. This problem mostly arises if one is dealing with
grouping multiple layers. Layers which consist of points do not normally obscure other layers, so in this case
it is better to move them to the top of the list and lines can also follow similar pattern. Layers comprising of
polygons tend to be the worst features when it comes to obscuring other layers. There are a couple of
strategies which can be adopted. We can adjust the transparency of the features, rather than making their
opacity 100%. The values can be adjusted in order to allow lower layers to visualize through it. We can ad-
just the opacity in the SLD script. Going through similar process of previewing a single layer as explained
before, we then generate a preview of all the layers. An example is shown in Figure 49
Figure 49 Layer Group Preview
4.6 Styling in GeoServer Creating styles in GeoServer is accomplished by creating .sldfiles, either we create our own or copy from an
existing style. By default, any SLD file created can be located under the directory geoserver / data_dir /
styles with a .sld extension. An SLD file called “BYGNING.sld” is as shown in fig 2a. It can be seen that some
tags have prefixes, such as ogc: in front of them. The reason for this is because they are XML namespaces.
In the tag on lines 2-4, there are two XML namespaces, one called xmlns, and the other is called xmlns:ogc.
Only tags corresponding to the second requires a prefix of ogc: but the first namespace do not need any
prefix. It must be made clear that the names of the namespaces are not relevant but what is very impera-
tive is that the namespaces should correspond and match with the tags. As for example, the first
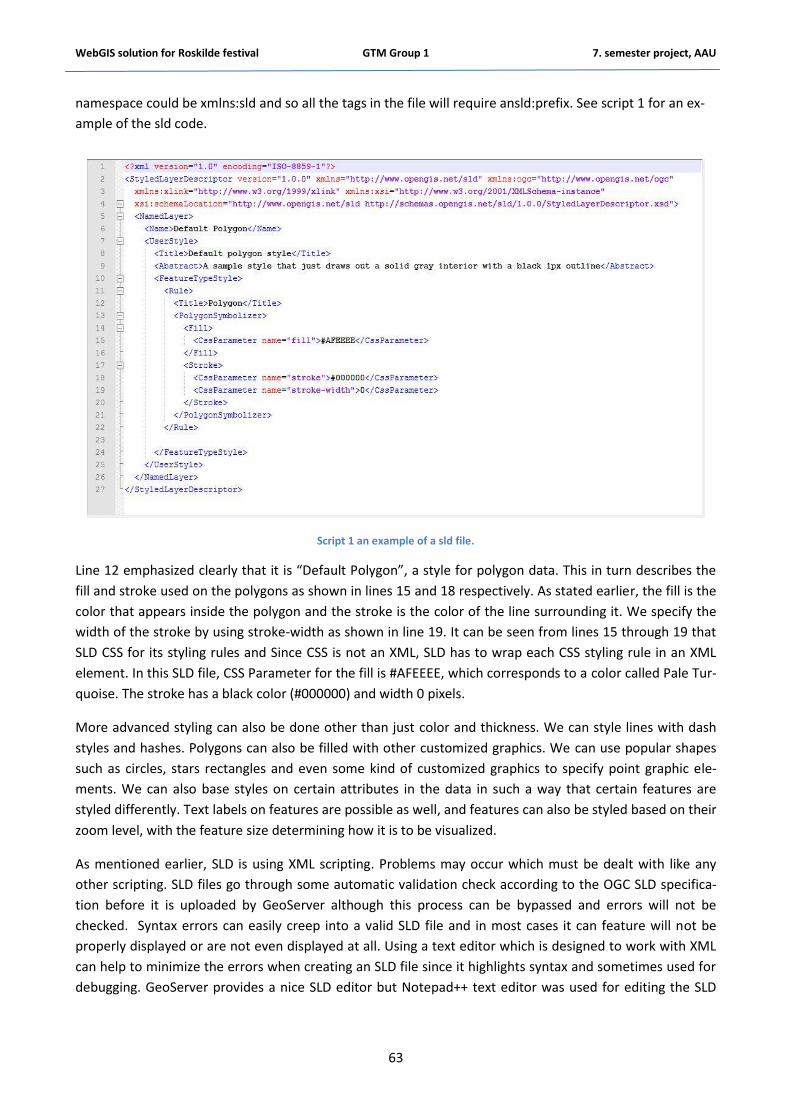
WebGIS solution for Roskilde festival GTM Group 1 7. semester project, AAU
63
namespace could be xmlns:sld and so all the tags in the file will require ansld:prefix. See script 1 for an ex-
ample of the sld code.
Script 1 an example of a sld file.
Line 12 emphasized clearly that it is “Default Polygon”, a style for polygon data. This in turn describes the
fill and stroke used on the polygons as shown in lines 15 and 18 respectively. As stated earlier, the fill is the
color that appears inside the polygon and the stroke is the color of the line surrounding it. We specify the
width of the stroke by using stroke-width as shown in line 19. It can be seen from lines 15 through 19 that
SLD CSS for its styling rules and Since CSS is not an XML, SLD has to wrap each CSS styling rule in an XML
element. In this SLD file, CSS Parameter for the fill is #AFEEEE, which corresponds to a color called Pale Tur-
quoise. The stroke has a black color (#000000) and width 0 pixels.
More advanced styling can also be done other than just color and thickness. We can style lines with dash
styles and hashes. Polygons can also be filled with other customized graphics. We can use popular shapes
such as circles, stars rectangles and even some kind of customized graphics to specify point graphic ele-
ments. We can also base styles on certain attributes in the data in such a way that certain features are
styled differently. Text labels on features are possible as well, and features can also be styled based on their
zoom level, with the feature size determining how it is to be visualized.
As mentioned earlier, SLD is using XML scripting. Problems may occur which must be dealt with like any
other scripting. SLD files go through some automatic validation check according to the OGC SLD specifica-
tion before it is uploaded by GeoServer although this process can be bypassed and errors will not be
checked. Syntax errors can easily creep into a valid SLD file and in most cases it can feature will not be
properly displayed or are not even displayed at all. Using a text editor which is designed to work with XML
can help to minimize the errors when creating an SLD file since it highlights syntax and sometimes used for
debugging. GeoServer provides a nice SLD editor but Notepad++ text editor was used for editing the SLD

WebGIS solution for Roskilde festival GTM Group 1 7. semester project, AAU
64
files in this project. All the created SLD files was downloaded from GeoServer’s SLD cookbook webpage and
subsequently edited and customized for use.
So far, we can now see that styling of data layers straightforward or as involved as one may like. Many dif-
ferent styles can be created for the same layer depending on a need. All the different layers are styled to fit
the wanted expression.
4.7 User interface and HTML scripting
4.7.1 General
We chose to make the site according to the agile approach with simplification of the approach to the
methodology, where we build up a site with working functionalities before proceeding to more functionali-
ty for the page. To make a stabile product it is important to make one product work, before proceeding to
the next. In that way, we can be assured of a simple model and product which can be developed further.
We chose to write the script in the text editor Notepad++ which highlights the relevant code and tags when
writing the script for example in html format, which makes the overview of the programming quite
easy.The site was tested in Mozilla Firefox and therefore the product is designed for this browser, and users
of Internet Explorer (version 8) for example, would have a different visual and practical experience with the
layers. Testing of the performance of the site in different browsers will not be discussed in this project.
We were not given a virtual server to store our data, and therefore the product was stored locally on one of
our own hard drives. The page and data was controlled through a localhost server – which is controlled by
the server software Apache. The site, the OpenLayers and the GeoExt and Print extension to Openlayers
were stored within Apache and its folders, so it is easily opened in the web browser via an address like
http://localhost/agora.html. The data is stored in GeoServer via the PostGIS extension in PostGreSQL (see
theory section about data management).
4.7.2 Colors and web design
Colors have a very powerful effect on visitors on a page, and deserve attention from the start of designing a
webpage. It is essential for the design and overview that not too many colors are implemented on the
page. The colors are addressed with hexadecimal codes e.g. Purple = #80080 – the hexadecimal code is a
web translation of the RGB (Red, Green and Blue) color codes. Usually these color codes are found through
a color chart. The higher the contrast between the main background color and e.g. the font color, the easier
the text on the page is to read. By using .png images on the webpage we can assure that the background of
the images doesn’t deviate from the background on the page – the .png files can have transparent back-
grounds (Duckett, 2004).
4.7.3 Design
The design of the webpage was done with some introductory investigation of the official Roskilde Festival
homepage www.roskildefestival.dk, to get inspiration of making our own website with conform to the offi-
cial one. The official site (Roskilde Festival 2010) consists of an advanced site programmed in html, java and
xml. We choose to use their build up, with a bar at the top of the page to navigate between the different
sites. The site uses a black background, with a frame floating in the center of the page, with mainly orange,
black and gray colors. See Figure 50. From the source code of the site, we acquired the hexadecimal color
code of the main orange color at the site to use for our site, just corresponding to the official site. The cho-
sen color is used throughout the site to style fonts and elements at the site. The color is chosen by Roskilde

WebGIS solution for Roskilde festival GTM Group 1 7. semester project, AAU
65
Festival, because it represents the largest stage of the festival Orange Stage, which the festival uses as
branding. The Arial font was identified at the same time.
To get a feeling of the importance of the orange color and let the design control the page in a technical
easy way we choose to use padding and lines on the page. This means that orange lines surrounds the dif-
ferent objects (and the page), and orange lines separate the different sections of the page (Duckett 2004).
4.7.4 Content
The site is controlled by a bar in top of each page, sorted by Home, Maps (alphabetical grouped), Forum
and Print. The whole script can be seen in appendix A. The pages have different functionalities:
4.7.4.1 Body
In the top of the page is the body of the page loaded. This mainly controls the main styling of the site.
<body bgcolor="black" style="padding:10px;border:3px solid #F36113;">
Bgcolor is the background color; padding is a frame around the site.
Figure 50: Roskilde Festival Official site (Roskilde Festival 2010)

WebGIS solution for Roskilde festival GTM Group 1 7. semester project, AAU
66
4.7.4.2 Loading of external scripts
The external javascripts are loaded with the src=”” functionality at the top of the page before the body.
These scripts load applications, styles etc.
<script src="ext-3.3.0/ext-all.js" type="text/javascript"></script>
Type defines what kind of script we are using – here JavaScript, another common one is CSS.
4.7.4.3 Bar and links
A link is referred to with aA HREF="” request. There is two parts with links in. One with links to navigate
between the pages in tables, and another one go to the official Roskilde festival site. This looks like:
<table border="3" width="50%" style="font-color:black;background-color:#F36113;" cell spacing="5"> <tr>
<th><A HREF="http://localhost/home.html">HOME</A></th> <th><A HREF="http://localhost/camping.html">CAMPING</A></th> <th><A HREF="http://gtmprojekt.helring.dk/">FORUM</A></th> <th><A HREF="http://localhost//print.html">PRINT MAPS</A></th> </tr> </table>
The <table> defines the table <tr> and <th> defines the rows and columns. The width is defined is 50 % -
meaning 50 % of the page’s width. We choose to put these links in a table because of the easy implementa-
tion of this as a bar at the top of the page.
4.7.4.4 Headers
The headers show brief important information of what is on the site:
<h1><b>Roskilde Festival WebMapService</b></h1>
The <h1> is the type of header and what it contains.
4.7.4.5 MapPanel
The map window is made in a <script> and loaded on the page before the body. We choose to write each
map window on the page, instead of loading them in separate documents. This ease the overview of what
exactly is contained on the given site. The commented and explained code can be seen in Appendix A. The
map window is placed in the middle of the site to have a central placing. It is loaded as a script before the
body, and put on the site with the <div> where the script is identified by id="mappanel" :
<div style="width:1000; height:800; float:center; border:5px solid #F36113;" id="mappanel"></div>
The rest of line defines the styling of the outer parts of this map window.
WebGIS solution for Roskilde festival GTM Group 1 7. semester project, AAU
67
4.7.4.6 Print Page
This is made as a button for a possibility to make print of the page as seen. The small function uses the
browsers own print page functionality.
<input type="button" onClick="window.print()" value="Print This Page" style="font-size:16px;font-family:Arial;color:#F36113;float:left;"/>
The button is defined as input type, and the onClick="window.print()" defines the use of the print function-ality. The rest of the script consists of styling.
4.7.4.7 Last Updated
A small JavaScript is loaded to grant information of when the site was last updated in the script (not the
spatial data). This is very handy to let users know when the last updated was made. The script connects
with the OS to gain the information about the time:
<script style="float:right;font-size:16px;" language="javascript"> var m = "PAGE UPDATED " + document.lastModified; var p = m.length-3; document.writeln("<center>"); document.write("<FONT COLOR='#F36113'>") document.write("<FONT FACE='Arial'>") document.write(m.substring(p, 0)); document.writeln("</center>"); </script>
(Hypergurl 2010)
The document.write connects with the OS, and controls the styling as well. The m.length-3; limits the num-ber of digits in the display.
4.7.4.8 Contact the developers
This is a possibility to contact the developers of the site with questions or suggestions. When this button is
pressed a new email form will pop up created by the standard email software, and it is possible to write a
message to the given email address:
<b><A style="font-
size:16px;color:#F36113;float:right"HREF="mailto:[email protected]">CONTACT THE DEVEL-
OPER </A></b>
The HREF is a link – and in this case links to a given email address. The rest is styling, be aware that the link
could be a button, text, image etc.
4.7.5 Print functionality
The print functionality is loaded as a script as well. It uses the GeoExt applications to run. The commented
and explained code is found in appendix B.
4.7.6 Logo
We decided to make a logo for the group. The logo was designed at a free-source site on the internet –
www.logosnap.com . The logo was designed with thoughts of GIS and Roskilde Festival. The sphere symbol-

WebGIS solution for Roskilde festival GTM Group 1 7. semester project, AAU
68
izes the earth, with thoughts to a map and GIS, and the text is the name of our group. The orange color is
the same as represented on the page referring to Roskilde Festival designs (Guru Corporation 2010).
The logo is loaded in the top of each page as a trademark for this project. It is loaded as an image, and the
code for loading this is:
<imgsrc="logo4.png" alt="Logo" style="float:right;" width="110" height="90">
The imgsrc="logo4.png" loads the logo direct from our server-folder. The style defines the placement, and
the width and height controls the size of this image. The code sits where we want it placed in the context.
4.8 Styling The styling of the site is controlled in the script mainly via CSS styling. With HTML there are a few manage-
able styling commands, but CSS has more options. Implementation of CSS can be done in many ways,
where it seems it is the most common to write a separate CSS styling script and link it to the main script.
We do it differently, according to having such a small amount of CSS code which seems manageable to con-
trol inside of the main script. At the top of the script after the title we insert a few lines of styling code:
<style type="text/css"> h1 {font-size: 40px; font-family:Arial; color:#F36113} A {font-size: 14px; font-family:Arial; color:#000000; text-decoration:none;} table {font-size: 13px; font-family:Arial; color:#000000} div.olControlMousePosition {font-family: Arial;font-size: 12px; color:#F36113;left:0px} </style>
style type="text/css" defines that we are styling CSS. The code starts with choosing which element to style
and after that the specific styling is inserted. Before the { we defines what element to style, and inside the
{} is defined different calls of styling. For some of the specific elements we need to control them separately
which we do by adding a styling request before the start of the element. The div.olControlMousePosition is
a specific functionality in the div. element which is styled here. If there is an overlap with the earlier style,
this new style will overwrite the old one. An example from this CSS styling is seen here (red color), where A
HREF refers to a link:
<b><A style="font-size:16px;color:#F36113;float:right" HREF="mailto:[email protected]">CONTACT THE
DEVELOPER </A></b>
But some of the java-elements have their own kind of specific styling, which is controlled often in separate
ways inside the script.
4.9 The PHP forum The idea of creating a forum for the site is to make it possible for users to communicate and have open
discussions with each other. Those discussions could have several subjects like:
Coordination: Placing of object like toilets, stages etc.
Ideas: New implementation ideas.
General discussion.
Support: Using or help to get started with the WMS.
This is an alternative or supplement to have the WFS-T solution which we experienced was very hard to
setup. This forum is made with the PHP open source application MyBB, and is easily customized with CSS

WebGIS solution for Roskilde festival GTM Group 1 7. semester project, AAU
69
and HTML design and styling - so the site could get the same design properties as the main Roskilde Festival
Webmap Service main page. The forum is built with MyBB’s user interface (an editor) where it is easy to
administrate, design and modify the forum; and the control panels and moderator tools gives complete
control. The user interface is focused on being intuitive and at the same time possible to extend with dif-
ferent plugins. MyBB supports DBMS servers like MySQL and PostgreSQL, and have features like a schedul-
ing system, repairing corrupt tablets, cleaning up, security, backups, calendar, private messaging and send
out emails to users. Many of these features could be highly useful for the purpose of this forum
(MyBB2011).We don’t have much knowledge of the architecture of our own forum - due to the changing
circumstances of the project group, when the producer of the forum left the group. We chose to keep the
PHP forum in the projects because of the perspectives and ideas of having an open communication plat-
form in addition to the website.
As the forum is setup right now one just need to register as a user, but it would be possible to have limited
access for only selected users to keep it an internal forum for the festival. The page contains information of
e.g. the online members, the time, statistics and calendar. And the categories show statistics of replies,
rating and number of views, dropdown index besides the possibilities to start or make a new thread.
4.10 OpenLayers and GeoExt The OpenLayers is the main functionality on the web user interface. The OpenLayers is a javascript based
API, which enables all the dynamic map features, based on Javascript. This is the main feature for con-
structing our dynamic map. All the code shown below has been created based on the
http://openlayers.org/dev/examples/ library, and then modified to suit the features we wanted in the map
window. The whole script can be seen in appendix A.
Examples of OpenLayers map windows are illustrated in Figure 51 and 52.
Figure 51 Example of OpenLayers Mapwindow, with two differentGoogle baselayers. Source:( http://workshops.opengeo.org/stack-intro/openlayers.html)

WebGIS solution for Roskilde festival GTM Group 1 7. semester project, AAU
70
Figure 52 Example of OpenLayers Mapwindow. The mapwindow is a result of a dotdensity calculation. Source:( http://trac.osgeo.org/openlayers/wiki/Future/OpenLayersWithCanvas)
4.10.1 Programming the OpenLayers and its functionalities
The first Iteration of OpenLayers was comprised of dynamic map requesting WMS layers from our Ge-
oServer and a background from Kort& Matrikelstyrelsens (KMS) kortforsyningen, and then some basic
tools:LayerSwitcher, Pan, Zoom and Coordinates.
When building the OpenLayers application, the first essential code is adding the OpenLayers API. Script 2
illustrates how we added the API’s JavaScript from our Apache webserver.
Script 2 Adding External javascipt
4.10.1.1 First iteration “Core solution”
The whole OpenLayers script is embedded in the HTML-page. After adding the API and a new script tag to
start the actual functionalities we add some options. By creating the variable options and creates variable
“map” that creates the actual map, where we add our desired WMS Connections, as displayed in script 3.
Script 3 various OpenLayers options

WebGIS solution for Roskilde festival GTM Group 1 7. semester project, AAU
71
The var options allow us to define different parameters that should overrule e.g. other projections from
overlays or allows us to define scales, or how coordinates will be displayed in the map window. Unfortu-
nately the code regarding projection, units and display projection won’t execute the right way or is not
supported by OpenLayers. So it was not possible for us to overrule the standard OpenLayers projection
EPSG: 4326, which is the WGS84, so we don’t have an orthogonal view in the map window. This topic will
be discussed later on in the report. At the end of script 4 we add the map, and applythe options above.
The next step is adding WMS’s to our map window; we add data from two different sources. As background
map we use the topographical screen map that KMS hosts as WMS. The FOT and Festival data we receive as
WMS from our GeoServer, as seen in script 4.
Script 4 Adding WMS layers
The first WMS we added is the background map from KMS. We simply add the server address and the de-
sired layer from the server into the code. This is our GetMap request to the KMS server or our local Ge-
oserver. This differs from KVP GetMap request since must information is automatically included. We don’t
need to supply e.g. version.
Normally you would have to embed username and password into the string when using the services from
kortforsyningen. But instead we use an IP unlock at kortforsyningens homepage,
http://kortforsyningen.kms.dk/unlock.html.
We do the same with the next WMS; in this case it is the location of garbage points at the festival. The only
difference is that now we receive our layer from our local hosted GeoServer. Line 2 in wms1, we define the
name that will appear in the layerswitcher and in the two last lines we define wms1 as an overlay, this
makes it possible to switch the layer on and off. We add all the needed WMS layers that way.
After setting up the WMS connections we also need to assign them to our map variables this is done in
script 5.
Script 5 Adding layers to the map
After adding the layers the last thing we need to do, to fulfill our OpenLayers core solution is adding the
different OpenLayers functionalities to the map. The script 6 illustrates how the predefined map tools are
added.

WebGIS solution for Roskilde festival GTM Group 1 7. semester project, AAU
72
Script 6 Adding controls to the map window
4.10.1.2 Iteration two “Core solution with WFS-T”
This is the basic core solution, next step is to try to implement WFS-Transaction tools from the OpenLayers
examples homepage http://openlayers.org/dev/examples/wfs-protocol-transactions.js , it should enable
users to create new features and store them in our database. Based on that example we tried to divide the
code down into smaller pieces, and implement them bit by bit. The process became even more complicated
since we couldn’t execute the code from the example. We ended up with an error regarding a proxy server
we couldn’t connect to. We tried to implement bit by bit into our own working core script but with no luck.
There were a row of challenges that we couldn’t solve with the programming experience we have at the
moment. We even tried just to implement a single layer as WFS instead of WMS, but this challenge we
couldn’t solve either. These topics will also be discussed later on in the report. The scripts regarding WFS
and WFS-T are in appendix D.
Because of the relatively short development period and our agile approach to the development we decided
to leave the WFS-T solution, and try to find another solution that would enable the users to post proposals
of new features at the Roskilde festivals Web Map Homepage.
4.10.1.3 Iteration three “Core solution with GeoExt tools”
The GeoExt API offers additional tools that should be able to at least make some compensation for the fail-
ure with WFS-T. The GeoExt gives us the opportunity to digitize data, but they can’t be stored in the data-
base. Adding a PHP forum to the website enables users to discuss different proposals there. The GeoExt
also provides a print PDF function, which should make it easy for the users to upload proposals to the fo-
rum or simply just print maps from the service. As with the OpenLayers all code is created based on tutori-
als and examples from: http://www.geoext.org/examples.html#examples
The GeoExt extension that adds more possibilities to the OpenLayers map window, have to be installed on
our webserver and the java scripts must be included as external scripts to our code. In the script 7 you see
the 3 lines of code mandatory to use the GeoExt
Script 7 External GeoExt API javascripts
After adding this we can now use the GeoExt API. The code regarding the core product is now embedded
into a GeoExt function as script 8 illustrates.
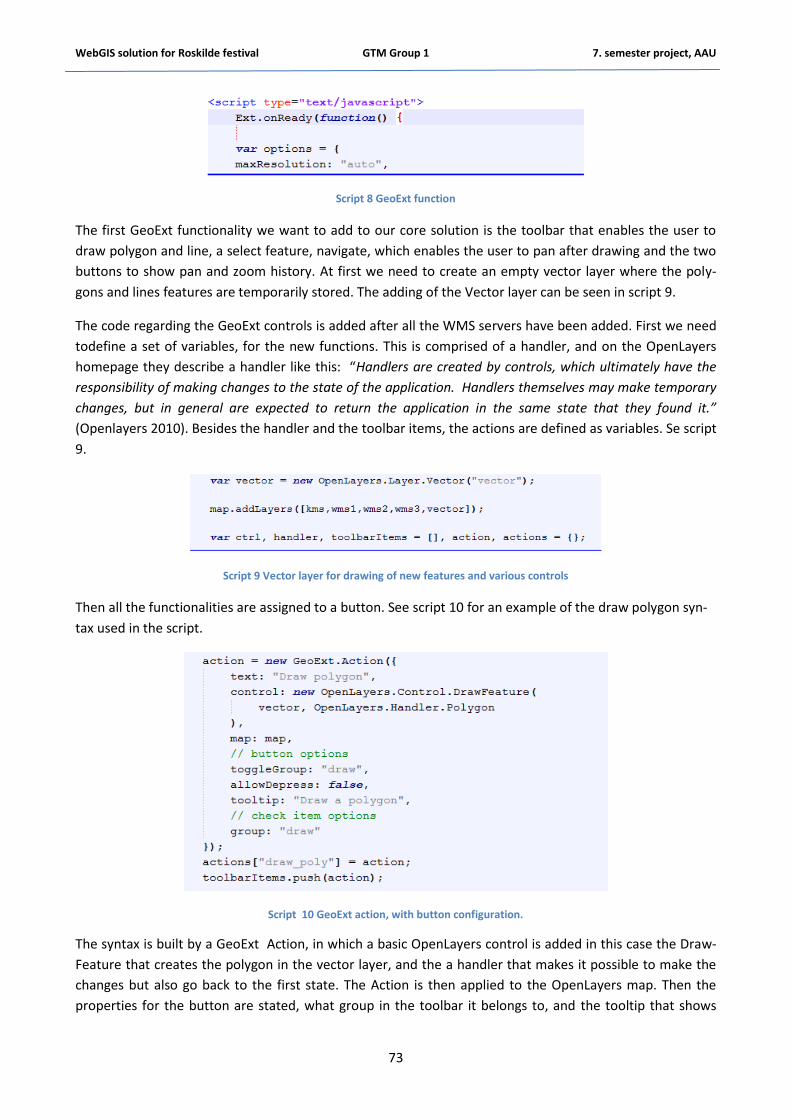
WebGIS solution for Roskilde festival GTM Group 1 7. semester project, AAU
73
Script 8 GeoExt function
The first GeoExt functionality we want to add to our core solution is the toolbar that enables the user to
draw polygon and line, a select feature, navigate, which enables the user to pan after drawing and the two
buttons to show pan and zoom history. At first we need to create an empty vector layer where the poly-
gons and lines features are temporarily stored. The adding of the Vector layer can be seen in script 9.
The code regarding the GeoExt controls is added after all the WMS servers have been added. First we need
todefine a set of variables, for the new functions. This is comprised of a handler, and on the OpenLayers
homepage they describe a handler like this: “Handlers are created by controls, which ultimately have the
responsibility of making changes to the state of the application. Handlers themselves may make temporary
changes, but in general are expected to return the application in the same state that they found it.”
(Openlayers 2010). Besides the handler and the toolbar items, the actions are defined as variables. Se script
9.
Script 9 Vector layer for drawing of new features and various controls
Then all the functionalities are assigned to a button. See script 10 for an example of the draw polygon syn-
tax used in the script.
Script 10 GeoExt action, with button configuration.
The syntax is built by a GeoExt Action, in which a basic OpenLayers control is added in this case the Draw-
Feature that creates the polygon in the vector layer, and the a handler that makes it possible to make the
changes but also go back to the first state. The Action is then applied to the OpenLayers map. Then the
properties for the button are stated, what group in the toolbar it belongs to, and the tooltip that shows
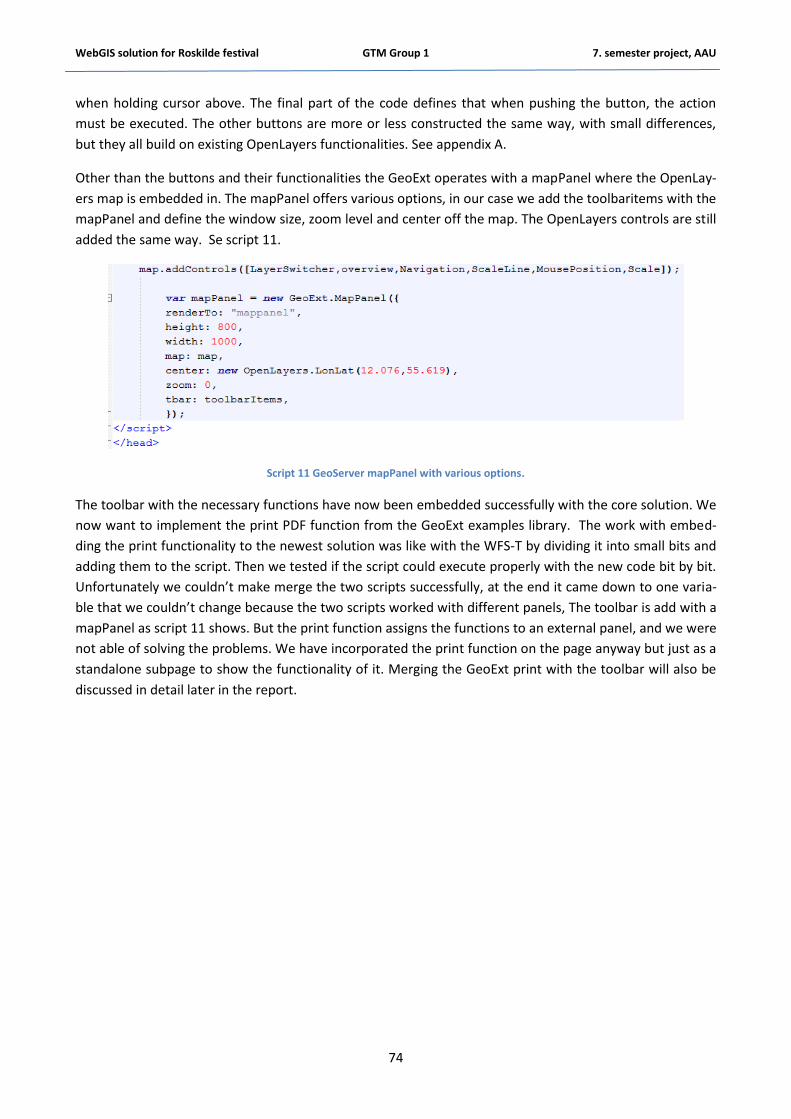
WebGIS solution for Roskilde festival GTM Group 1 7. semester project, AAU
74
when holding cursor above. The final part of the code defines that when pushing the button, the action
must be executed. The other buttons are more or less constructed the same way, with small differences,
but they all build on existing OpenLayers functionalities. See appendix A.
Other than the buttons and their functionalities the GeoExt operates with a mapPanel where the OpenLay-
ers map is embedded in. The mapPanel offers various options, in our case we add the toolbaritems with the
mapPanel and define the window size, zoom level and center off the map. The OpenLayers controls are still
added the same way. Se script 11.
Script 11 GeoServer mapPanel with various options.
The toolbar with the necessary functions have now been embedded successfully with the core solution. We
now want to implement the print PDF function from the GeoExt examples library. The work with embed-
ding the print functionality to the newest solution was like with the WFS-T by dividing it into small bits and
adding them to the script. Then we tested if the script could execute properly with the new code bit by bit.
Unfortunately we couldn’t make merge the two scripts successfully, at the end it came down to one varia-
ble that we couldn’t change because the two scripts worked with different panels, The toolbar is add with a
mapPanel as script 11 shows. But the print function assigns the functions to an external panel, and we were
not able of solving the problems. We have incorporated the print function on the page anyway but just as a
standalone subpage to show the functionality of it. Merging the GeoExt print with the toolbar will also be
discussed in detail later in the report.
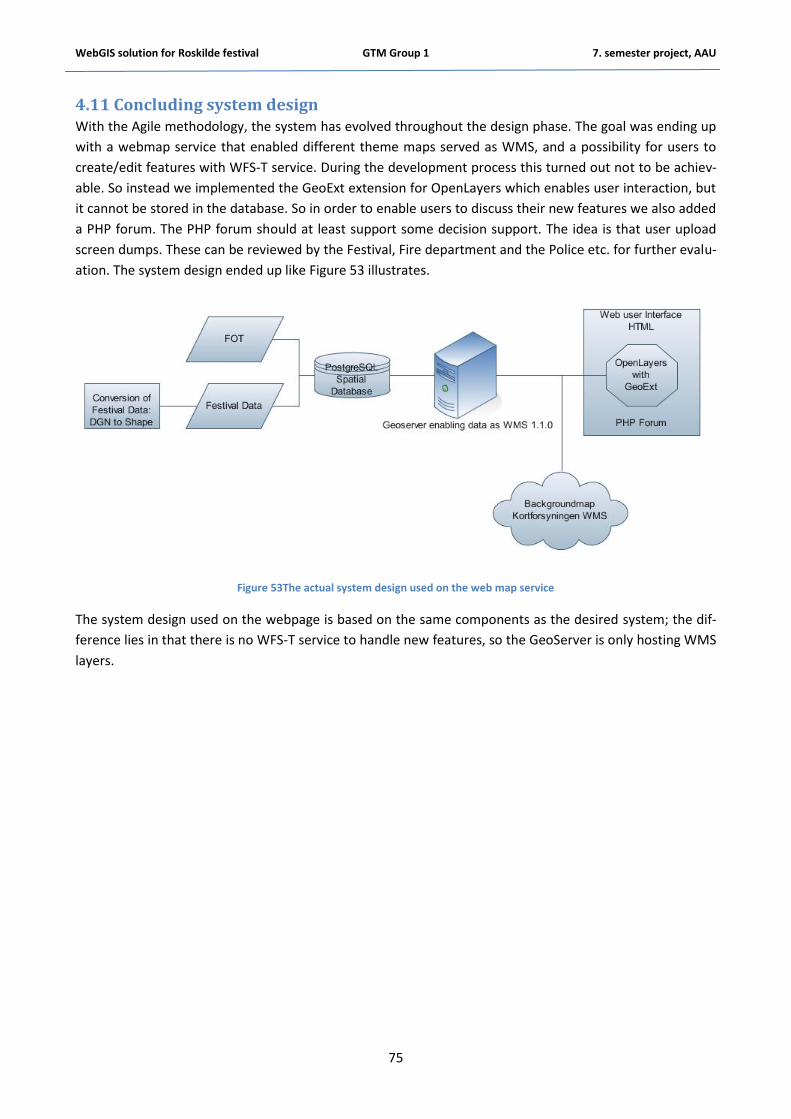
WebGIS solution for Roskilde festival GTM Group 1 7. semester project, AAU
75
4.11 Concluding system design With the Agile methodology, the system has evolved throughout the design phase. The goal was ending up
with a webmap service that enabled different theme maps served as WMS, and a possibility for users to
create/edit features with WFS-T service. During the development process this turned out not to be achiev-
able. So instead we implemented the GeoExt extension for OpenLayers which enables user interaction, but
it cannot be stored in the database. So in order to enable users to discuss their new features we also added
a PHP forum. The PHP forum should at least support some decision support. The idea is that user upload
screen dumps. These can be reviewed by the Festival, Fire department and the Police etc. for further evalu-
ation. The system design ended up like Figure 53 illustrates.
Figure 53The actual system design used on the web map service
The system design used on the webpage is based on the same components as the desired system; the dif-
ference lies in that there is no WFS-T service to handle new features, so the GeoServer is only hosting WMS
layers.
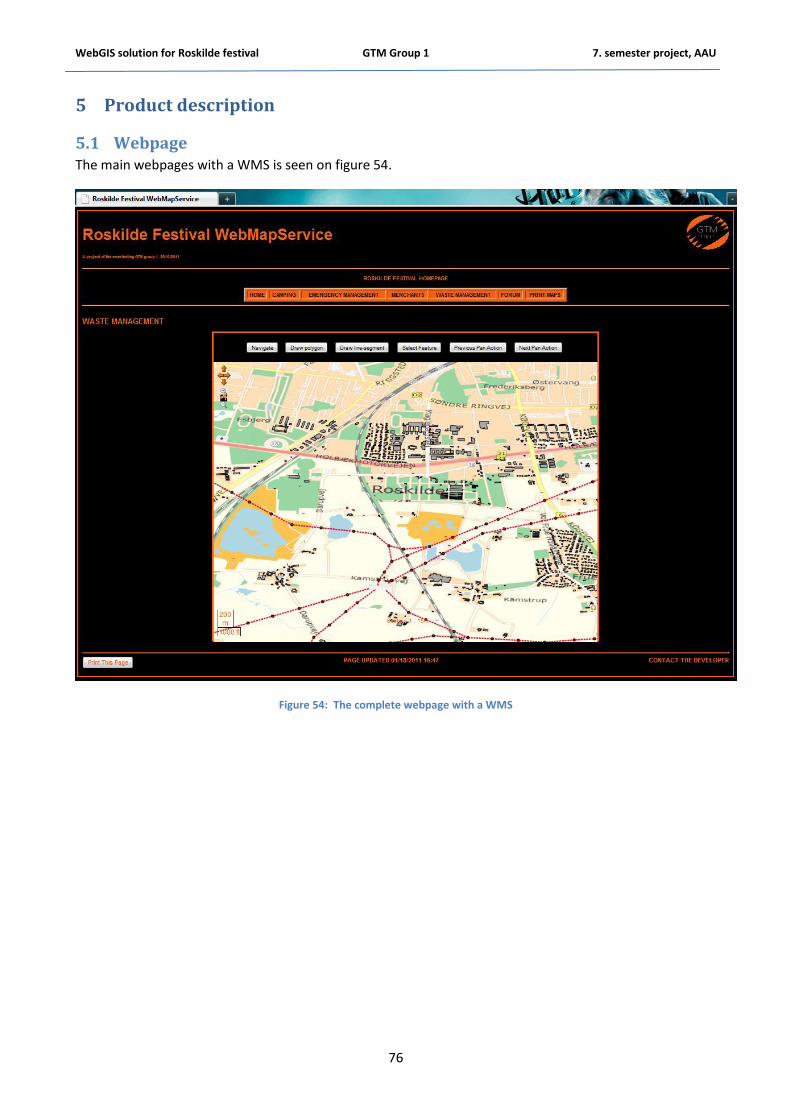
WebGIS solution for Roskilde festival GTM Group 1 7. semester project, AAU
76
5 Product description
5.1 Webpage The main webpages with a WMS is seen on figure 54.
Figure 54: The complete webpage with a WMS

WebGIS solution for Roskilde festival GTM Group 1 7. semester project, AAU
77
5.1.1 Content
The site consists of different contents controlled by a bar in the top of each page, sorted by Home, Maps
(ordered alphabetical), Forum and Print.
The groups of maps combined with FOT data are:
Camping: Data of the camping grounds for the festival guests.
Emergency Management: Data of fire equipment and emergency exits.
Merchants: Data of the different shops and merchants.
Waste Management: Data of location of the waste management.
The pages themselves (not the OpenLayers map window) have different functionalities which can be seen
with color codes from the bullets in Figure 55.
Links: to navigate between the different pages and go on to the official Roskilde Festival page.
Bar: with links to navigate between the pages.
Headers: to show brief information, of what is on the site.
Print Page: A possibility to make print of the page as seen.
Last Updated: Informations about when the site was last updated in the script (not spatial data).
Contact the developers: A possibility to contact the developers with questions or suggestions.
Logo: The designed logo.
WMS: The Map window.
GeoExt-buttons: The button used to the GeoExt functionalities as described.
Title
Figure 55 The Different content of the webpage

WebGIS solution for Roskilde festival GTM Group 1 7. semester project, AAU
78
5.2 The Map window
5.2.1 FOT data
We have selected 6 relevant FOT-data to include in the themed maps. Our experience of the festival says
that these layers are relevant due to their influence on the physical limitations for Roskilde Festival. The
layers are: Buildings (polygons), Pylons (points), Power lines (line), Lakes (polygons), Raw mining (gravel)
(polygons) and Windmills (points).
5.2.2 Background map
In order to ease to the overview and spatial location of data we have chosen to import KMS Topographical
map as background map. TheWMS layer can be loaded when having a login to kortforsyningen.dk.
The chosen map is the “topographic screen map” covering the whole of Denmark in 1:4000 to 1:8 million
scales, which is perfectly suited to show on webmap service as a background map. It contains mportant
information like road and city names depending on the scale of the map window. It is regularly updated
after the TOP10DK standards, meaning 20 % percent of the country is updated each year. See an example
in Figure 56. (KMS, 2005).
Figure 56: The topographic background map of KMS. Here a view of the festival area.
5.3 The data groups We have grouped the data into five different groups according to the way they are used and the practical
sections of the Roskilde Festival. The screenshots are overviews of the data at the basic set zoom level, but
to get detailed information, one must zoom further into the map.

WebGIS solution for Roskilde festival GTM Group 1 7. semester project, AAU
79
5.3.1 Camping
This dataset consists of 25 layers showing an overview of the camping areas made for the guests. The
camping data group consists mainly of different sections of the camping sites, mainly made as polygon da-
ta. Furthermore there is line data of roads and exits in the camping area. There is seen some overlap be-
tween the gravel-pit (raw mine) (light orange) and some of the camping areas (dark orange and brown are-
as) just below the middle of the map. This is because of these mining areas are expanding in size each year,
and take areas of camping away. From that we can see that the Festival data doesn’t seem updated from
the last year, because there is overlap between camping areas and the mining areas. See Figure 57.
Figure 57 The theme map with different camping sites and the FOT baselayers.

WebGIS solution for Roskilde festival GTM Group 1 7. semester project, AAU
80
5.3.2 Emergency Management
This group consists of 14 layers showing an overview of security matters, mainly relevant to the Festival
security groups, the fire and police department. The data is represented by Gas fields (line and polygons),
different Emergency exits (line) and different fire-emergency equipment (line, points). Figure 58.
Figure 58 Theme map with Emergency routes etc and the FOT baselayers.

WebGIS solution for Roskilde festival GTM Group 1 7. semester project, AAU
81
5.3.3 Merchants
The merchants group consists of 17 different layers, and shows where the different merchants have placed
their shops and facilities in the festival area. The data is represented by Tuborg (polygon and line) and dif-
ferent shopping sections; A, B and C (polygon and line data). Figure 59.
Figure 59 The different merchants on the Festival grounds and the FOT baselayers

WebGIS solution for Roskilde festival GTM Group 1 7. semester project, AAU
82
5.3.4 Waste Management
The merchants group consists of 3 different layers, and shows where the different services and sections for
garbage handling are placed in the festival area. The data is represented by Compost (polygon) and Gar-
bage (polygon). Figure 60.
Figure 60 All relevant layers of the renovation team during the Festival and the FOT baselayers
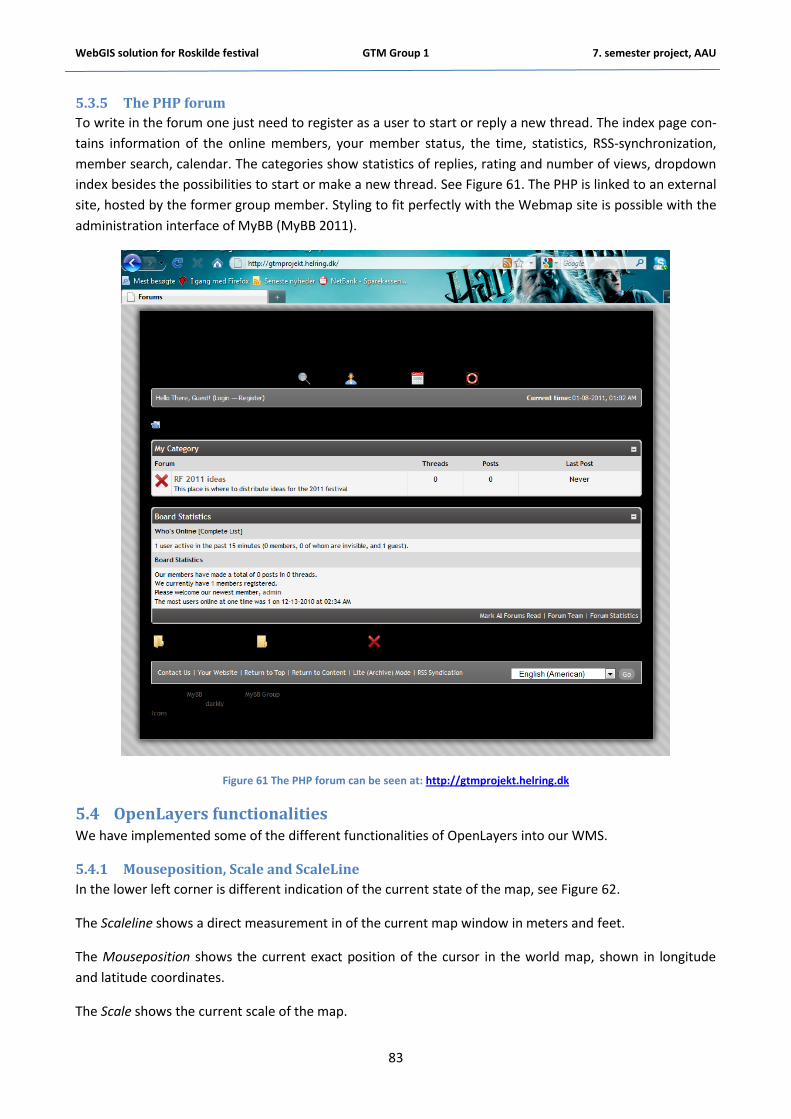
WebGIS solution for Roskilde festival GTM Group 1 7. semester project, AAU
83
5.3.5 The PHP forum
To write in the forum one just need to register as a user to start or reply a new thread. The index page con-
tains information of the online members, your member status, the time, statistics, RSS-synchronization,
member search, calendar. The categories show statistics of replies, rating and number of views, dropdown
index besides the possibilities to start or make a new thread. See Figure 61. The PHP is linked to an external
site, hosted by the former group member. Styling to fit perfectly with the Webmap site is possible with the
administration interface of MyBB (MyBB 2011).
Figure 61 The PHP forum can be seen at: http://gtmprojekt.helring.dk
5.4 OpenLayers functionalities We have implemented some of the different functionalities of OpenLayers into our WMS.
5.4.1 Mouseposition, Scale and ScaleLine
In the lower left corner is different indication of the current state of the map, see Figure 62.
The Scaleline shows a direct measurement in of the current map window in meters and feet.
The Mouseposition shows the current exact position of the cursor in the world map, shown in longitude
and latitude coordinates.
The Scale shows the current scale of the map.

WebGIS solution for Roskilde festival GTM Group 1 7. semester project, AAU
84
Figure 62 Mouse position, Scale and Scaleline.
5.4.2 LayerSwitcher
The Layerswitcher is the control panel; it is used to turn layers in the map window on and off. The KMS
service works as baselayer and is always turned on. We have named the layers in our own in the script, and
this is the closest we could get to a legend in the map window. See Figure 63.
Figure 63 The LayerSwitcher
5.4.3 Overview Map
The Overview map shows a small map in the lower right corner of the WMS if activated. The small map
shows an indication of where the current map window is placed in the current area. Figure 64.

WebGIS solution for Roskilde festival GTM Group 1 7. semester project, AAU
85
Figure 64 The overview map in the lower right corner
5.5 GeoExt functionalities 5.5.1 Draw
Draw makes it possible to draw polygons and lines in the script, used for highlighting or emphasizing ob-
jects in the map. Unfortunately the drawings can’t be saved, but this is the closest we could get to make it
possible for users to create new features. The objects can be selected using the “Select” button; it selects
and highlights an object. By pushing the “Navigation” button the user is returned to normal pan-mode. See
an example in Figure 65.
Figure 65 The draw line and draw polygon functionalities (orange), and a select of one them (blue)
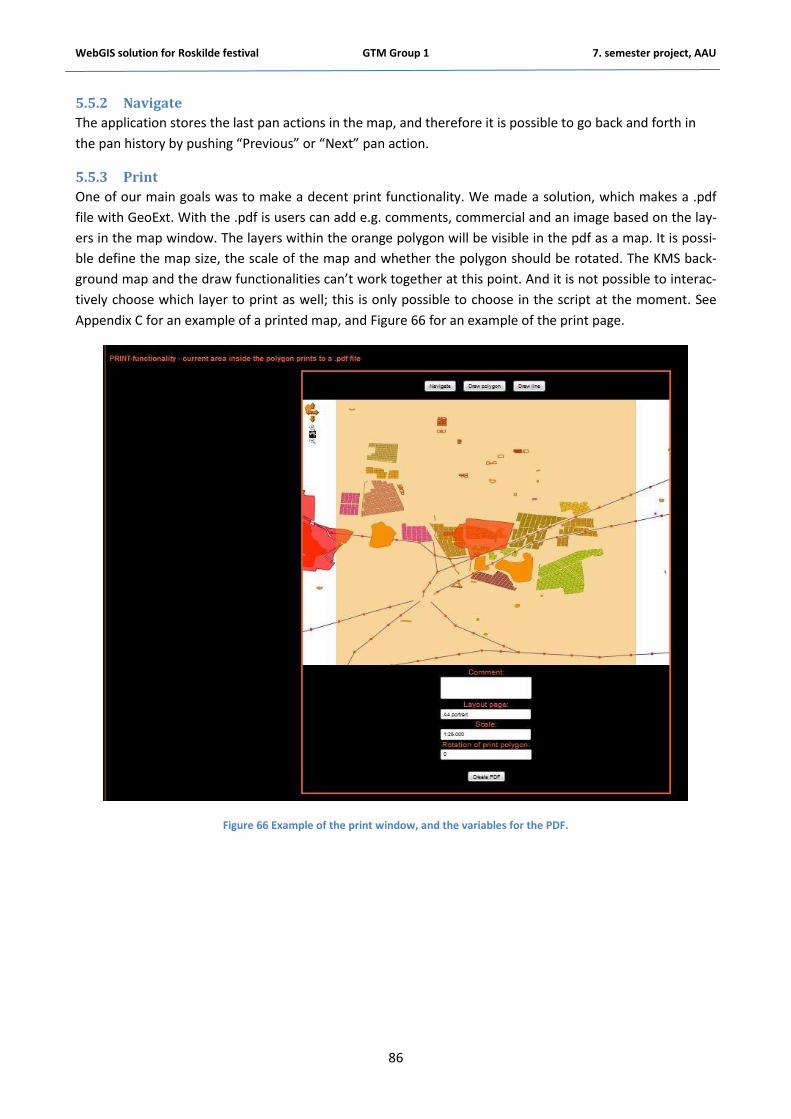
WebGIS solution for Roskilde festival GTM Group 1 7. semester project, AAU
86
5.5.2 Navigate
The application stores the last pan actions in the map, and therefore it is possible to go back and forth in
the pan history by pushing “Previous” or “Next” pan action.
5.5.3 Print
One of our main goals was to make a decent print functionality. We made a solution, which makes a .pdf
file with GeoExt. With the .pdf is users can add e.g. comments, commercial and an image based on the lay-
ers in the map window. The layers within the orange polygon will be visible in the pdf as a map. It is possi-
ble define the map size, the scale of the map and whether the polygon should be rotated. The KMS back-
ground map and the draw functionalities can’t work together at this point. And it is not possible to interac-
tively choose which layer to print as well; this is only possible to choose in the script at the moment. See
Appendix C for an example of a printed map, and Figure 66 for an example of the print page.
Figure 66 Example of the print window, and the variables for the PDF.

WebGIS solution for Roskilde festival GTM Group 1 7. semester project, AAU
87
6 Discussion The main objective of this project has been to develop a Web GIS solution for the Roskilde Festival using
open source solutions as supplement to the paper map solution, which is currently being used by the or-
ganizers of the festival. When trying to achieve the objectives mentioned, we have gone through various
processes and stages with theoretical background which yielded a wealth of results. In this chapter we will
discuss thoroughly the interpretation, the significance and implications of our results.
6.1 Project data The Festival data used in this project does not meet the OGC standards for WebGIS, compared to e.g. the
FOT data. We had no idea about the last update of data and there is a mixture of data on different levels
making it a bit difficult to interpret and address. We see in this project how strong WebGIS can be com-
pared to using only CAD system in handling spatial data. The CAD systems only deal with spatial data as
graphics, with symbols to represent their meaning which are organized into layers. With the WebGIS the
data becomes just representation of the real data from the database - this makes it weak data which is easy
to manipulate. In the data handling process we did not do data validation before importing into PostGIS.
Meaning we did not determine the geometric quality and integrity of the dataset, even though we over-
layed the vector data with a topographic map to check. In this case there may be some features which can
be overlapping and we can miss some of these. We must emphasize that the system we developed is not a
complete shift or replacement to the CAD system; but made to supplement it.
6.2 The process of building a WebGIS When working with the design of a WebGIS solution, whether the job is done for a client who pays you to
the job or it’s done as a private project your website, it is essential that you keep in mind what the client
expects from the system. But it is even as important to realize what demands the future users will have to
the system, if your webmap is to become a success. Otherwise the resources spent creating map service is
wasted. So before the process of designing the actual system starts, it is important to turn these demands
into actual objectives which can be implemented as tangible requirements in the design and programming
phase. The need to analyze and research client and user demands can be done and structured in many dif-
ferent ways. We have structured out work through a requirement specification, based on the goal of creat-
ing a webmap portal which goal was to provide easy access to maps and interaction between user groups
among others to ease the decision making process. Since we worked with a fictitious client, we could only
create the requirements based on what needs we could imagine the festival having. But analyses of user
groups, and their needs, qualifications and incitement to use the end product - could have contributed with
further requirements. When working with an actual client, a close cooperation is very important. This is one
of the points emphasized by the Agile principles, but also when working with other strategies than the agile
approach it is important to plan well, e.g. the waterfall method is based on thoroughly planning. Software
functionalities are not the only important requirements to consider, hardware can like missing functionali-
ties also become a bottle neck in the system. Especially when developing commercial solutions where
number of users can increase rapidly, it is important to design the system so it can be scaled in the same
pace as the numbers of user increases. The hardware requirements have not been given much thought in
our design, since we execute everything as localhost, but also because the created solution is created to a
limited numbers of users with the current functionalities.
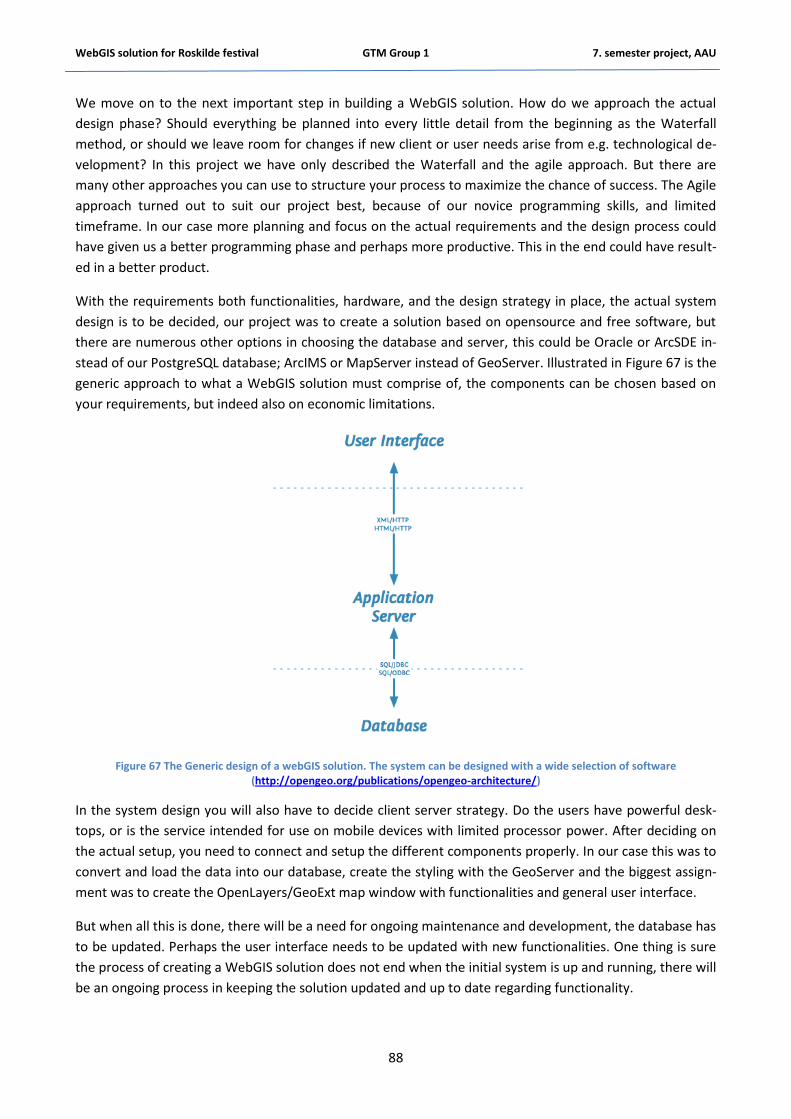
WebGIS solution for Roskilde festival GTM Group 1 7. semester project, AAU
88
We move on to the next important step in building a WebGIS solution. How do we approach the actual
design phase? Should everything be planned into every little detail from the beginning as the Waterfall
method, or should we leave room for changes if new client or user needs arise from e.g. technological de-
velopment? In this project we have only described the Waterfall and the agile approach. But there are
many other approaches you can use to structure your process to maximize the chance of success. The Agile
approach turned out to suit our project best, because of our novice programming skills, and limited
timeframe. In our case more planning and focus on the actual requirements and the design process could
have given us a better programming phase and perhaps more productive. This in the end could have result-
ed in a better product.
With the requirements both functionalities, hardware, and the design strategy in place, the actual system
design is to be decided, our project was to create a solution based on opensource and free software, but
there are numerous other options in choosing the database and server, this could be Oracle or ArcSDE in-
stead of our PostgreSQL database; ArcIMS or MapServer instead of GeoServer. Illustrated in Figure 67 is the
generic approach to what a WebGIS solution must comprise of, the components can be chosen based on
your requirements, but indeed also on economic limitations.
Figure 67 The Generic design of a webGIS solution. The system can be designed with a wide selection of software (http://opengeo.org/publications/opengeo-architecture/)
In the system design you will also have to decide client server strategy. Do the users have powerful desk-
tops, or is the service intended for use on mobile devices with limited processor power. After deciding on
the actual setup, you need to connect and setup the different components properly. In our case this was to
convert and load the data into our database, create the styling with the GeoServer and the biggest assign-
ment was to create the OpenLayers/GeoExt map window with functionalities and general user interface.
But when all this is done, there will be a need for ongoing maintenance and development, the database has
to be updated. Perhaps the user interface needs to be updated with new functionalities. One thing is sure
the process of creating a WebGIS solution does not end when the initial system is up and running, there will
be an ongoing process in keeping the solution updated and up to date regarding functionality.

WebGIS solution for Roskilde festival GTM Group 1 7. semester project, AAU
89
6.3 Implementations problems of WebGIS
6.3.1 Technical and performance problems
Our webGIS solution, meets the specification of our core product. The festival crew can update data in a
central database. The webpage gives users access to updated data and maps composed to fit different
themes. Additionally we have added the GeoExt functions which combined with the PHP-forum at least
leaves some room for user groups to discuss different proposals. It does not support the same functionali-
ties as the WFS-T could have offered. The biggest technical challenges we faced creating webGIS solution is
discussed below.
6.3.2 Coordinate system
Working with different coordinate systems in OpenLayers turned out to be quite harder than expected. For
our webmap solution we need to display our data in the EPSG:25832(UTM ZONE 32, ETRS 89). All the data
is stored in GeoServer in that projection. Unfortunately OpenLayers reprojects the data into the default
EPSG:4326 (WGS84). This should only happen if the OpenLayers doesn’t support our desired projection. We
have tried out different solutions. In the OpenLayers syntax there are different ways off deciding how to
project data. As shown in the methodology regarding OpenLayers you can add it as an option as shown in
script 12.
Script 12 The various options regarding the projection.
This should result that all layers both base layers and overlays should be reprojected. When using this setup
the code executes without errors. But simply just leaves behind an empty OpenLayers window, containing
the tools and the layers displays in the layers switcher. But the WMS’s do not occur. Se Figure 68.

WebGIS solution for Roskilde festival GTM Group 1 7. semester project, AAU
90
Figure 68 The result when using the EPSG:25832:An empty map window. But a browser requesting data like it should.
The browser even acts like it retrieves the layers from kortforsyningen and the GeoServer. We have also
tried to add the projection as a property of the baselayer, this should result in that the overlays automati-
cally should display in EPSG:25832. See script 13 with example of adding the projection as a property of the
base layer.
Script 13 Adding the projection as a property of the baselayer.
The result is still the same. To ensure that the WMS receives the GETMAP request with the projection right,
we tried it with the EPSG:3044 which is the ETRS-TM32 projection that also covers Denmark. We know
from the GETCAPABILITY request, that kortforsyningen doesn’t support this projection. When adding this to
the code, the WMS reacts as it should and tells us that the projection isn’t supported. See Figure 69
Figure 69 The return when making a GetMap request with unsupported EPSG.
So it seems that the projection we want to use isn’t supported. In addition to this we have stumbled upon
an independent project called Proj4js. We have tried to embed this is our script but haven’t been success-
ful. The Proj4js is added as an external JavaScript, and we also add a link to the desired projection, either
online or locally. In this case we retrieve it from an online source. See script 14.
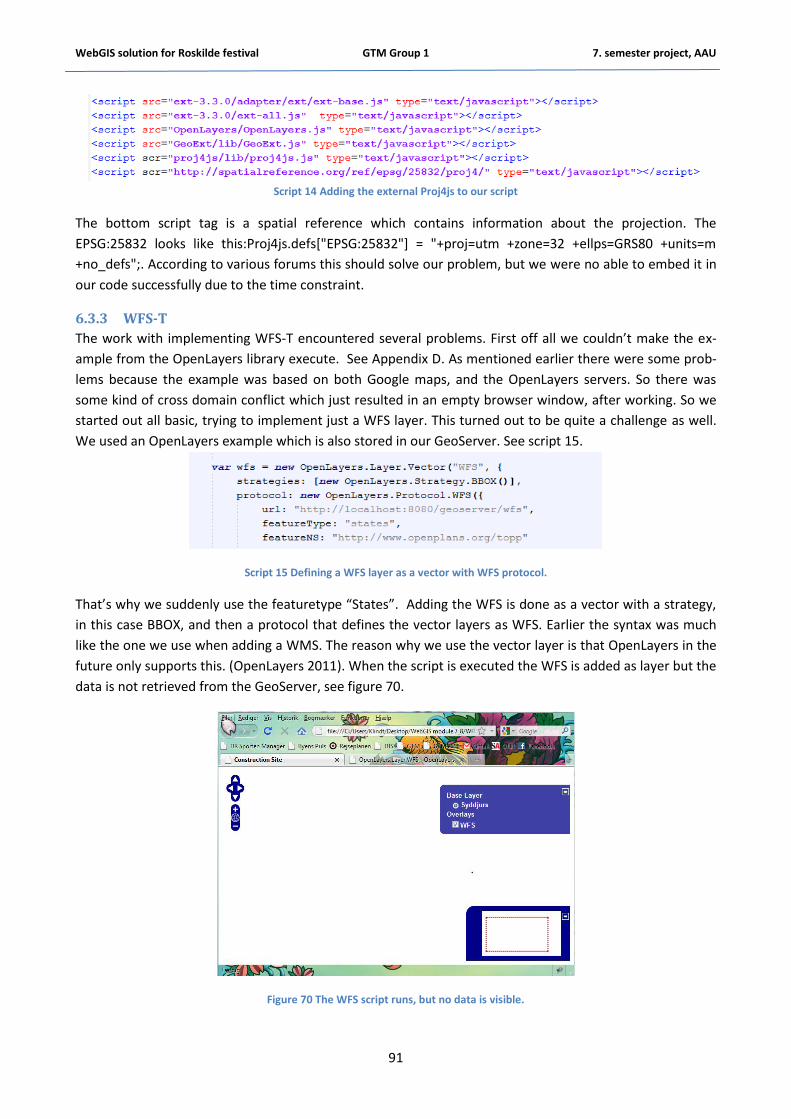
WebGIS solution for Roskilde festival GTM Group 1 7. semester project, AAU
91
Script 14 Adding the external Proj4js to our script
The bottom script tag is a spatial reference which contains information about the projection. The
EPSG:25832 looks like this:Proj4js.defs["EPSG:25832"] = "+proj=utm +zone=32 +ellps=GRS80 +units=m
+no_defs";. According to various forums this should solve our problem, but we were no able to embed it in
our code successfully due to the time constraint.
6.3.3 WFS-T
The work with implementing WFS-T encountered several problems. First off all we couldn’t make the ex-
ample from the OpenLayers library execute. See Appendix D. As mentioned earlier there were some prob-
lems because the example was based on both Google maps, and the OpenLayers servers. So there was
some kind of cross domain conflict which just resulted in an empty browser window, after working. So we
started out all basic, trying to implement just a WFS layer. This turned out to be quite a challenge as well.
We used an OpenLayers example which is also stored in our GeoServer. See script 15.
Script 15 Defining a WFS layer as a vector with WFS protocol.
That’s why we suddenly use the featuretype “States”. Adding the WFS is done as a vector with a strategy,
in this case BBOX, and then a protocol that defines the vector layers as WFS. Earlier the syntax was much
like the one we use when adding a WMS. The reason why we use the vector layer is that OpenLayers in the
future only supports this. (OpenLayers 2011). When the script is executed the WFS is added as layer but the
data is not retrieved from the GeoServer, see figure 70.
Figure 70 The WFS script runs, but no data is visible.

WebGIS solution for Roskilde festival GTM Group 1 7. semester project, AAU
92
We have tried several different approaches with our own layers. In the example above the FeatureNS
(namespace) is provided as an URL, but it simply just links to a webpage. We have tried substituting this
with the feature namespace from the GeoServer. And we can’t figure out exactly what the meaning of the
namespace is. With the WFS-T more difficulties occur, the code is more complex. Since we now also have to
implement a save strategy and a schema that defines how the created or edited features should be re-
moved see script 16.
Script 16 Vector layer with WFS protocol
We add the WFS version, we add the namespace from the GeoServer, we insert what the column where
the geometry is stored in the database is named, and we apply a DescribeFeatureType schema so the Ge-
oServer have a standard for storing the newly created data. Again we have tried different approaches re-
garding the namespace and schema, but with no success. The WFS-T turned out to be too complicated for
our current programming skills.
6.3.4 Toolbar and Print functionalities
After implementing the GeoExt toolbar, we wanted to merge this with the print functionality. This resulted
in some new challenges. First of all we had to install an extension to the GeoServer and include a script tag
with the print configuration. See script 17.
Script 17 Adding the external MapFish print module to our script
The info.json gives us different opportunities of customizing the PDF print e.g. defining scales, paper size
and dpi.
The whole script with Toolbar + Print can be found in appendix A and B. The Script can be executed, but the
buttons haven’t been assigned any abilities. Because when doing so, there is a conflict between two varia-
bles both named map. In script 18, and 19 the code where map is used in both syntaxes is seen.
Script 18The Mappanel to the print function, this controls the polygon that defines the extent off the print.
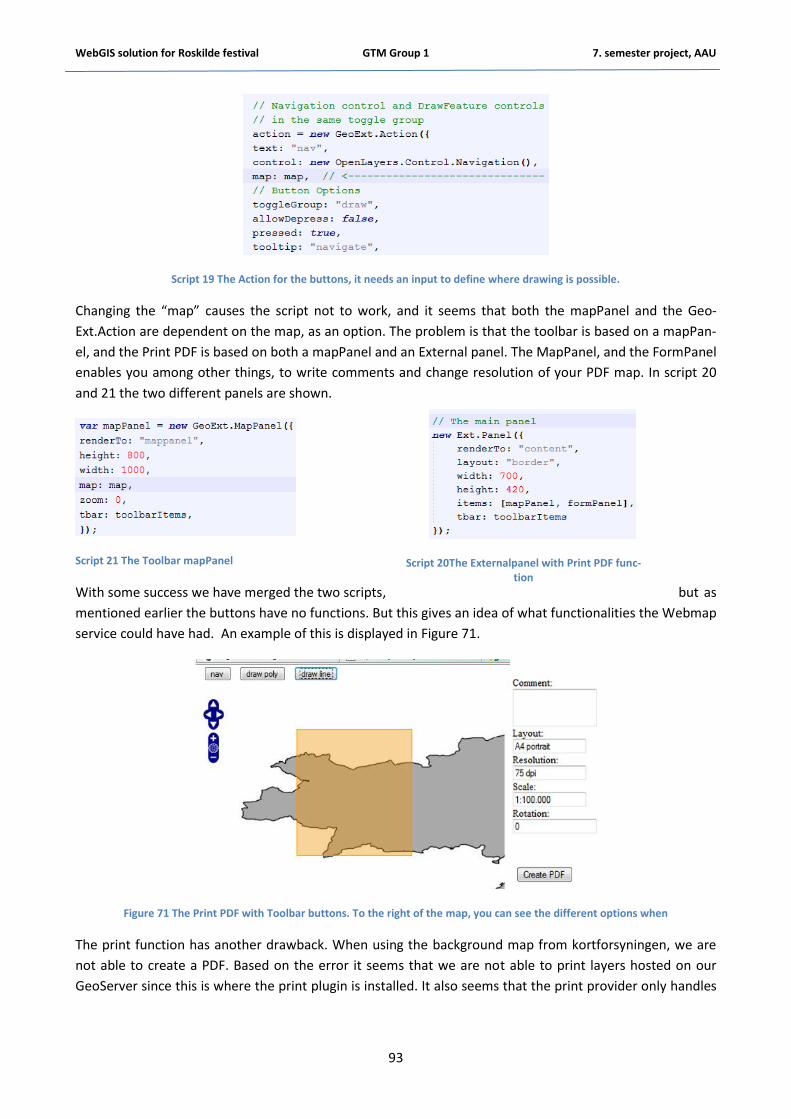
WebGIS solution for Roskilde festival GTM Group 1 7. semester project, AAU
93
Script 19 The Action for the buttons, it needs an input to define where drawing is possible.
Changing the “map” causes the script not to work, and it seems that both the mapPanel and the Geo-
Ext.Action are dependent on the map, as an option. The problem is that the toolbar is based on a mapPan-
el, and the Print PDF is based on both a mapPanel and an External panel. The MapPanel, and the FormPanel
enables you among other things, to write comments and change resolution of your PDF map. In script 20
and 21 the two different panels are shown.
Script 21 The Toolbar mapPanel
With some success we have merged the two scripts, but as
mentioned earlier the buttons have no functions. But this gives an idea of what functionalities the Webmap
service could have had. An example of this is displayed in Figure 71.
Figure 71 The Print PDF with Toolbar buttons. To the right of the map, you can see the different options when
The print function has another drawback. When using the background map from kortforsyningen, we are
not able to create a PDF. Based on the error it seems that we are not able to print layers hosted on our
GeoServer since this is where the print plugin is installed. It also seems that the print provider only handles
Script 20The Externalpanel with Print PDF func-tion

WebGIS solution for Roskilde festival GTM Group 1 7. semester project, AAU
94
a limited numbers of layers, because we were not able to include more than 7-8 layers in a PDF. More lay-
ers simply just results in an empty map window.
Some of the challenges could possibly be solved if we had more time, but a lot of the problems relate to the
fact that both OpenLayers and GeoExt is opensource freeware. During the process it has been very hard for
us to find the needed documentation on how to implement different features. Both OpenLayers and Geo-
Ext have an example library - but as shown with the toolbar and print functions, the two examples uses
different ways of embedding functions into the map window. And as stated earlier we have not been able
to solve that problem. The same applies with the coordinate system, the script runs but no data is dis-
played, and we haven’t been capable of finding official documentation, about the support of the EPSG that
we want to use. In different forums word is that it’s not supported and that must be the conclusion. The
WFS is created exactly as an OpenLayers example but with our own GeoServer, again no data is displayed.
Except from the problems with creating the code and making the elements work together, there are also
some performance problems. With the current system setup, all the Layers are being requested from the
same webserver with GeoServer. This result is a long loading time on the webpage; this is with just one
user requesting data on a local host. With multiple users requesting data via the internet, the loading time
would be increased further. So in order to increase performance the system must be tuned to meet the
requirement from multiple users. The first and easiest solution would be to have a high end and powerful
server as host. This could probably reduce loading time. Another approach could be a multi-server strategy
as illustrated in Figure 72.
Figure 72 Multiple webservers to handle the requests from users and retrieve data from the central database.
This should ease the workload for the servers. When using our system, the server’s use of processing power
seems to be the limitation. So this could be a strategy to improve performance and prepare tune the sys-
tem to handle request from multiple users with acceptable loading time.

WebGIS solution for Roskilde festival GTM Group 1 7. semester project, AAU
95
6.4 Opensource software The Roskilde Festival is a non-profit organization, and is mainly based on voluntary work. Every year around
25.000 volunteers makes sure that the festival is a reality. So the use of opensource and free software to
create the web map service is in the spirit of the festival. One could argue that the cost of acquiring licenses
for paid software would be so expensive that a webmap service never would be considered as a solution
for the festival, and valuable resources would be wasted year after year.
Throughout the work with Roskilde festival web map service we have made an example of that it is possible
to create a web map service based on opensource software. And it is possible with a lot of different setups,
as discussed in the introduction; there are several other frameworks for building web map applications.
Mapfish, GeoExt, OpenLayers etc. And the selection keeps growing, e.g. the GeoExt that is included in our
final solution where just released as 1.0 this October. It seems that the interoperability is increasing - the
GeoExt builds on top of OpenLayers, but the print module is also based on a Mapfish print module for the
GeoServer. Based on the different examples libraries, it seems that there are plenty of opportunities within
the opensource webmapping society to create a rich webmap service, which supports all the functions that
the festival could use for planning the festival and the security at the festival. The development of the web
mapping tools continues to evolve, and this can lead to even more advanced analysis tools. But this can
also enable easier implementation, which could result in even lower costs of creating the services.
As novice users of the OpenLayers and GeoExt and JavaScript programming in general we have faced quite
few challenges working with the software. As discussed earlier we had difficulties to find the right docu-
mentation on the code. The examples library was a great help, but when embedding functions from various
scripts, the different syntaxes from the examples, was hard to merge successfully. This was the case with
OpenLayers and GeoExt. Actually the OpenLayers API is well documented, but as novice programmers it is
very hard to translate it into creating working code. Some help is available through various forums, but
perhaps we haven’t used the opportunity enough. The GeoExt is at the moment not very well documented,
as mentioned earlier version 1.0 was just released few months ago. So the usability of GeoExt will for sure
be better in the future, as more developers and users start working with the tools and discover new solu-
tions. So the possibilities for creating rich web map services are there, in our case our programming skills
and knowledge was the limitation.

WebGIS solution for Roskilde festival GTM Group 1 7. semester project, AAU
96
7 Perspectives
7.1 Further development of the product There are many possible solutions for further development of this project. We see our project as in an early
development phase, and with more work time there are many possibilities to extend functionalities, per-
formance and the user interface.
7.1.1 General WMS
A major problem for our WMS is that the performance is quite very low. It is very hard for one CPU to run
the request for the data, and tests shows that up to 100 % of a dual core processor is used in the process. In
a future development this problem would be solved by passing the data on to several different host servers
to let the burden be shared and spread, and ease each processing of layers upon requests.
We didn’t succeed to put our webpage on a real webserver. Instead we made a local host server which
services requests from the client (the browser) in the PostGIS database. We use Apache as a localhost, and
this would be proper software to use since it is opensource and well-established software used widely on
the internet. In a near future it would be possible to load the webpage and applications to a webserver for
processing and open access.
Among the festival data is access to a number of high resolution raster orthophotos of the festival area.
Instead of loading a KMS service as the background map we would like to load the provided orthophotos on
our own server and incorporate them in the system design. There is just one major problem to this; it is not
possible in PostGreSQL – yet. This would make it possible to update the data on a regular basis, since the
festival make new images each year.
Another major miss from our WMS is the lack of a legend. The only way to get an overview of data is by
using the Layerswitcher implemented in OpenLayers. Both OpenLayers and the application GeoExt has
functionalities regarding a legend, we have unfortunately not been able to implement this in our project at
this point.
During the whole development phase we have had big problems to with the projection of our data, which
we were not able to solve in any way. It gives a quite bad image of the representation of the data, and
therefore this is a major problem to be solved. The problem seems that the projection given to these local
Danish data is not supported by OpenLayers. In future development we would contact OpenLayers or other
capable developers of this kind of WMS solution, to find a solution.
When making a webserver to upload our data on it would be obvious to make different external documents
for e.g. our CSS and JavaScript’s. This would make it possible to have these documents separate from the
rest of the html document, and is then easy editable for each group of data. Furthermore it would enhance
the overview of the script, and we can hide our project secrets.
If having an official corporation with the Roskilde Festival it would be appropriate to work together with the
Web designers of the official GIS and webpage developers of the festival, to make design and implementa-
tion together with the more official parts of the site.
A necessary feature of having a good WebGIS solution would also be to have some kind of restricted user
interface where a login is necessary to gain access to the site. This is necessary as the site develops into a
portal for administration services of the different workgroups in the festival, where editing upload and
WebGIS solution for Roskilde festival GTM Group 1 7. semester project, AAU
97
download of data is possible. This restricted user interface should be connected to the PHP forum we have
created
7.1.2 Functionalities of GeoExt
The .pdf print functionality provided by GeoExt, we have made it with our Webmap solution. Several limita-
tions make it desirable to have extended possibilities with this service. We are not able to choose which
layers are printed from the map window, only through hard coding it into the script. Here it would have
been good to have some kind of layer switcher in the user interface. Another limitation that must be ad-
dressed is that we are only able to print up to 8 layers at the same time. Whether this was a limitation from
the application or limitations on our laptop, server or database - we have not tested, but this to should be
solved.
The Draw functionality from the GeoExt applications ended up working, and is the closest we could get to
some a service that enabled users to post proposals on the webpage. We expect that there in future devel-
opment of the GeoExt could be a possibility to save, delete or edit the drawings made in the WMS or even-
tually export them as a layer. These drawing could be saved as temporary layers. This would make it easy
for the different workgroups to highlight different issues with the data.
7.1.3 WFS-T
We were not able to create a WFS-T to editing and uploading data to the maps; this is very advanced
WebGIS development and hasn’t succeeded properly for many developers. In the future this could make an
important feature because of possibilities with versioning – where users can be able to track former data
structures. Furthermore WFS-T could provide database storage for data, where to data can be uploaded,
updated and edited. Behind these functionalities of a WebGIS, there would be extended possibilities to
administer and do decision-making for the geographical placement of objects in the festival area.
7.1.4 Data
The data conversion, merging and clean up could be whole project in itself – the conversion from CAD to
shape is not painless. The data we received from the Roskilde Festival is developed without standards
throughout many years and therefore there is very little structure here. Decisions of relevant or irrelevant
data must be made to get a neat dataset with real possibilities of
We have included FOT in this project to compare with and supplement our own data. The festival can have
this data as an ideal of how to make standards with GIS data, for their future development of the data.
After a data restructuring this could provide a strong and healthy structure for a good dataset.
7.1.5 Ideas
There could be exciting possibilities to let the users choose their own layout and visualization of the data. If
users have specific needs or wishes to the output of a printed map, it could be nice to have e.g. a palette to
choose colors from. The most common solution to this at the moment is simply putting in copies of the
whole datasets but with different styling’s.
Mapfish is a JavaScript extension to OpenLayers much like GeoExt is in many
ways. Mapfish provides even more services than GeoExt does, but have also
more years under development behind them. Among features are WebService
and Search functionalities. We could have chosen to implement this applica-
tion in our project, but we found it much harder to implement with our novice skills at programming. The
implantation of this interface could maybe solve some of our problems at this point and extent the possibil-

WebGIS solution for Roskilde festival GTM Group 1 7. semester project, AAU
98
ities of development of our product. But we wouldn’t be surprised if other problems could occur with this
extension.
Furthermore it could be interesting to include a WPS (Web Processing Service) or analysis tools if the da-
taset where extended with other spatial data for the festival – e.g. the density of tents in a camping area.
This could make new varieties to the analysis for the administrators of the festival – where to place mer-
chant, exits or toilets.
7.2 The future of GIS The use of GIS is expanding around the world. GIS is developing from normal mapping and geospatial analy-
sis to merge with other genres like IT infrastructure, engineering and science. Especially since GIS moved on
to the WebGIS versions GIS isn’t just a tool for specialist anymore. The mapping mashups like Google Maps,
Google Earth, Microsoft Virtual Earth and different Opensource initiatives has made interactive maps really
popular on the internet, and has furthermore introduced new possibilities of spatial awareness and sharing
(Hsu & Obe 2007) (Paulsen, Hinrich 2010) (Courtin &Cave-Ayland 2010). The GIS bloggers Hsu and Obe
names it:
“This new rise is what many refer to as NeoGeography. NeoGeography is still in its infancy; people are just
getting over the excitement of seeing dots in their hometown, and are quickly moving into the next level -
where more detailed questions are being asked about those dots and dots are no longer sufficient. We want
to draw trails such as trail of hurricane destruction, avian bird flu, track our movement with GPS, draw
boundaries and measure the densities of these based on some socio-ecological factor. “
(Hsu and Obe 2007, 18-01-2011)
There is an expanding need for storing tool generated information, security and ability to query in an easy
way in these spatial data. Here are opensource DBMS like PostGIS and other spatial databases continuous
useful solutions. Because there is a rise of geoportal software like Mapbender. A Geoportal are usually not
limited to displaying geodata, but also offer other different kind of information too - hence the need to
combine geospatial software with a CMS (Content Management System). This is also an example of the
modern way, which is to make one piece of software lead, and let all others follow this by using plugins.
Usually the software choice can be a CMS because it already has a lot of functionality like session handling
and database abstraction layers (Hsu & Obe 2007) (Paulsen, Hinrich 2010) (Courtin &Cave-Ayland 2010).
Other urgent matters in the very most future of GIS is the implementation of GUI’s to make e.g. import of
data, WFS-T and other WebGIS solutions flexible and easy to setup for the common user. Furthermore sim-
ple tools like implementation of tools like detection of incorrect data, or the development of raster support
in the WebGIS solutions are obvious.
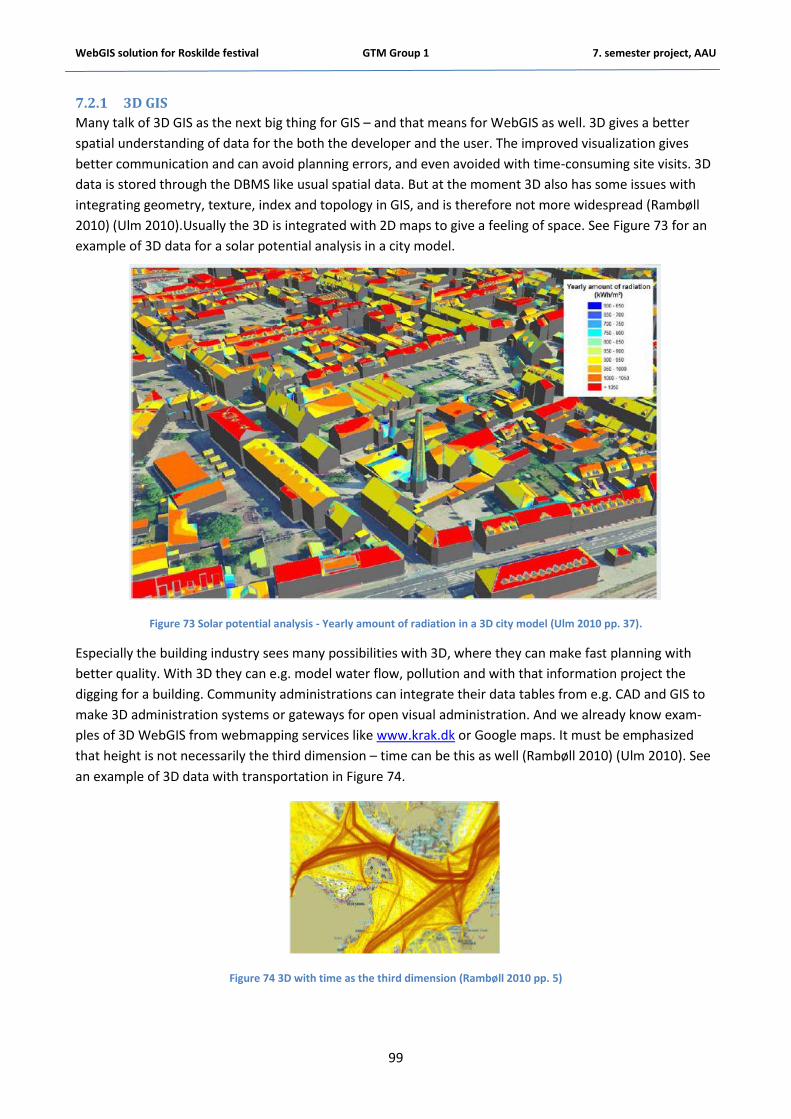
WebGIS solution for Roskilde festival GTM Group 1 7. semester project, AAU
99
7.2.1 3D GIS
Many talk of 3D GIS as the next big thing for GIS – and that means for WebGIS as well. 3D gives a better
spatial understanding of data for the both the developer and the user. The improved visualization gives
better communication and can avoid planning errors, and even avoided with time-consuming site visits. 3D
data is stored through the DBMS like usual spatial data. But at the moment 3D also has some issues with
integrating geometry, texture, index and topology in GIS, and is therefore not more widespread (Rambøll
2010) (Ulm 2010).Usually the 3D is integrated with 2D maps to give a feeling of space. See Figure 73 for an
example of 3D data for a solar potential analysis in a city model.
Figure 73 Solar potential analysis - Yearly amount of radiation in a 3D city model (Ulm 2010 pp. 37).
Especially the building industry sees many possibilities with 3D, where they can make fast planning with
better quality. With 3D they can e.g. model water flow, pollution and with that information project the
digging for a building. Community administrations can integrate their data tables from e.g. CAD and GIS to
make 3D administration systems or gateways for open visual administration. And we already know exam-
ples of 3D WebGIS from webmapping services like www.krak.dk or Google maps. It must be emphasized
that height is not necessarily the third dimension – time can be this as well (Rambøll 2010) (Ulm 2010). See
an example of 3D data with transportation in Figure 74.
Figure 74 3D with time as the third dimension (Rambøll 2010 pp. 5)

WebGIS solution for Roskilde festival GTM Group 1 7. semester project, AAU
100
8 Conclusion When making this kind of project, one needs to have a lot of focus on the process. We have used the agile
approach when developing the product because this seem by far, as a reasonable approach when develop-
ing and designing scripts, data conversion and database and server management. Our approach was to
design a web mapping service with WFS-T before realizing the big challenges connected to this. To over-
come the WFS-T solution, we have used the agile approach and satisfied the basic need for a WebGIS solu-
tion by making a WMS with different functionalities, and still used opensource as the model.
Even when creating and designing a map service we find a number of major problems of making the solu-
tions functionality as desired. E.g. we find it hard to accept that we were not able to implement a correct
projection to the data or apply a legend to it. We succeeded to implement and design a functional site with
a WMS applied with some of the OpenLayers functionalities; among others mouse position and scale. Be-
sides that, we were able to implement a Print and draw solution made with GeoExt extensions to Openlay-
ers, and a forum for communication possibilities for the administration. Another issue was that after we
have been working with the Roskilde Festival dataset we have also realized that missing standards for these
data are a big challenge, because of the big effort it took to prepare it for a WebGIS solution. So when fac-
ing all of these challenges, there are as well a lot of major perspectives in the projects further development
and extended functionalities.
Working with opensource we see as a model and a possible future of the WebGIS development. But this
approach is not easy created at the moment, which we have faced during the development face. For novice
developers, as we see ourselves, a development of a WFS-T solution with opensource programming
seemed impossible. There is needed more skill and experience to overcome the obvious hurdles with pro-
gramming. And from there on there can be several problem with implementation and performance, which
we have experienced even when using only WMS layers. But we were able to create a functional, but lim-
ited user interface with functionalities only using opensource – and more time would only extend the quali-
ty of this product. We had also hoped that among the benefits of using opensource is the large communi-
ties connected to this. But since e.g. GeoExt is a new development the community is currently not exten-
sive, and our problems seems too specific (e.g. projection), we were not able to find any help there.
From this project we must conclude that things are not as easy as they look. And that the project re-
strictions, i.e., time and software means that that the desired solution cannot always be obtained. It re-
quired a lot of tenacity and patience to make just a few of the desired functionalities work in a WebGIS
solution, but the perspectives for this service seems unlimited.

WebGIS solution for Roskilde festival GTM Group 1 7. semester project, AAU
101
9 Bibliography Agile Manifesto A, 2001: Manifesto for agile software development. Retrieved at 16-12-2010 from:
http://agilemanifesto.org/
Agile Manifesto B, 2001: Principles behind the Agile Manifesto. Retrieved at 16-12-2010 from:
http://agilemanifesto.org/principles.html
Agile Methodology, 2008: Agile Methodology. Retrieved at 16-12-2010 from: http://www.agile-
methodology.com/
Agile Methodology, 2009: Reasons why Agile Methodology is used today. Retrieved at 16-12-2010 from:
http://www.agile-methodology.com/Reasons-why-Agile-Methodology-is-Used-Today_10.html
Apache A, 2011: Http server project. Retrieved at 10-01-2011 from:http://httpd.apache.org/
Apache B, 2011: Httpd Wiki. FAQ. Retrieved at 10-01-2011 from:http://wiki.apache.org/httpd/FAQ
Babin, Lee, 2007: Beginning AJAX with PHP. From novice to professional. Apress. USA
Beaujardiere, Jeff la, 2006:OpenGIS Web Map Server Implementation Specification. Version 1.3.0. Open
Geospatial Consortium Inc.
Bloch, J.: How to Design a Good API and Why it Matters. Slides. Google. USA
Brodersen, Lars, 2008: Kommunikation med kort; informationsdesign og visualisering, Nyt Teknisk Forlag
1.udgave. Denmark.
Buzzle A. 2010: Waterfall Model Phases. Retrieved at 16-12-2010 from:
http://www.buzzle.com/articles/waterfall-model-phases.html
Buzzle B, 2010: The Waterfall Model Explained. Retrieved at 16-12-2010 from:
http://www.buzzle.com/editorials/1-5-2005-63768.asp
Buzzle C, 2010: Waterfall model advantages and disadvantages. Retrieved at 16-12-2010 from:
http://www.buzzle.com/articles/waterfall-model-advantages-and-disadvantages.html
Camara, Gilberto and Onsrud, Harlan 2004: Open Source GIS Software: Myths and Realities. Open Access
and the public domain in digital data information science. Washinton. The National Academic Press.
Courtin, Olivier andCave-Ayland, Mark 2010: PostGIS 1.5 and beyond, a technical perspective. Oslandia.
Sirius. PGDay.eu 2010. Germany
Dale Olson Consulting, 2009:Agile Project Management Pros & Cons. Retrieved at 16-12-2010 from:
http://www.daleolsonconsulting.com/blog/2009/06/21/agile-project-management-pros-cons/
Davis, Scott, 2007: GIS for Web Developers, 1st edition, The Pragmatic Bookshelf, ISBN-13: 978-0-9745140-
9-3.USA.
Duckett, Jon, 2004: Beginning Web Programming with HTML, XHTML and CSS. Programmer to Programmer
TM.Wrox. Wiley Publishing, Inc. USA

WebGIS solution for Roskilde festival GTM Group 1 7. semester project, AAU
102
ESRI 2011: ArcEditor Overview.Retrieved at 11-01-2011
from:http://www.esri.com/software/arcgis/arceditor/index.html
FOT Danmark 2009: FOT 4.1 specifikation. FOT Danmark.
FOT Danmark A, 2008: FOT2007 systemet – teknik og baggrund. Retrieved at 03-01-2011 from:
http://www.fotdanmark.dk/Menu/FOT2007/FOT2007+systemet/FOT2007+systemet+-
+teknik+og+baggrund
FOT Danmark B, 2008:FOT2007 systemet og dets snitflader.
Fuglsang, Morten: Distributed GIS. Module 7 & 8: Web Application workshop. Slides. Aalborg University.
Denmark.
GeoExt A 2011: Developers blog. Blogspot. Retrieved at 11-01-2011 from:http://geoext.blogspot.com/
GeoExt B 2011: Documentation. Retrieved at 10-01-2011 from:http://www.geoext.org/
Geoserver 2010: User manual. Retrieved at 20-12-2010 from
http://docs.geoserver.org/stable/en/user/index.html
GeoServer A 2011:Complex Features. Retrieved at 07-01-2011 from
http://docs.geoserver.org/latest/en/user/data/app-schema/complex-features.html
Geoserver B 2011: What is Geoserver.Retrieved at 11-01-2011
from:http://geoserver.org/display/GEOS/What+is+GeoServer
Guru Corporation 2010: Four easy steps to create your logo. Retrieved 20-11-2010 from
http://www.logosnap.com/logo.php?action=create USA
Hernandez, Michael J, 2003: Database Design for Mere Mortals: A Hands-On Guide to Relational Database
Design, Second Edition; Addison Wesley, ISBN : 0-201-75284-0. USA
Hsu, Leo & Obe, Regina 2007: PostGIS for geospatial analysis and mapping. PostGres Online Journal. Re-
trieved 18-01-2011 from:http://www.postgresonline.com/journal/index.php?/archives/7-PostGIS-for-
geospatial-analysis-and-mapping.html
Hypergurl 2010: Last update to page javascript. Retrieved at 25-11-2010 from:
http://www.hypergurl.com/lastupdate.html
KMS 2005: DTK/Skærmkort. Produktblad. Miljøministeriet, Kort og Matrikelstyrelsen. Danmark.
Kraak, Jan-Menno, 2004:The role of the map in a Web-GIS environment. Journal of Geographical Systems.
International Institute of Geoinformation Science and Earth Observation, Department of GeoInformation
Processing, Enschede. The Netherlands.Springer-Verlag 2004. Holland
Lab{vl} 2010: Coordinate Systems and Projections. Retrieved at 20 -12-2010 from: http://lab.visual-logic.com/skills-techniques/gis-resources-and-tutorials/coordinate-systems-and-projections/
Longley, Paul A.,2004:Geographic Information Systems and Science.2nd Edition; John Wiley & Sons, ISBN:
978-0-470-87001-3. USA.

WebGIS solution for Roskilde festival GTM Group 1 7. semester project, AAU
103
MyBB Group 2011: MyBB Feature Tour. Retrieved at 16-01-2011 from: http://www.mybb.com/features
Nørmølle et al: Vejledning i anvendelse af Web Map Services. Et projekt udarbejdet for Servicefællesskabet
for Geodata. Et udvalg under Geoforum.
NuWave tech 2010: Agile Software development projects: Pros and Cons. IT project blog. Retrieved at 16.-
12-2010 from: http://www.nuwave-tech.com/it-project-blog/bid/45506/Agile-Software-Development-
Projects-Pros-and-Cons
OGC 2011: Welcome to OGC website. Retrieved at 07-01-2011 from:http://www.opengeospatial.org
OpenGeo 2011: White paper: The OpenGeo Architecture. Retrieved at 18-01-2011 from:
http://opengeo.org/publications/opengeo-architecture/
Openlayers 2010: Openlayers.Handler. Natural Docs. Retrieved at 25-11-2010 from:
http://dev.openlayers.org/docs/files/OpenLayers/Handler-js.html
OpenLayers 2011: What is Openlayers.Retrieved at 07-01-2011
from:http://docs.openlayers.org/index.html.
Orenstein, David 2000: Quickstudy: Application Programming Interface (API). Computerworld. Retrieved at
16-01-2011 from:http://www.computerworld.com/s/article/43487/Application_Programming_Interface
Overgaard et al 2004: Vejledning I anvendelse af Web Feature Services V.1.1.0. Geoforum. Denmark
Peng, Zhong-Ren& Tsou, Ming-Hsiang 2003: Internet GIS - Distributed Geographic Information Services for the Internet and Wireless Networks; 1st edition 2003; John Wiley & Sons, Inc. USA; ISBN 0-471-35923-8.
PHP Group, 2011: Getting started.Retrieved at 06-01-2011 from:http://www.php.net/manual/en/getting-
started.php
PostGIS 2010: What is PostGIS. Retrieved at 12-01-2011 from: http://postgis.org/
PostGIS 2011: PostGIS wiki. Retrieved at 12-01-2011 from:
http://trac.osgeo.org/postgis/wiki/UsersWikiMain
PostgreSQL 2009: PostgreSQL 8.4.4 Documentation, ThePostgreSQL Global Development Group.
PostgreSQL, 2010:PostgreSQL. Retrieved 20-12-2010 from http://www.postgresql.org/
Rambøll 2010: Analyse og visualisering af data i 3D. Kortdage 2010. Slides. Rambøll. Danmark.
Roskilde Festival 2010: Roskilde Festival Forside. Retrieved at 19-12-2010 from: http://www.roskilde-
festival.dk
Safe 2011: FME Desktop.Retrieved at 04-01-2011 from: http://safe.com/products/fme-desktop/
Sherman, Gary E., 2004: Desktop GIS- Mapping the Planet with Open Source Tools. First edition. The Prag-matic Bookshelf, ISBN 13- 978-1-934356-06-7.USA. Ulm, Kilian 2010: Cowi – 3D City Models for Urban Planning and GIS. Kortdage 2010. Slides.Cowi. Denmark.
Vretanos, Panagiotis A, 2005, OpenGIS Web Feature Server Implementation Specification. Version 1.1.0.
Open Geospatial Consortium Inc.

Appendix
Table of contents:
Appendix A – The WebGIS solution source code – Theme maps subpages
- Waste.html – Commented
Appendix B – The Print functionality
- Print.html – Commented
Appendix C – Print PDF example
- Print PDF example
Appendix D – Source code from WFS-T example
- Code from iteration working with the WFS-T example
Appendix E – XML code example on how to add features with WFS-T protocol
- Code example from (Overgaard et. al, 2004)

Appendix A - The WebGIS solution source code
The theme map subpages from the WebGIS solution. The code from the theme map waste management is
commented line by line, indicated by the green text. The other subpages are not commented but they are
coded more or less the same way. The rest of the subpages are included on the CD in the folder Code

C:\Appendix\waste-commented.html 19. januar 2011 09:43
<html> <!-- this defines the start of a html-->
<head> <!-- In the head we load the main content behind the page-->
<title>Roskilde Festival WebMapService</title> <!-- The title of the page-->
<style type="text/css"> <!-- Here we load some CCS styling for this script-->
h1 {font-size: 40px; font-family:Arial; color:#F36113} <!-- Different CSS stylings of
elements -->
h3 {font-size: 20px; font-family:Arial; color:#F36113}
h6 {font-size: 10px; font-family:Arial; color:#F36113}
A {font-size: 14px; font-family:Arial; color:#000000; text-decoration:none;}
table {font-size: 13px; font-family:Arial; color:#000000}
div.olControlMousePosition {font-family: Arial;font-size: 12px; color:#F36113;left:0px} <!--
Styling of JavaScript elements-->
div.olControlScaleLine {font-family: Arial;font-size: 18px; color:#F36113;}
div.olControlScale {font-family: Arial;font-size: 15px; color:#F36113;left:450px}
</style>
<script src="OpenLayers/OpenLayers.js" type="text/javascript"></script> <!-- Adding the
OpenLayers API from external javascript on our Apache Webserver-->
<script src="ext-3.3.0/adapter/ext/ext-base.js" type="text/javascript"></script> <!-- Adding
Ext from from external javascript on our Apache Webserver-->
<script src="ext-3.3.0/ext-all.js" type="text/javascript"></script> <!-- Adding dding Ext
from from external javascript on our Apache Webserver-->
<script src="GeoExt/lib/GeoExt.js" type="text/javascript"></script> <!-- Adding GeoExt from
from external javascript on our Apache Webserver -->
<script type="text/javascript"> // script tags to indicate piece of JavaScript on our HTML
page.
Ext.onReady(function() { // Creating the External functions to write all OpenLayers and
GeoExt commands within.
var options = { // defining the Options to our map
maxResolution: "auto", // defines the max resolution of our WMS's
scales: [15000,10000,5000,1000,500,100,10,1], // defines the number of and the actual
scales when using the Zoomfunction.
};
var map = new OpenLayers.Map('map',options); // Creating the actual map where all WMS
layers are going to be added,
// the map also stores the options aplied..
var kms = new OpenLayers.Layer.WMS("KMS", //Creating the var KMS-WMS, this is
our backgroundmap.
"http://kortforsyningen.kms.dk/topo_skaermkort", // The URL to Server hosting the WMS
{layers: "topo_skaermkort"} // The specific layer from the WMS
is requested
);
var wms1 = new OpenLayers.Layer.WMS( // Creating var wms1,
"Garbage", // This defines the name shown in the layer
switcher
"http://localhost:8080/geoserver/wms", // URL to our GeoServer
{layers: "Affald_solid", // The layer name of the layer we want to add
transparent: "true"}, // makes the img recieved from WMS
transparent, so only features are visible
{isBaseLayer: false, visibility: true}); // Defines the layer as overlay and that
the ->
-1-

C:\Appendix\waste-commented.html 19. januar 2011 09:43
//layer is turned on automatically when
loading the page.
var wms2 = new OpenLayers.Layer.WMS( // The same procedure is used with alle the
WMS's below.
"Compost Bin",
"http://localhost:8080/geoserver/wms",
{layers: "KompostSpand_solid",
transparent: "true"},
{isBaseLayer: false, visibility: true});
var wms3 = new OpenLayers.Layer.WMS(
"Garbagebin depots",
"http://localhost:8080/geoserver/wms",
{layers: "Skraldespande - Depot_shape",
transparent: "true"},
{isBaseLayer: false, visibility: true});
var fot1 = new OpenLayers.Layer.WMS( // This is one our basic layers included in
all the theme maps
"FOT_buildings", // below the six FOT layers WMS connections
are created.
"http://localhost:8080/geoserver/wms",
{layers: "byg2",
transparent: "true"},
{isBaseLayer: false, visibility: true});
var fot2 = new OpenLayers.Layer.WMS(
"FOT_Powerlines",
"http://localhost:8080/geoserver/wms",
{layers: "HJSPLEDN",
transparent: "true"},
{isBaseLayer: false, visibility: true});
var fot3 = new OpenLayers.Layer.WMS(
"FOT_Pylons",
"http://localhost:8080/geoserver/wms",
{layers: "HJSPMAST",
transparent: "true"},
{isBaseLayer: false, visibility: true});
var fot4 = new OpenLayers.Layer.WMS(
"FOT_Mining",
"http://localhost:8080/geoserver/wms",
{layers: "RAASTOF",
transparent: "true"},
{isBaseLayer: false, visibility: true});
var fot5 = new OpenLayers.Layer.WMS(
"FOT_Lakes",
"http://localhost:8080/geoserver/wms",
{layers: "so2",
transparent: "true"},
{isBaseLayer: false, visibility: true});
var fot6 = new OpenLayers.Layer.WMS(
"FOT_Mills",
"http://localhost:8080/geoserver/wms",
{layers: "VINDMOEL",
transparent: "true"},
{isBaseLayer: false, visibility: true});
var vector = new OpenLayers.Layer.Vector("vector"); // This Layer enables the creation
of polygons and lines with the Toolbar
// This is where the information is
temporarely stored.
-2-

C:\Appendix\waste-commented.html 19. januar 2011 09:43
map.addLayers([kms,wms1,wms2,wms3,fot1, // adding all the WMS's to the MapWindow,
otherwise they wont be requested.
fot2,fot3,fot4,fot5,fot6,vector]);
var ctrl, handler, toolbarItems = [], action, actions = {}; // Defining the variables we
are going to use when adding the toolbar.
// Navigation control and DrawFeature controls in the same toggle group
// Navigation control:
action = new GeoExt.Action({ // The GeoExt Action that enables navigation in the
window after using other toolbare controls
text: "Navigate", // This defines the text on the actual button
control: new OpenLayers.Control.Navigation(), // it's created as an OpenLayers
navigate basic control
map: map, // and is within the map window
// button options
toggleGroup: "draw", // All the buttons are placed in the draw group in the toolbar
allowDepress: false, // This control will always apply
pressed: true,
tooltip: "Pan through the map", // Tooltip displaying when holding curson over button
// check item options
group: "draw",
checked: true
});
actions["nav"] = action; // The action defines what action should be executed when
pressing the Nav button
toolbarItems.push(action);
// Draw polygon
action = new GeoExt.Action({ // The OpenLayers control that enables drawing of polygon.
text: "Draw polygon", // Button text
control: new OpenLayers.Control.DrawFeature( // the handler that makes sure the
feature is created but also
vector, OpenLayers.Handler.Polygon // that mapwindow will return to normal
state after refreshing
),
map: map,
// button options
toggleGroup: "draw", // The group where the button belong
allowDepress: false,
tooltip: "Draw a polygon", // Tooltip displaying when holding curson over button
// check item options
group: "draw"
});
actions["draw_poly"] = action; // The action defines what action should be executed when
pressing the Draw Poly button
toolbarItems.push(action);
// Draw Line
action = new GeoExt.Action({ // The GeoExt Action that enables Drawing of polygonsin
the window
text: "Draw line-segment",
control: new OpenLayers.Control.DrawFeature( // The OpenLayers control that enables
drawing of polygon in the "vector" layer.
vector, OpenLayers.Handler.Path // The Other Buttons are defined more
or less the same way.
-3-

C:\Appendix\waste-commented.html 19. januar 2011 09:43
),
map: map,
// button options
toggleGroup: "draw",
allowDepress: false,
tooltip: "Draw a line-segment",
// check item options
group: "draw"
});
actions["draw_line"] = action;
toolbarItems.push(action);
toolbarItems.push("-");
// SelectFeature control, a "toggle" control
action = new GeoExt.Action({
text: "Select Feature",
control: new OpenLayers.Control.SelectFeature(vector, {
type: OpenLayers.Control.TYPE_TOGGLE,
hover: true
}),
map: map,
// button options
enableToggle: true,
tooltip: "Select the created features"
});
actions["select"] = action;
toolbarItems.push(action);
toolbarItems.push("-");
// Navigation history - two "button" controls
ctrl = new OpenLayers.Control.NavigationHistory();
map.addControl(ctrl);
action = new GeoExt.Action({
text: "Previous Pan Action",
control: ctrl.previous,
disabled: true,
tooltip: "Previous in pan action history"
});
actions["previous"] = action;
toolbarItems.push(action);
action = new GeoExt.Action({
text: "Next Pan Action",
control: ctrl.next,
disabled: true,
tooltip: "Next in pan action history"
});
actions["next"] = action;
toolbarItems.push(action);
toolbarItems.push("->");
// This is where all the functionalities wanted in the map are defined as a Variabel and
added to the map.
var LayerSwitcher = new OpenLayers.Control.LayerSwitcher(); // Defining the
Layerswitcher tool
var overview = new OpenLayers.Control.OverviewMap(); // Defining the Overview
-4-

C:\Appendix\waste-commented.html 19. januar 2011 09:43
window
var Navigation= new OpenLayers.Control.Navigation(); // Defining the right to
navigate in the picture
var ScaleLine = new OpenLayers.Control.ScaleLine(); // Defining the scale line
var MousePosition = new OpenLayers.Control.MousePosition(); // Defining mouse position
var Scale = new OpenLayers.Control.Scale(); // Defining the scale is
shown a text
map.addControls([LayerSwitcher,overview,Navigation,ScaleLine,MousePosition,Scale]); //
all the above definitions are applied
//
so they are shown in the map window
var mapPanel = new GeoExt.MapPanel({ // The Mappanel Defines various things about the
mapwindow shown on the HTML page
renderTo: "mappanel", // this defines what should load
height: 800, // Window height
width: 1000, // Window width
map: map, // that the variable map should be displayed in the window
center: new OpenLayers.LonLat(12.076,55.619), // The center of the opening view
zoom: 0, // The Starup Zoomlevel, when using custom scale
//levels the Zero indicates the first scale defined in the
options
tbar: toolbarItems, // This adds the Toolbarbuttons to MapPanel.
});
});
</script> <!-- end of JavaScript -->
</head> <!-- end of head with main functionalities-->
<body bgcolor="black" style="padding:10px;border:3px solid #F36113;"> <!-- The body where
load and display different content of the page-->
<img src="logo4.png" alt="Logo" style="float:right;" width="110" height="90"> <!-- Load the
logo image in the right side of the page-->
<h1><b>Roskilde Festival WebMapService</b></h1> <!-- The main header-->
<h6 style="color:#F36113">A project of the everlasting GTM group 1, 2010/2011</h6> <!-- The
minor header-->
<hr style="color:#F36113" /> <!-- a line to break the page-->
<p><center><b><A style="color:#F36113" HREF="http://www.roskilde-festival.dk/">ROSKILDE
FESTIVAL HOMEPAGE</A></p> <!-- The loading of the official Roskilde Festival site with HREf
functionality-->
<table border="3" width="50%" style="font-color:black;background-color:#F36113;" cellspacing=
"5"> <!--A new table is loaded and it's styling-->
<tr> <!-- first row-->
<th><A HREF="http://localhost/home.html">HOME</A></th> <!-- Columns with links to
the different pages inside -->
<th><A HREF="http://localhost/camping.html">CAMPING</A></th>
<th><A HREF="http://localhost/emergency.html">EMERGENCY MANAGEMENT</A></th>
<th><A HREF="http://localhost/merchants.html">MERCHANTS</A></th>
<th><A HREF="http://localhost//waste.html">WASTE MANAGEMENT</A></th>
<th><A HREF="http://gtmprojekt.helring.dk/">FORUM</A></th>
<th><A HREF="http://localhost//print.html">PRINT MAPS</A></th>
</tr>
</table> <!-- End of the table - now it works as a bar at the top of the page-->
-5-

C:\Appendix\waste-commented.html 19. januar 2011 09:43
<hr style="color:#F36113" />
<h3 style="color:#F36113;float:left;">WASTE MANAGEMENT</h3> <!-- title of this mapwindow-->
<br><br><br> <!-- line breaks-->
<div style="width:1000; height:800; float:center; border:5px solid #F36113;" id="mappanel"
></div> <!-- the div functionality loads the mappanel from the above JavaScript-->
<br>
<hr style="color:#F36113" />
<b><A style="font-size:16px;color:#F36113;float:right" HREF="mailto:[email protected]">
CONTACT THE DEVELOPER </A></b> <!-- link at the bottom for contact information-->
<input <!-- creation of a button-->
type="button"
onClick="window.print()" <!-- when pressed it uses the browsers print functionality-->
value="Print This Page" <!-- The displayed name of the button-->
style="font-size:16px;font-family:Arial;color:#F36113;float:left;" <!-- styling of the
button-->
/>
<script style="float:right;font-size:16px;" language="javascript"> <!-- Load and style a
small JavaScript-->
var m = "PAGE UPDATED " + document.lastModified; <!-- The variable display "Page
updated" + a last modified call from the document-->
var p = m.length-3; <!-- decrease of the lenght of the displayed digits-->
document.writeln("<center>"); <!-- center the button on the page-->
document.write("<FONT COLOR='#F36113'>") <!-- styling-->
document.write("<FONT FACE='Arial'>") <!-- styling-->
document.write(m.substring(p, 0)); <!-- activates the functionality and styles it-->
document.writeln("</center>");
</script> <!-- end of script-->
<br>
</body> <!-- end of the main body-->
</html> <!-- end of the page-->
-6-

Appendix B – The Print functionality
The Print functionality is commented in this appendix, comments are highlighted green. The example of
merging the toolbar with the print functionality is also included in the code. The problems described in the
discussion are marked as well.

C:\Appendix\print-commented.html 19. januar 2011 09:44
<html>
<head>
<title>Roskilde Festival WebMapService</title>
<style type="text/css">
h1 {font-size: 40px; font-family:Arial; color:#F36113}
h3 {font-size: 20px; font-family:Arial; color:#F36113}
h6 {font-size: 10px; font-family:Arial; color:#F36113}
p {font-size: 13px; font-family:Arial; color:#000000}
A {font-size: 14px; font-family:Arial; color:#000000; text-decoration:none;}
table {font-size: 13px; font-family:Arial; color:#000000}
</style>
<script src="ext-3.3.0/adapter/ext/ext-base.js" type="text/javascript"></script>
<script src="ext-3.3.0/ext-all.js" type="text/javascript"></script>
<script src="OpenLayers/OpenLayers.js" type="text/javascript"></script>
<script src="GeoExt/lib/GeoExt.js" type="text/javascript"></script>
<script type="text/javascript" src=
"http://localhost:8080/geoserver/pdf/info.json?var=printCapabilities"></script>
// This script tag defines the Capabilities of the PDF we want to print
<script type="text/javascript">
Ext.onReady(function() {
// The printProvider that connects us to the print service
var printProvider = new GeoExt.data.PrintProvider({
method: "GET", //
capabilities: printCapabilities, // from the info.json script in the html
customParams: {
mapTitle: "Print Demo"
}
});
// Our print page. Stores scale, center and rotation and gives us a page
// extent feature that we can add to a layer.
var printPage = new GeoExt.data.PrintPage({
printProvider: printProvider
});
// A layer to display the print page extent ( The Orange polgygon)
var pageLayer = new OpenLayers.Layer.Vector();
pageLayer.addFeatures(printPage.feature);
var wms3 = new OpenLayers.Layer.WMS(
"Campingfields2",
"http://localhost:8080/geoserver/wms",
{layers: "CAMPINGFELTER_shape",
transparent: "true"},
{isBaseLayer: false, visibility: true});
var wms4 = new OpenLayers.Layer.WMS(
"Campingfields3",
"http://localhost:8080/geoserver/wms",
{layers: "CAMPINGFELTER_solid",
transparent: "true"},
{isBaseLayer: false, visibility: true});
var wms6 = new OpenLayers.Layer.WMS(
-1-
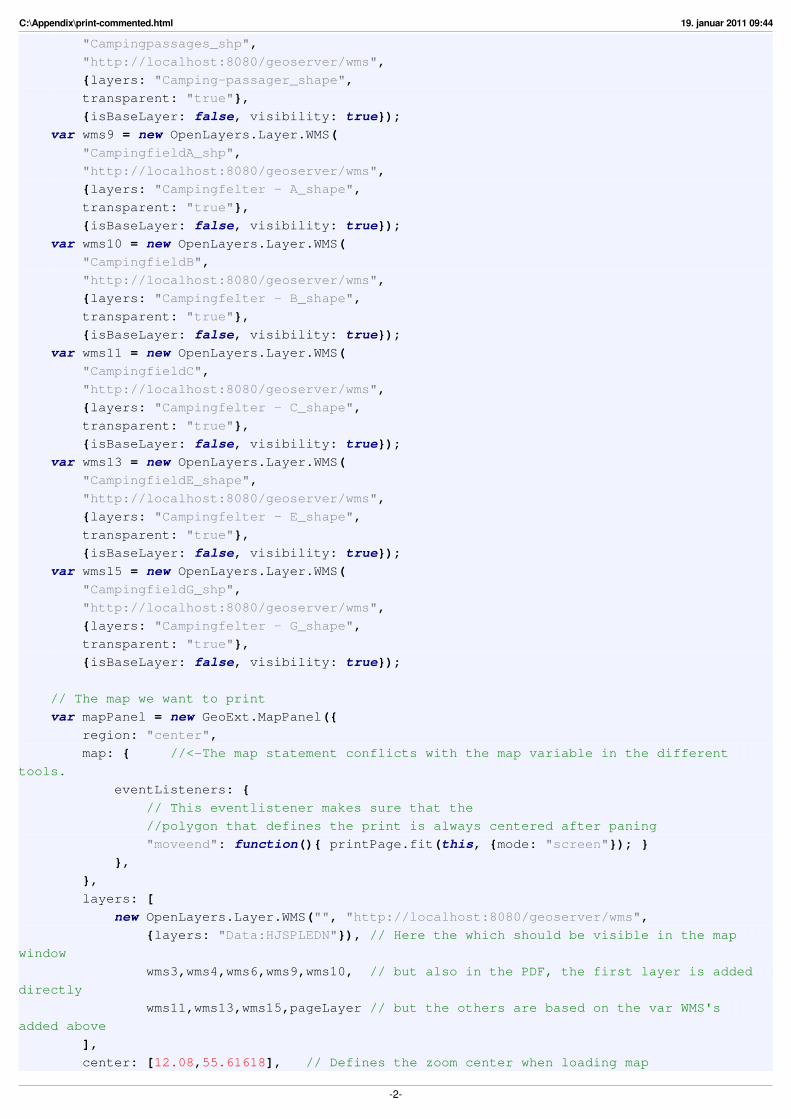
C:\Appendix\print-commented.html 19. januar 2011 09:44
"Campingpassages_shp",
"http://localhost:8080/geoserver/wms",
{layers: "Camping-passager_shape",
transparent: "true"},
{isBaseLayer: false, visibility: true});
var wms9 = new OpenLayers.Layer.WMS(
"CampingfieldA_shp",
"http://localhost:8080/geoserver/wms",
{layers: "Campingfelter - A_shape",
transparent: "true"},
{isBaseLayer: false, visibility: true});
var wms10 = new OpenLayers.Layer.WMS(
"CampingfieldB",
"http://localhost:8080/geoserver/wms",
{layers: "Campingfelter - B_shape",
transparent: "true"},
{isBaseLayer: false, visibility: true});
var wms11 = new OpenLayers.Layer.WMS(
"CampingfieldC",
"http://localhost:8080/geoserver/wms",
{layers: "Campingfelter - C_shape",
transparent: "true"},
{isBaseLayer: false, visibility: true});
var wms13 = new OpenLayers.Layer.WMS(
"CampingfieldE_shape",
"http://localhost:8080/geoserver/wms",
{layers: "Campingfelter - E_shape",
transparent: "true"},
{isBaseLayer: false, visibility: true});
var wms15 = new OpenLayers.Layer.WMS(
"CampingfieldG_shp",
"http://localhost:8080/geoserver/wms",
{layers: "Campingfelter - G_shape",
transparent: "true"},
{isBaseLayer: false, visibility: true});
// The map we want to print
var mapPanel = new GeoExt.MapPanel({
region: "center",
map: { //<-The map statement conflicts with the map variable in the different
tools.
eventListeners: {
// This eventlistener makes sure that the
//polygon that defines the print is always centered after paning
"moveend": function(){ printPage.fit(this, {mode: "screen"}); }
},
},
layers: [
new OpenLayers.Layer.WMS("", "http://localhost:8080/geoserver/wms",
{layers: "Data:HJSPLEDN"}), // Here the which should be visible in the map
window
wms3,wms4,wms6,wms9,wms10, // but also in the PDF, the first layer is added
directly
wms11,wms13,wms15,pageLayer // but the others are based on the var WMS's
added above
],
center: [12.08,55.61618], // Defines the zoom center when loading map
-2-

C:\Appendix\print-commented.html 19. januar 2011 09:44
zoom: 15 // defines the zoom level
});
// The form with fields controlling the print output
var formPanel = new Ext.form.FormPanel({ // line 113-117 defines the styling of the
formpanel
region: "center", // the placement of the form relative to the map window
width: 200, // the width of the formpanel
bodyStyle: "padding:5px;color:#F36113;font-size:20px;font-family:Arial", // Each box
in formpanel, with font, size and color
labelAlign: "top", // placement of labels to the input forms
defaults: {anchor: "25%"}, // Size of textboxes
items: [{ // This is the propertis of the form box "comments"
xtype: "textarea", // Defines the box as character type
name: "comment", // The name of box used in PDF
value: "", // this is where the comment is stored before added to the pdf
fieldLabel: "Comment", // the label belonging to the textbox on the HTML page
plugins: new GeoExt.plugins.PrintPageField({
printPage: printPage
})
}, {
xtype: "combo", // Defines the layout box as both integer and character.
//Since this defines the page size input is e.g. A4
store: printProvider.layouts,// information is stored for the print
//provider to use when creating the PDF
displayField: "name", // print layouts from Json A3, A4 etc.
fieldLabel: "Layout page", // the label belonging to the textbox on the HTML page
typeAhead: true,
mode: "local",
triggerAction: "all", /// When changing paper size this changes the polygon
defining print extent
plugins: new GeoExt.plugins.PrintProviderField({
printProvider: printProvider
})
}, {
xtype: "combo", // The Scale box is also defined as intg and char since dealing
with e.g. 1:5000
store: printProvider.scales,// information is stored for the print provider to
use when creating the PDF
displayField: "name",
fieldLabel: "Scale", // the label belonging to the textbox on the HTML page
typeAhead: true,
mode: "local",
triggerAction: "all", // Changes the scale when changing value in formpanel
plugins: new GeoExt.plugins.PrintPageField({
printPage: printPage
})
}, {
xtype: "textfield", // Rotation of print polygon
name: "rotation",
fieldLabel: "Rotation of print polygon",
plugins: new GeoExt.plugins.PrintPageField({
printPage: printPage
})
}],
buttons: [{ // Creates the PDF when clicking this button
text: "Create PDF", // Label of the button
-3-

C:\Appendix\print-commented.html 19. januar 2011 09:44
handler: function() { // The handler functions creates the PDF based on the
Mappanel and the printpage where varios informations
printProvider.print(mapPanel, printPage); // are stored using the different
elements of the form.
}
}]
});
// Adding the different toolbar buttons and functionality (Hopefully
soon)-----------------------------------------------------------------------
var ctrl, toolbarItems = [], action, actions = {};
// Navigation control and DrawFeature controls
// in the same toggle group
action = new GeoExt.Action({
text: "Navigate",
control: new OpenLayers.Control.Navigation(),
//map: map,
// button options The problem is that in the example "Toolbar", the syntax off
adding the layers is different than in this one.
//i cant seemt to adress the correct variable to make this
work properly.
toggleGroup: "draw",
allowDepress: false,
pressed: true,
tooltip: "navigate",
// check item options
group: "draw",
checked: true
});
actions["nav"] = action;
toolbarItems.push(action);
action = new GeoExt.Action({
text: "Draw polygon",
control: new OpenLayers.Control.DrawFeature(
vector, OpenLayers.Handler.Polygon
),
//map: map, <-------------------------------------
// button options
toggleGroup: "draw",
allowDepress: false,
tooltip: "draw polygon",
// check item options
group: "draw"
});
actions["draw_poly"] = action;
toolbarItems.push(action);
action = new GeoExt.Action({
text: "Draw line",
control: new OpenLayers.Control.DrawFeature(
vector, OpenLayers.Handler.Path
),
//map: map, <---------------------------------------
// button options
toggleGroup: "draw",
-4-

C:\Appendix\print-commented.html 19. januar 2011 09:44
allowDepress: false,
tooltip: "draw line",
// check item options
group: "draw"
});
actions["draw_line"] = action;
toolbarItems.push(action);
toolbarItems.push("-");
// The main panel
new Ext.Panel({ // The print function works with an Ext panel
renderTo: "content",
layout: "border",
width: 1000, // map width
height: 800, // map height
items: [mapPanel, formPanel],// The MapPanel and formpanel are added to the window
ass items
tbar: toolbarItems // the same is for the toolbar without functionalities
});
});
</script>
</head>
<body bgcolor="black" style="padding:10px;border:3px solid #F36113;">
<img src="logo4.png" alt="Logo" style="float:right;" width="110" height="90">
<h1><b>Roskilde Festival WebMapService</b></h1>
<h6 style="color:#F36113">A project of the everlasting GTM group 1, 2010/2011</h6>
<hr style="color:#F36113" />
<p><center><b><A style="color:#F36113" HREF="http://www.roskilde-festival.dk/">ROSKILDE
FESTIVAL HOMEPAGE</A></p>
<table border="3" width="50%" style="font-color:black;background-color:#F36113;" cellspacing=
"5">
<tr>
<th><A HREF="http://localhost/home.html">HOME</A></th>
<th><A HREF="http://localhost/camping.html">CAMPING</A></th>
<th><A HREF="http://localhost/emergency.html">EMERGENCY MANAGEMENT</A></th>
<th><A HREF="http://localhost/merchants.html">MERCHANTS</A></th>
<th><A HREF="http://localhost//waste.html">WASTE MANAGEMENT</A></th>
<th><A HREF="http://gtmprojekt.helring.dk/">FORUM</A></th>
<th><A HREF="http://localhost//print.html">PRINT MAPS</A></th>
</tr>
</table>
-5-

C:\Appendix\print-commented.html 19. januar 2011 09:44
<hr style="color:#F36113" />
<h3 style="color:#F36113;float:left;">PRINT-functionality - current area inside the polygon
prints to a .pdf file</h3>
<br><br><br>
<div style="width:1000; height:1550; float:center; border:5px solid #F36113;" id="content"
></div>
<br>
<hr style="color:#F36113" />
<b><A style="font-size:16px;color:#F36113;float:right" HREF="mailto:[email protected]">
CONTACT THE DEVELOPER </A></b>
<input
type="button"
onClick="window.print()"
value="Print This Page"
style="font-size:16px;font-family:Arial;color:#F36113;float:left;"
/>
<script style="float:right;font-size:16px;" language="javascript">
var m = "PAGE UPDATED " + document.lastModified;
var p = m.length-3;
document.writeln("<center>");
document.write("<FONT COLOR='#F36113'>")
document.write("<FONT FACE='Arial'>")
document.write(m.substring(p, 0));
document.writeln("</center>");
</script>
<br>
</body>
</html>
-6-

Appendix C – Print PDF example
Example of a Print PDF with the GeoExt print functionality
A4 portrait
a red box Page 1

Print Demo
This is an example of the print functionalities. This map window shows an example of some ofthe data from the "camping" group.
1:25000 01.13.2011
15sec1050
a red box Page 2

Appendix D – Source code from WFS-T example
The code from the OpenLayers example, that we tried to modify work with our own data.

C:\Appendix\WFS-T (Faillure).html 19. januar 2011 10:22
<html>
<head>
<title>WFS-T</title>
<script src="http://openlayers.org/api/OpenLayers.js"></script>
</head>
<body>
<div style="width:100%; height:100%" id ="map"></div>
<script defer="defer" type="text/javascript">
var map, wfs;
var DeleteFeature = OpenLayers.Class(OpenLayers.Control, {
initialize: function(layer, options) {
OpenLayers.Control.prototype.initialize.apply(this, [options]);
this.layer = layer;
this.handler = new OpenLayers.Handler.Feature(
this, layer, {click: this.clickFeature}
);
},
clickFeature: function(feature) {
// if feature doesn't have a fid, destroy it
if(feature.fid == undefined) {
this.layer.destroyFeatures([feature]);
} else {
feature.state = OpenLayers.State.DELETE;
this.layer.events.triggerEvent("afterfeaturemodified",
{feature: feature});
feature.renderIntent = "select";
this.layer.drawFeature(feature);
}
},
setMap: function(map) {
this.handler.setMap(map);
OpenLayers.Control.prototype.setMap.apply(this, arguments);
},
CLASS_NAME: "OpenLayers.Control.DeleteFeature"
});
function init() {
map = new OpenLayers.Map('map', {
projection: new OpenLayers.Projection("EPSG:900913"),
displayProjection: new OpenLayers.Projection("EPSG:4326"),
units: "m",
maxResolution: 156543.0339
controls: [
new OpenLayers.Control.PanZoom()
]
});
var wms = new OpenLayers.Layer.WMS("Syddjurs",
"http://localhost:8080/geoserver/wms", {layers: 'Syddjurs'});
var saveStrategy = new OpenLayers.Strategy.Save();
wfs = new OpenLayers.Layer.Vector("Editable Features", {
strategies: [new OpenLayers.Strategy.BBOX(), saveStrategy],
projection: new OpenLayers.Projection("EPSG:4326"),
-1-

C:\Appendix\WFS-T (Faillure).html 19. januar 2011 10:22
protocol: new OpenLayers.Protocol.WFS({
version: "1.1.0",
srsName: "EPSG:4326",
url: "http://localhost:8080/geoserver/wfs",
featureNS : "www.WG.dk",
featureType: "Feature",
geometryName: "the_geom",
schema:
"http://localhost:8080/geoserver/wfs/DescribeFeatureType?version=1.1.0&typename=WG:Feature"
})
});
map.addLayers([wms,wfs]);
var panel = new OpenLayers.Control.Panel();
var navigate = new OpenLayers.Control.Navigation({
title: "Pan Map"
});
var draw = new OpenLayers.Control.DrawFeature(
wfs, OpenLayers.Handler.Polygon,
{
title: "Draw Feature",
multi: true
}
);
var edit = new OpenLayers.Control.ModifyFeature(wfs, {
title: "Modify Feature",
});
var del = new DeleteFeature(wfs, {title: "Delete Feature"});
var save = new OpenLayers.Control.Button({
title: "Save Changes",
trigger: function() {
if(edit.feature) {
edit.selectControl.unselectAll();
}
saveStrategy.save();
});
panel.addControls([navigate, save, del, edit, draw]);
panel.defaultControl = navigate;
map.addControl(panel);
map.zoomToMaxExtent();
}
</script>
</body>
<body onload="init()">
</body>
</html>
-2-

Appendix E – Example of adding feature by WFS-T with XML
Code example from (Overgaard et al ,2006)how two features are added to a database by the WFS-T
protocol.

Which returns: