theme 5: tropical island hydrology - bvsde desarrollo ... · second i nternational colloquium on...
TRANSCRIPT

235
Theme 5: Tropical Island Hydrology

Second International Colloquium onHydrology and Water Management in the Humid Tropics
237
Tropical Island Hydrology and Water Resources
Current Knowledge and Future NeedsA. Falkland, Senior Engineer – Hydrology, Ecowise Environmental, ACTEW Corporation, Canberra, ACT, Australia, [email protected]
ABSTRACT
Islands are prevalent in the humid tropical regions of the world. Most are part of developing countries and have scarce natural land-based resources. In particular, the water resources of islands are often very limited. Many have no surface water resources and rely on limited groundwater resources in the form of thin freshwater lenses. The exposure of islands makes them particularly vulnerable to natural disasters such as cyclones, floods and droughts.Pollution from population centres and from agricultural and other activities is an increasingproblem.
Limited research data is available on island hydrology and greater efforts are required to better understand the hydrologic cycle and how human activities impact upon the fragile water resources of islands, particularly small and very small islands. While some hydrological studies undertaken on larger landmasses are applicable to islands, there are some areas ofresearch that are essentially only applicable to the small spatial scale of islands and the relatively rapid turnover times of hydrologic systems on such islands. This is particularly relevant to groundwater resources.
Likewise, while the results of research on some islands has relevance to other similar islands, there are often unique characteristics of particular islands which mean that local data is required to at least demonstrate the suitability of methods which have been developed with a regional focus.
UNESCO and other agencies have been active recently in providing initial and valuable contributions to selected research activities in some Pacific islands. In addition, a number of countries with small tropical islands are pursuing their own applie d research directed at water resources planning and management. A summary of some of this recent research, which should be useful for other similar islands, is presented. In addition to research, appropriate methods of data collection are considered.
A summary of research, training and education needs for small island hydrology and water resources management in the humid tropics is also provided.
1 INTRODUCTION
Tropical islands abound in the major oceans (Pacific, Indian and Atlantic) and smaller adjacentseas. In the Pacific Ocean alone there are over 30,000 small islands most of which are in tropical regions. The number of populated islands is in the order of 1000. Several thousand small islands are found in the Indian Ocean (e.g. about 1,300 islands in the Maldives, of which

Second International Colloquium onHydrology and Water Management in the Humid Tropics
238
about 200 are inhabited). There are several thousand small islands in the Caribbean Sea of which about 100 are inhabited.
The region of Indonesia, Papua New Guinea, Philippines, Malaysia, Vietnam andsouth-eastern China comprises many thousands of islands. In Indonesia alone, there are over 17,000 islands, most of them small in size, of which about 6,000 are inhabited (Hehanussa, 1993; see also Hehanussa in this document).
Islands can be classified as either small or large. Islands with areas less than 2,000 km2
or widths less than 10km have been classified as small by UNESCO (1991). This paper primarily considers small islands, where special attention is required to sustainably develop and manage the limited water resources.
Most small islands are less than 200km2 in area and many fit into a category of "very small islands" which are less than 100 km2 or have a maximum width of 3 km (Dijon, 1984).Examples of very small islands are the sand cays, coral atolls and small limestone islands where surface water resources are non-existent and fresh groundwater resources are very limited. On these islands, conventional options for freshwater supplies are limited to groundwaterdevelopment and rainwater collection. Other examples are very small volcanic islands where fresh ground water is very limited or non-existent, and geological conditions are not favorable to surface water storages. On many very small islands, the only conventional freshwater option is rainwater collection, which often needs to be supplemented in droughts by, for example, water imported by boats or barges. In some special cases, desalination units have beeninstalled for regular use (e.g. Maldives) or for drought emergencies (e.g. Marshall Islands).
This paper considers current hydrological knowledge and future needs for further applied research and training. The paper is organized into a number of major sections as follows:
• Freshwater resources on small islands,• Water issues and problems,• Factors affecting freshwater resources,• Water balance and hydrological processes,• Groundwater resource assessment,• Water resources development,• Water resources planning and management, and• Research, training and education.
2 FRESHWATER RESOURCES ON SMALL ISLANDS
The water resources on small islands can be classified as either ‘conventional’ or ‘non-conventional’. The ‘conventional’ water resources include surface water, ground water, and rainwater collected from artificial or natural surfaces. The ‘non-conventional’ water resources include desalination of seawater or brackish ground water, importation, treated wastewater, and substitution (e.g. use of coconuts during droughts).A brief description of the ‘conventional’ water resources is provided in this section. Furtherdescription of all methods is provided in a later section on water resources development.
2.1 Rainwater
Second International Colloquium onHydrology and Water Management in the Humid Tropics
239
Rainwater collection systems are common on many islands. In some small island nations (e.g.Tuvalu), rainwater catchments using the roofs of individual houses and some communitybuildings are the sole source of freshwater. Rainwater collection is particularly useful on islands such as those in Tuvalu where the rainfall is higher and more regular than on many other small island nations.
In other small island nations, rainwater is used as a supplementary source of water, often to ground water, for the more essential water needs (e.g. drinking and cooking). In drought periods, when rainfall can be very little or zero for many months, household rainwaterstorages (typically 500-10,000 litres) are susceptible to being severely depleted unless verystrict rationing is imposed.
In addition to roof catchments, rainfall is sometimes collected from specially prepared surfaces. Examples are paved runways (e.g. the island of Majuro in the Marshall Islands) and specially prepared surfaces with adjacent storage tanks or artificially lined reservoirs (e.g.Coconut Island, Torres Strait – between Australia and Papua New Guinea).Common materials for rainwater tanks are ferrocement, fibreglass and polythene. Steel tanks are generally not used owing to corrosion problems unless they are well painted. Ferrocement tanks are commonly used in some Pacific islands (e.g. Tonga, Tuvalu, Kiribati, Federated States of Micronesia) as local contractors and community groups can construct them.
2.2 Surface water
Where conditions are favorable, surface water can occur on small high islands in the form of ephemeral and perennial streams and springs, and as freshwater lagoons, lakes and swamps.
• Perennial streams and springs occur mainly in high volcanic islands where thepermeability of the rock is low. Low lying islands rarely have surface water. Many high islands, particularly where volcanic rocks underlie limestone, have perennialsprings. These often occur around the base of the island either slightly above or sometimes below sea level.
• Freshwater lagoons and small lakes are not common but are found on some small islands. These can occur in the craters of extinct volcanoes or depressions in the topography, or even on small coral islands where rainfall is abundant (e.g. Washington Island (Teraina) in Kiribati). Most small island lakes, lagoons and swamps, particularly those at or close to sea level, are brackish.
2.3 Ground water
Ground water occurs on small islands as either perched (high level) or basal (low level)aquifers:
• Perched aquifers commonly occur over horizontal confining layers (aquicludes). Dyke-confined aquifers are a less common form of perched aquifer and are formed when vertical volcanic dykes trap water in the intervening compartments (e.g. some of the islands of Hawaii and French Polynesia).
• Basal aquifers consist of unconfined, partially confined or confined freshwater bodies which form at or below sea level. Except where permeabilities are very low, as on

Second International Colloquium onHydrology and Water Management in the Humid Tropics
240
some volcanic and bedrock islands, most islands would have some form of basal aquifer in which the freshwater body comes into contact with seawater. On many small coral and limestone islands, the basal aquifer takes the form of a ‘freshwater lens’ (or ‘groundwater lens’) which underlies the whole island.
Basal aquifers tend to be more important than perched aquifers because not all islands have the latter, and where both types occur, basal aquifers normally have greater storage volume. Basal aquifers are, however, vulnerable to saline intrusion owing to the freshwater-seawater interaction and must be carefully managed to avoid over-exploitation and consequent seawater intrusion.
The term ‘freshwater lens’ can be misleading as it implies a distinct freshwater aquifer.In reality, there is no distinct boundary between freshwater and seawater but rather a transition zone (refer to Figure 1). The base of the freshwater zone can be defined on the basis of a salinity criterion such as chloride ion concentration or electrical conductivity.
Figure 1. Cross section through a small coral island showing main features of a freshwater lens (exaggerated vertical scale) and location of aninfiltration gallery.
The lens often has an asymmetric shape with the deepest portion displaced towards the lagoon side of the island, as shown in Figure 1. Typically, the freshwater zone of a thick freshwater lens on a small coral island is about 10-20 m thick, with a transition zone of a similar thickness. Where the freshwater zone is less than about 5 m thick, the transition zone is often thicker than the freshwater zone. The freshwater and transition zone thicknesses are not static but vary according to fluctuations in recharge and possibly abstraction of ground water.

Second International Colloquium onHydrology and Water Management in the Humid Tropics
241
3 WATER ISSUES AND PROBLEMS
3.1 Overview
Underlying the water issues and problems of small islands is the fact that freshwater resources are very limited and highly susceptible to normal climate variability, natural disasters and contamination from human settlements, over-pumping of ground water, and agricultural (and in some cases industrial/mining) activities.
Despite their small area, many small islands have very high population densities that place great stress on water resources. Population densities of over 10,000 persons per km2
occur on some islands. An extreme example is the coral island of Malé in the Republic of Maldives, Indian Ocean, where the population on the 1.3 km2 island is over 60,000. Very high population densities also exist on islands in the Pacific region (e.g. parts of Tarawa, Republic of Kiribati and Majuro, Republic of Marshall Islands). High population densities not only create high demands for water but also increase the risk of pollution of the limited water resources.
3.2 Water quantity and supply issues
During moderate to severe droughts, rainwater storages risk becoming very low or empty, even when they are used only for the most basic of needs (e.g. drinking and cooking).
Surface water resources (e.g. streams, lakes) occurring on high islands with favorable topographical and geological conditions, are often severely depleted and sometimes exhausted during extended droughts. Few high islands have conditions suited to the construction of significant surface water storages.
The residence (or turnover) time of fresh groundwater resources on most small islands tends to be short, generally ranging from several months to a few years at most. These groundwater resources may become severely depleted during extended droughts even under natural (no pumping) conditions due to evaporation and groundwater outflows. The additional stress of pumping can easily induce saltwater intrusion if care is not taken in the design andoperation of pumping systems.
Very small islands with highly permeable geological conditions (e.g. small limestone islands) are particularly vulnerable to droughts. These islands have no potential for surface water and very little if any potential for fresh ground water. Populations on such islands, for example in Tonga and Fiji (see the paper by Terry & Raj in this document), are reliant solely on rainwater catchments except during droughts, when water is imported by barge or boat.
Due to their exposure, small islands are highly vulnerable to natural disasters such as cyclones (also hurricanes, typhoons), earthquakes, volcanic eruptions, tsunamis and stormdriven waves. There have been instances of small islands being damaged and even overtopped by storm-generated waves (e.g. Tuvalu, Tokelau and the Marshall Islands). Overtopping has caused seawater to contaminate fragile groundwater resources on low lying islands and the coastal parts of higher islands, requiring several months of rainfall to reverse the problem. In the Marshall Islands, it has led to damage to rainfall collection systems at the airport runway.These extreme conditions may be exacerbated under possible sea level rise conditions in the future.

Second International Colloquium onHydrology and Water Management in the Humid Tropics
242
Compaction and sealing of surfaces has led to increased surface runoff which can cause flooding, especially in parts of some high islands, and loss of potential recharge (e.g. where runoff flows directly to the sea). This problem can occur also on coral islands with sandy soils (e.g. flooding of villages adjacent to compacted or sealed airstrips after heavy rainfall). On some islands, alteration of coastlines including the removal of protective vegetation such as mangroves, and construction of canals in coastal zones (e.g. Grand Bahama Island: Whitaker & Smart, 1997), has led to seawater intrusion and loss of valuable fresh groundwater storage.
Major losses from water supply distribution pipelines are common on small islands.These losses are significant in terms of wastage of valuable freshwater resources and in economic terms. Unaccounted-for water losses (losses between supply source and consumer meters) have been measured at 50% and higher in urban areas of Tonga (e.g. Nuku’alofa), Fiji (e.g. parts of Suva) and Kiribati (e.g. South Tarawa). The causes of these losses include leaks from main pipelines due to the old age of pipes, inadequate joints, lack of maintenance and illegal connections. In some islands, especially where no charges for water supply are applied, wastage and over-use of water is a problem. Under such conditions, there are no economic incentives to fix leaks or conserve water, leading to high per capita water usage. Water supply systems that operate on an intermittent basis also lead to water wastage because taps are oftenleft open in order to maximize delivery of the small quantities of water available while the system is operating.
3.3 Water quality issues
Biological pollution of water resources due to overcrowded urban centres, coupled withinadequate sanitation systems is a major problem on some small islands. The high incidence of diarrhoeal diseases and other infectious diseases on some small islands is often caused by poor water supply and sanitation in such areas. Often, poor design, siting and condition of pit latrines and septic tanks, and inadequate solid waste disposal have contaminated ground water located nearby to houses, which should be in reasonable condition. Siting of sanitation facilities is often done with no concern for the direction of groundwater flow, and is often done according to guidelines which are not applicable to island hydrogeological environments. In many cases, certain types of sanitation systems (e.g. pit latrines and even septic tanks, which are often poorly maintained) are incompatible with maintenance of good groundwater quality. Resultant problems are very high bacterial and high nitrate levels. This water is sometimes used for potable purposes (after some but often insufficient boiling) contributing to endemic sickness in the local population.
Inadequate solid waste disposal methods often add to the pollution problem on small islands. This is especially serious where solid waste, which often contains toxic chemicals and hydrocarbon residues, is dumped over or close to freshwater areas. Landfill sites on the edges of the island, which keep pollution away from freshwater resources, can have a major impact on near-shore and marine resources.
Actual and potential chemical contamination of water resources is also a major problemon some small islands caused by uncontrolled use of agricultural chemicals (insecticides and pesticides), some of which have been banned in other countries. Often the extent of the problem is not well known owing to little or no monitoring. Other sources of chemical pollution for surface and groundwater resources are leakage of hydrocarbons (e.g. from poorly
Second International Colloquium onHydrology and Water Management in the Humid Tropics
243
maintained fuel storages, power stations and pumping stations), untreated industrial effluent discharges and, on some islands, releases of toxic mining wastes.
Seawater intrusion due to over-pumping from fragile groundwater resources has led to the depletion of groundwater resources on a number of small islands. An extreme example is Malé in the Republic of Maldives where over-pumping has led to the total loss of the island’s fresh ground water. In such cases, more expensive water supply options including desalination and importation of water have been implemented to meet the demand for water.
Land use changes involving the removal of trees and other vegetation (e.g. foragriculture, forestry or mining) has often led to increased problems of erosion and sedimentation on high islands with moderate to steep slopes. High turbidity and sediment loads after heavy rainfall on cleared catchments are major problems for water supplies on some islands. In the worst cases, these impacts have caused water to become non-potable for days after heavy rainfall or, where treatment plants are used, have severely impaired the treatment processes.High turbidity and sediment loads caused by land use changes have often adversely impacted on the near sea ecology of small islands.
3.4 Policy, planning and management
In many small island nations, there is inadequate emphasis placed on water and sanitation sector issues. Commonly, there is no clear policy for water resources development and management and inadequate or no legislation to protect and conserve water resources. In other islands, legislation exists but is not effectively enforced. For instance, illegal habitation on areas designated as ‘water reserves’ continues to occur on some islands. Another example is the common occurrence of illegal connections into public water supply facilities, tampering withwater meters and outright wastage of water (e.g. by leaving taps on).
In some small islands, there is a lack of clear distinction between agencies involved in the provision of water supply and the regulation and protection of water resources. Co-ordination problems are evident where a multiplicity of agencies is involved, at least to some degree, in the water sector, often without clearly defined roles and responsibilities. Inter-departmental water committees established to improve co-ordination in the sector in some islands are sometimes ineffective owing to the often-large groups involved, competing priorities and sometimes-irregular meetings. A more serious issue in some cases is the conflict between traditional private land ownership and government imposed land use, which may have beenimplemented without formal agreement between the affected parties. These issues can lead to conflicts of interest and uncertainty, and protracted delays in achieving effective land and water management.
Short-term decision-making, often at a time of greater stress (e.g. during severedroughts), can result in inappropriate and expensive solutions being implemented where more appropriate solutions are available. An example is the perceived need for desalination plants to overcome water shortages during droughts when other naturally occurring water resources are available at a much cheaper cost of development but are not fully utilised due to inadequate monitoring information or other issues (e.g. distribution systems with large leakage and wastage rates).

Second International Colloquium onHydrology and Water Management in the Humid Tropics
244
3.5 Assessment and monitoring
On some islands, there appears to be a decline in recent years in the quality of data collection from long-term rainfall gauges and climate stations. Recent gaps in data in otherwise continuous records are a symptom of the problem. The causes are multiple but include inadequate and often declining funding from government, reductions in external assistance from traditional aid donors, faulty equipment and insufficiently trained staff.
In some situations there has been inadequate attention to obtaining critical data for water resources monitoring (e.g. on rainfall, surface flows, groundwater levels, water quality).Many water supplies are designed and implemented without resources and training beingprovided to cover basic monitoring. It is of fundamental importance in the case of small islands that appropriate monitoring of rainfall, streamflow, water salinity, water levels and pump rates be undertaken and seen as a long-term, basic operational requirement rather than a short-termproject requirement.
Inadequate assessment of water resources, and planning and management of water resources development has contributed to inappropriate decisions being made. This includes allowing settlement on areas that once had good potential for freshwater resource development but where these resources now have become polluted to such an extent that they are unusable or require expensive treatment.
Inadequate attention is often given to the assessment of simple and practical alternatives for supplementary water (e.g. rainwater systems). There is also generally inadequate emphasis placed on appropriate, simple and non-polluting sanitation systems (e.g. composting toilets) instead of systems that are known to pollute vulnerable groundwater resources (e.g. pit latrinesand poorly maintained septic tanks).
Small island nations are concerned about the possibility of sea-level rise and the impacts this would have on their islands and communities. Long-term climatic change caused either by natural or anthropogenic phenomena can influence the water resources on small islands and, in fact, their very existence. The current focus on the impact of sea level rise on small island nations is useful in raising awareness of the issue of climate change. It can, however, have the effect of detracting from more immediate problems and ones that are likely to have a greater impact on many small islands over the next 20-50 years than potential rises due to sea level. The impacts of inadequate water supply and sanitation are being felt now, and in a manner probably far greater than the potential problems of sea level rise. This is not to suggest that monitoring programs of climate change and sea level rise should be curtailed, but rather that there is a need to focus attention on the current major water and sanitation issues.
3.6 Community consultation, education and involvement
Inadequate community education, consultation and involvement in decisions affecting water resource development, management and protection are problems in a number of island nations. As a result, communities may become suspicious and even hostile to government agencies involved with water supply provision. Sometimes villages are adversely impacted by water resource development projects and may have had little if any involvement in the decision-making process, leaving them feeling resentful and alienated. Vandalism against water supply infrastructure and monitoring equipment is not uncommon.

Second International Colloquium onHydrology and Water Management in the Humid Tropics
245
3.7 Research and training
The results of hydrological research and investigations from large islands or continents are often difficult to apply or inappropriate for small islands. Sometimes, though, hydrological studies undertaken on larger landmasses (large islands and continents) do apply to small islands.However, there are some areas of research that are essentially only applicable to the small spatial scale of islands and the relatively rapid turnover of hydrologic systems on such islands.Island-specific or, in favorable cases, regional studies are required for water resourcesassessment, development and management issues to be resolved.
While there has, in recent times, been a commitment to island hydrological research from international and regional agencies (e.g. the UNESCO-IHP/SOPAC sponsored projects on selected Pacific Islands with additional and ongoing assistance provided by otherinstitutions/agencies: White et al., 1999a; Crennan, Fatai & Fakatava, 1998), there is a need for further commitment in this area. Such commitment to applied research, training andtechnical transfer can provide great benefit to small islands in offering solutions to some of the fundamental hydrological issues (e.g. sustainability of extraction rates, and vulnerability of water resources to natural and human-induced stresses: droughts, pollution, etc.).
In recent years, significant gains have been made in the development of water resources professional and technical staff from island nations in the Pacific region. However, many island countries remain understaffed in the water supply and sanitation sector. In particular, there is a shortage of well-trained and experienced local professionals to undertake the necessary and important medium and long term planning required for appropriate development andmanagement of water resources.
4 FACTORS AFFECTING WATER RESOURCES
It is useful to consider the main factors influencing hydrological processes and the nature of surface and groundwater resources on small tropical islands. The main factors are:
• Physiography,• Climate and hydrology,• Geology and hydrogeology, • Soils and vegetation, and• Human impacts, including abstraction (pumping or withdrawal of water) and pollution
from a variety of sources.
For low islands and low lying areas of high islands, sea level movements due to tides,pressure changes and longer-term influences are also important factors. Each of these factors is briefly considered below.
4.1 Physiography
Size, shape and topography of a small island are major influences on the occurrence of both surface and groundwater resources. Larger and wider islands are more likely to have either or both types of water resources in greater quantities than smaller and narrower islands. The
Second International Colloquium onHydrology and Water Management in the Humid Tropics
246
width of a small island is a particularly important influence on the occurrence of basal aquifers (e.g. “freshwater lenses” on coral islands)
Small islands are often classified according to topography as either "high" or "low.”Depending on geological conditions, high islands have the potential for surface water resources as well as groundwater resources, while low islands generally only have the potential for exploitable ground water. On low islands, surface water, if it occurs at all, is likely to be in the form of shallow and often brackish lakes. Volcanic islands are typically high islands and coral atolls are typically low islands. Raised coral limestone islands are topographically high but generally have no surface water owing to high permeability of the rock.
High volcanic islands with low permeability surfaces may have small perennial streams, except during extended droughts. On most small islands, surface runoff occurs rapidly after rainfall and recedes to little or no flow within hours. If high islands consist of predominantly low permeability rocks, surface runoff can be an important component of the water balance.
4.2 Climate
The climate of small islands within tropical regions is variable with time and location. The controlling mechanisms of tropical climate are summarised by Manton & Bonell (1993). These can include, at increasing time scales, diurnal convection, easterly waves, tropical cyclones, thirty-sixty day oscillations, monsoons, quasi-biennial oscillations, El Niño/La Niña episodes and long-term climatic change. Regional climatic influences on small islands are presented in UNESCO (1991).
4.3 Hydrology
A small island’s hydrological regime is largely determined by local geology and topography, the prevailing climate, together with soil and vegetation conditions. These factors affect the quantity and distribution of recharge to ground water and, on high islands, the nature of surface runoff.The most important hydrological processes are precipitation and evapotranspiration, themagnitude and variability of which have a major influence on an island’s water resources.These and other hydrological processes are considered in more detail in the next section.
4.4 Geology
Small islands can be classified according to geology in a number of ways. A convenient classification, outlined in UNESCO (1991) is as follows:
• Volcanic,• Coral atoll,• Limestone,• Bedrock,• Unconsolidated, and• Mixed.

Second International Colloquium onHydrology and Water Management in the Humid Tropics
247
Other classifications are equally valid. For instance, Hehanussa (1993; see alsoHehanussa in this document) presents a classification of islands based on both geological andtopographical (low and high) characteristics.
Volcanic islands are common in tropical regions of the Pacific Ocean (e.g. Hawaiian Islands, many islands in Micronesia and French Polynesia) and in the Caribbean Sea. They also occur in the Atlantic Ocean (e.g. Ascension Island) and the Indian Ocean (e.g. Mauritius).There are at least two sub-types of the volcanic type: the andesitic sub-type which normally forms as island arcs on the continental sides of deep trenches, and the basaltic or oceanic sub-type which rises from the ocean floor in the middle of tectonic plates.
The coral atoll type of island is common in the Pacific Ocean (e.g. the islands ofKiribati, Tuvalu and the Marshall Islands) and in the Indian Ocean (e.g. the Maldives, some of the islands in Seychelles and the Cocos (Keeling) Islands). There are many variants of the coral atoll type of island but typically they consist of a chain of low coral islands surrounding a shallow lagoon. Small limestone islands are also common in the oceans and seas within the humid tropics.Examples include old carbonate islands such as Bermuda in the Atlantic Ocean, the Bahamas in the Caribbean Sea and raised coral atolls such as Nauru, Niue and many of the islands in Tonga in the Pacific Ocean. Raised atolls are uplifted coral atolls that have undergone subsequent erosion and karstification. Some limestone islands and coral atolls have beensubsequently tilted and may also be covered in other deposits (e.g. volcanic ash layers on limestone islands in Tonga, phosphate deposits on Nauru and Christmas Island, Indian Ocean).
Many islands show stages of evolution between volcanic and limestone, as shown in Figure 2.
Bedrock islands are those formed by igneous or metamorphic rocks such as granite, diorite, gneiss and schists. They are mainly found on continental shelves or adjacent to large islands of similar geology.
Unconsolidated islands typically consist of sand, silt and/or mud and are generally found in the deltas of major rivers. These islands are often very susceptible to flooding from rivers and sometimes from overtopping due to storm driven waves (e.g. in the Bay of Bengal).
Islands of mixed geology are common. Amongst the oceanic islands those with a mixture of volcanic and limestone rocks occur frequently. Other examples are limestone or volcanic islands with unconsolidated sand deposits on part or all of the perimeter.
Over long periods of time the geological nature of islands can change. For instance, volcanic islands can subside forming fringing reefs and eventually all traces of volcanic rock sink below the surface leaving coral limestone as the only rock type above sea level. This process is shown in Figure 2 and more explicitly in Figure 3.
4.5 Hydrogeology
Hydrogeological factors have a major influence on the distribution of ground water on an island.These factors include the permeability and porosity of the rocks and sediments, and thepresence and distribution of karstic features such as small cave systems and solution cavities.
Surface water resources prevail only on islands with relatively low permeability.Groundwater resources are most abundant on small islands with moderate to highpermeabilities and porosities. Where the permeability or porosity is very low, exploitable ground water is generally low. Conversely, where permeabilities are very high, mixing of

Second International Colloquium onHydrology and Water Management in the Humid Tropics
248
freshwater and seawater are enabled and fresh groundwater resources are limited. The islands with the greatest potential for groundwater resources are those with moderate permeabilitiesand porosities.
Figure 2. Some volcanic & atoll island types (after Scott & Rotondo, 1983; Woodroffe, 1989)
Volcanic islands of the andesitic type generally have low permeability and water-bearing properties and groundwater yields are generally low. The basaltic types of volcanic islands, where lava rather than pyroclastic rock predominates, vary in permeability and hence in exploitable ground water. Where the lava flows are young such as found in the HawaiianIslands, Western Samoa and French Polynesia, permeability and groundwater potential are high. In older basaltic islands with a higher degree of pyroclastic material, the volcanic rock has low permeability and limited exploitable ground water.
Limestone islands are generally karstic and weathered from alternate periods ofsubmergence and exposure due to fluctuating sea levels. Caves and solution cavities are often found along the shoreline and within the island. The permeability of the limestone is often very high (generally greater than 1,000 m/d) and, consequently, freshwater lenses are generally no more than about 10-20 m thick, even though the islands may be quite wide.

Second International Colloquium onHydrology and Water Management in the Humid Tropics
249
Figure 3. Stages in the evolution of an atoll island showing (a) active volcanic island, (b) volcanic core subsiding after vulcanism ceases, (c) final stages of volcanic rock above sea level and (d) the ring-like structure of most atolls (modified fromAyers, 1984).
Coral atolls generally consist of a layer of recent (Holocene) sediments, mainly coral sands and fragments of coral, on top of older (Pleistocene) limestone. An unconformity, separating these two layers at typical depths of 10-15 m below mean sea level, is one of the main controls to freshwater lens thickness (refer Figure 1). The freshwater zone is mainly or solely contained in the relatively low permeability (typically 5-10 m/day) coral sediments as mixing of freshwater and seawater is readily facilitated in relatively high permeability limestone (typically 50-1,000 m/day).
On small islands fluctuations in sea level, primarily due to tides, cause movement of the freshwater lens. The tidal lag and efficiency is dependent largely on permeability of thesediments. In karstic limestone, the tidal efficiency at the water table can be more than 90% at relatively large distances from the coastline (e.g. 300 m on Christmas Island, Indian Ocean). In coral sediments on atolls the tidal efficiency at the water table is often 5-15% and isindependent of distance from the coastline, indicating predominance of vertical and nothorizontal tidal signal propagation. Further evidence is the increase in tidal efficiency with depth (to 70-90% near the base of the Holocene sediments).

Second International Colloquium onHydrology and Water Management in the Humid Tropics
250
4.6 Soils and vegetation
Soils play an important role in the hydrological cycle through their influence onevapotranspiration, surface runoff and groundwater recharge.
Limestone and coral islands have sandy soils with high infiltration capacity resulting in little or no surface runoff except where the surface has become compacted. Recharge from heavy rainfall quickly infiltrates below the root zone, thus decreasing evaporative losses and increasing recharge.
Clay soils produced by weathering are generally evident on volcanic and bedrock islands. The thicknesses of these soils depend largely on the history of deposition and erosion, and on the topography and vegetative cover. These may have a lower infiltration capacity than sandy soils causing surface runoff to occur more readily after rainfall.
Thick, high water-retention soils can be an effective agent in preventing or minimising groundwater pollution and, hence, in the protection of aquifers. Thin, low water-retention soil layers such as the sandy soils found on coral islands offer very little protection to underlying freshwater lenses.
The type and density of vegetation also has important effects on the hydrological cycle and available water resources. Vegetation intercepts a portion of rainfall, causes transpiration to occur and, on high islands, may slow surface runoff and reduce erosion. Interception and transpiration by vegetation decrease recharge. On many small islands, the native vegetation has been partially or largely cleared for development, and significant erosion of the landscape has occurred. Depending on the depth to the water table and type of vegetation, directtranspiration losses from a freshwater lens may be promoted. For example, coconut trees on low coral islands act as phreatophytes (i.e. they draw water directly from the water table) and can lead to a reduction in groundwater resources in relatively dry periods.
4.7 Human impacts
The impacts of human activities on both quantity and quality of surface andgroundwater resources are presented in some detail in the section on water issues andproblems.
5 WATER BALANCE AND HYDROLOGICAL PROCESSES
5.1 Overview
The hydrological cycle is a combination of a number of atmospheric, land surface, sub-surfaceand marine components which involve the transfer of water in its various phases (vapour, liquidand solid). These components are often described as hydrological processes. Small islands provide a unique opportunity to study the full hydrological cycle and processes within a limited domain.
Significant hydrological processes include:
• precipitation,• surface retention,• infiltration and soil water dynamics,

Second International Colloquium onHydrology and Water Management in the Humid Tropics
251
• evapotranspiration,• surface runoff,• groundwater recharge, and• groundwater flow.
This section presents some of the main features of, and relationships between, these hydrological processes as they apply to small islands. First, water balance principles are reviewed in the context of small island hydrology.
5.2 Water balance
The main hydrological processes are often related and analyzed by means of a water balance (or water budget). A water balance equates inputs to outputs, storage terms and a possible error term to account for both errors in measurement and unknown or unquantified terms (UNESCO, 1991).
All water balances are relative to a defined domain. For a small island, the water balance can be considered at an island wide scale, or at the sub-area or catchment (basin) scale. The domain selected for a water balance study is dependent on the size of the island and the problem being studied. For a very small low-lying coral island, normally the whole island would be considered. For high islands with multiple catchments, it may be more appropriate to analyze the balance on a catchment basis, particularly if surface runoff characteristics differ between catchments. In some cases, larger areas than an individual surface catchment may need to be considered, as groundwater provinces can extend over several catchments.
Once the domain is defined, the water balance can be conveniently considered within two reference zones (Chapman, 1985). The first reference zone is at the island's surface and comprises atmospheric processes, vegetation, soils and the unsaturated zone. The second zone is the groundwater system. The water table provides a convenient interface between the two zones.
Water balances are time-dependent. The selected time interval must be suited to the natural fluctuations of the hydrological processes being considered. In particular, the time interval should be based on knowledge of turnover time (Chapman, 1985; Falkenmark & Chapman, 1989) of the hydrological system (i.e. time required for the system to replace itself).
Water balance at the surface.
At the surface of an island, rainfall is the input. Evapotranspiration, surface runoff (if it occurs) and recharge to ground water are outputs. Surface retention (interception and depression storage) and water held in the soil and the unsaturated zone are the storage terms.A general water balance equation for the surface of a small island is:
P = Eta + SR + R + ∆V (1)
where P is precipitation (most commonly rainfall), Eta is actual evapotranspiration, SR is surface runoff, R is recharge to ground water, and ∆V is the change in soil moisture. Interception by vegetation and other surfaces can be treated as a separate term in the water balance, but here it has been included with Eta since the intercepted water is evaporated.

Second International Colloquium onHydrology and Water Management in the Humid Tropics
252
On many low islands with permeable soils and subsurface geology (typically, coral atolls and small limestone islands), there is negligible surface runoff and the water balance equation can be reduced to:
R = P - Eta + ∆V (2)
Figure 4 shows a water balance model used for estimating net recharge on a typical low coral island with a shallow water table. In this model, Eta is assumed to be comprised of three terms, namely, interception (EI), evaporation and transpiration from the soil zone (ES), and transpiration of deep-rooted vegetation directly from ground water (TL).
The time step for the surface water balance on a coral island should not exceed one day because the turnover time in the soil zone is measurable on this time scale (Chapman, 1985). The use of either mean or actual monthly rainfall data rather than actual daily rainfall data will underestimate recharge (e.g. by 6-10% for two coral atoll studies: Kwajalein: Hunt & Peterson, 1980; Cocos (Keeling) Islands: Falkland, 1994a). The latter study found that the use of mean monthly evaporation estimates rather than daily evaporation data was acceptable.
The water balance procedure is more complex for raised atolls and limestone islands.Typical depths to water table are 10-100 m and extensive karstic formations often occur.These islands may have soil layers of variable thickness unlike low coral islands, and may have interbedded ash layers from previous volcanic activity. Roots of trees may penetrate through fissures and reach pockets of water at different levels. Flow paths from the surface to the water table may have major horizontal components due to karstic formations (solutionchannels) unlike the essentially vertical flow paths with low coral islands.
For volcanic and bedrock islands, the water balance is also complex and it is essential that the major components are adequately quantified. Water balance equation (1) was used to estimate recharge to ground water for Norfolk Island (Abell & Falkland, 1991) and Pohnpei, Federated States of Micronesia (Spengler et al., 1992).
The water balance for islands of mixed geology is even more complex. The water table may vary considerably in elevation due to a number of perched aquifers and an underlying basal aquifer. On some islands, the time scale taken for rainfall to percolate and become subsurface flow is quite long. For example, on Christmas Island, Indian Ocean, the response of a major subterranean stream occurring at the interface between volcanic rock and overlying limestone at a depth of about 50 m below the ground surface is about 3months (Falkland & Usback, 1999).
Water balance within the groundwater system
For the groundwater system, recharge (from the surface zone) is the input with the outputs being losses to seawater (due to outflows at the island perimeter and dispersion at the base of the groundwater system) and abstraction.

Second International Colloquium onHydrology and Water Management in the Humid Tropics
253
Figure 4. Water balance model to estimate recharge for a coral island (fromFalkland & Woodroffe, 1997)
The water balance within a small island groundwater system can be expressed in its simplest form as:
R = GF + D + Q + ∆S (3)
where R is net recharge, GF is groundwater outflow (to the sea), D is dispersion at the base of the ground water, Q is abstraction (normally by pumping), and ∆S is change in freshwater zone storage.
The value of R in equation (3) is usually estimated from the surface water balance (equation 1) but can also be estimated from other methods as described later.
Due to a longer turnover time within the groundwater system than in the surface zone, a monthly time step for the groundwater balance is appropriate. Commonly, the turnover time of the fresh ground water on a small island is between one and ten years, with the durationdepending on the relative magnitudes of average freshwater zone thickness and averagerecharge.
The groundwater balance is complicated if there are perched or dyke-confined aquifers present on the island, as in the case of some volcanic islands. In mixed geology islands, the groundwater flow pattern may include subterranean streams (e.g., Christmas Island, IndianOcean). These streams may emanate as springs either above or below sea level, or become more diffuse flows near the edge of the island.

Second International Colloquium onHydrology and Water Management in the Humid Tropics
254
Figure 5. Groundwater balance for a typical coral island freshwater lens.
5.3 Precipitation
In tropical regions, precipitation on small islands occurs predominantly as rain. Other forms of precipitation, particularly dew condensation and fog interception, may occur in highland areas of small high tropical islands. As these are relatively minor forms of precipitation in comparison with rainfall in tropical islands, emphasis is placed on rainfall. The important characteristics of rainfall from a water resources viewpoint for a particular island are its spatial and temporal distribution.
Spatial variations
Spatial variations in rainfall for islands are largely governed by the prevailing regional climate that is a function of the island's latitude, longitude and proximity to other landmasses. Ingeneral, small islands share the climate of the ocean region in which they are located.Exceptions are islands situated close to continents where the coastal continental climate may have a strong influence on the prevailing climate including rainfall patterns on the nearby islands.
Rainfall varies considerably between small islands and can vary within a given island.As an example of inter-island variation, the distribution of mean annual rainfall at sea level in the tropical and sub-tropical regions of the Pacific Ocean varies from approximately 500 mm to more than 4,000 mm.
The spatial rainfall variation on high islands is often very significant owing to orographic effects. Under the influence of moist winds, rainfall on the windward side is considerably higher than on the leeward side as the moist air currents are forced to rise over elevated terrain. On the leeward side, dry and possibly arid conditions can prevail due to a ‘rain-shadow’ effect.On Pohnpei in the Federated States of Micronesia (area 338 km2 and maximum elevation760 m), the rainfall at sea level is approximately 3,500 mm compared with over 10,000 mm at

Second International Colloquium onHydrology and Water Management in the Humid Tropics
255
altitude (Spengler et al., 1992). On Kauai in the Hawaiian Islands (area 1,420 km2 and maximum elevation 1,600m), nearly 12,000 mm of rainfall falls annually at the high altitude compared with 500 mm less than 30 km away on the leeward side of the mountains (Peterson, 1991).
Rainfall gradients on small high islands are often very steep on small islands. Examples are Pohnpei (800 mm/km), Kauai (850 mm/km) and Rarotonga, Cook Islands (area 67 km2
and maximum elevation 650 m) where the gradient reaches 1,000 mm/km (Waterhouse & Petty, 1986).
Orographic effects are also found on islands with moderate terrain. For example, Christmas Island, Indian Ocean (area 135km2 and maximum elevation 361 m), receives higher rainfall (2,400 mm) at an elevation of 250 m compared with 1,900 mm on the coastal margin, a difference of about 25% over a distance of 5km (Falkland, 1986). Other examples are provided in UNESCO (1991).
On low flat islands, orographic effects are negligible and there are no significant long-term spatial rainfall variations. Minor variations, typically 10-20%, in mean annual rainfall have been observed (e.g. New Providence, Bahamas: area 208 km2 and maximum elevation 3 m:Swann & Peach, 1992); South Keeling atoll, Cocos (Keeling) Islands: area 14 km2 andmaximum elevation 9m: Falkland, 1994b). Rainfall variations of these magnitudes are not considered significant given that measurement accuracy of individual rain gauges is of this order.
As orographic influences are significant, it is important for high islands to measure rainfall at a number of locations, including low and elevated terrain and windward and leeward parts of the island. For high islands, significant under-estimation will occur if records are used solely from rain gauges in the coastal areas. On many high islands, there is insufficient data to accurately estimate spatial rainfall patterns, particularly where the elevated terrain is steep and inaccessible. Even with access to remotely sensed data, there is a need to obtain accurate ground level rainfall data. If rainfall data is not available from the elevated parts of the island, approximate estimates based on measured differences between sea level and elevated terrain on similar and preferably nearby islands can be made.
Temporal variations
Knowledge of temporal variations in rainfall (inter-annual, annual, seasonal, monthly and daily rainfall patterns) is required in order to carry out comprehensive hydrological studies. Shorter time scale data from pluviographs are also useful for analyzing the effects of individual storms.
Inter-annual variability of rainfall may be high on small islands due to significant climatic cycles such as the cycle of El Niño (often referred to as El Niño Southern Oscillation or ENSO in the Pacific) and La Niña (or ‘anti-ENSO’) episodes. An example is the mid -Pacific Ocean atoll of Kiritimati (Christmas Island), Republic of Kiribati, where annual maximum, mean and minimum rainfalls for the period 1951-1998 are 3,686 mm (in 1997), 890 mm and 177 mm (in 1954). The coefficient of variation of annual rainfall is 0.77, considerably higher than values of 0.2 - 0.4 on many other tropical islands (UNESCO, 1991).
On many tropical islands, particularly in the Pacific Ocean and parts of South East Asia, there is a strong relationship between low rainfall and El Niño episodes. The opposite effect is experienced in some parts of the central and eastern Pacific Ocean, where high rainfall is associated with El Niño episodes. On the atoll of Tarawa, Kiribati, in the central Pacific

Second International Colloquium onHydrology and Water Management in the Humid Tropics
256
Ocean, for example, there is a high correlation (r2 = -0.67) between annual rainfall and the Southern Oscillation Index (SOI).
Many small islands are also influenced by random cyclonic events. Cyclones are a major problem for small island communities, often causing major wind damage, floods, hillside erosion with consequent downstream damage and sedimentation. The highest rainfall intensities and maximum daily rainfalls on small islands are normally associated with tropical cyclones (hurricanes) and tropical depressions. This can have beneficial effects on groundwaterresources. However, freshwater lenses can suffer due to partial inundation with seawater as a result of cyclonic storms. This phenomena has occurred on a number of Pacific Ocean atolls (e.g. in the Marshall Islands, Tuvalu, Tokelau and the Cook Islands) and many months may be required to naturally ‘flush’ the saltwater from freshwater lenses and restore them to a potable condition.
Seasonal variations are most obvious in areas with distinct wet and dry seasons, often associated with monsoonal climate. On some islands in the Torres Strait between Australia and Papua New Guinea, for instance, about 90% of the mean annual rainfall occurs in the 6 month'wet season' from December to May. The highly skewed seasonal pattern of rainfall has major effects on available ground water and other water resources.
While mean monthly rainfall patterns can provide an insight into average variations in rainfall, they are most often not a good guide to the actual time series of monthly rainfall. In water balance studies it is normally essential to use the actual time series of monthly rainfall.
At time scales of less than a month, variation in rainfall between rainfall recording sites becomes evident. Due to the localized impact of thunderstorms, daily rainfall records fromclosely spaced sites can show considerable variation.
Rainfall mechanisms and origins
Stable water isotopes (deuterium and oxygen-18) have been used on high islands todetermine the mechanisms of rainfall in different areas. Studies in the Hawaiian Islands, for instance Scholl et al. (1996), show areal differences in isotopic content of rainfall that are strongly correlated with general climatological patterns. High rainfall areas associated withorographic lifting of moist trade wind air have isotope contents similar to the first stagecondensation of atmospheric vapor above the ocean. The isotopic content becomes more depleted with increasing elevation and distance inland, as a result of the decreasing temperature and ‘rain out’ effects. In low rainfall areas, associated with rain shadow effects, where rainfall primarily occurs as storms, the isotopic content is more depleted than in orographic rainfall areas, but also depletes at about the same rate with elevation and distance inland. A third category of rainfall occurs in high elevation areas above the influence of orographic rainfall, where the isotopic content also varies with elevation but the depletion rate is higher than in the orographic rainfall areas. In these areas, the rainfall is considered to be all of storm origin.Scholl et al. (1996) consider that similar relations between rainfall isotope content and elevation may have application to other high islands.
5.4 Surface retention
Surface retention is the part of precipitation that does not infiltrate the surface and which is subsequently evaporated. Surface retention consists of interception and depression storage that

Second International Colloquium onHydrology and Water Management in the Humid Tropics
257
are, respectively, the water held on the surfaces of vegetation and the water stored in ground surface depressions after rainfall.
Interception by vegetation can represent a significant component of total evaporation to the atmosphere. The magnitude of interception is dependent on the type and density of vegetation. There is limited data available about interception on small islands.
During a recent research project of recharge on the island of Bonriki, Tarawa atoll, Republic of Kiribati, interception by individual coconut trees during low rainfall was measured at about 0.7 mm (White et al., 1999a). Over the study period from August 1996 to February 1997, the interception by trees was estimated to be approximately 7% of rainfall. Rain gauges placed in the open, under the fronds and under the crown showed that less rainfall fell under the crown (approx. 70% of open rainfall) but under the crown the throughfall was concentrated (up to 270% of open rainfall). The crown also contributed to significant stemflow on vertical trees.
In the absence of data, simple water balance models for low islands (Figure 4) have used estimates of interception store capacities (ISMAX) of 1mm (per day) for fully grassed areas and up to 3mm for areas which are thickly covered by coconut trees (e.g. Cocos (Keeling) Islands (Falkland, 1994b). It is assumed that the interception storage must be filled by rainfall before water is made available to the soil moisture storage and evaporation from the interception storage is assumed to occur at the potential rate. Water balance simulations using daily rainfall data for the period 1953-1991, showed that average interception losses were 8% and 20% of rainfall for, respectively, ISMAX values of 1and 3 mm. Based on recentlymeasured values for Tarawa, these values may be over-estimates and further work is warranted to refine these estimates. This should cover a range of typical vegetation types and densities on small islands.
Depression storage is difficult to estimate and depends on soil types, depths andinfiltration capacities, topography and the influence of man (for example, agricultural practices and urbanization). Depression storage decreases with increasing slope, increasing soilinfiltration capacity and decreasing rainfall intensity. Where freely draining soils occur (high infiltration capacity), depression storage is low or negligible and can be neglected except where urban areas are significant. In many small island situations, it is of minor importance and can probably be ignored, except where large areas are taken up by surface water storages. In these limited cases, site-specific studies are required.
5.5 Infiltration and soil water dynamics
Infiltration is the movement of water through the soil surface and into the soil. Water infiltrates the soil surface under the effect of gravity in the larger soil openings (macropores) and bycapillary action through smaller pores. Infiltration in tropical soil conditions, especially hillslope conditions, is extensively covered in Bonell and Balek (1993). These authors note that there is limited knowledge of field soil hydraulic properties (e.g. sorptivity and hydraulic conductivity) in tropical regions and this is also the case on small tropical islands. Field instruments andtechniques are outlined by these authors and an extensive list of other reviews and references is provided.
It is not intended to reiterate the extensive work of Bonell and Balek (1993) and other work covered by other authors in Bonell, Hufschmidt & Gladwell, (1993). An example of a recent study on a coral island (Bonriki, Tarawa: White et al., 1997, 1999a) will be briefly considered.

Second International Colloquium onHydrology and Water Management in the Humid Tropics
258
As part of the Bonriki recharge project, moisture readings of the sandy soil/unsaturated zone, were made at depths of 0.15, 0.3, 0.5 and 0.7m at 2 sites (one open site, the other under trees) using buried time domain reflectometry (TDR) probes linked to a data logger. The TDR equipment was found to be particularly useful as it could be left for long unattended periods, and avoids the regular visit requirements for some other methods.
Results from the Bonriki study show rapid response of soil water to rainfall. Soil drying occurred over several weeks following high recharge and followed the square root of time dependence expected for soil evaporation. Further details are contained in White et al.(1999a).
Further useful extension to this study would be to measure the soil water dynamics in the upper 0.15 m, where the limited organic matter within the unsaturated zone is mainlyconcentrated.
Bonell & Balek (1993) emphasize the need for further field data to be obtained for humid tropical sites and this is certainly applicable to small islands.
5.6 Evapotranspiration
The combined processes of evaporation and transpiration are referred to as evapotranspiration.On small tropical islands, evapotranspiration is a very important part of the hydrological cycle and can account for more than half of the rainfall on an annual basis. It often exceeds the rainfall for individual months or consecutive months during dry seasons or drought periods.Despite its importance, evapotranspiration is probably the least quantified component of the water balance on small islands (Falkland & Brunel, 1993; White, 1996).
Direct measurements of actual evapotranspiration (ETa) on small islands, especially over long periods, are sparse and difficult to obtain. Where they have been used, they tend to be short-term studies. Brunel (1989) outlines short-term studies at two sites in New Caledonia where weighing lysimeters and the Bowen ratio method were used. White (1996) outlines possible methods for direct measurement including weighing lysimeters, micrometeorological techniques (e.g. Bowen ratio, eddy correlation), heat pulse (sap flow) measurements, tracers, ventilated chambers, aircraft measurements with meteorological platforms, atmospheric mass balance, microwave and optical scintillometry. All methods have problems, including measuring only part of the total evaporation, logistics and costs.
Transpiration by trees, for example coconut trees, can be a significant part of total evapotranspiration, especially on low lying islands and low lying parts of high islands where water tables are shallow and coconut trees are often prolific. Their roots are capable of penetrating 5m below the surface and hence are able to reach the water table in many island situations. The roots can access water even during drought periods, as long as the water table does not drop substantially. On atolls and some coastal areas, water tables do not vary more than about 0.3-0.5 m and hence coconut trees can survive extended droughts unlike shallow rooted vegetation that can wilt and die.
Direct measurement of tree transpiration has been undertaken on two atolls using heat pulse velocity meters (or ‘sapflow sensors’). The first, on Cocos (Keeling) Islands during a one-week study (Bartle, 1987; Falkland, 1994a) measured rates of 70-130 L/day, equivalent to about 400-750 mm/year in areas with 100% tree cover and tree spacing of about 8 m. On Tarawa, the Bonriki recharge project (White et al., 1997) measured typical daily transpiration rates of 100-150 L/day over a 6month period. For a coconut tree with a 30 m2 leaf area,

Second International Colloquium onHydrology and Water Management in the Humid Tropics
259
these rates are equivalent to water loss of about 4 mm/day (White et al., 1999a). Based on an estimated tree cover over Bonriki over 20%, the average transpiration rate for coconut trees is 0.8 mm/day (290 mm/year). This is equivalent to a water loss from the Bonriki freshwater lens (approx. 71 ha in area) of about 570 m3/day.
Potential evapotranspiration estimation
In the absence of direct measurements, actual evapotranspiration (ETa) is often estimated for some small islands using a two-stage process. Firstly, potential evapotranspiration (ETp) is normally estimated from measurements of climatic parameters and/or pan evaporation.Secondly, Eta is calculated from ETp using a water balance procedure to take account of soil water deficit in dry periods and other factors.
Using climatic data, ETp can be estimated, for instance, by the Penman equation (Penman, 1948, 1956). When using daily pan evaporation data, appropriate pan coefficients are required to estimate ETp, normally on an aggregated monthly basis. Doorenbos & Pruitt (1977) and UNESCO (1991) outline a number of methods.
The Penman equation has often been used as an estimator of ETp in the tropics (Chang, 1993). For small islands, this equation has been used to estimate ETp on a number of small low-lying tropical islands (e.g. Tarawa, Kiribati: Fleming, 1987; Cocos (Keeling) Islands: Falkland, 1994a).
Both the Penman and pan methods were used for water resources studies of the Cocos (Keeling) Islands (Falkland, 1994b). Using data from 1982-1987, mean monthly climatic data was used to estimate ETp by the Penman method, after comparisons with daily and monthly data indicated that there was little difference in ETp estimates. Daily pan data and a pan coefficient of 0.8 were used to estimate ETp by the pan method. Mean annual ETp estimates were 2,048 mm (Penman method) and 1,983 mm (pan method), indicating a small difference (3%) between the two methods. As neither method is calibrated against direct measurements of evapotranspiration, the results are not validated.
The Bonriki recharge project (White et al.; 1997, 1999a) estimated ETp as3.9 mm/day over a 6-month period from August 1996 to February 1997. ETp was again based on the Penman equation and used climate station measurements at a site in the centre of Bonriki of solar radiation, air temperature, relative humidity, wind speed and atmospheric pressure. This estimated daily rate is equivalent to an annual evaporation rate of 1,420 mm, and compares with an average pan evaporation rate of 6.1 mm/day obtained from dailymeasurements of a US Class A pan at a more exposed part of the atoll in the period 1981-1991. While coincident and concurrent data was not available, the recent measurements on Tarawa in late 1996/early 1997 suggest an average pan coefficient of about 0.65.
In the tropics, the net radiation energy term dominates the aerodynamic term in the Penman equation. The Priestley-Taylor method, which simply equates ETp to 1.26 times the energy term from the Penman equation (Priestley & Taylor, 1972), has been found appropriate in wet months, apart from mountainous areas (Chang, 1993). This method was used by Nullet (1987) and Giambelluca, Nullet & Nullet (1988) to estimate ETp on a number of tropical Pacific islands. Nullet produced a map with isolines of annual potential evaporation, showing typical values of 1,600-1,800 mm.
White (1996) suggests that equilibrium evaporation (equivalent to the radiation term of the Penman equation) is a more appropriate upper limit for ETp than the full Penman equation.

Second International Colloquium onHydrology and Water Management in the Humid Tropics
260
Data from the Bonriki recharge project suggests that this is indeed the case for the location of the climate station, which is in the centre of the Bonriki Island and is sheltered to some degree by adjacent vegetation (White et al., 1999a). Hence, advection is low (wind speeds less than 2 m/s) and the aerodynamic term of the Penman equation is insignificant compared with the radiation term. By comparison the meteorological site on the Cocos (Keeling) Islands isexposed and mean wind speeds are higher (over 6m/s) and hence the advection term is comparatively more important than at Tarawa.
It has been found that the Thornthwaite method (Thornthwaite, 1948) which expresses ETp in terms of temperature and day length tends to underestimate ETp and is less accurate than the Penman method (Chang, 1993).
Estimation of actual evapotranspiration
A water balance procedure to estimate Eta from ETp and appropriate soil and vegetation parameters has been used on a number of low-lying small island studies (e.g. Cocos (Keeling) Islands: Falkland, 1994a). This is summarised in Figure 4, and further explanations and typical parameter values for this simple model are given in UNESCO (1991) and Falkland (1993).This water balance model for the surface zone of small islands is being validated against data obtained from the Bonriki recharge study.
From the Bonriki study, White et al. (1997, 1999a) estimated Eta at 0.67*ETp, or approx. 2.6 mm/day, based on observed rainfall, soil moisture and water level measurements.During a six month period (August 1966-mid February 1997), no recharge to ground water was evident from the soil moisture probe at depth 0.7 m and water table measurements (at depth 2m). Hence, all rainfall was assumed to be lost to evapotranspiration. As the measured tree transpiration, mostly from ground water, was about 1mm (approx. 40% of ETa) the remaining amount (1.6 mm/day) comprises both interception and soil moisture zone losses.
Conclusions and future directions
Despite isolated studies and the recent initiative by UNESCO and other agencies on a low-lying atoll in the Pacific, it is evident that small island hydrology suffers from both direct measurements and indirect estimates of evapotranspiration.
Further work on selected small low and high islands is required to ascertain theappropriateness of various methods of estimating potential evaporation. To do this, climate stations with appropriate sensing and recording equipment are required. Minimum parameters are radiation, air temperature, relative humidity, wind speed and atmospheric pressure.
For the direct measurement of evaporation, there is considerable promise for measuring evaporation fluxes from small tropical islands using optical scintillometry (White, 1996). In this method, a collimated infrared or microwave beam is transmitted to a receiver above the surface under investigation. Intensity fluctuations from the scintillometer together with measured wind speed and estimated surface roughness can provide estimates of heat, momentum and moisture fluxes. The usable range for large aperture scintillometers is about 1.7 km. Directmeasurement of evaporative flux is possible using recently developed microwave scintillometers but further testing remains to be made. This technique appears to be the most promising for small coral islands (White, 1996).

Second International Colloquium onHydrology and Water Management in the Humid Tropics
261
There is considerable potential for further detailed studies of tree transpiration on a number of small islands, low and high. The sapflow measuring equipment now available is very easy to operate and maintain and there is potential for greater use of this equipment combined with other techniques. As shown for the Bonriki recharge study (White et al., 1997, 1999a), this technique allows the components of evapotranspiration to be more accurately quantified.
5.7 Surface water runoff
Surface runoff only occurs on high islands with favorable topographical, soil and geological conditions. Such islands are generally characterized by many small sized catchments with steep slopes in which runoff occurs very rapidly.
Due to the erosive power of the streams, erosion and sedimentation problems are also prevalent. Soil and vegetation loss, high turbidity problems in streams and damage to water intake and other on-stream structures have occurred on a number of islands. These problems are particularly evident where high rainfall intensities occur (e.g. cyclonic rain) or whereextensive land clearing has occurred and where inadequate attention is paid to sediment control.
Less attention is paid in this paper to surface runoff processes than to those of ground water for two reasons. Firstly, surface runoff processes are well covered in other publications on the humid tropics (for example, Bonell and Balek, 1993). Other papers in Bonell, Hufschmidt & Gladwell (1993) also address this topic. Secondly, the surface runoff processes on small tropical islands are not dissimilar to those occurring on larger islands and on continental areas where similar climatic, topographical and geological conditions apply. As such, theresults of research in other tropical environments, especially nearby large islands or possibly mainland areas, can assist greatly with knowledge of surface water processes on small islands.This is particularly applicable where catchments with similar physical conditions (slopes, soils and vegetation) are found.
Data collection and processing
A necessary part of research into surface water processes is the need for surface waterresource assessment. The collection of runoff data on many islands, especially remote locations (‘outer islands’) is extremely difficult. The physical environment is harsh on equipment and structures. Stream gauging stations need to be robust and the equipment needs to be well tested in tropical environments. Problems in obtaining surface runoff measurements on small islands in the humid tropics are well covered in WMO (1983; 1987) and Manley & Askew (1993).
The use of properly tested electronic water level sensors (e.g. in-stream pressure transducers, above-stream ultrasonic sensors) and data logging systems is encouraged. This equipment is generally more reliable than older mechanical devices (e.g. chart recorders). All systems have their problems, especially in warm tropical environments and it is necessary to select the most appropriate technology based on experience. The acquisition of data from remote sites via radio or satellite telemetry is also encouraged, especially for flood warning or forecasting.
As small high islands are characterized by rapidly varying topography, multiple steep basins and difficult access, it is often not feasible to establish extensive water resourcesmonitoring sites. In particular, it is not practical or economic to gauge all streamflows.
Second International Colloquium onHydrology and Water Management in the Humid Tropics
262
Decisions need to be made about optimum networks to provide representative information.Hall (1983) outlines minimum networks for small tropical islands densities as follows:streamflow (1 per 140-300 km2), rainfall (1 per 25 km2) and evaporation (1 per 50,000 km2).These are guides only and individual island size, topography, access and resources need to be taken into account in applying them. Some high islands are very much less than 140 km2 and may require more than one streamflow station to characterise the runoff of the island. This is particularly relevant on islands that have multiple small basins with varying geological, soil and vegetation characteristics. As with many other aspects of hydrology in small islands,generalizations are not possible and each island or, at least group of similar islands should be assessed on its own merits. For instance on Norfolk Island (area 35 km2 and maximumelevation 319 m), 8 stream gauging stations (one recording, 7 daily read) were installed to quantify surface runoff from 54% of the island's area (Abell & Falkland, 1991).
Water quality data is even more difficult to obtain owing to often long travel times to laboratories. Where possible, in-situ tests should be conducted.
Data processing, archiving, analysis and reporting of hydrological (rainfall, climatic, streamflow, water quality and groundwater) data is an integral part of surface water resources assessment. A number of appropriate hydrological data processing software packages have been developed and are regularly updated for these purposes.
Remote sensing
Remote sensing has not been widely used in small island hydrology studies. It has, however, been used in a number of specific applications. Aerial photography is often used as a means of mapping surface and hydrogeological features. Aerial photography was studied (Canoy, 1983) in the U.S. Virgin Islands to assess the suitability of remotely sensed plant pigment as an indicator of soil moisture status and possible aquifers. It was concluded that this method was not suitable.
Satellite imagery (LANDSAT MSS) was studied for its usefulness in water resources assessment of the Belau islands (Contractor, 1982). Although surface water bodies larger than about 1-2 ha were easily identified, it was not possible to identify water bodies with lesser areas. Identification of coastal springs was found not to be accurate.
Satellite imagery (LANDSAT TM) was used to investigate coastal springs onChristmas Island, Indian Ocean. The limitations of pixel size (120 m square) and the small temperature differences between seawater and submarine and coastal freshwater springs meant that this technique was not successful at identifying springs.
Remote sensing has some practical applications and offers some useful opportunities for island hydrological studies. It will not replace but rather supplement ground-based surveys and studies. In-situ measurements of hydrological parameters are a necessary part of any remote sensing study to provide "ground-truth" for the remotely sensed data. Undoubtedly, remote sensing applications in small island studies will become more important, especially as sensor resolution is improved.
Data analysis
One of the parameters of primary concern to the water balance of high islands is the proportion of rainfall that becomes runoff. This is important, for instance, when estimating the relative

Second International Colloquium onHydrology and Water Management in the Humid Tropics
263
significance of surface and groundwater resources. To obtain such data, good quality data from a representative number of catchments is required. Runoff coefficients vary considerably between islands and may vary between catchments on islands. Runoff coefficients between 0.22 and 0.6 have been obtained for the Hawaiian Islands (Wright, 1989). An average value of 0.67 was obtained from gauging stations on Pohnpei, Federated States of Micronesia(Spengler, Peterson & Mink, 1992), indicating the low permeability of the volcanic rocks. On Mahe, a granitic island in Seychelles, the runoff coefficient for one basin was measured as 0.12 (Cetoupe, 1992). Runoff coefficients on Norfolk Island varied between 0.05 and 0.23 (Abell & Falkland, 1991), with the differences being due to differences in catchment conditions (cleared v. forested). Further information on runoff coefficients for different island conditions are contained in UNESCO (1991).
To determine the sustainability of runoff during dry periods, it is necessary to review baseflow conditions. On islands affected by floods, it is also desirable to gauge high flows and use this information with continuous stage hydrographs to develop flood hydrographs for further analysis. This is particularly important in urbanized areas where the risks and consequences of flooding are higher. The issue of flood hydrology is beyond the scope of this paper and is well covered in the literature. A case example of an urban catchment in Singapore is provided by Chui Peng Cheong & Tay Joo Hwa (1993).
Geographical information systems (GIS) are effective tools in the study and research of surface water catchments. They are most useful for their ability to overlay spatially available information including catchment boundaries, topography, soils, land use and of the information.They also can be used to plot rainfall hyetographs from rainfall networks and to store attribute data related to water resources monitoring stations.
5.8 Recharge to ground water
Reliable estimates of recharge are required as input to groundwater systems. Estimates of recharge can be made by a water balance, where it is treated as the output of the surface water balance, or it can be estimated by other methods. Some of the methods are given below while others are presented in more detail in UNESCO (1991).
Water balance procedure
Recharge is difficult to estimate because the amounts of water intercepted by tropicalvegetation, lost by evapotranspiration, removed from ground water by trees and stored in the soil are known only approximately. However, estimates for small coral islands have been made using the simple water balance model shown in Figure 4 and described earlier in this section.Large variations in annual recharge can occur as shown in Figure 6 for Tarawa, Kiribati atoll using daily rainfall records for 43 years (1954-1996). In general, years with high annual rainfall result in high annual recharge and vice versa. The relationship is not linear as recharge is dependent not only on total rainfall but on the distribution of daily rainfall. Recharge in some years can be very low and even negative (i.e. there is a net loss of water from the freshwater lens). This occurs due to transpiration directly from the lens by roots of coconut trees (in this case estimated to cover an average of 40% of the island’s surface over the full time period).The most critical times for freshwater lenses towards the end of a succession of low recharge years. Recharge in some years can be very low and even negative (i.e. there is a net loss of

Second International Colloquium onHydrology and Water Management in the Humid Tropics
264
water from the freshwater lens due to evaporation and transpiration). This is evident for some years at Bonriki - 1955, 1971, 1974 and 1985 (refer Figure 6). Recharge is even more variable at a monthly scale than at an annual scale.
A range of soil and vegetation parameters affects recharge estimates. For instance, the proportion of tree cover over a small coral island has a significant impact on recharge. The results of a series of water balance analyses for the period 1954-1996 using different percentages of tree cover on Tarawa yielded the following results:
• Average annual recharge of 1,023mm (50% of average rainfall) for 20% tree cover• Average annual recharge of 960 mm (47% of average rainfall) for 40% tree cover• Average annual recharge of 868 mm (43% of average rainfall) for 80% tree cover
Further details are presented in Falkland & Woodroffe (1997).While the results of this model need to be verified against actual measurements,
observations of groundwater volume underlying open and forested areas in the Cocos (Keeling) Islands suggest that these estimates are reasonable.
An alternative water balance model to that described above is provided in White et al.(1999a) based on data collected during the Bonriki recharge project.
Other methods of recharge estimation
If data for detailed water balance studies is not available, preliminary estimates can be made by other methods.
The first of these is an empirical relationship between mean annual rainfall and mean annual recharge shown in Figure 7. Using the results of a number of studies of recharge on small low lying islands, Chapman (1985) developed this non-linear graph. The graph was further extended (UNESCO, 1991) using the results of other island studies.
The data suggests that as the mean annual rainfall increases, the percentage recharge increases. The influence of vegetation can clearly be seen for the Cocos (Keeling) Islands and Christmas Island (Kiritimati), Republic of Kiribati. Results for three freshwater lenses with different vegetation densities in the Cocos (Keeling) Islands show that recharge can nearly be doubled by reducing the tree cover from 100% to zero.
A similar type of annual rainfall-annual recharge curve was developed for high islands, based on data from the Hawaiian Islands (UNESCO, 1991). It is evident that a lowerrecharge proportion occurs on high islands than on low islands which is due to the surface runoff component.
For the Pacific Ocean region, Nullet (1987) produced contours of recharge over low lying islands using the Priestley-Taylor method of determining ETp and a water balanceprocedure. Nullet's analysis assumed vegetated areas on atolls with a rooting depth forcoconut trees of 1m. It is not known whether a similar analysis has been done for other islands for other regions.

Second International Colloquium onHydrology and Water Management in the Humid Tropics
265
Figure 6. Annual rainfall and recharge for Tarawa, Kiribati, 1954-1996
Preliminary estimates of recharge can also be made using a solute balance approach (e.g.chloride ion). Recharge from rainfall has a small concentration of chloride due to airborne sprays from the ocean. Evapotranspiration subsequently removes some of the water leaving the chlorides behind in the ground water. The ratio of chloride ion in rainwater and in shallow ground water gives an approximate value of the ratio of recharge to rainfall. This approach has been used for estimating recharge on Guam (Ayers, 1981) and Norfolk Island (Abell &Falkland, 1991). Due to the many assumptions involved and the difficulty of obtaining representative values, this method is approximate. In small islands sea spray may affect samples of rainwater used for chloride balances. The ground water may also be more saline than the recharging water due to salt-water contamination where there is a thick transition zone, and this may invalidate calculations. Chapman (1985) suggests that samples for chloride ion balances should be obtained from just below the ground surface and just above the water table.A further problem of this method is that in low lying areas the top phreatic water, which can more easily be sampled than water from the unsaturated zone, may not have originated locally but rather have come dominantly from the island's interior, where there is generally a lowersalinity than the local recharged water.
Annual Rainfall at Betio & Estimated Recharge at Bonriki, 1954-1996(assuming 40% tree coverage, pan factor = 0.7)
Average annual values: Rainfall=2,040 mm, Recharge=960 mm (47% of Rainfall)
-1,000
0
1,000
2,000
3,000
4,000
5,00019
54
1959
1964
1969
1974
1979
1984
1989
1994
Year
An
nu
al r
ain
all &
rec
har
ge
(mm
Annual rainfall Estimated annual recharge at Bonriki

Second International Colloquium onHydrology and Water Management in the Humid Tropics
266
Figure 7. Relationship between mean annual rainfall and mean annual recharge for a number of low lying islands (from Falkland & Brunel, 1993)
Continuous water level records can be analysed in conjunction with tidal andbarometric records to estimate recharge. This method was used for the island of Tongatapu in Tonga (Furness & Gingerich, 1993). If the effects of sea level and pressure changes are removed from the water level hydrograph, recharge can be estimated from the residual trace and knowledge of the aquifer specific yield. The uncertainty of this method is associated with estimating a representative value of specific yield.
Monitoring of water table elevation at Bonriki, Tarawa has shown that major recharge events can raise the groundwater elevation over 600mm in approx. 3hours (after 200 mmrainfall in the same period). Increases in elevation take at least 7 days to decay due to discharge from the edge of the lens. The response to recharge is significantly more than to other effects. Drawdown during pumping (from infiltration galleries) is only about 20 mm and the diurnal water table fluctuation due to tides is approximately 60-100 mm. Water level measurements coupled with soil water measurements can clearly indicate the movement ofwater through the soil and unsaturated zone and subsequent effect at the water table.

Second International Colloquium onHydrology and Water Management in the Humid Tropics
267
5.9 Groundwater flow
The groundwater dynamics of small islands can be conveniently separated according to the two basic types of island aquifers: perched aquifers and basal aquifers. Basal aquifers or‘freshwater lenses’ are those in hydraulic connection with the sea while perched aquifers are those above sea level and are similar, in many respects, apart from their limited volume, to aquifers found on large islands and continents.
Water balance aspects for ground water were introduced earlier, particularly forfreshwater lenses that occur on many small coral and some volcanic islands. In many situations, the water balance is required to assess the sustainable yield of the freshwater lens (Q inFigure 5).
Modeling
To solve the groundwater system water balance, a groundwater model is normally used. Many models of varying accuracy, complexity and resource requirements are available.
Early conceptual models and solution techniques for freshwater lens flow assumed a sharp interface between freshwater and seawater based on the ‘Ghyben-Herzberg’ theory and the Dupuit assumptions of horizontal flow (refer Figure 8).
Observations have shown that this is not the case on atolls and that wide transition zones are the norm and vertical flow occurs. Sharp interface models can at best only provide an estimate of the depth to the mid-point of the transition zone, yielding no information about transition zone width. Such models also assume horizontal flow within the lens with freshwater outflow occurring around the perimeter of the island and do not account for tidal movements.They can at least provide qualitative information about the response of a freshwater lens and an indication of the most important aspects to be modeled in more detail by a more realistic model.
A more realistic conceptual freshwater lens flow model has evolved (Buddemeier & Holladay, 1977; Wheatcraft & Buddemeier, 1981; Oberdorfer et al., 1990; Peterson, 1991; Underwood et al.., 1992) based on detailed observations on atolls. The conceptual model accounts for vertical and horizontal tidal propagation through a dual aquifer system consisting of the upper (Holocene) coral sediments and lower (Pleistocene) limestone layer (Figure 9). This conceptual model is supported by observations on a number of atolls in the Pacific (Buddemeier & Holladay, 1977; Hunt & Peterson, 1980; Wheatcraft & Buddemeier, 1981; Ayers & Vacher, 1986; Anthony et al., 1989; White et al., 1999a) and in the Cocos (Keeling) Islands (Falkland, 1994b). These studies have shown that tidal lags and efficiencies at water level monitoring locations within atolls are largely independent of horizontal distance from the shore. Tidal lag and efficiency (or the time difference between, and amplitude ratio of, water table movement to tidal movement) are, in fact, greatly influenced by the depth of the holes used for water level monitoring. Vertical propagation of tidal signals tends to be dominant in the middle of the island whereas both horizontal and vertical propagation are significant near the edges.
Using this conceptual model, the numerical solution of freshwater lens flow problems can more realistically be made with available "dispersion" models rather than sharp interface models. Dispersion models are available which account for a two layered hydrogeologicsystem, flow of variable density water and the mixing of freshwater and seawater. Dispersionmodels are inherently more complex, requiring additional parameters to be evaluated or

Second International Colloquium onHydrology and Water Management in the Humid Tropics
268
estimated, than sharp interface models. Both types of models can be used on micro-computers, but dispersion models take much longer to run.
Figure 8. Ghyben-Herzberg model of groundwater flow in a freshwater lens. The model incorporates the Dupuit assumption of horizontal flow (after Buddemeier,1991)
One dispersion model is the two-dimensional (2D) SUTRA model, developed by the United States Geological Survey (Voss, 1984; Voss, Boldt & Sharpiro, 1997). This has been applied to the study of freshwater lenses and coastal aquifers on a number of islands. This model uses finite elements to solve the equations rather than the finite difference method used in the sharp interface models. Case studies using the SUTRA model include Enewetak atoll, Marshall Islands (Oberdorfer & Buddemeier, 1988; Oberdorfer, Hogan & Buddemeier, 1990), Majuro atoll, Marshall Islands (Griggs & Peterson; 1989, 1993) and a ‘generic’ atoll(Underwood, Peterson & Voss, 1992).
Griggs & Peterson (1989, 1993) modeled the freshwater lens on Laura, an island of the Majuro atoll in the Marshall Islands, Pacific Ocean, using the SUTRA model. Theyshowed that the effects of pumping at 20% of mean annual recharge was minor while pumping at 40% and 60% of mean annual recharge caused, respectively, major upconing anddestruction of the lens.
Recently the SUTRA model has been applied to freshwater lenses at Home Island, Cocos (Keeling) Islands (unpublished as yet) and Bonriki, Tarawa (Alam & Falkland, 1997).In both cases, the model was calibrated against observed salinity profiles and permeability and specific yield data obtained during drilling investigations. Dispersivity values were assumed from published data, as with other atoll studies (Underwood, Peterson & Voss, 1992).
The SUTRA model can be run in either a tidal or non-tidal mode. For realistic results, the tidal model is required to adequately account for the short term fluctuations which causes mixing within the transition zone (Underwood, Peterson & Voss, 1992).

Second International Colloquium onHydrology and Water Management in the Humid Tropics
269
Figure 9. Conceptual flow model of an atoll island allowing for atransition zone between freshwater and seawater (afterPeterson, 1991).
The SUTRA model has also been used to analyze freshwater lenses on volcanic islands (e.g. Oahu in the Hawaiian Islands: Voss & Souza, 1987). Generalized groundwater flow models are, however, not practical for volcanic, bedrock and mixed geology because of the often unique characteristics of such islands. Some transfer of information may be possible on the groundwater flow processes for islands of similar origin (e.g. within a geologically similar archipelago). In general, each island needs to be considered on a site-specific basis.
3-D dispersion type models are available and have been applied to some small islands (e.g. Nauru: Ghassemi, Jakeman & Jacobson, 1993; Jacobson, Hill & Ghassemi, 1997); Cocos (Keeling) Islands: Ghassemi et al., 1999). They require large computers, large data requirements and significant resources in terms of time and expertise to run them. 2-D models are easier to use and are often applicable as freshwater lenses on small islands are oftenelongated.
Other approaches to modeling transition zone behavior have been made. Volker, Mariño & Rolston (1984), for instance, used an analytical model that treated the transition zone as a mixing layer similar to a laminar boundary layer between fluids moving at different velocities. The model was tested with the freshwater lens on Tarawa, Kiribati. Analytical solutions at two cross sections indicated that the method could reasonably describe thetransition zone behavior and the effects of different pumping strategies.
In general, groundwater flow models have developed to a point where they are suitable for many applications on small islands. While some field data has been obtained during water resources investigations, there is a need for further research data to be obtained in island situations on some of the primary hydrogeological parameters, particularly dispersivity.
With improved data, it may well be possible to use simpler rather than more complex models for many of the water resources issues. Work is continuing on data collected from a number of atolls to ascertain the effectiveness of simpler approaches.
Isotopes and tracers

Second International Colloquium onHydrology and Water Management in the Humid Tropics
270
Environmental isotopes can be effective means of determining origins of water. Stableenvironmental water isotopes (deuterium and oxygen-18) have been used to assessgroundwater origins (recharge source areas) and processes. Examples are provided in some of the case studies in Vacher & Quinn (1997) and in White et al. (1999a).
Tracers also can be useful for understanding flow paths, particularly in groundwater systems. For instance, bromide and chloride ions can be a useful means of estimating recharge and nitrate and sodium are useful for assessing pollution from sanitation systems. Bromide ion was used for a recent UNESCO sponsored groundwater pollution study on the island of Lifuka in the Kingdom of Tonga (Crennan, Fatai & Fakatava, 1998).
Further information on the use isotope and tracer methods can be found, for instance, in UNESCO (1991).
6 GROUNDWATER RESOURCES ASSESSMENT
There is a basic need on all islands to adequately assess the available water resources on small islands. The level of assessment is largely dependent on the degree to which water resources need to be developed.
As ground water is a very important resource on many small islands and indeed often the only naturally occurring freshwater resource, it is considered appropriate to provide a special section dealing with groundwater resources assessment.
Some aspects of surface water assessment are described in the earlier section on water balance and hydrological processes.
6.1 Freshwater lenses
On small islands the most common form of ground water occurs in the form of‘freshwater lenses’ (refer to Figures 1 and 5).
There are a number of techniques that can be used to assess the location and size of freshwater lenses. Some are relatively cheap methods and can be used for preliminaryreconnaissance while other more expensive methods are suited to detailed investigations for ongoing monitoring. Further information and references are provided in Dale et al. (1986), UNESCO (1991), SOPAC/UNEP (1996) and IETC (1998).
Preliminary assessment
The salinity of the upper surface of a freshwater lens can be obtained by measurements at exposed water surfaces such as existing wells and pumping galleries or additional dug or drilledholes. This, however, does not provide information on the thickness of the lens. The lower surface of the freshwater zone can only be accurately determined by establishing a recognizable salinity limit for freshwater and drilling through the lens to find where the limit occurs.
Discussion with local agencies and residents can provide valuable qualitative data on the location of freshwater. The pattern of human settlement is often a guide to freshwater location especially where domestic wells are used. Salinity measurements with a portable salinity (electrical conductivity) meter at wells and other exposed water surfaces can provide an initial quantitative assessment of freshwater locations, although this does not indicate thickness of freshwater.

Second International Colloquium onHydrology and Water Management in the Humid Tropics
271
In the absence of other data, the depth of water from water table to transition zone mid-point can be roughly estimated by empirical formulae. These empirical approaches do not give the thickness of the freshwater zone that might be much less than the depth thus estimated.
The first empirical formula is the Ghyben-Herzberg relationship (approx 1:40 based on the density differences between fresh and sea water) that requires the mean height of the water table above sea level to be known (by survey and water level observations). Multiplication of this mean height by about 40 gives the approximate mid-point of the transition zone.
The second is a relationship between easily obtained data such as island width and rainfall. Oberdorfer & Buddemeier (1988) developed a relationship between lens thickness to the mid-point of the transition zone (H), annual rainfall (P) and island width (W), as follows (all units in metres):
H/P = 6.94 log W - 14.38 (4)
This relationship is based on a linear regression fit (r2=0.52) to data from nine coral islands (atolls and limestone islands) and indicates that no permanent freshwater lens can occur regardless of rainfall where the island width is less than about 120 m. Other factors not accounted for in the above relationship have an effect on the occurrence of freshwater lenses (e.g. permeability of the coral sediments and the density of vegetation). Empiricalrelationships do not necessarily provide accurate results and caution is required in using them.
Salinity monitoring work in the Cocos (Keeling) Islands (Falkland, 1994a) has shown that a freshwater lens with a thickness of 11 m to the mid-point of the transition zone (and 7 mto the base of the freshwater zone) occurs in a location where the island is only 270 m wide.This indicates that the empirical relationship (4) does not always give an accurate guide to lens thickness.
A recently conducted review (unpublished) of data from a number of atoll islands has provided a different equation to the one above:
H/P = 27.7 log W - 66.5 (5)
In an attempt to standardize and improve the data quality, equation (5) was based entirely on measurements of average freshwater thickness from salinity monitoring boreholes, rather than from a mixture of methods including geophysics, water table elevation and drilling as in (4). The linear regression fit for (5) marginally improved (r2=0.58) but still indicates that other factors account for freshwater lens thickness. Using equation (5), the minimum width is 250 m to support a permanent freshwater lens.
As a comparison between equation (4) and (5), the example of Bonriki, Tarawa was used (P = 2m, W = 800 m). The estimated thickness to the mid-point of the transition zone using both equations is 11.5 m and 27.8 m, respectively, compared with observed meanthickness of about 23.5 m.
Apart from the fact that the linear regression fits are not particularly good, this type of formula provides information only about maximum thickness of water to the transition zone mid-point. Other information is required to enable the base of the freshwater lens to be determined.It is further noted that the observed thickness to the base of the freshwater zone is actually

Second International Colloquium onHydrology and Water Management in the Humid Tropics
272
about 15-20 m at Bonriki, thus neither method described above provides a good indication of this thickness.
Detailed studies
The thickness of freshwater and transition zones can be accurately determined by drillingthrough the lens and establishing vertical salinity profiles from tests at different depths.Geophysical soundings (electrical resistivity, ER, and electromagnetics, EM) can also provide reasonably accurate data about the base of the freshwater lens. ER and EM survey results are subject to differing interpretations and require independent calibration (e.g. by vertical salinity profiles obtained from appropriately constructed boreholes) to be confidently used. In general, EM surveys are more rapid than ER surveys but give less information. The choice of method is dependent on availability of time and funds and the degree of accuracy required. Combined with a drilling program, geophysical techniques offer a particularly suitable means of assessing freshwater lenses. Many examples of geophysical surveys in coral islands are provided inFalkland (1993).
A drilling and testing programme can provide control for geophysical soundings,provide information about permeability, porosity and depth to major hydrogeological features such as solution channels and unconformities, and enable permanent monitoring systems to be installed. Drilling of monitoring holes up to 30m below ground surface has been successfully undertaken with rotary rigs and drilling muds on a number of small coral and limestone islands including Tarawa and Kiritimati in the Republic of Kiribati (Falkland & Woodroffe, 1997); the Cocos (Keeling) Islands (Woodroffe & Falkland, 1997); the Cook Islands (Turner &Falkland, 1996) and Tonga (Turner, 1997). An alternative to drilling holes on such islands is the driving of suitable pipes. Steel pipes have been successfully driven to 15 m below ground surface on coral atolls (e.g. Kwajalein: Hunt & Peterson, 1980; Majuro: Hamlin & Anthony, 1987).
Deeper monitoring boreholes to depths of 200 m have been drilled on Christmas Island (Indian Ocean using a percussion rig and drilling foam to investigate groundwater resources near the margin of the island (Falkland & Usback, 1999).
Salinity monitoring systems enable long-term data to be collected about the behavior of freshwater lenses and for the calibration of groundwater flow models. Suitable salinitymonitoring systems for small islands are either multiple holes terminated at different depths with the base of each hole left open or single boreholes with multiple tubes or pipes terminated at a number of pre-determined depths, between which bentonite (sealing) layers are inserted. The former type of system has been used on Kwajalein (Hunt & Peterson, 1980), Majuro (Hamlin & Anthony, 1987) and recently in Tonga. Samples can be obtained by bailing or pumping from the base of each hole or a salinity probe can be lowered to the base of each hole to obtain measurements. An example of the multiple tube method, designed for use with a small portable electric pump (to obtain samples) is shown in Figure 10. This type of system or very similar systems have been installed on Tarawa and Kiritimati in the Republic of Kiribati, the Cocos (Keeling) Islands, Lifuka in Tonga and Aitutaki in the Cook islands (Figure10). The shallow PVC pipe within the borehole enables water level measurements to be made and surface samples collected.
Very useful monitoring data from some of these systems has been collected since the early 1980’s. Vertical salinity profiles (salinity versus depth) can be plotted from the data and

Second International Colloquium onHydrology and Water Management in the Humid Tropics
273
fluctuations in the base of the freshwater lens and transition zone mid-point can be observed over time. Normally, the boreholes should be sampled and data analysed on a 3 monthly basis.
On small islands, open holes or continuously perforated casings in holes are not suitable for accurate determination of salinity profiles since tidally forced mixing of freshwater andseawater can easily occur in the hole. This problem is known in mainland aquifers (Rushton, 1980; Kohout, 1980) and has been demonstrated in coral atolls (e.g. Enewetak; Buddemeier & Holladay, 1977). Also, contamination of the freshwater zone by underlying saline water can be induced if this approach is used. Open wells will underestimate the freshwater zonethickness and overestimate the transition zone thickness.
Measurements of water table movements can be useful for determining height above mean sea level and the effects of tides, pumping and climate variation. This data is useful for setting levels for, and analyzing impacts of, abstraction facilities. It cannot be used, however, to determine the thickness of the freshwater lens using the Ghyben-Herzberg ratio (approx. 40:1) because the sharp interface assumption is not correct. Rather, this approach would predict the mid-depth of the transition zone. Measurements on some atolls indicate that large errors can result if mean water table height above mean sea level is used to estimate freshwater zone thicknesses. Water level measurements can also be used to determine tidal efficiencies and la gswithin the freshwater lenses, which provide an indication of the relative ‘hydraulic connection’ with the sea.
6.2 Other groundwater sources
On volcanic islands, perched water aquifers may occur. These may be formed abovehorizontal confining beds or in, special cases, confined in vertical compartments behind volcanic dykes (e.g. in the Hawaiian Islands: Takasaki & Mink, 1985).
The methods of groundwater evaluation on volcanic islands are not dissimilar to those used on larger islands or even continents. Conventional drilling techniques and pump testing have been carried out on many small islands to assess groundwater potential. Geophysical methods are also used. Spring sources are often used to locate perched and dyke-confinedaquifers (Peterson, 1984). A study of the small volcanic island of Pohnpei, Federated States of Micronesia outlines many of the available techniques (Spengler, Peterson & Mink, 1992).Further information and references are provided in Mink (1986) and UNESCO (1991).
High and low level springs also occur on limestone-capped islands, flowing at the interface between the limestones and underlying basalt. Submarine springs have been observed discharging on the margins of many small islands, indicating large freshwater outflows at specific locations.
On some small islands, where subterranean streams occur dye tracing studies have been useful at tracing flows through island cave systems (e.g. Christmas island, Indian Ocean).
7 WATER RESOURCES DEVELOPMENT
Apart from the naturally occurring water resources on small island (surface water and ground water), possible alternative sources of freshwater on small islands are rainwatercollected from artificial or natural surfaces, desalination of seawater or brackish groundwater, importation, treated wastewater, and substitution. Other than from rainwater collection, these

Second International Colloquium onHydrology and Water Management in the Humid Tropics
274
alternative water sources are often referred to as ‘non-conventional’. Rainwater, surface water and ground water are considered to be ‘conventional’ water sources.
Figure 10. Example of permanent monitoring system for measuring water salinity
This section considers briefly some of the development approaches to water resources on small islands. More detailed information is available in UNESCO (1991), SOPAC/UNEP (1996) and IETC (1998).
7.1 Surface water resources
Development of surface water resources on small islands are generally stream intake structures, dams and other storages, or spring cappings.
Stream intake structures consist of either in-stream weirs or buried collector pipe systems laid in or near the streambed. In-stream weirs are used in some of the high islands in the Indian Ocean (e.g. Seychelles), the Pacific Ocean (e.g. Tonga) and in most of the high islands in the Caribbean. Buried collector pipes in streams have also been used on some islands (e.g. the Cook islands: Waterhouse & Petty, 1986).
Water retaining structures can be constructed as dams within the stream or as off-channel storages. Neither is very common on small islands due to unsuitable topography or geology and high costs.
Second International Colloquium onHydrology and Water Management in the Humid Tropics
275
Spring cappings, common in many small high islands, typically consist of an open or covered containment structure, generally constructed from concrete or masonry. Spring flows are contained by the structure and diverted to an intake pipe.
Examples of the application of these methods are provided in UNESCO (1991), SOPAC/UNEP (1996) and IETC (1998).
7.2 Groundwater resources
Groundwater abstraction methods on small islands are generally of the following types: dugwells, boreholes (or drilled wells), infiltration galleries and tunnels.
Dug wells
Dug wells are common on many small islands, particularly on low islands. Freshwater is generally available in small quantities. Dug wells also provide a source of freshwater in the coastal areas of high islands. Shallow dug holes on beaches are sometimes used as a source of freshwater during low tide. Deep wells have been excavated on some islands (e.g. on the volcanic islands of Upolu and Savai'i in Samoa and on high limestone islands in Tonga).
Boreholes (drilled wells)
Boreholes are a common means of developing groundwater resources on islands. These are particularly useful in high islands where depths to water table are excessive or rocks are too hard for surface excavation. Increases in salinity due to over pumping from boreholes have been experienced on a number of islands, especially where freshwater lenses are thin. Single boreholes and arrays of boreholes have been used to extract water from relatively thin freshwater lenses on the island of New Providence in the Bahamas but these are graduallybeing replaced by horizontal collection systems because the latter have less risk of inducing local seawater upconing (Swann & Peach, 1992). Where freshwater lenses are relatively thick, borehole abstraction systems have been used successfully.
On high islands, boreholes have been used to develop high-level or perched aquifers.For instance in Tahiti, French Polynesia and in the Hawaiian Islands, vertical and horizontalboreholes have been used to obtain water from dyke-confined aquifers contained behind impermeable volcanic rock formations called dykes.
On some limestone islands, freshwater found in natural sinkholes or cave systems have been used for water supply by pumping to the surface. These natural features provide a more convenient means of gaining access to the ground water than boreholes. Examples include Christmas Island, Indian Ocean and the islands of Grand Bahamas and Eleuthera in theBahamas.
Infiltration galleries
In freshwater lenses on small low islands, large-scale extraction systems have been successfully implemented using infiltration galleries or ‘skimming wells’ (Figures 1 and 11). These avoid the problems of excessive drawdown and consequent upconing of saline water caused by localized

Second International Colloquium onHydrology and Water Management in the Humid Tropics
276
pumping from individual boreholes. Infiltration galleries skim water off the surface of the lens, thus distributing the pumping over a wide area.
Infiltration galleries generally consist of horizontal conduit systems which are permeable to water (e.g. PVC slotted pipes), laid in trenches dug at or close to mean sea level thus allowing water to be drawn towards a central pump pit. Buried conduit systems have been installed and are successfully operating on a number of atolls including Kwajalein in the Marshall Islands (Hunt & Peterson, 1980), Tarawa, Republic of Kiribati (Falkland &Woodroffe, 1997) and the Cocos (Keeling) Islands (Woodroffe & Falkland, 1997). Open trenches are not recommended as these are subject to surface pollution and can enhance evaporation. On the island of Bonriki, Tarawa, a yield of about 1,000 m3/day is obtained from 17 galleries, each 300 m long. On Home Island in the Cocos (Keeling) Islands, seven galleries have been laid between existing houses as these were built over the only freshwater lens on the island (Figure 11). These galleries, each about 300 m long, produce a total yield of about 150 m3/day. Due to their skimming nature, the salinity of abstracted ground water has been lowered (Home Island) or maintained at pre-pumping conditions (Tarawa).
Figure 12 demonstrates the reduction of salinity in the water pumped from thefreshwater lens on Home Island in recent years. In early 1983, water was pumped from three pump wells fitted with very short lateral pipes. In early 1984 and 1987, fourth and fifth pump wells of similar construction were commissioned. During this period and shortly after it, the highest chloride readings were obtained. Between March and October 1991, five 300 m long galleries were constructed at the sites of the former pump wells. A sixth gallery wascommissioned in mid 1992 and a seventh gallery in May 1997. Based on the chloride readings obtained during dry periods between 1985 and 1988, it would be expected that the driest period on record (1991) would have resulted in higher chloride readings than were obtained.The fact that they were significantly lower at the end of 1991 than in the period 1985-1988 is evidence that the new galleries are an effective means of extracting ground water from a freshwater lens, particularly a fragile one such as that on Home Island. Guidelines for the design, siting and construction of the type of infiltration galleries in the Cocos (Keeling) Islands are provided in Falkland (1995).In the Bahamas, infiltration trenches have been connected to inclined pipes allowing freshwater to flow under gravity to a deep sump towards the edge of the lens (UNDTCD, 1988). A single pump is used to deliver the water to supply centres. This method avoids the need for multiple pumping systems, typically one per gallery or trench. Weirs at each trench must be carefully set to avoid excessive draining of freshwater from the upper surface of the lens, which could cause upconing of seawater The most technically difficult and least common method of groundwater development on islands is by tunneling. Tunnels have been used in the past to develop both high-level and basal groundwater bodies on high islands. In the Hawaiian Islands, tunnels or ‘Maui-type wells’ have been constructed to develop basal groundwater bodies in coastal areas. These tunnels were constructed by sinking a vertical or inclined shaft from ground level to a pump room just below the water table. A series of horizontal collection tunnels radiating from the pump room, allow water from a relatively large area to be abstracted. The yields from Maui-type wells are generally very good (e.g. 200,000 m3/day from a 500 m gallery in southern Oahu and175,000 m3/day from a 200 m gallery on Maui: Peterson, 1984). Due to cheaper alternatives (boreholes), no new major Maui-type wells have been constructed since the early 1950's.
.

Second International Colloquium onHydrology and Water Management in the Humid Tropics
277
Figure 11. Upper diagram (after Falkland & Brunel, 1993) shows cross sectionthrough an infiltration gallery constructed from horizontal slotted PVC pipes and vertical cylindrical concrete pump well and access manholes.This design was used for seven galleries on Home Island, Cocos(Keeling) Islands. The galleries were located within the boundaries of the freshwater lens as shown in the lower diagram (modified fromWoodroffe & Falkland, 1997).

Second International Colloquium onHydrology and Water Management in the Humid Tropics
278
Figure 12. Reduction of salinity (chloride ion) in water reticulated to Home Island
Tunnels
To increase well yields in the past, tunnels have been constructed at the base of large diameter wells or shafts at sea level. On the island of Barbados, Caribbean Sea, 60m long tunnels have been excavated from the base of vertical shafts at a depth of about 40 m. A yield of about 95,000 m3/day from 14 such wells is reported (Goodwin, 1984).
Rainwater collection
Guidelines for the design, construction and operation of rainwater catchment systems and further useful references are provided in UNESCO (1991) and Gould (1991). A useful approach to designing rainwater catchment and storage systems is provided by Heitz & Winter (1996). Computer programs are available for simulating the operation of rainwater systems for given daily rainfall patterns, roof sizes, storage volumes and water usage rates. Some take into account rationing scenarios once the storage falls to defined levels.
7.3 Desalination
While desalination plants are used on some islands for specific requirements (e.g. at tourist resorts and military installations and as a temporary measure after natural disasters or during droughts), there are only a few small islands where desalination is used as the main source of water. Examples of those that primarily use desalination are Malé in the Maldives and some islands in the Caribbean Sea. Approximately 60% of the water requirements on the island of Nauru are produced from desalination (Jacobson, Hill & Ghassemi, 1997).
Desalination systems are based on a distillation or a membrane process. Distillation processes include multi-stage flash (MSF), multiple effect (ME) and vapor compression (VC) while the membrane processes include reverse osmosis (RO) and electrodialysis (ED).Descriptions of these processes are provided together with approximate costs and a
Salinity Variations, Home Island Galleries (average), 1983-1998
0
100
200
300
400
500
600
Jan-83 Jan-85 Jan-87 Jan-89 Jan-91 Jan-93 Jan-95 Jan-97 Jan-99
Month & Year
Chl
orid
e io
n (m
g/L)

Second International Colloquium onHydrology and Water Management in the Humid Tropics
279
comprehensive reference list in IETC (1998). Further information is provided in UNESCO (1991) and SOPAC (1998).
All types have been used on islands with varying success. MSF plants operate on the island of Aruba, Netherlands Antilles in the Caribbean Sea and in the U.S. Virgin Islands there are a number of ME plants. VC plants operate in the Cayman Islands. A number of seawater RO plants operate in the U.S. Virgin Islands, Bermuda, on some tourists islands in Fiji and off the coast of Australia and on Malé in the Maldives. RO units have been installed foremergency use in the Marshall Islands in 1998 and are currently being considered for some islands in Kiribati. Further examples of use are provided in UNESCO (1991) and IETC (1998).
On some islands, however, this technology has not been successful (e.g. Diego Garcia, Funafuti in Tuvalu and Nomuka in Tonga) and desalination plants have been removed or lie idle. Common problems have been insufficient filtering of feed water, intermittent powersupplies and insufficiently trained operators.
Desalination is a relatively expensive and complex method of obtaining freshwater for small islands (UNESCO, 1991). The cost of producing desalinated water is almost invariably higher than ‘conventional’ options (e.g. pumping of ground water) due to the high-energy costs and other operating costs. In extreme cases where other water resources are exhausted it may be a necessary source of freshwater (e.g. Malé in the Maldives).
In general, desalination should only be considered when more conventional water sources are non-existent, fully utilised or more expensive to develop. Trained operators and a reliable source of supply for chemicals and replacement parts are essential for reliableoperation.
Solar stills offer a ‘low technology’ solution in certain cases. They have been used, generally on a temporary or research basis, for the production of small quantities of fresh water from sea water. With typical daily solar radiation values in the humid tropics, freshwater yields of about 3L/ m2/day can be produced. While solar stills have some major advantages such as using readily available energy and the high quality of the water produced, there are some significant problems for large-scale production of fresh water by this method. They can,however, be used for emergency purposes. Further information and references are provided in UNESCO (1991) and IETC (1998).
7.5 Importation
Water importation is used on a number of islands as an emergency measure during severe drought situations and in others as a supplementary source on a regular basis. Water can be imported by submarine pipeline, for islands close to large landmasses, or by sea transport (tankers or barges).
Water is imported by pipeline from adjacent mainlands to Hong Kong, Singapore and Penang, Malaysia. Approximately 30% of the water for New Providence in the Bahamas is imported by barge from a nearby and larger island, Andros (Whitaker & Smart, 1997). Theisland of Nauru in the Pacific Ocean received most of its water as return cargo in ships used for exporting phosphate until it installed a desalination plant. Some of the small islands of Fiji and Tonga receive water from nearby islands by barge or boat, especially during drought periods.
7.6 Other methods

Second International Colloquium onHydrology and Water Management in the Humid Tropics
280
Wastewater reuse
Wastewater reuse for potable water is rare on small islands. One exception is Singapore, where treated stormwater is used to supplement drinking water supplies.
Substitution
During severe drought conditions or after natural disasters, substitutes for fresh drinking water have been used. The most notable is the water from coconuts. People on some of the smaller outer islands in Fiji, Kiribati and the Marshall Islands, for instance, have survived on coconuts during drought periods. The coconut tree is very salt tolerant and can continue to produce coconuts once ground water has turned brackish.
Non-potable water systems
Non-potable water sources include seawater, brackish ground water and wastewater. There are many examples of the use of these waters in order to conserve valuable freshwater reserves on islands. For example, seawater is used for both toilet flushing and fire-fighting on a number of islands (e.g. St. Thomas and St. Croix in the U.S. Virgin Islands, Tarawa in Kiribati and Majuro in the Marshall Islands). Seawater or brackish well water is often used for bathing and some washing purposes on small islands. Seawater is also used on some islands for cooling of electric power generation plants, for ice making, in air conditioning plants, and in swimming pools.
Potable water enhancement techniques
There are a number of methods that are aimed at, or happen to cause, an increase in the available freshwater storage in the ground. These methods include artificial recharge, seawaterintrusion barriers, groundwater dams and weather modification. Most are either experimental, expensive or have not been used in humid tropical islands. Further information is provided in UNESCO (1991).
8 WATER RESOURCES PLANNING AND MANAGEMENT
Water resources policy, planning and management issues on small islands, including those in tropical regions, are considered in detail in UNESCO (1991). Selected aspects are considered below.
8.1 Policy and legislation
As water resources on small islands are often under great stress, there is an increasing need for the governments of island nations and, where applicable, donor agencies, to recognize the importance of the water sector to the long term sustainability of small island nations. While much has been done to address problems in this area on certain islands, much remains to be done.

Second International Colloquium onHydrology and Water Management in the Humid Tropics
281
Appropriate policy and supporting legislation are essential for effective water resource management and protection. In particular, such measures should cover controls on water abstraction and measures for the protection of areas reserved for water resources conservation. Guidelines and case studies are provided in UNESCO (1991).
On some small islands there is a need to streamline the many separate agenciesinvolved in the water and sanitation sector to improve co-ordination and minimize duplication of effort, especially where human resources are so scarce. This can be done effectively byensuring that there are clear definitions of roles and responsibilities. In some cases it is necessary to re-structure agencies to manage the water sector issues more effectively. In islands with public water supply systems, clear distinctions between supplier(s) and regulator(s) are most important, especially in view of recent moves to privatize water supply agencies in some countries. Water supply regulations need to take into account community interests at the village level as well as traditional landowners. Community input into the development andimplementation of regulations to protect and conserve limited water resources is a crucial step.
8.2 Water resources assessment and monitoring
There is a basic need on all islands to assess available water resources adequately and to monitor their performance under natural stresses (e.g. droughts) and additional stresses induced by human activities (e.g. surface water diversions and groundwater pumping). On high islands, it is important to assess both surface and groundwater resources. Knowledge of the relative quantities of both types of water resource based on adequate investigations and monitoring, is essential for planning purposes.
Groundwater investigations are most important in order to assess the quantity and quality for planning purposes, especially on low islands, where ground water and rainwater are often the only potential natural sources. On certain small islands, groundwater resources may be so limited that it is necessary to resort to rainwater collection as the primary source of freshwater. In these latter cases, it is essential that rainwater systems be adequately designed to cater for droughts.
A sustained effort is required to obtain good quality data. Regular monitoringprogrammes by well-trained staff are the ideal approach. National water agencies should be encouraged to maintain and, in many cases, expand water resources monitoring networks.Assistance from external aid donors may be necessary where local funding is inadequate to cover this important aspect.
Further details on water resources monitoring and assessment techniques for small islands can be found in UNESCO (1991), Falkland & Brunel (1993), Vacher & Quinn (1997), IETC (1998). Examples of techniques used for specific research studies are provided in White (1996) and White et al. (1999a).
The use of electronic data logging equipment should be encouraged for data collection programmes. In addition, the acquisition of data from remote sites via telemetry can provide significant advantages.
Data processing, archiving, analysis and reporting of hydrological (rainfall, climatic, streamflow, water quality and groundwater) data are an integral part of water resourcesassessment. A number of appropriate hydrological data processing software packages have been developed and are regularly updated for these purposes. Regular analysis and reporting

Second International Colloquium onHydrology and Water Management in the Humid Tropics
282
on the results of water resources monitoring programmes is an essential part of the water monitoring and management process.
8.3 Impact of climate change and sea level rise
Ten years ago, global mean sea level was expected to rise between 0.5 and 1.5 m within the coming century, as a result of global warming (Oberdorfer & Buddemeier, 1988). A more recent review of sea level rise by Houghton et al. (1996) indicates that sea level is expected to rise by about 0.5 m by the year 2100, with a range of uncertainty of about 0.2-0.9 m. Rising sea level and changes in the precipitation may have major impacts on the freshwater lenses of small low lying islands such as the atolls of Kiribati. Rising sea level can lead to a reduction of island width with a consequent reduction in freshwater lens extent and thickness.
Based on observed data, current global sea level shows an increasing trend of18 mm/decade or 0.18 m per century. The trend varies according to location with most tiderecorders showing an increasing level while some show a decrease. Data collected over the last 20 years at the Betio tide recorder on Tarawa by the University of Hawaii shows anincreasing trend of 45 mm per decade or 0.45 m per century. If the trend for Tarawa were to continue, the sea level rise there in the next century would be very close to the predictions in Houghton et al. (1996).
The impact of a small rise in sea level (up to about 0.5 m) on freshwater resources is likely to be relatively minor, compared with other influences (e.g. current natural variability with ENSO cycles, storms, human impacts). On small coral atolls, the freshwater inventory can actually increase with such a rise, owing to the lens being raised further into lower permeabilityHolocene sediments. This was found in two studies of atolls (a generic atoll study byOberdorfer & Buddemeier, 1988 and a study of the Bonriki freshwater lens on Tarawa atoll by Alam & Falkland, 1997). If moderate sea level rises were to occur and loss of land was experienced, freshwater resources would inevitably diminish as the area of land decreased. It is important that present sea level monitoring programmes for small islands be continued to enable further data to be collected and analysed. This should be combined with data monitoring and analysis of climate and groundwater systems in order to assess relative impacts of changes in recharge, pumping and sea level changes.
It is imperative that present sea-level monitoring programmes for small islands be continued to enable further data to be collected and analysed. This should be combined with data monitoring and analysis of climate and groundwater systems in order to assess relative impacts of changes in recharge, pumping and sea level changes.
8.4 Planning and design
A crucial step in the planning of water resource developments on islands is the assessment of water resource potential and use. Initially, ‘conventional’ resources (ground water andrainwater, and if present, surface water) need to be adequately assessed and sustainable yields estimated. ‘Non-conventional’ options, including desalination, importation and wastewater reuse, may be required if conventional sources are very limited, polluted or over-utilised or where the island economy can afford them. An example of the latter is the use of desalination units for water supply on islands that have a significant tourist industry to support the additional costs of this technology (e.g. Mana Island in Fiji and a number of Caribbean islands).

Second International Colloquium onHydrology and Water Management in the Humid Tropics
283
The conjunctive use of different classes of water is a very useful option wherefreshwater resources are very limited, and should be given high priority. Even the smallest of islands usually have access to rainwater catchments and shallow groundwater sources, either fresh or brackish. Rainwater may be a suitable option for the most basic of needs, such as drinking and cooking, leaving higher salinity ground water for other uses such as bathing and washing. Where existing or potential water supplies are scarce, the use of dual quality supplies should be seriously considered. This is currently undertaken, as mentioned earlier, on some coral islands by using seawater for flushing water in toilets. In some islands, available water resources are classified into three levels, used for different purposes: rainwater; ground water from private wells; and water provided by public piped water supply systems. It is important to make use of all available water sources, as long as they are safe (i.e. non-polluted) and economic.
Governments need to indicate appropriate water quality criteria for drinking (potable) water supplies. Guidelines (e.g. WHO, 1993) may need to be adapted to local conditions.For instance, island water agencies need to consider salinity and hardness criteria that are appropriate to local circumstances. People living on Islands are often accustomed to higher levels of water salinity than specified in most guidelines. Provided there are no adverse health effects, adapting guidelines to suit local conditions is often appropriate.
For water resource project planning and design, simple designs, proven in similarconditions should be used. Technical criteria from other regions can be used as guides but should be adapted to local conditions. Locally available materials should be used where possible to minimize import costs. Where possible, materials and equipment should be simple and standardized to minimize ongoing operation, maintenance and training requirements.Corrosion resistant materials should be used due to proximity to the ocean environment.Renewable energy sources (e.g. solar pumps) should be considered so as to reduce operating costs.
8.5 Land use planning and catchment management
Effective land use planning and management are most important for the protection of water resources from contamination. This is particularly important on coral islands with highlypermeable soils and shallow water tables where ground water is very susceptible to pollution.Water reserves or groundwater protection zones should be established and land use regulated wherever possible. On atolls, it may be possible to reserve whole islands for water supply purposes. Alternatively, it may be possible to locate urban development on island edges,allowing the centre to be used for water resources development without the threat of pollution.A relevant case study of the issues and some recommended solutions regarding conflicts over land use for water reserves are contained in White et al. (1999b).
In areas already settled and where the ground water is either already contaminated or under threat of becoming so, other measures such as the use of appropriate, non-pollutingsanitation systems should be considered. This is particularly relevant to urban areas on small coral islands, such as the island of Lifuka in the Kingdom of Tonga where dry compostingtoilets have been given trials and partially introduced in recent years.
Where possible, groundwater supply extraction facilities should be located towards the centre of an island while sanitation and solid waste disposal facilities should be planned near the edge. Where this is not possible, large open spaces (e.g. playing fields) provide reasonable

Second International Colloquium onHydrology and Water Management in the Humid Tropics
284
areas for the development of ground water. A project is currently being implemented on the island of Lifuka in Tonga to install infiltration galleries on sports fields within the urban area (the only area which has a freshwater lens under it). The galleries are sited as far from humanhabitations and pollution sources as possible in order to minimize the threat of biologicalcontamination.
To maximize groundwater availability, it may be prudent to selectively clear vegetation, particularly coconut trees, in designated areas, to reduce transpiration. Coconut trees on low coral islands act as phreatophytes (i.e. draw water directly from the water table) and may cause a reduction in available groundwater resources, especially during relatively dry periods.However, this suggestion should be treated very cautiously, as coconut trees are often a source of food and drink, shade and materials for building and other purposes. On some islands, areas that have been already cleared for other land uses, such as airfields, offer good opportunities for groundwater development, especially on low lying coral islands (e.g. Tarawa in Kiribati, Aitutaki in the Cook Islands, Kwajalein in the Marshall islands and West Island in the Cocos (Keeling) Islands).
Small streams and springs on high islands are susceptible to surface pollution, and controls need to be placed on land use activities in contributing catchments. Major potential sources of pollution such as fuel storages, rubbish disposal areas, agricultural activitiesparticularly involving the use of agricultural chemicals need to be positioned well away from water sources. Often the catchments are not well defined since the directions of groundwater flow may not be obvious, particularly where karstic limestone formations occur. In suchlocations, additional precautions are often necessary, including proper bunding around fuel and other storage tanks, impermeable membranes and effective leachate control and disposalsystems at landfill sites and pollution monitoring boreholes. The same precautions should be applied to groundwater resources under or near such pollution sources.
Restrictions on areas for keeping animals such as pigs and poultry should be enforced to reduce pollution, particularly on the very susceptible small coral islands with very thin soils and shallow ground water.
On larger high islands, catchment management should include controls on erosion and sedimentation and, where possible, allowance for environmental flows. Creation of water reserves upstream of surface water storages where certain activities are restricted will assist in maintaining both water quality and sedimentation of reservoirs.
Pollution control for sanitation systems
As discussed above, adequate spacing must be maintained between sanitation and ground-water extraction facilities. To minimize pollution from sanitation systems, special measures may be required. The direction of groundwater flow is also very important. Safe distances are not easy to assess and were the subject of a research project, sponsored by UNESCO withassistance from SOPAC on the island of Lifuka, Tonga (Crennan, Fatai & Fakatava, 1998).In the Lifuka study, the minimum horizontal movement of a bromide tracer was found to be at least 5m in 2weeks. Because of the density of sanitation facilities and wells in the study site it was concluded that no safe distance could be specified. The study further concluded that alternative strategies such as source control of pollutants (e.g. use of non-polluting composting toilets) and water treatment are required to reduce the negative impacts of pollution (Crennan, Fatai & Fakatava, 1998).

Second International Colloquium onHydrology and Water Management in the Humid Tropics
285
A literature review of the issues of groundwater pollution and recommendedapproaches to investigating pollution problems are provided by Dillon (1997). This studyconcluded that organic dyes are poor tracers of pollution. Nitrate and sodium can be effective for determining groundwater contamination due to sanitation systems. Bromide is an effective tracer to measure travel times.
Composting toilets can act to protect fresh ground water, and have been the subject of trials in recent years on a number of Pacific islands, including Kiritimati in Kiribati (Crennan, 1998) and Lifuka in Tonga (Crennan, 1999). These trials were conducted to assess the physical, biological and cultural acceptability of this relatively simple technology. Theadvantages of appropriately designed composting toilets are: simple construction; protection of ground water (under the village areas); water conservation (as no flushing water is required); and production of a useful agricultural fertilizer.
In heavily populated areas, seawater-flushed sewerage systems with ocean outfalls may be appropriate, as long as due consideration is given to appropriate sewage treatment. These are installed on crowded urban areas of Tarawa and Majuro. A recent review of options for sanitation options for Tarawa supported the continued use and refurbishment of the present sewerage systems which have been operating for nearly 20 years, and proposed theintroduction of composting toilets in the less crowded areas of South Tarawa (ADB, 1996).There are a number of different types of composting toilets available and it is important to select the right design for the context.
Further information and guidelines for selection of appropriate sanitation systems for small islands are provided in Depledge (1997).
Restrictions on location of animals such as pigs and poultry may be appropriate to reduce pollution. Potential sources of harmful chemicals and other substances (e.g. fuel depots, chemical stores) should be sited away from water supply sources.
Demand management and leakage control
This aspect of water resources management is particularly important on small islands where public piped water supply systems are used. Demand management measures includecommunity education to conserve water and reduce wastage, introduction of appropriatepricing policies coupled with metering of consumer connections, pressure reduction and use of water conserving devices.
Many small islands need to place increased emphasis on community educationprogrammes.
Metering of water usage at consumer connections and pricing of water at rates which enable basic usage at low cost while penalizing high water usage, have the advantages of raising revenue for water supply authorities and enabling a water conservation message to be given to water consumers.
Piped water supply systems often have substantial leaks and an active leak detection and repair programme is required as part of ongoing water supply system management. The savings in water can often have positive benefits in delaying the need for development of new sources. It is generally far more cost-effective and it is certainly more environmentallysustainable to place emphasis and provide funding for leakage control of existing piped systems than to fund additional water supply infrastructure development.

Second International Colloquium onHydrology and Water Management in the Humid Tropics
286
9 RESEARCH, TRAINING AND EDUCATION
9.1 Recent Meetings and Publications
In response to the hydrological and water resource management needs of small islands, there have been a number of important international and regional meetings held in recent years. The summary below tends to concentrate on the islands of the Pacific Ocean and South East Asian region, as this is where the author has been primarily involved.
Conferences and meetings leading up to the (First) Colloquium on the Development of Hydrologic and Water management Strategies in the Humid Tropics held in Townsville in 1989 are outlined in Chapter 10 (refer Falkland & Brunel, 1993) of the publication which followed the colloquium (Bonell, Hufschmidt & Gladwell, 1993).
Since 1989, some key workshops and conferences in the Pacific and South East Asian region were:
• Workshop on Small Island Hydrology, Batam Island, Indonesia, sponsored byUNESCO, Research Institute for Water Resources Development and the Indonesian Institute of Sciences and supported by Batam Development Authority. Batam Island, 1993.
• Workshop on Water Sector Planning, Research and Training, organised by UNESCO, SOPAC and UNDDSMS, Honiara, Solomon Islands, 1994.
• Training Workshop on Water Resources Assessment and Development in SmallIslands and the Coastal Zone, Pari Island and Bandung, Indonesia, 1995.
• Workshop on Technologies for maximising and Augmenting Freshwater resources in Small Islands (for South Pacific, Indian Ocean and South China Sea Regions), Suva, Fiji, February 1996.
• Small Islands Water Information Network (SIWIN) Workshop, SOPAC, Suva, Fiji, February1997.
• Small islands Developing States Working Group Meeting on Water, SOPAC, Suva, Fiji, February 1997.
• UNESCO Water Resources Workshop, University of the South Pacific, Suva, Fiji, July 1997.
• Workshop on Local Scale Hydrological Processes in Islands, Highlands and UrbanEnvironments in Malaysia: Need for Future Directions. Kuala Lumpur, Malaysia, November 1997.
• Science, Technology and Resources Sessions at SOPAC Annual Conferences,September 1997 and September 1998, Fiji.
In addition, there have been some useful publications that expand on aspects of island hydrology and water resources management, including the following:
• UNESCO (1991). Hydrology and water resources of small islands, a practical guide.Studies and reports on hydrology No 49, pepared by A. Falkland (ed.) and E. Custodio with contributions from A. Diaz Arenas & L. Simler and case studiessubmitted by others. Paris, France, 435pp.

Second International Colloquium onHydrology and Water Management in the Humid Tropics
287
• UNESCO (1992). Small Tropical Islands, water resources of paradises lost. IHP Humid Tropics Programme Series No. 2. UNESCO, Paris.
• SOPAC/UNEP (1996). Technologies for augmenting freshwater resources in Small Island Developing States. Compiled by U. Morgensen, SOPAC Joint ContributionReport 112, UNEP, Nairobi, Kenya.
• Vacher & Quinn, (1997). Geology and Hydrogeology of Carbonate Islands,Developments in Sedimentology No. 54, Elsevier, Amsterdam, 948 pp.
• IETC (1998). Source book of alternative technologies for freshwater augmentation in small island developing states. International Environmental Technology Centre incollaboration with South Pacific Applied Geoscience Commission and the Water Branch of UNEP, Technical Publication Series No. 8.
9.2 Recent applied research and training projects for Pacific Islands
Two important applied research projects, which were selected by an international meeting of agencies and Pacific island countries (UNESCO/SOPAC/UNDDSMS, 1994), have beenconducted on small islands in the Pacific regions. The projects were a study of groundwater recharge on a small coral atoll island (Bonriki island, Tarawa atoll, Republic of Kiribati) and a groundwater pollution study on a small coral sand and limestone island (Lifuka island, Kingdom of Tonga). UNESCO provided a pivotal role and the initial funding to support the two projects with additional funding and logistical support provided by SOPAC, the CommonwealthScience Council and a number of institutions in Australia. Literature surveys were completed in the early stages of both projects (White, 1996; Dillon, 1997). Progress on the first project is summarised in White et al. (1999a). A final report has been completed for the second project (Crennan, Fatai & Fakatava, 1998).
The focus on ground water is indicative of the importance of ground water as afreshwater resource on many small islands. Both projects included physical and social science components. In the early stages of the two projects, the training effort was not only directed at local counterparts but also appropriate water resources personnel from other selected islands who were brought to the study sites during the initial field work. Community education about the reason for and findings from the projects was also an important component.
Another proposed project is a study of catchments and affected communities on a small ‘high’ island, where land use change due to deforestation and or mining activities has had a significant impact. In 1997 it was ‘re-packaged’ to include a smaller amount of physical science with greater community involvement aspects. This project is designed for a ‘high’ island in Melanesia.
At the 1997 UNESCO Water Resources Workshop, progress was noted on the projects in Kiribati and Tonga. Further work on these projects and commencement of work on other projects was recommended. In order of priority, the projects for which additional funding was recommended were as follows:
• Catchment and communities project (completion of planning phase, commencement of project)
• Groundwater recharge and modeling (completion of stage 1, and commencement of stage 2 involving groundwater modeling and sustainable yield estimation for Bonriki,Tarawa, Kiribati)

Second International Colloquium onHydrology and Water Management in the Humid Tropics
288
• Groundwater pollution due to sanitation systems (completion of project for Lifuka, Tonga)
• Integrated island water resources study• Groundwater and surface pollution due to chemicals• Appropriate groundwater extraction systems• Rainwater catchment study
The groundwater pollution project in Tonga and stage 1 of the recharge project inKiribati have been completed.
9.3 Research needs
Overview
There is a need for a continued research effort to address the major components of the hydrological cycle on small typical islands.
Very few studies have been undertaken to develop procedures applicable to other islands. It is noted that some hydrological studies undertaken on larger landmasses (large islands and continents) are applicable to islands, including small islands. However, there are some areas of research that are essentially only applicable to the small spatial scale of islands and the relatively rapid turnover times of hydrologic systems on such islands.
The list of research needs presented in this section is based on previousrecommendations (e.g. Falkland & Brunel, 1993) and identified continuing gaps in knowledge.
Surface water hydrology
Some examples of further research needs are:
• The impacts of catchment change on water resources quantity and quality, affected communities and downstream and near-shore environments. In particular, water quality studies in surface water systems (streams, lakes, reservoirs) are required to assess the impacts of man’s activities (e.g. from deforestation, mining, agricultural chemicals);
• Interception of dense areas of island vegetation, predominantly coconut trees; tree transpiration of a tropical trees in both shallow and deep water table areas usingsapflow sensors;
• Actual evapotranspiration using scintillometry methods over typical island vegetation and open areas, as this technique, yet to be used for such applications, offersconsiderable potential;
• Infiltration and soil water dynamics using in situ TDR soil moisture probes over the fulldepth range from surface to water table, in a number of island environments (coral sands, volcanic soils in open and shaded areas and in flat and sloping areas);
• Refinement of current water balance models to provide improved estimates, forexample of recharge, using the results of field research in a number of different island environments. A start has been made on a coral atoll environment. This should be extended and broadened to other environments including raised atoll (deeper water table), volcanic island (sloping terrain) and possibly others;

Second International Colloquium onHydrology and Water Management in the Humid Tropics
289
• The use of remote sensing applications to small island hydrology is encouraged.Developments in this rapidly expanding field should be monitored to ensure thatappropriate technology and methods are introduced to the study of small island hydrology; and
• The impacts of climate variability on surface water catchments.
Groundwater hydrology
Further research needs are:
• Improved methods of groundwater assessment are required for both high and low islands. Emphasis has to be put on simple methods since small island water resources personnel are few, and many issues have to be solved at the local level;
• The study of groundwater recharge on Tarawa, Kiribati could be supplemented with further research into the behavior of freshwater lenses and the sustainability of pumping systems. This would be a great benefit not only locally but also to other similar low lying coral islands;
• Further relevant field data in a number of typical island environments is required. Thisincludes permeability and dispersivity for use in modeling studies;
• in general, groundwater flow models have developed to a point where they aresufficient for many applications on small islands. In some cases, simpler models need to be developed so that island personnel can use them. This may be possible for freshwater lenses, for instance, on small islands;
• Chemical and environmental isotope methods are generally powerful tools foridentifying the origin of water, particularly in small high islands, but research is needed to develop improved methods;
• Further research into groundwater pollution from sanitation systems is required. While a start has been made with the groundwater pollution study on Lifuka in Tonga, there is a need for further on other islands to determine the extent of the problem and to assess strategies for dealing with it. Guidelines for minimum distances between sanitation and water supply facilities need to be re-evaluated for island conditions with dueconsideration given to groundwater flow direction, the permeability of soils andunderlying geological layer(s), the rate of extraction and the type(s) of sanitationdisposal;
• Monitoring and research into the movement and fate of agricultural chemicals on small islands is also required;
• Pesticide behavior and transport especially in terrain devoid of soil cover or with small adsorption capacity;
• Further research is required into the optimal length of infiltration galleries and slotting patterns. Presently linear slot patterns are used and these seem to work effectively.However, it may be best to use a different slotting pattern to more adequately distribute the pumping over the full length of the gallery;
• Impact of conjunctive land uses on water quality of groundwater systems (freshwaterlenses) on small coral islands and identification of practices which are compatible with groundwater protection; and
• The impacts of climate variability on groundwater catchments.

Second International Colloquium onHydrology and Water Management in the Humid Tropics
290
9.4 Monitoring and analysis
In conjunction with research efforts, there needs to be considerable effort placed on obtaining good quality data. Regular monitoring programmes by well-trained staff are the ideal approach.National water agencies should be encouraged to maintain and, in many cases, expand water resources monitoring networks. Assistance from external aid donors may be necessary where local funding is inadequate to cover this important aspect; and there is a need for data to be not only collected but processed and archived in a readily accessible form. Regular analysis and reporting on the results of water resources monitoring programs is an essential part of the overall process.
9.5 Training, education and knowledge transfer
There is an ongoing need for appropriate training of professionals and technical staff in the water sector. This can best be done by a combination of:
• Formal education, often in academic institutions of other countries;• In-country training workshops, courses and seminars;• Regional training sessions and workshops where island personnel can share expertise
and experience are also useful. Relevant agencies (e.g. SOPAC) have greatly assisted with appropriate training and technology transfer in the Pacific islands water section;
• Interchange of professional and technical staff between different islands; and• Active involvement of island personnel in appropriate research and implementation
projects undertaken in-country or in similar island environments.
There is also a need for ongoing commitment to information dissemination andknowledge transfer in the water sector. There have been a number of major improvements in this area in recent years but there always scope for further improvements. Some of the main achievements and areas for further improvement are:
• Seminars and workshops (international, inter-regional and regional) on the topic of hydrology and water resources management of small islands have assisted participants from many islands in the past and these should continue on a periodic basis;
• Specific meetings of professional and technical personnel may also help to resolve ongoing practical and theoretical issues (for example, workshops on appropriategroundwater development methods, rainwater catchment systems); and
• Specific publications on small island water resource and water supply issues (e.g.UNESCO, 1991; UNEP/SOPAC, 1996; IETC, 1998) have provided valuableinformation, and will continue to do so in support of further appropriate technology and research advances. Newsletters on current and forthcoming activities can also be a useful means of transferring information (e.g. SOPAC and UNESCO newsletters).
• The results of studies and research into water resources issues should be effectively communicated by the researchers and funding agencies to island governments, relevant agencies and local communities in order that the potential benefits of research work is

Second International Colloquium onHydrology and Water Management in the Humid Tropics
291
realized. Where research results have a wider regional application, this informationshould be disseminated through regional agencies and appropriate institutions. The results of research which is published only through scientific or technical journals is of limited practical value and may not reach the wider community.
• There is a need for dissemination of hydrological data and information on a regional basis. Production and dissemination of written reports are one means of achieving this.Often a more valuable method of dissemination of information and knowledge transfer is through regional workshops on specific topics.
• Inter-regional networking between relevant agencies with an interest in small island hydrology and water resources management such as those mentioned above andothers, for instance, in the Caribbean and Latin America region and in the Indian Ocean can assist with this important process. A recommendation from the small islands working group at the Second International Colloquium on Hydrology and WaterManagement in the Humid Tropics (Panama City, March 1999 – of which this book is a result) was that regional focal points should assist small island nations in the co-ordination of applied hydrological research, training and information dissemination. In the Pacific Ocean region, for instance, SOPAC acts in this capacity to a large degree and provides an archive and clearinghouse of water resources information for the Pacific Islands. The establishment of a ‘virtual library’ of technical reports and access to this information through the Internet is a welcome addition.
9.6 Community education and involvement
There is an increasing need for effective community education and awareness about water resource issues. This is especially evident in some of the smaller islands (e.g. coral atolls such as Tarawa, Kiribati and Majuro, Marshall Islands) where populations are increasing andplacing severe pressures on limited water supply systems and there is additional pressure to settle on land that is reserved for water resource protection (refer White et al., 1999b). It is important that the communities on small islands, especially the more populated ones, areencouraged to become more involved in water supply planning and management issues.
With public water supply systems under severe stress on some islands to provide even basic needs, there is a need for a re-evaluation of the need for effective conjunctive use systemswhich optimize the use of household systems (e.g. rainwater catchments and private wells) as well as public water supply systems. This process should be one that actively involvescommunities in the issues and decisions over appropriate methods. This can generally be done most effectively at the village level.
The need for water conservation is above all a community issue. Only with the support and participation of the community at large, especially women and children, will the small islands be able to reduce wastage and move towards sustainable development of theirfreshwater resources. Appropriate community information and education in this regard are most important and can be provided through public meetings, school presentations and radiobroadcasts. It is essential that governments and water agencies recognize the need for community participation in water resources conservation, planning and management in order to preserve freshwater resources for future generations on small islands.

Second International Colloquium onHydrology and Water Management in the Humid Tropics
292
10 REFERENCES
ADB, 1996. Sanitation and Public Health Project, Republic of Kiribati. AsianDevelopment Bank TA2497-KIR. Prepared by Royds Consulting Ltd in association with KPMG & Kab Beriki and Associates, December.
Abell, R.S. and A.C. Falkland, 1991. The hydrogeology of Norfolk Island, South Pacific Ocean. Bureau of Mineral Resources Bull. 234, Canberra, Australia.
Alam, K. and A.C. Falkland, 1997. Vulnerability to Climate Change of the BonrikiFreshwater Lens, Tarawa. Report No HWR97/11, ECOWISE Environmental,ACTEW Corporation, prepared for Ministry of Environment and Social Development, Republic of Kiribati, April 1997.
Anthony, S.S., Peterson, F.L., MacKenzie, F.T. and S.N. Hamlin, 1989. Geohydrology of the Laura fresh-water lens, Majuro atoll, a hydrogeochemical approach. Geol. Soc. Am. Bull. 101, 1066-1075.
Ayers, J.F., 1981. Estimate of recharge to the freshwater lens of northern Guam. Tech. Rpt. No. 21, Water Resources Research Center, University of Guam, 20pp.
Ayers, J.F., 1984. Geologic construction of atolls. Proceedings, Regional Workshop onWater Resources of Small Islands, Suva, Fiji. Commonwealth Science Council Tech. Publ. No. 154, Part 2, 69-78.
Ayers, J.F. amd H.L. Vacher, 1986. Hydrogeology of an atoll island, a conceptual model froma detailed study of a Micronesian example. Groundwater 24(2), 185-198.
Bartle, G.A., 1987. Report on the evaluation of the "Aokautere Thermoelectric Heat Pulse" for measuring transpiration in coconut palms. Division of Water Resources, CSIRO,Australian Government.
Bonell, M. and J. Balek, 1993. Recent scientific developments and research needs inhydrological processes of the humid tropics. In: Hydrology and Water Management in the Humid Tropics, Bonell, M., Hufschmidt, M.M.and J.S.Gladwell (eds).UNESCO International Hydrology Series, Cambridge University Press, 167-260.
Bonell, M., Hufschmidt M.M. and J.S. Gladwell (eds), 1993. Hydrology and Water Management in the Humid Tropics, UNESCO International Hydrology Series,Cambridge University Press, 590pp.
Brunel, J.P., 1989. Evapotranspiration in South Pacific tropical islands, how important?Internat. Colloquium on the Development of Hydrologic and Water Management Strategies in the Humid Tropics. UNESCO-IHP. James Cook Univ., Townsville, Australia, 12pp.
Buddemeier, R.W., 1991. Climate and groundwater resource interactions on atolls and small islands. In: South Pacific environments: interactions with weather and climate, J. Hay (ed), Environmental Science, University of Auckland, 57-62.
Buddemeier, R.W. and G.L. Holladay, 1977. Atoll hydrology, island groundwatercharacteristics and their relationship to diagenesis. Proceedings. 3rd Internat. Coral Reef Symposium, Miami, 2, 167-174.
Canoy M.J., 1983. Remote sensing of subsurface water resources in the U.S. Virgin Islands. Tech. Rpt. No. 14, Caribbean Research Institute, College of the Virgin Islands, St. Thomas, U.S. Virgin Islands.

Second International Colloquium onHydrology and Water Management in the Humid Tropics
293
Cetoupe, R., 1992. Seychelles water resources. Water Resources Management Techniques for Small Islands. UN Department of Economic and Social Development. INT-88-R41, 172-185.
Chang, J.H., 1993. Hydrology in humid tropical Asia. Hydrology and water management in the humid tropics. In: Hydrology and Water Management in the Humid Tropics,Bonell, M., Hufschmidt, M.M. and J.S.Gladwell (eds). UNESCO InternationalHydrology Series, Cambridge University, 55-66.
Chapman, T.G., 1985. The use of water balances for water resource estimation with special reference to small islands. Bull. 4, Pacific Regional Team, Australian Development Assistance Bureau.
Chui Peng Cheong and Tay Joo Hwa, 1993. A study on stormwater runoff characteristics of the urbanised Stamford canal watershed. Proceedings. Regional Workshop on Small Island Hydrology, Batam Island, Indonesia.
Contractor, D.N., 1982. Remote sensing of water resources on Pacific islands. Water and Energy Research Institute, University of Guam, OWRT Proj. No. A-023-Guam, 15pp.
Crennan, L., 1998. Composting Toilet Trial on Kiritimati, Kiribati. In: Source book of alternative technologies for freshwater augmentation in Small Island Developing States. International Environmental Technology Centre in collaboration with SouthPacific Applied Geoscience Commission and the Water Branch of UNEP, Technical Publication Series No. 8.
Crennan, L., 1999. Final report, Composting toilet trial. Tonga Water Board Institutional Development Project. Prepared for Australian International Development Assistance Bureau, April.
Crennan, L., Fatai T. and T. Fakatava, 1998. Report on Completion of Phase Two, August-December 1998. UNESCO-IHP/SOPAC Groundwater Pollution Study, Pangai-Hihifo, Lifuka, Kingdom of Tonga, report submitted to UNESCO Office of Pacific States, Apia, Samoa, December 1998.
Dale, W.R., Waterhouse B.C., Risk G.F. and D.R. Petty, 1986. Coral island hydrology, a training guide for field practice. Commonwealth Science Council, TechnicalPublication Series, No. 214.
Depledge, D., 1997. Sanitation for small islands. Guidelines for selection anddevelopment. published by SOPAC in conjunction with UNDP and WHO.
Dillon, P., 1997. Groundwater pollution by sanitation on tropical islands. UNESCO, International Hydrological Programme, IHP-V, Technical Documents in HydrologyNo. 6.
Dijon, R., 1984. General review of water resources development in the region with emphasis on small islands. Proceedings. Regional Workshop on Water Resources of SmallIslands. Suva, Fiji. Commonwealth Science Council. Tech. Publ. No. 154, Part 2, 25-44.
Doorenbos, J. and W.O. Pruitt, 1977. Guidelines for Predicting Crop WaterRequirements. Irrigation and Drainage Paper, No 24, Food and AgricultureOrganisation, United Nations, Rome.
Falkenmark, M. and T. Chapman, T. (eds), 1989. Comparative hydrology: an ecological approach to land and water resources. Unesco, Paris, 479pp.
Falkland, A.C., 1986. Christmas Island (Indian Ocean) water resources study. Rpt. No. 86/19, Hydrology and Water Resources Unit, Australian Department of Territories.

Second International Colloquium onHydrology and Water Management in the Humid Tropics
294
Falkland, A.C., 1993. Hydrology and water management on small tropical islands.Proceedings, Symp. Hydrology of Warm Humid Regions, J.S. Gladwell (ed).International Association of Hydrological Sciences Publ. No. 216, 263-303.
Falkland, A.C., 1994a. Management of freshwater lenses on small coral islands.Proceedings, Water Down Under '94 Conference, Adelaide, Australia, November, No. 1, 417-422.
Falkland, A.C., 1994b. Climate, Hydrology and Water Resources of the Cocos (Keeling) Islands. Atoll Research Bulletin , No. 400.
Falkland, A., 1995. Cocos (Keeling) Islands. Guidelines for Water Supply Galleries. Report No HWR94/09. Hydrology and Water Resources Branch, ACT Electricity and Water. prepared for Asset Services, Cocos (Keeling) Islands.
Falkland, A.C. and J.P. Brunel, 1993. Review of hydrology and water resources of humid tropical islands. In: Hydrology and water management in the humid tropics,.Bonell,M., Hufschmidt, M.M. and J.S.Gladwell (eds). UNESCO, International Hydrology Series, Cambridge University Press, 135-166.
Falkland, A.C. and Usback R., 1999. Water Management Plan, Christmas Island, Indian Ocean, prepared for Australian Government Department of Transport and Regional Services.
Falkland, A.C. and C.D. Woodroffe, 1997. Geology and hydrogeology of Tarawa andChristmas Island, Kiribati, Chapter 19, in: Geology and Hydrogeology of Carbonate Islands, Developments in Sedimentology 54, Vacher, H.L. and T.M. Quinn (eds).Elsevier, Amsterdam, 577-610.
Fleming, P.M., 1987. The role of radiation estimation in the areal water balance in tropical regions, a review. Arch. Hydrobiol. Beih., 28, 19-27.
Furness, L.J. and S. Gingerich, 1993. Estimation of recharge to the fresh water lens of Tongatapu, Kingdom of Tonga. In: Hydrology of Warm Humid Regions, IAHS Publication 216, 317-322.
Ghassemi, F., Jakeman, A.J. and G.J. Jacobson, 1993. Mathematical modelling of sea water intrusion, Nauru island. Hydrological Processes. 4, 269-281.
Ghassemi, F., Molson, J.W., Falkland, A. and K. Alam, 1999. Three-dimensional modeling of the Home Island freshwater lens: preliminary results. Environmental Modeling & Software, Elsevier, 14, 181-190.
Giambelluca, T.W., Nullet, D. and M.A. Nullet, 1988. Agricultural drought on south-centralPacific islands. Professional Geographer. 40(4), 404-415.
Goodwin, R.S., 1984. Water resources development in small islands, perspectives and needs. Natural Resources Forum, United Nations. 8(1), 63-68.
Gould, J.E., 1991. Rainwater catchment systems for household water supply. EnvironmentalSanitation Information Center, Asian Institute of Technology. No. 32.
Griggs, J.E. and F.L. Peterson, 1989. Groundwater flow and development alternatives, a numerical simulation of Laura, Majuro atoll, Marshall Islands. Tech. Rpt. No.183, Water Resources Research Centre, University of Hawaii.
Griggs, J.E. and F.L. Peterson, 1993. Ground Water Flow Dynamics and Development Strategies at the Atoll Scale. Ground Water, 31(2), 209-220.
Hall, A.J., 1983. Surface water information network design for tropical islands. Proceedings,Meeting on Water Resources Development in the South Pacific. United Nations Water Resources Series No.57, 83-95.

Second International Colloquium onHydrology and Water Management in the Humid Tropics
295
Hamlin, S.N. and S.S. Anthony, 1987. Groundwater resources of the Laura area, Majuro Atoll, Marshall Islands, U.S. Geol Survey Wat. Resour.Invest. Report 87-4047,Hawaii, U.S.A, 69pp.
Hehanussa, P.E., 1993. Morphogenetic classification of small islands as a basis for water resources planning in Indonesia. Proceedings, Regional Workshop on Small Island Hydrology, Batam Island, Indonesia, sponsored by UNESCO, Research Institute for Water Resources Development and the Indonesian Institute of Sciences and supported by Batam Development Authority.
Heitz, L.F. and S.J. Winter, 1996. Designing your rainwater catchment and storage system. Water Information Bulletin No. 1, Water and Energy Research Institute of the Western Pacific, University of Guam, Guam.
Houghton, J.T., Meira Filho, L.G., Callander, B.A., Harris, N., Kattenberg, A. and K. Maskell (eds), 1996. Climate Change 1995. The Science of Climate Change, published for the Intergovernmental Panel on Climate Change, Cambridge University.
Hunt, C.D. and F.L. Peterson, 1980. Groundwater resources of Kwajalein island, Marshall Islands. Tech. Rpt. 126, Water Resources Research Centre, Univ. of Hawaii, 91pp.
IETC, 1998. Source book of alternative technologies for freshwater augmentation in Small Island Developing States. International Environmental Technology Centre incollaboration with South Pacific Applied Geoscience Commission and the WaterBranch of UNEP, Technical Publication Series No. 8.
Jacobson, G., Hill, P.J. and F. Ghassemi, 1997. Geology and Hydrogeology of Nauru Island. Chapter 24. In: Geology and Hydrogeology of Carbonate Islands, Developments in Sedimentology 54, Vacher, H.L. and T.M. Quinn (eds). Elsevier, Amsterdam, 707-742.
Kohout, F.A., 1980. Differing positions of saline interfaces in aquifers and observationboreholes - comments. J. Hydrol. 48, 191-195.
Manley, R.E. & Askew A.J. (1993). Operational hydrology problems. In: Hydrology and water management in the humid tropics, Bonell, M., Hufschmidt, M.M. and J.S.Gladwell (eds). UNESCO, International Hydrology Series, Cambridge University Press, 34-44.
Manton, M.J. and M. Bonell, 1993. Climate and rainfall variability in the humid tropics. In:Hydrology and water management in the humid tropics, Bonell, M., Hufschmidt, M.M. and J.S.Gladwell (eds). UNESCO, International Hydrology Series, Cambridge University Press, 13-33.
Mink, J.F., 1986. Groundwater resources and development, Trust Territory of the Pacific Islands. U.S. Environment Protection Agency, Region 9.
Nullet, D., 1987. Water balance of Pacific atolls. Water Resources Bulletin , 23(6), 1125-1132.
Oberdorfer, J.A. and R.W. Buddemeier, 1988. Climate change, effects on reef islandresources. Sixth Internat. Coral Reef Symp., Townsville, Australia. 3, 523-527.
Oberdorfer, J.A., Hogan, P.J. and R.W. Buddemeier, 1990. Atoll island hydrogeology, flow and fresh water occurrence in a tidally dominated system. J. Hydrol. 120, 327-340.
Penman, H.L., 1948. Natural evaporation from open water, bare soil and grass. Proc. Royal Soc. London, Series A, 193, 120-145.
Second International Colloquium onHydrology and Water Management in the Humid Tropics
296
Penman, H.L., 1956. Estimating evapotranspiration. Trans. Am. Geophys. Union. 37, 43-46.
Peterson, F.L., 1984. Hydrogeology of high oceanic islands. Proceedings. RegionalWorkshop on Water Resources of Small Islands, Suva, Fiji. Commonwealth Science Council Tech. Publ. Series No. 154, Part 2, 431-435.
Peterson, F.L., 1991. Hawaiian Islands. Case study 6. In: Hydrology and water resources of small islands, a practical guide. Studies and reports on hydrology No 49 (ed. A. Falkland), UNESCO, Paris, 362-367.
Priestley, C.H.P. and R.J. Taylor, 1972. On the assessment of surface heat flux andevaporation using large-scale parameters. Mon. Weath. Rev. 100, 81-92.
Rushton, K.R., 1980. Differing positions of saline interfaces in aquifers and observationboreholes. J. Hydrol. 48, 185-189.
Scholl, M.A., Ingebritsen, S.E., Janik, C.J. and J.P. Kauahiaua, 1996. Use of precipitation and groundwater isotopes to interpret regional hydrology on a tropical volcanic island: Kilauea volcano area, Hawaii. Water Resources Research 32 (12), 3525-3537.
Scott, G.A. and G.M. Rotondo, 1983. A model to explain the differences between Pacific plate island-atoll types. Coral Reefs. 1:139-150.
SOPAC, 1998. Water supply for Majuro, Republic of Marshall islands, A technical appraisal for feasible options, edited and compiled by H. Scholzel.
SOPAC/UNEP, 1996. Technologies for augmenting freshwater resources in Small Island Developing States. Compiled by U. Morgensen, SOPAC Joint Contribution Report112, UNEP, Nairobi, Kenya.
Spengler, S.R., Peterson, F.L. and J.F. Mink, 1992. Geology and hydrogeology of the island of Pohnpei, Federated States of Micronesia. Tech. Rpt. 189, Water Resources Research Centre, Univ. of Hawaii, 79pp.
Swann, M.S. and D.W. Peach, 1992. Status of groundwater resources development for New Providence, Bahamas. Water Resources Management Techniques for Small Islands. UN Department of Economic and Social Development. INT-88-R41, 114-123.
Takasaki, K.J. and J.F. Mink, 1985. Evaluation of major dike-impounded groundwater reservoirs, island of Oahu: U.S. Geol. Survey, Water-Supply Paper 2217.Washington D.C., 77pp.
Thornthwaite, C.W., 1948. An approach toward a rational classification of climate. Geogr.Rev. 38, 55-94.
Turner, B. and A.C. Falkland, 1996. Drilling report, Vaipeka water gallery extension project, Aitutaki, Cook Islands, report prepared for Australian Agency for InternationalDevelopment.
Turner, B. 1997. Report on water monitoring borehole installation, Lifuka, Tonga. Prepared for Tonga Water Board Institutional Development Project, January.
Underwood, M.R., Peterson, F.L. and C.I. Voss, 1992. Groundwater lens dynamics of atoll islands. Water Resources Research 28(11), 2889-2902.
UNDTCD, 1988. Bahamas: Water resources development (Phase I), Water resources development and management (Phase II) and Water abstraction, transportation and supply (Phase III). New York, 58pp.
UNESCO, 1991. Hydrology and water resources of small islands, a practical guide.Studies and reports on hydrology No 49. Prepared by A. Falkland (ed.) and E.

Second International Colloquium onHydrology and Water Management in the Humid Tropics
297
Custodio with contributions from A. Diaz Arenas and L. Simler and case studies submitted by others. Paris, France, 435pp.
UNESCO, 1992. Small Tropical Islands, water resources of paradises lost . IHP Humid Tropics Programme Series No. 2. Paris, France.
UNESCO/SOPAC/UNDDSMS, 1994. Pacific water sector planning, research and training. Proceedings of UNESCO/SOPAC/UNDDSMS Workshop, Pacific Water sector Planning, Research and Training, June 1994, Honiara, Solomon Islands.
Vacher, H.L. and T.M. Quinn, (eds), 1997. Geology and Hydrogeology of Carbonate Islands, Developments in Sedimentology No. 54, Elsevier, Amsterdam, 948 pp.
Volker, R.E., Mariño, M.A and D.E. Rolston, 1984. Transition zone width in ground water on ocean atolls. Am. Soc. Civil Eng., J. Hyd. Eng. 111(4), 659-676.
Voss, C.I., 1984. SUTRA, A finite-element simulation model for saturated-unsaturated, fluid-density-dependent groundwater flow with energy transport or chemically-reactivesingle - species solute transport. U.S. Geol. Survey Water-Resour. Invest. Report84-4389, 409 pp.
Voss, C.I., Boldt, D. and A.M. Sharpiro, 1997. A Graphical-User Interface for the U.S. Geological Survey’s SUTRA Code using Argus ONE (for Simulation of Variable –Density Saturated-Unsaturated Ground Water Flow with Solute or Energy Transport), U.S. Geol. Survey, Open-File Report 97-421, Reston, Virginia.
Voss, C.I. and W.R. Souza, 1987. Variable density flow and solute transport simulation of regional aquifers containing a narrow freshwater-saltwater transition zone. WaterResour. Res. 23(10): 1851-1866.
Waterhouse, B.C. and D.R. Petty, 1986. Hydrogeology of the Southern Cook Islands, South Pacific. New Zealand Geol. Survey Bull. 98. Department of Scientific and Industrial Research. 93pp.
Wheatcraft, S.W. and R.W. Buddemeier, 1981. Atoll island hydrology. Groundwater.19(3), 311-320.
Whitaker, F.F. and P.L. Smart, 1997. Hydrogeology of the Bahamian Archipelago. ,Chapter 4, in Geology and Hydrogeology of Carbonate Islands, Developments in Sedimentology 54, Vacher, H.L. and T.M. Quinn (eds), 1997. Elsevier, Amsterdam, 83-216.
White, I., 1996. Fresh groundwater lens recharge, Bonriki, Kiribati. Preliminary report.UNESCO, International Hydrological Programme, IHP-V, Technical Documents inHydrology No. 5.
White, I., Falkland, A., Kamaie, B., Metai, E., Metutera, T. and L. Crennan, 1997. Rechargeof fresh groundwater lenses: field study, Tarawa atoll, Kiribati. VIII Pacific Science Inter-Congress, Suva, Fiji, 13-19 July.
White, I., Falkland, A., Etuati, B., Metai, E. and T. Metutera, 1999a. Recharge of Fresh Groundwater Lenses: Field Study, Tarawa Atoll, Kiribati. (paper in this document)
White I, Falkland, A., Crennan, L., Jones, P., Metutera, T., Etuati, B. & Metai, E. (1999b). Groundwater recharge in low coral islands Bonriki, South Tarawa, Kiribati. Issues, traditions and conflicts in groundwater use and management. UNESCO IHP-V, Technical Documents in Hydrology, No. 25, UNESCO, Paris, 37 pp.

Second International Colloquium onHydrology and Water Management in the Humid Tropics
298
WHO, 1993. Guidelines for drinking-water quality. Volume 1, Recommendations.World Health Organisation, Geneva.
WMO, 1983. Operational hydrology in humid tropical regions. Hydrology of Humid Tropical Regions, R. Keller (ed). IAHS Publication 140, 3-26.
WMO, 1987. Tropical hydrology. Operational hydrology Report . No. 25, WMO No. 655, World Meteorological Organisation, Geneva, Switzerland, 66pp.
Woodroffe, C.D., 1989. Salt water intrusion into groundwater; an assessment of effects on small island states due to rising sea level. Small States Conference on Sea Level Rise, 14-18 November, Republic of Maldives, 33pp.
Woodroffe, C.D. and A.C. Falkland, 1997. Geology and hydrogeology of the Cocos(Keeling) Islands, Chapter 31. In: Geology and Hydrogeology of Carbonate Islands, Developments in Sedimentology 54, Vacher, H.L. and T.M. Quinn (eds). T.M., Elsevier, Amsterdam, 885-908.
Wright, E.P., 1989. Small high islands. In: Comparative hydrology, an ecological approach to land and water resources, Falkenmark, M. and T.Chapman (eds). UNESCO, Paris, 295-322.

Second International Colloquium onHydrology and Water Management in the Humid Tropics
299
Recharge of Fresh Groundwater Lenses:Field Study, Tarawa Atoll, Kiribati
I. White Jack Beale Professor of Water Resources, Water Research Foundation of Australia, Centre for Resource and Environmental Studies, Institute of Advanced Studies, Australian National University, Canberra, ACT 0200, AustraliaA. Falkland Senior Engineer, Ecowise Environmental, ACTEW Corporation, Canberra, ACT 2601, AustraliaB. Etuati Hydrogeologist, Ministry of Environment and Social Development, Bikenibeu, Tarawa, Republic of Kiribati.E. Metai Officer in Charge, Water Engineering Section, Public Works Division, Ministry of Works and Energy, PO Box 498, Betio, Tarawa, Republic of KiribatiT. Metutera Manager Water Supply and Sewerage, Public Utilities Board, Ministry of
Works and Energy, PO Box 498, Betio, Tarawa, Republic of Kiribati
ABSTRACT
Freshwater is limited in small, low, coral islands, where shallow, groundwater lenses are the principal source of potable water in dry periods. Sustainable extraction from freshwater lenses is governed by the fraction of rainfall recharging the ground water. Recharge is difficult to estimate accurately because the amount of rainfall intercepted by tropical vegetation, lost by evapotranspiration from the soil and from shallow ground water have not been measured on low coral atolls. This UNESCO-SOPAC-initiated study aimed to quantify these recharge and loss processes. Bonriki Island, Tarawa atoll, Republic of Kiribati was chosen for the study. The Bonriki groundwater reserve supplies water to about 30,000 residents in South Tarawa, over one third of the population of Kiribati.
Novel features of this work were the measurement of throughfall, stemflow and the estimation of interception losses of coconut trees, the direct measurement of both transpiration by coconut trees and changes in the soil water store in the top 0.7 m of the profile. These were coupled with measurements of the climatic drivers of evapotranspiration, the water table height and the thickness of the freshwater lens. To estimate potential evapotranspiration, wind speed, air temperature and humidity, atmospheric pressure, solar radiation, soil moisture to 0.7m, groundwater elevation and sap flow velocity in coconut trees were recorded at 15 minute intervals for the duration of the study. Salinity monitoring boreholes were used to monitor the freshwater lens thickness. Analyses of groundwater chemistry were also conducted and profiles of the heavy isotopes 2H and 18O were measured.
It was found that throughfall varies dramatically beneath the coconut trees both spatially and temporally. Close to the crown of coconut trees, throughfall is, on average, 68% of daily precipitation. During heavy rains, the tree crowns concentrate throughfall up to 2.7 timesincident rainfall on the tree and, in straight trees, stemflow is equivalent to 31% of the daily precipitation. On average, the interception store of the crown is 5 mm and fronds have a 0.7

Second International Colloquium onHydrology and Water Management in the Humid Tropics
300
mm store. Interception losses by the crown of coconut trees are, on average, 1% of daily precipitation. Since the Bonriki reserve has only 20% tree coverage, the average totalinterception losses are as low as 7% of annual rainfall.
The mean daily potential evapotranspiration rate was 3.9 mm/d. Sapflow measurements showed coconut trees transpired on average 4 mm/d, close to potential evaporation,independent of soilwater and driven by solar radiation. For the estimated 20 % tree coverage, this amounts to 0.8 mm/d losses and seems to be supplied directly from the fresh ground water. This rate is comparable with the extraction due to pumping of 1.4 mm/d.
Soil moisture monitoring showed very rapid responses to rainfall and drainage and revealed that soil evaporation took place from the top 0.5 m of the profile. Soil moisture probesat 0.7 m depth identified recharge events during intense rains that were confirmed with water table height measurements. Water tables show rapid responses to rainfalls in excess of 50 mm/d. Isolated rainfall events of less than 20 mm/d did not recharge the freshwater lens in dry periods and the non-drainable daily soil water store to 1.0 m was estimated to be 130 mm.
The soil probe data showed that soil evaporation decreased as the square-root of time following rainfall. Estimates of soil evaporation from rainfall not causing recharge gave average soil and interception losses of 1.7mm/d. These estimates of soil evaporation, together with the interception and coconut tree evapotranspiration losses, suggest that the mean daily totalevaporative losses are about 2.5 mm/d, about 2/3 of potential evapotranspiration.
Water table levels showed tidally forced fluctuations, independent of position and with a mean tidal efficiency of 5%. The water table response demonstrated that the maximumdrawdown due to groundwater pumping from infiltration galleries was less than 20 mm. This is 1/5 the diurnal, tidally forced water table fluctuation of approximately 100 mm. A simpleanalysis of water table elevation at the centre of the freshwater lens suggests a mean annualrecharge rate of 860 mm/y. Chloride tracer estimates gave an average annual recharge of about 690 mm/y. Heavy water isotope 2H and 18O concentrations in the upper portion of the freshwater lens were close to the tropical meteoric line. This indicates no significant direct evaporation losses from ground water. The maximum thickness of the freshwater lensdecreased by 1.0 m during the study. This is equivalent to average losses of 2.4 mm/d. When freshwater abstraction is accounted for, this suggests groundwater losses of 1.0 mm/d, close to that found for coconut tree groundwater use.
Based on these results, a simple daily water balance model was constructed whichestimated interception, soil evaporation and groundwater transpiration losses and changes in soil moisture storage. During the study period, the estimated total evapotranspiration losses were 2/3 of potential evaporation. This implies that equilibrium evaporation may be a more appropriate upper bound for small, low islands. Recharge of the freshwater lens was estimated to be 102 mm, only 17% of the total rainfall of 603 mm, and only occurred after intense rainfalls in excess of 50 mm/d at the end of the study period. The model can be used to estimate mean annual recharge rates and the effects of management strategies.
1 INTRODUCTION
Expanding populations, land use change and urbanisation, together with limited land area and conflicts over resource ownership, use and management are imposing increasing pressures on freshwater in many small island nations. These problems are exacerbated in low-coral-atolls,where the principal source of freshwater, particularly in prolonged dry periods, is shallow

Second International Colloquium onHydrology and Water Management in the Humid Tropics
301
ground water. This ground water exists as a shallow freshwater lens in coral sands “floating” over seawater in highly permeable karstic limestone (Wheatcraft & Buddemeier, 1981;Falkland & Brunel, 1993; Falkland & Woodroffe, 1997). Groundwater fluctuations, due to tidal forcing, mix freshwater and seawater at the base of the freshwater lens, so that asubstantial, brackish, transition zone is produced (Underwood, Peterson & Voss, 1992) making the freshwater lens thinner than expected from the classical freshwater lens model(Badon Ghijben, 1889; Herzberg, 1901 ).
Shallow, freshwater lenses in highly permeable coral sands are very vulnerable to contamination from surface sources, especially from animal or human wastes (Dillon, 1997). Residence times for pollutants in the unsaturated zone above the ground water are of the order of one day. As well, inundations by the sea during storm surges can also salinise freshwater lenses. In addition to contamination, many small islands in the Pacific have highly variable annual rainfalls, with large coefficients of variation, strongly influenced by El Niño Southern Oscillationevents (Falkland & Brunel, 1993; Cole, Fairbanks & Shen, 1993). Finally, but importantly, excessive or inappropriate methods of extraction of freshwater from lenses can cause seawater intrusion, and the salinisation of the potable water supply (Falkland & Brunel, 1993; Whitaker & Smart, 1997).
1.1 Knowledge gaps
The identification of sustainable rates of groundwater extraction is essential for the well-being of many small island nations in the humid tropics. Past estimates of these rates have been based on approximations of the hydrology of small islands. Some have used entirely empirically based rules-of-thumb, some theoretical, while others a mixture of both (see below1).
The amount of information required to use purely theoretical approaches is a majorproblem. On the other hand, predictions from rules-of-thumb, which are much less data-hungry, may be suboptimal because of their unknown generality and because they tend to err on the overly conservative side so that predicted water abstraction rates are less than the sustainable rates. In order to determine sustainable extraction rates, it is necessary to know the rate at which freshwater is supplied to the lens by rainfall that is the groundwater recharge rate.
Recent reviews (Falkland & Brunel, 1993; Falkland & Woodroffe, 1997; Whitaker & Smart, 1997; Falkland, 1999; White, 1996) have identified knowledge gaps in rechargeestimation for small islands. These have highlighted the need for more data on climatic variables, especially rainfall and solar radiation, as well as information on groundwater dynamics and salinity profiles and sea level influences. The reviews have pointed out that evapotranspiration, a major component of the water balance of freshwater lenses is poorly known for small, coral atolls (White, 1996). This means that estimates of groundwater recharge are also uncertain.
1.1 Aims of this work
1 Wheatcraft & Buddemeier, 1981; Mather, 1973; Hunt & Peterson, 1980; Ayers & Vacher, 1983; Chapman, 1985; Falkland, 1983,1988, 1990, 1992a, 1992b, 1999; Griggs & Peterson, 1989; Anthony, 1992; Ghassemi, Jakemann & Jacobsen, 1990; Oberdorfer & Buddemeier, 1988; Oberdorfer, Hogan & Buddemeier, 1990; Voss & Souza, 1987; Peterson, 1991

Second International Colloquium onHydrology and Water Management in the Humid Tropics
302
The information gaps in our understanding of the water balance of freshwater lenses in low, small coral islands caused UNESCO and SOPAC to initiate a staged project to investigate freshwater lens recharge and groundwater extraction. This paper summarises stage 2 of a project to measure components of the water balance of a freshwater lens in Bonriki Island, Tarawa Atoll and Republic of Kirabati. Gr ound water pumped from the freshwater lens supplies water to about 30,000 residents of South Tarawa, over a third of the Republic’s population. The aim of this component of the project was to provide techniques for the estimation of recharge in low coral islands. This paper describes results of this component..
2 GROUNDWATER USE AND THE WATER BALANCE OF LOW CORALATOLLS
The groundwater supply and its sustainable use in coral atolls is dictated by the atoll’sfreshwater balance. Figure 1 shows a schematic diagram of the water balance at the surface of a freshwater lens. It has been usual practice for low coral islands (Falkland & Brunel, 1993; Chapman, 1985) to consider the water balance of the unsaturated and saturated zonesseparately. As shown in Figure 1, we can also consider the vegetation as a third, important zone. In the vegetative and unsaturated zone, the flux of water is predominantly vertical. In the saturated freshwater zone, which has a typical aspect ratio (depth over characteristic horizontal length) of less than 0.05, mean flow is assumed to be mainly horizontal (Chapman, 1985).
2.1 Interception, throughfall and stemflow
Evaporative interception losses from atoll vegetation, Ei, do not appear to have been measured. The water balance over a time period t at the intercepting surface relates the interception losses on vegetation, Ei, to precipitation, P (Bonell, 1993; Bonell & Balak, 1993; Blake, 1975 ):
VFPEP ti ∆++=− (1)
where Pt is the throughfall, that portion of the rain falling below the vegetation, and F is stemflow in which water channels down the stem of the plants, and ∆V is the interception store which has a maximum storage capacity of Si . All components of the water balance inEquation 1 and the following water balances have units of volume per area, normally expressed
as a length (mm). It is only when iSP > that stemflow and throughfall occur. Under prolonged or heavy rainfalls, ∆V is negligible.
Interception losses are a function of the precipitation rate, the cumulative precipitation or duration and the architecture of the vegetation. Simple, linear correlations have been used to relate throughfall and stemflow to daily precipitation (Blake, 1975):
).(1 lit SPAP −= (2a)).(2 ciSPAF −= (2b)
where A1 and A2 are approximate constants and Sil and Sic are the maximum interception stores of leaves and crowns. If we take these stores to be equal, the simple relations in

Second International Colloquium onHydrology and Water Management in the Humid Tropics
303
Equations 2, together with Equation 1, to a first approximation give, for daily rainfalls when
iSP > :
)()1.( 2121 AASAAPE ii −+−−= (3)
Under short duration, low intensity rainfalls with no stemflow, the interception store can be found from the rainfall when throughfall first commences. It is important to recognise that interception losses should be treated on a per storm or daily basis, not as a percentage of total cumulative rainfall (Fleming, 1993).
Figure 1: Conceptual water balance model of recharge of a freshwater lens (Falkland &Brunel, 1993).
2.2 Recharge and the soil water store
Coral sands in low coral atolls have large hydraulic conductivities (typically > 4 m/d). Surface runoff and unsaturated lateral flow therefore are usually negligible and the water balance for the
Freshwater Lens

Second International Colloquium onHydrology and Water Management in the Humid Tropics
304
unsaturated, soil water zone above the water table can be simplified to (Falkland & Brunel, 1993; Fleming, 1993):
RUEEP si +∆=−− (4)
where Es is the soil evaporation losses incorporating both direct soil evaporation and plant extraction for transpiration, ∆U is the change in soilwater store (volume per unit area,positive[increase in water stored] or negative[decrease in water stored]) and R is the recharge flux leaving the bottom of the unsaturated zone and entering the ground water. Equation 4 ignores capillary rise from the water table into the unsaturated zone to supply soil evaporation. This is probably negligible in coarse-textured coral sands. We take the total evapotranspiration losses as the sum of interception losses, soil evaporation and evapotranspiration supplied by the groundwater store, Eg:
gsi EEEE ++= (5)
Eg includes transpiration losses by phreatophytes, plants able to use ground water directly, and any evaporation from ground water direct into the atmosphere. Direct evaporation from ground water in coarse coral sands with depths to the water table greater than about 1 mis negligible. Soil evapotranspiration loss, Es, in Equations 4 and 5 has not been measured separately in atolls nor is there information about the daily dynamics of soil moisture storage, ∆U, in the unsaturated zone. Using Equation 5, Equation 4 can be rewritten as:
gERUEP −+∆=− (6)
and R - Eg is the net groundwater recharge that can be positive or negative. For low coral islands, the unsaturated zone store is normally small, with the maximum ∆U typically less than 100 mm. This means that for long–term water balances (t ~ 1 year), ∆U is small relative to P(typically 700 to 3,000 mm) and E (700 to 1500 mm) and can often be ignored (Brutsaert, 1982; Dunin, White & Denmead, 1999). Over long time periods, Equation 6 becomes simply:
EPER g −=− (7)
In order to estimate R-Eg in the long term P and E must be known or estimated. It has been assumed in the humid tropics that E is just potential evaporation (Chang, 1993).
2.3 The groundwater store: recharge, losses and abstraction
Recharge from the unsaturated zone is related to the change in groundwater store, ∆G, water abstraction by pumping, Q, peripheral losses of fresh water into surrounding seawater, Lp, and direct evapotranspiration losses from the ground water, Eg :
GQLER pg ∆++=− (8)

Second International Colloquium onHydrology and Water Management in the Humid Tropics
305
Peripheral losses include lateral outflow at the edge of the lens and the flux of water at the base of the lens lost by dispersion and mixing into the underlying salt ground water. The magnitude of direct evapotranspiration losses from the ground water for small coral atolls due to abstraction by plants also has not been measured, but appears to be substantial (Falkland & Woodroffe, 1997; Falkland, 1999). There are few estimates of total peripheral losses, Lp, for coral atolls, particularly losses due to dispersion at the base of the lens. They may be best estimated by numerical models (Ghassemi, Jakemann & Jacobsen, 1990; Peterson, 1991).
During prolonged dry periods, with no rainfall, the decrease in stored ground water is:
QLEG pg −−−=∆ (9)
In the long term (about 10 years), changes in groundwater storage (typically no more than 1 m) can be ignored and the steady state approximation is appropriate (Chapman, 1985). Therefore, through Equations 7 and 8, we have:
QLEREP pg +=−=− (10)
Abstraction by pumping, Q, and precipitation, P, are the only two terms we know with any certainty in Equations 7 through 10 for low coral atolls.
2.4 Time period for water balance estimation
The time period over which water balances should be estimated depends on the storagecapacity of the compartment, S, (volume per area) and the flux of water, f, (volume/area/time) into or out of the compartment (Chapman, 1985). These together determine the residence time or turnover time, tr, for water in the compartment:
fStr = (11)
Typically for vegetated canopies, S is around 2 mm. With rainfall rates of 30 mm/d, common in many tropical islands, Equation 11 suggests that balances for the canopy need to be followed over an event. For the unsaturated zone, S is of order 50 mm and, with typical rainfall 30 mm/d, Equation 11 suggests that for the unsaturated zone water balances should beestimated over daily periods. For the groundwater store in coral atolls, S may be of order 10 m and recharge rates are of order 0.5 to 1 m/y. These suggest that the average residence time of freshwater in lenses is about 5 to 10 years. This period is of order or even longer than the period of ENSO correlated droughts (Falkland, 1992a). With such a long residence time, it is clear that monthly time steps are adequate for estimating the water balance for freshwater lenses.
2.5 Evapotranspiration losses from coral atolls
In this study, our concern is with daily or longer estimates of evapotranspiration. For these time scales, the energy balance for the partition of radiant energy at the earth’s surface can be written as:

Second International Colloquium onHydrology and Water Management in the Humid Tropics
306
HAERn ∆++= λ (12)
with Rn the net radiation, λE is the latent heat flux due to the evaporation of water with λ the latent heat of vaporisation of water at the temperature of interest and E the actual total evaporation, A the sensible heat lost to the air and ∆H the ground heat flux (positive or negative). Terms in the energy balance Equation 12, have units of watts/m2. In the humid tropics, ground heat flux is probably negligible for periods of a day or longer so that incoming radiation is split between evaporation and heating the air. Also, the generally small differences in air and wet bulb temperatures and temperatures close to 32 °C in equatorial areas, indicate about 90% of the absorbed radiant energy is used to evaporate water (Fleming, 1993).
The most frequently used estimate of evaporation is potential evaporation (Brutsaert, 1982) given by Penman’s (Penman, 1948) estimate of the potential evaporation rate, Ep, over extensive moist surfaces (Bonell & Balek, 1993):
)/( ∆++= γγλλλ aqp EEE (13)
where Eq is the equilibrium evaporation rate due to radiant energy; Ea is the so-called “drying power of the air”, due to both the humidity and wind speed of the air (Dunin, White & Denmead, 1999); γ is the psychrometric constant (γ = pCp /[0.662λ], with Cp the specific heat of the air at pressure p; and ∆ is the slope of the saturation vapour pressure versus temperature curve. Potential evaporation in Equation 13 is driven by net solar radiation and by drier air flowing over the evaporating surface. In humid tropics, the second term is only about 26% of the first.
It has been suggested that the Penman Equation 13 (Chang, 1993) provides good estimates of actual daily evapotranspiration for the tropics (Fleming, 1993; Chang, 1993) and it has been used to estimate potential evaporation from atolls (Falkland, 1988, 1993, 1999; Fleming, 1987). However, this suggestion has not been tested. Actual measurements ofevapotranspiration on small low islands are by no means straightforward because of the strong influence of the surrounding oceans and the limited fetch of small islands (White, 1996).
In order to use Equation 13 to estimate long–term evaporation, measurements of net radiation, wet and dry bulb temperatures, and wind speed are required. These are usually not available for small coral islands. Because of this, it has been suggested that the empirical Priestley and Taylor Equation (Priestley & Taylor, 1972) is more useful for tropical situations, with Ep given by:
qp EE α= (14)
The proportionality constant, α, in Equation 14 is traditionally taken as α = 1.26 whichapplies to moist conditions. The simpler Equation 14 has been employed to estimate potential evaporation for tropical Pacific Islands (Nullet, 1987; Giambelluca, Nullet & Nullet, 1988). However, the choice of the constant term by Priestley and Taylor (Priestley & Taylor, 1972) was influenced by their experience of advective situations in drier, temperate areas.

Second International Colloquium onHydrology and Water Management in the Humid Tropics
307
It has been the usual practice to model the impact of soil water content on evaporation by introducing a soil water content-dependent α in Equation 14 (Davies & Allen, 1973). This can take the form of an exponential relationship (Davies & Allen, 1973), or a more simple linear relationship on soil moisture (Falkland, 1983). It is not known how the depth of the vegetation’s root zone, or the distribution of soil moisture within that zone, influence theperceived value of α. It is also not known how phreatophytes, such as coconut trees and understorey vegetation, tapping into shallow water tables, influence the value of α . Falkland(1988) partitioned evaporation between soil and ground water by estimating the percentage of roots reaching the ground water and assumed that the crop factor (a factor used to multiply potential evaporation) for grasses on tropical atolls was 1.0 while that for coconut trees was 0.8. Mixed stands were handled by estimating the percentage of ground cover taken by that crop. In the absence of detailed crop and soil information, the assumption of α = 1 for coral atolls seems reasonable for long term evapotranspiration estimates.
The first term in Equation 13 represents equilibrium evaporation, the steady state loss of water from a large expanse of uniform vegetation into a closed atmosphere. It incorporates only the contributions of net radiation to evaporation. Equilibrium evaporation from wet surfaces over very long fetches is given by (Priestley, 1959; Slatyer & McIlroy, 1961):
])[/()( ∆+∆∆−= γλHRE nq (15)
with ∆H the ground heat flux. Equation 15 is simply Equation 14 with α = 1. The only factors governing Eq are net radiation, ground heat flux (of order 5 to 10% of Rn if daytime values are used) and, more weakly, air temperature and, very weakly, pressure (through ∆/[∆+γ]). If direct radiation measurements are not available, methods for estimating net radiation, based on latitude, time of year and rain days are available (Fleming, 1987).
True equilibrium conditions are rare over short–time scales. However it has been proposed that Equation 15 represents an instantaneous balancing act between advection, which tends to increase E above Eq, and soil water deficit which decreases E below Eq. Equation 15 may therefor be an appropriate upper bound for evapotranspiration, even in drier, temperate regions, (Denmead & McIlroy, 1970; Dunin, White & Denmead, 1999).
Measurements from Amazonian rainforests (Viswanadham, Filho & André, 1991) and from temperate forests (McNaughton & Jarvis, 1983), under moderate evaporation insituations where the differences between atmospheric and plant canopy vapour pressure are small, show that α = 1. This may also be so in small coral atolls surrounded by the sea. It has been argued (Denmead & McIlroy, 1970) that, except in oasis or desert-type situations, departures of actual evaporation from equilibrium evaporation would rarely be extreme.Brutsaert & Stricker, 1949, observed that the average daily E was almost identical to Eq over a 74–day dry period in Gelderland. For coastal regions, substantially influenced by evaporation from the sea, it seems plausible to suggest that α = 1, that is, equilibrium evaporation, appears a reasonable upper bound (Penman, 1948).
3 THE STUDY SITE
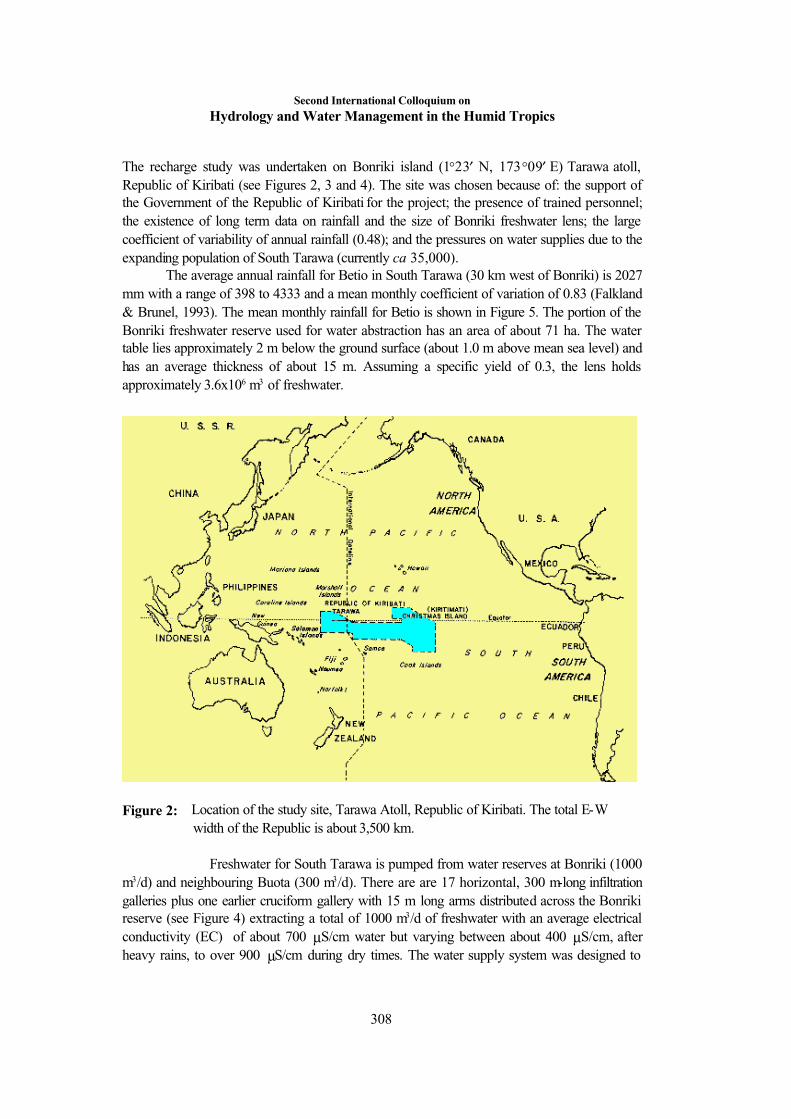
Second International Colloquium onHydrology and Water Management in the Humid Tropics
308
The recharge study was undertaken on Bonriki island (1°23′ N, 173°09′ E) Tarawa atoll, Republic of Kiribati (see Figures 2, 3 and 4). The site was chosen because of: the support of the Government of the Republic of Kiribati for the project; the presence of trained personnel; the existence of long term data on rainfall and the size of Bonriki freshwater lens; the large coefficient of variability of annual rainfall (0.48); and the pressures on water supplies due to the expanding population of South Tarawa (currently ca 35,000).
The average annual rainfall for Betio in South Tarawa (30 km west of Bonriki) is 2027 mm with a range of 398 to 4333 and a mean monthly coefficient of variation of 0.83 (Falkland & Brunel, 1993). The mean monthly rainfall for Betio is shown in Figure 5. The portion of the Bonriki freshwater reserve used for water abstraction has an area of about 71 ha. The water table lies approximately 2 m below the ground surface (about 1.0 m above mean sea level) and has an average thickness of about 15 m. Assuming a specific yield of 0.3, the lens holds approximately 3.6x10⁶ m3 of freshwater.
Figure 2: Location of the study site, Tarawa Atoll, Republic of Kiribati. The total E-Wwidth of the Republic is about 3,500 km.
Freshwater for South Tarawa is pumped from water reserves at Bonriki (1000 m3/d) and neighbouring Buota (300 m3/d). There are are 17 horizontal, 300 m-long infiltration galleries plus one earlier cruciform gallery with 15 m long arms distributed across the Bonriki reserve (see Figure 4) extracting a total of 1000 m3/d of freshwater with an average electrical conductivity (EC) of about 700 µS/cm water but varying between about 400 µS/cm, after heavy rains, to over 900 µS/cm during dry times. The water supply system was designed to

Second International Colloquium onHydrology and Water Management in the Humid Tropics
309
provide about 40 L/head/d of potable water (Falkland & Brunel, 1993). This designspecification, however, is threatened by the population growth rate on South Tarawa, due to both births and migration of outer islanders, of 2.4%. The extraction rate appears conservative. In a prolonged dry period, the current pumping regime, on its own, would take about 10 years to deplete the lens.
Senile coconut trees cover about 20% of the water reserve with scattered pandanus palms and understorey vegetation that is frequently burnt. There are also abandoned babai (swamp taro) pits scattered across the water reserve that are sources of organic matter inputs to the freshwater lens. Current land use on the water reserve, beside groundwater abstraction, includes harvesting of coconuts, logging of coconut trees, harvesting of coconut and pandanus fronds, two cemeteries, illegal housing and vegetable gardens.
A weather station (Campbell Scientific Instruments) was established in a cleared site in the middle of the water reserve (see Figure 4). The location chosen was secure from vandalism. The chlorination plant with its locked, fenced inclusion was chosen for security reasons, although the fetch for wind speed measurements was not ideal. The weather station measured solar radiation, wind speed, air temperature and relative humidity, and barometric pressure (Vaisala PTB 101B, installed 8 Nov 1996). Measurements were made at 1-minute intervals and averaged over 15 minutes. The data were stored on a data logger (Campbell Scientific) and down loaded at approximately monthly intervals. Solar radiation, air temperature, vapour pressure deficit, calculated from the relative humidity and wind speed were used to calculate the potential evaporation using Equations 13, and 15.
4 MEASUREMENT TECHNIQUES
4.1 Climate parameters
Rainfall was measured using two 200 mm tipping bucket rain gauges, one placed in the open, the other under the maximum leaf cover of a coconut tree. These were about 30 m apart.Rain gauges were positioned in order to estimate the contributions of crown flow and crown interception to throughfall (see Equations 1 through 3). Data from all instruments were stored in a datalogger that was downloaded approximately every month. In addition, two 200 mmmanual rain gauges were placed alongside the tipping bucket rain gauges as backups. Manual rain gauges were read daily. Calibration of the tipping bucket rain gauges showed theyrecorded 94% of incident water. The measurement period was from 20 August 1996 to 28 February 1997.
4.2 Interception, stemflow and tree water use
In addition to the paired 200 mm tipping bucket rain gauges and the 200 mm manual rain gauges in the open and under a coconut tree crown, ten 100 mm rain gauges were distributed in the open and underneath other coconut trees in order to assess interception losses by palm fronds. A stemflow gauge was attached to the only vertical coconut tree at the site in order to assess the flow of water down the stem of the tree. The stemflow gauge consisted of a U-shaped rubber channel that was wound two and a half times around the tree and attached with staples and sealed with a silicone sealant. The rubber channel was led into a 25 mm tube that

Second International Colloquium onHydrology and Water Management in the Humid Tropics
310
delivered the stemflow to sealed 20 L container. Rain gauges and the stemflow gauge were read daily.
Coconut tree transpiration was determined using two heat-pulse sap flow sensors inserted to a depth of 20 mm in the tree. The volume fraction of water in the tree trunk, (0.72) was determined by sampling the tree and oven drying samples at 60°C for two days. Coconut trees are C4 plants and the entire cross section of the trunk conducts water. The heat pulse sensors were used to obtain the sapflow velocity at 10-minute intervals throughout the day. This data was stored in a data logger and down loaded at about monthly intervals. Sapflow data was converted into transpiration rates using the cross sectional area of the conductive tissue and the volume fraction water in that tissue. The coconut palm showed no wound response to the insertion of heat pulse probes over an extended period.

Second International Colloquium onHydrology and Water Management in the Humid Tropics
311
Figure 3: Tarawa Atoll, Bonriki Island is on the lower right of the atoll. Freshwater from the lens at Bonriki is distriibuted along South Tarawa to Betio on thelower left of the atoll (Falkland & Brunel, 1993).
Figure 4: Bonriki water reserve, showing pumping galleries ( ), salinitymonitoring boreholes (▲) and the climate monitoring site (■). The airport runway is 2.1 km long (Falkland & Woodroffe, 1997).
4.3 Soil water content
The soil water content was determined by gravimetric sampling to a depth of 0.55 m. Inaddition, a frequency domain variant of time domain reflectometry, FDR, (Topp, Davis & Annan, 1980; White & Zegelin, 1995) was used to monitor soil water content at 1 minute intervals that were averaged over 15 minute intervals. Data were stored in the weather station data logger. The FDR probes used (Campbell Scientific) were 0.6m long and were placed in two pits, one close to trees, the other in the open near the weather station. Probes were installed at soil depths of 0.15, 0.3. 0.5 and 0.7 m in the soil profile in the tree pit, and two deeper probes were at depths of 0.45 and 0.6 m in the open pit.
4.4 Water table elevation
Water table elevation was measured using two temperature-compensated pressure transducers that were sensitive to changes in water level of 1 mm. Pressure transducers were positioned at the bottom of the pumping well in the infiltration galleries. The maximum drawdown of pumping was determined by noting the change in groundwater level when the pump was switched off for

Second International Colloquium onHydrology and Water Management in the Humid Tropics
312
at least 24 hours. The two transducers were moved to different pumping wells in galleries across the water reserve over the period of measurement. Pumping stations chosen for monitoring were PS 1, 7, 12, 16 and 18 (at the chlorination plant). The tidal record for Betio, South Tarawa, 30 km from the site, was also obtained. Tidally forced groundwater fluctuations were found in all wells.
Figure 5: Mean monthly rainfall for Betio, South Tarawa, for 50 years from 1948. Shaded area shows +/- one standard deviation.
4.5 Salinity monitoring and thickness of the freshwater lens
The thickness of the freshwater lens was measured using salinity monitoring boreholes (Falkland & Woodroffe, 1997). Salinity profiles through the freshwater lens were measured at at two sites, one close to the centre of the freshwater lens (BN 16 in Figure 4), the other close to the northern, ocean-side edge of the freshwater lens (BN 1). Salinity records for these sites are available since 1987. The in situ EC of water sampled at 3 m depth intervals from 6 m to 30mat BN 16 and from 6 to 21 m at BN 1 was measured by pumping groundwater from these depths and using a calibrated field EC probe. Profiles were taken at approximately 3 month intervals. The EC of waters produced from the shallow infiltration galleries close to the water table were also monitored.
4.5 Chemistry of the Freshwater Lens

Second International Colloquium onHydrology and Water Management in the Humid Tropics
313
Water samples for chemical analysis were taken from the same salinity monitoring boreholes. Samples were stored at 5°C and analysed for Na, K, Mg, Ca, Sr, Cl, SO4, dissolved organic C, total dissolved N and H2S. Field tests for H2S were carried out using a Scrage field test kit. Samples for H2S analysis were also taken by immediately fixing samples with zinc acetate at the time of collection and analysing in the laboratory. Samples were also taken for 2H and 18Oanalyses. Saline isotope samples were azeotropically distilled.5 RESULTS
5.1 Climate
The mean daily climate variables for the study period (20 August 1996 to 28 February 1997) are shown in Table 1. The principal drivers of the long-term water balance are rainfall and solar radiation. Mean daily rainfall, over the study period is shown in Figure 6. It can be seen from Figure 6 that significant rains did not commence until the end of January 1997. Over the study period 603 mm of rain fell compared with the long term average expected for that period of 1124 mm.
Table 1: Summary of daily climate variables over the period 20 August 1996 to 28 February 1997.
Variable Mean StandardDeviation
Maximum Minimum
Air Temperature (°° C) 28.95 0.74 34.18 21.91
Vapour Pressure Deficit(kPa)
2.95 0.16 3.28 2.50
Sol ar Radiation (kW/m2) 6.31 1.07 7.65 1.12
Wind Speed (m/s) 0.97 0.32 1.94 0.22
Atmospheric Pressure (kPa) 100.96 0.05 101.04 100.87
Potential ET (mm/d) 3.89 0.82 5.12 0.75
Rainfall (mm/d) 3.77 6.59 105 0
The daily potential evaporation calculated from Equation 13 is given in Figure 7 and was closely correlated to daily solar radiation. The minimum daily potential evapotranspiration, shown in Table 1, corresponded to cloudy conditions during intense rainfall. During the latter part of the study period, increasing cloudiness and rain, as shown in Figure 6, appear to have decreased the potential evaporation.
The cumulative rainfall and potential evaporation for the study period is shown in Figure 8. It is clear from this Figure that potential evaporation exceeds rainfall for the study period. If potential evaporation were an appropriate estimate of actual evaporation, as has been

Second International Colloquium onHydrology and Water Management in the Humid Tropics
314
suggested (Chang, 1993), Figure 8 indicates that no recharge would have occurred during the study period. As we shall show below, this is far from the case.
5.2 Interception of rainfall by coconut trees
Rain totals from the rain gauges distributed around the coconut trees (estimated canopy area 30 m2) were compared with the reference 200 mm rain gauge in the open. The results had awide range of variation in space and time. Some positions located directly below the crown of the tree indicated up to 270% increase in cumulative rainfall over that in the open, others in the open or at the edge of the canopy showed no change, while one beneath the central fronds collected 65% of cumulative open rainfall. The impact of the coconut tree vegetation on the cumulative rainfall is shown, in Figure 9, where the mean ratio of cumulative rainfall at a location to the cumulative rainfall in the open is plotted against distance of the gauge from the tree trunks.
0
20
40
60
80
100
120
8-Aug-96 5-Sep-96 3-Oct-96 31-Oct-96 28-Nov-96 26-Dec-96 23-Jan-97 20-Feb-97Date
Rai
n (m
m/d
)
Daily Rainfall Bonriki, Kiribati
Figure 6: Daily rainfall at the Bonriki site over the study period.

Second International Colloquium onHydrology and Water Management in the Humid Tropics
315
0
1
2
3
4
5
6
8-Aug-96 5-Sep-96 3-Oct-96 31-Oct-96 28-Nov-96 26-Dec-96 23-Jan-97 20-Feb-97 20-Mar-97
Date
Dai
ly P
ote
ntia
l Eva
po
tran
spir
atio
n (m
m/d
)
Potential Evapotranspiration
Figure 7: Calculated daily potential evaporation for the study period using Equation 13.
0
100
200
300
400
500
600
700
800
10-Aug-96 9-Sep-96 9-Oct-96 8-Nov-96 8-Dec-96 7-Jan-97 6-Feb-97 8-Mar-97
Date
Cu
mu
lativ
e R
ain
fall,
Po
ten
tial E
vap
ora
tion
o
r In
terc
epti
on
(mm
) ΣEp
ΣP
Cumulative Rainfall, Potential Evaporation and Interception
ΣEI
Figure 8: Cumulative daily rainfall, ΣP, potential evaporation, ΣEp, and interception ΣEi, for the study period.
It is obvious from Figure 9 that considerable concentration of rainfall can occur beneath the fronds close to the stem of coconut trees. Rainfall on the inner fronds is intercepted to feed

Second International Colloquium onHydrology and Water Management in the Humid Tropics
316
this crown flow, as evident in Figure 9. Close to the outer fronds, rainfall at the ground is either enhanced or depleted depending on drips from the near-vertical fronds, rainfall intensity and wind direction. The considerable enhancement of rainfall close to the tree trunk funnels water preferentially into the root zone of the coconut trees. This seems to be a survival strategy for coconut trees since it increases the local water flux close to the trees roots. Because the coral sands are highly permeable, this increased flux is essentially vertical and may allow recharging of the water table under rainfalls that would normally be re-evaporated from the soil or transpired by shallow-rooted under storey. The I-Kiribati people are well aware of crown flow and use it as a shower during heavier rainfalls.
At low daily rainfalls, initial interception of rain was observed at all locations beneath the canopy relative to those in the open. This loss is due to the wetting of fronds. Rainfall data was sorted on increasing daily rainfall and cumulative mass plots were constructed for small rainfalls. Rainfall data for all gauges beneath the canopy showed initial storage losses ofbetween 0.4 to 1.2 mm of rainfall. We conclude that there is an initial storage loss of about 0.7 mm from rainfall beneath palm fronds due to wetting of fronds. Table 2 summarises thethroughfall, stemflow and interception losses for the coconut trees for individual daily rainfalls. These values are much lower than those found for temperate forests. They were used to estimate interception losses shown in Figure 8 and amount to only 7.2% of total rainfall.
0.5
1.0
1.5
2.0
2.5
3.0
0 5 10 15 20
Distance from Trunks (m)
Cu
mu
lativ
e R
ain
fall
Rat
io
OpenOuter Fronds
Inner Fronds
Crown Flow
Ratio of Cumulative Rainfall under Canopy to Rainfall in Open
Figure 9: Ratio of cumulative rainfall at locations under the coconut palm canopy to cumulative rainfall in the open as a function of distance from the tree trunks. The canopy extended to 3.1 m.
Table 2: Summary of interception stores, stemflow, throughfall, and interception found for coconut trees, P is daily rainfall.

Second International Colloquium onHydrology and Water Management in the Humid Tropics
317
Property Value
Area of fronds (m2) 30
Palm frond interception storage (mm) 0.7 ±0.3
Area of crown (m2) 0.8
Total interception store (20% trees) (mm) 0.713
Palm crown interception storage (mm) 5.0
Stemflow (mm) 0.311(P-5)
Throughfall near crown (mm) 0.682(P-0.43)
Daily Interception losses from crown (mm) 0.01P + 1.85
From Table 2, we estimate that the interception losses from the crown of coconut trees are only 1% of daily precipitation plus 1.85 mm. The sparse planting of coconuts at the Bonriki reserve, covering about 20% of the area and the crown area of 0.8 m2 (only about 2.7% of the total canopy area) contribute to these low losses. In more densely planted areas, with over lapping canopies, both crown flow and losses will be more significant. Apart from the crown and the frond interception store of 0.7 mm, other canopy interception losses appear negligible. Given the upright architecture of coconut fronds, these results are expected (Fleming, 1993). These measurements should be repeated under more densely planted situations.
5.3 Transpiration losses from coconut trees
The sapflow sensors showed consistent results throughout the study period. No evidence of wound build up was observed either in the results or the trees themselves. Typical sap flows are shown in Figure 10 and the corresponding solar radiation is shown in Figure 11. The close correlation between sapflow and solar radiation is obvious. Days with small sapflow velocities and lower radiation corresponded to rain days. The results show an apparent, discernible sapflow over the nighttime period of about 4.5 L/h. This appears to be the limit ofdiscrimination of the system used. The total volume of daily water transpired was estimated from the sapflow data in Figure 10. The daily water use per coconut tree was found to lie in the range 60 to 155 L/d with a mean close to 120 L/d. The effective canopy area of the tree was approximately 30 m2. These losses therefore correspond to an average transpiration of 4 mm/d per tree.
The transpiration rate of 4 mm/d is close to the mean potential evaporation found for the study period (Table 1). This transpiration rate was noted to be independent of soil moisture status with a constant transpiration rate throughout the study period, even during the dry period. From this we conclude that the coconut trees were extracting water directly from the freshwater lens. It is estimated that the coverage of coconut trees on the freshwater lens is about 20% and the mean transpiration loss from the lens is about 0.8 mm/d. This corresponds to a withdrawal rate of 570 m3/d over the entire 71 ha of the freshwater lens, similar to the daily abstraction rate by pumping.

Second International Colloquium onHydrology and Water Management in the Humid Tropics
318
5.4 Soil Water Dynamics
The dynamics of soil water content to a soil depth of 0.7 m is given in Figure 12 for daily averaged water content. The minimum soil water store was 68.7 mm and the maximum daily soil water store to 0.7 m was 133 mm during this period. It can be seen that the profile responds rapidly to rainfall and drainage but there is a slower drying period. It was found that the maximum average change in soil water store depends strongly on averaging time, due to the large hydraulic conductivity of the soil (see Table 3). We estimate from these results that the mean non-drainable water content of the soil is 0.098 (m3/m3) and the maximum mean daily water content is 0.190 (m3/m3), while the maximum mean 15 minute water content is 0.276 (m3/m3). It appears that about 30 mm of rain are required in dry times, or an average water content of 0.13 (m3/m3) over the top 1 m of the soil before significant drainage commences. Coconut tree crown flow concentration of rainfall lowers this critical rainfall locally to about 11 mm.
Direct measurements of water content of the top 0.53 m of the soil gave volumetric water contents between 0.08 and 0.15 (m3/m3) and total porosities between 0.5 and0.7 (m3/m3). The maximum soil water content measured using the probes was 0.568 (m3/m3)when the water table rose to engulf the lower probes. This seems to indicate a porosity close to the measured porosity and a specific yield of about 0.47 (m3/m3).
The soil water probes revealed rapid wetting and draining of the profile during intense rainfalls. Rapid drainage occurred within 8 hours. This suggests that a simple bucket model may be appropriate for the soil water balance.
-0.2
0
0.2
0.4
0.6
0.8
1
1.2
1.4
30-Jan-97 4-Feb-97 9-Feb-97 14-Feb-97 19-Feb-97 24-Feb-97 1-Mar-97
Date
So
lar
Rad
iati
on
(kW
/m2)
Figure 10: Sapflow in a coconut tree during February 1997.

Second International Colloquium onHydrology and Water Management in the Humid Tropics
319
0
5
10
15
20
0 5 10 15 20 25 30
Days since start time (1010 on 30/1/97)
Sap
flow
(L/h
)
Coconut Tree Sapflow
Figure 11: Corresponding solar radiation for the sap flow results shown in Figure 10.
0
20
40
60
80
100
120
140
11-Nov-96 1-Dec-96 21-Dec-96 10-Jan-97 30-Jan-97 19-Feb-97 Date
So
il W
ater
Sto
re o
rD
aily
Rai
nfa
ll (m
m) Daily Soil Water Store to 0.7 m
Daily Rainfall
Figure 12: Change in amount of water stored in the soil to depth 0.7 m in responseto rainfall for daily averaged data.

Second International Colloquium onHydrology and Water Management in the Humid Tropics
320
Soil water profiles revealed that evaporation from the profile appeared to occur from the upper 0.5 m of the profile. The measured water loss due to soil evaporation from the soil above 0.5 m depth following a 22.4 mm rainfall is presented in Figure 13 together with the evaporation rate calculated from the smoothed data. The evaporation rate calculated from the soil water loss decreased from 1.2 to 0.4 mm/d. The results showed a square root time dependence of soil water loss, typical of direct soil evaporation. It was found that water loss via soil evaporation proceeded at about the potential rate for the rain day (t =0), followed by a decreasing rate which could be described by:
tEs /58.1= (16)
where t is the time (days) since rain.The daily soil water measurements provide valuable information on the recharge
process. Daily results for the deepest probe at 0.7 m are given in Figure 14. Soil water content at this depth remained essentially constant throughout the period of measurement except for the rainfall event on 15 February that caused the profile to wet up and drain at this depth. From this we conclude that all rainfall that fell during the period before 15 February was re-evaporated or transpired from the soil giving an average rainfall loss (interception plus soil evaporation) of 1.66 mm/d. When this is added to the mean transpiration from trees, assumed sourced from the ground water, averaged daily evaporation losses of 2.5 mm/d are estimated, about 2/3 of the potential losses in Table 1.
Table 3: Effect of averaging time on the average maximum change in soil water storeto 0.7 m
Averaging Time (hours) Average Maximum Change in Soil Water Store (mm)
0.25 139
6.0 100
24.0 64

Second International Colloquium onHydrology and Water Management in the Humid Tropics
321
0
2
4
6
8
10
0 2 4 6 8 10 12 14
Days Since 19/12/96
So
il W
ater
Lo
ss (m
m)
0
0.2
0.4
0.6
0.8
1
1.2
1.4
Eva
po
ratio
n R
ate
(mm
/d)
Cumulative Soil Water Loss
Evaporation Rate
Figure 13: Cumulative loss of water from the soil to a depth of 0.5 m over a drying period in late December 1996, and the calculated evaporation rate from the smoothed data.
5.5 Groundwater dynamics
The water table dynamics were measured at several widely separated pump stations across Bonriki Island. All wells monitored showed significant diurnal fluctuations due to tidal forcing of the freshwater lens. Figure 15 shows the impact of intense rains on the elevation of the water table. It is evident that almost instantaneous recharge occurs in these large events because of the limited storage capacity of the soil and its large hydraulic conductivity. The rapid decay in the peak of the groundwater elevation can be used to estimate the mean hydraulic conductivity of the aquifer (Chapman, 1985). From the data in Figure 15 we estimate the hydraulicconductivity to be about 5 m/d.

Second International Colloquium onHydrology and Water Management in the Humid Tropics
322
0
20
40
60
80
100
120
11-Nov-96 1-Dec-96 21-Dec-96 10-Jan-97 30-Jan-97 19-Feb-97
Date
Dai
ly R
ain
fall
(mm
)
0.08
0.1
0.12
0.14
0.16
0.18
0.2
So
il W
ater
Co
nte
nt (
m3 /m
3 )
Impact of Rainfall on Soil Water Content at Depth 0.7 m
Soil Water Content at 0.7 m
Figure 14: Impact of rain on the mean daily soil water content at a depth of 0.7 m. The profile at this depth only wets up and drains after 15 February 1997.
0.8
1.1
1.4
1.7
2
2.3
2-Apr-97 7-Apr-97 12-Apr-97 17-Apr-97 22-Apr-97 27-Apr-97 2-May-97
Date
Wat
erta
ble
Hei
gh
t (m
, arb
it d
atu
m
0
100
200
300
Cu
mu
lati
ve R
ain
(m
m)Watetable
Pump Station 16
Cumulative Rain
Figure 15: Change in groundwater height due to recharge events and tidal forcing.

Second International Colloquium onHydrology and Water Management in the Humid Tropics
323
Comparison of the groundwater tidal signal with the oceanic tidal signal at Betio(National Tidal Facility, Adelaide, Australia) provided information on the tidal efficiency (ratio of groundwater amplitude to tidal amplitude) and the tidal lag at each location. The results are given in Table 4.
Table 4: Tidal lags and efficiencies for the water table at different locations across Bonriki.
Pump Station Distance from ocean (m) Tidal Lag(h)
Tidal Efficiency(%)
PS 1 150 2.75 4
PS 16 280 2-2.25 6.6
PS 18 320 2.5 5
PS 7 420 2.5-3 4
It is clear from Table 4 that the tidal response of the freshwater lens is not governed by distance from the sea. The usual explanation for the independence of tidal lag or efficiency on distance from the ocean in coral atolls is due to the vertical propagation of tidal signal from the extremely permeable, underlying karstic limestone on which the coral sand aquifer is deposited (Wheatcraft & Buddemeier; Falkland & Woodroffe, 1997). It seems that this is certainly the case at Bonriki.
Water table drawdown due to groundwater pumping was a key concern to thetraditional owners of the freshwater reserve. Measurements of the response of the water table to turning the pumps on and off revealed a maximum drawdown of less than 20 mm much less than the average diurnal fluctuations.
5.5 Thickness of the freshwater lens
Electrical conductivity (EC) profiles in two salinity monitoring boreholes, one near the ocean-edge of the freshwater lens (BN1), the other near the centre of the freshwater lens (BN 16) were used to monitor the thickness of the freshwater lens (freshwater limit defined as EC = 2,500 µS/cm). The results of these measurements are shown in Figure 16. It is clear that the edge of the lens is more sensitive to recharge or water loss than the centre of the lens.
If we assume the decrease is approximately one dimensional at the centre of the lens, the data on the decrease in freshwater lens thickness at the centre of the lens in Figure 16, together with the specific yield, 0.47, can be used to estimate the mean loss rate from the lens. The decrease in freshwater lens thickness at the centre over the 194 day study period, 20 August 1996 to 28 February 1997 was 1.0 m and this corresponds to an average daily loss rate of about 2.4 mm/d. In this period, groundwater pumping accounted for about 1.4 mm/dand our estimates here are that extraction by phreatophytes amounts to about 1.0 mm/d. Given

Second International Colloquium onHydrology and Water Management in the Humid Tropics
324
the crudity of this estimate the agreement is satisfactory and suggests that outflow anddispersion losses may be relatively minor during dry times.
5.6 Groundwater elevation and mean recharge
Approximate estimates of mean annual net recharge can be found from the Dupuit-Forchheimerapproximation for the elevation of the middle of the freshwater lens, hm, above mean sea level for circular islands (Chapman, 1985):
2
)1(8
+=−
W
hKER m
g α(17)
where α , a dimensionless quantity, is related to the density contrast between fresh andseawater (≈ 37.1 for the South Pacific [Chapman, 1985]), K is the mean hydraulic conductivity of the freshwater lens in the horizontal direction, and W is the mean diameter of the island. For Bonriki, K ≈ 1,820 m/y, hm ≈ 1.0 m, W ≈ 800 m so that the mean net annual recharge rate is approximately 870 mm/y, close to the current estimate for recharge, 700 mm (Falkland & Brunel, 1993). This approximation must be considered, at best, a first order estimate ofrecharge. It assumes that the island is circular and the freshwater aquifer has uniform hydraulic properties over the island.
5
10
15
20
25
3011-Apr-95 28-Oct-95 15-May-96 1-Dec-96 19-Jun-97 5-Jan-98
Date
Len
s D
epth
(m)
Centre of Lens - BN16
Edge of Lens - BN1
Change of Lens Freshwater Depth
Figure 16: Change in the depth to the freshwater/saline water transition

Second International Colloquium onHydrology and Water Management in the Humid Tropics
325
in the freshwater lens due to evaporation and pumping.
5.7 Groundwater chemistry and recharge
Chloride has been used as a conservative tracer to estimate the mean recharge rate of small island ground waters (Ayers & Vacher. 1983). Care has to be taken, however, in the use of this technique because of dry deposition of salt from sea spray (Chapman, 1985). In Table 5, we compare the concentration of chloride in surface soil water with that at the top of the ground water during heavy rains (P>100 mm/d) to estimate the ratio of groundwater evaporation to recharge.
Table 5: Estimation of long-term mean net groundwater recharge from chloride concentrations using a mean annual rainfall of 2027 mm.
Attribute Mean Value Error Estimate
Chloride conc. in soil water (mg/L) 4.3 - (n=1)†
Chloride conc. in fresh surface ground water (mg/L) 12.6 2.1 (n=5)†
Ratio recharge to precipitation, (R-Eg)/P 0.34 0.06
Estimated Mean Annual Recharge, R-Eg (mm) 690 115
† n = number of measurements.
The net annual recharge estimated here is close to the estimate of 700 mm of Falkland (Falkland & Brunel, 1993), however it is emphasised that the estimate in Table 5 is based on only one estimate of soil water chloride concentration. It is emphasised here that the chloride balance technique assumes a long term steady state relation between rainfall and evaporation and the salinity in the groundwater is due to evaporation of infiltrated water, not mixing with underlying seawater. The extremely short residence time for water in the unsaturated soil zone, together with variable accumulation of salt spray from the sea mean that this technique is questionable in low coral islands.
5.8 Isotopic concentration and groundwater evaporation
The heavy, naturally occurring isotopes of water, 18O and 2H, concentrations found in 7 samples from the upper, freshwater portion of the centre of the lens (6 to 15 m) are shown in Figure 17, where they are compared with results from the mean tropical island meteoricrelationship (Scholl, et al., 1996):
97.317.6 182 += OH δδ (18)

Second International Colloquium onHydrology and Water Management in the Humid Tropics
326
The data in Figure 17 have similar slope but fall slightly below this line and fitted the relationship:
31.193.5 182 −= OH δδ (19)
Direct evaporation from the freshwater lens should result in significant concentration of heavy isotopes that would result in values above the mean tropical island line. In Figure 17, the data fall slightly below the tropical meteoric line and show that there is no significant direct evaporation from the shallow water table in the freshwater lens.
-50
-40
-30
-20
-10
0
10-8.0-6.0-4.0-2.00.0
δδ18O(%o)
2 H (
%o)
Tropical Meteoric Line
Figure 17: The relation between 2H and 18O concentrations in the freshwater lens, compared with the tropical island meteoric line.
6 GROUNDWATER RECHARGE ESTIMATION
The results in this work can be used to construct a simple, daily water balance model to estimate recharge. The elements of this model, for daily rainfalls, are: appropriate rules for interception losses from vegetation so that daily rains of 0.7 mm or less never reach the soil store; appropriate rules for the interception losses from coconut trees taking account of the fractional area covered by crowns (see Table 2); a non drainable soil water store of 130 mm for the top 1 m of the coral sands; soil evaporation proceeding at the potential rate for the day

Second International Colloquium onHydrology and Water Management in the Humid Tropics
327
of rain followed by a decreasing, square-root time relation for following days (Equation 16); and coconut trees evaporating ground water at the potential rate irrespective of the soil water status, taking account the fractional area covered by trees. Using these the daily water balance for the study period, excluding groundwater pumping, is shown in Figure 18.
-200
0
200
400
600
10-Aug-96 14-Sep-96 19-Oct-96 23-Nov-96 28-Dec-96 1-Feb-97 8-Mar-97
Date
Cum
ulat
ive
Rai
nfal
l, E
T, a
nd
Net
Rec
har
ge(
mm
)
-20
0
20
40
60
80
100
120
140
So
il W
ater
Sto
re(m
m)
ΣΣ ETΣΣ P
ΣΣ (R-Eg)
∆∆ S
Figure 18: Daily water balance components (excluding groundwater pumping) for the study period showing measured cumulative rainfall, ΣP,change in the soil water store to 1 m, ∆S, evapotranspiration losses, ΣET (=Σ[Ei + Es + Eg] ), and net recharge, Σ(R-Eg).
It can be seen in Figure 18 that significant net recharge did not occur until the end of the study period clearly indicating that this was a dry period. The role that soil water store plays in moderating recharge can be seen for the 64 mm rainfall event on 24 October 1996. While some 15 mm of recharge occurred in this event, 48 mm went to filling the depleted soil store.
The estimated total evapotranspiration loss for the study period was 513 mm, only66.8% of the potential evaporation, 767 mm. This suggests that equilibrium evaporation may be a better estimate of total evaporative losses than potential evaporation. The total recharge to the ground water was estimated to be 255 mm, 42% of total rainfall. However, the persistent groundwater evapotranspiration losses reduced this to a net recharge of 102 mm, some 17% of total rainfall. With a larger coverage of coconut trees, net recharge would be even smaller.
7 CONCLUSIONS

Second International Colloquium onHydrology and Water Management in the Humid Tropics
328
This study has sought to quantify the groundwater recharge of freshwater lenses in small, low, coral islands by measuring or estimating components of the water balance at Bonriki Island, Tarawa atoll, the Republic of Kiribati. The novel features of this work were the measurement of throughfall, stemflow and the estimation of interception losses of coconut trees, the direct measurement of transpiration by coconut trees and changes in the soil water store in the top 0.7 m of the profile. These were coupled with measurements of the climatic drivers ofevapotranspiration, the water table height and the thickness of the freshwater lens.
It was found that the interception storage and interception losses from coconut trees are quite small in the sparsely treed situation at Bonriki, with losses about 7% of total rainfall. This is in sharp contrast to sometimes 50% losses found in temperate areas with lower rainfall intensities, but is consistent with findings in other tropical forests (Bonell & Balek, 1993; Fleming, 1993). Preferential flow from the crown of the coconut palm was substantial, again consistent with findings from tropical forests (Fleming, 1993). Crown flow increased cumulative throughfall by up to 270% of the above canopy precipitation. Because of the high permeability of coral sands, this crown flow appears to be a strategy for funnelling modest rainfalls, which would otherwise be re-evaporated from the unsaturated zone, to the water table. It is suggested that in coral atolls, low interception losses and crown flow may be a survival strategy for coconut trees in dry periods. It is only when the trunks of trees are vertical, that stemflow is important. It is recommended that measurements of throughfall, crown flow and stemflow should be repeated for higher density plantings where interception losses may be moresubstantial.
Direct measurement of sapflow in coconut trees revealed that solar radiation is the key determinant of transpiration. This transpiration proceeded at a rate close to the potential rate and independent of the soil water content. From this we conclude that the coconut palm was extracting water from, or close to, the water table. This makes coconut trees key users of groundwater from freshwater lenses. Their density of planting therefore is an importantdeterminate of sustainable pumping rate for groundwater extraction from freshwater lenses (Falkland & Brunel, 1993). For the estimated 20% coverage of trees at Bonriki, directtranspiration losses accounted for about 0.8 mm/d.
Measurements of the changes in soil water storage revealed the rapid wetting and draining of coral sands. Estimates of the maximum soil water storage available are therefore strongly dependent on the averaging time. The maximum storage for 15 minute averaging was more than twice that for a 24 hour average. On a daily basis, the maximum nondrainable soil water store to 1.0 m before drainage occurred was 130 mm and the minimum soil water store found during the measurement period was 98 mm. In dry times, daily rainfalls exceeding 20 mm are required before recharge commences. Soil probes at 0.7 m provided direct evidence of recharge. Measurements of the drying of the soil following non-recharge-producing rainfall gave valuable data on the soil evaporation process. Soil evaporation proceeded at about thepotential rate for the day on which rain fell, followed by an evaporation rate which decreased as the square root of time since rain fell. Mean, direct soil water evaporation for periods with non-recharge-producing rainfalls was estimated to be about 1.7 mm/d.
Measured groundwater table elevations also showed rapid response to recharge during significant rainfall events. In addition, tidal fluctuations in watertabe elevation, showed little dependence on distance from the edge of the island and had a mean tidal efficiency of 0.05. This is consistent with the long-established model that tidal signals are propagated vertically from the karstic limestone beneath the coral sand aquifer rather than horizontally through the

Second International Colloquium onHydrology and Water Management in the Humid Tropics
329
aquifer from the edge of the island. The maximum drawdown due to pumping from thehorizontal infiltration galleries was found to be less than 20 mm, five times less than the average daily tidal-forced groundwater fluctuation. A first order estimate of recharge from the mean groundwater elevation at the centre of the lens suggests a mean annual net recharge rate of approximately 870 mm/y.
The freshwater lens decreased in thickness over the study period. The decrease in the centre of the lens was 1.0 m which, when pumping losses were taken into account, suggested direct transpiration losses of about 1 mm/d, consistent with the direct transpirationmeasurements. Chloride concentrations in the upper soil water and at the water table surface were also used to estimate mean annual recharge. Assuming chloride is a conservative tracer, it was estimated that mean annual net recharge was 34% of net precipitation, about 690 mm/y. This is consistent with existing estimates (Falkland & Brunel, 1993). Groundwaterconcentrations of the heavy water isotopes 2H and 18O in the upper freshwater part of the lens were close to and slightly below the tropical meteoric line, indicating that there is no significant, direct evaporation from the freshwater lens.
Using the above findings a simple water balance model was constructed which took into account interception losses, soil evaporation, transpiration from ground water and changes in soil water storage. From the model, the total evapotranspiration losses over the study period were about 2/3 of the potential evaporation. This suggests that equilibrium evaporation may be a more appropriate estimate for evapotranspiration from small coral islands, a finding consistent with results in other tropical areas (Viswanadham, Filho & André, 1991). Significant decrease in soil water content occurred during the measurement period and recharge did not occur until the end of the study. In total, 102 mm of net recharge was estimated due to rain falling at the end of the period. This was only 17% of rainfall and was consistent with the soil watermeasurements during this dry period. The model may be used to determine the averagerecharge rate, to assist in estimating the sustainable groundwater abstraction rate and to help identify reserve management strategies.
8 ACKNOWLEDGMENTS
This work was initiated as part of the UNESCO-IHP Humid Tropics Programme andadministered through the UNESCO Office for the Pacific States, Apia, Samoa, and the South Pacific Applied Geoscience Council (SOPAC), Suva, Fiji. The support of UNESCO-IHP,SOPAC, the Government of the Republic of Kiribati Public Works Department and Public Utilities Board, the Water Research Foundation of Australia, the Centre for Resource andEnvironmental Studies (CRES), Institute of Advanced Studies, Australian National University (ANU), and ACTEW Corporation are gratefully acknowledged. The authors thank Tekena Teitiba, Deputy Director, Meteorology Division, Republic of Kiribati for provision of data, Dr Fred Ghassemi, CRES, ANU, and Mr David Scott, SOPAC, for helpful comments on this manuscript.
9 REFERENCES
Anthony, S.S., 1992. Electromagnetic methods for mapping freshwater lenses on Micronesian atoll islands. J. of Hydrol., 137, 99–111.

Second International Colloquium onHydrology and Water Management in the Humid Tropics
330
Ayers, J.F. and H.L. Vacher, 1983. A numerical model describing unsteady flow in a fresh water lens. Water Res. Bull., 19, 785–792.
Badon Ghijben (Ghyben), W., 1889. Nota in verband met de voorgenomen putboring nabij Amsterdam. Tijdschrift het Koninkliijk Instituut voor Ingenieurs, the Hague, 8–22
Blake, G.J., 1975. The interception process. In: T.G. Chapman and F.X. Dunin (eds.). Prediction in Catchment Hydrolgy. Australian Academy of Science, Canberra, pp 59-81.
Bonell, M., 1993. Progress in understanding runoff generation dynamics in forests. J. Hydrol.,150, 217–275.
Bonell, M. and J. Balek, 1993. Recent scientific developments and research needs in hydrological processes of the humid tropics. In: Hydrology and Water Management in the Humid Tropics, M. Bonell, M.M. Hufschmidt and J.S. Gladwell (eds). Cambridge Univ. Press–IAHS, Cambridge, England, pp 167-260.
Brutsaert, W.H., 1982. Evaporation into the Atmosphere. Theory, History and Applications. D. Reidel Publishing Co., Doredecht, Holland, 299 pp.
Brutsaert, W.H., and H. Stricker, 1979. An advection–aridity approach to estimate actual regional evapotranspiration. Water Resour. Res., 15, 443–450.
Chang, J.H., 1993. Hydrology in the humid tropical Asia.In: Hydrology and Water Management in the Humid Tropics, M. Bonnel, M.M. Hufschmidt, and J.S. Gladwell (eds). Cambridge Univ. Press–IAHS, Cambridge, England.
Chapman, T.G., 1985. The use of water balances for water resource estimation with special reference to small islands. Bulletin No. 4. Pacific Regional Team. Australian Development Assistance Bureau, Canberra, Australia., pp 34.
Cole, J.E., Fairbanks, R.G., and G.T. Shen, 1993. Recent variability in the Southern Oscillation: Results from a Tarawa Atoll Coral. Science, 260, 1790-1793.
Davies, J.A., and C.D. Allen, 1973. Equilibrium, potential and actual evaporation from cropped surfaces in southern Ontario. J. Appl. Meteorol. 12, 649–657.
Denmead, O.T., and I.C. McIroy, 1970. Measurements of non–potential evaporation from wheat. Agric. Meteorol., 7, 285–302.
Dillon, P., 1997. Groundwater pollution by sanitation in tropical islands. UNESCO IHP-V,Project 6-1, Technical Documents in Hydrology, No. 6, UNESCO, Paris, 34 pp
Dunin, F.X., White, I., and O.T. Denmead, 1999. Conservative water use by eucalypts. J.Hydrol. (submitted). Cambridge Univ. Press–IAHS, Cambridge, England, pp 55-66.
Falkland, A.C., 1983. Christmas Island (Kiritimati) water resources study. Hydrology and Water Resources Unit Report No. HWR 83/03, Department of Housing and Construction, prepared for Australian Development Assistance Bureau.
Falkland, A.C., 1988. Water resource and management study, Cocos (Keeling) Islands. Report No. 88/12. Hydrology and Water Resources Section, ACT Electricity and Water, Canberra, Australia.
Falkland, A.C., 1990. Groundwater resources study, Warraber and Yorke Islands, Torres Strait. Report No. 90/1. Hydrology and Water Resources Section, ACT Electricity and Water, Canberra, Australia.
Falkland, A.C., 1992. Review of Tarawa Freshwater Lenses, Republic of Kirabati. Australian International Development Assistance Bureau. Report No. HWR 92/682. Canberra Australia, 73 pp.

Second International Colloquium onHydrology and Water Management in the Humid Tropics
331
Falkland, A.C., 1992. Review of groundwater resources on Home and West Island, Cocos (Keeling) Islands. Report No. 92/1, Hydrology and Water Resources Section, ACT Electricity and Water, Canberra, Australia.
Falkland, A.C., 1993. Water resources assessment, development and management of small coral islands. Regional Workshop on Small Island Hydrology. Batam Island, Indonesia. 16–19 February 1995, 26 pp.
Falkland, A.C., 1999. Tropical Island Hydrology and Water Resources: Current Knowledge and Future Needs. Second International Colloquium on Hydrology and Water Management in the Humid Tropics. Panama, 22-25 March, 1999. UNESCO-IHP and CATHALAC, Panama City.
Falkland, A.C., and J.P. Brunel, 1993. Review of hydrology and water resources of the humid tropical islands. In: Hydrology and Water Management in the Humid Tropics, M. Bonell, M.M. Hufschmidt and J.S. Gladwell (eds). Cambridge Univ. Press–IAHS,Cambridge, England, pp 135-163.
Falkland, A.C., and C.D. Woodroffe, 1997. Geology and hydrogeology of Tarawa and Christmas Island, Kiribati. In: H.L..) Geology and Hydrogeology of Carbonate Islands, Vacher and T. Quinn (eds ), Chapter 19. Elsevier Science BV, Netherlands, pp 577-610.
Fleming, P.M., 1987. The role of radiation estimation in the areal water balance in tropical regions, a review. Arch. Hydrobiol. Beih., 28, 19–27.
Fleming, P.M., 1993. The impact of land-use change on water resources in the tropics: An Australian view of the scientific issues. In: Hydrology and Water Management in the Humid Tropics, M. Bonell, M.M. Hufschmidt and J.S. Gladwell (eds). Cambridge Univ. Press–IAHS, Cambridge, England, pp 405-413.
Ghassemi, F., Jakemann, A.J., and G.J. Jacobsen, 1990. Mathematical modelling of sea water intrusion, Nauru Island. Hydrol. Processes, 4, 260–281.
Giambelluca, T.W., Nullet, D., and M.A. Nullet, 1988. Agricultural drought on South–Central Pacific islands. Prof. Geog., 40, 404–415.
Griggs, J.E., and F.L. Peterson, 1989. Groundwater flow and development alternatives: a numerical simulation of Laura, Majuro atoll, Marshall Islands. Tech. Report No. 183. Water Resources Research Centre, University of Hawaii.
Herzberg, A., 1901. Die Wasserversorung einiger Nordseebäder. Jour. für Gaseleuchtung und Wasserversorung, München, 44, 815–819; 45, 842–844.
Hunt, C.D. and Peterson, F.L. (1980). Groundwater resources of Kwajalein Island, Marshall Islands. Tech. Report No. 126. Water Resources Research Centre, University of Hawaii., 91 pp.
McNaughton, K.G., and P.G. Jarvis, 1983. Water Deficits and Plant Growth, Vol VII. Academic Press, London, pp 1–47.
Mather, J.D., 1973. The groundwater resources of Southern Tarawa, Gilbert and Ellice Islands. Hydrogeological Department, Institute of Geological Sciences, U.K., 54 pp.
Nullet, D., 1987. Water balance of Pacific atolls. Water Resour. Bull., 23, 1125–1132.Oberdorfer, J.A., and R.W. Buddemeier, 1988. Climate change: effects on reef island
resources. Sixth International Coral Reef Symposium, Townsville, Australia, 3, 523–527.
Oberdorfer, J.A., Hogan, P.J., and R.W. Buddemeier, 1990. Atoll island hydrogeology: Flow and freshwater occurrence in a tidally dominated system. J. Hydrol., 120, 327–340.

Second International Colloquium onHydrology and Water Management in the Humid Tropics
332
Penman, H.L., 1948. Natural evaporation from open water, bare soil and grass. Proc. Roy. Soc. London A193, 120–146.
Peterson, F.L., 1991. Recent advances in atoll hydrology. In: Groundwater in the Pacific Rim Countries. H.J. Peters (ed). Amer. Soc. Civil Engng. pp. 2–8.
Priestley, C.H.B., 1959. Turbulent Transfer into the Lower Atmosphere. University of Chicago Press, Chicago, Ill., 130 pp.
Priestley, C.H.B., and R.J. Taylor 1972. On the assessment of surface heat flux and evaporation using large–scale parameters. Monthly Weath. Rev., 100, 81–92.
Scholl, M.A., Ingebrutsen, S.E., Janik, C.J., and J.P. Kauahikaua, 1996. Use of precipitation and groundwater isotopes to interpret regional hydrology on a tropical volcanic island: Kilauea volcano area, Hawaii. Water Resources Res. 32, 3525-3537.
Slatyer, R.O., and I.C. McIlroy, 1961. Practical Micrometeorology. CSIRO, Melbourne, Australia, 310 pp.
Topp, G.C., Davis, J.L., and A..P. Annan, 1980. Electromagnetic determination of soil–watercontent in coaxial transmission lines. Water Resour. Res., 16, 574–582.
Underwood, M.R., Peterson, F.L., and C.I. Voss, 1992. Groundwater lens dynamics of coral atolls. Water Resour. Res., 28, 2889-2902.
UNESCO, 1991. Hydrology and water resources of small islands, a practical guide. Studiesand Reports on Hydrology No. 49, A.C. Falkland and E. Custodio (eds) UNESCO Paris, France. 435 pp.
Viswanadham, Y., Silva Filho, V.P., and R.G.B. André, 1991. The Priestly-Taylor parameter,α, for the Amazon forest. Forest Ecol. and Manag., 38, 211-225
Voss, C.I., and W.R. Souza, 1987. Variable density flow and solute transport simulation of regional aquifers containing a narrow fresh–water–saltwater transition zone. WaterResour. Res, 23, 1851–1866.
Wheatcraft, S.W. and R.W. Buddemeier, 1981. Atoll island hydrology. Ground Water, 19,311–320.
Whitaker, F.F., and P.L. Smart, 1997. Water resources assessment, development and management in the Bahamas. In: Geology and Hydrogeology of Carbonate Islands, H.L. Vacher and T. Quinn (eds.), Chapter 4. Elsevier Science BV, Netherlands, pp 163-216.
White, I., 1996. Fresh groundwater lens recharge, Bonriki, Kiribati: Preliminary report. UNESCO IHP-V, Project 6-1, Technical Documents in Hydrology, No. 5, UNESCO, Paris, 34
White, I., and S.J. Zegelin, 1995. Electric and dielectric methods for monitoring soil–watercontent. In: Handbook of Vadose Zone Characterisation and Monitoring, Wilson, L.G. Everett, L.G. and S.J. Cullen (eds). Lewis Publishers, Ann Arbor, MI, pp. 343–385.

Second International Colloquium onHydrology and Water Management in the Humid Tropics
333
Ecohydrology and Tecto-Genesis ofSmall Islands in Indonesia
P.E. Hehanussa Indonesian Institute of Sciences (LIPI), Kompleks LIPI, Cibinong, 16911 Indonesia
ABSTRACT
Indonesia is an archipelagic nation comprised of some 60% of the 17,508 islands of the Indonesian Archipelago. The water resource potentials are relatively high in this humid tropic region but several overpopulated islands have suffered from water scarcity. The tectonically complex history of the islands creates large differerences between one row and another row of islands. Studies on these rows of islands reveal that the tecto-genesis left a clear signature on the geohydrological characteristics of each island. This paper discusses results of severalecohydrological studies in the small islands of Indonesia and their relevant water resource potentials. Based on the studies it is proposed that besides the conventional concept of ‘one river basin one management plan’, each island within a size range of 200 – 2,000 km2 should become the basis for a sustainable water resource development plan, and become a ‘one islandone management plan’.
1 INTRODUCTION
The Indonesian archipelago consists of 17,508 large, small, and very small islands spreading between 95 to 138o, E and 6o N to 11o S along the tropical equator. The Indonesian nation comprises some 60% of these islands. Many other nations in the Circum-Pacific region, such as the Philippines, Papua New Guinea, Japan, New Zealand, Singapore and Fiji are also comprised of islands. Water resources of these small islands are naturally restricted when compared to the larger continental areas. This forum is an important media for the exchange of experiences in the identification, planning, management, and evaluation of the fragile fresh water resources of small islands, as well as for the proposal to promote small islands or a single island as a unit system for water resources management.
Fresh water resources on small islands are certainly restricted, there may be some surface water in small basins that can greatly fluctuate with the season, or there may exist rich ground water for instance in old and extinct volcanic islands or in multiple uplifted coral terracesislands. Other sterile islands may have no fresh water sources except for that from rainwater harvesting. In general water resources on small islands differ from the large continental areas where the water cycle has a longer replenishment time as well as a longer path for the quality to be altered by surface and underground actions. Besides the conventional and already popular concept of ‘one river one management plan’, these small island units have been proposed (Hehanussa, 1988, 1993) for consideration as ‘one island one management plan’.
Small islands have recently been defined by IHP-UNESCO as islands with an area of less than 2000 km2 or islands with a width of less than 10 km. This shows an evolution in the two decades of intensive island studies where the size limit was first put at 10,000 km2 then

Second International Colloquium onHydrology and Water Management in the Humid Tropics
334
went down to 5,000 km2 further down to 1,000 km2. Later studies show that based on field experience islands with an area of 2,000 km2 do not differ substantionally from those of 1,000 km2 (Falkland, 1991). In the Pacific region there are thousands of politically and economically important smaller islands. For those the classification for very small islands was defined as those islands with an area of less than 100 km2 or a width not greater than 3 km (Dijon, 1984).Other bases of approach have been proposed including demographic aspects such as islands with more than 500,000 population, but for ecohydrologic perspectives described in this paper, these criteria are not taken into consideration.
Of the 17,000 islands of the Indonesian archipelago, only 116 islands are consideredlarge by definition, e,g., Kalimantan (747,000 km2), Sumatera (474,413 km2), Sulawesi(187,078 km2), Java (133,018 km2), Ceram (18,000 km2), or Bali (5,655 km2). Most are small islands and very small islands, some of which are of great importance because they have been developed into industrial, petroleum, petrochemical, agriculture, urban, for touristicattraction, as well as because of their strategic positions. With the exception of many barren islands, the water resource potentials on most of these small and very small islands are limited, determined basically by their position in the climatic province, the geohydrology, their ecology,and their tecto-genetic or geologic structure. Natural water sources may be directly fromprecipitation water, surface water, or ground water. In many cases, surface water, including springs and seepages, are the most important water sources on small islands. Desalination and water imports are rare and mainly restricted to commercialized islands. Water availability on these islands are sensitive to anthropogenic changes such as a sudden change in land cover, land use, socio-demographic structure, pollution, pumping exceeding extraction limits, and probably to global changes especially those related to sea level rise.
Because of their limited size, groundwater reservoirs of the islands are naturally small, they are surrounded and underlain by a salt water zone. The Ghyben Herzberg equation that governs the balance between salt and fresh water provides an understanding of theirinteractions. The composition of this generally unstable system is a potential for salt waterencroached that can be triggered by uncontrolled pumping. Traditional uses and practices of water exploitation on several islands has had to evolve due to great pressures of rapidpopulation growth and in several cases by industrial, agricultural, and touristic developments.Based on the inherent physical limitations, it is essential that each populated small island make and have their water resource management plan include a clear measure of its (water) carrying capacity.
2 TECTO-GENESIS OF SMALL ISLANDS
The geography and the tectonic regime of the Indonesian archipelago is unique. It is formed by the conjunction of three major tectonic plates: the Pacific, Indian-Australian, and Eurasianplates. Perpendicular and oblique inter-plate conjunctions as well as strike slip faults complicate the junctions, simultaneous with the existence of minor plates, creating specific rows of islands.It is part of the larger ‘Pacific Ring of Fire’, distributed throughout Indonesia, the Philippines, Japan in the north, to Kamchatka, to the west coast of American continent, and New Zealand in the south. These mountain arcs and their volcanic chains are important land barriers that modify the flow of air, and have left their impacts on the local hydrologic cycles.
This tectonic orogenesis and the resulting evolution of the lithosphere have their marks on the island types, the soil, morphology, geology, and the water availability for human life.

Second International Colloquium onHydrology and Water Management in the Humid Tropics
335
Nearly all of the major Indonesian islands Quaternary history, sediments and volcanics are those where most of the people are living. It is this tecto-genesis fingerprint that greatlydetermines the water availability of an area. Based on this background it was determined that the tecto-genesis is an important criterion, and was chosen as the preliminary basis upon which to evaluate water potentials of an island. The Indonesian islands were then first classified bytwo morphological feature and then, secondly, on their geohydrological characteristics such as flat islands comprised of:
• Alluvial islands,• Coral islands,• Atoll islands.
or mountainous islands comprised of :
• Volcanic islands, • Tectonized islands,• Uplifted terraces islands, • Monadnocks,• Combinations of the above
Flat islands have, in most cases, rather limited water resources. But they can be rich in brackish and salt-water biodiversity. Many of the islands that developed in the broad and flatcoastal plain of Sumatra, Kalimantan, and Irian Jaya Islands and in the shallow sea facing deep waters in eastern Indonesia are comprised of these types of islands. Mountainous islands are more variable, they may be remnants of older rock structure, they can be the result ofQuaternary tectonic movements which is not only uplifting but also shear and high angle faulting, as well as new and old volcanoes developed in the marine environment.
Alluvial islands are usually located in the estuaries of large rivers and may be partially comprised of mangrove forests. The shape of the estuary together with the relative position of the river bed are key factors for water resources exploitation. The island lithologies are composed of well sorted mouth bar sands and silts at the interchannel deposits. Examples are Rupat, Musi, Barito, and Kolepom islands. Coral islands are formed by clastic and bioclastic sediments. The permeabilities in most cases are high and rainwater will often disappear and mix with the underlying saline water. With a uniform, low permeability and impervious underlying bedrock they may create groundwater reservoirs. Examples are Pari, Sepermonde, and Tukangbesi islands. Atoll island are composed of bioclastic overlying corals in living position,and in most cases have very limited water resources. The elevations of these kinds of islands seldom exceed ten meters above the high tide. Examples are Owi and Takabonerate islands.
Mountainous islands have more variation in their genesis. They may be the product of volcanic activities resulting from tectonic movements, uplifting or emerging coral terraces, or they may be remnants of submerged morphologies. Volcanic island are numerous in Indonesia,some of them build from the very deep-sea bottom of the 6,000 m Banda Sea, or they may emerge from deep underwater calderas such as Krakatau Island. These types of islands are located in the row of the volcanic chain of Indonesia. Volcanoes that are ‘young’ have less groundwater water potentials compared to the ‘older’ ones where soil and forest formation has affected the hydrologic cycle components. Examples are Krakatau, Togian, Manuk, Api, Siau,

Second International Colloquium onHydrology and Water Management in the Humid Tropics
336
and Ternate islands. Tectonized islands are located outside of the volcanic chain of islands.Many of them have an elongated shape along their tectonic sutures, have steep slopes and are easily eroded along the highly faulted formations. Examples are Nias, Siberut, Moa, Babar, and Salebabu islands. Uplifted terrace islands are made up of a set of step-like morphologies that may contain groundwater pockets and reservoirs overlying impermeable basement rocks.Based on their water availability, many of them are populated and have developed agr iculturaland urban centers. Several examples are Ambon, Biak, Tual, and Rote islands. The rows of monadnock islands are located inside the volcanic chain along the more ‘stable’ tectonic region.They are made up of older sedimentary, metamorphic, and batholitic rocks and have shorelines that resemble emerged type coastal plain. Water resources are mainly surface water that has to be collected in man-made reservoirs during the rainy seasons. Ground water is limited to the shallow type and is easily polluted. The row of Singapore, Batam, Bintan, Bangka and Sananaislands are examples of these types of islands. The last group of islands is a mixture of above-mentioned types. They may be a mixture between basement, volcanic, and uplifted terraces such as Nusalaut Island, or they may be mixture between tectonized and uplifted terraces such as Moa Island.
3 NOVEL ECOHYDROLOGICAL NOTES
Ecohydrology is defined as the study of hydrological processes in relation to the biologicaldynamics in spatial and time dimensions. The tropical climate of Indonesia with its high rainfall is the main source of the rich biodiversity. This type of ecosystem composition very much determines the hydrologic cycle components related to the water balance of the island. Due to abundant water availability on several types of islands these islands become places of interest for plantation and urbanization. But the natural dynamics of the ecosystem have increasingly been disturbed over the last hundred years or so with increasing anthropogenic changes such as forest clearing, transformation to agricultural land, new urban coverage, plantation areas, open pit mining, fisheries, as well as other civil structures. These anthropogenic changes alter the water cycle path, its components and its availability, affecting the yearly pattern of the whole cycle. Some of these changes have been wisely ‘controlled’ by local traditional wisdomfollowed by the local people in the past, that have sets of restrictions and prohibitions as well as taboos.
Field studies on small islands consist of activities such as collection of local climatic data observations, geohydrological mapping, surveys on urban and village distribution, geo-bio-physical observations, and several detailed field measurement and samplings. Geohydrological mapping is done by field surveys, measurements, and mapping. General geo-bio-physicalobservations are done on the morphology and composition of their land cover and whether they are still covered by primary forest, plantations areas, types of land use changes, quantity and quality fluctuations of ground water and springs, type of plant cover in valleys and lowland areas which usually contain shallow ground water, and water availability and distributionsystems in villages. Field observations may consist of physical and chemical measurements on the spring water, ground water, and surface water if they exist. Several auger boring and geo-electric measurements have been executed to explore groundwater reservoir parameters,bedrock depths, and the la teral morphological trends of the underlying basement rocks.

Second International Colloquium onHydrology and Water Management in the Humid Tropics
337
Table 1: Island types and water potentials of small islands in Indonesia.
Island type Surface water Ground water Example(island)[1] Alluvial islands medium low – medium Musi, Kolepom
[2] Coral island very low – low low Pari,Sepermonde
[3] atoll island very low – low very low Owi,Takabonerate[4] Volcanic island very low – high medium – high Krakatau, Api
[5] Tectonized island medium low – medium Nias, Mentawai
[6] Uplifted terraces island medium – high medium – high Kei, Biak[7] Monadnocks low – medium low – medium Batam,
Sanana[8] Combinations medium – high medium Nusalaut, Ambon
Field surveys on many small islands during 1973 – 1998 were concluded with island typing that was grouped based on the water availability potentials as presented in Table 1.Alluvial islands are low-lying, many of them are covered by mangrove forests, they may consist of seasonal wetland, and don’t have great attraction for permanent urban dwellings except a few who are the ‘sea people’ who build their houses on long poles near deep estuaries. Fishing communities only temporarily use many of the atoll and coral islands. Young volcanic islands such as Krakatau volcano seldom have any permanent population because in most cases the slopes are barren, with rocks made up of coarse volcanic boulders and sand that is so highly pervious that rain water will directly disappear into the depth. Older volcanic islands such as Ternate Island have developed erosional valleys and gulleys and have transported some sediments into the lower foothills so that with soil development pioneer forest areas exist.Springs and water resources are abundant. This has great attraction for people to live on.Tectonized islands, or as known popularly as the ‘outer islands’, face the open sea and are inhabited by those who mainly live in or depend on the forest ecosystem. Primary forests cover most of them, and slope stability is low. Thus, forest clearing carries a high risk of causing landslides. The ‘inner islands’ are monadnock islands that are made up of steep and highly sinuous shorelines. Many of these islands composed of metamorphic, batholitic rocks, or highly folded sedimentary rocks. Surface water availability is more predominant than ground water.Because of their geographic positions, several of these islands such as Batam and Bintan have developed into important industrial, touristic, and other economic centers.
Ecohydrological observations on several small islands will be explained shortly. Alluvialislands are usually located at the estuaries of large rivers along flat coastal plains. In most cases they comprise of mangrove ecosystems. The geometry of the estuaries range between a wide to narrow ‘V’ shape, which together with the tidal range determine the salt and brackish water dynamics of the area. The low and wetlands between the (often braided) river channels and the distribution of plant types and cover are governed by the water dynamics of the area.Examples are Rupat, Delta Musi and Kolepom islands. Coral and atoll islands are important traditional fisherman temporal ports. The mangrove composition is more uniform and usually dominated by salt water types. Water availability is restricted and rainwater harvesting is an

Second International Colloquium onHydrology and Water Management in the Humid Tropics
338
important water source. Coconut trees and plantations are often alternative water sources. On several plantation islands water has to be imported from adjoining islands.
Volcanic islands are an interesting island type for ecohydrological studies. Theyrepresent a wide variety, determined by the age of the volcano. Krakatau Island in the Sunda Strait, which now stands 290 m above sea level, has emerged as the result of repeatedpyroclastic explosions from an old caldera 300 m below sea level that was the result of a giant explosion in 1883. It is considered to be a ‘new’ volcanic island. Pioneer plant occupation of the island has been studied, differing substantionally from pioneer plant succession in deltaic or coastal areas on the mainland. There are no inland plant sources, so all the seed sources are either from the sea or airborne, or accidentally brought in by people. The rock type iscomposed of lava flows and pyroclastics; there is no surface water or ground water in the area.An example of another type of ‘older’ volcanic island is Api Island in the Banda Sea in eastern Indonesia. This is a high-rise volcano that stands only about 400 m above sea level but actuallyhas grown up from the bottom of the 6,000 m deep Banda Sea. The island has developed a variety of biodiversity, fauna and flora, but still has no sign of surface or ground water. Older volcanic islands such as Ternate Island in the Moluccas have developed gulleys and erosion valleys along their slopes where surface water and ground water is observed and supported the live of this old kingdom town.
Uplifted terrace islands are of interest because many of them have no surface water but rich in ground water. Ambon, Nusalaut, and Biak Islands in eastern Indonesia are examples.Biak Island, which faces the Pacific Ocean, is made up of an impervious water basementcovered by sets of uplifted coral terraces. It is narrow in the north but broader in the southernpart of the island. During World War II this island was a strategic site for both sides, based on the fact that it is surrounded by deep sea and is ringed by coral reefs. It has many broad flat areas and many cliffs and caves. Most important, it contains a source of rich and good quality fresh water.
4 WATER RESOURCES AND PEOPLE
The traditional water sources in small islands are:
• Rainwater harvesting, • Surface water from rivers and lakes, • Springs,• Tidal springs along the low tidal shore, • Dug well in loose clastic and bioclastic sediments, • Drilled artesian wells, • Limestone caves, • On several mountainous islands galleries has been dug to tap water from a fractured
zones,• Or in uplifted coral reef island from tunnels build at the end of a sea notch into the
inland groundwater aquifers, • On some plantation islands water is transported from the mainland or from nearby
islands,• On several small islands, small scale desalination plants from brackish or saline water
has been constructed for fisheries and petroleum industries,

Second International Colloquium onHydrology and Water Management in the Humid Tropics
339
• On islands developed for coconut plantation, it is not uncommon to drink biosourcesdirectly from the coconuts or other organic sources.
Rainwater harvesting is simple and the most common water source in the humid tropiccoastal areas and flat undeveloped islands. A wide variety of materials are used to collectwater, from tin to plastic cans, ferrocement canisters, small earth dams, plastered reservoirs,direct tapping from roof buildings or impermeable surfaces. Small basins dug into the soil are commonly used to collect rainwater. Water is then used directly, or in several areas mixed with brackish water to reduce its hardness. Reuse of water is common, and water borne diseases can be communicated through this kind of water-use practice.
Surface water can be abundant in some mountainous islands and be absent in flat islands and in fractured or active volcanic islands. The abundance of surface water is related to the geology and ecology of the higher-lying areas. Those covered by rain forests and underlain by impermeable basement rocks will have surface water systems, especially during the rainy season (Batam and Bintan Island). On volcanic islands, the breaks in slope areas around the central cone are potential areas for springs and act as heads of river and surface waters (Nusalaut Island). Surface water may be absent in fractured islands such as the tectonizedislands (Kisar Island) as well as in very permeable uplifted coral reef islands (Biak Island), and active volcanic islands with freshly laid coarse clastic material and no plant cover (Krakatau, and Gunungapi Island). Flat islands in most cases have no surface water system (Pari Island) except for the alluvial islands where large rivers wash the shores of the islands (KolepomIsland).
Groundwater aquifers may be formed of coarse clastic sediments (Sanana Island), bioclastic (Kei Island), fractured rocks (Moa Island), volcanics (Ternate Island), and in islands with limestone layers (Saparua Island). It is common that bay areas on mountainous islands or along straight shore where coastal plains have been formed by coarse clastic material will contain fresh ground water. This kind of ground water is easily subjected to salt waterencroachment when the balance between fresh water supply from inland and the sustainablerate of exploitation has been exceeded. On many islands of Indonesia there is ‘traditionalwisdom’ to conserve water, either that the number of dug wells is restricted or that water may be exploited (Nusalaut Island) only under supervision by an elder. In other villages (e.g.,Banda Island) exploitation is limited to from just after high tide until half-time to low tide. Deep drilling for fresh artesian water is not common, and is usually restricted to less than 120 m(Batam, Sanana, and Ambon Island). Fresh water from caves are important water sources.Large limestone caves are being exploited (Saparua Island) as well as other large and small caves. These were used during World War II by Japanese as well as US troops (Biak Island).Galleries are low angle tunnels dug on a cliff toward a groundwater source in fractured rocks of the higher elevations. This practice is not common on many islands but can be an important water source especially in hard rock island. In the Moluccas province, it is common practice to use sea notches in the uplifted terraces islands for digging galleries into groundwater aquifers.
5 CONCLUDING REMARKS
Based on the increasing number of islands occupied by people in the Indonesian archipelago, it is proposed that the popular continental concept of water resources management of ‘one river basin one management plan’ be applied to specific archipelagic nations as ‘one island one

Second International Colloquium onHydrology and Water Management in the Humid Tropics
340
management plan’. To help quicken the surveys of this program in Indonesia, studies of small islands have come up with eight different islands types based on their water availabilitypotentials. The climatic province, its position in the regional tectonic setting, geology, and the ecohydrology of the island, determines water potentials in small islands. Although surface water and rainwater harvesting are the most common sources on many islands, uplifted terraces islands underlain by impervious basement may contain large and good quality groundwater resources (Biak, Ambon, and Nusalaut islands). Volcanic islands in Indonesia have a wide variety of water availability, determined by their ‘age’, young volcanoes such as Krakatauisland is barren of plants and has no water sources, while the older Ternate Island is capped with a wide variety of plants and an abundance of water.
6 REFERENCES
Dijon, R., 1984. General Review of Water Resources Development in the Region withEmphases on Small Islands. Proc.Regional Workshop on Water Resources of Small Islands, Suva, Fiji, Commonwealth Science Council, Techn. Publ. No.154, part 2: 25-44.
Falkland, A., 1991. Hydrology and Water Resources of Small Islands: A Practical Guide, in Studies and Reports in Hydrology 49, a contribution to the International Hydrological Programme, IHP-III, Project 4.6, UNESCO publ., Paris.
Hehanussa, P.E., 1988. Geohydrology of Uplifted Island Arcs with Special Reference to Ambon, Nusalaut, and Kei Islands, Workshop on Hydrology and Water Balance of Small Islands, Nat.Com. IHP-UNESCO, Nanjing, China.
Hehanussa, P.E., 1993. Basic Concepts for Water Resources Management in Small Islands, Proceedings of the 25 Years Hydrological Developments in Indonesia ,Nat.Com.IHP-UNESCO Indonesia, p. 73-84.

Second International Colloquium onHydrology and Water Management in the Humid Tropics
341
A NOTE ON THE HYDROLOGY OF SMALL VOLCANIC ISLANDS
Mohammad Farook Mowlabucus, Ministry of Public Utilities,Mauritius. [email protected]
1 INTRODUCTION
Hydrology deals with the assessment of water resources, their distribution and evolution inspace and time. Assessment of water resources implies addressing both the water quality and quantity aspects. However, this paper will limit itself to the quantity aspect only.
The Hydrological Cycle is the same whether it is for a small island or for a continent.The same runoff generation factors apply for either a very small or a very big river basin.However, the very topic “Hydrology of Small Islands” dictates that such Hydrology has specificities that merit our close attention.
The aim of this paper is to highlight various specificities of Small Island Hydrology, and, in no way, pretends to present an exhaustive list.
2 SMALL ISLANDS
What is a small island in our context? It is assumed that an island is small if:
• The time of response of the biggest river basin of the island to rainfall storms is usually in terms of hours and at the most days - depending upon which hydrological component is being considered, and
• Each and every part of the country enjoys a maritime climate.
Using the above definition, the islands of Hawaii, Reunion and Mauritius, for example,are considered small islands. Smaller ones, de facto, belong to the same category.
Such islands vary in size, have different geological formations, topography, climate and vegetation cover. Hawaii, Reunion, Mauritius and Rodriguez are of volcanic origin, whereas Agalega to the North of Mauritius and many other small islands are coral atolls.
This Paper deals with the hydrology of small islands of volcanic origin.
2.1 General
In general, a volcanic island consists of a Central Plateau (the wettest part) with all of its sides dropping to the sea as undulating plains or ending as cliffs, (lowest precipitation). Riversoriginate from the Central Plateau and flow down to the sea through wide-ending or deeply gorged valleys. The morphometric characteristics of adjacent river basins can be very different from one another.
The topography can be either ‘smooth’ or very rugged, depending upon both the size and age of the latest lava flows. The geology is the result of the number of major volcanic

Second International Colloquium onHydrology and Water Management in the Humid Tropics
342
activities and of the duration of periods of quiescence in between such activities. The length of a period of quiescence dictates the stage of weathering of the different aged strata.Pedological, geological and hydrogeological characteristics vary a lot over very short distances.
Groundwater flow is usually through lava tunnels, fissures and faults (fractures), and is seldom artesian.
The size of such island countries often results in the destruction of forests for eitherfirewood or more especially for cultivation.
2.2 Hydrogeology
The geological characteristics described above result in aquifers with very heterogeneoushydrogeological characteristics. Transmissivities and borehole yields, for example, may vary considerably over very short distances. Aquifers are better regarded as buffer reservoirs rather than storage ones.
2.3 Hydrology
The island of Mauritius, with an area of 1865 km2 , has 25 major river basins. Most rivers usually spring from the wet Central Plateau and flow radially to the sea through either relatively wide undulating valleys or through deeply cut, steep-sided valleys. The number of river basins is quite impressive. The relief, size and shape of the watersheds are such that heavy rainfall results in flashy floods with very sharp peaks. The time of concentration is of the order of less than one hour to three hours, and floods subside in a matter of hours. Flows in surface streams/rivers range from a few liters per second on non-rainy days and during the dry season, to more than 500 m3/s during floods. This applies to all river basins although these basins may have very different morphometric characteristics.
On volcanic islands that have a very rugged topography, like Reunion and Rodriguez, bedloads consisting of pebbles and boulders are usually washed down watercourses and cause changes of control at flow gauging stations. Consequently head-discharge relationships at such stations have to be checked and amended frequently.In most cases, precipitation, temperature and humidity vary over short distances.
3 OPERATIONAL HYDROLOGY OF SMALL, TROPICAL, VOLCANIC ISLANDS
Operational Hydrology of small, tropical, volcanic islands has certain specificities that arereflected in the:
• Density of the hydrometric network• Flow measurement/observation methods• Frequency of observations• Generation of flow data upstream and downstream of an existing flow-gauging station• Generation of flow data for ungauged basins
3.1 Density of hydrometric networks

Second International Colloquium onHydrology and Water Management in the Humid Tropics
343
The number and locations of rainfall observation and of flow-gauging stations shall be such as to permit the PRIMARY network to provide adequate coverage of variability in space and time, and of different river basin characteristics. Secondary or project-oriented stations must necessarily supplement this primary network with:
• Flow measurement/observation methods• Flow measurement/observation carried out in such a way as to lead to:• Proper assessment of water resources availability• Proper design of water retention infrastructure (e.g., dams)• Databases suitable for hydrological studies/analysis• Data accurate enough to allow small flows to be shared among several users, wherever
applicable
For low to medium flow measurements, the stations should (as often as possible) be of natural control that may be calibrated using a current-meter, wherever available. Stations that are established to provide data related to low, medium and high flows are usually equipped with flow-measuring structures (weirs and flumes). In general, the use of flow meters for the measurement of, say, abstracted flow should be avoided because of frequent breakdowns due to heavy loads of suspended solids during floods. Furthermore, depending upon the use to which data from a particular station (rainfall or flow) will be put, the station should be equipped with a continuous recording instrument.
3.2 Frequency of observations
The frequency at which measurements/observations need to be carried out at a stationdepends, mainly, upon the use of the data obtained from the station. The following providesguidelines that define the overall policy in data collection and is to be taken as indicative:
Hydrological Studies
• Primary network …………………. continuous recording• Secondary network ………………. two observations daily
Project-oriented
• Domestic water supply …………… one observation daily• Construction of dams/
impounding reservoirs ……………. continuous recording
3.3 Generation of flow data upstream and downstream of an existing flow-gauging station, and for ungauged basins

Second International Colloquium onHydrology and Water Management in the Humid Tropics
344
Geological and hydrogeological characteristics result in flows at different points along a stream, not necessarily being proportional to the respective catchment areas. The following example from the Island of Mauritius illustrates the previous statement:
Catchment Area Peak Flow (km2) (m3/s)
0.6 424 6
Furthermore, run-off generation factors vary in magnitude from one river basin toanother, especially if river-basin characteristics are very different. This implies that generationof flow data, be it through the use of simple mathematical relationships or through modeling,should be carried out with care and based on on-site information and knowledge.
4 WATER BALANCE
One of the aims of hydrology is the computation of a water balance for a river basin or for a country as a whole. A water balance provides a global picture of the distribution of the input (precipitation) into various components such as surface runoff and evapotranspiration. The evolution of such a distribution may indicate, as a result, changes in run-off generation factors due to land-use changes, for example. However, for a water balance exercise to provide a realistic picture, it is essential to carry out such an exercise on an area that represents a global entity in as far as input from rainfall and groundwater are concerned.
On an island of volcanic formation, one main groundwater system (aquifer) may be contributing surface runoff (base flow) to more than one river basin. In such cases, using a river basin as the entity for a water balance exercise may result in serious errors in the estimation of the various components of the water balance equation.
It is recommended that for islands of volcanic formations, water balance studies be carried out using a main aquifer system as the hydrological entity.
Conclusions and Recommendations

Second International Colloquium onHydrology and Water Management in the Humid Tropics
345
Tony Falkland, Senior Engineer, Ecowise Environmental, ACTEW Corporation, Canberra,ACT 2601, Australia. [email protected]
1 THE PROBLEMS AND ISSUES
The special needs of small islands, particularly the Small Island Developing States (SIDS), have been recognized as requiring priority action by a number of international meetings andconferences including:
• The United Nations Conference on Environment and Development, Rio de Janeiro, Brazil in 1992
• The United Nations Global Conference on Sustainable Development of SmallIsland Developing States, Barbados, 1994.
• The United Nations Global Commission on Sustainable Development (UNCSD) in April 1998.
In terms of water resources, a number of international agencies including UNESCO have highlighted the special needs of small islands in the fields of applied hydrological research of direct relevance to small islands, training and education.
Communities on small tropical islands share many of the same problems experienced by communities elsewhere, but have additional ones caused by:
• Limited water availability (often sufficient freshwater only for basic human needs –50 L/person/day)
• Limited land and increasing populations putting extreme pressure on waterproducing areas/protection zones
• High vulnerability to natural hazards (droughts, cyclones/hurricanes, earthquakes,storm surges, tsunamis)
• Vulnerability to climate variability and change (e.g. sea level rise)• Vulnerability to over-extraction of groundwater• Vulnerability of surface water catchments to land use changes• Very high vulnerability of water resources to biological and chemical contamination
(soil residence times of one day) from human settlement (sanitation systems and solid waste disposal)
• Developing status of most small island nations• Importance of small islands for economic development (e.g. tourism) in many
countries/island groups and the well being of their peoples (e.g. Indonesia, Fiji, Hawaii)
• Difficulties of conducting water resources assessment programmes due to oftendifficult access and rapid response of surface water catchments to rainfall events
• Inadequate demand management measures and community education programmesto reduce the high level of water leakage and wastage from current water supply systems.

Second International Colloquium onHydrology and Water Management in the Humid Tropics
346
Many small islands are so small that the only naturally occurring freshwater is limited ground water. Changes in land use or inappropriate waste disposal can be manifested as impacts in water quality often within less than a day.
Islands are surely one of the most hydrologically dynamic and vulnerable physicalenvironments in the humid tropics, and as such deserve special recognition and focus, regarding research and training.
2 CURRENT STATE OF THE ART
There have been many a number of important and relevant meetings and publicationsconcerning small island hydrology and water resources management since the First InternationalColloquium in Townsville, Australia in 1989.
Since 1989, some key workshops and conferences in the Pacific and South East Asian region were:
• Workshop on Small Island Hydrology, Batam Island, Indonesia, sponsored byUNESCO, Research Institute for Water Resources Development and the IndonesianInstitute of Sciences and supported by Batam Development Authority, 1993.
• Workshop on Water Sector Planning, Research and Training, organised by UNESCO, SOPAC and UNDDSMS, Honiara, Solomon Islands, 1994.
• Training Workshop on Water Resources Assessment and Development in SmallIslands and the Coastal Zone, Pari Island and Bandung, Indonesia, 1995.
• UNESCO Water Resources Workshop, University of the South Pacific, Suva, Fiji, July 1997.
• Workshop on Local Scale Hydrologic al Processes in Islands, Highlands and Urban Environments in Malaysia: Need for Future Directions Kuala Lumpur, Malaysia,November 1997.
• Science, Technology and Resources Sessions at SOPAC Annual Conferences,September 1997 and September 1998, Fiji. In addition, there have been some useful publications which expand on aspects of island hydrology and water resourcesmanagement, including:
• UNESCO (1991). Hydrology and water resources of small islands, a practical guide.Studies and reports on hydrology No 49, prepared by A. Falkland (ed.) and E. Custodio with contributions from A. Diaz Arenas & L. Simler and case studiessubmitted by others. Paris, France, 435pp.
• UNESCO (1992). Small Tropical Islands, water resources of paradises lost. IHP Humid Tropics Programme Series No. 2. UNESCO, Paris.
• Vacher H.L. and Quinn T.M., eds. (1997). Geology and Hydrogeology ofCarbonate Islands, Developments in Sedimentology No. 54, Elsevier, Amsterdam, 948 pp.
• IETC (1998). Source book of alternative technologies for freshwater augmentation in small island developing states. International Environmental Technology Centre incollaboration with South Pacific Applied Geoscience Commission and the WaterBranch of UNEP, Technical Publication Series No. 8.
Second International Colloquium onHydrology and Water Management in the Humid Tropics
347
In collaboration with other agencies, including SOPAC and the CommonwealthScience Council, UNESCO has initiated two, much-needed, applied research projects onPacific Island nations, and assisted with the planning of a third project. The two projects,which have now been completed or are about to be completed, are:
• Groundwater recharge on a coral island – conducted on the island of Bonriki, Tarawa atoll, Republic of Kiribati, and
• Groundwater pollution on a small limestone and coral sand island – conducted on the island of Lifuka, Kingdom of Tonga.
• The third project, yet to be implemented, is a study of catchments and affectedcommunities on a small ‘high’ island, where land use change due to deforestation and or mining activities has had a significant impact.
The focus on ground water is indicative of the importance of ground water as a freshwater resource on many small islands. The above-mentioned projects are a welcomestart, but there is a need for further research, including further consideration of the topics for thetwo implemented projects in different island environments.
Recognizing SOPAC’s key role as a regional focal point for applied research and training in the Pacific Ocean region, a memorandum of understanding has been signed between SOPAC and UNESCO for future co-operation. The strengthening of other focal points (e.g. in the Indian Ocean) is also considered an important strategic initiative.
3 RESEARCH NEEDS
The following applied research projects are recommended:
• Catchment and communities project (impacts of land use change such asdeforestation or mining on island catchments and affected communities. So far a planning phase has been completed but a project is yet to be commenced),
• Groundwater recharge and modelling (completion of stage 1, and commencementof stage 2 involving groundwater modelling and sustainable yield estimation for Bonriki, Tarawa, Kiribati),
• Groundwater pollution due to sanitation systems (completion of project for Lifuka, Tonga),
• Groundwater and surface pollution due to agricultural chemicals,• Water resources pollution due to industrial discharges and spillages and solid waste
disposal (e.g. leaks from fuel tanks),• Conjunctive use of water (e.g. rainwater and groundwater, second class water
systems, etc.),• Response of surface water catchments to both climate variability (e.g. El Niño/La
Niña cycles) and land use changes,• Appropriate groundwater extraction systems,• Rainwater catchment study,• Study of potential for creation/construction of storage to cope with inter-seasonal
climate variability,• Treatment, re-use and storage of wastewaters,
Second International Colloquium onHydrology and Water Management in the Humid Tropics
348
• Assessment of effects the mitigation measures for potential sea level rise,• Study of water balance with groundwater aquifers extending under more than one
river basin,• Integrated island water resources study (looking at whole hydrological cycle and
water management systems).
Project proposals with details have been prepared for some of the above projects.
4 APPROPRIATE MECHANISMS AND TOOLS TO ENHANCEINTEGRATION OF EFFORTS BETWEEN SCIENTISTS AND POLICYMAKERS
There is a need for scientists to advise and encourage water managers and policy makers in relation to important water sector issues. In particular, there is a need for:
• Continual raising of the awareness of the water resources problems of small islands with policy makers at national and international level and the need for appropriateapplied research projects to solve these problems. As part of this, advice on priorities is essential.
• Provision of advice on the implementation of research findings to resolve practicalproblems (i.e. disseminate information about research findings to water managersand policy makers followed by appropriate action)
• Examination of institutional impediments to integrated water and land management,and provision of advice concerning rationalization of, and enhanced co-operationbetween, the agencies involved in the water sector so as duplication of effort is avoided, especially where human resources are so scarce.
5 TRAINING AND REGIONAL FOCAL POINTS
There is an ongoing need for appropriate training of professionals and technical staff in the water sector. This can best be done by a combination of:
• Formal education, often in academic institutions of other countries,• Revival of in-country hydrology technician courses by UNESCO,• Interchange of professional and technical staff between different islands,• In-country training workshops, courses and seminars,• Geographical information systems, • Active involvement in appropriate research and implementation projects
undertaken in the person’s own country or in similar environments.
Regional focal points exist in some regions for co-ordination of applied hydrologicalresearch, training, information dissemination and provision of critical information to island nations. Examples of these are:
• South Pacific SOPAC (Fiji), University of the South Pacific

Second International Colloquium onHydrology and Water Management in the Humid Tropics
349
• North Pacific University of Hawaii, University of Guam (Water and EnergyResearch Institute)
• Southeast Asia UNESCO ROSTSEA Office (Jakarta, Indonesia) and theRegional Humid Tropics Hydrology and Water Resources Centre for Southeast Asia and the Pacific (Malaysia
• Latin America and the Caribbean CATHALAC and Easter CaribbeanCentre and Water Resources Research Institute, University of the Virgin Islands
• Indian Ocean no agency at present but co-ordination could be done through the University of Mauritius
Based on the above observations, there is a need for:
• Nomination of a focal point in the Indian Ocean region• Encouragement of inter-regional networking and co-operation in the process of
knowledge transfer. Inter-regional workshops and seminars are a useful means of achieving this objective. Other mechanisms are sharing of relevant reports and data, combined training workshops and seminars.
6 OTHER
• Continued donor support is essential• Data availability – data should be freely available