their use in forecasting consumer behavior - national bureau of
TRANSCRIPT

This PDF is a selection from an out-of-print volume from the NationalBureau of Economic Research
Volume Title: Short-Term Economic Forecasting
Volume Author/Editor: Conference on Research in Income and Wealth
Volume Publisher: Princeton University Press
Volume ISBN: 0-870-14172-4
Volume URL: http://www.nber.org/books/unkn55-1
Publication Date: 1955
Chapter Title: Consumer Anticipations: Their Use in ForecastingConsumer Behavior
Chapter Author: John B. Lansing, Stephen B. Withey
Chapter URL: http://www.nber.org/chapters/c2905
Chapter pages in book: (p. 381 - 454)
CONSUMER ANTICIPATIONS: THEIR USE INFORECASTING CONSUMER BEHAVIOR
JOHN B. LANSING AND STEPHEN B. WITHEY- SURVEY RESEARCH CENTER, UNIVERSiTY OF MICEJIGAN
A. IntroductionUSE OF ANTICLPATORY DATA in the consumer sector of the econ-
omy presents a challenging problem. It has in recent years alsoproved of great help in forecasting economic fluctuations. Sharpmovements in consumer expenditures, unforeseen in advance bymany technical economists, have been a feature of much of theshort-run business cycle activity in the postwar period.
Surveys of .anticipated plant and equipment outlays of businessenterprise carry more weight because a significant number, thoughnot all, of these anticipations represent firm contractual commit-ments. In consumer surveys, however, expressed anticipations areusually not tied to binding contracts, and a more comprehensiveanalysis of the underlying situation must be attempted. Our ap-proach has been to consider a range of supporting data needed tobuild relationships among such variables as actual purchases, ex-pected purchases, incomes, liquid assets, personal attitudes, familystructure, and others. A higher degree of confidence is attached to anappraisal of the economic situation if it is based on firmly establishedinterrelationships, rather than on simple translations of anticipationsinto action. In addition period to period movements in the variousconsumer statistics give a firmer base for projections than collec-tions of isolated data in a unique time interval.
In this paper we shall examine the use of data on consumer an-ticipations from two alternative points of view. In the first sectionare considered the problems involved in forecasting consumer de-mand from anticipatory statistics collected in an annual sequenceof representative cross-sectional samples of consumer units in theUnited States. The samples do not, except by small chance, includeidentical respondents. In the second section a different approach isused: identical consumers are followed from one period to the next.Material on individual fulfillment of expectation and changes inindividual attitudes and economic situations between time periodsare then added. Relationships derived from studying reinterviews of
381

CONSUMER ANTICIPATIONS
identical units can be used to advantage in the subsequent analysisof repeated interviews from independent cross-sections.
'The Surveys .of Consumer Finances conducted by the Survey Re-search Center for the Board of Governors of the Federal ReserveSystem are the source of our data on consumer anticipations andrelated data used in forecasting 'demand. These are relatively newinstruments for business cycle analysis and have only a short history(beginning in 1946). The analysis of the reinterviews was made withthe help of a grant by the Rockefeller Foundation to the Universityof Michigan.
In these Surveys, data have been collected on consumer inten-tions to buy selected durable commodities during a future timeperiod, consumers' opinions about their personal and the generaleconomic climate, consumers' financial condition, and consumerdemographic facts. Our experience has shown us some of the linesof influence •connecting both actual and anticipated expendituresto these other variables. We are in a somewhat weaker position intrying to account for relationships among these "explanatory" fac-tors. The problem of the origins of consumer attitudes is especiallydifficult. The problems we have posed are indeed not at a stage offinal solution. Nevertheless, we have learned some things aboutrelationships involved in consumer behavior—relevant variables tobe considered, techniques of measuring these variables, and thestrength and magnitude of some of the relationships.1 We are farfrom sure that we have included all the important variables; wehave made only first attempts at estimating the underlying relation-ships. A very important limitation' is the fact that the Surveys ofConsumer Finances cover oniy the types of economic conditionsfound in the postwar boom. *
1 See, for example, George Katona, Psychological Analysis of EconomicBehavior (McGraw-Hill, 1951). This volume contains analyses of the relationsbetween consumer behavior and attitudes. Results of econometric equationscontaining several variables relating to consumer behavior are found in L. R;Klein, "Estimating Patterns of Savings Behavior from Sample Survey Data,"Econometrica, Vol. 19 (1951), pp. 438-454. A volume is now in preparationat the Survey Research Center on the use of survey data for determining basicrelationships between demand and explanatory variables. See also ConsumerAttitudes and Demand, 1950-1952, by George Katona and Eva Mueller (In-stitute for Social Research, University of Michigan, 1953), for a discussion ofthe role of economic attitudes in business cycle research, with special referenceto the events of 1950-1952.
382

CONSUMER ANTICIPATIONS
B. Repeated Interview Data on Cross-Section of Consumer Units2
In the annual Surveys of Consumer Finances many of the ques-tions remain the same year after year, although the respondentsare different. One of the purposes of these repeated interviews isto provide new data not otherwise available which may contributeto predictions of consumers' behavior.
In the absence of survey data, predictions in the consumer sectormust rely on aggregate statistics. For example, an economist maypredict that sales of new cars to consumers will amount to $x mil-lion, on the basis of a function involving such variables as totalstocks of cars, national income, liquid assets held by private indi-viduals, etc. One contribution of the Survey method to predictionsof this type is to make available distributions of magnitudes forwhich aggregate statistics are available. The distribution of income,the distribution of liquid assets, and the relation between individ-uals' incomes and their liquid assets can be and are calculated fromSurvey data.
The Survey method is by no means limited to breaking down ag-gregates. Perhaps its most interesting contribution is to provide in-formation on variables where no aggregate statistics are available.Psychological variables are inherently of this type. Perceptions,motivations, attitudes—the entire psychological gamut must be in-vestigated on a group or individual basis.
The addition of psychological information to the supply of dataat the disposal of forecasters should make possible improvements inthe accuracy of forecasts. Although forecasters commonly speak interms of predicting economic magnitudes, such as the aggregatelevel of spending by consumers, they are, by implication, predict-ing the behavior of individuals. To predict that total spending byconsumers will be $x is equivaknt to predicting the spending of amass of individuals, each of whom makes some contribution to thetotal. We may think of a sequence in which events occur in theeconomic world, the attitudes of consumers change, and finally thebehavior of consumers changes. Evidently there is less risk in pro-ceeding from knowledge about both step 1 and step 2, events andchanges in attitudes, to a prediction of step 3, changes in behavior,than there is in predicting fromknowledge of only step 1 to step 3.
The forecaster without psychological information must eithermake that jump or wait until the behavior actually starts to change.
2 John B. Lansing is primarily responsible for this section.
383

CONSUMER ANTICIPATIONS
If people's attitudes, particularly shifts in these attitudes, are known,the forecaster has an opportunity to make use of knowledge aboutthe effects of attitudes on behavior.
Even after the event a forecaster without psychological data mayhave only a partial picture of what happened. He will know onlythat a certain event took place and that people behaved in a certainway. He cannot always be certain that he has inferred the correctcausal link joining the right event with the right behavior. Psycho-logical knowledge may help to establish what the causal connectionactually was. It may also indicate that certain causal connectionsare impossible. For example, a man cannot be influenced directlyby an event about which he has no knOwledge.
Thus the addition of psychological data can, add much to theinformation at the disposal of economists. There are difficulties,however, both in gathering and in making use of these new data,and these difficulties have not all been solved in the work done inconnection with the Surveys of Consumer Finances.
In the first place, the interpretation of a body of attitudinal ma-terial from a survey of consumers is not simple. The analyst muststudy changes in answers to a dozen questions from one year to thenext. in a simplified situation where distributions of the popu-lation are available only on six three-point scales, the population asa whole may be distributed in any proportions 'on each scale, andthe scales are largely independent. For example, one scale woulddivide the heads of spending units into three groups according towhether they expect to make more in the current year than in theprevious year, about ,the same, or less (see table 8) Another scalewould divide the same individuals according to whether they nowfeel better off financially than a year ago, the same, or worse off (seetable 9). The possible combinations of distributions of the popula-tion on different scales are very numerous.
In general the analyst must ask himself the question, Is it possiblefor people to hold this particular set of attitudes at one time? Hemust ask this question in the light of general psychological knowl-edge and of particular knowledge about the attitudes in question.It is possible that answers to one or more questions may seem tomake no sense in the pattern. The meaning of the whole body of
Although the' example refers only to three-point scales, other types arecommon. A five-point scale would divide the population into five instead ofthree groups. For example, those who expect to make more could 'be split intothose who expect to make a lot or a little more.
384

CONSUMER ANTICIPATIONS
data may have to be reconsidered, and new data sought out, per-haps by intensive analysis of some subgroup of the population whichnow seems to be of key importance.
This type of analysis involves some exercise of judgment on thepart of the analyst. He has to think, and when he thinks he may err.Judgment is also involved, of course, in the more usual forecastingprocedures, but it enters in a different way. Even assuming that,given the same model and the same data, different analysts wouldreach the same conclusions, not all econometricians would use thesame model for forecasting gross national
In the second place, the differences in method make difficultthe combination of psychological and other survey data with datafrom other sources. The results of a survey of attitudes are not easilyreduced to a form which can be inserted, say, in an econometricmodel. If other data about the consumer sector are to be taken intoaccount, and we feel that they should be, the problem of articula-tion arises even within the consumer sector of the economy.
But if one rashly ignores other data about the consumersector, one cannot ignore the interrelations among the consumersector, the business sector, and government. Ideally, one shoulddeal with all three together, but the practical difficulties are serious.
One method of approaching a solution is to make some crudesubjective combination of information about the different sectors.One may study the consumer sector more or less in isolation andreach some conclusion about the probable course of consumer de-mand. If, after a similar study of the other sectors, the indicationsin all sectors point one way, one can infer that events will move inthat direction. The difficulty is that indications in different sectorsneed not point in the same direction, and movements in one sectormay tend to change the course of events in another. Relative mag-nitudes and interrelations are the heart of the problem. Informedjudgments on these points are valuable, but not entirely satisfactory.
An alternative to nonquantitative estimates of the interrelationsis the construction of a mathematical model of the economy. Tointroduce all the relevant data from the Surveys of Consumer Fi-nances into such a model would require a major effort. One methodwould require a precise dollar estimate of total consumer demandwhich could be entered as a constant in a system of equations de-scribing the functioning of the economy. Another method wouldrequire the development of equations based on Survey data for in-corporation in a larger system. As we have observed, the data in the
385

CONSUMER ANTICIPATIONS
Surveys are not now in a form appropriate for use in either mannerand they are not easily reduced to such a form. A discussion of thediffkulties which would confront anyone who attempted this taskis beyond the scope of this paper, but some of them will be ap-parent to anyone who reads the discussion which follows. For thepresent, at least, the consumer sector is studied in isolation, withoutattempting to combine it with information from other sectors.
In view of the seriousness of these difficulties, we at the SurveyResearch Center have tended to avoid making "predictions." Weuse the word, but only in a loose sense. Strictly speaking, we haveobtained and published data which we believe are relevant to themaking of predictions about consumer demand. We have evenstated, in our bolder moments, that indications in the consumersector point in a certain direction. We have not undertaken thework of combining our data with data from other sources. For ex-ample, we have published data about consumer intentions to buynew cars, and a variety of other data relevant to the analysis of de-mand for new cars, but we have not attempted to estimate howmany new cars actually will be purchased by consumers. It wouldbe dangerous to predict demand for new cars for a year withouttaking into account what such factors as government policies cando to the level of consumer income and the terms on which con-sumers can borrow. It would be absurd to predict sales of new cars.without considering what may happen on the supply side of themarket. Whether one uses the word "prediction" with reference tothe Survey data is perhaps a verbal question, but it is both impor-tant and to keep in mind that the Survey data at best arelimited to the consumer sector.
Specifically, in using the data from the Surveys we have attemptedto collect information of two kinds not otherwise available, namely,distributions of economic magnitudes and psychological data aboutconsumers' attitudes. We have also studied these data in isolationand attempted to draw conclusions about them. These conclusionsand the supporting data are then published and may be used byothers in making prognostications.
The data may be applied to projections for the consumer sector asa whole or for parts of it. Of particular interest is the total consumerdemand for goods and services, that is, total spending in dollars forgoods and services by the household sector of the economy. Theimportance of total demand by consumers in forecasting the courseof economic events hardly needs emphasis. The basic postulate of
386

CONSUMER ANTICIPATIONS
those who work with Survey data is that consumers have a realfreedom of choice about what they do with their income and assets,particularly over short periods, of time: they may purchase goodsand services, or they may increase their liquid assets and claimsagainst the other sectors of the economy. In other words, it is notenough to know consumers' income and asset positions. Forces otherthan incomes and assets influence spending, and these forces requirestudy.
A more restricted area than total demand by consumers is con-sumer demand for durable goods, automobiles, and houses. Thesemay be considered individually or collectively, that is, one may beinterested in the demand for individual items or for all these itemsasa group. The methods actually used in the Survey can be appliedseparately to the three categories (houses, cars, and other durables)or to the three in combination.
Data on demand for the large items may be used for projectionsof total consumer demand on the assumption that the variability intotal demand is entirely in the large items—houses, cars, and otherdurables. If, for example, consumer purchases of other goods andservices always bear a single ratio to income, there is no difficultyin converting a projection for large items into a projection for totalconsumer demand. The approach in the Surveys can be useful evenif the facts are not so neat. The inference may be made that if de-mand for houses, cars, and other durables will increase in a particularyear, total consumer demand will increase for a given level of income.
With this background, the information gathered in• the Surveywhich is relevant to the problem of forecasting may be consideredin more detail. This information may be classified under three head-ings: individuals' ability to buy, individuals' willingness to buy, andindividuals' plans to buy. In brief, an individual's ability to buyinvolves his income and his balance-sheet position. An individual'swillingness to buy involves both his evaluation of his ability to buyand his wants. It includes his expectations of his future income,future prices, and the future of other aspects of his ability to buy.It includes his attitudes and motivations, or, in language more usualamong economists, his preference functions. Plans to buy comprisepeople's answers to questions as to what they expect to buy duringa calendar year. These expressed intentions involve wishes andhopes which are sometimes not realistic and are always open to thepossibility of change, but in some cases, at least, they represent a
387

CONSUMER ANTICIPATIONS
joint expression of willingness to buy and ability to buy. Withineach of these major categories the most useful information concernstrends, that is, trends on ability to buy, trends on willingness to buy,and trends on plans to buy.4
The content of these categories and the reasons for including theparticular information gathered are set forth below. There follow adiscussion of the method of combining the several types of data,and some remarks about methods of testing the validity of thematerial for purposes of forecasting. The latter topic is treated inmore detail, for a part of the data, in the second section of thispaper, and for the data as a whole in a separate paper by IrvingSchweiger, elsewhere in this volume.
The problem of estimating the relative importance of the factorsmentioned cannot be solved satisfactorily with the available dataand is not discussed here. The emphasis, rather, is on what types ofdata are used.
It should be noted that the period with which we are concernedis the calendar year. We interview in January and February, andinquire about individuals' income for the preceding year, their bal-ance-sheet situation and attitudes at the time of interview, and theirplans and expectations for the remainder of the year. We comparethese data for earlier years; using interviewsone year apart. A year is a period commonly used for accounting,and hence it has great advantages for the study of past behavior,particularly of past income. For the study of the future, however,it is an arbitrary inteiyal, and it may well be that in making projec-tions a period or periods of different length should be used. Thedata discussed below suggest that a shorter future period would beappropriate for some purposes.
1. ABILITY TO BUY
The first major type of data on consumers' intentions has to dowith individuals' ability to buy. The data about ability to buy fal.linto the three familiar categories of income, assets, and debts.
The basic information about income obtained by the Surveys isembodied in the income distribution. Trends in median and meanincome and in the proportion with very low incomes are computed
4The word "trend" as used here refers simply to the comparison of the tin-adjusted results of repeated interviews. It implies comparability in questionsasked, methods of sampling, etc. This use of the word is in contrast to that indiscussions of secular trends in the economy.
388
CONSUMER ANTICIPATIONS
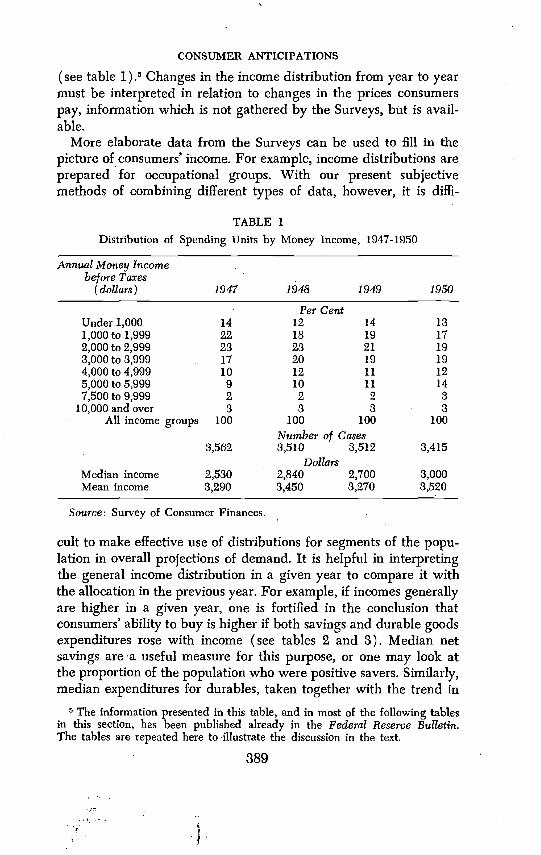
(see table 1) Changes in the income distribution from year to yearmust be interpreted in relation to changes in the prices consumerspay, information which is not gathered by the Surveys, but is avail-able.
More elaborate data from the Surveys can be used to fill in thepicture of consumers' income. For example, income distributions areprepared for occupational groups. With our present subjectivemethods of combining different types of data, however, it is diffi-
TABLE 1Distribution of Spending Units by Money Income, 1947-1950
Annual Money Income :
before Taxes .
(dollars) 1947 1948 1949 1950
Under 1,000 14Per Cent
12 14 131,000to 1,999 22 18 19 172,000to2,999 23 23 21 193,000 to 3,999 , 17 20 19 194,000to4,999 10 12 11 125,000to5,999 9 10 11 147,500 to 9,999 2 2 2 3
•
10,000 and overAll income groups
3100
• 3 3100 100
3,562Number of Cases8,510 3,512
Dollars3,415
Median income 2,580 2,840 2,700 3,000Mean income 8,290 3,450 8,270 3,520
Source: Survey of Consumer Finances.
cult to make effective use of distributions segments of the popu-lation in overall projections of demand. It is helpful in interpretingthe general income distribution in a given year to compare it withthe allocation in the previous year. For example, if incomes generallyare higher in a given year, one is fortified in the conclusion thatconsumers' ability to buy is higher if both savings and durable goodsexpenditures rose with income (see tables 2 and 3). Median netsavings are a useful measure for this purpose, or one may look atthe proportion of the population who were positive savers. Similarly,median expenditures for durables, taken together with the trend in
The information presented in this table, and in most of the following tablesin this section, has been published already in the Federal Reserve Bulletin.The tables are repeated here to illustrate the discussion in the text.
889
I

• CONSUMER ANTICIPATIONS
TABLE 2Distribution of Amounts Saved by Spending Units, 1947-1950
Savings(dollars) 1947
.
1948 1949 1950
Per CentPositive savings 61 60 57 58
2,000 and over 5 5 4 51,000to 1,999 7 7500to999 9 11 11 11200 to 499 • 13 14 13 13100to199 9 8 8 8
1to99 18 15 14 12
Zero savings 8 6 6 7
Negative savings
1to9927
6
29 336 7
31
5
100to499 11 11 13 14
500 and over 10 .12 13 12
Not ascertained 4 5 4 4
All savings 100 100 100 100
3,562
Number of Cases3,510 3,512
Dollars
3,415
Median amount saved 60 75 60 90
Source: Survey of Consumer Finances. For a list of the component elementsentering into the definition of saving used here, see Appendix to "The Distri-bution of Consumer Saving in 1948," Federal Reserve Bulletin, January 1950,
pp. 38-34.
TABLE 3Distribution of Purchases of Durable Goods by Spending Units, 1947-1950
Purchases 1947 1948 1949 1950
Per CentBought one orDid not buy
Total
more durablesa 3565
100
39 4061 60
100 100
4258
100
Median expenditure
3,562
of buyers 200
Number of Cases3,510 3,512
Dollars250 250
3,415
280
a Includes radios, television sets, refrigerators, furniture, washing machines,stoves, and other electrical appliances.
Source: Survey of Consumer Finances.
390

CONSUMER ANTICIPATIONS
the proportion who bought at least one durable good, may serve toindicate the level of purchases. If incomes rose, but the proportionof positive savers fell and median expenditures for durables alsofell, the increase in income cannot be taken as indicating improvedability to buy. Evidently the increase was offset by price increases.It must be emphasized that the data about income from the Surveysare data about past income. They indicate the situation at the be-ginning of the period which is to be covered in a projection. Strictly,past incomes are relevant to the future only to the extent that theyinfluence willingness to buy in the future.
The basic information about consumers' assets is incorporated inthe distribution of liquid asset holdings. The higher the medianholding, and the more individuals with at least some liquid assets,the better are people able to buy (see table 4). However, changes
TABLE 4Distribution of Liquid Assets of Spending Units, 1947-1951
Total Holdings ofLiquid Assetsa
(dollars) 1947.
1948 1949 1950 1951
.
None 24Per Cent
27 29 31 28.
ito 499 26 27 28 27 30500 to 1,999 •28 24 22 20 232,000to4,999 14 13 12 13 ii5,000 and over 8 9 9 9 8
All holdings 100 100 100 100
. 3,058Number of Cases
3,562 3,510 3,512Dollars
3,415
Median holdings of thosewith liquid assets
Median holdings of allspending units
890
470
820 790 810
350 300 250
710
300
"Liquid assets" exclude currency, but include U.S. government bonds,savings accounts, and checking accounts. Holdings are estimated as of thetime of interview, that is, in January-February of the years indicated.
Source: Survey of Consumer Finances.
in prices influence the real value of liquid asset holdings just as theyinfluence real incomes. In estimating changes in real income, it ispossible to use the Consumer Price Index, at least for large segmentsof the population. No price index exists, unfortunately, which isproperly weighted forestimating the real value of consumers' liquid
891
CONSUMER ANTICIPATIONS
asset holdings. The Consumer Price Index uses, in calculatingweights, information about the allocation of consumers' incomesamong various goods and services. A similar index for liquid assetswould require information about the allocation of withdrawals fromliquid assets among various goods and services, which is entirelydifferent from the allocation of income. When consumers draw downtheir liquid assets, the Survey data indicate that a smaller propor-tion of the total is spent for general living, expenses (food, clothing,rent) than is true of expenditures out of income (see table 5). Forexample, of spending units in the middle income group ($2,000-$4,999) who reduced their liquid assets in 1950, only 30 per centindicated that any of the money went for food, clothing, or othernondurables. Half mentioned medical expenses. If a "market basket"approach were to be used in preparing an index for liquid assets,the relative weight of the price of food and the price of medicalservices would be different from their weight in an index developedfor the study of income.
The assets which consumers may employ in the purchase of goodsand services are not limited to their "liquid
assets be spent should include such items assecurities issued by government agencies other than the U.S. Treas-ury, securities of private corporations, and hoards of currency, aswell as nonliquid assets. Information on the distribution of thelatter assets, with the notable exception of currency, is availablefrom the Survey but has not been used in making projections. Themethod of analysis emphasizes changes in the situation of con-sumers from one year to the next, and these distributions changevery little in the period of one year. Information about changes inthe distribution of holdings of currency might prove more helpful,but the data have proved difficult, if not impossible, to collect.
Another aspect of consumers' ability to buy is their ability to bor-row. Consumers'may make a given level of purchases by borrowing,as well as by the use of income and liquid assets. The Surveys pro-vide several types of data about consumer borrowing. The simplestdata are trends on the proportion of buyers using credit and on theproportion of the purchase pric.e borrowed (see tables 6 and 7).These data, however, represent a record of the extent to whichcredit has been used rather than an estimate of the extent to which
6 Liquid assets, as defined and measured in the Surveys, include bank depositsand U.S. government bonds.
392

r) 0 z tTj z C, 0 z U,
Perc
enta
ge o
f Spe
ndin
g U
nits
TAB
LE S
in D
iffer
ent I
ncom
e G
roup
s Who
Red
uced
The
ir Li
quid
Ass
et H
oldi
ngs
by M
ajor
Item
s of E
xpen
ditu
re, 1
950
Co
<C (0
Am
ount
of
Red
uctio
n in
-
Aut
omob
iles
Liqu
id A
sset
s(d
olla
rs)
Num
ber o
fC
ases
Med
ical
Expe
nses
Livi
ngR
epay
men
tIn
vest
-Ex
pens
esa
of D
ebt
men
tsb
and
Oth
erD
urab
le G
oods
Oth
er L
arge
Out
lays
d
Any
am
ount
254
5219
50 In
com
e un
der $
2,00
046
412
1612
27ito 199
86
51
48
211
11
12
18
200 to 499
69
47
49
24
15
16
29
500t
o 99
945
4845
510
8ii
401,
000
or m
ore
4960
398
2936
635
Any
am
ount
1 to
199
549
148
58 52
1950
Inco
me
of $
2,00
0 to
$4,
999
3Q7
1448
62
32 1419 14
25 20200 to 499
158
5731
76
3123
25500 to 999
109
56
23
815
44
19
27
i,00bormore
131
48
20
841
48
21
31
Any amount
284
45
1950
Inco
me
of $
5,00
0 or
Mor
e17
10
24
41
26
37
1 to
199
4246
237
1419
3030
200t
o 49
956
5516
83
3527
30SO
Oto
999
5540
2510
2047
3041
1000
orm
ore,
128
4412
1339
4923
40
a In
clud
esfood,
clot
hing
, and
oth
er n
ondu
rabl
e ex
pend
iture
s.b
Incl
udes
busi
ness
inve
stm
ents
, pur
chas
e of
hom
e or
oth
er re
al e
stat
e, a
nd se
curit
y in
vest
men
ts.
Includes
trave
l, am
usem
ent,
vaca
tions
, fur
s, je
wel
ry, a
nd m
arria
ge.
dIn
clud
esre
pairs
and
add
ition
s to
hous
e, ta
xes,
car r
epai
rs, c
hild
ren'
s edu
catio
n, lo
ans t
o fr
iend
s and
fam
ily, m
ovin
g, fa
rmop
erat
ing
expe
nses
, etc
.So
urce
: Sur
vey
of C
onsu
mer
Fin
ance
s.A
ll sp
endi
ng u
nits
trea
ted
in th
is ta
ble
redu
ced
thei
r liq
uid
asse
t hol
ding
s bet
wee
n ea
rly 1
950
and
early
195
1. T
he ro
ws a
ddto
mor
e th
an 1
00 p
er c
ent s
ince
mor
e th
an o
ne m
ajor
item
of e
xpen
ditu
re m
ight
be
repo
rted
by a
sing
le sp
endi
ng u
nit.
The
table
is b
ased
on
answ
ers t
o tw
o qu
estio
ns a
sked
of s
pend
ing
units
repo
rting
redu
ctio
ns in
liqu
id a
sset
s:"What sort
of th
ings
did
you
use
the
mon
ey fo
r?"
and
"Did
you
hav
e an
y la
rge
expe
nses
we
did
not t
alk
abou
t, fo
r ins
tanc
e, d
octo
r and
hos
pita
lbi
lls, e
xpen
ses f
or m
ovin
g or
trip
s or t
he li
ke?"

CONSUMER ANTICIPATIONS
it can be used. One can assume that the use of credit cannot becomemore and more important year. after year, indefinitely, but that pre-sumption is of limited use in a projection for one particular year.
A second type of data about consumer borrowing concerns thetotal burden of consumer debt. If debt is not rising, or is rising lessrapidly than income, consumers may be able to borrow at the samelevel or at a higher level. A rising ratio of debt to income may leadto the opposite conclusion. Here, as with income and liquid assets,the essential datum is the frequency distribution, either the fre-quency distribution of total debt or, better, the frequency distribu-tion of the ratio of debt to income. For example, if the Surveysshould show that in one year K per cent of the population had totaldebt equal to or greater than their income, while a year later 2Kper cent of the population had total debt equal to or greater thantheir income, this finding would suggest that consumers had beenborrowing at a higher rate than they could maintain. Their abilityto finance further purchases by more borrowing would be in doubt.Actual data from the Surveys on trends in debt have not, unfor-tunately, been fully comparable from year to
It hardly seems necessary to demonstrate here that informationabout trends in the distribution of consumers' holdings of liquidassets and of the burden of debts which they are supporting is rele-
TABLE 6Method of Financing Durable Goods Purchased, 1947-1950
Method of Financing 1947 1948 1949 1950
Per Cent of Spending Units Who BoughtDurables Other than Cars
All items bought for cashAll items bought on installmentSome items bought for cash, some
items on installment
57 51 46 4931 87 44 40
11 11 10 9Not ascertained 1 1 a 1
Total 100 100 100 100Number of Cases
1,286 1,384 1,405 1,471Per Cent of Sample Purchasing Durables
Other than Cars. 35 89 39 41
a Less than 0.5 per cent.Source: Survey of Consumer Finances.The durable goods included are radios, television sets, refrigerators, furniture,
washing machines, stoves, and other electrical appliances.
394

C.3
TAB
LE 7
Met
hod
of F
inan
cing
Aut
omob
iles P
urch
ased
, 194
7-19
50
-4
Met
hod
of F
inan
cing
New
Car
sU
sed
Car
sA
ll C
ars
1947
1948
1949
1950
1947
1948
1949
1950
1947
1948
1949
1950
Cas
h (in
clud
ing
trade
-in)
.71
66•
55Pe
r Cen
t of
5463
Spen
ding
Uni
ts W
ho B
ough
t Car
s55
4642
6559
5047
Inst
allm
ent
Bor
row
ed le
ss th
an50
per
cent
Borrowed
50 p
ercent
or
mor
ePe
r cen
t bor
row
edno
t asc
erta
ined
15 14 a
13 20
a
15 27
1912
2624
aa
1314
1013
2937
4520
:
aa
12
13 26 .
a
.
15 33 a
13 37
1
Gift
aa
aa
a1
1
aa
11
a1
1.
Tota
l10
010
010
010
010
010
010
010
010
010
010
010
0
.
264
256
351
400
307
Num
ber o
f Cas
es-
1243
345
857
1-
628
784
858
66
10
Per C
ent
109
of P
opul
atio
n Pu
rcha
sing
Car
s11
12
14
15
17
22
25
0 z
a Le
ssth
an 0
.5 p
er c
ent.
Sour
ce: S
urve
y of
Con
sum
er F
inan
ces.

CONSUMER ANTICIPATIONS
vant to projections of consumers' demand. In the authors' experiencefew economists question the relevance of these data. l'he questionsat issue are rather: first, What other data are also relevant? and sec-ond, How should the relevant data be combined?
2. TO B!JY
The next major type of information concerns individuals' "will-ingness to buy." Consumers' estimates of their ability to buy includeboth their appraisal of their own personal situations and their ap-praisal of the general economic situation. A consumer certainlymay take into account his expectations as to the course of his in-come in the future (see table 8). He may be influenced by any
TABLE8Expectations of Income Change, 1950-1951
Expected Income Change 1950 1951
Will make more in current year •
Per Cent of All Spending Units
than in previous year • 30 89About the same 43 35Will make less 16 13Don't know . 9 12Not ascertained 2 1
Total . 100 100
.
. Number of Cases3,512 3,415
Source: Survey of Consumer Finances. The question was: "Now for the cur-rent year, 1951, do you (and your wife) think your income will be Larger, thesame, or smaller than in 1950?"
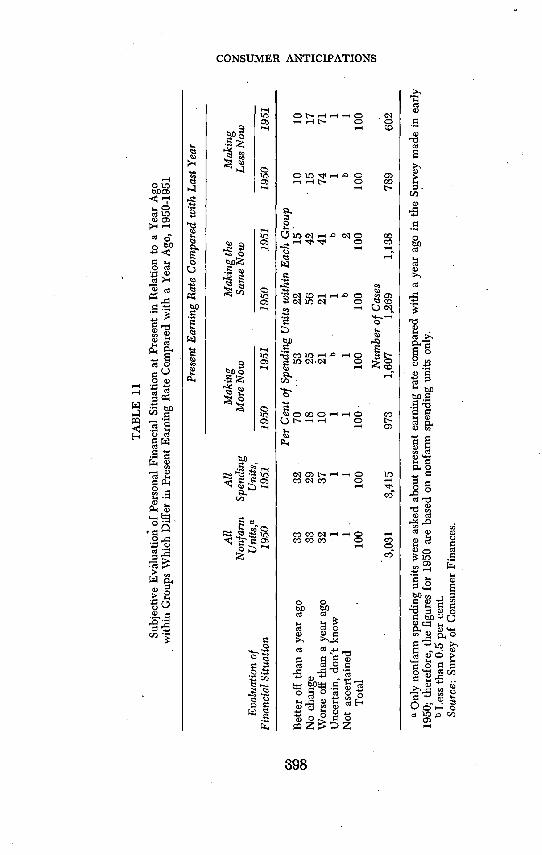
changes in his rate of income in the recent past. He will not limithimself, however, to. looking at his dollar income. In estimatingwhether he is better off than he was, a consumer may take intoaccount any kind of shift in his financial position, including changes•in his estimated future liabilities, changes in the value of his assets,and price changes (see tables 9 and 10). Many individuals whoserate of income has increased over a year feel at the end of theyear that they are worse off than they were at the beginning, andthe reverse is also true. The trend in the proportions of the popu-lation who fall in these deviant groups and the reasons they givefor their statements provide valuable sources of information on con-sumer reactions to economic events (see table 11).
396

CONSUMER ANTICIPATIONS
TABLE 9Subjective Evaluation of Personal Financial Position
Compared with Year Ago, 1950-1951
Evaluation of Financial Situation 1950 1951
Better offPer Cent of AU
32Spending Units
32About the same 32 29Worse off 34 37Undecided, don't know 1 1Not ascertained 1 L
Total 100 100Number
3,512of Cases
3,415
Source: Survey of Consumer Finances. The question was: "Would you sayyou folks are better off or worse off financially now than you were a year ago?"
TABLE 10Causes of Changed Financial Position of Spending Unit, 1950-1951
(percentage of units mentioning different factors)
1950 1951
Factors making for improved positionWage or salary raise, promotion, shift to better job 20 30More work, steadier work, overtime,
more members of spending unit working 8 11Higher returns from business, farm, profession 3 6Better net worth position, greater savings,
bills paid, house bought 10 11Other factors 7 9
Factors making for less satisfactory positionWage or salary cut, shift to poorer job 5 . .4Less work, less steady work,unemployment,
less overtime 15 9Lower returns from business, farm, profession 9Higher prices, high cost of living 3 32Increased expenses not due to higher prices 6 7Other factors 10 14
Source: Survey of Consumer Finances. Based on answers to the questioncited in the footnote to table 9 and the question: "Are you folks making asmuch money now as you were a year ago, or more or less?" Each of these ques-tions is followed by a supplemental question such as "How is that?" or "Whyis that?"
Since a respondent may mention more than one factor, the columns add tomore than 100 per cent.
397.
S
TAB
LE 1
1Su
bjec
tive
Evàl
uatio
ii of
Per
sona
l Fin
anci
al S
ituat
ion
at P
rese
nt in
Rel
atio
n to
a Y
ear A
gow
ithin
Gro
ups W
hich
Diff
er in
Pre
sent
Ear
ning
Rat
e C
ompa
red
with
a Y
ear A
go, 1
950-
1951
Eval
uatio
n of
All
Non
f arm
Uni
ts,a
All
Spen
ding
Uni
ts,
Pres
ent E
arni
ng R
ate
Com
pare
d w
ithLa
st Y
ear
Mak
ing
Mak
ing
the
Mor
e N
owSa
me
Now
Mak
ing
Less
Now
Fina
ncia
l Situ
atio
n19
5019
5119
5019
5119
5019
5119
5019
51
Bet
ter o
ff th
an a
yea
r ago
3832
Per C
ent o
f Spe
ndin
g U
nits
with
in E
ach
Gro
up70
5322
1510
10N
o ch
ange
Wor
se o
ff th
an a
yea
r ago
Unc
erta
in, d
on't
know
33 32 1
29 37 1
1856
4210
2121
411
b1
b
1517
7471
11
Not
asc
erta
ined
11
11
b2
b1
Tota
l10
010
010
010
010
010
010
010
0
3,03
13,
415
Number of
Cas
es97
81,
607
1,26
91,
138
789
602
a O
nly
nonf
arm
spen
ding
uni
ts w
ere
aske
d ab
out p
rese
nt e
arni
ng ra
te c
ompa
red
with
a y
ear a
go in
the
Surv
ey m
ade
in e
arly
1950
; the
refo
re, t
he fi
gure
s for
195
0 ar
e ba
sed
on n
onfa
rm sp
endi
ngon
ly.
b Le
ss th
an 0
.5 p
er c
ent.
Sour
ce: S
urve
y of
Con
sum
er F
inan
ces.
03 00
0 z
CONSUMER ANTICIPATIONS
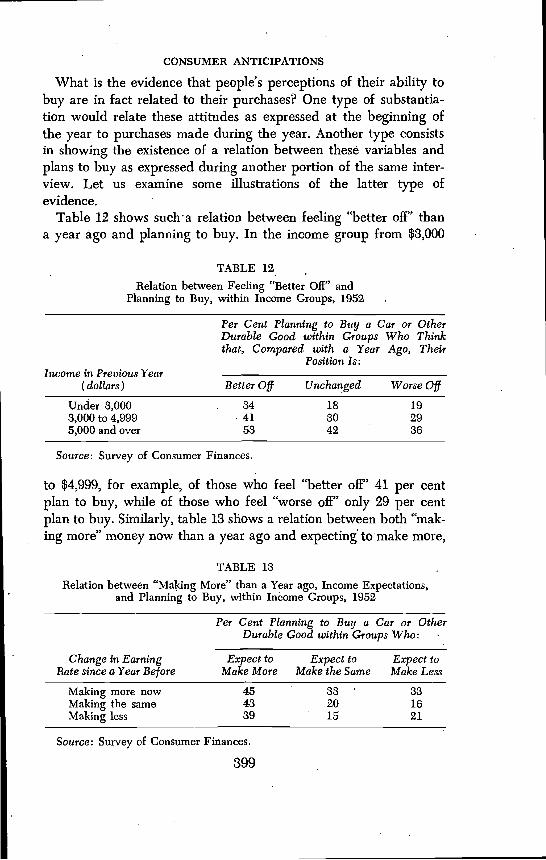
What is the evidence that people's perceptions of their ability tobuy are in fact related to their purchases? One type of substantia-tion would relate these attitudes as expressed at the beginning ofthe year to purchases made during the Another type consistsin showing the existence of a relation between these variables andplans to buy as expressed during another portion of the same inter-view. Let us examine some illustrations of the latter type ofevidence.
Table 12 shows relation between feeling "better off" thana year ago and planning to buy. In the income group from $3,000
TABLE 12Relation between Feeling "Better Off" and
Planning to Buy, within Income Groups, 1952
Per Cent Planning to Buy a CDurable Good within Groupsthat, Compared with a Year
Position Is:
ar or OtherWho ThinkAgo, Their
Income in Previous Year(dollars) Better Off Unchanged Worse Off
Under 3,000 . 34 18 193,000 to 4,999 41 30 295,000 and over 53 42 36
Source: Survey of Consumer Finances.
to $4,999, for example, of those who feel "better off" 41 per centplan to buy, while of those who feel "worse off" 'only 29 per centplan to buy. Similarly, table 13 shows a relation between both "mak-ing more" money now than a year ago and expecting' to'make more,
TABLE 13Relation between "Making More" than a Year ago, Income Expectations,
and Planning to Buy, within Income Groups, 1952
Per Cent PlaDurable
nning to Buq a Car or OtheGood within Groups Who:
r
ChangeRate since
in Earninga Year Before
Expect toMake More
Expect toMake the Same
Expect toMake Less
Making more now 45 33 33MakingMaking
the sameless
4339
2015
1621
Source: Survey of Consumer Finances.
399

CONSUMER ANTICIPATIONS
on the one hand, and planning to buy, on the other. The popula-tion is divided into nine groups in this table. First, each spendingunit was classified according to whether it is "making more," "thesame," or "less"; then each of these groups was divided accordingto expected changes in income. The body of the table shows thepropOrtion within each of the nine groups who plan to buy. Forexample, of those who are making more and also expect to make'more, 45 per cent plan to buy, but of those who are making lessand expect a further decline, only 21 per cent plan to buy.
Another aspect of consumers' estimates of their personal situa-tion is their underlying attitude toward their liquid assets. For ex-ample, there may be changes in people's plans or lack of plans forthe use of their series E bonds. In fact there have been no funda-mental changes in this area in the postwar period. A related possi-bility is that continued actual and prospective price increases maylead people. to believe that it is unwise to keep their money inliquid assets (see table 14). Plans for the use of liquid assets be-come particularly 'interesting at decision points, such as when bondsmature.
Most economists will agree that it is important for the economywhether consumers do or do not continue to hold liquid assets. Thepoint which is open to debate is the validity of the questions used,a matter which might be investigated by reinterviewing spendingunits to discover what they actually did with their maturing bonds,for example. No such investigation has been undertaken.
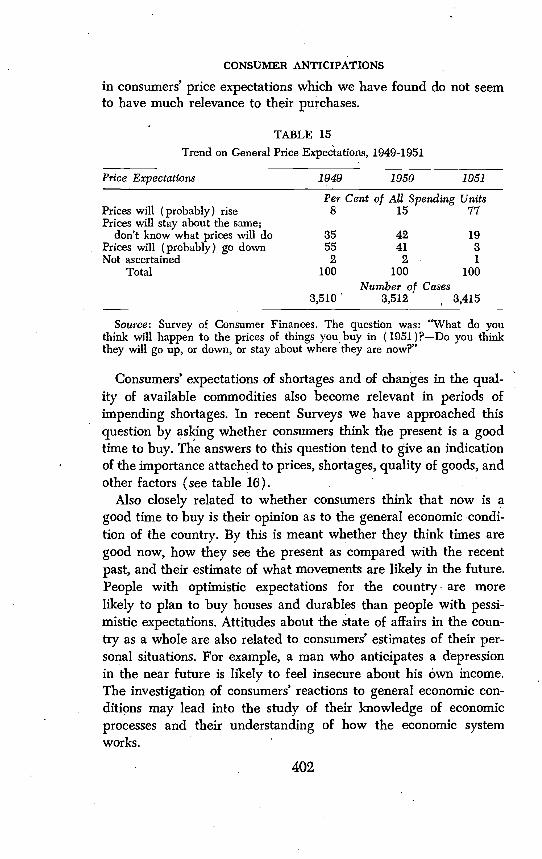
Consumers take into account not only their personal financialsituation, but also the economic environment in which they live.Their views of the situation in individual markets, and of the under-lying economic situation in the country as a whole, may be relevantto their purchases. Consumers' attitudes toward the present level ofprices and their price expectations are relevant here (see table 15).Surprisingly, the data indicate little or no relation between con-sumers' price expectations and their plans to buy or their actualpurchases. The available data on price expectations concern expec-tations for a period of a year, and one may argue that a longer orshorter period is relevant. The data also refer only to the directionof price movement, and it can that more effort should beput into estimating the magnitude of the expected change or theassurance with which consumers predict that prices will behave ina certain way. As matters now stand, however, the actual variations
400

0 0 z U,
TAB
LE 1
4"W
ises
t Pla
ce to
Put
Mon
ey,"
by
Inco
me
Gro
ups,
1949
and
195
1
0
$3,0
00or
Ove
r$3
,000
to3,999
$4,000 to 4,999
$5,0
00to 7,499
$7,500
or o
ver
Wis
est P
lace
toPu
t Mon
ey19
4919
5119
4919
5119
4919
5119
4919
5119
4919
51
Fixe
d m
oney
ass
ets
7969
Per C
ent o
f All
Spen
ding
Uni
ts in
. Des
igna
ted
Inco
me
Gro
ups
8680
8070
7465
6447
Ban
ks18
1320
1617
1417
918
7Sa
ving
s bon
ds54
Ban
ks a
nd b
onds
749 7
5954
5648
4951
437
107
88
55
37 3
Var
iabl
e m
oney
val
ue a
sset
s11
Com
mon
stoc
k2
23 88
1412
2314
2622
12
33
67
45 16R
eal e
stat
e9
167
129
1711
1914
23C
omm
on st
ock
and
real
est
ate
a1
aa
aa
11
16.
All
othe
r com
bina
tions
54
23
4.
17
57
7N
one
of th
ese
12
a3
23
22
1D
oesn
't kn
ow, n
ot a
scer
tain
ed5
22
31
42
24
1To
tal
100
100
100
100
100
100
100
100
100
100
1,75
1.
1,00
0kNumber of Cases
671
300b
414
220b
407
270b
259
150b
a Le
ssth
an 0
.5 p
er c
ent.
bA
ppro
xim
atio
n.So
urce
:Survey
of C
onsu
mer
Fin
ance
s. Th
e qu
estio
n w
as: "
Now
I ha
ve o
ne la
st q
uest
ion
abou
t how
peo
ple
save
. Sup
pose
a m
an h
as so
me
mon
ey o
ver a
nd a
bove
wha
t he
need
s for
his
exp
ense
s. W
hat d
o yo
u th
ink
wou
ld b
e th
e w
ises
t thi
ng fo
r him
to d
o w
ith it
now
aday
s: P
ut it
in th
e ba
nk, b
uy g
over
nmen
t sav
ings
bon
ds w
ith it
, inv
est i
t in
real
est
ate,
or b
uy c
omm
on st
ock?
"
CONSUMER ANTICIPATIONS
in consumers' price expectations which we have found do not seemto have much relevance to their purchases.
TABLE 15Trend on General Price Expectations, 1949-1951
Price Expectations 1949 1950 1951
Per Cent of All Spending UnitsPrices will (probably) rise 8 15 77Prices will stay about the same;
don't know what prices will doPrices will (probably) go downNot ascertained
35552
42412
1931
Total 100
3,510
100 100Number of Cases
3,512 3,415
Source: Survey of Consumer Finances. The question was: "What do youthink will happen to the prices of things you buy in (1951 )?—Do you thinkthey will go up, or down, or stay about where they are now?"
Consumers' expectations of shortages and of changes in the qua!-ity of available commodities also become relevant in periods ofimpending shortages. In recent Surveys we have approached thisquestion by asking whether consumers think the present is a goodtime to buy. The answers to this question tend to give an indicationof the importance attached to prices, shortages, quality of goods, andother factors (see table 16).
Also closely related to whether consumers think that now is agood time to buy is their opinion as to the general economic condi-tion of the country. By this is meant whether they think times aregood now, how they see the present as compared with the recentpast, and their estimate of what movements are likely in the future.People with optimistic expectations for the country are morelikely to plan to buy houses and durables than people with pessi-mistic expectations. Attitudes about the state of affairs in the coun-try as a whole are also related to consumers' estimates of their per-sonal situations. For example, a man who anticipates a depressionin the near future is likely to feel insecure about his own income.The investigation of consumers' reactions to general economic con-ditions may lead into the study of their knowledge of economicprocesses and their understanding of how the economic systemworks.
402

CONSUMER ANTICIPATIONS
TABLE 16Opinions of Buying Conditions and Reasons Given for These Opinions,
Early 1951(percentage of spending units in the population)
Per Cent ofPer Cent of
Opinions and Reasons PopulationPer Cent ofReasonsa
Population forGiven Reason
Good or very good time to buy 32Reasons given by those who feel
it Is a good time:Shortages, present or expected 39 - 17Prices going up, or not coming down 33 14Quality good now, better than
itwilibe 7 3People can afford to buy now 3 1Taxes on goods will be increased 1Personal situation good 2 1Other supporting reasons 5 2
Subtotal 92Reservations expressed ("It's a good
time but. . . .") 6 3Reasons not ascertained 2 1
Total 100Middle position: In some ways a goodtime, in other ways a bad time to buy;or it depends 13
Reasons why it a good time givenby those who take the middleposition:
• Shortages, present or expected 15 8Prices going up, or not coming down 8 2People can afford to buy now 3 1Quality good now, better than
itwifibe 8 1Other reasons good time to buy 5 1
Subtotal 34Factors on which "it depends" (ac-
cording to some people who takethe midd'e position)
Depends on personal situation 38 7Depends on other factors 2 1-
Subtotal 40Reasons why it is a bad time
given by those who take themiddle position:
Prices are high; prices going up 16 3Other reasons bad time to buy 9 2
Subtotal 25Reasons not ascertained 1
Total 100
403

CONSUMER ANTICIPATIONS
TABLE 16 (continued)
Opinions and Reasons
,
Per Cent ofPopulation
Per Cent ofReasonsa
Per Cent ofPopulation forGiven Reason
Bad or very bad time to buy 50Reasons given by those who feel
it is a bad time:Prices are high; prices going up 57 37Quality is poor; emphasis now on
quantity 6 4Personal situation bad 5 3Shortages, materials needed for war 5 3Conditions are uncertain 4 3Taxes on goods are high 2 1Too many regulations on install-
ment buying 2, 1Buying would cause panic buying,
inflation, shortages 2 1
Bad times ahead, should save now 2 1Price controls will keep prices from
rising 1 1Bad time, other reasons 5 3
Subtotal 91Reservations expressed 6 4Reasons not ascertained 3 2
Total 100Don't know 8OTiinions not ascertained 2
Total 100Number of cases 1,925 3,415
a The percentage distribution of reasons is given for each segment of thepopulation classified in the three major opinion
Source: Survey of Consumer Finances. The question was: ". . . looking atthings in general, do you. think it's a good time or a bad time to buy autos andlarge household items?" After the respondent had expressed his opinion he wasasked, "Why?" About one-third of the respondents gave two or more reasonsfor their Opinion, of which two are included in these percentages.
Table 17 indicates that there is a relation between thinking thatthe present is a good time to buy cars and dürables and actuallyplanning to buy. For example, in the income group below $3,000,
• of who feel the present is a good time to buy 31 per cent plantà buy, but of those who feel that the present is a bad time to buy,only 20 per cent plan to buy. A positive relation between feelingthat the general economic outlook is favorable and planning to buyhas been found repeatedly in the Survey.7 Since 1950, however, the
Katona, op.cit., table 32, p. 183. The same tabLe includes data show-ing the lack of relation between price expectations and plans to buy.
404-

CONSUMER ANTICIPATIONS
question about whether the individual expects good or bad timesfor the country as a whole has been crowded out of the Surveys.
TABLE 17Relation between Feeling that Now Is a Good Time to Buy and
Planning to Buy, within Income Groups, 1952
Income in
Per CentCar or
of SpeOther
nding Units PlanDurables within
Think that:
nine to Buy aGroups Who
Previous Year Now is a Good Now is a Bad(dollars) Time to Buy it Depends Time to Buy
Under 3,000 31 35 203,000 to 4,999 41 32 315,000 and over 48 43 41
Source: Survey of Consumer Finances.
Consumers' willingness to buy depends upon their needs andaspirations, as well as upon their estimate of their economic posi-tion. Investigation of consumers' wants leads to the consideration oftheir present stocks of goods. Data about the level of stocks con-sidered in isolation are likely to prove misleading. Consumers'wants are capable of expansion, and anyone who assumes that theproportion of the population who own some commodity will notrise above a certain level can be mistaken. Data about stocks may,however, be used for such purposes as to separate demand into twocomponents: demand for the first purchase of a particular type ofgood, for example, the first purchase of an automobile by an indi-vidual; and replacement demand, for example, trading in a carbought used for a new car.
3. PLANS TO BUY8
The final category of data relevant to projections of demand isdata about cOnsumers' plans to buy cars, houses, and durable goods.Strictly speaking, these data refer not to plans but to expectedpurchases, since the questions ask whether individuals "expect tobuy" these items. Since what people expect to buy reflects bothwhat they are able to buy and what they wish to, these data are the
A discussion of the data on planning by consumers appeared in "Values andLimitations of Consumer Financial Surveys for Economic Research," by R. A.Young and D. McC. Holthausen, Federal Reserve Bulletin, March 1947.
405

CONSUMER ANTICIPATIONS
result of the interaction of all the factors just discussed. In a sensethese questions represent the direct approach to the problem ofprojecting demand. If you want to know what a man is going to do,one way to find out is to ask him (see table 18). You may discover
TABLE 18Consumer Intentions to Purchase Automobiles,Other Durable Goods, and Houses, 1948-1951
Attitude toward Purchase 1948 1949 1950 1951
Automobiles Per Cent of All Spending UnitsWillbuyaProbably will buy, undecided
7 9 109 10 7
57
Do not plan to buy 84 81 83 87Not ascertained b 1
Total 100 100 100 100Other durable goods
Will buyaProbably will buy, undecidedDo not plan to buy
16 17 1911 14 972 69 72
207
72Not ascertained b b b
Total 100 100 100 100Houses (non farm)
WillbuyaProbably will buy, undecidedDo not plan to buyNot ascertained
3 3 44 4 4
83 83 821) 1 1
35
831)
Farmer (question not applicable)Total
10 9 9100 100 100
9100
. 3Number of Cases
,562 3,510 3,512 3,415c
a Includes those who have already bought during the year. Since interviewingtakes place during both January and Februa.ry, about one month's actual pur-chases are included in the "will buy" category.
bLess than 0.5 per cent.c For 1951 the number of cases is 3,415 for houses only. For automobiles and
other durables the number is 1,927.Source: Survey of Consumer Finances. The questions asked are: "Do you
expect to buy a house for your own year-round use this year, 19—?"; "Doyou expect to buy a car this year, in 19—?"; "Do you expect to buy any largeitems such as furniture, a refrigerator, radio, television set, household appliancesand so on—during this year 19—?"
what he would like to do,. however, instead of what he actuallywill do.
In reinterviewing persons who stated that they planned to buyhouses, cars, or other durables, we have found that there is a con-siderable degree of agreement between what an individual says he
406
CONSUMER ANTICIPATIONS
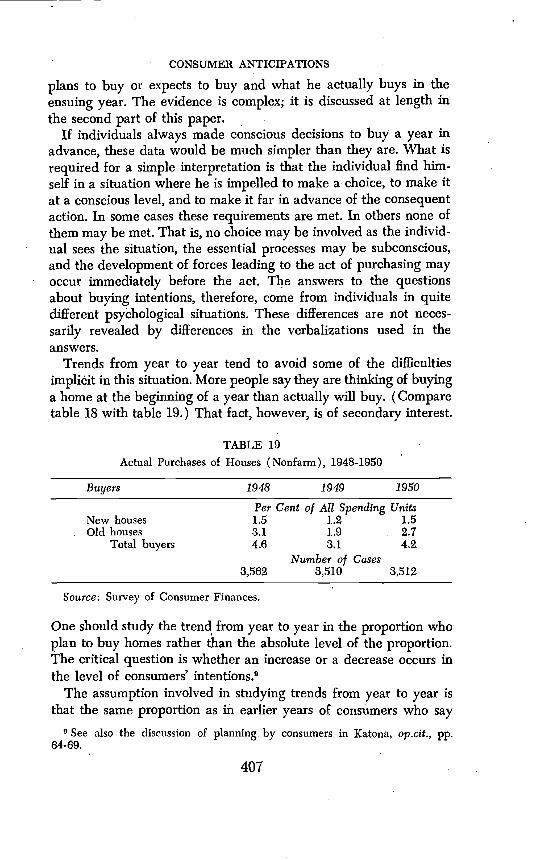
plans to buy or expects to buy and what he actually buys in theensuing year. The evidence is complex; it is discussed at length inthe second part of this paper.
If individuals always made conscious decisions to buy a year inadvance, these data would be much simpler than they are. What isrequired for a simple interpretation is that the individual find him-self in a situation where he is impelled to make a choice, to make itat a conscious level, and to make it far in advance of the consequentaction. In some cases these requirements are met. In others none ofthem may be met. That is, no choice may be involved as the individ-ual sees the situation, the essential processes may be subconscious,and the development of forces leading to the act of purchasing mayoccur immediately before the act. The answers to the questionsabout buying intentions, therefore, come from individuals in quitedifferent psychological situations. These differences are not neces-sarily revealed by differences in the verbalizations used in theanswers.
Trends from year to year tend to avoid some of the difficultiesimpliáit in this situation. More people say they are thinking of buyinga home at the beginning of a year than actually will buy. (Comparetable 18 with table 19.) That fact, however, is of secondary interest.
TABLE 19Actual Purchases of Houses (Nonfarm), 1948-1950
Buyers 1948 1949 1950
New housesPer1.5
Cent of All Spending1.2
Units1.5
. Old housesTotal buyers
3.14.6
1.93.1
2.74.2
3,502Number of Cases
3,510 3,512
Source: Survey of Consumer Finances.
One should study the trend from year to year in the proportion whoplan to buy homes rather than the absolute level of the proportion.The critical question is whether an increase or a decrease occurs inthe level of consumers' intentions.9
The assumption involved in studying trends from year to year isthat the same proportion as in earlier years of consumers who say
See also the discussion of planning. by consumers in Katona, op.cit., pp.64-69.
407

CONSUMER ANTICIPATIONS
they do or do not expect to buy are accurately foreshadowing theirbehavior. In other words, we assume constancy from year to year inthe elements which lead some consumers to understate and othersto overstate their intentions.
This assumption is closer to the facts than the assumption thatthe proportion who do buy will turn out to be exactly equal to theproportion who say they will buy. Nevertheless, there 'is strongreason to believe it will not always be proved correct. The bestmethod we have of assessing the meaning of trends in expectedpurchases is to study the underlying factors, consumers' basic abilityto buy and willingness to buy.
There are great advantages, then, in interpreting the data on ex-pected purchases in relation to the other data from the Surveys. Allthe data—consumers' ability to buy, their willingness to buy, andtheir expected purchases—should form a consistent picture. To theextent that this internal consistency appears in fact, One can haveconfidence in the conclusions drawn. For example, if a much largergroup of people should plan to buy in one year than a year earlier,but people's ability to buy appears weaker, doubt would be cast onthe carrying out of the plans. On the other hand, if ability to buyis at a lower level,, but plans to buy decline and consumers regardthe present as a bad time to buy, the findings form a consistentpicture.
By way of summarizing to this point, it may be useful to list thevariables we have been discussing in the scheme for analyzing con-sumer demand. The principal variables are as follows:
I. Ability to buyA. Trend in distribution of income
1. Trend in median income2. Trend in proportion with very low incomes8. Trends in allocation of income—proportion of positive
savers, proportion of durable goods buyersB. Trend in distribution of liquid assets
1. Trend in median2. Trend in proportion with no liquid assets
C. Trend in ability to borrow1. Trend in use of borrowing in past purchases2. Trend in ratio of total consumer debt to incomes
a Not covered at all or covered only in part in the Survey of ConsumerFinances.
408
CONSUMER ANTICIPATIONS
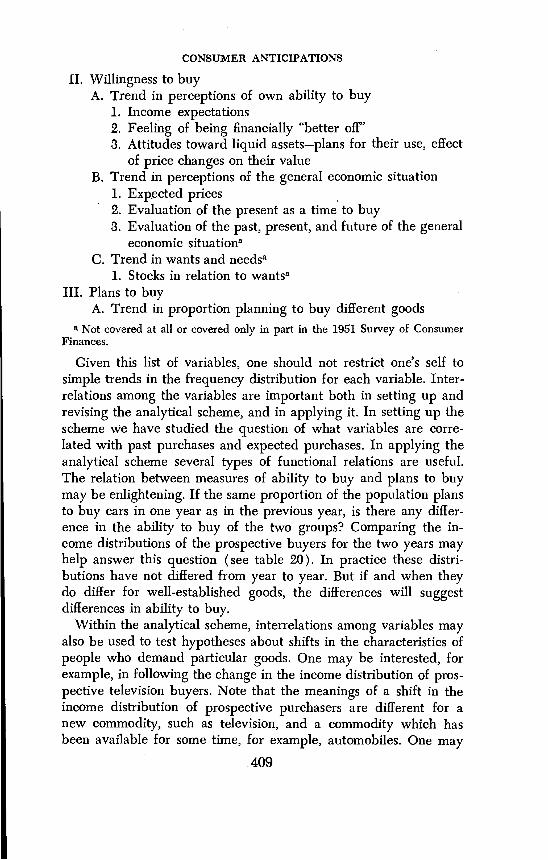
H. Willingness to buyA. Trend in perceptions of own ability to buy
1. Income expectations2. Feeling of being financially "better off"3. Attitudes toward liquid assets—plans for their use, effect
of price changes on their valueB. Trend in perceptions of the general economic situation
1. Expected prices2. Evaluation of the present as a time to buy3. Evaluation of the past, present, and future of the general
economic situationaC. Trend in wants and needsa
1. Stocks in relation to wantsaIII. Plans to buy
A. Trend in proportion planning to buy different goodsNot covered at all or covered only in part in the 1951 Survey of Consumer
Finances.
Given this list of variables, one should not restrict one's self tosimple trends in the frequency distribution for each variable. Inter-relations among the variables are important both in setting up andrevising the analytical scheme, and in applying it. In setting up thescheme We have studied the question of what variables are corre-lated with past purchases and expected purchases. In applying theanalytical scheme several types of functional relations are useful.The relation between measures of ability to buy and plans to buymay be enlightening. If the same proportion of the population plansto buy cars in one year as in the previous year, is there any differ-ence in the ability to buy of the two groups? Comparing the in-come distributions of the prospective buyers for the two years mayhelp answer this question (see table 20). In practice these distri-butions have not differed from year to year. But if and when theydo differ for well-established goods, the differences will suggestdifferences in ability to buy.
Within the analytical scheme, interrelations among variables mayalso be used to test hypotheses about shifts in the characteristics ofpeople who demand particular goods. One may be interested, forexample, in following the change in the income distribution of pros-pective television buyers. Note that the meanings of a shift in theincome distribution of prospective purchasers are different for anew commodity, such as television, and a commodity which hasbeen available for some time, for example, automobiles. One may

CONSUMER ANTICIPATIONS
also be interested in long-run shifts in a market resulting from suchforces as the changing age distribution of the population, but shiftsof this sort are likely to be small in any one year and to be obscuredby sampling fluctuations.
TABLE 20Distribution of Prospective Car Purchasers by Income, 1948-1951
Income (dollars) 1948 1949 1950 1951
Per Cent• Under 1,000 3 4 4 5
1,000to 1,999 7 11 102,000 to 2,999 19 16 16 133,000 to 3,999 20 23 20 204,000 to 4,999 17 16 16 185,000 and over 84 32 33 34
Total 100 100 100 100
438Number499
of Cases464 145
Source: Survey of Consumer Finances. This table includes those who actuallyhad bought a car in the month or so before they were interviewed in thecalendar year, and those who said they "definitely" or "probably" would buybefore the end of the year, but not those who were "undecided" about buying.
In applying the scheme it has also proved important to studytrends in the relations between certain attitudes. For example, thetrend in the relation between answers to a question about whetheran individual is making more money than he was a year ago, andanswers to a question on whether he feels that he is "better off"than he was a year ago, is revealing. The principal factor whichtends to cause changes in this relation is popular awareness of theimpact of price changes. When prices are rising, there is a tendencyfor a smaller proportion of those who are making more to say theyare better off. The inference as to the importance of prices is sup-ported by the reasons people give as to why they are better off orworse off than they were a year earlier.
It is also possible to use data from the Surveys to study the under-lying structures of demand for automobiles, for houses, and, to someextent, for the other durables. To the extent that the results of analy-sis of the underlying structures of demand for individual items areavailable they can be used to supplement; and hence to strengthen,general conclusions about the level of consumers' demand. As thecomplexity of the analysis increases, however, it takes more timeand more effort to complete the preliminary study. Nevertheless,
410

CONSUMER ANTICIPATIONS
this is one direction in which it would be possible to expand ourefforts in the future.
4. APPLICATION OF ANALYTICAL TECHNIQUE
As a means of summarizing the preceding discussion it might behelpful to illustrate the application of the analytical technique tothe data for a particular year. Let us select 1951, the year of thisConference. Consumer demand was high in the period following theoutbreak of the Korean war and prices of all kinds of commoditiesrose. The Department of Labor's index of wholesale prices, for ex-ample, reached a peak in March 1951, just after the survey wastaken.
The data on consumers' ability to buy early in 1951 showed onlymodest changes from a year earlier. The distribution of incomeshifted upward, with the median income rising some 10 per centto a level of $3,000 (see table 1). Since the sampling error of medianincome is roughly $150 (at the 95 per cent level of probability), wemay infer that the difference of $300 in income between thetwo years was not the result of chance fluctuations in the sample.b0Prices had risen by about the same proportion over the year. Theproportion of consumers in the low income group below $2,000showed a slight decline, from 33 to 30 per cent of all spending units,but this decline must be interpreted in the light of the change inthe price level. The decline is large enough not to be attributable tochance. A difference between these two proportions as large as 2.9per cent might occur by chance, but the actual difference is 3.2per cent.11
The distribution of liquid assets also showed only modest differ-ences from the distribution for a year earlier. The proportion ofthe population with no liquid asset holdings fell slightly, from 31to 28 per cent, reversing a trend which had continued from 1947through 1950. Again the difference is just large enough to be reliable.As a result the median holding of all spending units tended to in-crease, but there was a decline in the median holdings of all thosewho had any liquid assets. The median for holders fell, in fact, from$810 to $710. The sampling error of this difference has not been
10 The estimate of $150 must be taken as rough since it was made on thebasis of data for earlier years, but it is highly unlikely that new estimates wouldbe twice as high.
11 The yardstick of chance used here and in the following discussion is the95 per cent level of probability.
411

CONSUMER ANTICIPATIONS
estimated specifically, in contrast to the situation with respect tomedian income. But the decline of 3 per cent in the proportion withholdings over $2,000 is reliable (see table 4).
The data on consumers' ability to borrow, as noted earlier, arenot entirely satisfactory. The proportion of purchasers of cars anddurables who borrowed in the year 1950 appeared to be running atabout the same level as the year before. Actually, the data indicatethat the proportion of car buyers who paid cash fell by 3 per cent,while the proportion of buyers of other durables who paid cash forall items rose by 3 per cent (see tables 6 and 7). No doubt theseaverage figures for the year obscured opposing tendencies fromperiods before and after the introduction of credit regulations. Byand large, consumers' ability to buy in early 1951 was not too dif-ferent from their ability to buy in early 1950.
Willingness' to buy showed a somewhat more complex picture.Income expectations improved, with a third more expecting incomeincreases than a year earlier. The increase was from 30 to 39 percent, or three times as much as might be attributed to samplingerror (see table 8). People did not feel, however, that 'they were'better off than a year earlier. If anything, a somewhat larger groupthought that they were worse off, in spite of the fact that almostone-half the population said they were making more money thanthey had a year earlier. The proportion reporting that they felt"better off" was unchanged at 32 per cent, but the proportion feel-ing "worse off" increased from 34 to 37 per cent, a reliable increase.Of those who were making more only about half felt they werebetter off, compared with 70 per cent the year before (see table 11).Spontaneous mentions of high prices and the high cost of living asfactors which tended to make people worse off increased almost tentimes, from 3.5 to 32 per cent (see table 10). These changes, ofcourse, are far larger than could be attributed to chance.
People's attitudes toward their liquid assets proved to be under-going only a slow change. The comparison here is over a two-yearperiod. There was an increase from 11 to 23 per cent in the pro-portion thinking stocks and real estate were the wisest place to puttheir money, while the overwhelming majority (69 per cent) stillpreferred fixed value assets (see table 14).
Consumers' perceptions of the general economic situation changedmore rapidly. A large majority (77 per cent) expected price in-creases in early 1951 (see table 15). These were not interpreted,however, as meaning that the present was a good time to buy. On
412

CONSUMER ANTICIPATIONS
the contrary, only 32 per cent of the population felt that the presentwas a good time to buy and more of these were concerned withpresent or expected shortages (39 per cent) than with the price level(33 per cent) (table 16). One-half of the population felt the pres-ent was a bad time to buy, the remainder being undecided or am-bivalent. Of those who felt it was a bad tune to buy, by far thelargest number referred to high prices.
Plans to buy reflected the cautious conclusions which emergedfrom the data on ability to buy and willingness to buy. About thesame number of people were thinking of buying a house as a yearearlier, but they tended to be less certain that they would actuallybuy. The proportion indicating definite plans fell from 4 to 3 percent. The unrounded difference is 1.2 per cent, or barely enoughfor reliability. An equal and opposite movement occurred in theproportion with less definite plans (see table 18). The proportionplanning to buy a car showed a definite decline from 17 to 12 percent of the spending units. The proportion planning to buy otherdurables remained more or less unchanged at 27 to 28 per cent of thepopulation.
The general conclusion which emerges is that people felt theywere in about as strong a position to buy in early 1951 as they hadbeen in 1950, but they had real doubts about the wisdom of makinglarge purchases in 1951. These doubts were much more widely heldthan the idea that one should convert everything into goods to rideup with the inflation. Traces of the latter attitude may be found inthe answers to the question about the wisest place to put one'smoney, but these answers must be considered along with the state-ments about being "worse off" because of high prices and about thepresent being a bad time to buy because of inflation.
Taken together, the data from the Survey suggested that con-sumer demand would be somewhat weaker in 1951 than in 1950. Inother words, a decline in the volume of purchases by consumerswas indicated. This projection, like any other, was subject to thepossibility that forces not taken into account might change thevariables which entered into the analysis sufficiently to alter thecourse of events. Ability to buy may change as a result of events inother sectors of the economy. Willingness to buy and plans to buymay change similarly. Forces in the consumer sector not taken intoaccount also may cause the projection to go astray. Since the possi-bilities include any factors which may change willingness to buy,its determinants, as well as the impact of forces in the other sectors
413
CONSUMER ANTICIPATIONS
of the economy on the level of income, must be taken into account.Ultimately, we may hope to be able to say more than is now possibleabout what invalidates projections for the consumer sector.
It is inherently difficult to validate as a whole .a method of analy-sis such as that presented above. Certainly one should examine therecord of inferences drawn in the past. Since the paper by IrvingSchweiger elsewhere in. this volume is conôerned with this problem,it need not be discussed here. However favorable the record may be,there is always the possibility that events have moved in the rightdirection for the wrong reasons. This possibility isserious, as mentioned earlier, for projections based on one sectorconsidered in isolation.
The reinterviewing of identical economic units offers another toolfor the of projections which we have employed for thestudy of one major . element in the analytical scheme, the data onintentions to buy. The separate study of these data has proved en-lightening for the method as a whole, though it does not constitutea test of it.
C. Reinterview Data12
In practice, prediction of forthcoming purchases of durable goodswill generally be based on trend data derived from repeated inter-views. However, one's understanding of the data is deepened by areinterview investigation of individual expectancies, abilities, andfulfillments. This approach is the subject of this section. It is pri-marily an exploratory look at sub jectivé expectancies as a predictiveinstrument. Analytically, it is little more than a presentation of data,but much of the confidence that is placed in the previously developedschema arises out of analyses of this nature.
In the Surveys of Consumer Finances, data on expectancies re-garding purchases of durable goods are only one item or elementin the set of those factors that offer some insight into the consumersector of the economy.
When one concentrates on "expectancies" (the resultants of needs,wants, means, etc.) as a predictor, one is making several assump-tions about the functions of the other elements in the situation—asimpediments or facilitators. Knowledge of their influence and rele-vance is therefore important. Reinterviews with identical respond-ents enable the investigator to check on the realization of expect-
12 Stephen B. Withey is primarily responsible for this section.
414
CONSUMER ANTICIPATIONS
andes by individuals and also the predictive value of aggregateexpectancy data, and to relate them to impeding or facilitatingfactors.
On an a priori basis one would not expect all those expressing apurchase expectancy actually to carry out their plans, even in aperiod as long as a year. This is one reason why no attempt is madein this analysis to develop equations for prediction of individualbehavior. The development of formulae for aggregate predictionwould require either repeat reinterviews or repeat interviews overan extended period. .
There are many circumstances that would prevent realization ofeven realistic expectancies. Such circumstances might be predictedfor a population on an actuarial basis if sufficient data were avail-able. For events to work out as predicted for the population, themiscalculations for individuals must more or less cancel out, or the.bias must be known and therefore be correctable. The peculiar ad-vantage of the approach through individual predictions is that it ispossible to go back to the people originally investigated and, bystudying in detail why some of the expectancies were fulfilled andsome not, gain some insight into the type of bias present in aggre-gate predictions.
The Survey Research Center conducted reinterviews of this kindin January-February 1949, a year after the original interview tookplace, and in October 1949, nine months after the first interview.
The procedure followed for reinterview was to pick, by randomselection, a sample of the representative sample interviewed in thefirst study. The reinterview sample was drawn only from urbanaddresses. The identification of a house by a street name and housenumber facilitates recontact identification. In rural areas one oftenhas to resort to house descriptions and these sometimes make re-location difficult.
The reinterviews totaled 655 cases with the one-year interval and590 cases with the nine-month interval. It is apparent that with suchsmall samples a valid check on some items bought by a very smallsection of the urban population cannot be made. This is anotherreason why no mathematical or statistical manipulations of the dataseemed to be warranted.
The following tables will include some absolute figures where thenumber of cases is too few to permit the confident use of percent-ages. Only the rare opportunity for a reinterview prompts the pres-entation of so few cases. Further, there are so many variables réle-
415

CONSUMER ANTICIPATIONS
vant to the topic that the text will be kept to a minimum to permittabular presentation of the data. Much of the interpretation of thetables is left to the reader, since in many cases it would be repeti-tious to summarize the table in the text, and in other cases a largerfrequency would be needed before statistical treatment could clarifythe relations for interpretive insight.
From these studies data will be offered on: (1) ratio of aggregatepurchases to aggregate expectancies; (2) ratio of individual fulfill-ment of expectancies to individual expectancies; (8) factors in ex-pectancy realization or nonfulfillment, involving chiefly (a) periodof consideration of purchase and period involved in prediction;(b) postponement of purchase; (c) imprecision in measured ex-pectancies due to vagueness in the expectancy, imprecise measur-ing instruments, and not interviewing the person most involved inthe decision; (d) miscellaneous factors such as illness, accident, andaltered circumstances; (e) financial and economic factors affectingfulfillment or nonfulfillment.
Initially, the method used for measuring expectancies and certainconditions at the time of the surveys will be summarily recalled. Thefirst problem that confronts the investigator and the one most sub-ject to manipulative experimentation is the method of measuringexpectancies. The method used in the Surveys of Consumer Financeshas been the simple one of asking each respondent whether heplanned to buy the item during the coming year. The answer, re-corded verbatim by the interviewer, is evaluated by the contentanalysts and the reply categorized on a five-point scale of expect-ancy, reading: definitely will buy; probably will buy; undecided;probably will not .buy; definitely will not buy.
This method of measuring expectancies gives rise to the so-calledcutting-point problem. Should one assume that oniy those cate-gorized as "definitely will buy" are actually going to purchase? Ifnot, should one include the entire "probably will buy" group in one'sprediction or a fraction of them? If a fraction, then what fraction?The predictor needs to decide on some point on the scale, so thatpersons above such a point are going to be regarded as future "pur-chasers" and those below that point as "nonpurchasers." Or he hasto devise a formula with fractional predictions from each grouping.The customary solution has been to present the entire scale andbase one's interpretation on trend data using the entire column. Forpurposes of convenience in this analysis, the first two categories areusually lumped together when the category "expect to buy" is used.
416
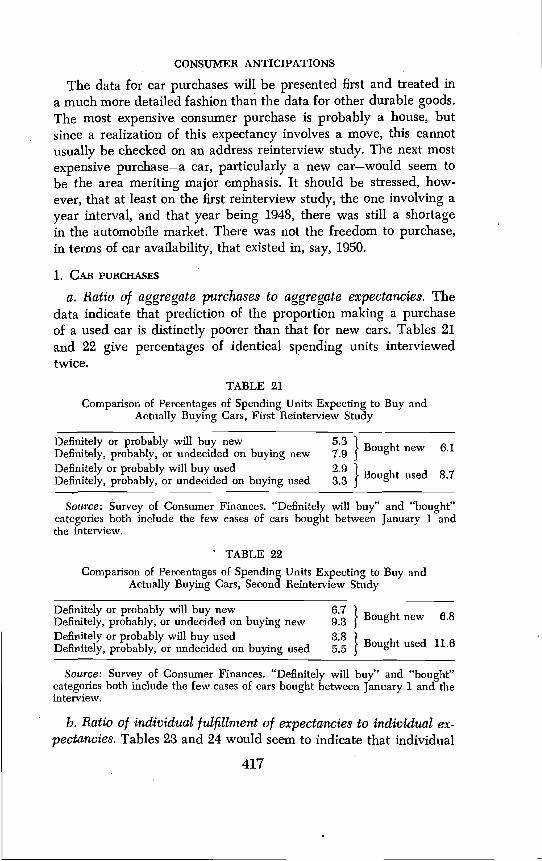
CONSUMER ANTICIPATIONS
The data for car purchases will be presented first and treated ina much more detailed fashion than the data for other durable goods.The most expensive consumer purchase is probably a house, butsince a realization of this expectancy involves a move, this cannotusually be checked on an address reinterview study. The next mostexpensive purchase—a car, particularly a new car—would seem tobe the area meriting major emphasis. It should be stressed, how-ever, that at least on the first reinterview study, the one involving ayear interval, and that year being 1948, there was still a shortagein the automobile market. There was not the freedom to purchase,in terms of car availability, that existed in, say, 1950.
1. CAB PURCHASES
a. Ratio of aggregate purchases to aggregate expectancies. Thedata indicate that prediction of the proportion making a purchaseof a used car is distinctly poorer than that for new cars. Tables 21and 22 give percentages of identical spending units interviewedtwice.
TABLE 21Comparison of Percentages of Spending Units Expecting to Buy and
Actually Buying Cars, First Reinterview Study
DefinitelyDefinitely,
or probably will buy newprobably, or undecided on buying new
5.8 )7.9 Bought new 6.1
DefinitelyDefinitely,
or probably will buy usedprobably, or undecided on buying used
2.9 'j
8.3Bought used 8.7
Source: Survey of Consumer Finances. "Definitely will buy" and "bought"categories both include the few cases of cars bought between January 1 andthe interview.
TABLE 22Comparison of Percentages of Spending Units Expecting to Buy and
Actually Buying Cars, Second Reinterview Study
DefinitelyDefinitely,
or probably will buy newprobably, or undecided on buying new
6.7 19.3 Bought new 6.8
DefinitelyDefinitely,
or probably will buy usedprobably, or undecided on buying used
3.8 1
55 Bought used 11.6
Source: Survey of Consumer Finances. "Definitely will buy" and "bought"categories both include the few cases of cars bought between January 1 and theinterview.
b. Ratio of individual fulfillment of expectancies to individual ex-pectancies. Tables 28 and 24 would seem to indicate that individual
417

CONSUMER ANTICIPATIONS
TABLE 23Realization of Expectancies of New and Used Car Purchasers,
First Reinterview Study, 1948(per cent of spending units)
Definitely Probably UndecidedWill Buy Will Buy about Buying
1948Purchasing New Used New Used New Used
Do NotExpectto Buy
Bought new 57 32 7Bought used 10 54 10 42 11 86Did not buy 33 46 58 58 82 14
47
89Total 100 100 100 100 100 100 100
Per cent of sample 4 2 1 1 8 a 86
a Less than 0.5 per cent.Source: Survey of Consumer Finances.
TABLE 24Realization of Expectancies of New and Used Car Purchasers,
Second Reinterview Study, 1949(per cent of spending units) .
Definitely Probably Undecided .
Will Buy Will Buy about Buying.7949
Do NotExpect.to BuyPurchasing New Used New Used New Used
Bought new 43 38 7 40Bought used' 8 60 3 15 77Did not buy 40 59 93 45 23
3988
Total 100 100 100 100 100 100 100
Per cent of sample 5 3 2 1 3 2 82
Source: Survey of Consumer Finances.
predictions based on expectancy are, roughly speaking, equal fornew and used cars. The difference between the two lies largely inthe large number of persons buying used cars who did not reportany expectancy of purchase (see table 25).
These data seem to indicate that, there is no clear basis on whichto ignore or take into account the "undecided" group. The "definitelywill buy" group are more certain of realizing their intentions thanany other, but even in this group only about 50 per cent fulfill ex-pectations.
Another way of analyzing the data is to examine the degree ofexpectancy among those purchasing. This approach is presented intables 25 and 26. '
418

CONSUMER ANTICIPATIONS
This series of tables indicates that. there is a sizable group thatexpected to purchase a new car but did not, and also a sizablegroup that did not expect to purchase one but did. These two groupswhose expectancies were not confirmed are .the ones that are espe-cially interesting for analysis.
TABLE 25Breakdçwn of Expectancies among Car Purchasers,
First Reinterview Study(per
Bought
Expectancy New Car Used Car
Definitely will buy new 2.4 0.4Probably will buy new 0.4 0.1Undecided about buying new 0.2 0.3Definitely will buy used 0.8Probably will buy used 0.6Undecided about buying used 0.3Do not expect to buy new or used 3.1 6.2
•
Total 6.1 8.7
Source: Survey of Consumer Finances.
TABLE 26Breakdown of Expectancies among Car Purchasers,
Second Reinterview Study(percent)
Bought .
Expectancy New Car . Used Car
Definitely will buy new 2.1 0.3Probably will buy new 0.7 a
Undecided about buying new 1.0 0.3Definitely will buy used 1.7Probably will buy used . a
Undecided about buying used 1.3Do not expect to buy new or used 3.0 8.0
Total 6.8 11,6
a Less than 0.5 per cent.Source: Survey of Consumer Finances.
It would seem that prediction of individual behavior, with assimple an instrument as was used, is somewhat futile if not naïve.The approach which is obviously more fruitful and theoretically
'419
CONSUMER ANTICIPATIONS
sensible is to regard the responses as measuring changes in inclina-tions to buy.
c. Factors in expectancy realization or nonfulfillment. The avail-ability of information in the interview schedule limited the study ofthe factors selected to throw light on why intentions changed orwere realized. Among the factors chosen for study were those thatmight offer insight into the nature, quality, worth, and strength ofthe expectancy itself, and those that might operate in such a waythat a genuine expectancy either could not be carried out or wasfulfilled after the first interview.
The following questions were asked: (1) Do people plan a pur-chase far enough in advance so that expectancies at one point intime could be regarded as covering expectancies for periods as longas nine months or a year? (2) How important is• the choice of re-spondent in determining the expectancies of a family unit out ofwhose budget the expenditure must be made? (3) To what extentshould expectancies be regarded as an ongoing psychological statewith realization postponed by prevailing and changing market con-ditions or the financial situation of the spending unit? (4) Whatsort of events intervene between the time of stated expectancy andthe time of purchase in such a way as to void the expectancy? (5)What sort of factors lead to "unexpected" purchasing?
1. Period of consideration of purchase and period involved in pre-diction. An obvious question relates to the time period covered bythe expressed expectancies. Is it too long, or too short? In. the secondreinterview study we asked about the month of purchase. The dataindicate that the expectancies reflect the majority of imminent pur-chases (made within three months), while purchases after threemonths or at least after six months tend to be largely those not ex-pected at the time of first interview. This is predominantly true forpurchases of used cars. However, even first-quarter predictions forindividuals are better with new than with used cars (see tables
• 27 and 28).Table 29 contains data on the length of consideration prior to the
purchase. The question used was, "How. long had you been con-sidering buying a car?" and it was asked only of those who bought.It is apparent that most used car purchases entail less than sixmonths' consideration. Furthermore, those who expected to buy andbought tend to be persons who deliberated longer Over-the purchase
• than buyers who did not expect to buy.

CONSUMER ANTICIPATIONS
TABLE 27Expectancy Related to Time of Purchase of New Car
in 1949, Second Reinterview Study(per cent)
Bought New Car in:
Expectancy 1st Quarter 2nd Quarter 3rd Quarter
Expected to buy 81 36 26Uncertain 9 24Didn't expect to buy 19 55 50
Total 100 100 100Distribution of purchasers 29 24 47
Source: Survey of Consumer Finances.
TABLE 28Expectancy Related to Time of Purchase of Used Car
in 1949, Second Reinterview Study(per cent)
Bought Used Car in:
Expectancy 1st Quarter 2nd Quarter 3rd QuarterExpected to buy 44 2Uncertain 10 10 10Didn't expect to buy 46 88 90
Total 100 100 100Distribution of purchasers 34 32 34
Source: Survey of Consumer Finances.
TABLE 29Length of Time of Consideration of Car Purchase
for Specific Expectancy-Realization Groups, Second Reinterview Study(per cent)
Did Not Did NotExpected to Expect to Expect to
Length Of Time Buy New Car Buy and Butt andof Consideration and Did Bought New Bought Used
Less than 1 month 21 35ito 2months 11 103to5months 11 5 12Gto 11 months 24 39 1212 months or more 39 16 20Ashorttime 5 3 2A long time 11 2Don't know 3Not ascertained 10 4
Total 100 100 100
Source: Survey of Consumer Finances.
421

CONSUMER ANTICIPATIONS
Data are also. available on the degree or seriousness of consid-eration of car purchases. Here again, those expecting to buy andactually buying cars report more involvement and concern over thepurchase than the group who bought cars without previously ex-pecting to do so (see table 80).
TABLE 30Recalled Degree of Consideration Given Purchase
Plans for Various Purchasing Groups, Second Reinterview Study(per cent)
Did Not Did NotExpected to
Recalled Degree Buy New Carof Consideration and Did
Expect toBuy and
Bought New
Expect toBuy and
Bought Used
Purchase followed carefulconsideration 69 24 16
Purchase followed some .
consideration 26 50 47 -
No careful consideration 5 26 33Not ascertained 4.
Total 100 100 100
Source: Survey of Consumer Finances.
2. Postponement of purchase. For an item as expensive as a carit is probably easy to procrastinate for several months. Also, in 1948there was considerable delay due to late deliveries and limitedavailability of new models. Thus continued expectancies in spite ofnonpurchase become a possible explanation of nonfulfillment ofplans to buy.
A check on expectancies of persons previously expecting to pur-chase but not doing so indicates that a sizable group stifi expectedto purchase a car, especially in the second reinterview study, whichinvolved only a nine-month interval (see tables 31 and 32).
8. Imprecision and vagueness in measured expectancies. In addi-tion to the problem of the cutting point on' the five-item expectancyscale and the problem of meaning and nuance in the words used bythe respondents that are the basis for classification, there is a prob-lem of who should be interviewed to obtain the most valid informa-tion on the expectancy for the spending unit involved. Usually onewould regard this key person as being the head of the spending unit.
That this problem cannot be ignored is shown by a comparisonof respondent similarity on the two interviews with expectancyrealizations in table 38. The group not fulfilling expectancies to pur-
422

CONSUMER ANTICIPATIONS
TABLE 31Expectancies for 1949 of, Persons Thinking of Buying a New Car
in 1948 but Not Doing So, First Reinterview Study(percent)
Expectancy to Buy to Buy inNew Car in 1949 1948 but Did Not
Definitely or probably will buy 31Undecided 14Probably will not or will not buy 49Not ascertained 6
Total 100
Source: Survey Of Consumer Finances.
TABLE 32Expectancies of Persons Thinking of Buying a New Carin 1949 but Not Doing So, Second Reinterview Study
(per cent)
Expected to Buy in 1949Expectancy to Buy New and Did Not in FirstCar after October 1948 Nine Months of 1949
Definitely or probably will buy in 1950 71Expect to buy in 1951 4Expect to buy in next few years 7Uncertain 9Don't expect to buy 9
Total 100,
Source; Survey of Consumer Finances.
TABLE 33Realization of Expectancies Related to Identity
of Respondents, Both Surveys(per cent)
Interview on Each Occasion with:
Same RespondentDifferent
Expectancy Head Not Head RespondentExpected to buy new, did 82 18Expected to buy new, did not 56 11 33Did not expect to buy
Bought new 71 11 18Bought used 62 29 9Did'not buy 69 21 10
Source: Survey of Consumer Finances.
423

CONSUMER ANTICIPATIONS
chase has the highest frequency of "different respondents" on bothinterviews.
An analogous problem is whether the expectancies were realenough or general enough in terms of involving the whole spendingunit. A series of questions was used covering reasons for failure tocarry out purchasing plans. The leading question in the series askedwhether the respondent had planned such a purchase. The shortlife of some expectancies, or the fact that recall is influenced bysubsequent developments, is reflected in the high proportion ofpersons who did not recall the expectancies they had mentionednine months previously.
TABLE 34Responses to Probe on Reasons for Nonpurchase of a New Car
of Those Not Buying but Stating Expectancy(per cent)
Reasons for not buyingPrices too high 31Did not need one as expected 18Waiting for new models (made old one do) 5Did not expect to buy 46
Totala 100
a Four per cent of sample.Source: Survey of Consumer Finances. .
TABLE 35Responses to Probe on Reasons for Nonpurchase of Used
of Those Not Buying but Stating Expectancy(per cent)
Cars
Reasons for not buyingPrice too high 16Did not expect to buy 84
Totala 100
a Two per cent of sample.Source: Survey of Consumer Finances.
Tables 34 and 35 show that among the persons who expected tobut did not buy a new car 46 per cent did not recall any such ex-pectancy. In the similar group previously expecting to buy a usedcar 84 per cent did not recall any such consideration. This may bea matter of glib answers to interviewer, of repression, or of theinfluence of subsequent developments.
424

CONSUMER ANTICIPATIONS
4. Miscellaneous factors. Tables 34 and 85 also include otherreasons why persons expecting to buy a car did not do so.
Whether one has a car, whether it is in good condition, the 'qualityof performance or appearance that one requires—all these are fac-tors that could be relevant to expectancy realization. These factorswere not covered in detail in the questionnaire, but some relevantdata were obtained. A loose estimate of condition of car ownedprevious to purchase was given by all those making a car purchasein the period between interviews. The data so obtained indicatethat persons not stating an expectancy but nevertheless purchasingtend to regard their cars as in better shape than other groups whopurchase (see table 36).
TABLE 36Evaluation of Condition of "Old" Car by Purchasers
(per cent)' Did Not Did Not
Condition of Old Car
Expected toBuy New Car
and Did
Expect toBuy and
Bought New
Expect toBuy and
Bought Used
Very goodFairly goodMiddle positions
1624
57113
155
Fairly poor 16 5Very poorDid not trade in or sell an old
10car 31
56
2047
Not ascertained 3 8Total 100 100 100
Source: Survey of Consumer Finances.
However, 70 per cent of those not expecting to buy a car wholater purchased a new one claimed, when they were asked why,that they did so because their old one was in poor condition (seetable 37).
When respondents were asked how they happened to buy a carat the time they did, their reasons showed that the emphasis wason "need" (either through not having one or owning one in poormechanical condition), or chance, or lucky events. While it is truethat hardly anyone buys a car for reasons other than some type of"need," those offered can be divided on the basis of major em-phasis.
425

CONSUMER ANTICIPATIONS
TABLE 37Rationale for Purchase Offered by Various Car-Purchasing Groups
(per cent)
Need One Good Deal,LuckyChance, Total• Old One
Expectancy of None in Poor Wanted "Good Time" Fur-Purchasers Owned Condition Onea to Buy Other chasing
Expected to buy,bought new 21 . 50 19 10 100
Did not expectto buy, bought .
newb 70 24 5 1 100Did not expect
to buy, boughtused 20 36 2 33 9 100
a Refers to liking new models or prestige reasons; can include none owned.b Only 15 per cent of this group did not own a car before purchase.Source: Survey of Consumer Finances.
It seems that those who expect to buy new cars and do so arepersons who may not have cars or have cars in poorer conditionthan those of the less predictable purchasers. They consider purchas-ing for a longer period and more seriously.
Finally, there is no doubt that the price of the car was an impor-tant factor in influencing the purchase of a used car. Consideringthe number of cases involved, there does not seem to be any sig-nificant difference between the expected and the unexpected pur-chases of new cars. One can say with some confidence, however,that the "unexpected" purchasers of new cars do not buy cars thatare any cheaper than those bought by people who state expectancies(see table 38).
5. Financial and economic factors affecting fulfillment and non-fulfillment. Tables 39 to 46 indicate the economic characteristics ofpersons in differing expectancy or realization groups. The factorsselected include: level and change in income; level and change inliquid assets; expected 1948 income; comparison of 1946, 1947, .and1948 financial positions; and year model of car owned in 1947. Thisanalysis could be carried out in the first reinterview survey only.
From these tables it is apparent that the factors considered arerelated in varying degrees to both expectancy and purchase. Thegeneral picture seems to be that those whose financial, position wasstable or improved realized their expectancies and bought a new
426

CONSUMER ANTICIPATIONS
TABLE 38Price of Car Purchased .by Varying Expectancy Groups
(per cent)
Did Not Expect to Buy a CarExpected to Buy
Price of Car New Car, Did Bought New Bought Used(dollars)
ito 500 35600to 1,000 39
1100 to 1,500 91,600 to 2,000 58 37 122,100 to 3,000 37 423,100 or over 5Not ascertained 16 5
Total 100 100 100
Source: Survey of Consumer Finances.
TABLE 39Income of Various Expectancy and Purchase Groups
(per cent)
Expected to Did NotBuy New Car Expect to Buy
1947 Income Bought Did Not Bought Did Not(dollars) . New Buy Car New Buy Cara
Under 3,000 23 15 563,000 to 4,999 54 20 30 305,000 or over 44 57 53 13Not ascertained 2 2 1
Total 100 100 100 100
a In this series of tables the last column is close to the total sample (about90 per cent).
Source: Survey of Consumer Finances.
TABLE 40Liquid Assets of Various Expectancy and Purchase Groups
(per cent)
Expected to Did NotBuy New Car Expect to Buy
1947 Liquid Assets Bought Did Not Bought Did Not(dollars) New Buy Car New Buy Car
Under 1,000 28 26 .28 631,000tol,999 . 13 11 18 122,000 orover 55 63 43 21Not ascertained 4 11 4
Total 1.00 100 100 100
Source: Survey of Consumer Finances.
427

CONSUMER ANTICIPATIONS
TABLE 41Evaluation of 1947 Financial Position of Various Expectancy
and Purchase Groups(per cent)
Expected to Did NotBuy New Car Expect to Buy
Evaluation of1947 Financial Bought Did Not Bought Did Not
Position New Buy Car New Buy Car
Better off than 1946 40 51 26 26About the same 54 26 52 37Worse off than 1946 6 20 15 31Not ascertained 3 7 6
Total 100 100 100 100
Source: Survey of Consumer Finances.
TABLE 42Income Change as Measured on Two Surveys of
Various Expectancy and Purchase Groups(percent)
Expected to Did NotBuy New Car Expect to Buy
Income Change from Bought Did Not Bought Did Not1947 to 1948 New Buy Car New Buy Car
Had an increase 63 43 63 55About the same 12 9 20 13Had a decrease 23 37 11 29Not ascertained 2 11 6 3
Total 100 100 100 100
Source: Survey of Consumer Finances.
TABLE 43Comparison of Expected and Actual 1948 Income
for Various Expectancy and Purchase Groups(per cent)
Expected to Did NotBuy New Car Expect to Buy
Expected and Actual Bought Did Not Bought Did NotIncome, Th48 New Buy Car New Buy Car•
Received more than expected 27 17 63 30Received expected income 50 40 20 32Received less than expected 17 32 4 22Not ascertained 6 11 13 16
Total 100 100 100 100
Source: Survey of Consumer Finances.In the first interview a question was asked about expected dollar income in
the following year. This figure was compared with the income reported in thesecond interview.
428
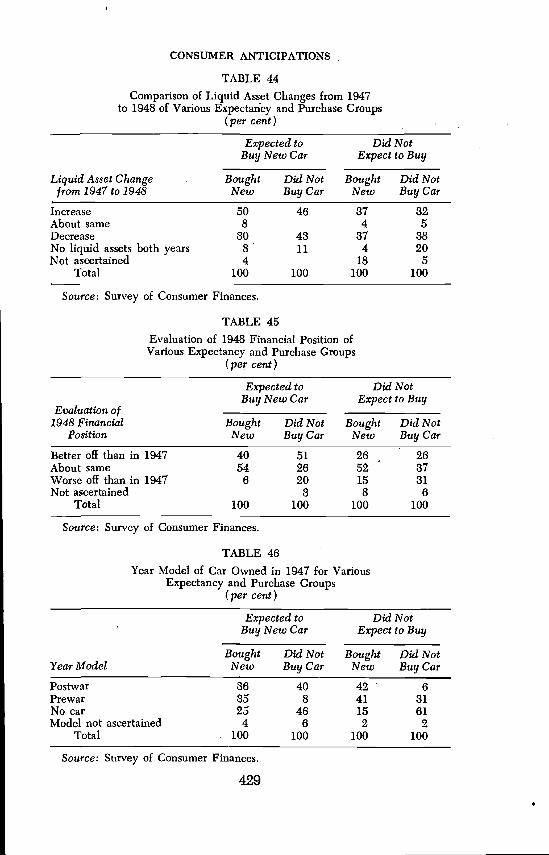
CONSUMER ANTICIPATIONS.
TABLE 44Comparison of Liquid Asset Changes from 1947
to 1948 of Various Expectancy and Purchase Groups(per cent)
Expected to Did NotBuy New Car Expect to Buy
Liquid Asset Change Bought Did Not Bought Did Notfrom 1947 to 1948 New Buy Car New Buy Car
Increase 50 46 37 32About same 8 4 5Decrease 30 43 37 88No liquid assets both years 8 11 4 20Not ascertained 4 18 5
Total 100 100 100 100
Source: Survey of Consumer Finances.
TABLE 45Evaluation of 1948 Financial Position ofVarious Expectancy and Purchase Groups
(per cent)
Expected to Did NotBuy New Car Expect to Buy
Evaltiation of1948 Financial Bought Did Not Bought Did Not
Position New Buy Car New Buy Car
Better off than in 1947 40 51 26 26About same 54 26 52 87Worse off than in 1947 6 20 15 31Not ascertained 3 8 6
Total 100 100 100 100
Source: Survey of Consumer Finances.
TABLE 46Year Model of Car Owned in 1947 for Various
Expectancy and Purchase Groups(per cent)
Expected to Did NotBuy New Car Expect to Buy
Bought Did Not Bought Did NotYear Model New Buy Car New Buy CarPostwar 36 40 42 6Prewar 85 8 41 31No car 25 46 15 81Model not ascertained 4 6 2 2
Total 100 100 100 100
Source: Survey of Consumer Finances.
429e

CONSUMER ANTICIPATIONS
car. In addition those who were "well off" and/or those whosefinancial condition improved bought cars when they had not ex-pected to do so. However, no single factor seems to be overwhelm-ingly significant.
d. Analysis of pattern.s' of financial characteristics. No one factoralone (i.e. income change, level of liquid assets, etc.) appears toexplain fully the failure to buy of persons expecting to buy a newcar or the unexpected purchase of a new car by persons stating noexpectancy. However, the possibility remains that a combination offinancial characteristics might serve as a complete explanation. Forinstance, while a high 1947 income level alone may not insure thata man who expects to buy a new car will do so, a high level of in-come in 1947 combined with the same or higher level in 1948 maymake it possible to predict his purchase behavior.
The characteristics selected might be regarded as factors facili-tating the purchase of a car if the need or desire for a car exists.The idea behind the pattern analysis was not that all the listed fac-tors must be present in each individual, but rather that a combina-tion of some should be present. Financial improvement or stabilitymay result from various combinations of these factors. Moreover,the presence of some factors may tend to compensate for the ab-sence of others. For instance, if a person's income went up but hisassets did not, he might still be-'regarded as being in a favorablesituation for the purchase of a car. The factors used in the patternanalysis were: (1) Had income of $3,000 or more in 1947. (2) Felthis financial situation in 1948 was the same as or better than in 1947.(3) Received expected income or more income than expected in1948. (4) Level of income stayed the same or increased from 1947to 1948. (5) Had liquid assets of $1,000 or more in 1947. (6) Levelof liquid assets stayed the same or increased from 1947 to 1948.
As table 47 shows, in 84 per cent of the cases persons who carriedout their expectations to buy a new car were found to have 1947incomes of $3,000 or more and to feel that financially they were thesame or better off (factors 1 and 2). Along with these two conditions,either they received the same or more income in 1948 (factor 4) andthe amount which they received was the amount which they ex-pected or more than expected (factor 3), or they had $1,000 ormore in liquid assets in 1947 (factor 5) and had liquid asset stabilityor increase in 1948 (factor 6). The 6 per cent who felt that theywere Worse off financially (factor 2 absent) reported meeting theother conditional factors.
430
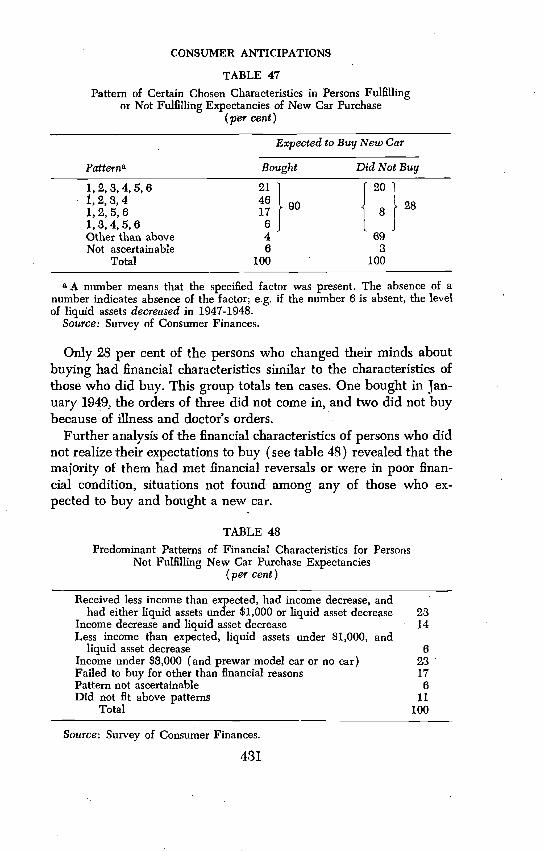
CONSUMER ANTICIPATIONS
TABLE 47Pattern of Certain Chosen Characteristics in Persons Fulfilling
or Not Fuffihling Expectancies of New Car Purchase(per cent)
Patterna
Expected to Buy New Car
Bought Did Not Buy
1,2,3,4,5,61,2,3,41,2,5,61,3,4,5,6
2146 9017
6
1 20
281 8
[ JOther than above 4 69Not ascertainable 6 3
Total 100 • 100
a A number means that the specified factor was present. The absence of anumber indicates absence of the factor; e.g. if the number 6 is absent, the levelof liquid assets decreased in 1947-1948.
Source: Survey of Consumer Finances.
Only 28 per cent of the persons who changed their minds aboutbuying had financial characteristics similar to the characteristics ofthose who did buy. This group totals ten cases. One bought in Jan-uary 1949, the orders of three did not come in, and two did not buybecause of illness and doctor's orders.
Further analysis of the financial characteristics of persons who didnot realize their expectations to buy (see table 48) revealed that themajority of them had met financial reversals or were in poor finan-cial condition, situations not found among any of those who ex-pected to buy and bought a new car.
TABLE 48Predominant Patterns of Financial Characteristics for Persons
Not Fulfilling New Car Purchase Expectancies(per cent)
Received less income than expected, had income decrease, andhad either liquid assets under $1,000 or liquid asset decrease 23
Income decrease and liquid asset decrease 14Less income than expected, liquid assets under $1,000, and
liquid asset decrease 8Income under $3,000 (and prewar model car or no car) 23Failed to buy for other than financial reasons 17Pattern not ascertainable 6Did not fit above patterns 11
Total 100
Source: Survey of Consumer Finances.
431

CONSUMER ANTICIPATIONS
An attempt was next made to find the financial patterns amongthose who did expect to buy and bought a new car. The fol-lowing financial characteristics were selected as con4itions underwhich a person who did not expect to buy a car might change hismind. It will be noted that they present a somewhat rosier financialpicture than do those used in realization of purchase expectancy.(1) Income of $3,000 or more in 1947. (2) Respondent feels he isbetter off financially in 1948. (3) Received more income than ex-pected. (4) Received income increase from 1947 to 1948. (5) Hadliquid assets of $1,000 or more in 1947. (6) Had liquid asset in-crease from 1947 to 1948. (7) Owned postwar model car.
In order to determine whether these factors had predictive value,the frequency of their occurrence among those who did not expectto. buy and did not was also tabulated. Table 49 indicates as well'the data for people who expected to buy and did so.
It is not surprising that there are no larger financial differencesbetween those who bought "unexpectedly" and those who did notbuy. In the first place, reasons for not expecting to purchase a carundoubtedly vary from respondent to respondent. Some may notexpect to buy because they do not think they will be able to afforda new car. Others may not feel the need of a new car or may evenfeel extremely attached to their old one. An unexpected increase inincome would not have the same effect on their purchase behavior.
A second factor, related to the first, is that equal financial improve-ments on the part of those who felt they could not afford to buy acar would not necessarily lead to equal facilitation of purchase.Under circumstances a man with no responsibilities would bemore apt to change his mind and buy a car than a man with manydemands on him. It is also impossible for a respondent to predictaccidents or other needs for car repairs, and in the event they occurhis purchase expectations may change without any change in hisincome or assets.
In a further effort to determine reasons for unexpected new carpurchases the interviews of the respondents in question were re-investigated, with the following results. It was found that for 59 percent of such respondents there were obvious financial conditionswhich facilitated the unexpected new car purchase, such as:
1947 or 1948 income of $10,000 or more 30 per centReceived more than new car price on trade-in 7Had saved the money for a car 4
432

CONSUMER ANTICIPATIONS
Income doubled unexpectedly 7Unmarried, no dependents, income over $3,000 and
liquid assets over $1,000 7Liquid assets over $10,000 in 1947 or 1948 4
TABLE 49Predominant Patterns of Financial Characteristics for Persons Not Expecting
to Buy and Then Purchasing a Car Compared with the Distribution ofIdentical Characteristics of Groups Fuffihling Expectancies
(per cent)
Did NotExpect to Buy
Pattern a Car, Bought NewDid
BuyNot Expect toa Car, Did Not
Expected to Buy,Bought
1,2,4,5,6,7 11 1 '
1,8,4,5,7 4 1 41,2,5,6,7 4 a 41,3,5,6,7 41,3,4,6,7 4 a 41,3,4,6 11 57 5 23 2713,4 2 5 111,8,5 4 11,5,7 4 11,4,5 4 21,5 5 .Total pattern
7 4
not ascertained 36b . 7 6None of above patterns 7 70 67
Total 100 100 100
a Less than 0.5 per cent.13 This high figure is due largely to uncertainty in respondents' answers on
3: "income expected."Source: Survey of Consumer Finances.
It should be pointed out, however, that such conditions also existedamong those who did not buy.
Although these various factors and measures aid in understandingthe failure of one's predictions, they are not precise enough to enableone materially to improve forecasting. Also some of the factors aredevelopments subsequent to the time of stated expectancy and needto be predicted themselves. They serve as guides to the type of datathat might be collected and reflect the corelevance of backgroundvariables of an economic nature.
2. PURcHASES OF OThER DURABLE GOODS
The Surveys of Consumer Finances also contain questions aboutbuying plans for refrigerators, furniture, radios, and, in the later
433

CONSUMER ANTICIPATIONS
study, television sets. These being smaller expense items, one wouldexpect that overall predictive efflciency on these would be worsethan that on autos—prediction, that is, from stated expectancy, nottrend data.
a. First reinterview study. The stated expectancies on these itemsseem to be fulfilled about as frequently as car purchase expectancies.However, more than twice as many persons bought radios as ex-pected to do so and 46 per cent more bought furniture (see table 50).
TABLE 50
Expected and Actual Purchases of Durable Goods,First Reinterview Study
(per cent)
Expected to buy
Radio
5.4
Refrigerator
6.4
Furniture9.4
All DurablesExcluding Car
21.2Actually bought 10.8 7.8 13.1 31.2
Source: Survey of Consumer Finances.
Along with the fact that many more people bought radios andfurniture than expected to do so, it should be noted that at leasthalf of those who expected to buy radios or furniture did not, and44 per cent of those who expected to buy refrigerators did not do so(see table 51). In the case of all three durables over 50 per cent
TABLE SiActual Purchase of Radio, Refrigerator, or Furniture
by Persons Expecting Definitely or Probablyto Buy, First Reinterview Study
(per cent)
,
Expected to Buy:
Radio Refrigerator Furniture
BoughtDid not buy
Total
4753
100
5644
100
5050
100
Source: Survey of Consumer Finances.
of the purchases were made by persons who did not expect to buy(see table 52). This is somewhat the same as in car purchasing (seetables 25 and 26).
434

CONSUMER ANTICIPATIONS
TABLE 52Degree of Expectancy of Purchase of Persons
Who Bought a Radio, Refrigerator, or Furniture,First Reinterview Study
(per cent)
Bought in 1948
Expectancy Radio Refrigerator Furniture
Definitely expected to buy 20 29 29Probably will buy 5 17 7Undecided 2 1 2Did not expect to buy 73 53 62
Total 100 100 100
Source: Survey of Consumer Finances.
When all durable goods are combined (excluding cars) the actualpurchases exceed the expected purchases by 46 per cent (see table50). If persons who were undecided had been included amongthose expecting to buy, the discrepancy would have been smaller( see table 53 ).
TABLE 53Degree of Certainty of Purchase of Persons Who Actually Purchased
Durable Goods, First Reinterview Study(per cent)
Expectancy Radio Refrigerator FurnitureDefinitely expected to buy 3.4 4.6
Did buy 2.1 2.3 4.0Did not buy 1.3 2.3 3.0
Probably will buy 2.0 1.8 2.4Did buy 0.6 1.4 0.9Did not buy 1.4 0.4 1.5
Undecided about buying 0.9 0.9 1.2Did buy 0.2 0.1 0.2Did not buy 0.7 0.8 1.0
Did not expect to buy 93.4 92.4 89.0Did buy 7.7 4.2 8.4Did not buy 85.7 88.2 80.6
Not ascertainable 0.3 0.3 0.4Total 100.0 100.0 100.0
Source: Survey of Consumer Finances.
b. Second reinterview study. Results obtained in the second re-interview study are given in tables 54 to 57.
435

CONSUMER ANTICIPATIONS
TABLE 54Expected and Actual Purchases of Durable Goods, Second Reinterview Study
(per cent)
All durablesExpectancy Radio Refrigerator Furniture Television excluding car
Expected to buy 4.2 6.0 10.5 3.8 24.5Actually bought 4.5 8.3 11.3 3.7 27.8
Source: Survey of Consumer Finances.
TABLE 55Degree of Certainty of Purchase of Persons Who Actually Purchased
Durable Goods, Second Reinterview Study(per cent)
Expectancy Radio Refrigerator Furniture Television
Definitely expected to buy 2.3 4.8 7.4 2.0Bought 0.8 2.3 1.9 0.8Did not buy 1.5 2.5 5.5 1.2
Probably will buy 1.9 1.4 2.9 1,4Bought 0.5 0.3 1.0 0.4Did not buy 1.4 1.1 1.9 1.0
Undecided about buying 2.4 1.7 0.5Bought 0.6 1.3Did not buy a 1.8 0.4 0.5
Did not expect to buy 94.4 91.0 87.1 95.0Bought 3.2 5.5 7.1 2.5Did not buy 91.2 85.5 80.0 92.5
Various expectancies, willbuy before 1950 1.3 0.4 0.9 1.1
Total 100.0 100.0 100.0 100.0
a Less than 0.2 per cent.Source: Survey of Consumer Finances.
TABLE 56Degree of Expectancy of Purchase of Persons Buying
a Durable Goods Item, Second Reinterview Study(per cent)
Expectancy Radio Refrigerator Furniture Televi.s ion
Definitely expected to buy 17 24 17 22Probably will buy 11 3 8 10Undecided 7 12Did not expect to buy 72 66 63 68
Total 100 100 100 100
Source: Survey of Consumer Finances.
436

CONSUMER ANTICIPATIONS
TABLE 57Actual Purchase of Durable Goods by PersonsExpecting to Buy, Second Reinterview Study
(per cent)
Expected to Buy:
Radio Refrigerator FurnitureBoughtDid not buy
Total
3070
100
3862
100
2778
100
3268
100
Source: Survey of Consumer Finances,
Table 58 offers data, showing a conflict between ofpurchase and time within which the anticipation is most likely to befulfilled.
TABLE58Expectancy to Purchase Selected Durable Goods Related
to Time of Purchase, Second Reinterview Study(per cent)
Expectancy .
Bought Item in:
1st Quarter 2nd Quarter 3rd Quarter
RadioExpected to buy 29 28 25Did not expect to buy 71 72 75
Total 100 100 100Refrigerator . .
Expected to buy 32 43 15Did not expect to buy 68 57 85
Total 100 100 100Furniture
Expected to buy 52 31 27Did not expect to
Totalbuy 48
10069.
10073
100Television set .
Expected to buy 25 75 21Did not expect to
Totalbuy 75
10025
10079
100
Source: Survey of Consumer Finances.
Tables 59 and GO show that a large group of purchasers make uptheir minds to buy durable goods in a very short period of time.This finding may account for a large share of the discrepancy in thefulfillment rates.
437..

CONSUMER ANTICIPATIONS
TABLE 59Length of Time of Consideration of Purchase of Selected
Durable Goods, Second Reinterview Study(per cent)
Length of Time of Con-sideration of Purchase
Item Bought
Refrigerator Furniture Radio Television Set
Less than 1 month 41 20 51 31lto2months 5 11 14Sto5months 6 12 8 86 to 8 months 8 5 13 179tollmonths 3 3 712 months or more 24 28 6 10Shorttime 5 5 8 3
Don t know8 10 11 10
Not ascertained 9 3Totala 100 100 100 100
a All persons who purchased regardless of expectancy to purchase.Source: Survey of Consumer Finances.
It should be noted that approximately one-third of the personswho expected to buy refrigerators and furniture in 1948, and did not,merely postponed their purchases and expected to buy these items in1949. However, only 11 per cent of those who failed to purchase aradio expected to buy it in 1949 (see table 61).
TABLE 61Comparison of Expected Durable Goods Purchases Not Realized
in 1948 with Expected Purchases in 1949, First Reinterview Study(per cent)
.
Expected to Buy in 1948Did Not Buy:
and
Radio Refrigerator Furniture
Expected to buy in 1949 11 34 36Did not expect to buy 85 58 58Not ascertainable 4 8 8
Total 100 100 100
Source: Survey of Consumer Finances.
In the second reinterview study, expectancies were checked oniyfor the remainder of 1949. There were too few of those expecting topurchase at the beginning of the year, and still expecting to purchasein 1949, to merit tabular presentation.
438

Ref
riger
ator
Furn
iture
Rad
ioTe
levi
sion
set
Did
Not
Did
Not
Did
Not
Did
Not
Leng
th o
f Tim
e of
Con
-si
dera
tion
of P
urch
ase
Expe
cted
to B
uya
Expe
ctto
Buy
Expe
cted
to B
uys
Expe
ctto
Buy
Expe
cted
to B
uya
Expe
ctto
Buy
Expe
cted
to B
uya
Expe
ctto
Buy
Less
than
1 m
onth
1751
2120
3059
451
to 2
mon
ths
713
1126
8St
o5m
onth
s11
521
1110
812
6 to
8 m
onth
s11
72
720
1042
59t
o 11
mon
ths
112
410
12 m
onth
s or m
ore
5014
2829
2021
5Sh
ortti
me
64
108
5tim
eD
on t
know
104
715
1110
Not
asc
erta
ined
.9
710
Tota
l10
010
010
010
010
010
010
010
0
TAB
LE 6
0Le
ngth
of T
ime
of C
onsi
dera
tion
Rel
ated
to D
egre
e of
Exp
ecta
ncy,
Sec
ond
Rei
nter
view
Stu
dy(p
er c
ent)
cc
0 z
a "E
xpec
ted
to b
uy"
incl
udes
"de
finite
ly w
ill b
uy"
and
"pro
babl
y w
ill b
uy"
and
boug
ht in
194
7 pr
ior t
o th
e Su
rvey
.So
urce
: Sur
vey
of C
onsu
mer
Fin
ance
s.

CONSUMER ANTICIPATIONS
Very little can be discovered as to the reasons for failure on thepart of the respondents to buy the durable goods which they statedthey intended to buy. A comparison was made of financial character-istics of persons who definitely expected to buy and did, and whodefinitely expected to buy and did not; but for the most part thedifferences between the two groups were too small, in the light ofthe small number of cases, to be considered significant.
Persons who did not expect to buy and did compared withthose who did not expect to buy and did not, with not much moresuccess. Again, the differences between the two groups were, forthe most, part, not significant.
D. Conclusions
1. GENERAL CONCLUSIONS
1. Data on intentions to buy should be used with caution. Trendsand direction of change may be more significant than absolute per-centage levels. The necessity of including other information at thetime the expectancy data are evaluated is borne out by thç analysisin the section on repeated interviews and by the data from the re-interview studies.
2. The analytical scheme outlined in the first section of this papercannot be validated by the available reinterview analysis. However,these data do tend to support strongly the suggested approach tothe analysis of prospective demand through using data on abilityto buy and willingness to buy in conjunction with the intentions data.
3. The prediction, on an individual basis, of something as corn-plexly determined as the purchase of a car over a period as long asa year is a very difficult task. However, pessimism about individualpredictions should not imply pessimism about aggregate predictionusing a multivariate approach. This analysis has suggested points atwhich the methodology might be improved.
4. A major predictive problem concerns purchasers without ex-pectancies at the time if questioning. The relevance of economicconditions to their behavior casts doubts on the assumption of a con-stant ratio of such persons to expecters.
5. The reinterview analysis indicates that financial ability andfinancial change influence fulfillment and nonfulfillment of expect-ancy. It also demonstrates the difficulty of locating those unabstract-ed items that explain many facets of fulfillment and nonfulfillmentof expectancies. However, even a simple combination of various
440

CONSUMER ANTICIPATIONS
factors without statistical weighting or mathematical formalizationindicates certain significant differences in the purchase and non-purchase groups of expecters. In toto, these combinations of factorsoffer an exploratory base for further development of the analyticaltechnique outlined in the initial section of this report.
2. RECOMMENDATIONS FOR IMPROVING TECHNIQ1JES
1. Ideally, the combination of variables into a single predictivemeasure should be by. an objective method of mathematical manipu-lation, rather than by a method that relies heavily on the subjectiveweighting of factors by the analyst or interpreter. Future effortsshould be focused in that direction both in analyzing the consumersector of the economy and in attempting to combine data from thatarea with data from other sectors. An index of ability to buy com-bined with expectancies would be a small step in this projecteddirection.
2. The intentions data are weak for radios and used cars in par-tièular. The difficulty appears to be with low-priced items. Thissuggests the possibility of limiting intentions data to high-priceditems in these categories.
8. The time interval of one year, covered by the intentions data,appears to be too long. Exactly what the interval should be is notclear, but it seems that, for example, a time period of six monthsmight be more appropriate for the prediction of new car purchases.The results raise a question as to whether the interval should not bevaried for different commodities. The length of time to be coveredshould also be studied in the light of the seasonality of purchase ofmany of the items, e.g. refrigerators.
4. The present method of measuring intentions to buy should beimproved. Both higher reliability and higher validity should beattainable from the adaptation of more refined techniques involvinginformation about the psychological and economic setting of ex-pectancies, past behavior, locus of decision-making, etc.
COMMENTELMER C. Lehigh University
For the purpose of a limited analysis of consumer expendituresthe problems of forecasting are not .carried beyond the personalsector into the interrelations with other sectors of the economy.
441

CONSUMER ANTICIPATIONS
Several different approaches are nOw employed to anticipate con-sumer expenditures:
1. Consumer expenditures, classffied as durable, nondurable, andservices (and further broken down when possible), are projectedby naïve model methods, specifically tailored to the requirementsat each point of time, as a section in the pattern-of-relationshipmethod of forecasting (what Bassiè calls "statistical analysis" in hispaper) applied to gross national prOduct. This is currently an im-portant working hypothesis.
2. Forecasts are developed from the level of disposable incomeand knowledge of the consumption function. Such overall methodshave passed rapidly out of fashion in the last three years, partly asa result of improvement in our analytical understanding and partlyfrom the irregularity in the movement that has been occurring inconsumer expenditures in relation to disposable income.
3. Forecasts on the basis of study of past consumer behavior areused. Such studies are well illustrated by the Survey analysis ofability and willingness to buy. I am not going to offer any criticismof the work along this line that has been done at the Survey Re-search Center, but I do enter a plea for greater coverage of con-sumer behavior.
Consumer stocks represent an extremely important area that hasbeen ignored. One method of analyzing the behavior of consumerstocks of durables is what is known as saturation analysis. This im-plies a concept of a relatively fixed total market for an individualproduct, a life curve to develop replacement demand (modified byassumptions as to obsolescence), and the filling of new demand(partly related to the flow of consumer income). Techniques needto be developed to reflect the changes taking place in consumerstocks of semidurables, notably clothing. I recommend that the Cen-ter make experiments to see what can be done in this area. I thinkon the whole the Center could profitably give more attention to thestudy of individual commodities in analyzing consumer behavior.
One major aim in the study of consumer behavior should be theseparation of disposable income handled automatically from thatpart spent or saved only after careful consideration. Contractualsaving and many food and service items fall in the former category,and probably most durables and nonrecurrent expenditures such asvacations fall in the second. But the Center should give us betterinformation on these points. Not only do we need a static classifica-tion, but we need to learn about its dynamic variation. How do
442

CONSUMER ANTICIPATIONS
changes in income influence the automatic (what Katona callsroutine) items?
4. Surveys to determine consumer plans (or better, as Lansingnotes, expected purchases) constitute another approach. Unlikeother methods of forecasting consumer expenditure, this one de-pends on what the consumer says he expects to do. The first prob-lem here, I believe, is to define the area to be covered. The appro-priate area seems to be the nonautomatic (nonroutine) or discre-tionary type of expenditure. This can be more clearly identffied ifautomatic expenditures are more carefully separated in studies ofconsumer behavior. Within the discretionary area it would be usefulto try a classification of the degree of urgency of demand. Howclosely does the urgency of demand tally with the reliability of ex-pected purchases 'for various commodities?
The specific purpose of the survey of expected purchases is highlyimportant. It is stated that emphasis is on diagnostic analysis. Iunderstand this to mean that the surveys of consumer plans are in-tended to interpret typical behavior, rather than dfrectly to assist pro-jection. Again, it is held that the interpretation must rest primarilyon the time trend. The most important thing to be found from thetime trend is the cyclical shift in optimistic or pessimistic expec-tations. This position is buttressed by the fact tha't admittedly theexpectation of any particular individual is quite' unreliable, whilethe average trend appears indicative. What is happening wouldappear to be a general social reaction to changes in income or psy-chological attitude. The most fruitful questions therefore would ap-pear to relate to ex ante income and liquid assets if we follow thetheory that these factors come closest to regulating shifting businesscycle psychology.
The aim of the authors is not to use, the expected-purchases studyto interpret consumer behavior in relation to the individual com-modities considered, for they say that "the inference may be madethat if demand for houses, cars, and other durables will increasein a particular year, total demand by consumers for goods and serv-ices will increase for a given level of income." This would' appearto be on the wrong track. If questions are to be asked about partic-ular items of durable demand, is it not more to the point to interpretthe estimated changes as additional to the automatic (or routine)?If all consumer expenditures are to behave similarly, perhaps wecan return to the general consumption function analysis.
On the, other hand, it is plausible that, where cracks appear on443

CONSUMER ANTICIPATIONS
the surface of a continuation of a trend of consumer performance,they are related to the behavior of particular types of expenditureor saving. What is the best way to anticipate the demand for partic-ular commodities? The role in this respect that surveys of expectedpurchases can play is not clarified by appeal to the complexity ofeconomic motivation, for however complex it may be, consumersdo decide to purchase. If consumers plan purchases for the com-modities in question far enough in advance, the Survey can help usdetermine what influence consumer purchase of individualties has on economic change. Certainly the plans must be made atleast three months in advance to be of any help. We very muchneed to know what the length of this planning period is for variouscommodities.
In a survey of expected purchases, the difference between micro-and macro- is important only in a psychological sense. The macro-expenditures for individual commodities are merely the sum of themicro- (but this is not true of savings). However, from the point ofview of social psychology, the intereffects of the plans of individ-uals are extremely important. The fruition of plans to purchase isprobably more a social than an individual process. Until we under-stand better the social process by which consumer plans are made,perhaps we should limit our studies on expected purchases (or con-sumer plans) to: (1) the length of the planning period for variousindividual commodities which might be studied; (2) expectationsas reflections of consumers' optimism or pessimism in relation tobusiness cycle changes—largely feelings about income; (3) possiblyexperiments to estimate consumer stocks; and (4) general method-ological experiments.
JAMES TOBIN, Yale University
The annual Surveys of Consumer Finances place economists intremendous debt to the, Survey Research Center and to the FederalReserve Board. Not only do these Surveys add substantially to eco-nomic information, but their design and analysis have already con-tributed greatly to the methodology of empirical research in eco-nomics, and we may look forward to even greater advances in thefuture.
Moreover, the record of predictions made from the Surveys, setforth both in this paper• and in Schweiger's paper, is impressive.Lansing and Withey have, therefore, performed a great service in
414

CONSUMER ANTICIPATIONS
explaining to us how the Center interprets the data of the Surveysfor the purpose of making predictions. But they do not claim tohave given us the complete story, and we may hope for futurepapers that wifi tell us more about the analytical scheme. What theyhave given us is mainly a list of the factors they consider in makinga prediction. The weighting of these factors in arriving at a finaldiagnosis appears to be a matter of judgment; although the judg-ment appears to be good, it would be helpful to know more aboutthe weighting process.
The role left to good judgment may be illustrated by the authors'treatment of the data on the "wisest place to put money" (table 14).These show what strikes me as a substantial rise since 1949 in theproportion of spending units preferring assets of variable moneyvalue to those of fixed money value; it is especially pronounced inthe income groups who have the resources to make their opinionscount. The judgment of the authors was that this rise was less im-portant than the fact that the proportion favoring assets of fixedmoney value was still, in absolute terms, high. Consequently, in-stead of interpreting this evidence as inflationary, they construed itas anti-inflationary. This was good judgment, but the fact that it wasjudgment is accented by the stress that the authors elsewhere placeon looking at changes from year to year rather than absolute levels.
The main methodological issue raised by the paper seems to meto be the role, in short-term forecasting of consumer behavior, ofanalyses of two kinds of information. One kind is information of ancx post, realized nature concerning past consumer behavior. Itsanalysis seeks to discover inductively relationships of predictivevalue between consumers' actions and certain "objective" factors intheir situation. The other kind of information is of an ex ante, un-realized nature, and concerns consumers' expectations, attitudes,and intentions. Its analysis seeks to discover, no less inductively,relationships of predictive value between such "subjective" data andsubsequent consumer actions. The issue is one of emphasis—no onebelieves that either type of information should be completely dis-regarded—and it has practical consequences in the distribution ofeffort in the design and analysis of consumer surveys.
Consumer surveys are an important source of both kinds of in-formation. Obviously they are practically the sole source of cx antedata. Their importance as a source of cx post information we havelearned from the inadequacies of quantitative relationships basedon aggregate time-series alone. In an approach based on "objective"
445

CONSUMER ANTICIPATIONS
information, surveys are necessary not only to provide raw materialfor the building of relationships to be used in prediction, but also,as the authors point out, to permit the use of those relationships inforecasting by supplying current information on the joint 'distribu-tion of consumer units according to the relevant variables. Themethodological issue, therefore, is not whether consumer surveysare to be used in short-term forecasting, but how they are to be used.
The Survey Research Center evidently believes strongly in theinadequacy of cx post information and in the fruitfulness of gather-ing and analyzing ex ante data. George Katona, in his recent inter-esting and stimulating book, contrasts "mechanistic" attempts toexplain consumption behavior, by reference to "income, assets, age,and similar 'objective' factors," unfavorably with explanations thatattribute significant influence to "subjective" factors. He assertsthat consumers make "genuine decisions" that can "influence eco-nomic developments." In the present paper there is an early dec-laration of faith that "consumers have a real freedom of choice asto what they do with their income and assets."
The determinism—free will controversy is unlikely to be resolvedin the realm of consumer economics. In any case the issue may bemore philosophical than operational. No "mechanist" expects to beable to muster enough "objective" factors to explain, completely theactions of individual consumers, or even those of consumers in theaggregate. It matters little whether the random error term in thedeterminist's equation is taken to stand for omitted variables or toallow for consumers' genuine spontaneity. Moreover, the objectionsof the Center to "objective" empirical analysis of consumer demandseem to be directed mainly against attempts to estimate unique re-lationships between consumer expenditure and income, or betweenexpenditure and two variables, income and asset holdings. A moreinclusive conception of "objective" factors, although in principleequally "mechanistic," would presumably encounter less objection.
One might hope that in short-run forecasting, in contrast to long-run projection, systematic relationships derived from ex post infor-mation could be dispensed with, altogether or in large part, bysubstituting more direct prediction from the stated intentions ofconsumers. As it has been put by others in these meetings, con-sumers themselves could serve as our calculating machines, weigh-ing the many factors that affect their spending decisions and coming
1 George Katona, Psychological Analysis of Economic Behat,ior (McGraw-Hill, 1951), pp. 6, 69.
446
CONSUMER ANTICIPATIONS
up with the answer. This method might be both more reliable andeasier than the multiple correlations of an outside observer. I be-lieve this hope to be illusory; consumers are not likely to be goodcalculating machines.
Consumer purchases may be what we would like to predict. Butthey will, in general, be influenced by variables exogenous to theconsumer sector. Some relevant variables will be capable of changein the interval between interviews and the end of the period forwhich predictions are desired; and to some or all of these, consumerswill react with no lag at all or with a lag shorter than that inter-val. Consequenfly, the best that can be done is to predict relation-ships between consumer purchases and the relevant current exog-enous variables. It is the need to predict relationships rather thanvariables that, in my view, makes it no less necessary in short-termforecasting than in long-term projection to rely on inductive rela-tionships between the realized actions of consumers and their"objective" determinants. If a consumer says at the beginning ofthe year that he plans to buy, or not to buy, a car, he gives no hintof what he will do should his income rise, car prices change, or hisold car break down. (Note the evidence in table 43 in the Lansingand Withey paper on "unexpected" car purchases by persons whoseincomes turned out to be higher than they had anticipated.) Togauge the effects of such changes we must—since answers to hypo-thetical questions are the most unreliable kind of anticipatory in-formation—look elsewhere, and that means to past experience asrecorded in cx post information. What the "subjective" data maytell us, however, is whether to expect actual car purchases to deviateabove or below their relationship to other "objective" variables asderived from past experience. Such data are more likely to tell usthat than to tell us whether car purchases will be bigger or smallerthan last year.
A second factor limiting the usefulness of statements of the inten-tions of individual consumers is the existence of types of expenditurethat are, in the aggregate, bound to occur every year, but are in-herently unforeseeable by consumer units interviewed at the begin-ning of the year. Such expenditures cannot be predicted except byrelationships based on cx post information, including aggregatetime-series. To give a ridiculously extreme illustration, anyone inter-ested in predicting funeral expenditures for the coming year wouldbe better advised to consult vital statistics and data on past expendi-turës than to ask consumer units their plans. Of more significance
447

CONSUMER ANTICIPATIONS
are the contributions to the demand for housing and householddurables of spending units that will be newly formed during theyear. These cannot be ascertained from interviews in January. An-other example is the replacement demand for durable goods. Noindividual owner of a ten-year-old car knows that his ancient vehiclewill break down during its eleventh year. But it is certain that agood proportion of old cars will break down and place their owners,regardless of the owners' expectations at the beginning of the year,in the car market.
In the second part of their paper the authors expended consid-erable ingenuity in explaining why car-buying plans stated at thebeginning of the year were or were not fulfilled. It occurred to thisreader that similar effort and ingenuity devoted to identifying thedifferentiating characteristics, not of but of car-buyers,might have led them by a more direct route to the ultimate goal ofbeing able to predict automobile demand. The data collected in theSurveys over a number of years would, I imagine, permit an analy-sis of car purchases in terms -of such factors as income (current andpast), assets, age of head of family, size of family, car ownership ornonownership, age of present car, location, and occupation. It wouldbe of great interest to know whether ex ante information on car-buying plans could add to the predictive value of such an analysis.2
The shift in emphasis for which I am arguing can be exemplifiedby considering two findings of the 1951 Survey. One was that only12 per cent of all spending units planned to purchase cars in 1951;this was considerably lower than the corresponding percentages for1950 (17 per cent) and all other postwar years (table 18). Thesecond finding concerned the aggregate size, and the distributionby age of car and by income of owning family, of the stock of auto-mobiles at the beginning of 1951. This showed that the proportionof families owning cars, and the proportion owning new or rela-tively young cars, exceeded for the first time the prewar proportions.This was true both in the aggregate and throughout the income dis-
Either of these findings might lead, in conjunction withother information, to the conclusion that, barring changes in exog-enous variables, the market for new cars would be somewhat weaker
2 A reader interested in this question would find tables 39 to 46 more informa-tive if they were turned around: if table 46, for example, gave the percentagesof owners of various models of cars and of nonowners who were in each of theexpectancy-action categories.
"1951 Survey of Consumer Finances, Part ii," Federal Reserve Bullqtin,July 1951, table 7, p. 766, and table 8, p. 767.
448

CONSUMER ANTICIPATIONS
in 1951 than in 1950. The authors arrived at this conclusion withthe help of the first finding, and there is no evidence that they paidattention to the second. Indeed, they are somewhat disdainful ofthe use of data on stocks, which they associate with the assumptionthat the market can be satiated. It is not necessary to deny theirassertion that consumer wants are capable of indefinite expansionto believe that old durable goods are competitive with new durablegoods and that the size, age composition, and distribution of theexisting stock are relevant to the net newS demand.4
Another reason for questioning extensive reliance on ex ante datais provided by the discrepancies between individual plans and re-alizations shown in section C of the paper. The authors admit thatthe usefulness of plans data depends on cancellation, in the aggre-gate, of opposite errors concerning individuals. It depends also, theysay, on consistency over time in the relationship of actual purchasesto expectancies—as they put it, "constancy from year to year in theelements that lead some consumers to understate and others to over-state their intentions." Since these elements include unanticipatedchanges in relevant exogenous factors, there is little basis for expect-ing such constancy. I see no reason, either a priori or empirical, forbelieving that there will be more constancy in propensities to under-state and overstate than in the effects of such "objective" factors asthe age of cars on the road.
Surveys of consumer buying plans are not going to spare us thenecessity for exhaustive multivariate analysis of consumer behavior.Consumer demand is not going to be explained adequately or pre-dicted accurately by simple relationships, whether these relationshipsinvolve cx post or ex ante information. Statistical data—micro-eco-nomic as well as macro-economic, cross-section as well as time-series, ex ante as well as ex post—can easily be misinterpreted interms of overly simple hypotheses. The authors are right to be scorn-ful of efforts to relate differences in the behavior of spending units,either intertemporal or interfamily, exclusively to differences in
This matter, like the genuine free will of consumers, is evidently one onwhich the Center feels strongly. Katona, questioning the value of stock data,points out that any salesman knows. that "the best prospects for new cars arenormally those who bought cars one, two, or three years ago, and the worstprospects are those who have no cars at all (op.cit., p. 106). But the closerelationship between the new and used car markets cannot be ignored. The newcar demand of the owners of young cars is dependent on trade-in values; andthese depend on the demand for used cars by those who own no cars at allor cars ready for the junk yard. Table 86 in the present paper shows the im-portance in the market of those who did not trade in or sell a car.
449
0

CONSUMER ANTICIPATIONS
financial position. In survey data the effects of income and liquidassets on consumer demand are obscured by and entangled with(a) dynamic effects not revealed by a single cross-section, and (b)effects of nonfinancial differences among families—age, occupation,size, composition, location, etc. In the Surveys of Consumer Finances,for example, the value of the numerous published tabulations relat-ing some kind of behavior to income class is vitiated by high corre-lation between size of family, or spending unit, and income. Evenyear to year changes in the behavior of units with the same incomeand asset holdings__on which the authors rely in assessing "ability tobuy"—.are difficult to interpret if there is a possibility that the samplesdiffer in respect to other relevant factors, such as family size.
We shall not make substantial progress in the prediction of con-sumer demand until the many difficulties of kind are overcomeand relationships are derived that take account of the many varia-bles affecting household behavior. In this task, as stated at the out-set, consumer surveys must play a large part, and reinterviews ofidentical samples can be especially useful. In applying these com-plex relationships to the problems of short-run prediction the exante information of consumer surveys should be very helpful.
REPLY BY MR. LANSING
Tobin and Bratt raise a number of interesting and difficult prob-lems. There are several points at which further discussion than iscontained in the paper seems in order. Both Tobin and Bratt suggestthat further attention be paid to data on the stocks of durables. Thissuggestion has much to commend it. We have never felt that infor-mation about stocks should be ignored—stocks are mentioned, forexample, in the analytical outline under "willingness to buy." Furtherinvestigations in this area should be part of our future work.
The type of analysis of which we are skeptical is that based onwhat might be called a naïve satiation hypothesis. This hypothesisin its simplest form runs as follows: If at a given point of time, suchas late 1940, x per cent of the spending units in the populationowned good A, it is unlikely that in 1952 the proportion owninggood A will rise above x per If one applies our analytical frame-work to this problem, one first must ask, Have there been anychanges in ability to buy? and What has happened to real income,to holdings of liquid assets, and to debt? The simple argument out-lined above assumes: (1) real incomes have not changed, or, if they
450

CONSUMER ANTICIPATIONS
have, the income elasticity of demand for good A is so low that it maybe ignored; (2) liquid asset holdings of consumers have not changed,or, if they have, these changes have no effect on consumers' pur-chases of durables once a certain level of stocks has been reached;(3) the credit position of consumers has not changed, or, if it has,the changes may be ignored.
These are strong assumptions. Even if are correét, one muststill ask, Have there been any changes in "willingness to buy"?"Willingness to buy" includes what we refer to as "wants, needs,and aspirations," which coincide more or less with what economistscall "tastes." The, assumption that tastes have not changed becomesespecially dangerous when periods of a decade or more are involved.Consumers' perceptions of their own ability to buy and their ap-praisal of the economic situation also are subject to change. In ourview these factors can be of great importaiice, especially in the shortrun, which is what is under discussion. Once again the naïve satia-tion hypothesis assumes either that these factors have not changed,or that they may be neglected.
Any comparison of stocks of durables over an extended period issubject to the limitation that the nature of the good will change.This point arises in analysis based on age distributions of durablegoods at two points of time. Differences in age may have a differentmeaning. Take, for example, data on the age distribution of auto-mobiles in 1940 and 1950. The cars on the road in 1940 included asubstantial number that had been built in the late twenties andearly thirties. The rate of change in the life expectancy of automobilescontinued to be rapid at least up to the time of universal adoptionof the all-steel body and roof, about 1936. Thus a ten-year-old carin 1940, or even a seven-year-old car, was one with quite a differentlife expectancy from that .of a car four or five years old. In 1950,however, a ten.year-old car was less drastically different from a five-year-old car. Thus a comparison of age distributions in 1940 and1950 is not simple—an element of judgment may slip in.
It is a basic limitation of any approach through the analysis ofstocks that a small percentage change in stocks can lead to a largechange in output in any given year. For example, One may find that45 per cent of the population own good A. Assume 50 million con-sumer units in the population. If one estimates the "saturation level"
• at 50 per cent ownership, the implication is a total demand for Aequal to whatever may be necessary for replacement plus up to 5per cent of 50 million, or 2.5 million, units. But if there is an error
451

CONSUMER ANTICIPATIONS
of five percentage points in the estimate of the "saturation level,"that is, if the "true" level is known only to be between 45 and 55 percent, demand will be anywhere from replacement only up to re-placement plus 5 million.
From a practical point of view the question must be raised of theaccuracy and validity of whatever data may be available. The onlydata on stocks of durablés in the Survey of Consumer Finances in1951 were those referred to by Tobin.1 The tables show the propor-tion of each rural and each urban income quintile owning a car, andthe age distribution of cars owned. These data, as noted in the foot-notes to those tables, are subject to important technical weaknessesin addition to the conceptual problems outlined above. They in-volve comparisons between surveys conducted by the Survey Re-search Center and surveys conducted by the Department of Labor.The surveys in question differ in definition of automobile ownershipand family unit, in universe covered, and in sampling methods. Thedata as reported from the 1941 survey were not in the form shownin the table; they had to be adjusted by a process of freehand graph.icinterpolation. Finally, the sampling errors of the differences in theproportion of owners in table 7 (which are incremental to any er-rors from the sources just enumerated) amount to from 6 to 11 percent. In view of these technical problems, in addition to the con-ceptual difficulties, it seemed appropriate to rely upon other data inappraising the immediate outlook in early 1951.
Another topic discussed by Tobin is whether one should rely oncx post or ex ante information. The difference, as he observes, is oneof emphasis, but there is probably also a real difference of opinion.The argument seems difficult to settle on the basis of a priori reason-ing. For example, there is no question that some types of expendi-tures like funerals are inherently unforeseeable by the consumerunits interviewed and that the frequency of funerals should be pre-dicted through the analysis of ex post information. An interestingquestion is, What proportion of consumers' expenditures are of thistype? Even more interesting is this: Can the variation, in consumers'expenditures from year to year be explained by the study of-suchexpenditures?
It seems to us open to question whether the replacement demandfor durable goods has quite the autonomous and unpredictable char-acter Tobin ascribes to funerals. Consider the most important of the
1 "Purchases of Durable Goods and Houses in 1950 and Buying Plans for1951," Federal Reserve Bulletin, July 1951, tables 7 and 8.
452

CONSUMER ANTICIPATIONS
durables, automobiles. In the first place, a car that is going to breakdown during a particular year is likely to have given some prelim-inary indication of the approaching catastrophe. In the second place,the actual course of events seems to be that cars do not collapse allat once, like the one-horse shay. More commonly, the owner of adilapidated vehicle decides that the game is not worth the àandleand trades his car a used car dealer for a slightly more modernvehicle. The dealer then does the actual scrapping—or installs a re-built engine. The date when the owner makes a last trade-in maywell be open to a certain amount of variation. He may elect to putin a little more money and a little more effort and get the car tocough along for a few more miles. Or he may decide a few weeksor months in advance that the old car is good for only another 1,000miles, and then he may elect to drive only 10 miles a week for thenext 100 weeks. But one point is quite clear: that the holder of theused car, in the last miles of its life, is the only individual whosedemand for a replacement is stimulated by the possibility of com-plete mechanical collapse. The individual who bought this car newpresumably traded it in after a few years' wear, when there was agood deal of life left in it. In all probability he was the individual(of all the owners of the car in its lifetime) who then bought an-other new car. Replacement demand for new automobiles is onlyindirectly connected with scrapping. The chain of events by whicha new car is turned out and an old one scrapped involves consciousdecisions on the part of several people. We feel it worth while toexplore the possibility that the individuals know in advance some-thing about their decisions and can tell us something about them.
Bratt argues convincingly that we need to study the length of theplanning period for various individual commodities. We have madesome attempts in this direction, but we have been handicapped bythe limited number of cases we have had in our reinterview analysisof people who bought particular items during a given year. Thedata we do have suggest a good deal of dispersion in the length of theplanning period; that is, some people seem to plan for one length oftime and others for different periods without as much central tend-ency as one might hope.
Another interesting suggestion made by Bratt is that we shouldstudy more closely the distinction between automatic and nonauto.matic consumer expenditures. This distinction plays an importantrole in the thinking of people at the Center, especially that of Ka-tona, and it may well be that further empirical investigations wouldprove. fruitful.
453
