the yin and yang of best track data: user "needs" and producer "wants" richard...
TRANSCRIPT

The Yin and Yang of Best Track Data:
User "needs" and Producer "wants"
The Yin and Yang of Best Track Data:
User "needs" and Producer "wants"
Richard J. MurnaneRichard J. MurnaneRPI/BIOS and Baseline Management Company, Inc.RPI/BIOS and Baseline Management Company, Inc.
7 May, 20097 May, 2009IBTrACS WorkshopIBTrACS Workshop
Asheville, NCAsheville, NC
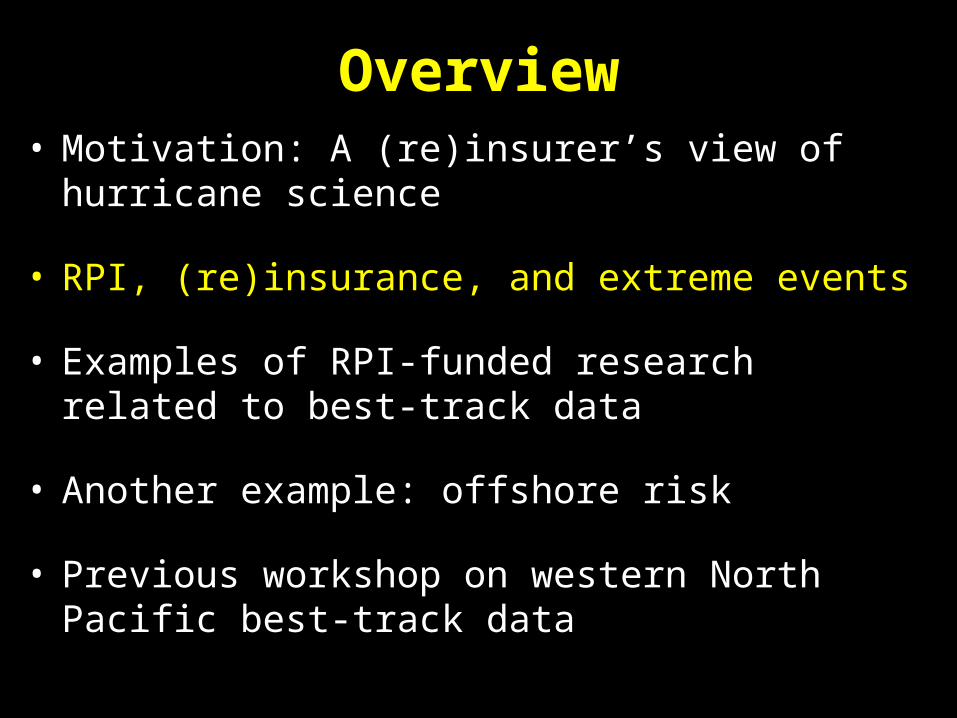
Overview• Motivation: A (re)insurer’s view of hurricane science
• RPI, (re)insurance, and extreme events
• Examples of RPI-funded research related to best-track data
• Another example: offshore risk
• Previous workshop on western North Pacific best-track data
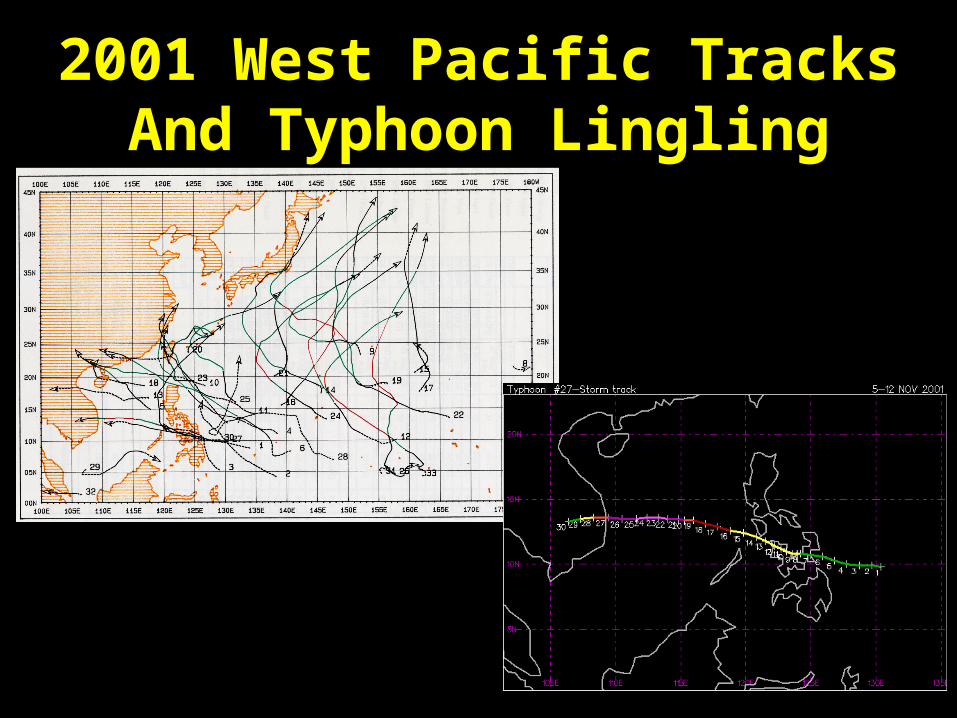
2001 West Pacific Tracks And Typhoon Lingling

Lingling Wind Speed EstimatesAgency Speed (kts) Category
Maximum wind speed (satellite obs)
China 115 Cat 4JTWC 115 Cat 4Hong Kong 109 Cat 3JMA 97 Cat 3
Just before landfall (satellite obs)China 91 Cat 2JTWC 95 Cat 2Hong Kong 75 Cat 1JMA 57 TS
Measured windVietnam 71(?) Cat 1
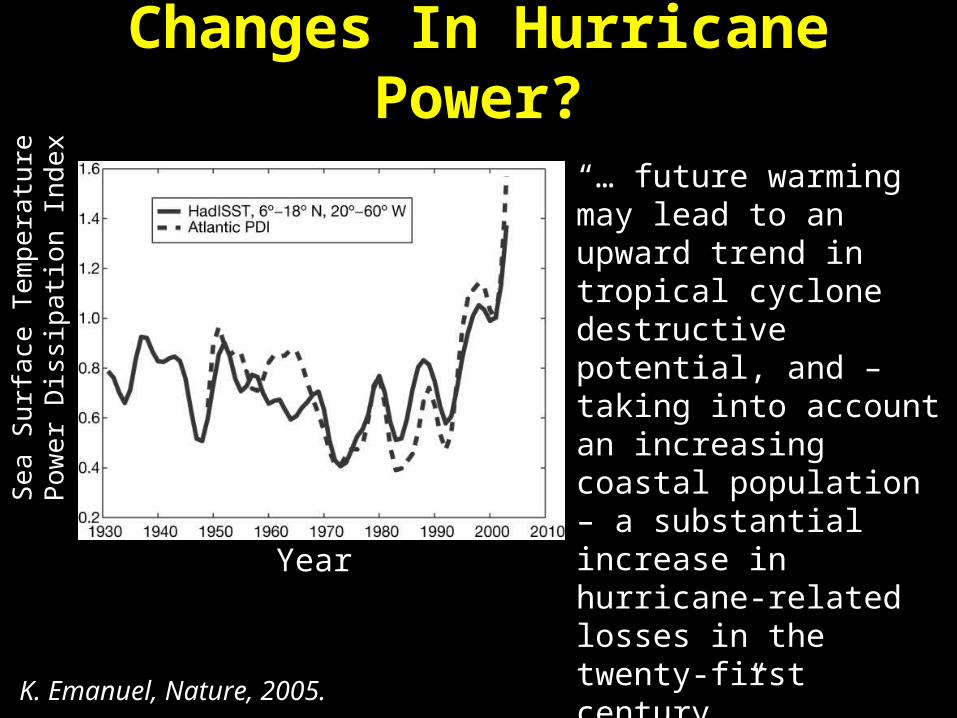
“… future warming may lead to an upward trend in tropical cyclone destructive potential, and – taking into account an increasing coastal population – a substantial increase in hurricane-related losses in the twenty-first century.”
Changes In Hurricane Power?
Year
Se
a S
urf
ace
Te
mp
era
ture
Po
we
r D
issi
pat
ion
Ind
ex
K. Emanuel, Nature, 2005.
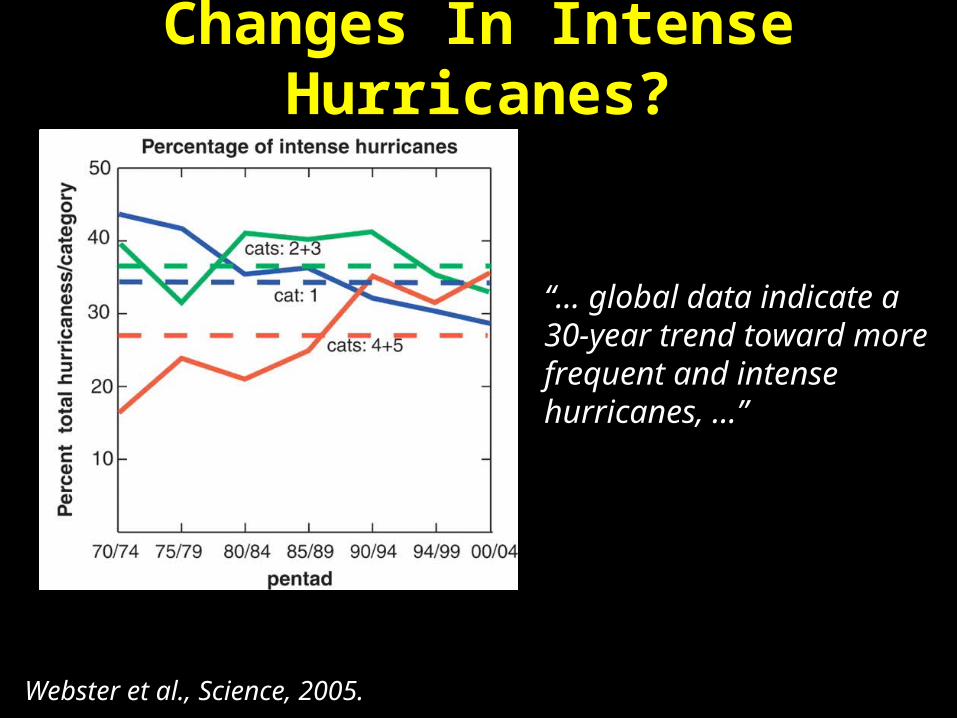
Changes In Intense Hurricanes?
“… global data indicate a 30-year trend toward more frequent and intense hurricanes, …”
Webster et al., Science, 2005.

Or, No Change?
“Subjective measurements and variable procedures make existing tropical cyclone databases insufficiently reliable to detect trends in the frequency of extreme cyclones.”
Landsea et al., Science, 2006.
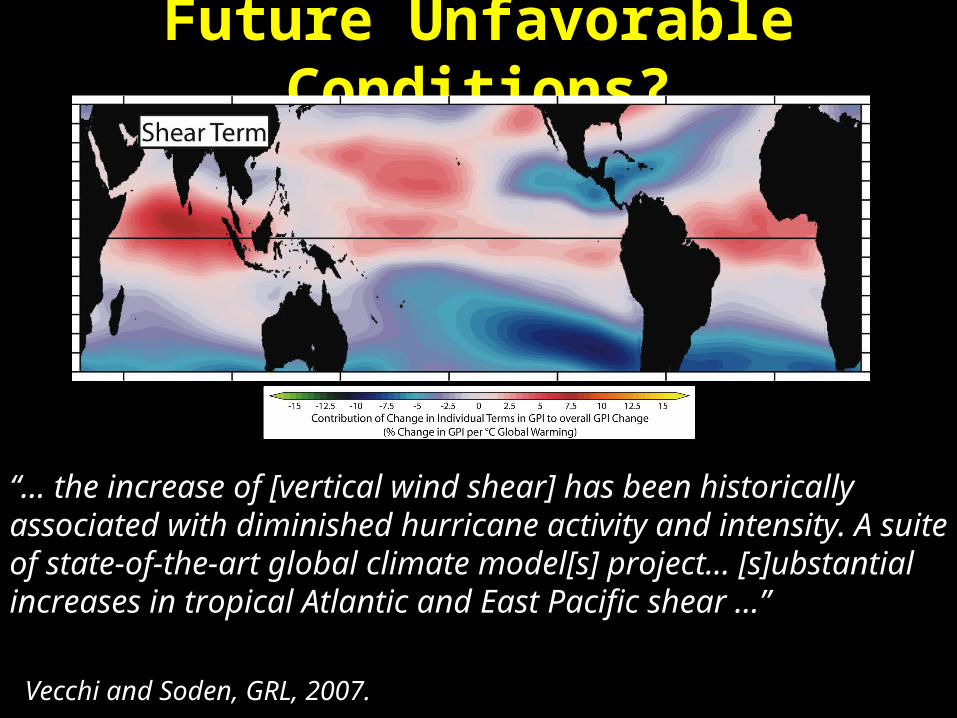
“… the increase of [vertical wind shear] has been historically associated with diminished hurricane activity and intensity. A suite of state-of-the-art global climate model[s] project… [s]ubstantial increases in tropical Atlantic and East Pacific shear …”
Future Unfavorable Conditions?
Vecchi and Soden, GRL, 2007.
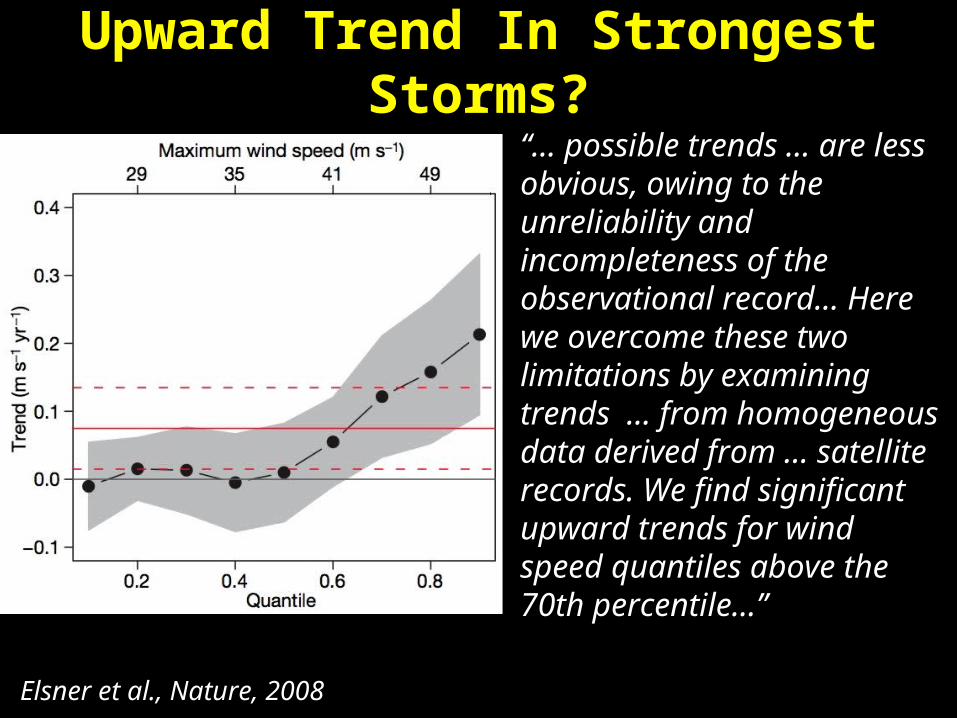
Upward Trend In Strongest Storms?
“... possible trends … are less obvious, owing to the unreliability and incompleteness of the observational record... Here we overcome these two limitations by examining trends … from homogeneous data derived from … satellite records. We find significant upward trends for wind speed quantiles above the 70th percentile…”
Elsner et al., Nature, 2008
Yin and Yang
• Climate Signal– Yes or No?
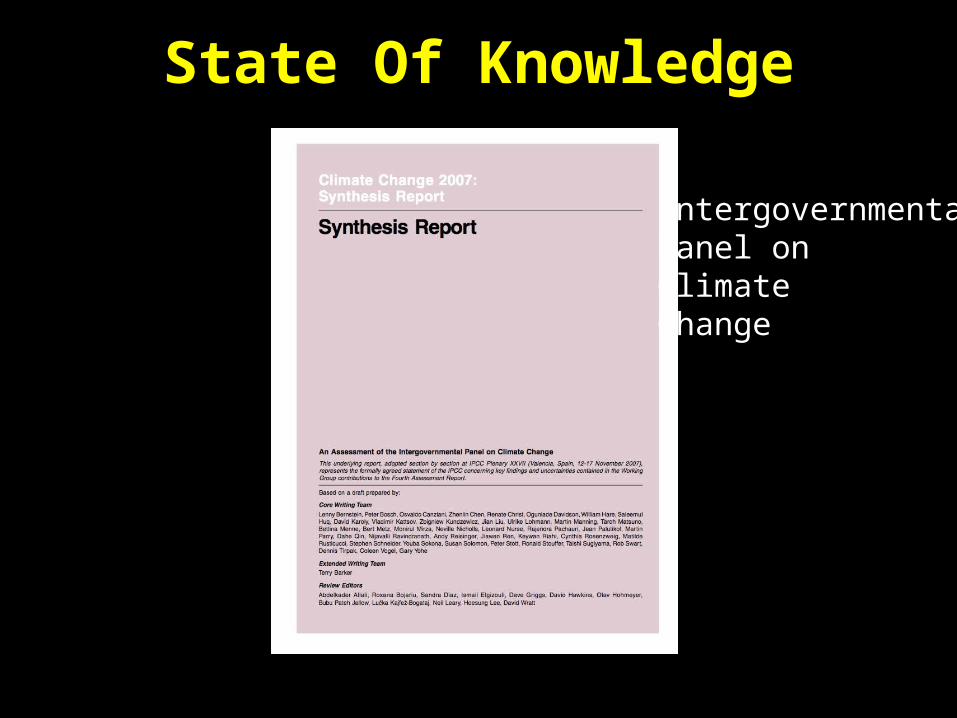
State Of Knowledge
IntergovernmentalPanel onClimateChange
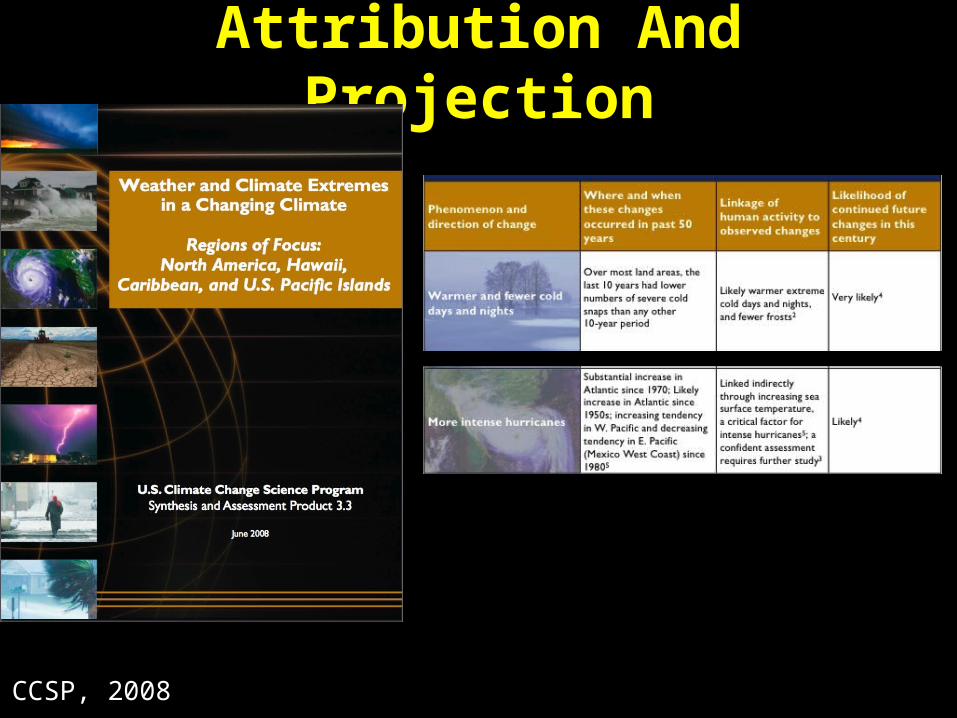
Attribution And Projection
CCSP, 2008
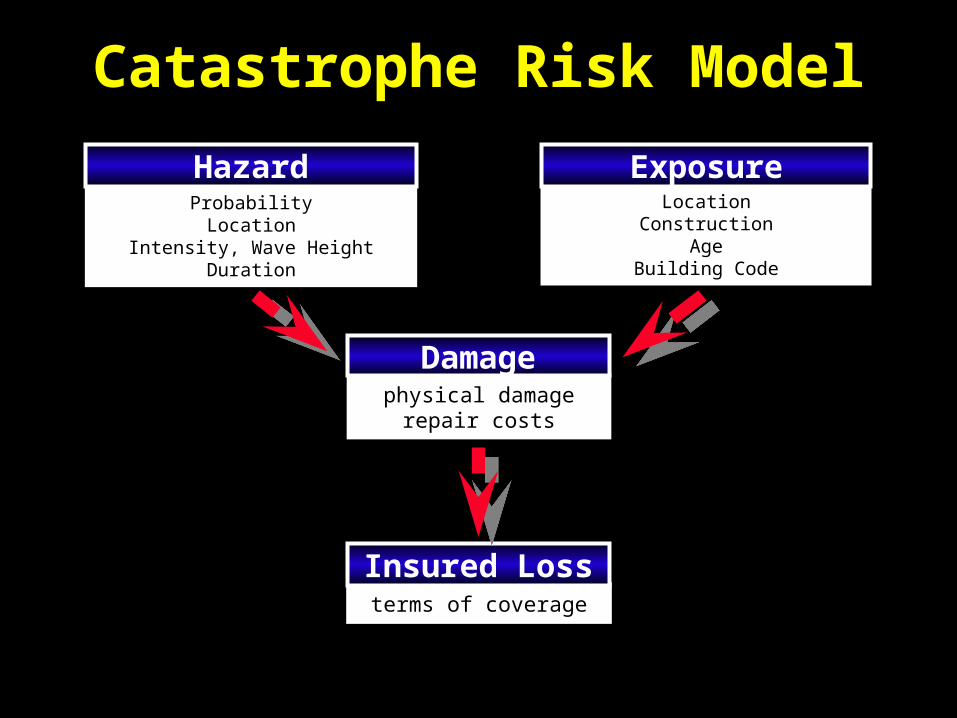
Catastrophe Risk Model
physical damagerepair costs
Damage
terms of coverage
Insured Loss
ProbabilityLocation
Intensity, Wave HeightDuration
HazardLocation
ConstructionAge
Building Code
Exposure
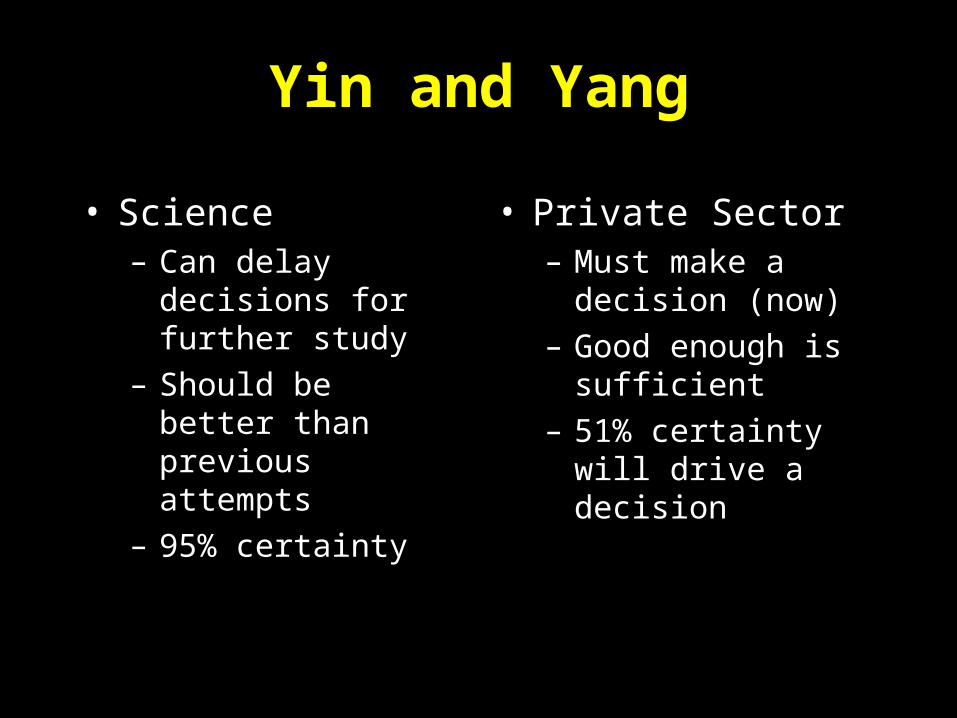
Yin and Yang
• Science– Can delay decisions
for further study– Should be better
than previous attempts
– 95% certainty
• Private Sector– Must make a
decision (now)– Good enough is
sufficient– 51% certainty will
drive a decision
Overview• Motivation: A (re)insurer’s view of hurricane science
• RPI, (re)insurance, and extreme events
• Examples of RPI-funded research related to best-track data
• Another example: offshore risk
• Previous workshop on western North Pacific best-track data

RPI Corporate Sponsors• XL Re Ltd.
• PartnerRe
• Amlin Underwriting
• Renaissance Reinsurance Corporation
• Axis Specialty
• Nephila Capital
• State Farm
• Aspen Insurance
• Risk Management Solutions
• FlagstoneRe

Top 40 Property Cat Losses 1970-2007
Onshore Katrina/Rita LossesOffshore
Losses total$308 billion in2007 dollars
Swiss Re Sigma, 1/2008
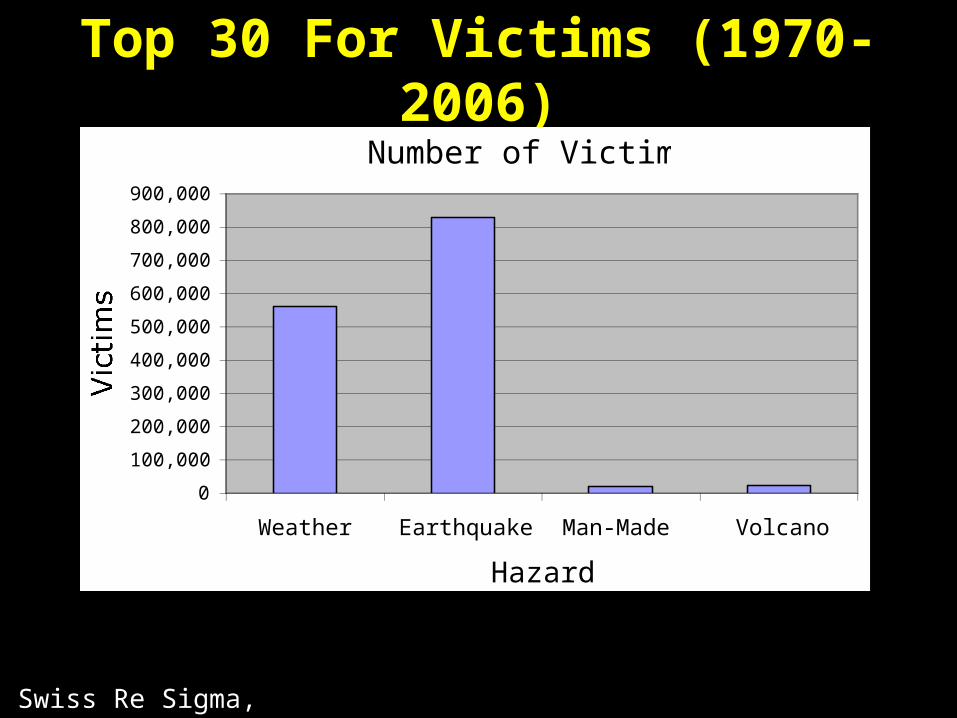
Top 30 For Victims (1970-2006)
Number of Victims
0
100,000
200,000
300,000
400,000
500,000
600,000
700,000
800,000
900,000
Weather Earthquake Man-Made Volcano
Hazard
Swiss Re Sigma, 2/2007
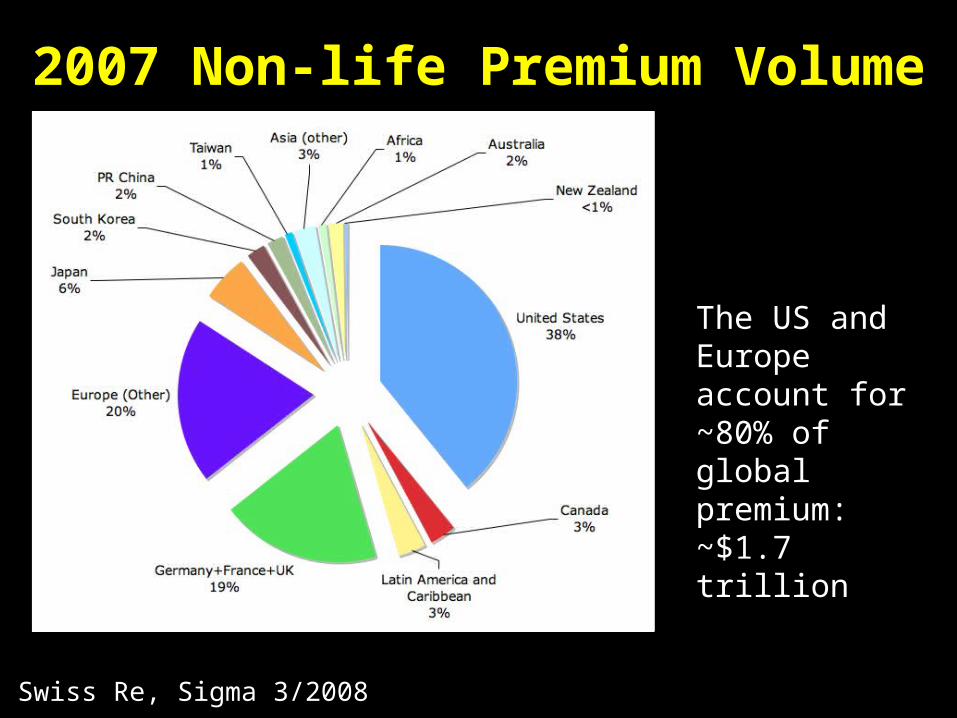
2007 Non-life Premium Volume
Swiss Re, Sigma 3/2008
The US and Europe account for ~80% of global premium:~$1.7 trillion
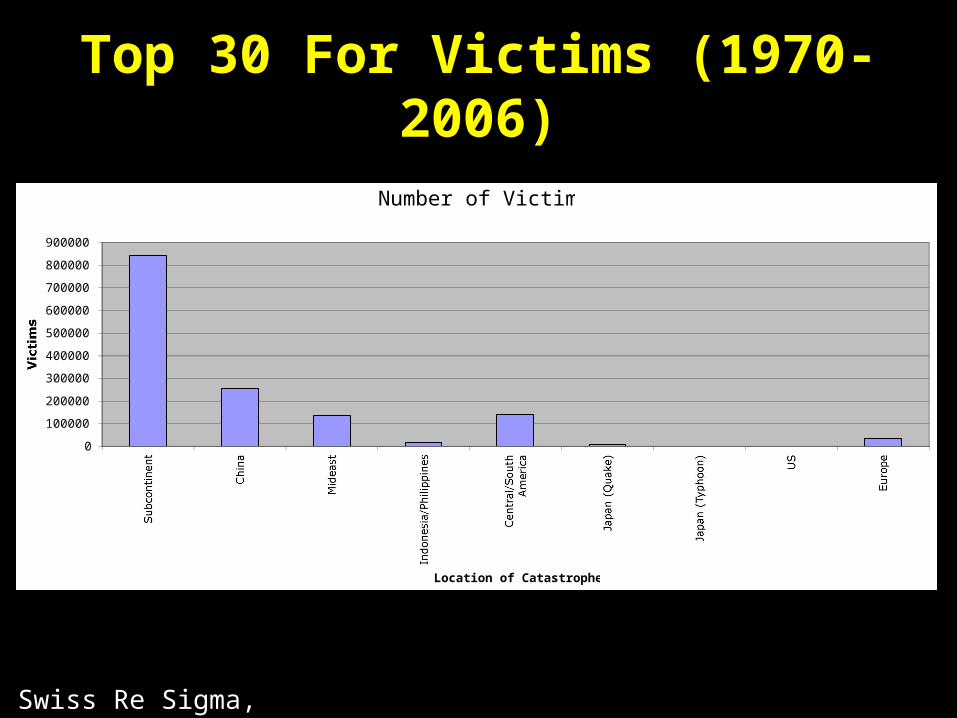
Top 30 For Victims (1970-2006)
Number of Victims
0
100000
200000
300000
400000
500000
600000
700000
800000
900000
Location of Catastrophe
Swiss Re Sigma, 2/2007
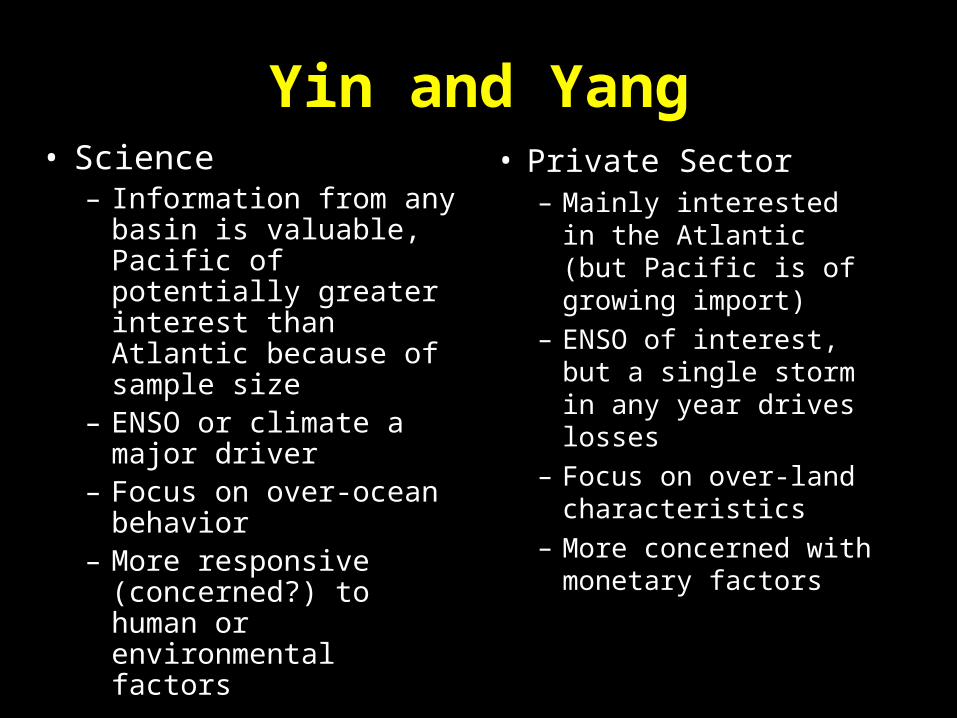
Yin and Yang• Science
– Information from any basin is valuable, Pacific of potentially greater interest than Atlantic because of sample size
– ENSO or climate a major driver
– Focus on over-ocean behavior
– More responsive (concerned?) to human or environmental factors
• Private Sector– Mainly interested in
the Atlantic (but Pacific is of growing import)
– ENSO of interest, but a single storm in any year drives losses
– Focus on over-land characteristics
– More concerned with monetary factors

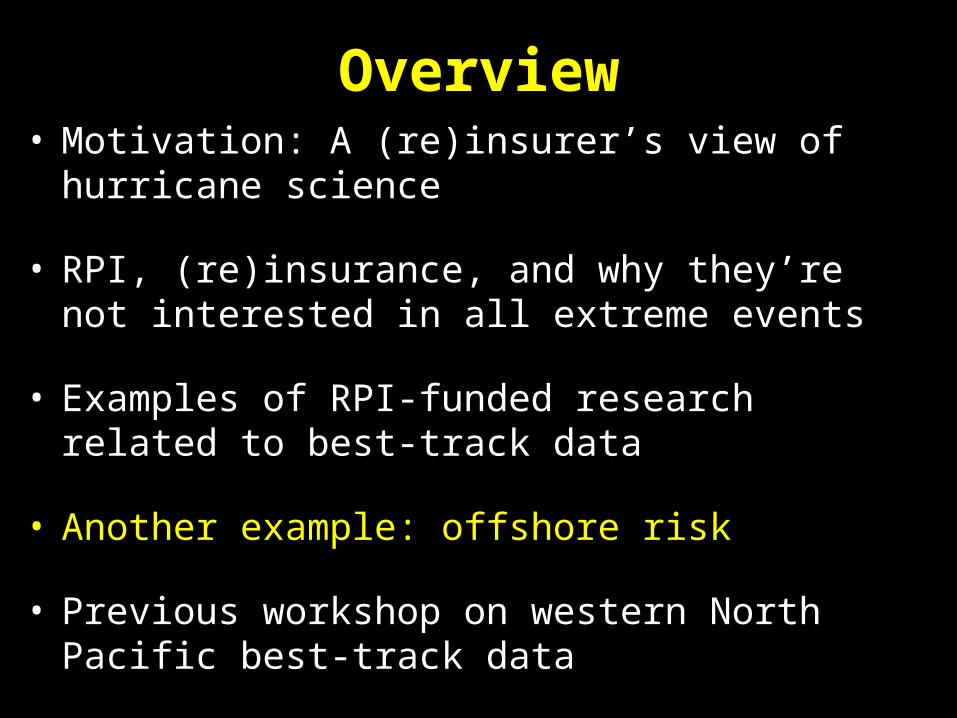
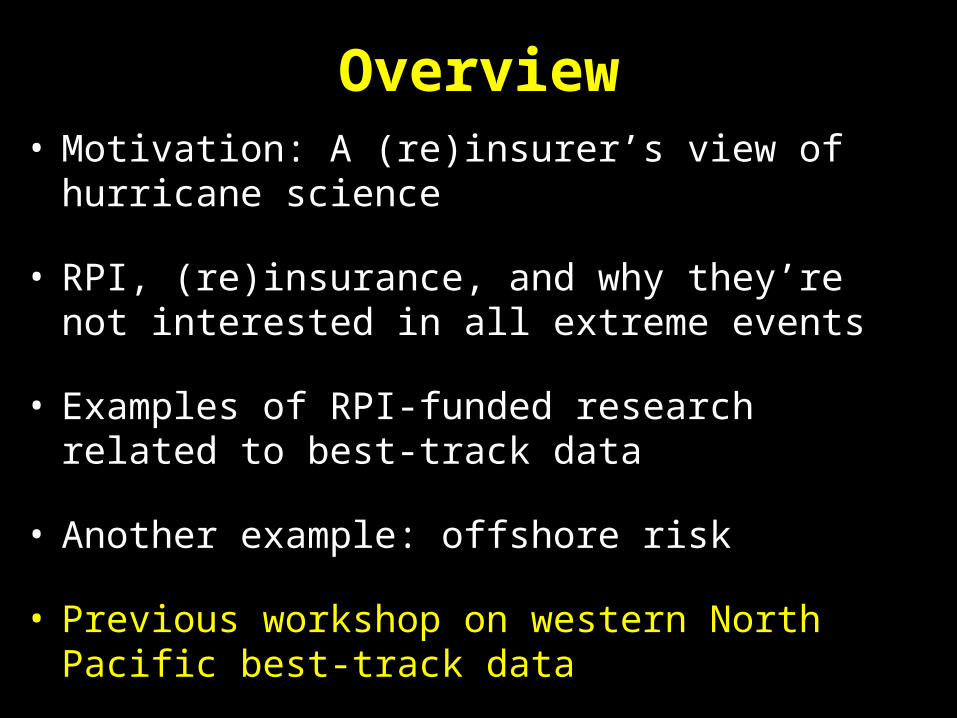
Overview• Motivation: A (re)insurer’s view of hurricane science
• RPI, (re)insurance, and why they’re not interested in all extreme events
• Examples of RPI-funded research related to best-track data
• Another example: offshore risk
• Previous workshop on western North Pacific best-track data
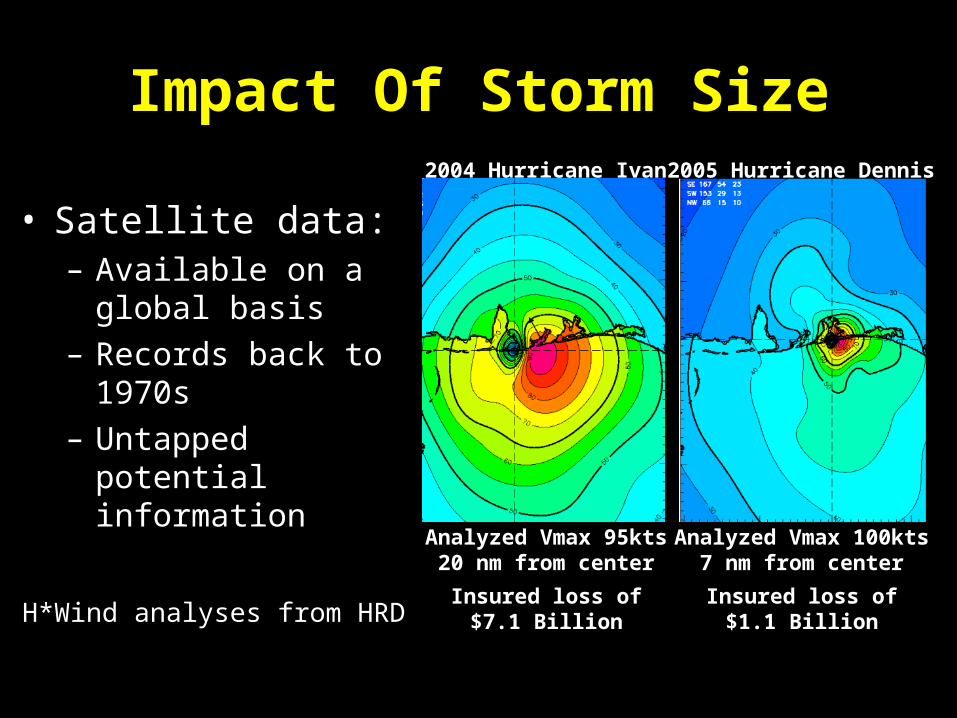
Impact Of Storm Size
• Satellite data:– Available on a global
basis– Records back to
1970s– Untapped potential
information
2005 Hurricane Dennis2004 Hurricane Ivan
Analyzed Vmax 100kts7 nm from center
Insured loss of$1.1 Billion
Analyzed Vmax 95kts20 nm from center
Insured loss of$7.1 BillionH*Wind analyses from HRD

Extended Best-Track Data
• 1997 RPI workshop: “Wind Field Dynamics of Landfalling Tropical Cyclones”
• Mark DeMaria said there were boxes of observations sitting in hallway
• RPI funded effort to digitize data: Extended Best Track data set
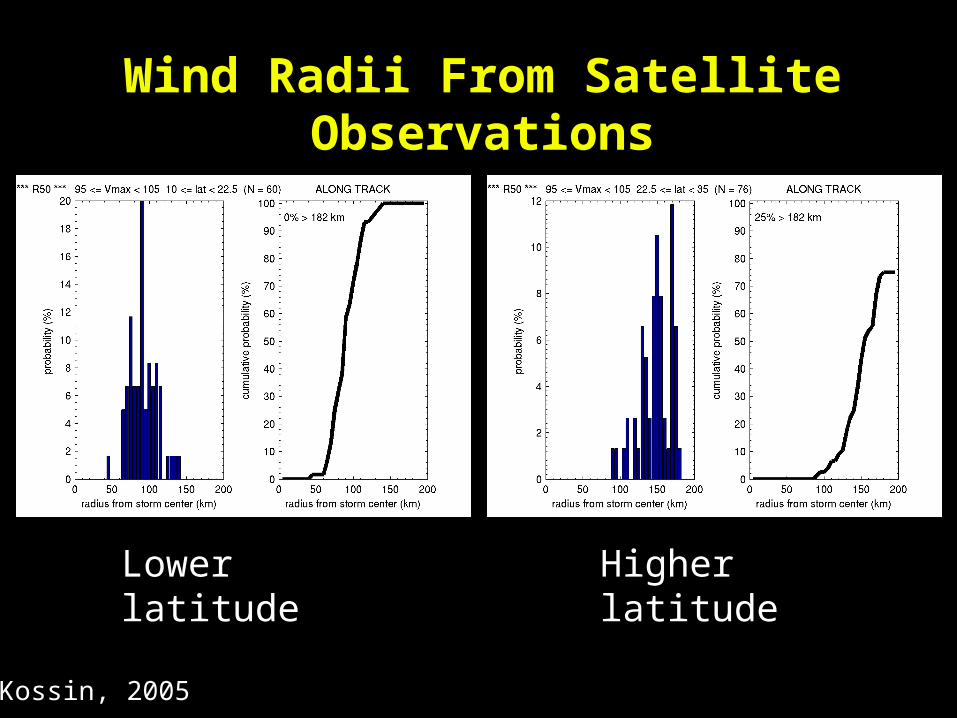
Wind Radii From Satellite Observations
Lower latitude Higher latitude
Kossin, 2005Kossin, 2005

UW/NCDC Reanalysis For PDIAtlantic NE Pacific NW Pacific
Global
Kossin et al., 2007
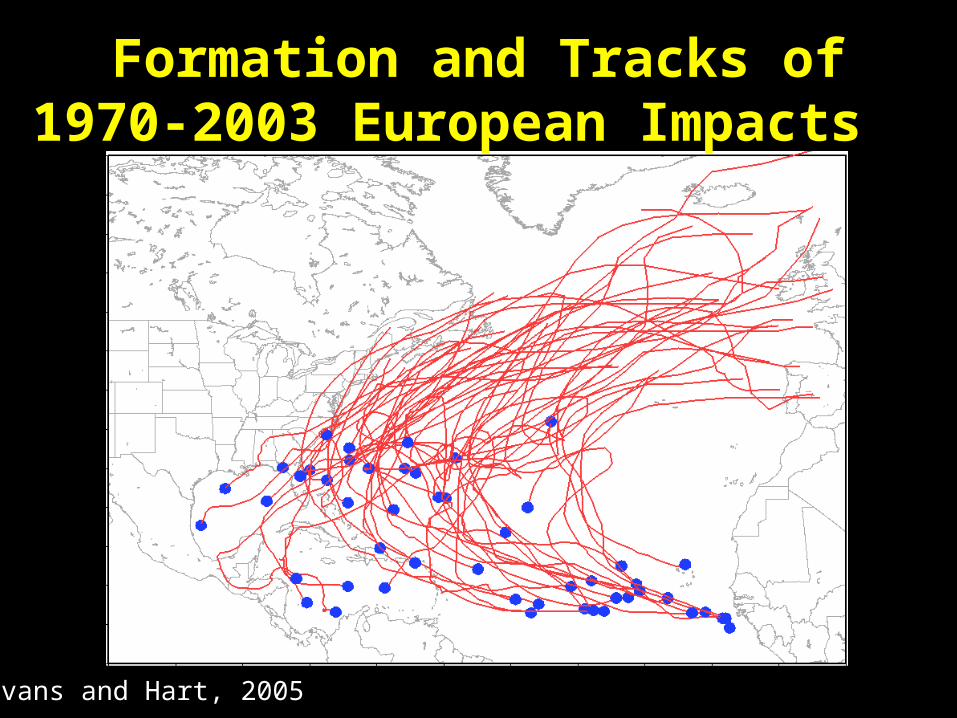
Formation and Tracks of 1970-2003 European Impacts
Evans and Hart, 2005
Overview• Motivation: A (re)insurer’s view of hurricane science
• RPI, (re)insurance, and why they’re not interested in all extreme events
• Examples of RPI-funded research related to best-track data
• Another example: offshore risk
• Previous workshop on western North Pacific best-track data
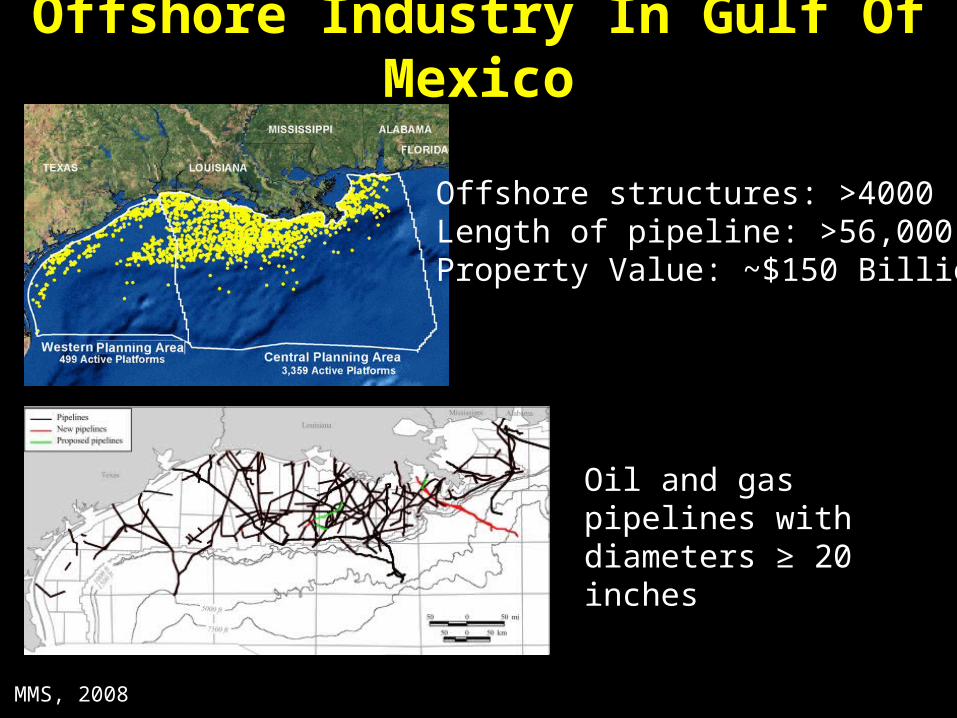
Offshore Industry In Gulf Of Mexico
Offshore structures: >4000Length of pipeline: >56,000 kmProperty Value: ~$150 Billion
MMS, 2008
Oil and gas pipelines with diameters ≥ 20 inches
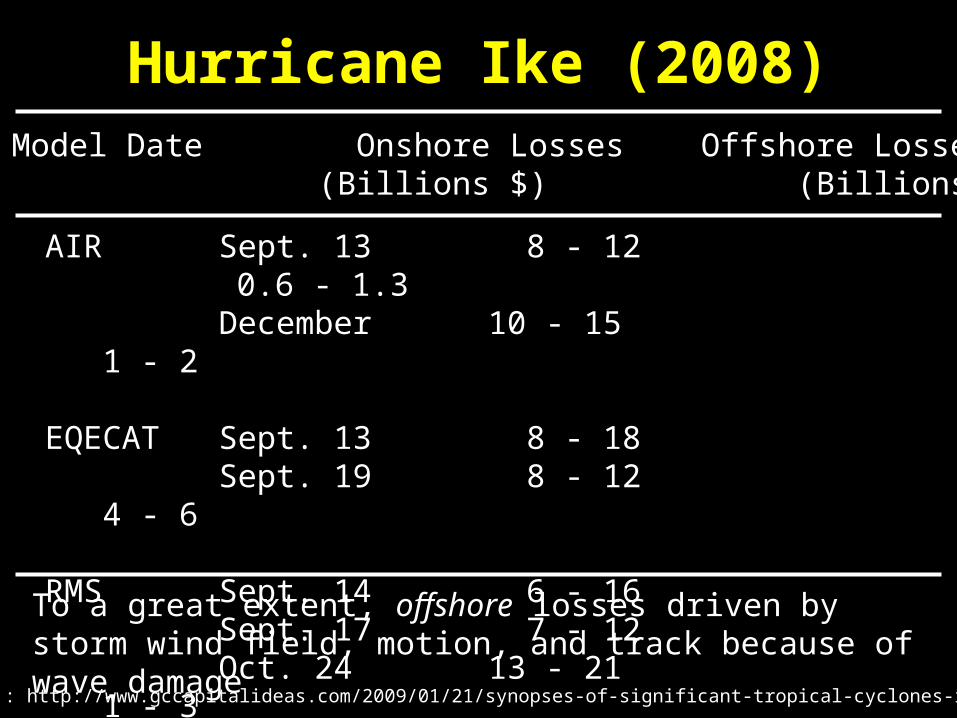
Hurricane Ike (2008)
Losses from : http://www.gccapitalideas.com/2009/01/21/synopses-of-significant-tropical-cyclones-in-2008/
Cat Model Date Onshore Losses Offshore Losses(Billions $) (Billions $)
AIR Sept. 13 8 - 12 0.6 - 1.3December 10 - 15 1 - 2
EQECAT Sept. 13 8 - 18Sept. 19 8 - 12 4 - 6
RMS Sept. 14 6 - 16Sept. 17 7 - 12Oct. 24 13 - 21 1 - 3
To a great extent, offshore losses driven by storm wind field, motion, and track because of wave damage
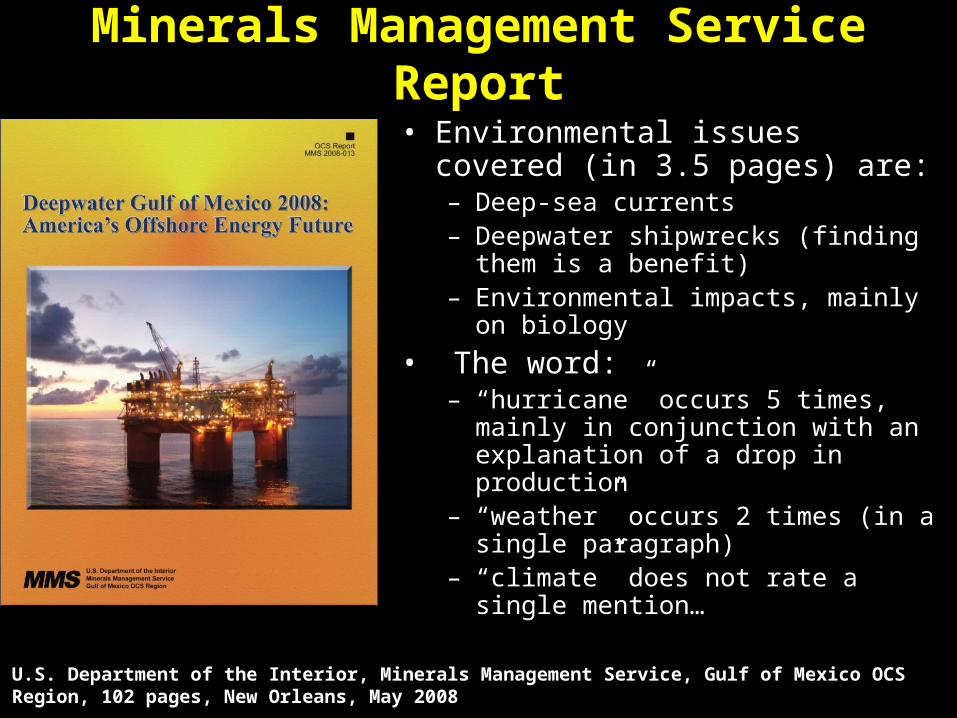
• Environmental issues covered (in 3.5 pages) are:– Deep-sea currents– Deepwater shipwrecks (finding them is
a benefit)– Environmental impacts, mainly on
biology
• The word:– “hurricane” occurs 5 times, mainly in
conjunction with an explanation of a drop in production
– “weather” occurs 2 times (in a single paragraph)
– “climate” does not rate a single mention…
U.S. Department of the Interior, Minerals Management Service, Gulf of Mexico OCS Region, 102 pages, New Orleans, May 2008
Minerals Management Service Report
Overview• Motivation: A (re)insurer’s view of hurricane science
• RPI, (re)insurance, and why they’re not interested in all extreme events
• Examples of RPI-funded research related to best-track data
• Another example: offshore risk
• Previous workshop on western North Pacific best-track data
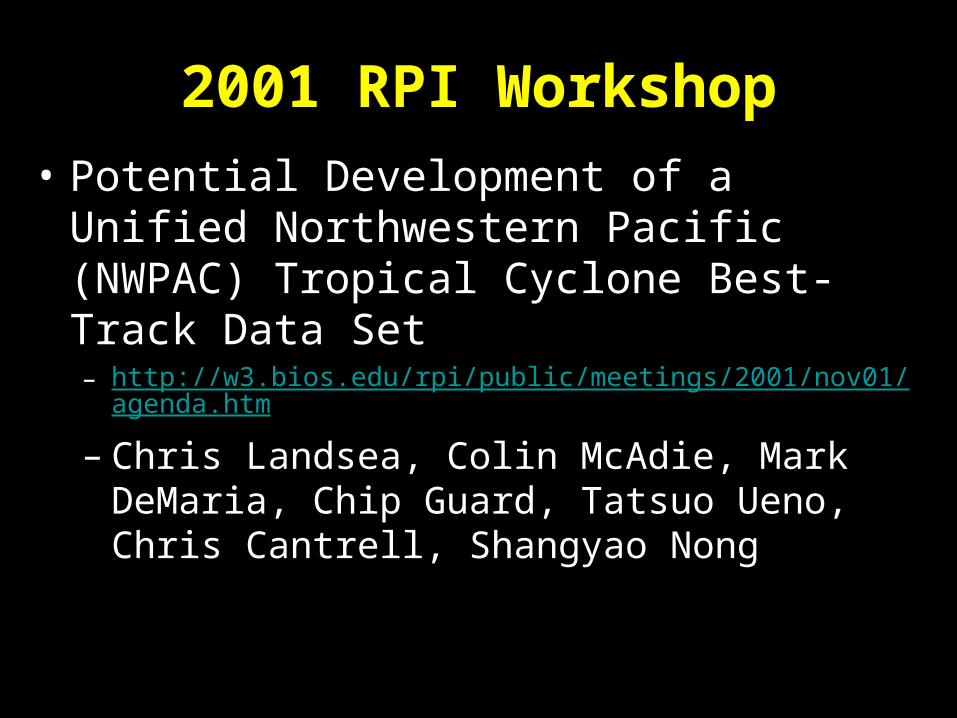
2001 RPI Workshop
• Potential Development of a Unified Northwestern Pacific (NWPAC) Tropical Cyclone Best-Track Data Set – http://w3.bios.edu/rpi/public/meetings/2001/nov01/agenda.htm
– Chris Landsea, Colin McAdie, Mark DeMaria, Chip Guard, Tatsuo Ueno, Chris Cantrell, Shangyao Nong
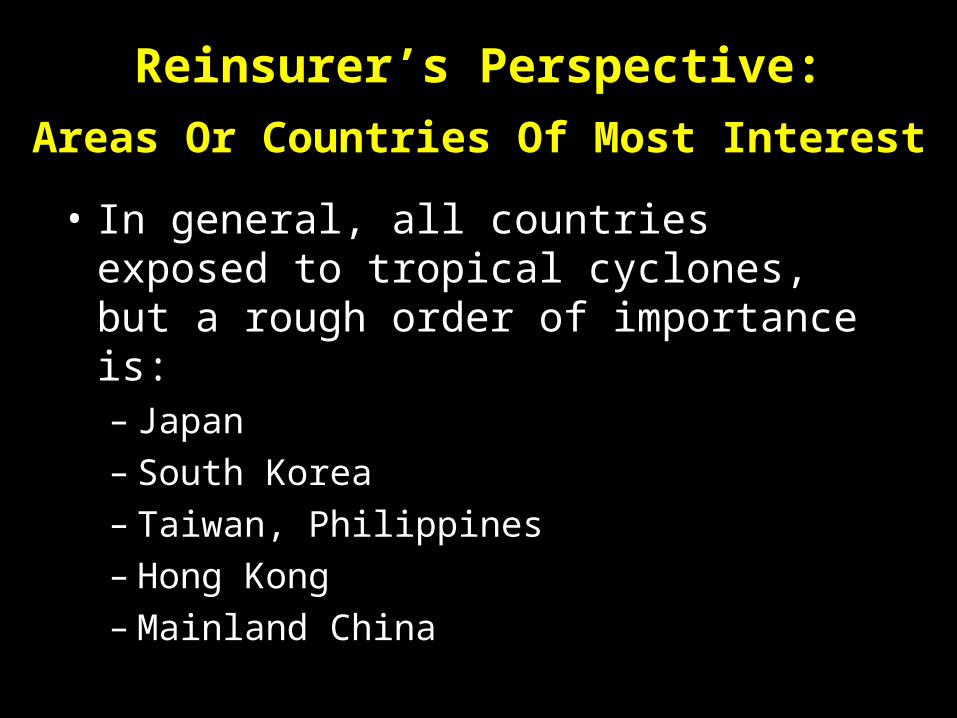
Reinsurer’s Perspective:
Areas Or Countries Of Most Interest
• In general, all countries exposed to tropical cyclones, but a rough order of importance is:– Japan– South Korea– Taiwan, Philippines– Hong Kong– Mainland China
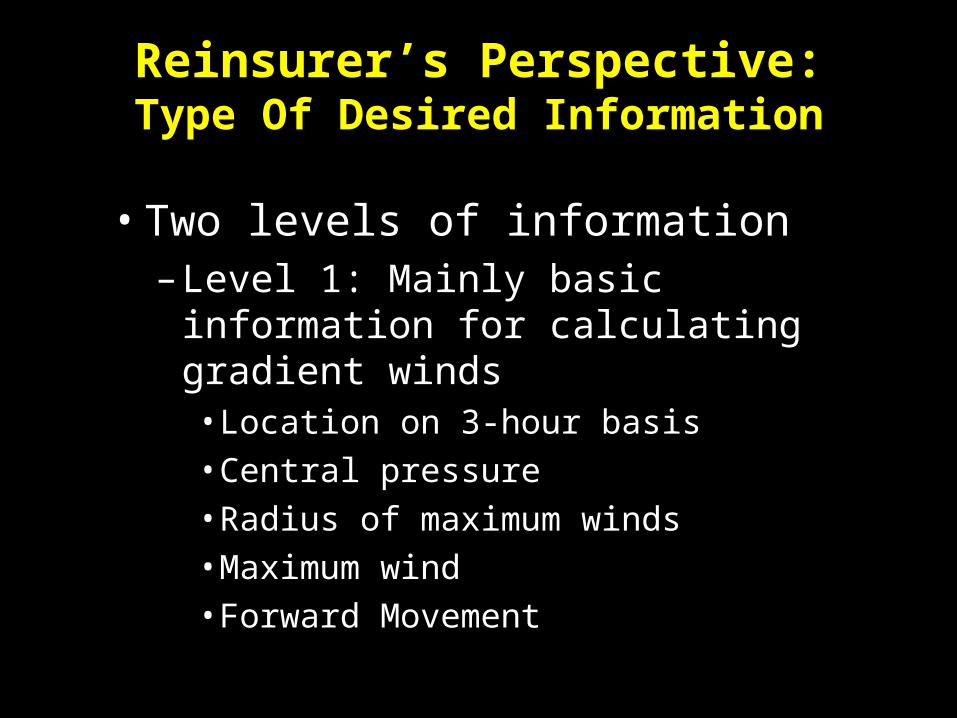
Reinsurer’s Perspective:Type Of Desired Information
• Two levels of information– Level 1: Mainly basic information
for calculating gradient winds• Location on 3-hour basis• Central pressure• Radius of maximum winds• Maximum wind• Forward Movement
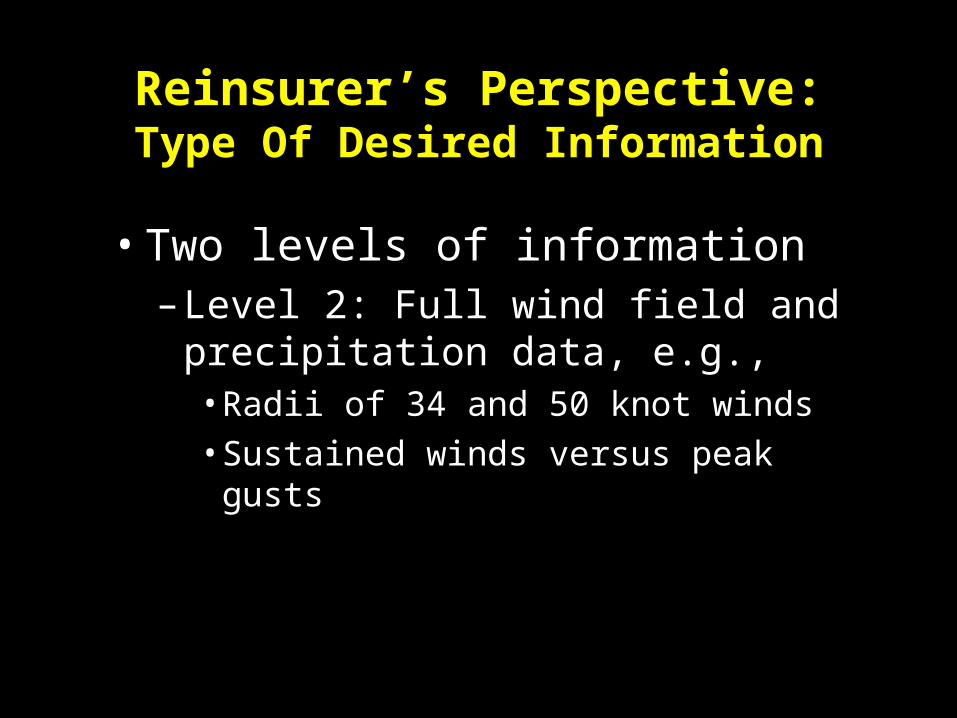
Reinsurer’s Perspective:Type Of Desired Information
• Two levels of information– Level 2: Full wind field and
precipitation data, e.g.,• Radii of 34 and 50 knot winds• Sustained winds versus peak gusts• Rainfall rate
Reinsurer’s Perspective:Data Format And Availability
• Data format relatively unimportant, as long as it is standardized
• Comma-delimited ASCII probably most practical
• On-line access preferred

http://w3.bios.edu/rpi/public/meetings/2001/nov01/agenda.htm
Reinsurer’s Perspective:Use Of “Real-Time” Wind Data
• With initial storm landfall try to overlap wind field data to “exposure” information to estimate expected losses
• At other times use proprietary models that have a version of integrated wind fields

WMO Report Data
• CI and T numbers• Confidence in center
position• Max gust and quality
code• Rmax• Wind radii: gale force
and optional wind speed in 4 quadrants