the world’s looming water crisis€¦ · the world’s looming water crisis by angelo katsoras...
TRANSCRIPT
Economics and Strategy
Geopolitical Briefing
January 6, 2020
The world’s looming water crisis By Angelo Katsoras
Introduction While today’s headlines focus on risks ranging from protectionism, great power rivalries, mass protests in many countries, tensions in the Middle East and greenhouse gases, one major story looms in the background: growing water scarcity.
The amount of freshwater on the planet has remained fairly constant over time, continually being recycled through the atmosphere and back into our cups. However, the world’s water reserves are being squeezed at both the demand and the supply ends of the curve.
The accelerating pace of industrialization, urbanization and agricultural production has caused global demand for water to increase significantly. This is exacerbated by pollution, inadequate infrastructure, and growing incidences of drought.
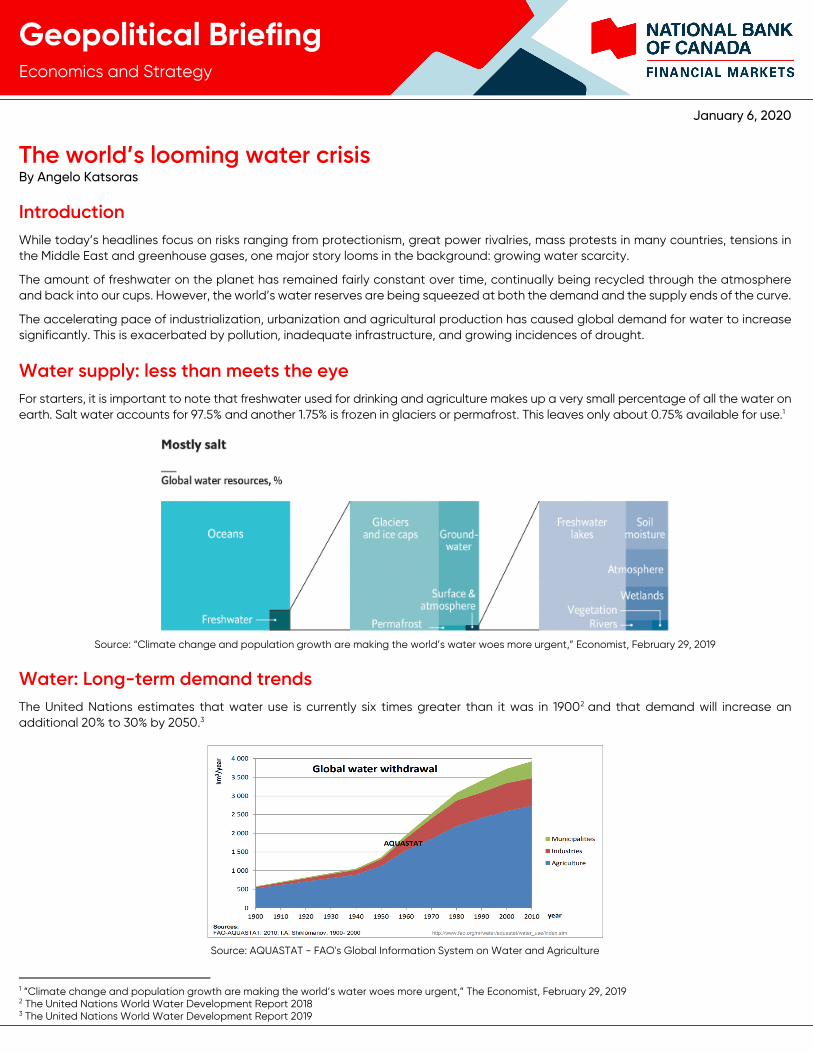
Water supply: less than meets the eye For starters, it is important to note that freshwater used for drinking and agriculture makes up a very small percentage of all the water on earth. Salt water accounts for 97.5% and another 1.75% is frozen in glaciers or permafrost. This leaves only about 0.75% available for use.1
Source: “Climate change and population growth are making the world’s water woes more urgent,” Economist, February 29, 2019
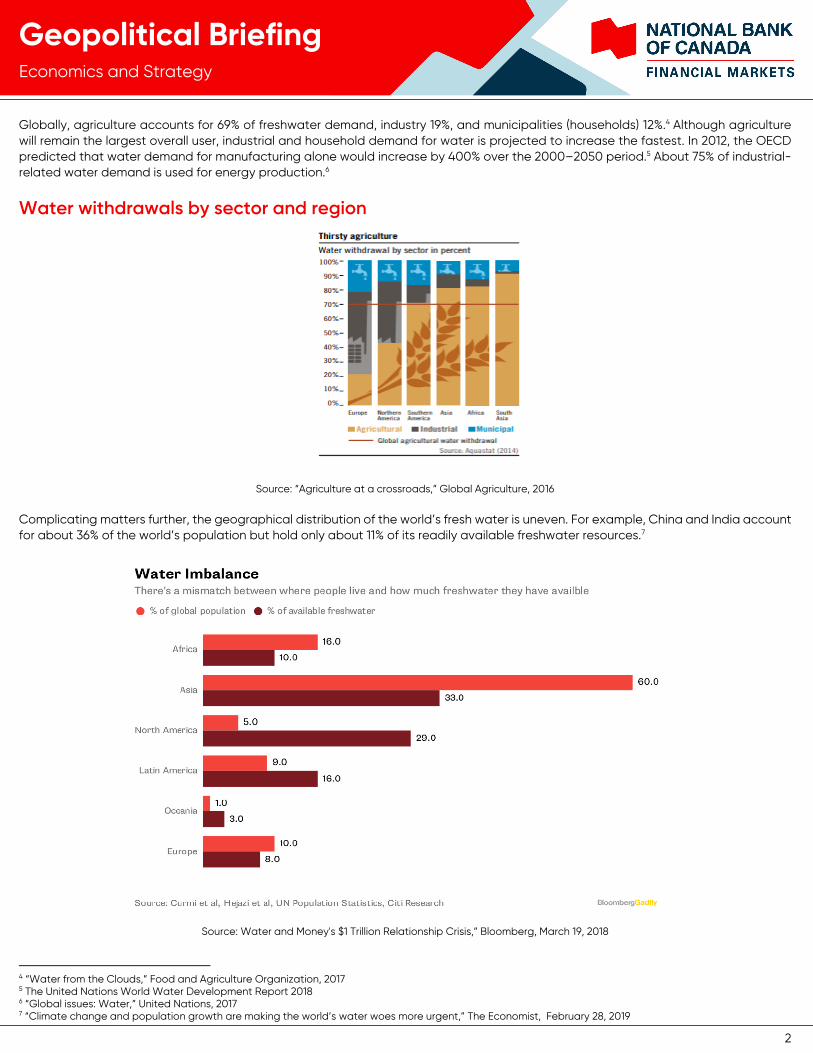
Water: Long-term demand trends The United Nations estimates that water use is currently six times greater than it was in 19002 and that demand will increase an additional 20% to 30% by 2050.3
Source: AQUASTAT - FAO's Global Information System on Water and Agriculture
1 “Climate change and population growth are making the world’s water woes more urgent,” The Economist, February 29, 2019 2 The United Nations World Water Development Report 2018 3 The United Nations World Water Development Report 2019
2
Economics and Strategy
Geopolitical Briefing
Globally, agriculture accounts for 69% of freshwater demand, industry 19%, and municipalities (households) 12%.4 Although agriculture will remain the largest overall user, industrial and household demand for water is projected to increase the fastest. In 2012, the OECD predicted that water demand for manufacturing alone would increase by 400% over the 2000–2050 period.5 About 75% of industrial-related water demand is used for energy production.6
Water withdrawals by sector and region
Source: “Agriculture at a crossroads,” Global Agriculture, 2016
Complicating matters further, the geographical distribution of the world’s fresh water is uneven. For example, China and India account for about 36% of the world’s population but hold only about 11% of its readily available freshwater resources.7
Source: Water and Money's $1 Trillion Relationship Crisis,” Bloomberg, March 19, 2018
4 “Water from the Clouds,” Food and Agriculture Organization, 2017 5 The United Nations World Water Development Report 2018 6 “Global issues: Water,” United Nations, 2017 7 “Climate change and population growth are making the world’s water woes more urgent,” The Economist, February 28, 2019
3
Economics and Strategy
Geopolitical Briefing
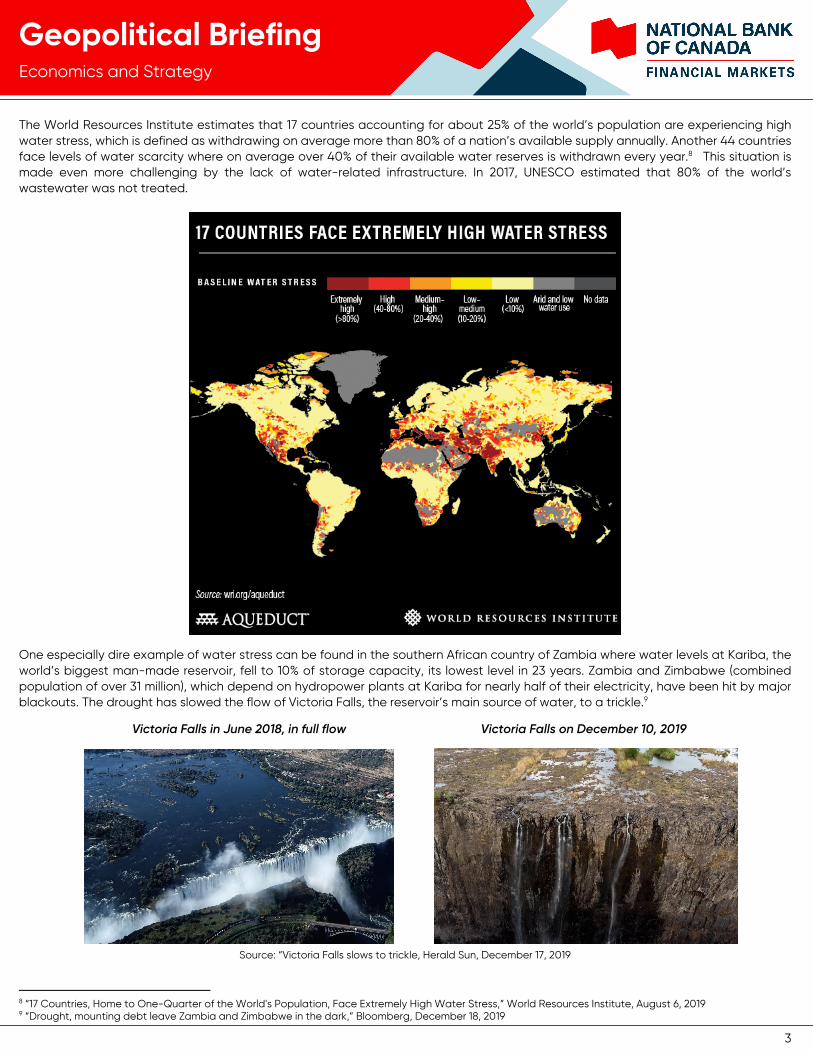
The World Resources Institute estimates that 17 countries accounting for about 25% of the world’s population are experiencing high water stress, which is defined as withdrawing on average more than 80% of a nation’s available supply annually. Another 44 countries face levels of water scarcity where on average over 40% of their available water reserves is withdrawn every year.8 This situation is made even more challenging by the lack of water-related infrastructure. In 2017, UNESCO estimated that 80% of the world’s wastewater was not treated.
One especially dire example of water stress can be found in the southern African country of Zambia where water levels at Kariba, the world’s biggest man-made reservoir, fell to 10% of storage capacity, its lowest level in 23 years. Zambia and Zimbabwe (combined population of over 31 million), which depend on hydropower plants at Kariba for nearly half of their electricity, have been hit by major blackouts. The drought has slowed the flow of Victoria Falls, the reservoir’s main source of water, to a trickle.9
Victoria Falls in June 2018, in full flow Victoria Falls on December 10, 2019
Source: “Victoria Falls slows to trickle, Herald Sun, December 17, 2019
8 “17 Countries, Home to One-Quarter of the World's Population, Face Extremely High Water Stress,” World Resources Institute, August 6, 2019 9 “Drought, mounting debt leave Zambia and Zimbabwe in the dark,” Bloomberg, December 18, 2019
4
Economics and Strategy
Geopolitical Briefing
Unlike oil, water is a renewable resource. Water falls from the clouds, returns to rivers, aquifers and the sea, and evaporates back to the clouds. This natural cycle explains why we cannot run out of water. However, as supply is finite, there is a very real risk that certain countries are using water faster than it can be naturally replenished.
Also, since importing water from overseas is not viable from an economic or logistical perspective, once a region’s water use exceeds the natural rate of replenishment, the best solution is to reduce water consumption to more sustainable levels and/or to import more water-intensive products from abroad.
Forces driving rising global demand for water
More urbanized mouths to feed
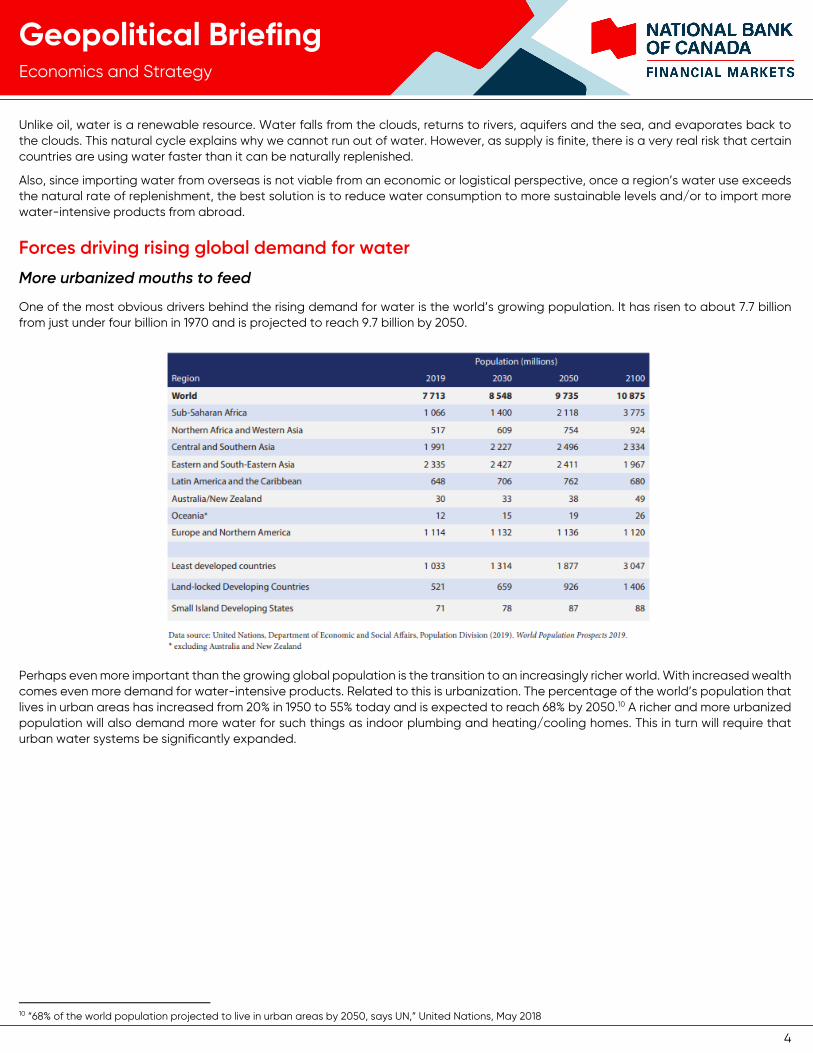
One of the most obvious drivers behind the rising demand for water is the world’s growing population. It has risen to about 7.7 billion from just under four billion in 1970 and is projected to reach 9.7 billion by 2050.
Perhaps even more important than the growing global population is the transition to an increasingly richer world. With increased wealth comes even more demand for water-intensive products. Related to this is urbanization. The percentage of the world’s population that lives in urban areas has increased from 20% in 1950 to 55% today and is expected to reach 68% by 2050.10 A richer and more urbanized population will also demand more water for such things as indoor plumbing and heating/cooling homes. This in turn will require that urban water systems be significantly expanded.
10 “68% of the world population projected to live in urban areas by 2050, says UN,” United Nations, May 2018
5
Economics and Strategy
Geopolitical Briefing
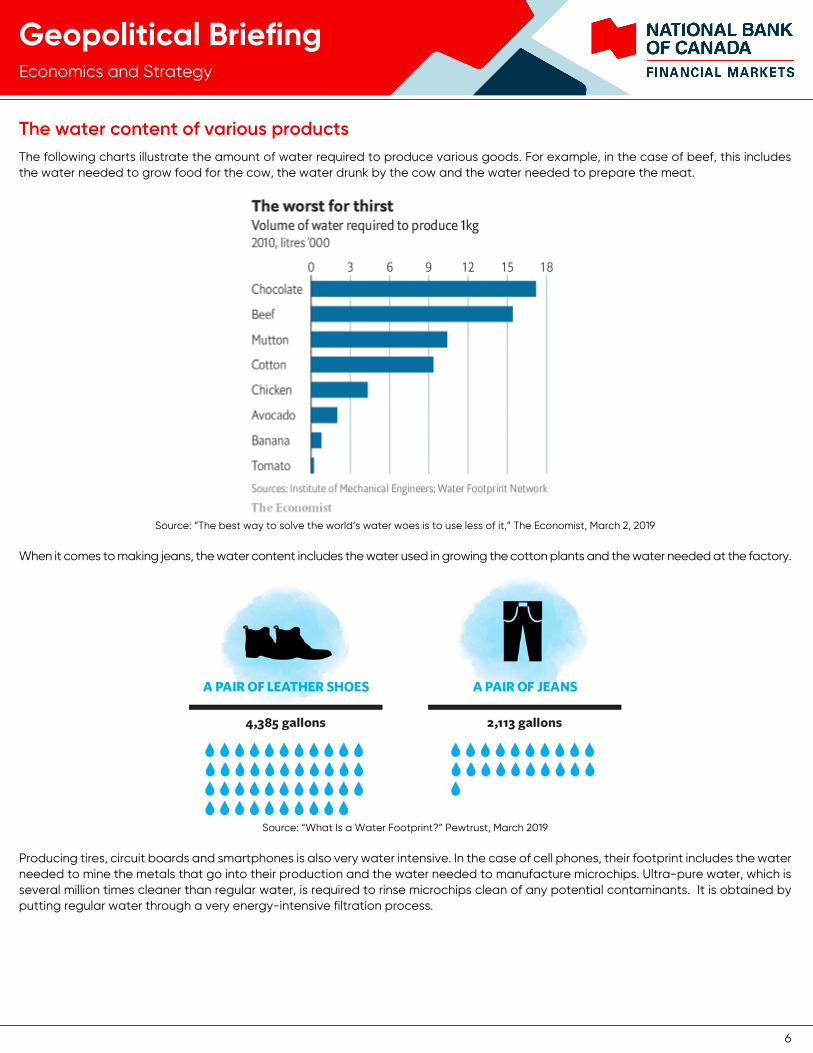
Greater demand for food, particularly meat
Increasing global demand for meat and eggs requires more and more corn and soybeans to feed growing numbers of cows, chicken and pigs. Global meat production has increased nearly fivefold from 70 million metric tons in the early 1960s to 330 million metric tons in 2017, while the global population only slightly more than doubled over this period.11
In 2017, the Food and Health Organization estimated that by 2050 the world would need to produce almost 50% more food (both meat and plants), feed and biofuels than it did in 2012.12
Source: “Which countries eat the most meat?” BBC, February 4, 2019
11 “Which countries eat the most meat?,” BBC, February 4, 2019 12 “The future of food and agriculture,” Food and Health Organization, 2017
38
40
42
44
46
48
50
52
54
56
58
60
62
1998 2000 2002 2004 2006 2008 2010 2012 2014 2016 2018 2020
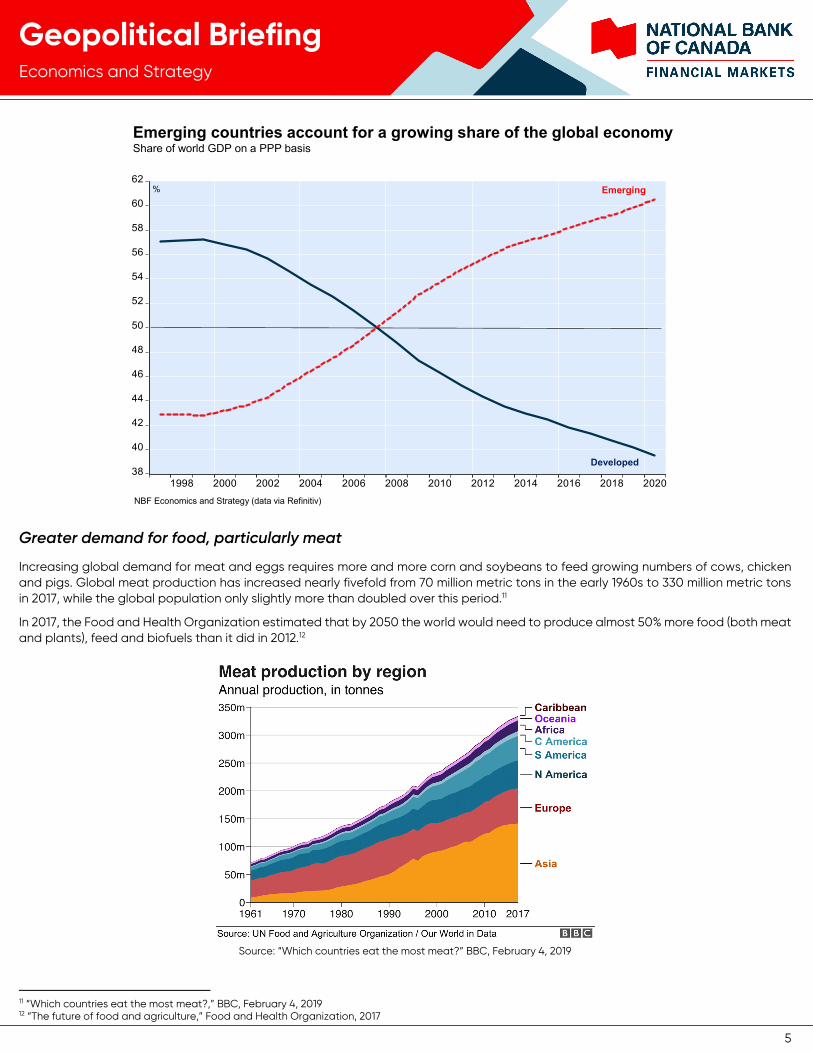
Emerging countries account for a growing share of the global economy Share of world GDP on a PPP basis
% Emerging
Developed
NBF Economics and Strategy (data via Refinitiv)
6
Economics and Strategy
Geopolitical Briefing
The water content of various products The following charts illustrate the amount of water required to produce various goods. For example, in the case of beef, this includes the water needed to grow food for the cow, the water drunk by the cow and the water needed to prepare the meat.
Source: “The best way to solve the world’s water woes is to use less of it,” The Economist, March 2, 2019
When it comes to making jeans, the water content includes the water used in growing the cotton plants and the water needed at the factory.
Source: “What Is a Water Footprint?” Pewtrust, March 2019
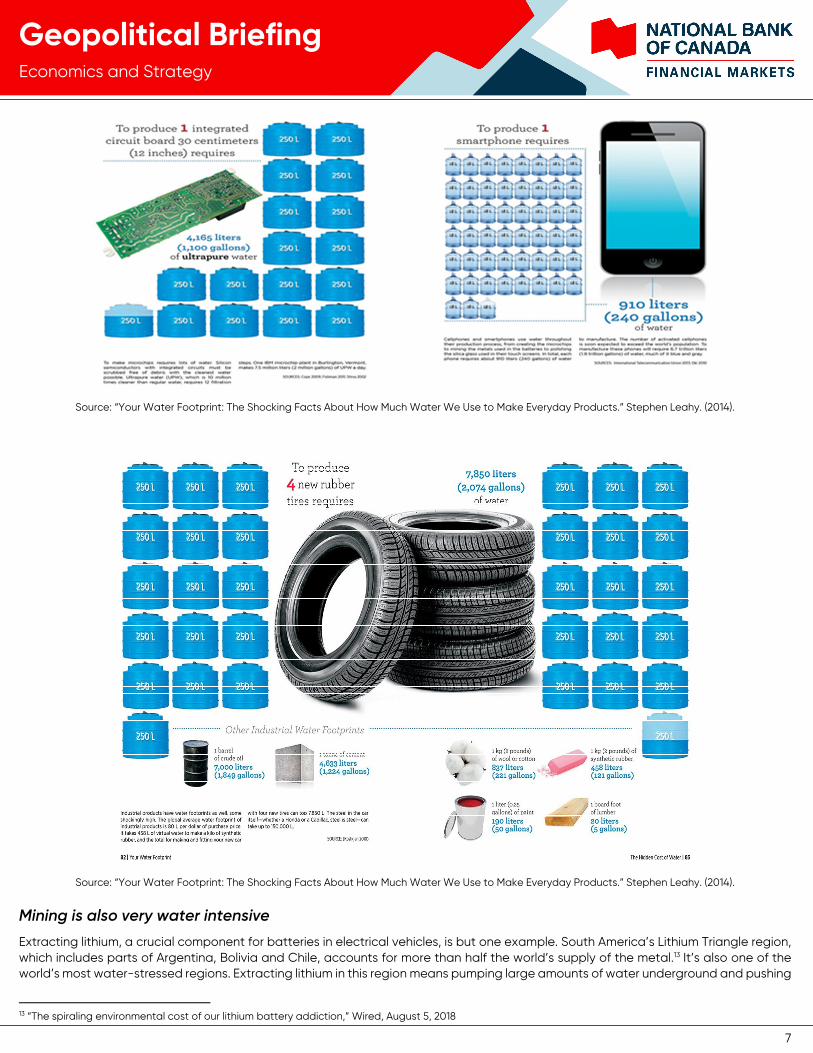
Producing tires, circuit boards and smartphones is also very water intensive. In the case of cell phones, their footprint includes the water needed to mine the metals that go into their production and the water needed to manufacture microchips. Ultra-pure water, which is several million times cleaner than regular water, is required to rinse microchips clean of any potential contaminants. It is obtained by putting regular water through a very energy-intensive filtration process.
7
Economics and Strategy
Geopolitical Briefing
Source: “Your Water Footprint: The Shocking Facts About How Much Water We Use to Make Everyday Products.” Stephen Leahy. (2014).
Source: “Your Water Footprint: The Shocking Facts About How Much Water We Use to Make Everyday Products.” Stephen Leahy. (2014).
Mining is also very water intensive
Extracting lithium, a crucial component for batteries in electrical vehicles, is but one example. South America’s Lithium Triangle region, which includes parts of Argentina, Bolivia and Chile, accounts for more than half the world’s supply of the metal.13 It’s also one of the world’s most water-stressed regions. Extracting lithium in this region means pumping large amounts of water underground and pushing
13 “The spiraling environmental cost of our lithium battery addiction,” Wired, August 5, 2018
8
Economics and Strategy
Geopolitical Briefing
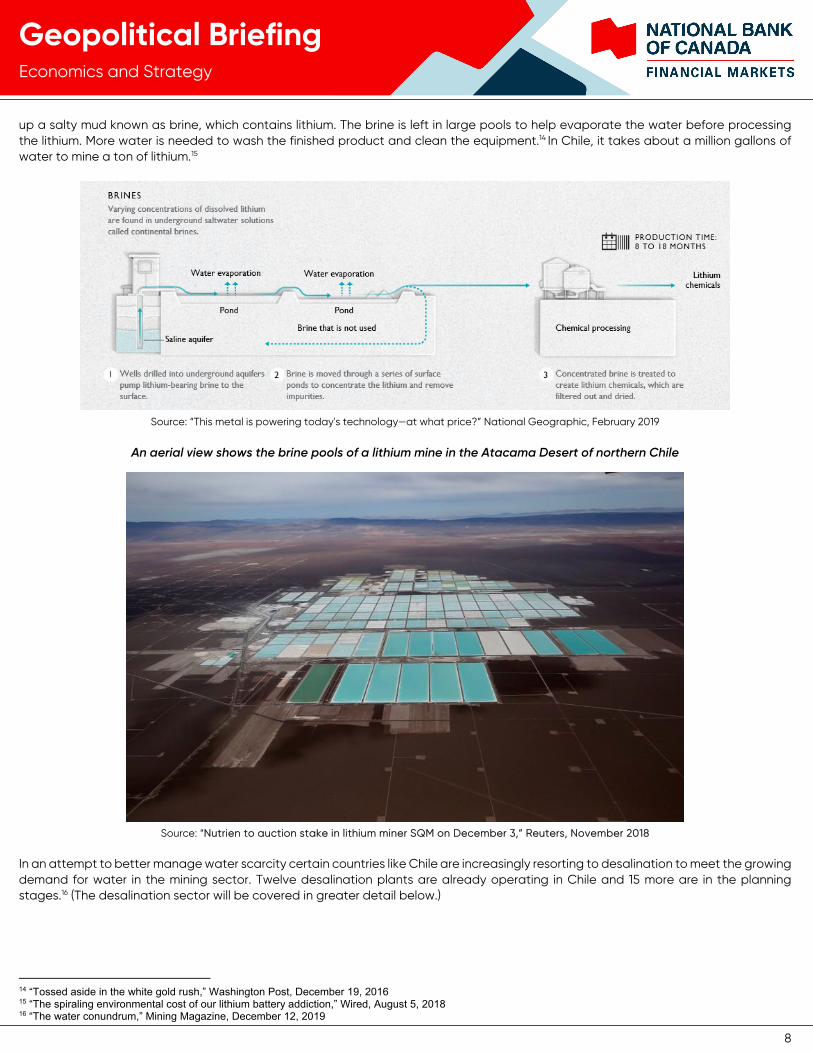
up a salty mud known as brine, which contains lithium. The brine is left in large pools to help evaporate the water before processing the lithium. More water is needed to wash the finished product and clean the equipment.14 In Chile, it takes about a million gallons of water to mine a ton of lithium.15
Source: “This metal is powering today's technology—at what price?” National Geographic, February 2019
An aerial view shows the brine pools of a lithium mine in the Atacama Desert of northern Chile
Source: “Nutrien to auction stake in lithium miner SQM on December 3,” Reuters, November 2018
In an attempt to better manage water scarcity certain countries like Chile are increasingly resorting to desalination to meet the growing demand for water in the mining sector. Twelve desalination plants are already operating in Chile and 15 more are in the planning stages.16 (The desalination sector will be covered in greater detail below.)
14 “Tossed aside in the white gold rush,” Washington Post, December 19, 2016 15 “The spiraling environmental cost of our lithium battery addiction,” Wired, August 5, 2018 16 “The water conundrum,” Mining Magazine, December 12, 2019
9
Economics and Strategy
Geopolitical Briefing
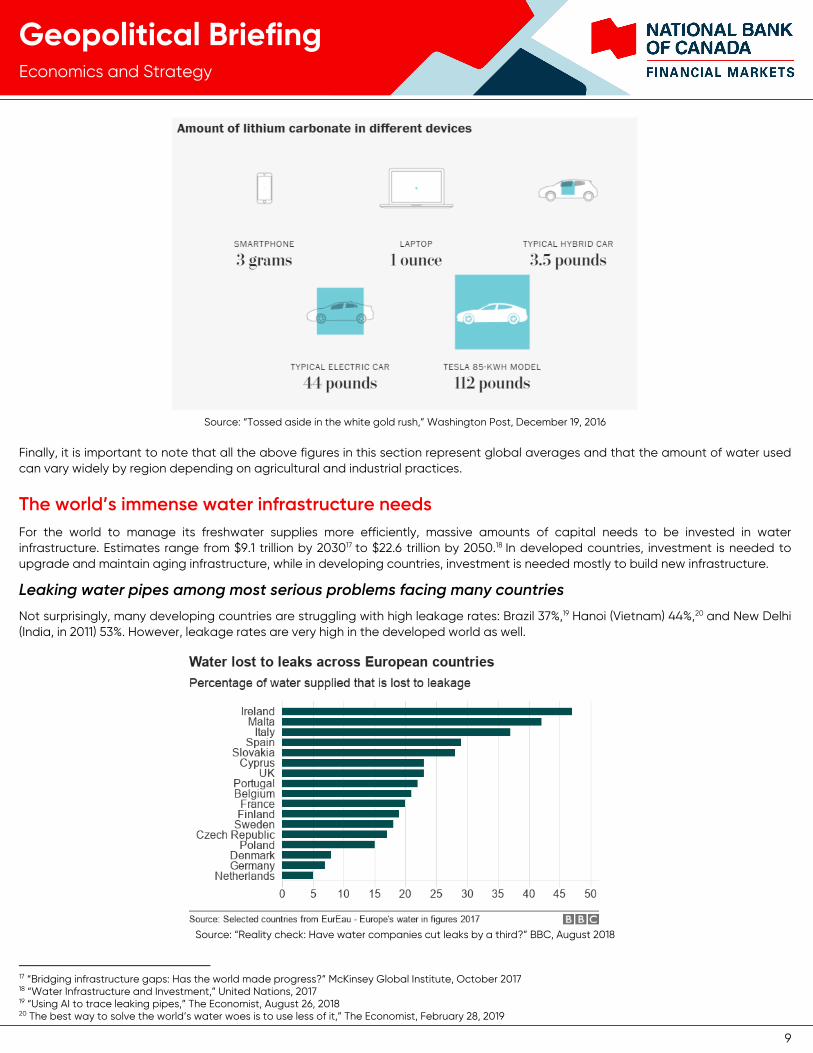
Source: “Tossed aside in the white gold rush,” Washington Post, December 19, 2016
Finally, it is important to note that all the above figures in this section represent global averages and that the amount of water used can vary widely by region depending on agricultural and industrial practices.
The world’s immense water infrastructure needs For the world to manage its freshwater supplies more efficiently, massive amounts of capital needs to be invested in water infrastructure. Estimates range from $9.1 trillion by 203017 to $22.6 trillion by 2050.18 In developed countries, investment is needed to upgrade and maintain aging infrastructure, while in developing countries, investment is needed mostly to build new infrastructure.
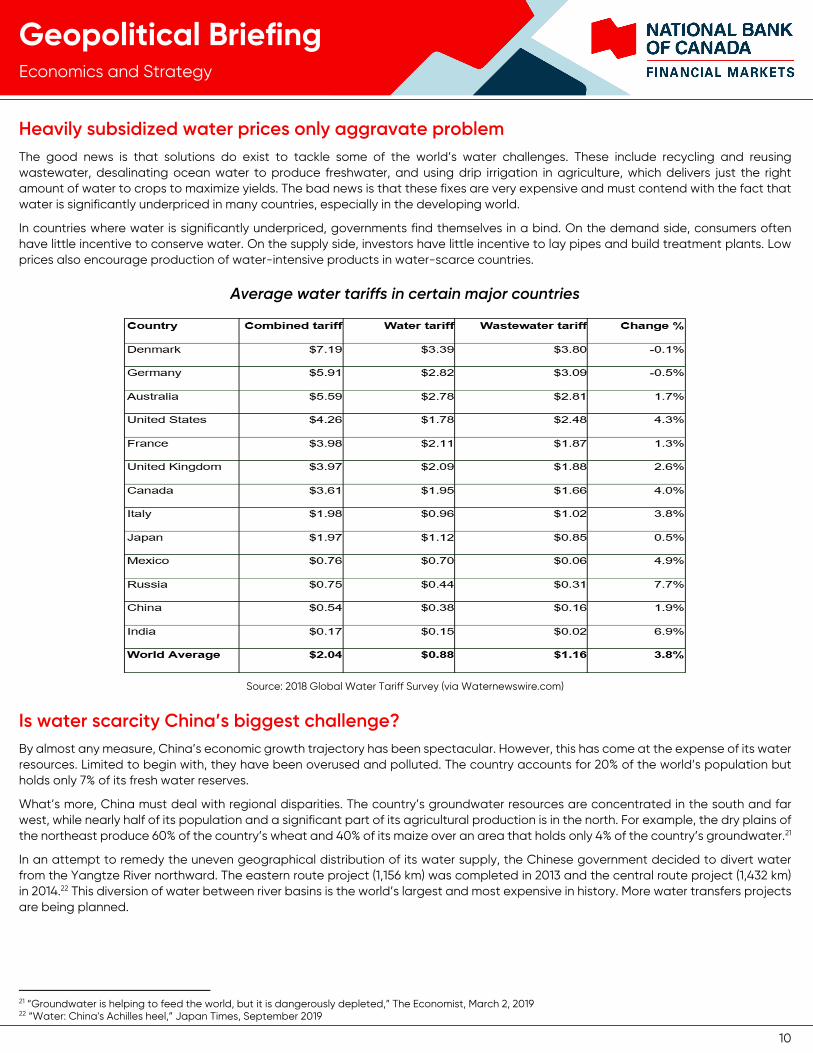
Leaking water pipes among most serious problems facing many countries
Not surprisingly, many developing countries are struggling with high leakage rates: Brazil 37%,19 Hanoi (Vietnam) 44%,20 and New Delhi (India, in 2011) 53%. However, leakage rates are very high in the developed world as well.
Source: “Reality check: Have water companies cut leaks by a third?” BBC, August 2018
17 “Bridging infrastructure gaps: Has the world made progress?” McKinsey Global Institute, October 2017 18 “Water Infrastructure and Investment,” United Nations, 2017 19 “Using AI to trace leaking pipes,” The Economist, August 26, 2018 20 The best way to solve the world’s water woes is to use less of it,” The Economist, February 28, 2019
10
Economics and Strategy
Geopolitical Briefing
Heavily subsidized water prices only aggravate problem The good news is that solutions do exist to tackle some of the world’s water challenges. These include recycling and reusing wastewater, desalinating ocean water to produce freshwater, and using drip irrigation in agriculture, which delivers just the right amount of water to crops to maximize yields. The bad news is that these fixes are very expensive and must contend with the fact that water is significantly underpriced in many countries, especially in the developing world.
In countries where water is significantly underpriced, governments find themselves in a bind. On the demand side, consumers often have little incentive to conserve water. On the supply side, investors have little incentive to lay pipes and build treatment plants. Low prices also encourage production of water-intensive products in water-scarce countries.
Average water tariffs in certain major countries
Source: 2018 Global Water Tariff Survey (via Waternewswire.com)
Is water scarcity China’s biggest challenge? By almost any measure, China’s economic growth trajectory has been spectacular. However, this has come at the expense of its water resources. Limited to begin with, they have been overused and polluted. The country accounts for 20% of the world’s population but holds only 7% of its fresh water reserves.
What’s more, China must deal with regional disparities. The country’s groundwater resources are concentrated in the south and far west, while nearly half of its population and a significant part of its agricultural production is in the north. For example, the dry plains of the northeast produce 60% of the country’s wheat and 40% of its maize over an area that holds only 4% of the country’s groundwater.21
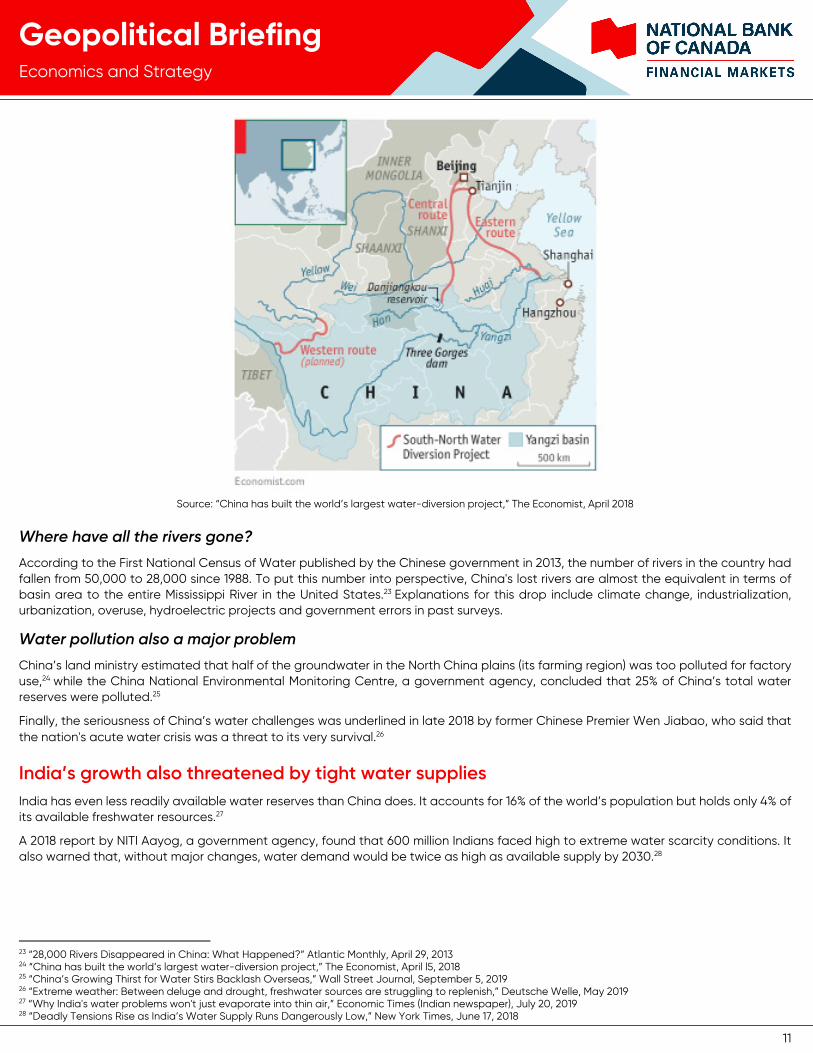
In an attempt to remedy the uneven geographical distribution of its water supply, the Chinese government decided to divert water from the Yangtze River northward. The eastern route project (1,156 km) was completed in 2013 and the central route project (1,432 km) in 2014.22 This diversion of water between river basins is the world’s largest and most expensive in history. More water transfers projects are being planned.
21 “Groundwater is helping to feed the world, but it is dangerously depleted,” The Economist, March 2, 2019 22 “Water: China's Achilles heel,” Japan Times, September 2019
11
Economics and Strategy
Geopolitical Briefing
Source: “China has built the world’s largest water-diversion project,” The Economist, April 2018
Where have all the rivers gone?
According to the First National Census of Water published by the Chinese government in 2013, the number of rivers in the country had fallen from 50,000 to 28,000 since 1988. To put this number into perspective, China's lost rivers are almost the equivalent in terms of basin area to the entire Mississippi River in the United States.23 Explanations for this drop include climate change, industrialization, urbanization, overuse, hydroelectric projects and government errors in past surveys.
Water pollution also a major problem
China’s land ministry estimated that half of the groundwater in the North China plains (its farming region) was too polluted for factory use,24 while the China National Environmental Monitoring Centre, a government agency, concluded that 25% of China’s total water reserves were polluted.25
Finally, the seriousness of China’s water challenges was underlined in late 2018 by former Chinese Premier Wen Jiabao, who said that the nation's acute water crisis was a threat to its very survival.26
India’s growth also threatened by tight water supplies India has even less readily available water reserves than China does. It accounts for 16% of the world’s population but holds only 4% of its available freshwater resources.27
A 2018 report by NITI Aayog, a government agency, found that 600 million Indians faced high to extreme water scarcity conditions. It also warned that, without major changes, water demand would be twice as high as available supply by 2030.28
23 “28,000 Rivers Disappeared in China: What Happened?” Atlantic Monthly, April 29, 2013 24 “China has built the world’s largest water-diversion project,” The Economist, April l5, 2018 25 “China’s Growing Thirst for Water Stirs Backlash Overseas,” Wall Street Journal, September 5, 2019 26 “Extreme weather: Between deluge and drought, freshwater sources are struggling to replenish,” Deutsche Welle, May 2019 27 “Why India's water problems won't just evaporate into thin air,” Economic Times (Indian newspaper), July 20, 2019 28 “Deadly Tensions Rise as India’s Water Supply Runs Dangerously Low,” New York Times, June 17, 2018
12
Economics and Strategy
Geopolitical Briefing
Groundwater, which provides 40% of the country's water supply, is under particular strain. A recent report by India’s Central Ground Water Board found the over 20% of India’s assessed groundwater units in 2017 (1,499 out of 6,881) were considered to be either overexploited (1,1186) or in critical condition (313).29
India’s water infrastructure problem
Unplanned urbanization is another problem. For starters, over 60% of the sewage generated by urban India is untreated.30 Urbanization has also resulted in nearby lakes and marshlands being covered over with concrete or clogged with sewage. To cite but two examples, the Indian cities of Mumbai and Bangalore have lost over 25% and 79% of their local water sources, respectively.31 Paving over these lakes and marshlands also eliminated natural basins that in the past stored rainwater for future use.
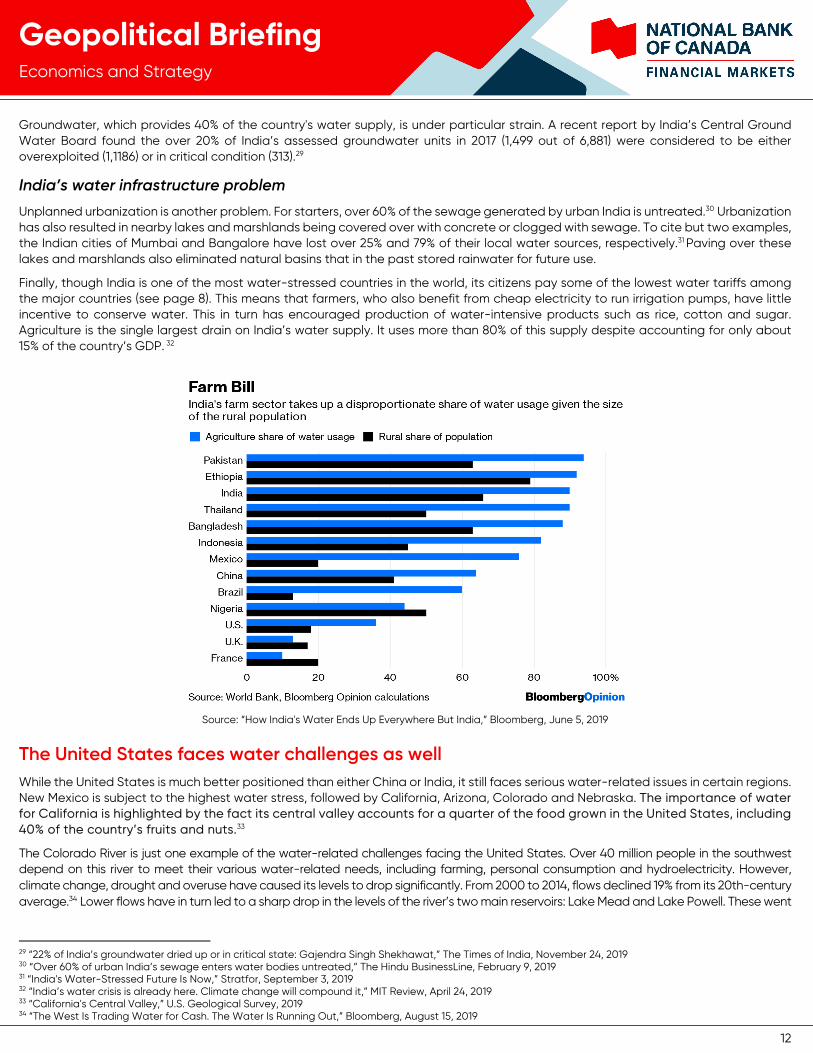
Finally, though India is one of the most water-stressed countries in the world, its citizens pay some of the lowest water tariffs among the major countries (see page 8). This means that farmers, who also benefit from cheap electricity to run irrigation pumps, have little incentive to conserve water. This in turn has encouraged production of water-intensive products such as rice, cotton and sugar. Agriculture is the single largest drain on India’s water supply. It uses more than 80% of this supply despite accounting for only about 15% of the country’s GDP. 32
Source: “How India's Water Ends Up Everywhere But India,” Bloomberg, June 5, 2019
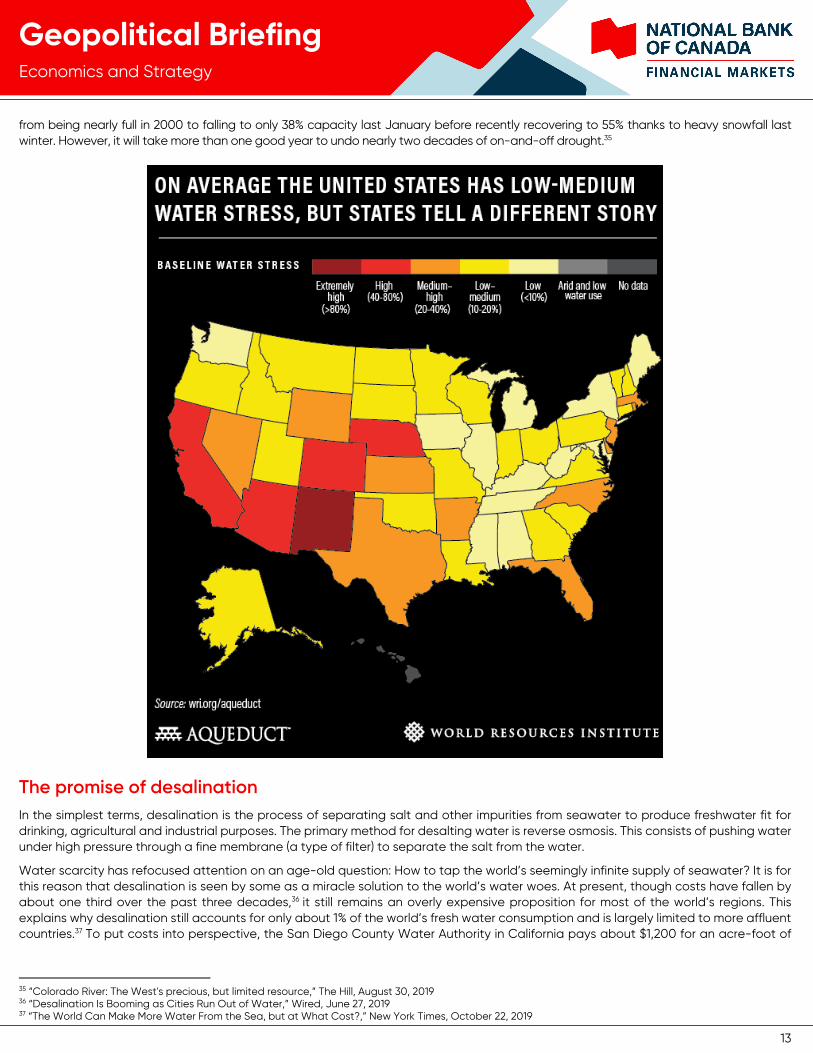
The United States faces water challenges as well While the United States is much better positioned than either China or India, it still faces serious water-related issues in certain regions. New Mexico is subject to the highest water stress, followed by California, Arizona, Colorado and Nebraska. The importance of water for California is highlighted by the fact its central valley accounts for a quarter of the food grown in the United States, including 40% of the country’s fruits and nuts.33
The Colorado River is just one example of the water-related challenges facing the United States. Over 40 million people in the southwest depend on this river to meet their various water-related needs, including farming, personal consumption and hydroelectricity. However, climate change, drought and overuse have caused its levels to drop significantly. From 2000 to 2014, flows declined 19% from its 20th-century average.34 Lower flows have in turn led to a sharp drop in the levels of the river’s two main reservoirs: Lake Mead and Lake Powell. These went
29 “22% of India’s groundwater dried up or in critical state: Gajendra Singh Shekhawat,” The Times of India, November 24, 2019 30 “Over 60% of urban India’s sewage enters water bodies untreated,” The Hindu BusinessLine, February 9, 2019 31 “India's Water-Stressed Future Is Now,” Stratfor, September 3, 2019 32 “India’s water crisis is already here. Climate change will compound it,” MIT Review, April 24, 2019 33 “California's Central Valley,” U.S. Geological Survey, 2019 34 “The West Is Trading Water for Cash. The Water Is Running Out,” Bloomberg, August 15, 2019
13
Economics and Strategy
Geopolitical Briefing
from being nearly full in 2000 to falling to only 38% capacity last January before recently recovering to 55% thanks to heavy snowfall last winter. However, it will take more than one good year to undo nearly two decades of on-and-off drought.35
The promise of desalination In the simplest terms, desalination is the process of separating salt and other impurities from seawater to produce freshwater fit for drinking, agricultural and industrial purposes. The primary method for desalting water is reverse osmosis. This consists of pushing water under high pressure through a fine membrane (a type of filter) to separate the salt from the water.
Water scarcity has refocused attention on an age-old question: How to tap the world’s seemingly infinite supply of seawater? It is for this reason that desalination is seen by some as a miracle solution to the world’s water woes. At present, though costs have fallen by about one third over the past three decades,36 it still remains an overly expensive proposition for most of the world’s regions. This explains why desalination still accounts for only about 1% of the world’s fresh water consumption and is largely limited to more affluent countries.37 To put costs into perspective, the San Diego County Water Authority in California pays about $1,200 for an acre-foot of
35 “Colorado River: The West's precious, but limited resource,” The Hill, August 30, 2019 36 “Desalination Is Booming as Cities Run Out of Water,” Wired, June 27, 2019 37 “The World Can Make More Water From the Sea, but at What Cost?,” New York Times, October 22, 2019
14
Economics and Strategy
Geopolitical Briefing
water from the Colorado River. The same amount of water from a nearby desalination facility (Carlsbad plant) costs about $2,200.38 There are potential environmental impacts as well. It takes two gallons of sea water to produce a gallon of fresh water. What is left behind is a gallon of extremely salty water. If this brine is returned to the ocean improperly, it could deplete the ocean of oxygen and negatively impact sea life.39
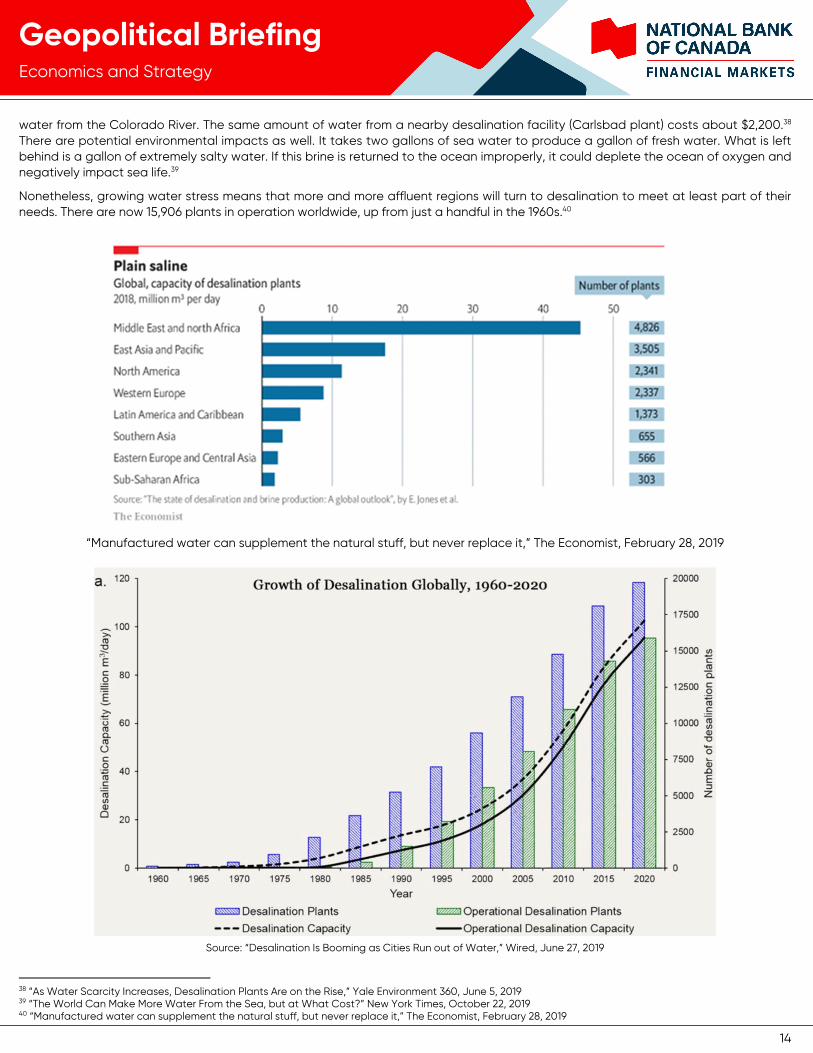
Nonetheless, growing water stress means that more and more affluent regions will turn to desalination to meet at least part of their needs. There are now 15,906 plants in operation worldwide, up from just a handful in the 1960s.40
“Manufactured water can supplement the natural stuff, but never replace it,” The Economist, February 28, 2019
Source: “Desalination Is Booming as Cities Run out of Water,” Wired, June 27, 2019
38 “As Water Scarcity Increases, Desalination Plants Are on the Rise,” Yale Environment 360, June 5, 2019 39 “The World Can Make More Water From the Sea, but at What Cost?” New York Times, October 22, 2019 40 “Manufactured water can supplement the natural stuff, but never replace it,” The Economist, February 28, 2019
15
Economics and Strategy
Geopolitical Briefing
Investment conclusion The driving force behind growing water scarcity is a more populous and wealthier world population. The agricultural sector needs more water to meet the growing demand for food. Industries require large amounts of water to maintain and increase production. Inefficient water infrastructure, water pollution, climate change and low water tariffs (which encourages consumption) only adds to the challenges.
This situation is further complicated by the fact the world’s accessible freshwater reserves are unevenly divided among countries. Many developing countries in particular have relatively limited water supplies (see page 2 for relevant chart). For example, China and India account for about 36% of the world’s population but hold only about 11% of its readily available freshwater resources. The combined impact of all these factors is that certain regions are consuming their accessible freshwater resources faster than the water cycle’s natural replenishment rate.
Growing water scarcity will eventually force many countries, particularly in the developing world, to confront the unpleasant reality that their water reserves are nowhere near sufficient to attain many of their long-term economic objectives. This among other things will force countries such as India and China to choose between focusing more on industry or agriculture.
In the case of India, to achieve its long-term goal of having manufacturing account for 25% of its GDP from just over 15% today, it would have to divert massive amounts of water to industry from other sectors.41 India’s aim of expanding its manufacturing footprint includes attracting more water-intensive smartphone manufacturing operations. In October 2018, the Indian Cellular and Electronics Association reported that more than 120 new smartphone manufacturing units had been created in the past four years.42 In addition to water scarcity, these countries must struggle between using land for either agriculture or industrial purposes. For example, China accounts for nearly one fifth of the world’s population but only one tenth of its farmland.43
Corporations with major operations in water-stressed countries also risk seeing their water usage increasingly scrutinized by local governments. After all, it is politically easier to impose a sharp price increases, or even restrict supplies, to foreign companies than to do the same to their own citizens and local companies.
Finally, growing water stress will make relatively water-rich countries seem increasingly attractive as investment locations to companies involved in water-intensive sectors. Adequate water reserves will become as important as labour costs, electricity prices, taxes and transportation infrastructure to companies scouring the planet for suitable investment locations.
Bottom-Line: Environmental risks considered in ESG investment decision-making have overwhelmingly been focused on greenhouse gas emissions. In our opinion, investors may soon widen their scope to include activities that risk placing further stress on already limited freshwater supplies in certain regions of the world.
41 World Bank, 2017 42 “Smartphones emerge as bright spot for Indian manufacturing,” Reuters, October 2018 43 “How China Plans to Feed 1.4 Billion Growing Appetites,” National Geographic, February 2018
Economics and Strategy
Geopolitical Briefing
Economics and Strategy
Montreal Office Toronto Office 514-879-2529 416-869-8598
Stéfane Marion Matthieu Arseneau Warren Lovely Chief Economist and Strategist Deputy Chief Economist Chief Rate Strategist, Economics and Strategy [email protected] [email protected] [email protected]
Krishen Rangasamy Paul-André Pinsonnault Marc Pinsonneault Taylor Schleich Senior Economist Senior Fixed Income Economist Senior Economist Associate, Rates Strategist, Economics and Strategy [email protected] [email protected] [email protected] [email protected]
Kyle Dahms Jocelyn Paquet Angelo Katsoras Economist Economist Geopolitical Analyst [email protected] [email protected] [email protected]
General
This Report was prepared by National Bank Financial, Inc. (NBF), (a Canadian investment dealer, member of IIROC), an indirect wholly owned subsidiary of National Bank of Canada. National Bank of Canada is a public company listed on the Toronto Stock Exchange.
The particulars contained herein were obtained from sources which we believe to be reliable but are not guaranteed by us and may be incomplete and may be subject to change without notice. The information is current as of the date of this document. Neither the author nor NBF assumes any obligation to update the information or advise on further developments relating to the topics or securities discussed. The opinions expressed are based upon the author(s) analysis and interpretation of these particulars and are not to be construed as a solicitation or offer to buy or sell the securities mentioned herein, and nothing in this Report constitutes a representation that any investment strategy or recommendation contained herein is suitable or appropriate to a recipient’s individual circumstances. In all cases, investors should conduct their own investigation and analysis of such information before taking or omitting to take any action in relation to securities or markets that are analyzed in this Report. The Report alone is not intended to form the basis for an investment decision, or to replace any due diligence or analytical work required by you in making an investment decision.
This Report is for distribution only under such circumstances as may be permitted by applicable law. This Report is not directed at you if NBF or any affiliate distributing this Report is prohibited or restricted by any legislation or regulation in any jurisdiction from making it available to you. You should satisfy yourself before reading it that NBF is permitted to provide this Report to you under relevant legislation and regulations.
National Bank of Canada Financial Markets is a trade name used by National Bank Financial and National Bank of Canada Financial Inc.
Canadian Residents
NBF or its affiliates may engage in any trading strategies described herein for their own account or on a discretionary basis on behalf of certain clients and as market conditions change, may amend or change investment strategy including full and complete divestment. The trading interests of NBF and its affiliates may also be contrary to any opinions expressed in this Report.
NBF or its affiliates often act as financial advisor, agent or underwriter for certain issuers mentioned herein and may receive remuneration for its services. As well NBF and its affiliates and/or their officers, directors, representatives, associates, may have a position in the securities mentioned herein and may make purchases and/or sales of these securities from time to time in the open market or otherwise. NBF and its affiliates may make a market in securities mentioned in this Report. This Report may not be independent of the proprietary interests of NBF and its affiliates.
This Report is not considered a research product under Canadian law and regulation, and consequently is not governed by Canadian rules applicable to the publication and distribution of research Reports, including relevant restrictions or disclosures required to be included in research Reports.
Economics and Strategy
Geopolitical Briefing
UK Residents
This Report is a marketing document. This Report has not been prepared in accordance with EU legal requirements designed to promote the independence of investment research and it is not subject to any prohibition on dealing ahead of the dissemination of investment research. In respect of the distribution of this Report to UK residents, NBF has approved the contents (including, where necessary, for the purposes of Section 21(1) of the Financial Services and Markets Act 2000). This Report is for information purposes only and does not constitute a personal recommendation, or investment, legal or tax advice. NBF and/or its parent and/or any companies within or affiliates of the National Bank of Canada group and/or any of their directors, officers and employees may have or may have had interests or long or short positions in, and may at any time make purchases and/or sales as principal or agent, or may act or may have acted as market maker in the relevant investments or related investments discussed in this Report, or may act or have acted as investment and/or commercial banker with respect hereto. The value of investments, and the income derived from them, can go down as well as up and you may not get back the amount invested. Past performance is not a guide to future performance. If an investment is denominated in a foreign currency, rates of exchange may have an adverse effect on the value of the investment. Investments which are illiquid may be difficult to sell or realise; it may also be difficult to obtain reliable information about their value or the extent of the risks to which they are exposed. Certain transactions, including those involving futures, swaps, and other derivatives, give rise to substantial risk and are not suitable for all investors. The investments contained in this Report are not available to retail customers and this Report is not for distribution to retail clients (within the meaning of the rules of the Financial Conduct Authority). Persons who are retail clients should not act or rely upon the information in this Report. This Report does not constitute or form part of any offer for sale or subscription of or solicitation of any offer to buy or subscribe for the securities described herein nor shall it or any part of it form the basis of or be relied on in connection with any contract or commitment whatsoever.
This information is only for distribution to Eligible Counterparties and Professional Clients in the United Kingdom within the meaning of the rules of the Financial Conduct Authority. NBF is authorised and regulated by the Financial Conduct Authority and has its registered office at 71 Fenchurch Street, London, EC3M 4HD.
NBF is not authorised by the Prudential Regulation Authority and the Financial Conduct Authority to accept deposits in the United Kingdom.
U.S. Residents
With respect to the distribution of this report in the United States of America, National Bank of Canada Financial Inc. (“NBCFI”) which is regulated by the Financial Industry Regulatory Authority (FINRA) and a member of the Securities Investor Protection Corporation (SIPC), an affiliate of NBF, accepts responsibility for its contents, subject to any terms set out above. To make further inquiry related to this report, or to effect any transaction, United States residents should contact their NBCFI registered representative.
This report is not a research report and is intended for Major U.S. Institutional Investors only.
This report is not subject to U.S. independence and disclosure standards applicable to research reports.
HK Residents
With respect to the distribution of this report in Hong Kong by NBC Financial Markets Asia Limited (“NBCFMA”)which is licensed by the Securities and Futures Commission (“SFC”) to conduct Type 1 (dealing in securities) and Type 3 (leveraged foreign exchange trading) regulated activities, the contents of this report are solely for informational purposes. It has not been approved by, reviewed by, verified by or filed with any regulator in Hong Kong. Nothing herein is a recommendation, advice, offer or solicitation to buy or sell a product or service, nor an official confirmation of any transaction. None of the products issuers, NBCFMA or its affiliates or other persons or entities named herein are obliged to notify you of changes to any information and none of the foregoing assume any loss suffered by you in reliance of such information.
The content of this report may contain information about investment products which are not authorized by SFC for offering to the public in Hong Kong and such information will only be available to, those persons who are Professional Investors (as defined in the Securities and Futures Ordinance of Hong Kong (“SFO”)). If you are in any doubt as to your status you should consult a financial adviser or contact us. This material is not meant to be marketing materials and is not intended for public distribution. Please note that neither this material nor the product referred to is authorized for sale by SFC. Please refer to product prospectus for full details.
There may be conflicts of interest relating to NBCFMA or its affiliates’ businesses. These activities and interests include potential multiple advisory, transactional and financial and other interests in securities and instruments that may be purchased or sold by NBCFMA or its affiliates, or in other investment vehicles which are managed by NBCFMA or its affiliates that may purchase or sell such securities and instruments.
No other entity within the National Bank of Canada group, including National Bank of Canada and National Bank Financial Inc, is licensed or registered with the SFC. Accordingly, such entities and their employees are not permitted and do not intend to: (i) carry on a business in any regulated activity in Hong Kong; (ii) hold themselves out as carrying on a business in any regulated activity in Hong Kong; or (iii) actively market their services to the Hong Kong public.
Copyright
This Report may not be reproduced in whole or in part, or further distributed or published or referred to in any manner whatsoever, nor may the information, opinions or conclusions contained in it be referred to without in each case the prior express written consent of NBF.