the world is flat. - the ucla anderson forecast
TRANSCRIPT

1
A Flat World, A Level Playing Field, a Small World After All, or None of the Above?
Review of Thomas L Friedman, The World is Flat.
Edward E. Leamer+
April 16, 2006
Prologue When the Journal of Economic Literature asked me to write a review of The World is Flat, by Thomas Friedman, I responded with enthusiasm, knowing it wouldn’t take much effort on my part. As soon as I received a copy of the book, I shipped it overnight by UPS to India to have the work done. I was promised a one-day turn-around for a fee of $100. Here is what I received by e-mail the next day: “This book is truly marvelous. It will surely change the course of human history.” That struck me as possibly accurate but a bit too short and too generic to make the JEL happy, and I decided, with great disappointment, to do the work myself.
What Might that “Flat World” Metaphor Mean? Stumbling onto a book titled “The World is Flat” by Thomas Friedman would leave a book browser puzzled about its likely content. My first guess would be epistemology and evolution. “The World is Flat” must be a reference to the pre-Columbian sailor’s worry about falling off the edge of the earth, and the tenacious clinging to that idea by members of the Flat-Earth Society in the face of “overwhelming” “scientific” evidence. Put that into the current context, the debate about the intellectual legitimacy of “intelligent design”, and you are led to my conclusion: “The World is Flat” is probably a book about faith-based decision-making and the teaching of intelligent design in the schools. This book is going to surprise. It will show that a flat earth is not a straw man at all, and that science is only another kind of religion, seeking to burn its heretics at the stake with all the vigor of traditional religion. Alas, the subtitle “A Brief History of the Twenty-first Century” unsettles this brief flight of fancy about the content of this book, but it leaves the browser utterly confused. How could “The World is Flat” and “A Brief History of the Twenty-first Century” have anything to do with each other? That subtitle reminds me of the New Yorker cartoon that hung outside a history professor’s office at UCLA for many years. It depicted a
+ Anderson Graduate School of Management, Department of Economics and Department of Statistics, UCLA. Thanks for comments from my brother, Laurence Leamer, my UCLA colleagues at the Political Economy lunch (Dan Treisman and Michael Ross), Eric Rasumusen, John Talbot and my former students, Christopher Thornberg, Peter Schott and Bernardo Blum, and to Frank Levy who offered extensive comments and several important suggestions.

2
student receiving a final exam in a history course: “Explain World War II. Use both sides of the page if necessary.” Enough with all these diverting thoughts. It’s time to look at the blurb. The blurb points in a wholly different direction: “ … the convergence of technology and events that allowed India, China, and so many other countries to become part of the global supply chain for services and manufacturing, creating an explosion of wealth in the middle classes of the world’s two biggest nations and giving them a huge new stake in the success of globalization? And with this “flattening” of the globe, which requires us to run faster in order to stay in place, has the world gotten too small and too fast for human beings and their political systems to adjust in a stable manner?” Huh? That last sentence packs in at least two too many metaphors for me to process: a flat earth, people running faster but staying in place, a small world and a fast world. And then there is the “explosion” in the previous sentence. What is Friedman getting at with this mélange of metaphors? I understand that China has increased it exports of manufactures to levels far above anyone’s expectations. I understand that call centers and some back-office functions and some software coding have moved to India. I understand that GDP growth in both China and India has been phenomenal and has lifted hundreds of millions out of poverty. But what is the meaning of that flattening metaphor? What is the alternative to a flat world? A smooth sphere? Bumps? That’s a puzzle worth solving.
Friedman’s “Aha” flat moment
Friedman’s “aha” flat moment came on a golfing outing during a Discovery Channel excursion to Bangalore, India where, surrounded by buildings emblazoned with US tech names, he was told to “Aim at either Microsoft or IBM.” (p. 3). Friedman recounts that Columbus, sailing in search of India apparently on the premise that the Earth is round, encountered exotic native Americans unlike the Europeans with which he was familiar and pronounced them Indians, allowing Columbus to carry the news back to King Ferdinand and Queen Isabella: the Earth is round. Likening his Discovery Channel crew to the sailors on the Nina and the Pinta and the Santa Maria, when Friedman found in Bangalore not Indians but Americans in name and speech and business practices, he “shared my discovery only with my wife, and only in a whisper. ‘Honey.’ I confided, ‘I think the world is flat.” Once “flat” was in Friedman’s head, he couldn’t seem to get it out. When on that same trip to Bangalore, Friedman was told by Nandan Nilekani, CEO of Infosys Technologies Limited, “Tom, the playing field is being leveled.” Friedman concludes “What Nandan is saying , I thought, is that the playing field is being flattened… flattened? Flattened? My God, he’s telling me the world is flat!” p.7 Flattened? I still don’t get it. To digress briefly into the use of metaphors in economics I routinely ask my Ph.D. classes in international economics what they think I mean when I tell them “Joe’s elevator doesn’t stop on all floors.” The foreign students (of which there

3
are many) whose native language is not English imagine literally an elevator in Joe’s building that isn’t working right. American students (of which there are only one or two) suspect that what I mean is “Joe isn’t playing with a full deck.” What I want these students to understand is that models in economics are highly metaphorical and if students cannot tell the difference between the literal mathematical properties of models versus the subtle messages of the models, they are not understanding the language. Decoding metaphors is the hardest part of learning a new language. When we emphasize only the grammar and the syntax in our economics courses, we leave little room for the kind of experience with the language that allows students to learn to converse in Economics, and we graduate students who can parse an Economics sentence but cannot carry on an Economics conversation. That is my way of saying that our language really matters, and metaphors need to be chosen carefully. I am open to a good new metaphor (economic model), but a metaphor isn’t going to work for me unless I can figure out what message is intended. I know what a “small world” means. I have some ideas what a “level playing field” may mean. But a “Flat World” for me is an elusive idea. Worth learning about.1
Economic Models of Flat Competition
Flatness is Familiar in Economic Geography
Flatness is not a new concept in economics: There are Von Thünen ringed cities in the centers of flat planes of agricultural land and Lösch hexagons that divide a flat plane of demand into identical service areas with a supply point in the middle of each. And there are Hotelling competitors that cluster inefficiently together in the center of a straight-line segment along which customers are distributed uniformly (a flat distribution). There is one important message in these models of economic geography. Best to reflect on it before we let our brains and spirits be flattened by Friedman’s metaphor. The message is that geography, flat or otherwise, limits competition and creates long-term relationships between buyer and seller. The German farmer Johann H. Von Thünen noticed that farmland closer to the towns where the produce was sold commanded a premium price, and he is credited with being the father of economic geography because in 1826 he postulated a featureless (flat) plane of land with a town in the center. Crops shipped from farm to town had different ratios of transportation cost to value. Fertilizers and farm implements were shipped the other way. These assumptions create a sequence of “Von Thünen” concentric rings of farmland around the town center, with the land rents highest near the center, with “heavy” crops that need fertilizers produced close to market. (A modern version of this idea is the micro-economic exam question: “Why does the State of Washington ship its best apples to other states, not its worst?”)
1 Bhagwati (2005) also has troubles with the Flat World metaphor and combats it with another: "kaleidoscopic comparative advantage.” Sorry, Professor, that one lacks the necessary punch to do much damage to its competitor.

4
Von Thünen’s theory of concentric rings presumes the existence of towns, but where do these towns come from? These might be market towns where farmers exchange one crop for another. They might be industrial centers. On this question Weber(1929) postulates a mathematical programming problem of industrial location in which materials can be found at discrete supply points on a featureless (flat) plane and manufacturing must procure these resources and ship finished products to prespecified locations of demand. Should the processing be done where the materials can be found, or where the product is sold? It depends on whether processing adds weight or reduces weight. Next comes Lösch (1938 and 1944) who postulates another mathematical programming problem with demand uniformly spread on an infinite plane. The problem is to locate supply points in this plane to minimize the total distance traveled from customers to supply points. The most efficient shape that minimizes the average distance between customers and supply point is a circle with the supply point in the center. But circles cannot be a solution to Lösch’s problem because they cannot tile a plane. Of the three regular shapes that can tile a plane - equilateral triangles, squares and hexagons – it is hexagons that come closest to circles. Thus Lösch’s infinite featureless (flat) plane of demand is cut most efficiently into equal-sized hexagons with a supply point located at the center of each. 2 While Von Thünen describes an economic equilibrium, Weber and Lösch describe only a mathematical optimization problem that may or may not be approximated by firms seeking locations that maximize profits. Probably not, since these socially optimal solutions leave firms in advantaged positions relative to their closest customers who would have to travel far to find another supplier. That market power is sure to be exploited with monopoly pricing, which in turn is sure to be contested by location and/or pricing decisions of other firms. Where might competitive firms locate in a flat world? An economic equilibrium model of competition on a flat line segment (call it a beach) has been offered by Harold Hotelling(1929) who argues that competition will induce both sellers (hot dog stands) to crowd together at the center, producing an inefficient outcome. The Hotelling model is routinely applied to competition between two political parties, each positioning itself close to the median voter.3
2I actually wrote my first published paper (my Senior Thesis at Princeton) on the Lösch problem but with demand limited geographically to squares and circles rather than infinite planes: "Location Equilibria," Journal of Regional Science, Vol, 8 (No. 2, 1968), 229-242 3 The traditional models of international comparative advantage also embody some geographical features, but very strange ones. In the traditional Heckscher-Ohlin model, with machines and labor as the inputs, countries are assumed to be close enough that the exchange of goods internationally is costless, but so far apart that neither workers nor contracts can find their way from one country to another. (If contracts could be formed across borders, current account deficits would allow for capital accumulation in one country to be financed by another, making the assumption of fixed capital stocks untenable.) Further, inside the countries, industries are so close geographically and technologically, that workers and machines can move without cost from one job to the next. Beginning with Krugman(1991) international economists have been working hard to introduce some more meaningful geography into their models, sometimes with more success than other times. Krugman postulates two points at which production can occur. “Peasants” who do the farming are tied to the land at each of these points, but “workers” who do the manufacturing can choose either location. Transportation costs are of the “iceberg” type – part of the product melts away en

5
The Message of Models of Competition in Flat Planes: Relationships not markets
From these references we should receive an important message that needs to be absorbed as we try to decode Friedman’s flat-world metaphor. Geography, whether physical or cultural or informational, limits competition since it creates cost-advantaged relationships between sellers and buyers who are located “close” to one another. The key word is relationships, with italics added to emphasize that this is the core property that drives my disagreements with Friedman. Flatness doesn’t create a relationship-free equilibrium; it merely changes the geography of relationships. It turns irregular hard-to-define geographic regions of customers committed to the same supplier into regular hexagons with the suppliers at the centers. Flat featureless planes of competition are the preferred spaces for the mathematical modeling of geographical competition, not because flatness closely resembles nature but only because modeling of competition in real geographies with rivers and oceans and hills and mountains is beyond the reach of algebra. The point of this modeling is not to show what flatness implies. The point is to show what transportation costs imply. The what- if question that these economic geographers ask is not : “What if the world were flat instead of spherical or bumpy?” Their what- if question is: “What if transportation costs were low instead of high? What do declines in transportation costs do to the intensity of competition and the geography of prosperity?” What if the world were small? The answer is clear: the smaller the world, the more contested are the exchanges, and the weaker are the relationships between buyers and sellers. In a small world, wages in Los Angeles are set in Shanghai.
Some Real Questions for Economic Geography to Explore
There are countless real “globalization” questions for economic geography to answer. For example: What if Europe were to form an economic union that allowed the four freedoms among countries: free movement of goods, people, services and capital, all supported by a common currency? Which kinds of activities would concentrate and which would disperse? Do the peripheral countries, like Sweden, benefit or lose out? What happens to a central country, like Switzerland, that doesn’t join? On another continent: Can the economic liberalizations in South America create an export- led prosperity, or are Argentina and Chile and other Latin American countries too far from the large and wealthy European and North American marketplaces for that strategy to work? If closeness matters, how can one account for the historically high per capita GDPs of New Zealand and Australia, and what accounts for the economic successes of far-way countries like Taiwan and Singapore, and now China? route. With increasing returns, product differentiation and monopolistic competition in manufacturing, what might the equilibrium look like? Is the manufacturing all done in one location and manufactured products shipped one way and agricultural products the other? Or do both communities grow their own food and exchange manufactured products? Like Weber’s solution: it depends.

6
When looking for problems that can be studied by economic geography, it is wise to keep in mind that the distance effects need not come from simple transportation costs. Physical distance may create and reinforce linguistic and cultural barriers that make it difficult to exchange thoughts between people located far from each other in the cultural landscape. In that kind of world, there would be specialized cultural services (e.g. plays and newspapers and legal services) made by locals for locals. These couldn’t be shipped very far because the messages would melt away to meaninglessness if the content were shipped over great distances to unreceptive cultures. But suppose that, by an accident of history, a geographically large area with a large population adopted much the same language and much the same culture. Though large physically, this area is small culturally. Call it the United States of America. Within this country, how many “Hollywoods” do you suppose might emerge? If the agglomerative externalities (economies of scale) were moderate compared with the cultural shipping costs, hundreds of Hollywoods might be sprinkled around the US each producing specialized products suited to the local markets. But suppose the benefits from agglomeration are large and the competitive outcome allowed only one Hollywood to emerge producing one homogenous cultural product that is not customized for Southern tastes nor Eastern Tastes nor Midwestern tastes nor Western tastes. The same movies are displayed in theaters all over the country. Enter into this drama a new actor: globalization. Suppose that communications innovations drive down the “shipping costs” for cultural products to points outside the United States. Suppose English is the language of global commerce and children all over the world drink Coke and wear jeans. Then what happens? Would a Bollywood emerge and compete actively for the US market? Or would global competition allow only a single Hollywood? Does our Hollywood win or lose from this form of cultural globalization? If your instincts are the same as mine, you are thinking that Hollywood wins big time from declining cultural “transportation” costs, and many of the rest of us living in Los Angeles benefit as well. It is the local cultural providers in France and Mexico and Canada and India and China that are probably hurt from an extension of the reach of US cultural services. (As I write these sentences I am resisting the very strong desire to write ‘The World is Not Flat’ to convey my disagreement with Friedman but at the cost of using a metaphor I do not understand. Countries on the receiving end of this cultural exchange might complain about the “flatness” of a one-cultural world and at the same time object to the “non-flatness” of the competitive landscape that leaves the United States firmly in a favored position. ) Cultural products are one of many intellectual services in which the US is the global leader. Like the movie industry, the production of these intellectual services is geographically clustered inside the United States, presumably because of powerful local agglomerative externalities. Finance is done in New York City. Innovations in electronic technology occur in the Silicon Valley and Boston and Austin. Biotech is clustered in San Diego. Country music in Nashville. Mundane economics training is centered in Cambridge, Mass. Creative economics education is in Los Angeles. Now

7
imagine a cultural and telecommunications revolution that allows the reach of these clustered intellectual services to be extended, allowing financial innovations made in New York to be used in Hong Kong, and software designed in Seattle to be marketed in India. Does this help or hurt the United States? I am thinking that the US is a big winner not a loser from the extension of the market for its intellectual services, provided, of course, that the rest of the world offers intellectual property protection. Then we get a larger market but not much in the way of new competitors because of the highly localized economies of scale and the very substantial first-mover advantages that history has bestowed on the US. But the answers to all these questions are the same as the answer to Weber’s question of where to locate manufacturing: it depends. It depends on the power of the agglomeration externalities, the costs of delivery and the distribution of consumers and their preferences across space.
Another book with another title
Clearly there is a book to be written about the impacts of the dramatic decline in transportation and communication costs that we have recently experienced – cargo containerization, air shipment, telecommunications, the Internet, e-mail, voice-mail and the cell phone. The title of that book would not be “The World is Flat.” The title would be “It’s a Small World After All.” I first realized this on a trip to Disneyland in 1975. After a trip through the adventure “It’s a Small World After All” it dawned on me that, under their outfits, the puppets depicting Asians and Europeans and Americans and Pacific Islanders are all pretty much identical. Though clothing and instruments are different, Walt Disney created a Small World by having all the puppets sing the same happy song. Disney gave us the world we should be striving for – a world with a rich smorgasbord of cultures but without the frictions that cultural differences usually engender. Not one flat common culture. (I did not whisper my extraordinary discovery to my wife. She was already asleep. )
A level playing field?
A “small world” is a clear metaphor, but a “flat world” is for me an elusive new one. The most prevalent metaphor for discussing global competition is “a level playing field” which actually is not crystal clear either. A “level playing field” refers to rules of the game that “unfairly” favor one competitor over another. If the football field is level, the better team will emerge victorious, but a sloped field confers advantages to the team defending the higher goal. “Fairness” requires a level playing field, but fairness and levelness are in the heart and eye of the beholder. If you are bigger and faster and smarter than I am, just because of your genetic draw, that doesn’t seem fair to me. That’s not a level playing field. Better offer a handicap or a point spread. That would make it fair. If you want to push this to

8
the extreme, it is unfair for there to be a loser at all. Can’t we all be winners? (With grade inflation, we are doing this on campus.) The literature on the theory of international trade has many models with sloped playing fields, including ones with technological differences and with policy differences across countries. The next paragraph has a model-building exercise that I offer my students. It is appealing because it has a geographic aspect to it, because it speaks to the growing concern over the US deficit, first with Japan and now with China, and because it yields a surprising conclusion. Imagine that there are two countries – Japan and the United States. Japan sits on the top of a hill and the United States sits at the bottom. To get US goods to Japan, one has to hire porters to carry the goods up the hill. But the Japanese can put their products in a chute and let gravity do the work - costlessly transporting Japanese goods down the hill to the US market. Not a level playing field, you should be thinking. Japan is clearly in the advantageous position. Not so fast, I caution the students. Who pays for lugging the US products up the hill? Why do you presume it is the US and not the Japanese? This should get them thinking about elasticities of supply and demand. If US goods are in short supply and are desperately desired by the Japanese, while Japanese goods are abundant and not much desired by Americans, then it is the US at the bottom of the hill that is in the advantageous position and it is the Japanese who pay for the lugging of the goods up the hill. If the Japanese build their mountain artificially with trade barriers that make it difficult to ship Washington apples to Japanese consumers, and if the Japanese consumers would pay any price for those apples while Americans could care less about the latest Sony gadget, then it is the Japanese who pay for the barriers, not the Americans. So be careful when you put rocks in your harbor. And be sure to wear the right kind of glasses when you are viewing the playing field. What looks tilted one way with your regular glasses may be tilted the other way with econ-oculars.
More Detective Work: How does Friedman use the “flat” word? Now that we have diverted to a brief review of flatness in economic thought and we have put some flesh on the bones of the level-playing-field metaphor, it is time to return to our first task: trying to decode Friedman’s flatness metaphor. One way to uncover what Friedman means by “The World is Flat” is to see how he uses the f-word. Since it occurs on virtually every page of this 450-page book, there is plenty of grist for the mill.
“..what the flattening of the world means is that we are now connecting all the knowledge centers on the planet together into a single global network.” (p.8) “from 1492 to around 1800.. it shrank to world from a size large to a size medium. From 1800 to 2000,.. shrank the world from a size medium to a size small. …around the year 2000 we entered a whole new era… shrinking the

9
world from a size small to a size tiny and flattening the playing field at the same time.” (p. 9-10) (my italics) “to flatten their accents in order to compete in a flatter world.” (p.27) “That is why I introduced the idea that the world has gone from round to flat. Everywhere you turn, hierarchies are being challenged from below or transforming themselves from top-down structure into more horizontal and collaborative ones.” (p.45) “common standards create a flatter, more level playing field.” (p. 52) “Just as the national highway system that was built in the 1950s flattened the United States, broke down regional differences, and made it so much easier to relocate in lower-wage regions, like the South… the laying of global fiber highways flattened the developed world.” (p. 69) “For the world to get flat, all your internal departments – sales, marketing, manufacturing, billing, and inventory – had to become interoperable, no matter what machines or software each of them was running.” (p. 74) “There is no future in vanilla for most companies in a flat world. A lot of vanilla making in software and other areas is going to shift to open-source communities.” (p. 91) “My bottom line is this: Open-source is an important flattener because it makes available for free many tools, from software to encyclopedias, that millions of people around the world would have had to buy in order to use, and because open-source network associations - with their open borders and come-one-come-all approach – can challenge hierarchical structures with a horizontal model of innovation …” (p 102-3) “China will never be truly flat until it gets over that huge speed bump called “political reform.”” (p. 126) “Insourcing came about because once the world went flat, the small could act big – small companies could suddenly see around the world. (p. 143) (My italics) “Search engines flatten the world by eliminating all the valleys and peaks, all the walls and rocks, that people used to hide inside of, atop, behind or under in order to mask their reputations or parts of their past.” (p. 158) “The net result of this convergence was the creation of a global, Web-enabled playing field that allows for multiple forms of collaboration – the sharing of knowledge and work – in real time, without regard to geography, distance, or in

10
the near future, even language…. That is what I mean when I say the world has been flattened,” (pp. 176-77) (Friedman’s italics and boldface).
This tediously long list is meant to help you feel my frustration. Friedman’s use of the flatness metaphor is virtually all encompassing. “Flattened” seems to be a synonym for “changed.” Often, and certainly in the last quotation, Friedman is really writing about a small world in which distance, measured physically, linguistically, and culturally, doesn’t isolate your job from competition from far-way workers.4
Friedman’s Ten Forces that Flattened the World
There is one last hope for the decoding of the flatness metaphor - a careful look at Friedman’s list of the ten forces that flattened the world. Here they are. 1. 11/9/89 The Fall of the Berlin Wall 2. 8/9/95 The Birth of the Internet (When Netscape Went Public) 3. Work Flow Software Software that coordinates tasks. 4. Open-Sourcing The Self-Organizing Collaborative Communities that
produced Linux and Wikipedia. 5. Outsourcing, Y2K The fiber-optic bubble created the potential to move
software coding to India and Y2K demand for coding far in excess of US capacity created the necessity.
6. Offshoring The movement of manufacturing jobs to low-wage developing countries.
7. Supply-Chaining Wal-Mart supply chain management practices. 8. “Insourcing” UBS which not only picks up your broken Toshiba laptop
but repairs its as well. Small companies can act large because the fixed-cost logistics infrastructure is supplied by a third party.
9. “In-forming” Google and Internet searches 10. The Steroids Digital, mobile, personal and virtual communications.
Videoconferences. Well that’s disappointing. This eclectic list doesn’t do much to narrow the definition of “flattened.” So it must mean “changed.” Of course, a book titled “The World is Different” isn’t destined to be a best seller, no matter what the content may be. A commercially better title would be “The World is Flat.” Each of the items on Friedman’s list of ten deserves comment. The last one, “the steroids” is another case of metaphorical malfunction. With the coining of the new words / new definitions “in-forming” and “insourcing” and “supply-chaining” Friedman is further working his magic with our language. 4 Even flatness as a visual metaphor, which is apt, is equivalent to a shrinking globe – in a spherical earth you cannot see around the world and cannot recognize the opportunities very far from where you reside. If the world were flat, you could see it all. That’s equivalent to a smaller globe that allows you to “reach” far-away opportunities.

11
I find myself trying now to resist the desire to discuss “open-sourcing” which is fourth on Friedman’s list of “flatteners.” We academics know more about this than he does. We are part of a “Self-Organizing Collaborative Community” called the research universities of the United States and increasingly the rest of the world. Unlike contributors to Wikipedia and Linux, we get paid for our work, not by those who consume the fruits of our labor, but by taxpayers and by donors and by our students, all of whom we have convinced are better off by virtue of the research that we do. When it got started fifty years ago, this system worked great, but it isn’t working as well anymore. While we are doing plenty of worthwhile research we are also doing plenty that isn’t worthwhile, and the competition for research talent defined by the fads of the moment is driving up the cost of education to unaffordable levels. Adam Smith would have understood what’s wrong here. It takes sales for the invisible hand to do its magic. Begging in your work clothes when you aren’t working isn’t enough, even though the pastime may be lucrative. On the contrary, the more lucrative is the begging, the more likely is the conclusion that the work is worthwhile, whether it is or isn’t. But it takes market prices to tell us what’s valuable and what’s not. Good will and good intentions can carry a collaborative community productively for a while, but financial rewards relentlessly bend the system to their will, slowly perhaps, but inevitably. That’s the invisible hand at work. Thus, open-sourcing has the same problems and the same probable longevity as the communes of the 1960s – they worked great for a while, but the participants chose other ways to live once they got to know each other. But, anyway, I don’t see how workflow software, open-sourcing, Wal-Mart supply-chaining or UBS “insourcing” can be considered revolutionary. They are just additional small steps in the march of progress. Rather than ten, my list of revolutionary forces has three items:
1. More Unskilled Workers: The economic liberalizations in China and India and Russia and South America and on and on have added to the effective global labor markets a huge number of unskilled workers and relatively little human and physical capital.
2. New Equipment for Knowledge Workers : The Internet and the Personal Computer have fundamentally changed the nature of knowledge work, raising productivity, emphasizing talent and reducing the need for “helpers.”
3. Communications Innovations: The cell-phone and the beeper and e-mail and voice-mail keep us all wired and connected 24/7, thus eliminating the borderline between time at work and time at leisure. These same communication tools, together with the Internet and virtually costless telecommunications have extended the geographic reach of suppliers, and have increased the intensity of competition for mundane work and standardized products.
The first two of these are not “flattening” forces at all. The increase in supply of unskilled workers is bad news for those who compete in that market segment but good news for those who do not. That doesn’t sound like flattening to me. The new equipment for knowledge workers greatly increases the productivity of those with natural talent but

12
that leaves the less talented with less to do and with lower pay. Today, Thomas Edison would be surprised to see the PC and the Internet doing most of the perspiring, and shocked to discover that genius is 99% inspiration and 1% perspiration. Since most of us are better at perspiration than inspiration, that doesn’t sound very “flat” to me. It is the third of these revolutionary changes that may be a force for “flattening”, or more accurately, a smaller world. I can buy an electric drill from my local hardware store or I can use the Internet to buy the drill from a supplier in Dallas or Newark and have it shipped by next day air. That means that my local hardware store is competing over a much larger geographic area and the rents that come from location are reduced. This can occur in the labor markets as well, with far-away workers bidding to do my tasks.
Other Models of Global Competition In addition to economic geography, there are countless models of global competition that are worth mentioning in a review of The World is Flat, but with too many words in this review already, some choices have to be made. The simple Ricardian model discussed below can be used to make an important point about the offshoring of intellectual work that so unsettled Friedman on his trip to Bangalore. I will also use this theory section to express the opinion that the market model we economists are so fond of applies to very few exchanges, most of which take place in the context of long-term relationships. Relationships greatly limit the contestability of our labor exchanges by making far-away low-skilled workers an unlikely alternative to nearby folks whom we have come to know and trust.
Did David Ricardo Understand Outsourcing?
As we wander through the thicket of theory that relates to Friedman’s Flat World, we need to revisit David Ricardo’s model of comparative advantage, which has been the bedrock argument for the gains from trade, but even this one is the target of attack. The public debate about the benefits and costs of “outsourcing” has been a heavyweight slugfest. Are there gains from trade or are there not? In the corner on the right, we have Professor Greg Mankiw, chairman of the Council of Economic Advisors, wearing the Crimson trunks and representing traditional thinking about the benefits of free trade. In the corner on the left, we have the newly-formed tag-team of Senator Charles Schumer and Dr. Paul Craig Roberts, loudly and publicly promising a first-round knock-out of Mankiw’s traditional way of thinking. (Yes, that is the same Paul Craig Roberts, who has always fought from the corner on the right.) In the front row, behind the Schumer/Roberts corner is the former Democratic Presidential nominee, Senator John Kerry, pointing a long thin finger at the “Benedict Arnold” businessmen whose company logos he imagines emblazon Chairman Makiw’s trunks. To the surprise of some, sitting to the left of John Kerry is none other than Paul Samuelson, holding aloft a clove of
13
garlic to ward off simple-minded thinkers. Thomas Friedman, perhaps not realizing the company he is keeping, has chosen to sit with Mankiw and the other free traders.5
Here is how the match is going:
Commenting on the offshoring of intellectual services, Chairman Mankiw, in the Economic Report of the President, 2004, advises:
“When a good or service is produced more cheaply abroad, it makes more sense to import it than to make or provide it domestically.”
But, based apparently on some serious late-night library work, Schumer and Roberts reply in the New York Times6
“when Ricardo said that free trade would produce shared gains for all nations, he assumed that the resources used to produce goods -- what he called the ''factors of production'' -- would not be easily moved over international borders. Comparative advantage is undermined if the factors of production can relocate to wherever they are most productive: in today's case, to a relatively few countries with abundant cheap labor. In this situation, there are no longer shared gains -- some countries win and others lose.” “And one thing is certain: real and effective solutions will emerge only when economists and policymakers end the confusion between the free flow of goods and the free flow of factors of production.”
My first reaction to Schumer and Roberts was: You need to write on the blackboard 100 times: “There are gains from exchange.” Ricardo’s (1817) Principles of Political Economy and Taxation was a good start, but take a look at the book that got Ricardo thinking about the issues: Adam Smith’s (1776) An Inquiry into the Nature and Causes of the Wealth of Nations. It was Adam Smith who emphasized the gains from exchange and the division of labor: "The propensity to truck, barter and exchange one thing for another is common to all men, and to be found in no other race of animals." It is the opportunity to exchange that allows the division of labor, from which flow the incredible efficiencies characteristic of modern economies. The very fact that there is an exchange confirms that there are gains to the parties involved. When ownership is freely passed from seller to buyer, the product or service increases in value, passing from one who values it less to one who values it more. The gains from exchange occur when buyer and seller reside in the same country, and occur
5 “The current debate about off-shoring is dangerously hot. But the debate about work going to India, China and Mexico is actually no different from the debate once held about … shoe work leaving Massachusetts or textile work leaving North Carolina. Work gets done where it can be done most effectively and most efficiently. …. Every person, just as every corporation, must tend to his or her own economic destiny, just as our parents and grandparents in the mills, shoe shops and factories did.” Friedman, p. ** 6 New York Times Op-ed Piece, January 6, 2004.

14
likewise when buyer and seller reside in different countries. Locations of residence of buyer and seller are utterly irrelevant. What about factor mobility? Does this vitiate the gains-from-exchange argument, as Schumer and Roberts suggest? Not in the slightest. It is irrelevant to the argument whether or not the buyer or seller chooses to move in order to effect the exchange. When a New Yorker hears of a better job in California, and decides to make the move, there are gains from the exchange that exceed the costs of the move. If the New Yorker can deliver the services over the Internet, all the better, since the costs of the move are not subtracted from the gains of exchange. Substituting “New Delhi” for “New York” in this factor mobility argument matters not in the slightest. “Nonsense, nonsense. Leamer, you are just another John Doe”, Professor Samuelson(2004) would disdainfully observe:
“Prominent and competent mainstream economists enter into the debate to educate and correct warm-hearted protestors who are against globalization. Here is a fair paraphrase of the argumentation that has been used recently by Alan Greenspan, Jagdish Bhagwati, Gregory Mankiw, Douglas Irwin and economists John or Jane Doe spread widely throughout academia…..
Correct economic law recognizes that some American groups can be hurt by dynamic free trade. But correct economic law vindicates the word “creative” destruction by its proof [sic] that the gains of the American winners are big enough to more than compensate the losers.
The present paper provides explication of the popular polemical untruth.”
If you find this an elliptical way of expressing disagreement with Mankiw et.al, try digging the deeper explanation from the body of the text, Samuelson(2004). Fortunately I(2004) had some class notes on this issue that stood ready on the shelf that I can share with you. It’s a terms of trade effect that Samuelson is talking about. Disturbances to equilibria can change the terms of trade and alter the distribution of the gains. (Even John and Jane Doe know that.) A flow of migrants is one such disturbance. That doesn’t mean that there are no gains from trade. It only means that the gains are distributed differently. I am going to call it “immiserizing outsourcing” in honor of Jagdish Bhagwati, who stands just above John and Jane Doe in Samuelson’s hierarchy. The model of outsourcing presented here illustrates what might happen if the US loses geographical control over its knowledge assets. This puts US prosperity at risk. It’s a possibility, not very close to reality, I think. Before we get into that material I have to make a confession. The argument that there are gains from exchange presumes that there are no “externalities” caused by the transaction, like the pollution caused when you exchange your hard-earned dollars for that gas-

15
guzzling foul-exhausting SUV. Here is a quip that makes the point in our context: International trade is an exchange that makes both parties worse off. We get their wages and they get our culture.
Immiserizing Outsourcing: Adverse Terms of Trade Effect on US Intellectual Property
Jagdish Bhagwati(1958) raised the possibility of “immiserizing growth” almost fifty years ago in a classic paper. Bhagwati warned that a country that grows more rapidly than its trading partners inevitably floods the markets with its export goods, which can lower the country’s terms of trade and make the growing country actually worse off.7 Factor mobility can also affect the terms-of-trade, as explored by Kemp(1966) and Jones(1967), who raised the possibility of immiserizing capital flows in a two-sector model with technological differences. Reverse the labels K and L and you have a long list of theorems on the effect of labor mobility on welfare. For a survey of the articles on the effects of tariffs in this kind of model, see Ruffin(1984). This literature directly addresses the implicit policy question lying behind the comments by Schumer and Roberts: Should the US attempt to halt outsourcing with some form of tax policy? We can capture this immiseration idea in a simple Ricardian model. Figure 1 illustrates the production possibilities of typical US and Indian workers8. They are equally productive in making apparel, but the US has a technological superiority in writing software. This superiority may come only from geography and history: Designing and writing software code requires close communications among the participants, and the Indian programmers are too far from the US to benefit from the agglomeration externalities that come from the need for clear communications. You cannot be a programmer unless you are “here”.
7 The traditional limit to growth comes from the diminishing marginal product of capital as capital accumulates. A startling implication of the small-country Heckscher-Ohlin model is that even though technologies at the sectoral level exhibit diminishing marginal products, the GDP function does not, since capital accumulation is accompanied by a shift from the labor-intensive sectors to the capital-intensive sectors, leaving the capital intensities at the sectoral level fixed. Immizerising growth recreates diminishing marginal product of capital for the GDP function through terms -of-trade changes. 8 For expositional purposes, I am illustrating the production possibilities of a typical worker, not the economy overall. For this reason, the diagram says nothing about the trade balance.

16
Figure 1 Production Possibilities: US and Indian Workers
Apparel
Software
US
India

17
Figure 2 illustrates the usual Ricardian equilibrium under these conditions: In addition to the production possibilities solid lines, this figure has two diamonds representing the production choices for India and the US, two dotted consumption possibility lines, two “indifference” curves that determine consumer choice and two solid circles representing the consumer choices in the US and in India. In this figure, the US specializes in software and India specializes in apparel. Workers in both countries are made better off by this exchange. In this equilibrium US workers have higher living standards than the Indians because of the US technological superiority in software. Figure 2 Specialization and Consumption: US and Indian Workers
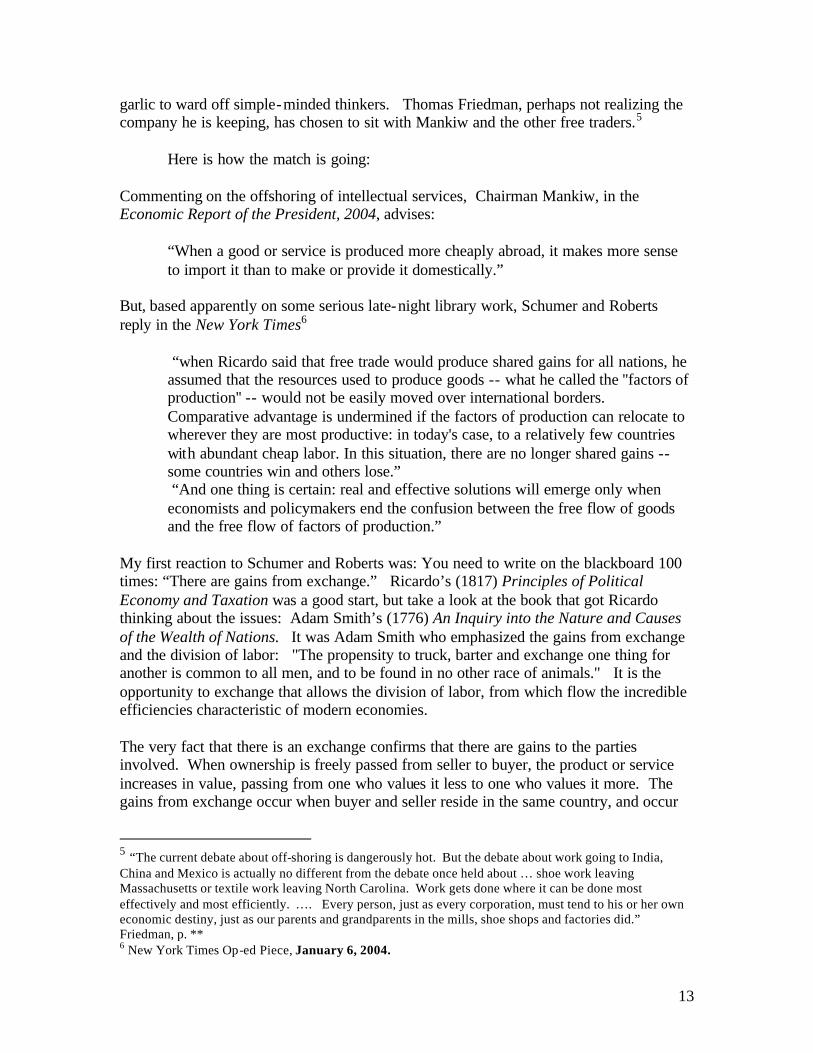
Figure 3 illustrates the effect of a change in communication technology that allows Indian programmers to participate in the conversations that are essential to the design and writing of computer code. The straight lines represent the initial production possibilities and the open circles the initial consumption points. The effect of delivering Indians to the US workforce over wires is to flood the global marketplace with cheap software, which causes a terms-of-trade deterioration for the US. This terms of trade deterioration for the US and improvement for India must eliminate the income differences in the two countries to stop the flow of Indians to the US through wires. In the final equilibrium, the technological difference between US workers and Indian workers is completely eliminated. The US workers are made worse off by this offshoring since they lose completely the gains from trade that came from their monopoly position (market power) in the software industry.
Apparel
Software
US
India Consumption
Options
Production
Consumption
India
US
18
Figure 3 Common Consumption Point, After Offshoring of Software Coding
There is an important message here. In this model, the US enjoys monopoly rents from the intellectual property that it creates, but those rents may dissipate if the franchise for creating intellectual property is extended to our customers. While this is a real issue, I doubt that this Ricardian model captures the production of intellectual property very accurately. A critical implicit assumption of this Ricardian model is that software programs are as alike as plain white t-shirts. If there are more t-shirts produced, with downward sloping demand, the price of t-shirts must fall. That is what causes the terms-of-trade deterioration in this Ricardian immisserizing outsourcing model as more coding is done in India. But intellectual properties are not stacks of identical plain-white t-shirts. While some software programs compete with each other, many do not, and the value of one can be enhanced by the existence of others. For this reason, I don’t think we need to worry about terms-of-trade deterioration for our intellectual properties - movies, drugs, financial derivatives, equipment and software. We do need to worry about intellectual property protection, without which the export value of our intellectual property may be seriously impaired. We also need to worry about the new competition for mundane coding tasks. In those same notes(2004) I have a Heckscher-Olhin model with production done by masters and helpers. The masters all live in the US. Helpers reside in the US and in India. It takes masters and helpers to make software. It takes only helpers to make apparel or nontraded services. In the initial equilibrium, externalities and transportation costs keep the masters and their helpers clustered together in the US, and the US exchanges software for apparel with India. A change in the communications technology that allows US
Apparel
Software
US initial consumption
India Initial
US and Indian consumption with offshoring
US and Indian production possibilities with offshoring

19
software masters to hire India helpers can eliminate all the US helpers jobs in the software sector. These US helpers move to the US nontraded service sector. Who wins and who loses from this change? US masters are sure to gain, since they can hire cheaper Indian helpers. US helpers might have a different outcome. A flood of displaced helpers in the US seems likely to drive down their wages, but keep in mind that there are global efficiency and income gains some of which will raise the demand for US helpers. Might the income gains that accrue to US masters translate into increased demand for US helpers in the service sector? Call that trickle-down offshoring.
Production and innovation are complementary
A terms-of-trade deterioration afflicting US intellectual products is far down the list of things to worry about. Higher up the list of concerns is the likely collateral but unintended transfer overseas of the innovative process in manufacturing along with the production work. Historically, the research labs have not been far from the manufacturing plants, since figuring out how to make “it” economically feasible was just as important to the innovative process as discovering “it.” In addition, ongoing cost-reducing process innovations can only be made by those who are actually producing the product. As we move more manufacturing to China we are certainly also moving process innovations there as well. It remains to be seen if product innovation can remain in the US when production is done elsewhere. In case you hadn’t noticed how much the structure of US production is changing, Figure 4 illustrates the fraction of value added originating in the three sectors that have experienced the greatest declines and Figure 5 illustrates the same for the four sectors that have experienced the greatest increases. It is the “manly-man” work in manufacturing9 and farming and transportation that is on the decline, falling from 40% of GDP in 1950 to 15% today. Meanwhile, it is the intellectual “geek work” in finance, professional services and information that is on the rise, as is health care. These high growth sectors have grown from 18% in 1950 to 44% today. I think we need to be concerned about the innovative process in an economy with so much finance and so little manufacturing. Dude, what is the latest financial derivative really worth? How much is it going to change your life?
9 If it is the kind of thing you like to do, please substitute “It is the ‘womanly-woman’ work in womanufacturing.’

20
Figure 4 The Disappearance of Manly Work
Value Added Fractions of GDP Decline in the "manly" sectors
Manufacturing
Agriculture, forestry, fishing, and hunting
Transportation and warehousing
0
5
10
15
20
25
30
35
40
45
50
1947 1952 1957 1962 1967 1972 1977 1982 1987 1992 1997 2002
Figure 5 The Growth of Geek Jobs
Value Added Fractions of GDPGrowth in Geek Work
Information
Educational services, health care, etc.
Professional and business services
Finance, insurance, real estate, rental, and
leasing
0
5
10
15
20
25
30
35
40
45
50
1947
1950
1953
1956
1959
1962
1965
1968
1971
1974
1977
1980
1983
1986
1989
1992
1995
1998
2001
2004
Per
Cen
t

21
So what? Does it matter if we transfer some innovative functions out of the US? To find an answer, I suggest another question: Why does the federal government of the United States subsidize research and development, but the City of Los Angeles does not? The answer is that the City of Los Angeles would not benefit much from the innovations the subsidies might support. Most of the value of that subsidized research would leak out of the city, and a subsidy would be a waste of the taxpayer’s money. For the US it has been different. Much of the research and development done here has raised the productivity of the US workforce relative to competitors. However, “globalization” is making the US overall pretty leaky, and we taxpayers need to insist that our taxes subsidize the creation of intellectual assets that are sufficiently immobile that the local return is high enough to justify the subsidy. For the mobile intellectual assets, it doesn’t matter to me whether they are created in Seattle or downtown Los Angeles or in Beijing. Friedman’s call10 for more R&D support by the US government thus seems mistaken policy in the “flat” world he imagines. Better to concentrate on the immobile assets – the researchers (not the research), and infrastructure, including the parks and pub lic spaces that these highly-paid knowledge workers enjoy.
Markets or Relationships: Contestable or Negotiable Exchanges?11
The worry that your job is going to be taken away by a cheaper worker in India or China is based on the supposition that there is a “market” for the tasks that you perform. Though we economists talk as if most exchanges were meditated by markets to which our simple supply and demand model applies, in fact most exchanges require long-term relationships between buyer and seller. The “capital” invested in these long-term relationships creates a situation of bilateral bargaining that responds to competitive pressures in much softer ways than would a market. It’s the difference between contestable versus negotiable exchanges. A market has contestable exchanges that cannot be consummated if they deviate in the slightest from the “market.” If the global market offers to do your work for 1 cent less today, then you either accept a wage reduction tomorrow morning, or you lose your job. That isn’t your situation, is it, o ye of tenure status? Your university job is not contested, is it? Your job is negotiated. The supply and demand balance for academic economists can change sharply but it will take a very long time for you to feel that change. You negotiate with your employer (the University) and your employer negotiates with the paying customers (state legislators and voters and students and donors). That isn’t like a market at all. At the economist’s hypothetical “market”, countless faceless buyers meet countless faceless sellers, and carry out exactly the same transaction – exchanging at one “instant” of time x units of a good or service A whose value is transparent to both buyer and seller for y units of good or services B, also with a
10 “At a time when we need to be doubling our investments in basic research to overcome the ambition and education gaps, we are actually cutting that funding.” p. 268 11 “Markets and hierarchies” is Williamson’s(1983) dichotomy. I prefer “markets or relationships” and “contestable or negotiable exchanges.”

22
transparent value.12 The market is thick with buyers and sellers, but there are no relationships. These market participants don’t even know each other. Buyers and sellers in this hypothetical market are all brought together into the same “space” so that they can overhear the terms of the exchanges being offered by others, and from that information cut a better deal for themselves. With all that overhearing the participants haggle their way to a collective rate of exchange, the “market price” at which total sales exactly match total purchases. Having found this market rate, the exchanges take place, and the participants go on their merry separate ways, never to see each other again. In this hypothetical market, the identities of buyer and seller are totally irrelevant. It doesn’t matter where the buyers or sellers reside, what their nationalities are, who they work for, who their parents are, where they went to school, how big are their bank accounts, how attractive they are, what their beliefs are, whether they are men or women, old or young, tall or short, convicts or ex-convicts, sinners or saints, con men or paragons. The exchange is completely impersonal. A market is infinitesimally close geographically, but infinitely remote personally. “Arm’s length” is the way we describe it. Close enough to overhear, but too far to shake hands and way too far to hug. (Gestures of trust.) In fact, there are very few exchanges that are mediated by “markets.” There are very few “commodities” whose value is transparent enough to allow the formation of a market. There are very few exchanges that take place at a frequency high enough and transparent enough to other potential participants that market prices can emerge. Most exchanges take place within the context of long-term relationships that create the language needed for buyer and seller to communicate, that establish the trust needed to carry out the exchange, that allow ongoing servicing of implicit or explicit guarantees, that monitor the truthfulness of both parties, and that punish those who mislead. Many exchanges occur between colleagues who work for the same firm. Indeed, about 40% of US imports are carried out internal to multinational enterprises. The fear that seems to underlie much of Friedman’s flat earth metaphor, is that work is becoming commoditized and sold in global markets. What got him to his “flat world” conclusion was his observation that software coding in Seattle seems contestable from Bangalore. But: Is Friedman’s job commoditized? Is Friedman’s job contested? I think I am getting close again to understanding the Flat World Metaphor. It is mostly about the commoditization of work, and the extension geographically of the contest for mundane work in manufacturing and services like sewing apparel and reading manuals at call centers over the phone and also not-so-mundane intellectual activities.
12 Often, one of the items exchanged is “money,” standing for a basket of goods or services.
23
The central issue is whether Americans are going to sell their products and services in a global “market” that completely determines the wages and working conditions, or are American jobs going to be protected by relationships and by geography. Will export and import-competing jobs be confined to specialized negotiable “craftwork” in which the forces of global competition are greatly attenuated, while the contestable jobs are limited to nontraded sectors with a contest that does not extend beyond borders? Or, as Friedman’s flat earth title suggests, are the dramatic changes in communications technology, includ ing the Internet and also essentially free telecommunications extending the contest for nontraded contestable work across borders and also turning secure negotiable jobs into insecure contestable jobs?
The Luddites preferred the old relationship-based way of selling cloth
An important determinant of contestability is product maturity. Product innovations are the waves that bring new high-paying skilled “craft” jobs to innovating communities, but standardization of the product and mechanization of the process inevitably cause the waves to recede as routinized jobs at low wages replace skilled jobs at high wages. Attitudes toward technology and trade naturally depend on whether the wave is advancing or receding. As we currently feel the undertow of the jobs receding from the United States, it is wise to understand that waves have been advancing and receding since the Industrial revolution began to standardize and mechanize the weaving of cloth at the beginning of the 19th Century. Prior to 1780, British cotton textiles were produced in small artisan shops and on family farms using spinning wheels to make the thread and hand-driven looms to weave the cloth. The Industrial Revolution brought numerous new machines to help do the work, including John Kay’s flying shuttle patented in 1733, and James Hargreaves’ spinning jenny patented in 1767 and Richard Arkwright’s water-powered spinning frame in 1769. The availability of this machinery moved the jobs out of homes into small mills near streams that could supply the waterpower. Then steam power allowed the mills to leave the streams of rural England in search of cheaper urban labor. It was here that workers, caught in the undertow of mechanization and standardization, responded with the Luddite destruction of textile machinery. The Luddites were upset not just with the machines but also with the way that a market system prices standardized products. When artisans made customized goods, the price was negotiated and skilled workers’ interests could be pursued by wise and/or benevolent master craftsmen. That was relationship-based exchange. But, once the product is standardized and the process of production is mechanized, the price is set by the “market” and laborers are forced in effect to bid against each other to do the work. Turned over completely to market forces, workers lose control of their workplace and their financial security and even their pride. The Luddite song, “General Ludd’s Triumph” points to these two concerns: machines and pricing:
The guilty may fear, but no vengeance he aims At the honest man's life or Estate

24
His wrath is entirely confined to wide frames And to those that old prices abate
Here "wide frames" is a reference to the machines and “old prices” is a reference to the negotiated/administered prices that were a characteristic of artisan shops. Smash the machines and give us back our old negotiated prices.
Which Activities are Contestable: Mundane Work or Creative Work?
The Luddites correctly perceived that mechanization and standardization of textile production was turning their jobs into tasks contestable by workers near and far. The key word here is “contestable.” Friedman’s flat world hypothesis seems to be that there are or will be many US jobs that are contested by Chinese and Indians. This strikes me as rather far from reality. It is only the mundane codifiable tasks in tradables for which there are global markets.13 You’d be surprised how few of those remain in the US. Table 1 reports imports and exports divided by US value added from the 1998 and 2004 Input-Output Tables prepared by the BEA. Also included in the table is the share of GDP that originates in the sector, the cumulative thereof, and, in the last column, the change in the GDP share from 1998 to 2004. Sectors are sorted by the 2004 import penetration ratio – the ratio of imports to value-added. At the top is apparel and leather products, with a 2004 import penetration ratio of 341%, up from 154% in 1998. While imports in that sector were on the rise, exports were stagnant, and value added as a share of GDP was declining. That’s a contested sector. Another sector that lost a lot of value added was computer and electronic products, which experienced a rise in the import penetration ratio from 99% to 147%. At the bottom of this list is motion picture and sound recording industries, which has high levels of exports and low levels of imports, though both were on the rise in this period. With imports in 2004 only 4% of value added, while exports are 29% it seems likely that the jobs in this movie sector are only minimally contested globally.
13 These ideas were developed in Leamer and Storper(2001). Levy and Murnane(2004) offer a highly interesting and closely related framework for thinking about cognitive tasks. What I am calling mundane, codifiable tasks, Levy and Murnane call rule -based deductive tasks. For Levy and Murnane, the non-routine, non-codifiable tasks are pure pattern recognition which cannot be articulated. Though it’s a great insight, I am not so sure that pattern recognition versus deduction is the key divider between codifiable and non-codifiable tasks, since simple pattern recognition is carried out well by computer algorithms of various forms, including the statistical tool that is wisely avoided by most economists: stepwise regression. (We don’t rely on stepwise regression or any other automated statistical pattern recognition to pull understanding from our data sets because there is currently no way of providing the critical contextual inputs into those algorithms and because an understanding of the context is absolutely critical to making sense of our noisy non-experimental data. The last person you want to analyze an economics data set is a statistician, which is what you get when you run stepwise regression. ) Furthermore, though Levy and Murnane’s classification is intended to apply only to intellectual work, it does not extend naturally to physical activities, like sports or ballet, where some part of the tasks are codifiable and learnabale in a classroom, but most require extensive learning-by-doing. But regardless, Levy and Murnane and I are in complete agreement on the critical point: the footloose contestable tasks are the routine codifiable tasks, both in manufacturing and intellectual services.
25
I have labeled this table “hints of contestability” because some serious econometric work would be needed to translate these numbers into legitimate measures of contestability, recognizing among other things that exports as well as imports can create global contests. It does seem likely that the industries at the bottom of this list with low ratios of imports to value added are minimally contested and the ones not shown but further down the list are even less so. Referring now to the cumulative GDP share, the sectors in this table comprised only 21% of GDP in 1998 and 17.5% of GDP in 2004. The other 80% are mostly nontraded sectors including, for example, 10% of value added in real estate, 9% in state and local government, 9% in construction, 8% in retail trade, 6% in the federal government, 6% in hospitals, 5% in ambulatory care and so on. But, I hasten to add, wages in Los Angeles hospitals can be set in Shanghai by a chain of contests. If apparel producers in LA are competing in the same product markets as apparel made in China, and if workers in LA can choose between hospital work and sewing garments, then there is a chain of contests linking US hospital to garment factories in China. To summarize, determining the degree of global contestability for US work is an important task that has hardly begun.

26
Table 1 Hints of Contestability
Value Added Shares and Trade Penetration
Trade to Value Added Ratios GDP Share 1998 2004 1998 2004 Change
Imports Exports Imports Exports Share Cum Share Cum Apparel and leather and allied products 154% 17% 341% 18% 0.62% 0.6% 0.27% 0.3% -0.35%Fabricated metal products 130% 97% 340% 161% 0.19% 0.8% 0.09% 0.4% -0.11%Electrical equipment, appliances, and components 97% 57% 205% 80% 0.37% 1.2% 0.20% 0.6% -0.17%Plastics and rubber products 115% 93% 194% 108% 0.16% 1.3% 0.12% 0.7% -0.04%Paper products 131% 105% 174% 104% 0.14% 1.5% 0.11% 0.8% -0.04%Computer and electronic products 99% 68% 147% 71% 1.97% 3.5% 1.28% 2.1% -0.69%Textile mills and textile product mills 69% 37% 114% 47% 0.23% 3.7% 0.16% 2.2% -0.07%Miscellaneous manufacturing 73% 23% 90% 27% 0.70% 4.4% 0.64% 2.9% -0.06%Chemical products 67% 56% 80% 54% 1.24% 5.6% 1.36% 4.2% 0.12%Motor vehicles, bodies and trailers, and parts
55% 24% 77% 25% 2.79% 8.4% 2.26% 6.5% -0.54%Printing and related support activities 35% 43% 77% 59% 0.04% 8.5% 0.02% 6.5% -0.02%Machinery 42% 40% 57% 47% 1.90% 10.4% 1.35% 7.8% -0.55%Furniture and related products 22% 5% 50% 5% 0.60% 11.0% 0.42% 8.3% -0.18%Petroleum and coal products 24% 19% 41% 14% 0.47% 11.4% 0.86% 9.1% 0.39%Farms 39% 55% 33% 49% 0.43% 11.9% 0.41% 9.5% -0.02%Air transportation 33% 37% 32% 38% 0.68% 12.5% 0.61% 10.1% -0.07%Other transportation equipment 24% 61% 28% 53% 1.24% 13.8% 0.89% 11.0% -0.35%Mining, except oil and gas 5% 91% 18% 64% 0.07% 13.9% 0.05% 11.1% -0.02%Food and beverage and tobacco products 9% 10% 13% 7% 3.76% 17.6% 3.35% 14.4% -0.41%Insurance carriers and related activities 5% 2% 13% 3% 1.97% 19.6% 1.96% 16.4% -0.01%Miscellaneous professional, scientific and technical services 8% 17% 8% 13% 0.79% 20.4% 0.79% 17.2% 0.00%
Motion picture and sound recording industries 2% 24% 4% 29% 0.30% 20.7% 0.29% 17.5% 0.00%
27
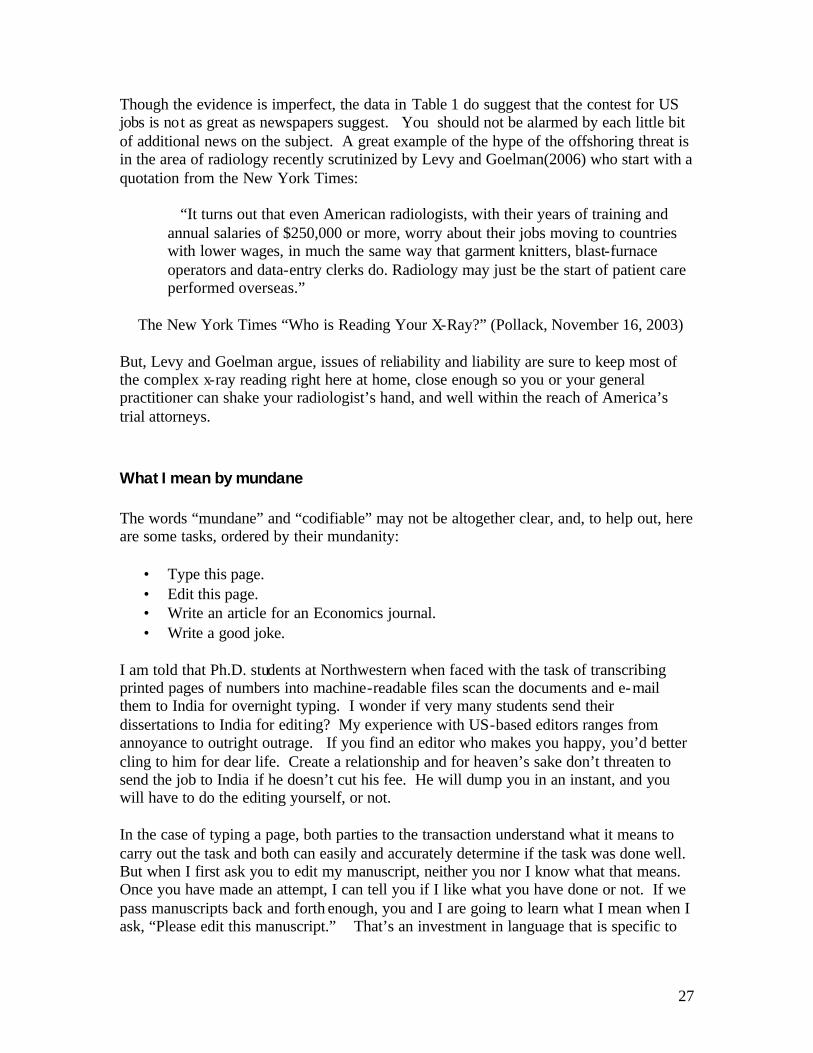
Though the evidence is imperfect, the data in Table 1 do suggest that the contest for US jobs is not as great as newspapers suggest. You should not be alarmed by each little bit of additional news on the subject. A great example of the hype of the offshoring threat is in the area of radiology recently scrutinized by Levy and Goelman(2006) who start with a quotation from the New York Times:
“It turns out that even American radiologists, with their years of training and annual salaries of $250,000 or more, worry about their jobs moving to countries with lower wages, in much the same way that garment knitters, blast-furnace operators and data-entry clerks do. Radiology may just be the start of patient care performed overseas.”
The New York Times “Who is Reading Your X-Ray?” (Pollack, November 16, 2003) But, Levy and Goelman argue, issues of reliability and liability are sure to keep most of the complex x-ray reading right here at home, close enough so you or your general practitioner can shake your radiologist’s hand, and well within the reach of America’s trial attorneys.
What I mean by mundane
The words “mundane” and “codifiable” may not be altogether clear, and, to help out, here are some tasks, ordered by their mundanity:
• Type this page. • Edit this page. • Write an article for an Economics journal. • Write a good joke.
I am told that Ph.D. students at Northwestern when faced with the task of transcribing printed pages of numbers into machine-readable files scan the documents and e-mail them to India for overnight typing. I wonder if very many students send their dissertations to India for editing? My experience with US-based editors ranges from annoyance to outright outrage. If you find an editor who makes you happy, you’d better cling to him for dear life. Create a relationship and for heaven’s sake don’t threaten to send the job to India if he doesn’t cut his fee. He will dump you in an instant, and you will have to do the editing yourself, or not. In the case of typing a page, both parties to the transaction understand what it means to carry out the task and both can easily and accurately determine if the task was done well. But when I first ask you to edit my manuscript, neither you nor I know what that means. Once you have made an attempt, I can tell you if I like what you have done or not. If we pass manuscripts back and forth enough, you and I are going to learn what I mean when I ask, “Please edit this manuscript.” That’s an investment in language that is specific to
28
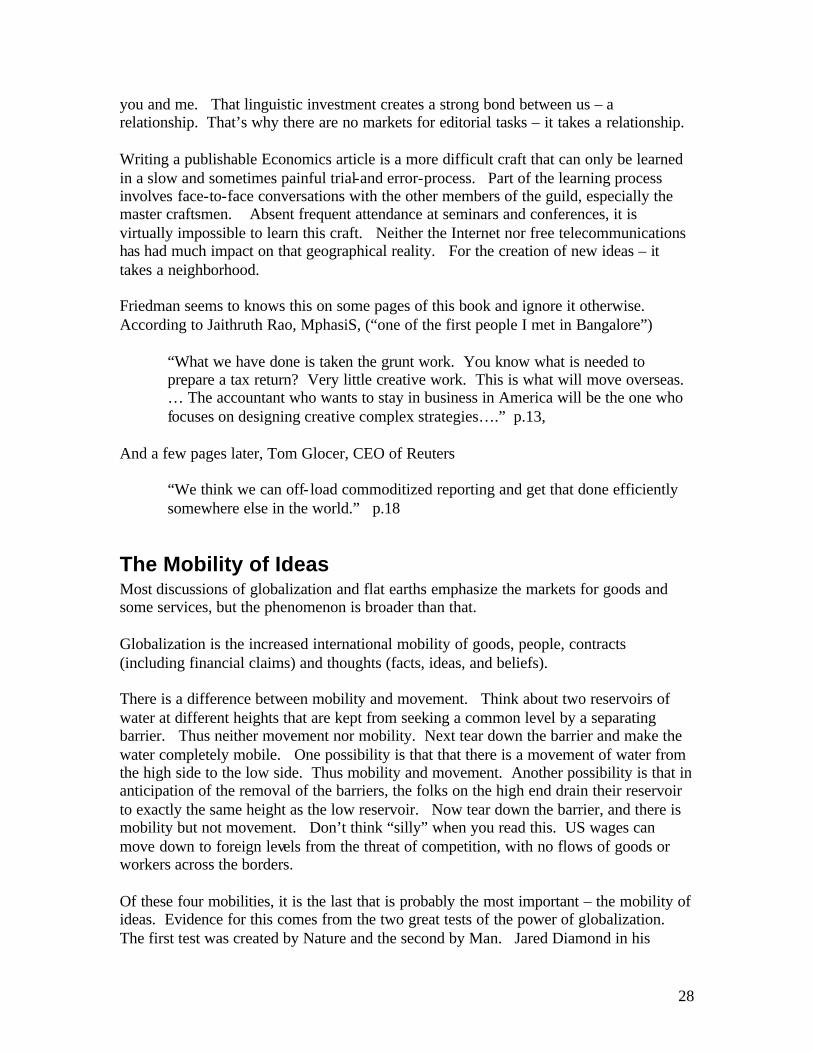
you and me. That linguistic investment creates a strong bond between us – a relationship. That’s why there are no markets for editorial tasks – it takes a relationship. Writing a publishable Economics article is a more difficult craft that can only be learned in a slow and sometimes painful trial-and error-process. Part of the learning process involves face-to-face conversations with the other members of the guild, especially the master craftsmen. Absent frequent attendance at seminars and conferences, it is virtually impossible to learn this craft. Neither the Internet nor free telecommunications has had much impact on that geographical reality. For the creation of new ideas – it takes a neighborhood. Friedman seems to knows this on some pages of this book and ignore it otherwise. According to Jaithruth Rao, MphasiS, (“one of the first people I met in Bangalore”)
“What we have done is taken the grunt work. You know what is needed to prepare a tax return? Very little creative work. This is what will move overseas. … The accountant who wants to stay in business in America will be the one who focuses on designing creative complex strategies….” p.13,
And a few pages later, Tom Glocer, CEO of Reuters
“We think we can off- load commoditized reporting and get that done efficiently somewhere else in the world.” p.18
The Mobility of Ideas Most discussions of globalization and flat earths emphasize the markets for goods and some services, but the phenomenon is broader than that. Globalization is the increased international mobility of goods, people, contracts (including financial claims) and thoughts (facts, ideas, and beliefs). There is a difference between mobility and movement. Think about two reservoirs of water at different heights that are kept from seeking a common level by a separating barrier. Thus neither movement nor mobility. Next tear down the barrier and make the water completely mobile. One possibility is that that there is a movement of water from the high side to the low side. Thus mobility and movement. Another possibility is that in anticipation of the removal of the barriers, the folks on the high end drain their reservoir to exactly the same height as the low reservoir. Now tear down the barrier, and there is mobility but not movement. Don’t think “silly” when you read this. US wages can move down to foreign levels from the threat of competition, with no flows of goods or workers across the borders. Of these four mobilities, it is the last that is probably the most important – the mobility of ideas. Evidence for this comes from the two great tests of the power of globalization. The first test was created by Nature and the second by Man. Jared Diamond in his

29
remarkable book Guns, Germs and Steel poses the question: why did Europe conquer the Americas, rather than the other way around? One of the answers is globalization. The north-south orientation of the Americas did not support the transfer of technology because innovative crops and livestock that would flourish in one latitude would not survive in another. In contrast, the middle latitudes stretched all the way from Europe to China, allowing grains discovered in the Middle East to be grown in Spain or in China, and gunpowder discovered in China to be deployed in European arms. Though those east-west trade routes between Europe and China were established to exchange goods, it was the stowaway ideas that traveled with the goods that really mattered. Europe conquered the Americas because of it superior mobility of thoughts. The second test of globalization came in the aftermath of World War II when about 2/3rds of humanity lived in inward- looking isolationist countries, and the other 1/3rd (Western Europe, the US, Canada, Japan, Korea and Taiwan, and a few others) created a great trading network within which stowaway ideas traveled freely along with the goods. The isolationist policies of the governments of the 2/3rds impeded the flow of ideas across borders, but worse still, in an effort to maintain political support for those external barriers, these countries typically controlled and thus greatly slowed the exchange of ideas internally, through control of the media and spying on domestic citizens. The technological progress created in the 1/3rd group of trading nations left the 2/3rds far behind, and eventually caused those inward- looking isolationist governments to pursue new policies.
The Speed at Which Ideas are Exchanged Determines the Pace of Progress
It is the speed at which ideas are passed between people that determines the rate of progress. As long as the only way to transfer ideas was via person-to-person conversations, progress was measured in tens of centuries starting with the evolution of homo sapiens in 200,000 BC. Early written language such as Egyption hieroglyphs in 4000 BC was an important step forward since it allowed an innovator to express her ideas in “writing” and then have those thoughts read by others for as many years and viewings as the parchment and tablets could withstand. While this increased the mobility of ideas, hand-transcription was an expensive and error-ridden process, restricting access to the texts to a very few. Enter Johann Gutenberg, the most influential person of the millennium per the Arts and Entertainment Network14. Gutenberg’s movable type and printing press allowed the mass printing of books, beginning with the Gutenberg Bible in 1455.15 Without printed books or an equivalently efficient system for passing ideas
14 http://en.wikipedia.org/wiki/A%26E%27s_Biography_of_the_Millennium 15 “Block printing, whereby individual sheets of paper were pressed into wooden blocks with the text and illustrations carved in, was first recorded in Chinese history, and was in use in East Asia long before Gutenberg. By the 12th and 13th century many Arabic and Chinese libraries contained tens of thousands of printed books. The Koreans and Chinese knew about movable metal types at the time, but arising from the complexity of the Chinese writing system, movable type printing wasn't as widely used as that of Renaissance Europe.” http://en.wikipedia.org/wiki/Johann_Gutenberg
30
between people, it is hard to imagine that there could have been an Industrial Revolution in the 18th and 19th Centuries – no Renaissance, no Scientific Revolution, no steam engine, no electric motor, no internal combustion engine, no telegraph, no telephone….. At least not so soon. But like tablets and parchment, printed books and physical documents have important limitations. There are still substantial fixed costs of going from author’s text to printed document, and there are substantial distribution and storage costs to create the libraries of paper documents and books, and there are very substantial search costs to find the right pages of the right book at the right time. The Internet has changed all this and has done so virtually overnight. That contrasts greatly with the printing press. It took several centuries after Gutenberg for the needed infrastructure investments in presses, literacy and libraries to provide access to thoughts to significant fractions of the global population. The Internet is like the printing press in terms of its potential impact on the mobility of thoughts. The Internet gives access today to the thoughts you had just yesterday to every web-enabled person all over the globe. You just have to post your thoughts on the web and hope that the search engines will point the relevant readers to your materials. The “publication” costs on the Internet are minimal, not even any pesky editors and publishers standing between you and your audience. The distribution costs are virtually zero, once the Internet and literacy infrastructure are in place. And digitalized electronic search is ever so much more efficient than the “analog” visual browsing that you and I used to conduct in the bowels of University libraries. Absent efficient search, the massive amounts of textual, numerical and visual information posted on the Web is a mountain of noise that completely covers the faint signal of valuable data. To turn that mountain of data first into information and later into wisdom and insight we need a filtering system that separates the signal from the noise, that sorts the important from the relevant and the relevant from the irrelevant. Thank you Google. How can one be anything but optimistic about the impact that the Internet will have on progress? If you think of humans on Earth as a single thinking organism, then until the 1980s we have been using only about 1/3rd of our global brain because 2/3rds of humanity were shut in closets where they couldn’t communicate with the rest of us. The liberalizations that have swept the globe have thus tripled the number of useable neurons in our collective brain. This has to be a good thing for all of us. Unlike the production of standard washing machines and toaster ovens, the innovative thoughts produced by the newly reintegrated 2/3rds do not necessarily compete with the innovative thoughts produced by our 1/3rd. It’s not a zero sum game. It’s a cumulative process with the innovators of today standing on the shoulders of the giants of yesterday. And add to that the power of the Internet that increases the speed of our global brain by many multiplies. We are a heck of a lot smarter now than we were a couple of decades ago. The 21st Century is sure to have a pace of innovation that is unrivaled in human history.

31
Facts: That’s the theory. What about the facts? Thomas Friedman and most journalists use what Dan Suits at the University of Michigan called “man-who” statistics, as in “I know a man who…” This book starts with an interview of Nandam Nailekani, CIA of Infosys Technologies, and then David Neeleman, CEO of JetBlue Airways Corp., and then General Richard Meyers, chairman of the Joint Chiefs of Staff, and then Colin Powell, and then Steven Holmes, UPS spokesman, and then David Glass, CEO of Walmart, and then and then and then an obscure economist or two (Robert Lawrence and Paul Romer) (anothe r joke, of course.) Economists create knowledge, or think they do, using an entirely different methodology that keeps them always very far from CEOs and any of the other actors in the drama they study. Some economists noodle away at the blackboard or on pads of paper. We call them theorists. Other economists stare at computer screens downloading data from various websites and organizing those data with econometric software packages. I am one of these. We look not at man-who statistics but rather population means, or the multivariate equivalent, estimated models. There is something we can learn from Friedman’s methodology. He does an extraordinarily good job creating ideas, especially when you consider that he is not a card-carrying member of our Guild. But, I think, he could benefit from some theory and some evidence, put together the way we do. If he had some of these, he would have been led to an alarmist view of another sort. From the countless facts that are material to whether or not The World is Flat, I have selected just a few.
• The income distribution is not becoming flatter, neither between countries and nor within the US.
• Trade is a neighborhood phenomenon, close to home geographically and organizationally.
• Trade contributes to the decline in manufacturing jobs, but doesn’t seem to be the primary driver.
• Outsourcing of intellectual work is a small drop in a very large bucket. • The US is extremely well positioned to compete in the Internet-based segment of
the economy.
The Tale of the Three-Legged Dog
Before we begin to look at some facts, I have to tell you a story about the use of theory and evidence to guide decision-making.
32
When asked to determine what would happen if a dog lost one of it's front legs, one group of researchers went to Toys R US and purchased a toy model of a dog that bounced around and barked when turned on. After many hours of play with this mechanical marvel, these researchers developed an affection for their toy model that was as deep and intense as for the real thing. They were deeply saddened to discover, when they removed the front leg, their dog pitifully lay on the ground wiggling in a circle, though still barking as it had before. Another group of researchers searched for real examples of three-legged dogs, and found, to their amazement, that those real three- legged dogs could run and jump, and seemed hardly different from real four- legged dogs. I am the proud owner of a three- legged dog, that has been teaching me about life and economics.

33
No “Flattening” of Global and Local Inequality
The Global Labor Pool: No Flattening Here
Figure 6 illustrates the global income distribution in 1980. This figure ignores inequality within countries and merely assigns to each individual the per capita income of his or her country. The vertical axis is real GDP per capita in $1995 using PPP exchange rates and the horizontal axis is the fraction of the global population. Each country in this figure is represented by a rectangle with height equal to per capita income, with width equal to the population fraction and with area representing total GDP (population times GDP per capita). Three rectangles are shaded: the USA on the left with a high per capita income and a large population fraction, and India and China on the right with low per capita incomes and very large population fractions. Figure 6 The 1980 Global Labor Pool
1980 Global Income Distribution
0
10,000
20,000
30,000
0% 20% 40% 60% 80% 100%
Cumulative Populat ion Fraction
USA
India China
Average per capita GDP = $5079
Countries in this figure are sorted by per-capita incomes, left to right, with the wealthy countries on the left and the poor countries on the right. Call this the global labor “pool”, a very strange pool indeed, with the liquid piled up high on one end and hardly present at the other end. What could possibly be holding up the high end? A prevalent answer in 1980 was that the 2/3rds of humanity in the low-income part of the global labor pool lived in countries with governments that adopted inward- looking isolationist policies that prevented businesses from pursuing the obvious arbitrage opportunity of buying labor where it is cheap and selling the products where labor is dear. The liberalizations that

34
swept the globe promised to unleash these arbitrage opportunities and to create a global labor market – a flat world per Friedman. Call it the Great Equalization in which wages and per capita incomes in the poorest parts of the globe would rise dramatically, but only by “draining” the high- income end of the pool. If the liquid in this pool were to find a common level it would leave every country with a per capita income equal to $5079, a little less than 1/4th of the 1980 per capita income in the USA. That’s turning the clock back to 1910, when the USA last had a per capita income that low. 16 Don’t be alarmed. Equalization of per capita incomes isn’t going to happen. One reason why it can’t happen is that global arbitrage works to equalize only the earnings of identical workers performing identical tasks. Much of the difference in GDP per capita among countries comes from the greater amounts of physical and human capital in the West, which advantages aren’t going to go away any time soon. A second view about the potential effect of these liberalizations focuses on the huge unskilled labor forces in China and India and Indonesia and the Soviet bloc and Africa and on and on. These liberalizations increased the effective global supply of unskilled workers enormously with no commensurate increase in human capital or physical capital or natural resources. Inevitably, this would mean a decline in the global wage rates of unskilled workers and their substitutes, but an increase in the global rate of compensation for complementary factors. Some serious econometric work is needed to determine which factors of production are complements and which are substitutes for unskilled labor, but you and I can guess. Both physical capital and semi-skilled workers are substitutes for unskilled workers in some activities. Think about construction. You can get that old concrete removed by hiring one skilled worker operating a jackhammer or five unskilled workers using sledgehammers. Agriculture is the same thing. Workers on US farms operate extremely expensive equipment for planting, cultivating and harvesting. Elsewhere in the globe, much of this farm work is done by hand. But manufacturing is different. The standardized and mechanized methods of production in manufacturing leave little scope for the substitution of unskilled workers for capital, and an increase in the global unskilled or semi-skilled workforce in manufacturing is likely to require more physical capital. Thus the huge increase in the effective global supply of unskilled workers seemed sure to lower the wage rates of workers without high school educations, and sure to increase the compensation for natural resources and for skilled workers with college educations and above, but has unclear effects on the middle range of human skills (high school graduates or less) and on the return to physical capital.17 According to this view, countries well endowed in natural resources and human capital benefit as the Chinese and Indians and Indonesians and Africans are integrated into the global economy but countries, with large endowments of unskilled workers suffer from the increased competition. Within countries expect a rise of inequality, as the unskilled suffer from the hot breath of Chinese competition.
16 Maddison data, http://english.historia.se/. 17 The very low real rates of return on financial investments in the wake of the 2001 recession are what Greenspan has called a “conundrum.” Part of the explanation is that global GDP growth is more concentrated in high savings countries in Asia, but another part has to do with weakness in demand for loanable funds from all those low-skilled low-wage workers that have been added to the

35
There is a third entirely optimistic view. According to these optimists, we should be expecting the global labor pool to be levelized mostly from below, with dramatic gains in incomes in the poor countries but no downward pressure on incomes among the rich. According to this view, the low incomes among the left-out 2/3rds came not from the absence of trading opportunities, but mostly from technological and institutional backwardness. According to this view, it is not mobility of goods that matters most; it is the mobility of ideas. If one allowed commercial exchanges between East and West, ideas would flow along with the goods. Then the Western way of living would move East, and North and South as well, and Western technology and Western market competition and Western business organizations would raise the living standards of all those who had been left-behind. So what actually happened and why? Figure 7 compares the 1980 global income distribution with the year 2000 distribution. The year 2000 distribution isn’t flatter at all. While it is true that there was substantial income growth in the shallow (poor) end of the pool, most importantly in India and China, there was also very substantial income growth at the wealthy end. Indeed, half of global GDP growth in this period originated in four countries: two wealthy countries (USA and Japan) and two poor countries (China and India). But income growth didn’t occur uniformly. The globe’s middle class was left behind, with no income growth over those two difficult decades between the 17th percentile and the 36th percentile.
Figure 7 Global Labor Pools in 1980 and 2000
1980 and 2000 Global Income Distribution
0
10,000
20,000
30,000
40,000
0% 20% 40% 60% 80% 100%
Cumulative Population
1980
2000US
Japan
ChinaIndia

36
A Great Equalization thus did occur – it just didn’t apply to the wealthiest 18% of countries. The wealthiest countries managed to prosper in the face of manufacturing jobs being tugged into the poor part of the globe while the middle class countries stagnated. What is the difference between the wealthy and middle- income countries? I believe that the answer is that the wealthy and the poor countrie s have different “domains of competition.” Inside of manufacturing there is a segment of footloose mundane labor-intensive activities and a set of innovative and/or capital- intensive activities that are firmly rooted. The footloose standardized products can be accurately described in documents (blueprints and engineering specifications and words) and the finished products can be easily inspected to determine if they meet the specifications. The footloose standardized products are sold in competitive global markets, which control the prices and the wages as well. But, because of market power, the prices of the innovative capital- intensive products are set by their manufacturers, who thus have considerable leeway in setting wages and working conditions. Think Ely Lilly today or Ford Motor Company in 1965. If your country’s prosperity in 1980 depended on attracting the mundane footloose manufacturing activities most notably in apparel, footwear, textiles and consumer electronics, your best hope for economic growth was to begin in poverty. The global competition for these footloose jobs was and is hopelessly intense. That is the story of the globe’s middle class. Their prosperity depended on attracting footloose manufacturing jobs from the high-wage countries but they couldn’t compete successfully for those functions against China and other very- low-wage countries. However, the high- income countries in 1980 prospered in the two subsequent decades because their domain of competition was mostly in the rooted functions and because they could derive substantial economic gains from transferring the relatively small numbers of footloose jobs to the low-wage countries. That is not to say that everyone in the high-income countries gained. On the contrary, those workers who found their jobs contested by low-wage far-away workers either had to find a way of escaping that competition through training and education, or they had to accept lower wages and harsher working conditions than they might otherwise have experienced. In other words, we have been here before. Newspaper anecdotes regarding the “offshoring” of mundane service activities like call centers and not-so-mundane activities like writing software have raised again alarms about a Great Equalization. But we have heard “The World is Flat” before, and it didn’t turn out that way. That doesn’t mean to fall asleep at the switch. The liberalizations that created a global labor market for mundane manufacturing caused a massive change in the competitive landscape, and those countries and individuals who were prepared for the change prospered while those who did not had harder times. The vast improvements in telecommunications and the Internet have also caused a massive change in the competitive landscape, whose effects are just

37
beginning to be evident. We would be wise to learn from the first Great non-Equalization to prepare for the next. The lesson of the first is that infrastructure and workforce quality can create deep roots that hold the best jobs firmly in place.
Trade in products is a neighborhood experience
The gravity model :location, location, location
There is very little that we economists fully understand about global trade but there is one thing that we do know – commerce declines dramatically with the distance. It’s not a small world. The distance effect on international commerce is described by what is known as the gravity model, which is one of the first models estimated by economists18, and possibly the only important finding that has fully withstood the scrutiny of time and the onslaught of econometric technique. According to this empirical model, commerce between any two countries is proportional to the product of the masses (GDPs) divided by the distance between them raised to approximately 0.9.19 The message of this gravity model is that the globe is not nearly as small as newspapers and business school curricula suggest.
You can see the powerful reality of the gravity model in Figure 8, which is a scatter diagram comparing the intensity of West German trade in 1985 with the distance to its trading partner. On the vertical axis is a measure of trade intensity: trade with the partner divided by partner GNP. On the horizontal axis is the distance from Germany to the partner. Both scales are logarithmic. If you didn’t think that distance matters much for international commerce, this figure should convince you otherwise. There is a remarkably clear log- linear relationship between trade and distance. An estimated distance elasticity of -0.9 means that each doubling of distance reduces trade by 90%. For example, the distance between Los Angeles and Tijuana is about 150 miles. If Tijuana were on the other side of the Pacific instead of across the border in Mexico and if this distance were increased to 10,000 miles, the amount of trade would drop by a factor of 44. Other things held constant, expect the amount of commerce between Shanghai and LA to be only about 2% of the commerce between Tijuana and LA.
18 See Leamer and Levinsohn(1995) for a brief review. 19 Per the meta-analysis of Disdier and Head (2005). The distance elasticity depends on the product. See Leamer(1994) and Rauch(1999), who offers an explanation in terms of trust and understanding by grouping products: “Organized Exchange Goods,” “Reference Priced Goods,” and “Differentiated Commodities.” The elasticity is higher for some commodities and lower for others.

38
Figure 8 West German Trading Partners, 1985
West German Trading Partners: 1985
0%
1%
10%
100%
100 1,000 10,000 100,000
Distance in Miles To German Partner
Trad
e / P
artn
er G
NP
But, you must be imagining, the force of gravity is getting less, much less. In 1997 Frances Cairncross, a journalist with the Economist, anticipated Friedman’s The World is Flat by proclaiming in her book title The Death of Distance20, and she followed that with The Death of Distance 2.0 in 2001, a paperback version with 70% more material because “In the three years since the original Death of Distance was written, an extraordinary amount has changed in the world of communications and the Internet.”21 The facts suggest otherwise. In my own (1993) study of OECD trade patterns I report that this distance elasticity changed very little between 1970 and 1985 even with the considerable reduction in transportation and communication costs that were occurring over that 15 year time period. Disdier and Head (2005) accurately title their meta-analysis of the multitude of estimates of the gravity model that have been made over the last half-century: “The Puzzling Persistence of the Distance Effect on International Trade.” They find “the estimated negative impact of distance on trade rose around the middle of the century and has remained persistent ly high since then. This result holds even after controlling for many important differences in samples and methods.” The distance effect on trade has not diminished even as transportation costs and communication costs have fallen. “How can that be right?” shoppers may ask themselves, “There surely are a lot more Asian goods on the shelves and racks of stores in the US than there were a couple of decades ago. We have the impression that Shanghai is sitting just beyond the breakwater of the LA harbor.” Keep in mind that the gravity model doesn’t depend only on distance; it has trade proportional to the product of
20 The Death of Distance: How the Communications Revolution Is Changing our Lives, by Frances Cairncross, (2.0 from Harvard Business School) 21 http://www.deathofdistance.com/
39
the GDP’s. It is the product of the GDPs that accounts for the increase in trans-Pacific trade, not a declining effect of distance. Clearly if all the economic mass of the globe were concentrated on a single location, there wouldn’t be any trades across space. According to the gravity model, the greatest amount of global trade would occur if GDP originated half in one location and half at the opposite side of the Earth. That is a pretty good description of the emerging distribution of global GDP. Thus, while it is true that Asian products are crowding the shelves of stores in Los Angeles, according to the gravity model, that comes from economic growth in Asia, not a decline in the effect of distance. What is happening is that growth of the economies in Asia is creating trading opportunities that did not exist before. The globe is not shrinking. Economic activity is dispersing. If you want to see the emerging economic mass in Asia I recommend William Nordhaus’ spinning globe that illustrates by color-coding the locations from which global GDP originates:
http://www.econ.yale.edu/~nordhaus/homepage/homepage.htm
This spinning globe dramatically reveals the very strong clustering of economic activity. Even within the US there are distinct clusters of economic activity. My version of this clustering phenonenom is conveyed by Figure 9,22 which says it matters who your neighbors are. On the horizontal axis is a measure of distance to global GDP suggested by the gravity model.23 On the vertical axis is per capita GDP. This figure indicates that distance to markets has a dramatic effect on GDP per capita. The fall-off in income levels when distance goes from 1000 to 2000 miles is very great. After 3000 miles there is hardly a country with a decent per capita GDP.
22 From Leamer(1997) 23 The measure of distance to markets is D w Di j
jij= ∑ − −( ). /.6 1 6
, where wj = GDPj / ∑ GDPj.

40
Figure 9 Geographical Clustering of High Income Countries
Access to Markets and Per Capita Income: 1960
Trinidad
Mauritius
Venezuela
Uruguay
Australia, New Zealand
0
5000
10000
15000
0 1000 2000 3000 4000 5000 6000 7000 8000 9000
Distance to GDP, 1960
Per
Cap
ita
Inco
me,
196
0
Access to Markets and Per Capita Income: 1990
Singapore
Taiwan
Australia
New Zealand
0
5000
10000
15000
20000
0 1000 2000 3000 4000 5000 6000 7000 8000
Distance to GDP: 1990
Per
Cap
ita G
DP
, 199
0
In 1960 only Australia and New Zealand were able to escape the curse of being far away. Maybe these English-speaking Commonwealth countries are closer to Britain and the US then geography suggests. By 1990, two other countries had escaped the force of gravity, namely Singapore and Taiwan. Part of the explanation for their ability to escape gravity may be gravity itself. There is scarcity value in being different and the gravity model suggests that scarcity needs to be measured locally. For that reason, capital accumulation has a bigger impact if your neighbors are capital-scarce. Indeed, studies of Asian growth by Young (1995) and Kim and Lau (1996) both argue that it was factor accumulation not growth in total- factor-productivity that accounts for the Asian miracles.

41
These countries have had relatively rapid capital accumulation and also relatively large elasticity of output with respect to capital, the former partly induced by the latter. Though we know that geography has had a large and persistent effect on trade and prosperity, we don’t understand why. I am inclined to think that there are two possible explanations. One possibility is that the globe is not getting smaller at all. The contracts that are necessary to exchange most goods require trus t and understanding, but there have been hardly any improvements in the technologies for creating trust and understanding over long distances. We are still animals, and like dogs that don’t recognize the image of another dog on TV, we cannot feel fear and doubt, or their opposites, trust and understanding, unless we are in the same physical space. Speaking of understanding and distance, in a remarkable paper, Blum and Goldfarb(2005) find that gravity applies even to the Internet – US surfers favor foreign websites close to the US.
For websites that do not involve a financial transaction, the distance effect is smaller than the average of the studies in Disdier and Head (2004), with the distance elasticity equal to 0.9%. For websites that involve a financial transaction, the distance elasticity is 1.8%, therefore larger than the average effect in the studies cited above. For taste-dependent websites, the distance elasticity is equal to 3.25%.
Blum and Goldfarb interpret this as a taste effect, with consumers clustered together with similar tastes and with far-away suppliers not really understanding what distant customers desire. “ North American music, for example, is very different from Indian music. Similar stories apply to games and pornography.” The other possibility why the distance effect has been so persistent is that although the earth is has been getting smaller, that doesn’t change much the geography of commerce. In the relentless search for the least-cost location, it doesn’t matter if A is 50% better than B, or 5%, or 0.5%. Still A is the preferred location. Thus, as the cost of doing business over long distances diminishes, the goods are delivered cheaper and faster, but from the same sources.24 Here we need again to make clear the important distinction between movement and mobility. With falling transportation costs the mobility changes but the movement may not. The gravity model measures movement, not mobility. For wages it is mobility (contestability) that matters. As the globe shrinks, wages for footloose work can converge because of contestability, even though the geography of commerce stays the same.25 My bottom line: There are many advantages that children can enter this world with including intelligence, physical power and agility, good looks and caring parents. It also matters where you live.
24 My colleague, Sebastian Edwards, wisely made this point to me. 25 For more on the persistence of the distance effect see Didier and Head(2005). See also Hummels (2001) and Deardorff (2003) for discussion of the role of timeliness in trade patterns.

42
How important is “outsourcing,” really?
In a recent class of 60 Executive MBAs I asked who personally felt the force of competition for their job from India or China. One hand was raised. Then I asked whose companies were interested or engaged in moving jobs to India or China. Two-thirds of the hands were raised. I wonder if they know more about their own jobs than about their co-workers. Though there is a great deal of fuss in the media about the movement of US service jobs to India, the number of US workers affected by outsourcing surely remains low. In response to queries from Congress about the amount of outsourcing that the US has been experiencing, the GAO (2004) issued a first report with the not-very-promising title “Current Government Data Provide Limited Insight into Offshoring of Services” and followed that one up a year later, GAO(2005) with “U.S. and India Data on Offshoring Show Significant Differences.” It may not be perfectly accurate, but here is what the GAO (2005) has to say (BPT = Business, Professional and Technical Services):
“The gap between U.S. and Indian data on trade in BPT services is significant. For example, data show that for 2003, the United States reported $420 million in unaffiliated imports of BPT services from India, while India reported approximately $8.7 billion in exports of affiliated and unaffiliated BPT services to the United States.”26
Compared with an $11 trillion economy, those numbers are small potatoes, the Indian estimate being less than 0.1% of GDP, less than the GDP measurement error by a wide margin. Dividing those two estimates by say, $100,000 in revenue per job, that translates into a low of 4,200 jobs to a high of 87,000. That compares with the US economy that increases payroll jobs on average by almost 200,000 jobs per month. No big problems here that I can see, though there is a difference between movement and mobility.
26 “ At least five definitional and methodological factors contribute to the difference between U.S. and Indian data on BPT services. First, India and the United States follow different practices in accounting for the earnings of temporary Indian workers residing in the United States. Second, India defines certain services, such as software embedded on computer hardware, differently than the United States. Third, India and the United States follow different practices for counting sales by India to U.S.-owned firms located outside of the United States. The United States follows International Monetary Fund standards for each of these factors. Fourth, BEA does not report country-specific data for particular types of services due to concerns about the quality of responses it receives from firms when they allocate their affiliated imports to detailed types of services. As a result, U.S. data on BPT services include only unaffiliated imports from India, while Indian data include both affiliated and unaffiliated exports. Fifth, other differences, such as identifying all services importers, may also contribute to the data gap.”
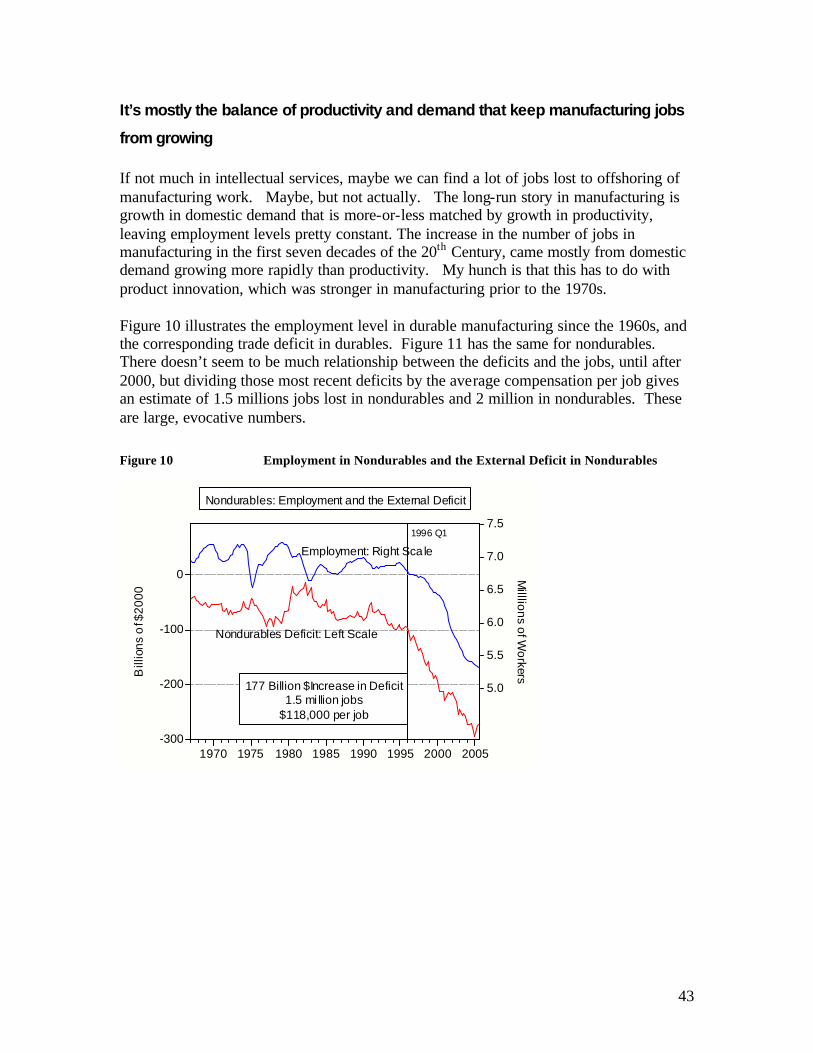
43
It’s mostly the balance of productivity and demand that keep manufacturing jobs
from growing
If not much in intellectual services, maybe we can find a lot of jobs lost to offshoring of manufacturing work. Maybe, but not actually. The long-run story in manufacturing is growth in domestic demand that is more-or-less matched by growth in productivity, leaving employment levels pretty constant. The increase in the number of jobs in manufacturing in the first seven decades of the 20th Century, came mostly from domestic demand growing more rapidly than productivity. My hunch is that this has to do with product innovation, which was stronger in manufacturing prior to the 1970s. Figure 10 illustrates the employment level in durable manufacturing since the 1960s, and the corresponding trade deficit in durables. Figure 11 has the same for nondurables. There doesn’t seem to be much relationship between the deficits and the jobs, until after 2000, but dividing those most recent deficits by the average compensation per job gives an estimate of 1.5 millions jobs lost in nondurables and 2 million in nondurables. These are large, evocative numbers. Figure 10 Employment in Nondurables and the External Deficit in Nondurables
-300
-200
-100
0
5.0
5.5
6.0
6.5
7.0
7.5
1970 1975 1980 1985 1990 1995 2000 2005
Nondurables: Employment and the External Deficit
Bill
ions
of $
2000
Milllions of W
orkers
1996 Q1
177 Billion $Increase in Deficit1.5 mi llion jobs
$118,000 per job
Employment: Right Scale
Nondurables Deficit: Left Scale

44
Figure 11 Employment in Durables and the External Deficit in Durables
-500
-400
-300
-200
-100
0
100
8
9
10
11
12
13
1970 1975 1980 1985 1990 1995 2000 2005
Durables: Employment and the External Deficit
Bill
ion
s o
f $20
00
Milllions of W
orkers
1998 Q1Employment: Right Scale
Durables Trade Deficit: Left Scale
$377 billion increase in Deficit2.0 million job s
$188,000 per job
But before we jump to trade as the driver, better lay out all the possibilities. It could be that a burst in productivity is allowing the few to do the work of the many. And it could be that domestic demand is too weak to allow normal job formation. The level of employment is necessarily equal to domestic demand times the ratio of production to domestic demand divided by productivity (output per worker):
ker/1
**kerWorGDPmandDomesticDe
GDPmandDomesticDesWor =
where domestic demand is equal to GDP + Imports – Exports and the ratio of GDP to domestic demand measures the fraction of demand satisfied from local supply, which gets smaller as the external deficit widens. This is only an accounting identity, and we need to be a little careful in drawing causal conclusions from these numbers, particularly because some of the productivity changes are induced by foreign competition. The trends since 1970 in employment and these three components of the employment identity are reported in Table 2. In durables, domestic demand has been growing smartly at the rate of 5.6% per year but the effect of this strong demand growth on employment has been largely offset by an improvement in productivity at the rate of 5.5% per year. Thus demand growth net of productivity improvement yields a potential growth in employment in durables of 0.1% per year. But from that number we need to subtract –0.5% to account for the trend in the sourcing of supply from foreign locations, leaving a trend downward of employment in durables equal to –0.4% per year. One might be tempted from this to conclude that, but-for the trade deficit, there would have been some slight employment growth in durables while trade pulls that number into negative territory. But the larger story is strong domestic demand growth offset by strong productivity growth.

45
Table 2 Decomposition of Employment Trends
Trends: 1970 to 2005 Durables NondurablesEmployment Growth Rate -0.4% -0.5% Consisting of Growth in Domestic Demand 5.6% 2.6%(-) Growth in Productivity -5.5% -3.0%+ Domestic Sourcing(GDP/Domestic Demand) -0.5% -0.1% The story of nondurables is rather different with weaker domestic demand growth (2.6%) and with productivity growth (3.0%) that outstrips domestic demand, leaving employment growth at –0.4% per year, absent any globalization effect. The globalization effect subtracts another –0.1% from that number, leading to employment in nondurables declining at the trend rate of –0.5% per year, about the same as durables.27
27 A continuation of these long-term trends implies job losses in manufacturing at roughly –0.5% per year, but since the recession of 2001 we have lost fully 18% of payroll jobs. Whence comes that? The table below reports the change in the deviation from trend from 2000 Q1 to 2005 Q2 for employment in durables and nondurables. This table indicates that since 2000 employment in durables has deteriorated by 17.2% relative to trend. That decline in employment is composed of 7.3% loss of work from weakness in demand, 6.8% from unusually strong productivity growth and 3.1% because of the rising trade deficit. For nondurables, the big news is in the productivity number. Job loss in nondurables of 16.3% relative to trend is explainable by a surge in productivity, 17.6% relative to trend. Some of the burst in productivity is a response to greater foreign competition and some of the burst is a ripple effect of information technology investments made in the Internet Rush. The most recent trends may continue by the effect of foreign competition and the Internet investment boom are likely to recede. Decomposition of Job Losses since 2000 2000-2005 Change in Deviation from Trend Durables NondurablesEmployment -17.2% -16.3% Consisting of Domestic Demand -7.3% 2.6%(-)Productivity 6.8% 17.6%Trade (GDP/Domestic Demand) -3.1% -1.3%

46
The bottom line: employment trends in manufacturing are affected a little bit by international trade, but the real story is strong productivity growth pretty much keeping up with the growth in domestic demand. Whooaa. Hold on a minute. I am misleading you. It is these kinds of quantity calculations that have led most economists including Krugman and Lawrence(1993) and Katz and Murphy(1992) to the conclusion that international trade is not much affecting US workers. These folks are my version of Samuelson’s John and Jane Doe. They are ignoring the difference between movement and mobility. They are ignoring the possibility that manufacturing jobs may be contested by low-wage foreign workers but still stay right here in the US. That global contest may be met by a deterioration of wages and working conditions in the US, not a movement of jobs to low-wage countries. Leamer(1998) and Lawrence and Slaughter(1993) and others have conducted empirical studies of the impact of international trade on US wages based on the extreme opposite assumption that contestability is perfect. In these studies, it is assumed that it doesn’t matter if the US is running surplus in apparel, a deficit or has balanced trade. What matters is whether the US competing in the same apparel product markets as the Chinese. Then US apparel wages have to be set to the Chinese level, adjusted for productivity differences. The real bottom line: we do not know the breadth and intensity of global contestability of US jobs, and until we do, we will not have a real handle on the impact of global competition on the US workforce.

47
The US has Extraordinary Advantages in the Use of the Internet.
There is one more thing that is really not flat: the Internet. The US is the primary home of the Internet, and in many ways is the center of the New Economy. Fully 67% of Internet hosts reside in the US (Table 3), and 23% of Internet users ( Table 4) compared with a population fraction of 4.6%. Of course, China and India, because of their huge populations, show up in the list of the top ten homes of Internet users, but my advice nonetheless is: bet on the US. Table 3 Residences of Internet Hosts
Country Population Internet HostsInternet Hosts
Per Capita
Fraction of Global
Population
Fraction of Global
Hosts1 United States 295,734,134 115,311,958 0.390 4.58% 67.27%2 Japan 127,417,244 12,962,065 0.102 1.98% 7.56%3 Netherlands 16,407,491 4,518,226 0.275 0.25% 2.64%4 United Kingdom 60,441,457 3,398,708 0.056 0.94% 1.98%5 Canada 32,805,041 3,210,081 0.098 0.51% 1.87%6 Brazil 186,112,794 3,163,349 0.017 2.88% 1.85%7 Australia 20,090,437 2,847,763 0.142 0.31% 1.66%8 Taiwan 22,894,384 2,777,085 0.121 0.35% 1.62%9 Germany 82,431,390 2,686,119 0.033 1.28% 1.57%
10 France 60,656,178 2,396,761 0.040 0.94% 1.40% Source: http://www.cia.gov/cia/publications/factbook/rankorder/2184rank.html
Table 4 Residences of Internet Users
Country
Internet Users Percent of Own
PopulationPercent of Global
PopulationPercent of Global
Internet Users 1 United States 53.76% 4.58% 22.59% 2 China 7.20% 20.25% 13.36% 3 Japan 44.89% 1.98% 8.13% 4 Germany 47.31% 1.28% 5.54% 5 Korea, South 60.07% 0.75% 4.15% 6 United Kingdom 41.36% 0.94% 3.55% 7 France 36.11% 0.94% 3.11% 8 Italy 31.84% 0.90% 2.63% 9 India 1.71% 16.75% 2.63%
10 Canada 49.11% 0.51% 2.29%

48
The Coming of the Post-Industrial Age Finally, I want to comment on what I think is the big issue. It isn’t globalization or a flat world; it’s technology and the post- industrial labor markets. The US is in the midst of a radical transformation from industrial to post-industrial society. Some of this transition is associated with the movement of mundane manufacturing jobs to low-wage foreign locations, but much of it comes from the dramatic changes in technology in the intellectual services sectors. The policy response to the globalization force is pretty straightforward: we need to make the educational and infrastructure investments that are needed to keep the high-paying non-contestable creative jobs here at home and let the rest of the world knock themselves silly competing for the footloose mundane contestable jobs. The response to the technological trends that are altering the nature of the relationship-based jobs is not so clear-cut. The US transition from an agrarian to an industrial economy that began in the 18th Century was put on hold during the Great Depression but accelerated during both WWI and WWII. Excluding the war years of 1942-45, the transition to an industrial society reached its zenith in the 1950s with 30% of our workforce in manufacturing and 10% in agriculture. The high-growth Kennedy/Johnson expansion of the 1960s kept the jobs in manufacturing at 28%, but the transition to a post-industrial socie ty began in earnest in the 1970s. While jobs in agriculture continued to decline throughout the century, dropping now to only about 1% of our workforce, there has also been a sharp drop in employment in manufacturing in the last three decades, falling in the most recent data (2005) to only 11% of our workforce. The speed of this decline after 1970 from a 28% share to a 11% share in manufacturing is every bit as rapid as the speed in the decline of agricultural jobs in the first seven decades of the 20th Century. This transition to the post-industrial age has consequences that are at least as profound as the transition from agriculture to industry. This will alter the way wealth is created and all that flows from the “means of production,” including politics and social structures.
Marx and The Transition from Agriculture to Industry
Studies of the transition from agrarian age to industrial age hint at what the next transition might entail. Nathan Rosenberg, Inside the Black Box, page 42, offers a cogent view of technology and production in the industrial age:
US Employment Shares in Agriculture and Manufacturing
0%
5%
10%
15%
20%
25%
30%
35%
40%
45%
1900 1910 1920 1930 1940 1950 1960 1970 1980 1990 2000
Agriculture
Manufacturing
Agriculture
Manufacturing

49
“Although, therefore, the manufacturing system achieved a growth in productivity through the exploitation of a new and more extensive division of labor, a rigid ceiling to the growth in productivity continued to be imposed by limitations of human strength, speed and accuracy. Marx’s point, indeed, is more general: Science itself can never be extensively applied to the productive process so long as that process continues to be dependent upon forces the behavior of which cannot be predicted and controlled with the strictest accuracy. Science, in other words, must incorporate its principles in impersonal machinery. Such machinery may be relied upon to behave in accordance with scientifically established physical relationships. Science, however, cannot be incorporated into technologies dominated by large-scale human interventions, for human action involves too much that is subjective and capricious. More generally, human beings have wills of their own and are therefore too refractory to constitute reliable, that is, controllable inputs in complex and interdependent productive processes.” (My italics.) “Relics of by-gone instruments of labor possess the same importance for the investigation of extinct economical forms of society, as do fossil bones for the determination of extinct species of animals. It is not the articles made, but how they are made, and by what instruments, that enables us to distinguish different economical epochs.” Marx, Capital, quoted by Rosenberg, page 40.
Not all tasks can be embodied in equipment
Thus, per Marx, we are what we operate, and what was essential about the industrial age is not what we produced but how we produced it. During the industrial age, Science and Industry collaborated to embody in equipment those tasks that are repetitive, codifiable and programmable, thus freeing the productive process from the caprice of human intervention. Mechanization of work was not limited to manufacturing and occurred also on the farm. But mechanization of services was much more limited. Getting a haircut in 2005 is not much different from getting a haircut in 1850. And having a will drawn up in 1970 was about the same as having a will drawn up in 1900. The mundane physical tasks that have been left to humans require a degree of dexterity that is difficult (expensive) to achieve with a machine, but year after year advances in Science transfer more and more of these functions to machines. Meanwhile, the economic liberalizations over the last three decades have added to the global workforce an enormous number of workers in Mexico, and Brazil and China and India and so on, offering to do the mundane physical tasks at rates of pay that are barely subsistent. Thus globalization and technology have ganged up after 1970 to rapidly reduce the demand for mundane physical labor in the US.

50
Most of the innovations of the Industrial age have made very little encroachment on intellectual tasks, mundane or otherwise. An attorney, an architect, a teacher all did about the same work in 1970 as they did in 1800. Absent innovations in production and communication, one might imagine a globalized post- industrial US in which mundane physical tasks like cutting hair would remain only in the local non-traded sector, and the rest of the jobs would be mixtures of mundane- intellectual tasks (clerks), creative-intellectual tasks (designers and researchers and repairmen) and social/organizing/motivating tasks (managers). But the microprocessor has changed the future of intellectual work, eliminating the mundane-intellectual tasks. Think about an architect. In 1970 the time of a creative architect was partly consumed by the task of rendering the drawings. Some of this work could be done by assistants, but the communication costs were often so high that it made more sense to have the master do the drawings. The personal computer, however, allowed the architect to render the drawings with great efficiency, thus freeing up time to do the creative tasks that the computer cannot ever perform. While for mundane programmable tasks, it is true that “human beings have wills of their own and are therefore too refractory to constitute reliable, that is, controllable inputs in complex and interdependent productive processes,” the opposite is true for creative tasks. It is machines that lack wills of their own and are therefore too obedient to constitute reliable, that is, innovative inputs in complex and interdependent creative processes. Indeed, when I teach data analysis I emphasize the constant struggle between machine and man for control of the process. We data analysts really want to be able to press a button and have the computer do the work, but the creative task of drawing inferences from data always requires a heavy human input, and if, through laziness and seduction, we come to imagine that the computer can think, we will surely be making major misinterpretations of the data. When one starts to lose control and not know if one button on the computer is any different from another, it is wise to shut the computer down and go play a round of golf. The human will be better able to maintain control after a little time off.
Is a computer a forklift or a microphone?
Education may be a solution to the temporary and permanent income inequality problems caused by the increased supply of Microprocessors. We just need to teach everyone how to write computer code. This might work, but it might not. I like to raise some doubts by posing the rhetorical
question; “Is a computer more like a forklift or more like a microphone?” It doesn’t matter much who drives the forklift, but it matters a lot who sings into the microphone. Think about the forklift first. You might be a lot stronger than I, but with a little bit of training, I can operate a forklift and lift just as much as you or any other forklift operator. Thus the forklift is a force for income equality, eliminating your strength advantage over me. That is decidedly not the case for a microphone. We

51
cannot all operate a microphone with anywhere near the same level of proficiency. Indeed, I venture the guess that I would have to pay you to listen to me sing, not the other way round. And I seriously doubt that a lifetime of training would allow me to compete with Springsteen, or Pavarotti. The effect of the microphone and mass media have been to allow a single talented entertainer to serve a huge customer base and accordingly to command enormous earnings. This creates an earnings distribution with a few extremely highly paid talented and trained individuals and with the vast group of slightly less talented working in LA restaurants, hoping someday to hit it big. Thus, opposite to the forklift, the microphone creates a powerful force for inequality. Think Silicon Valley, with extraordinary riches accruing to some, but with the service workers living in their cars because they cannot afford the homes. A computer is both a forklift and a microphone. Clerks in MacDonalds no longer have to be able to read or to compute - they only have to recognize the picture of a hamburger on the cash register. That’s the forklift. It doesn’t much matter who punches the buttons. Thus your intelligence advantage over me is eliminated by the computer, just as your strength advantage was eliminated by the forklift. But for many other operations it matters enormously who types on the computer. One example is computer programming. The vast majority of people are incapable of producing commercially viable computer code. That’s the microphone. It amplifies your natural advantages. Without a computer, an architect’s time is partly consumed by mundane tasks such as rendering drawings. A lawyer’s time is consumed writing and checking sentences in wills. An economist’s time is consumed making data displays. These mundane tasks are now transferred to computer assistants, who listen infinitely more attentively and who carry out the tasks with much greater precision than any human assistant. A talented architect with a computer assistant can serve a much enlarged customer base. A talented attorney, or a talented economist, or a talented radiologist, with computer assistants, can serve much enlarged customer bases. These talented individuals command high wages while the less talented struggle for customers. Computer technology seems therefore to be taking us into a future where there are a few very talented very well-paid people, and the rest of us are doing the mundane computer-assisted tasks which don’t require us to read, write or even think very much. Just push the right button now and then.
In other words, the information revolution may be a powerful force for income inequality by raising the compensation for natural talents and also the interaction between talent and training. It is the interaction between talent and training that is particularly difficult to deal with. If talent and training had additive effects on earnings, then compensatory education for the disadvantaged could be a low-cost solution for income inequality problems. But if training is much more effective for the talented, the talented will naturally receive more of it, and the amount of compensatory training that is needed to equalize incomes may be enormous and a great social waste - think of me and Pavarotti again.

52
Conclusion Here are titles of three books. Based on the titles alone, which do you think would sell the most copies?
The World is Flat The End of Poverty In Defense of Globalization Globalization and Its Discontents
The startling reality is that The World is Flat has been on the New York Times best-seller list forever and is ranked #1 on Amazon on February 21, 2006. Meanwhile, Jeffrey Sachs’ The End of Poverty: Economic Possibilities for Our Time is ranked number 515, which seems like a big number compared with the number 1, but Jagdish Bhagwati’s In Defense of Globalization is ranked 20,602, and Joseph Stiglitz’ Globalization and Its Discontents is ranked 52,196. We economists have great ideas but not great ways of expressing ourselves. It starts with bad titles. This raises the philosophical question: When economists speak, but no one listens, did we say anything? Thus I understand that it doesn’t much really matter what I think. The market has said that The World is Flat is a great book. But just for my own personal amusement, here comes the summary. First of all, metaphorical titles as powerful as The World is Flat really matter. With that title, readers have their fears reinforced, needlessly. The debate about how to handle our economic relations with other countries has already been harmed enough by misleading metaphors. Those who favor high tariffs call it “protection” as if a wolf were lurking beyond our borders ready to devour our jobs. And those who favor low tariffs call it “free” trade, as if paying a couple of more dollars for the shirts and jeans we buy at Wal-Mart amounted to a period of incarceration. Other than the metaphorical mischief, this book is long on anecdotes, interpretations and insight. It’s an eye-opener methodologically because of the clear progress Friedman makes without benefit of the union card we call the Ph.D. in Economics. But he doesn’t get “there”, because, I think, he has little knowledge of the vast amount of work that has been done by economists on these topics. Friedman does get some of the policy response right:
“And it requires a Great Society that commits our government to building the infrastructure, safety nets, and institutions that will help every American become more employable in an age when no one can be guaranteed lifetime employment” p. 277

53
“My vision is to put every American man or woman on a campus” p. 290 But when Friedman calls this program “compassionate flatism” that is the flat that broke this camel’s back. Worse still, this nonsense metaphor is becoming altogether commonplace, filtering into classrooms and boardrooms. We should take better care of our language. On the policy front, Friedman misses the distinction between markets and relationships, and thus misses the potential for policy measures that might facilitate the formation of long-term relationships between workers and employers. We economists do a linguistic disservice when we call a relationship-free, frictionless outcome “perfectly competitive”. The Luddites had it right when they complained that there is nothing perfect about that outcome at all. Frictions are our friends. Frictions give us the peace of mind that we will still have our jobs when we wake up tomorrow. Frictions reduce the chances that one party will try to “hold-up” the other, absconding with the lion’s share of the mutual benefits. Frictions thus give us the confidence to make the relationship-specific investments from which great returns can flow. It’s the friction we call “falling in love” that allows the human species to flourish. I am not endorsing the French solution of permanent jobs for all, which creates a forced one-sided “marriage” between a willing worker and an unwilling employer, without even the benefit of a first “date”. That makes French employers reluctant to marry workers and leaves the French unemployment level unnaturally high. But we should be thinking long and hard about how we can make our “single” workers more “lovable” and what we can do to maintain the “marriages” between employers and employees that are working. 28 Friedman also misses the point that education works well as a treatment for the income inequality that comes from increased global competition, but not so-well for the talent-driven income inequality of the post-industrial age.29 Beyond the fact that no amount of education will allow me to sing like Pavarotti, the well-paid tasks of the post- industrial era involve subtle job-specific tacit knowledge that is impossible to teach with the lecture/library work/exam style of University classes, which works best to transmit codifiable knowledge and rule-based decision-making. That’s training, not education. For tacit knowledge, it’s not that experience is the best teacher. It’s the only teacher. That, by the way, brings us back to the need for frictions. Who would have invested in
28 One obvious thing to do is to remove the burden of health care from the labor contract by providing a minimal level of universal care. Those health care benefits that are still provided by some firms are hard on globally contestable jobs since foreign employers don’t pay them, and they make employers wary of forming long-term relationships with prospective employees as they look into the future and see a mountain of health care costs. Another obvious role for policy is aggressive intellectual property protection. We cannot have relationships between employers and employees based on the knowledge assets they create, if those knowledge assets can be stolen. 29 Frank Levy reminded me to include this explicitly. He might also want me to leave no doubt that, unlike our Treasury Secretary John Snow who has defended CEO pay as “market-determined”, I think there is a difference between Pavarotti whose talent is demonstrable and whose pay is commensurate, versus the super-high-paid CEO whose talent is unclear and whose negotiated compensation bears little apparent relationship to the social product of the activity.

54
20 years of formal education and another 10 years of on-the-job training to become an economist, if they thought the job might disappear when they had finally mastered it? The final third of Friedman’s book is an insightful and lucid discussion of the stress points between the Muslim and the Judeo-Christian world. (You are free to object that I am not competent to review that material.) But: Physically, culturally, and economically the world is not flat. Never has been, never will be. There may be vast flat plains inhabited by indistinguishable hoi polloi doing mundane tasks, but there will also be hills and mountains from which the favored will look down on the masses. Our most important gifts to our offspring are firm footholds on those hills and mountains, far from the flat part of the competitive landscape. Living in the United States helps a lot, and will continue to. But those footholds will increasingly require natural talent. As a byproduct of our search for personal pleasure, we provide our children highly loaded dice to roll at the genetic craps table. Beyond the all- important luck of the genetic draw, it takes the kind of education that releases rather than constrains their natural talent. We send our children to good private schools and then on to UCLA. The rest is up to them. I am sorry to say it that flat way. It’s not an apt metaphor, even though it is a powerful one.
'When I use a word,' Humpty Dumpty said in rather a scornful tone, 'it means just what I choose it to mean--neither more nor less.'
'The question is,' said Alice, 'whether you CAN make words mean so many different things.' 'The question is,' said Humpty Dumpty, 'which is to be master— that's all.'
Lewis Carroll, Through the Looking Glass, Chapter 6

55
References Anderson, J., Wincoop, E., 2004. Trade Costs. Journal of Economic Literature, 42. 691-
752. Autor, David H., Lawrence Katz and Melissa S. Kearney(2006) “The Polarization of the
U.S. Labor Market,” NBER Working Paper 11986 Bhagwati, J. Immiserizing growth: A Geometric note. Review of Economic Studies 25
(1958): 201-205. Bhagwati, Jagdish(2005) “A New Vocabulary for Trade,” The Wall Street Journal, 4
August. http://yaleglobal.yale.edu/display.article?id=6109 Bhagwati, Jagdish(2004), In Defense of Globalization, Oxford University Press. Bhagwati, Jagdish and Kosters, M. (1994), Trade and Wages, Washington, D.C.:
American Enterprise Institute. Blum, Bernardo S. and Avi Goldfarb(2005) “Does the Internet Defy the Law of
Gravity?”, University of Toronto. Blum, Bernardo. and Edward E. Leamer, 2004. Can FTAA Suspend the Law of Gravity
and Give the Americas Higher Growth and Better Income Distributions? in: Estevadeordal, A., Rodrik, D., Taylor, A., Velasco, A. (Eds), FTAA and Beyond: Prospects for Integration in the Americas, Harvard University Press, 539-574.
Borjas, George J; Ramey, Valerie A. “Foreign competition, market power, and wage inequality,” Quarterly Journal of Economics, v110, n4 (Nov 1995):1075-1110.
Cairncross, F. (1997), The Death of Distance: How the Communications Revolution will change our Lives, Orion Business Books, London.
Davis, Donald, and David E. Weinstein(1996) Does Economic Geography Matter for International Specialization?”, NBER Working Paper No. 5706.
Deardorff, A., 2003, “Time and Trade: The Role of Time in Determining the Structure and E_ects of International Trade, with an Application to Japan,” in Stern R. M. (ed), Analytical Studies in U.S.-Japan International Economic Relations, Edward Elgar Publishing Inc.
Disdier Anne-Célia and Keith Head,(2005)“The Puzzling Persistence of the Distance Effect on International Trade,” working paper.
Easterly, William (2001), The Elusive Quest for Growth: Economists' Adventures and Misadventures in the Tropics (Cambridge: MIT Press).
Frankel, Jeffrey; Stein, Ernesto; Wei, Shang-jin(1995) “Trading blocs and the Americas: The natural, the unnatural, and the super-natural,” Journal of Development Economics v47, n1, June, 61-95.
Freund, C., Diana W., 2004. The Effect of the Internet on International Trade. Journal of International Economics 62, 171-189.
GAO Report to Congressional Committees (2004), “Current Government Data Provide Limited Insight into Offshoring of Services” September
GAO Report to Congressional Committees (2005) “U.S. and India Data on Offshoring Show Significant Differences” October.
Goolsbee, A., 2000. In a World without Borders: The Impact of Taxes on Internet Commerce. Quarterly Journal of Economics 115, 561-576.

56
Harrigan, J., 2003. Specialization and the Volume of Trade: Do the Data Obey the Laws? in Choi, K., Harrigan, J., The Handbook of International Trade, Basil Blackwell, London, UK, 85-118.
Heckscher, E. F. (1919), “The effect of foreign trade on the distribution of national income”, Ekonomisk Tidskrift, 21.
Hotelling, Harold, Stability in Competition, Economic Journal, vol. xxxix (1929), 41-57 Hufbauer, Gary Clyde, Globalization Facts and Consequences, March 13, 2001, Institute
for International Economics, http://www.iie.com/publications/papers/paper.cfm?ResearchID=388
Hummels, D., 2001b, “Time as a trade barrier,” Purdue University, mimeo. Jones, R.W. (1967), “International capital movements and the theory of tariffs and trade,”
Quarterly Journal of Economics, 81:1-38. Katz, Lawrence F. and Kevin Murphy (1992), “Changes in Relative Wages, 1963-1987:
Supply and Demand Factors,” Quarterly Journal of Economics, CVII, February, 36-78.
Kemp, M.C.(1966), “The gain from international trade and investment: A Neo-Heckscher-Ohlin approach,” American Economic Review, 56:788-809.
Kim, Jong-Il and Lawrence J. Lau(1996) “The sources of Asian Pacific economic growth.” Canadian Journal of Economics v29, Part 2 (Apr 1996):S448-S454.
Krugman, Paul (1991), “Increasing Returns and Economic Geography,” Journal of Political Economy, v. 99, no. 3, 483-499.
Krugman, Paul (1995) “Technology, Trade and Factor Prices,” NBER Working Paper 5355.
Krugman, Paul and Robert Lawrence (1993), “Trade and US Wages,” NBER Working Paper No. 4478.
Lawrence, Robert and Slaughter, Matthew (1993), "International Trade and American Wages," Brookings Papers on Economic Activity, 161-226.
Leamer, Edward E. (1993), "U.S. Manufacturing and an Emerging Mexico," The North American Journal of Economics and Finance, Vol. 4, No. 1, Spring 1993, 51-89.
Leamer, Edward E. (1994), "Wage Effects of a U.S.-Mexican Free Trade Agreement," in The Mexico - U.S. Free Trade Agreement, ed. Peter M. Garber, Cambridge, Mass.: The M.I.T. Press, 57-125.
Leamer, Edward E. (1996)“Q uestions, Theory and Data,” in Steven G. Medema and Warren J. Samuels, Foundations of Research in Economics: How do Economists Do Economics?, Edward Elgar Publishing Co. pp. 175-190.
Leamer, Edward E. (1998), "In Search of Stolper-Samuelson Effects on US Wages," ,” in Susan Collins, ed., Imports, Exports and the American Worker, Brookings.
Leamer, E. E., (1997). Access to Western Markets and Eastern Effort. in Zecchini, S., Lessons from the Economic Transition, Central and Eastern Europe in the 1990s, Kluwer Academic Publishers: Dordrecht, 503-526.
Leamer, Edward E. (2004) “Immiserizing Outsourcing and Trickle-Up Outsourcing Managing US Knowledge Assets”, Mimeo.
Leamer, E.E. and J. Levinsohn, (1995), “International Trade Theory: The Evidence,” in Grossman G. and K. Rogoff (eds), Handbook of International Economics Volume 3, Elsevier, North-Holland.
57
Leamer, Edward e. and Peter Schott (2005), “The Rich (and Poor) Keep Getting Richer”, Harvard Business Review, April, p. 20
Leamer, E. E., and M. Storper, (2001). The Economic Geography of the Internet Age. Journal of International Business Studies 32, 641-655.
Levy, Frank, and Richard J. Murnane. 2004. The New Division of Labor. Princeton University Press and the Russell Sage Foundation.
Levy, Frank and Ari Goelman (2006) “Offshoring and Radiology” copy. Lösch, A. (1938) The nature of economic regions Southern Econ. J., 5, pp. 71 - 8. Lösch, A.(1944) Die räumliche Ordnung der Wirtschaft. New Haven : Yale University
Press. The Economics of Locution, 1954 Lösch, August. The Economics of Location: A Pioneer Book in the Relations Between
Economic Goods and Geography. Translated from the Second Revised (1944) Edition by William H. Woglom with the Assistance of Wolfgang F. Stolper. New Haven: Yale University Press, 1954.
Olin,Bertil 1933, Interregional and International Trade. Reprinted by the Harvard University Press, 1967.
Mundell, R.M. (1957), “International Trade and Factor Mobility”, American Economic Review, 47,321-35.
Rauch J.E., 1999, “Networks Versus Markets in International Trade,” Journal of International Economics, 48: 7–35.
Rauch, J. E., 1996. Trade and Search: Social Capital, Soga Sosha and Spillovers. NBER working paper 5618.
Rauch, Manes and Vitor Trindade, “Neckties in the Tropics: A Model of International Trade and Cultural Diversity,” NBER Working Paper 11890, http://www.nber.org/papers/w11890
Redding, Stephen and Anthony J. Venables (2003), “Geography and Export Performance: External Market Access and Internal Supply Capacity”, NBER Working Paper No. 9637.
Ruffin, Roy J. “International Factor Movements”, ch. 5 in Ronald W. Jones and Peter B. Kenen, eds., Handbook of International Economics, Vol I, 1984.
Sachs, Jeffrey D. (2003) “Institutions Don't Rule: Direct Effects of Geography on Per Capita Income, NBER Working Paper No. 9490
Sachs, Jeffrey(2005) The End of Poverty: Economic Possibilities for Our Time, The Penguin Press, New York.
Samuelson, Paul A. “Where Ricardo and Mill Rebut and Confirm Arguments of Mainstream Economists Supporting Globalization” Journal of Economic Perspectives—Volume 18, Number 3—Summer 2004—Pages 135–146
Steele, Cherie and Arthur Stein(2002), “Communications Revolutions and International Relations,” in Juliann Emmons Allison, ed., Technology, Development and Democracy, International Conflict and Cooperation in the Information Age, State University of New York Press, pp. 25 – 54.
Stiglitz, Joseph E.(2002), Globalization and Its Discontents, W.W. Norton Company. von Thünen, Johann H. Der isolirte Staat in Beziehung auf Landwirthschaft und
Nationalökonomie, oder Untersuchungen über den Einfluss, den die Getreidepreise, der Reichtum des Bodens und die Abgaben auf den Ackerbau ausüben, Vol. 1, 1826

58
Weber, Alfred W. Theory of the Location of Industries (Chicago, 1929) Williamson, Oliver E.(1983), Markets and Hierarchies : Analysis and Antitrust
Implications, Free Press. Young, Alwyn. “The tyranny of numbers: Confronting the statistical realities of the East
Asian growth experience.” Quarterly Journal of Economics v110, n3 (Aug 1995):641-680.