the world food price spike of 2008 - university of kent · pdf filethe world food price spike...
TRANSCRIPT

THE WORLD FOOD PRICE SPIKE of 2008Colin Thirtle, Imperial College LondonJenifer Piesse, King’s College London
Chris Gilbert, University of Trento – commodities
Jeremy Woods, Imperial College London – biofuels
Tim Josling, Stanford University – trade policyAlan Swinbank, University of Reading – trade policy
Nick Vink, University of Stellenbosch Ferdi Meyer, University of Pretoria – supply response in South Africa/FAPRI model
Phil Pardey and Julian Alston, Minnesota and UC DavisWorld R&D, Technology and Productivity GrowthPeter Street, DEFRA – UK situation

ConsultationsIFPRI – Joachim von BraunWorld Bank – Don MitchellUSDA – Ronald Trostle – Keith CollinsIMF –
FAO – OECD/FAO Agricultural OutlookJosef Schmidhuber – 30/50 forecasts
Moral Hazard?
Chris Gilbert – commodities

A STRUCTURED ACCOUNT OF THE PRICE SITUATION - WITH CAUSALITY
• Long decline in food prices relative to non-agricultural prices
• Huge price spike in 1970s due to oil crisis• 2008 prices are nothing like the 1970s levels
and then prices resumed the long decline• But about 5 million died – action needed• Need to separate the spike factors from those
driving the long term trend (60/40?)• Slow, long run changes do not cause sudden
large price spikes

The Long Fall in Farm Output Prices Relative to All Prices, US Long-Run Time Series (1998 is less than 25% of 1945 price) Doug Gollin and Robert Evenson
0
0.2
0.4
0.6
0.8
1
1.2
1.4
1770 1790 1810 1830 1850 1870 1890 1910 1930 1950 1970 1990 2010
Year
Rel
ativ
e Pr
ice
of F
arm
Goo
ds

Long Run Decline in Food Prices
St4
St3
St1St2
Dt4
Dt2
Dt3
Dt1
Demand, shifts caused by income, population, product innovation
Quantity
Price
Long term decline in commodity prices
Supply, shifts caused by technology, efficiency, scale
St4
St3
St1St2
Dt4
Dt2
Dt3
Dt1
Demand, shifts caused by income, population, product innovation
Quantity
Price
Long term decline in commodity prices
Supply, shifts caused by technology, efficiency, scale
Source: David Hallam, FAO, presentation at University of Cassino


R ea l P rices: B u lk C om m od ities (1957-2008)
0
200
400
600
800
1000
1200
1400
19571960 19631966 1969 19721975 19781981 1984 1987 1990 19931996 1999 20022005 2008
W heat M aizeR ice Soybeans
Source: Adam Prakash, FAO

The 2008 Peak levels and the fallFrom FAO/GVIEWS
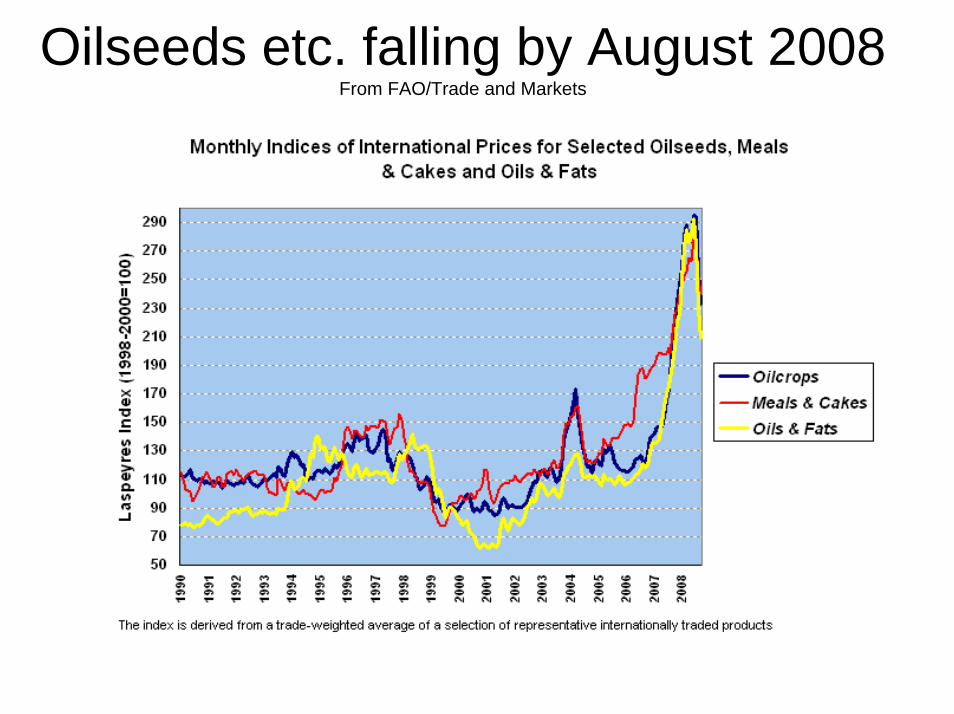
Oilseeds etc. falling by August 2008From FAO/Trade and Markets
FAO

But food followed oil and commoditiesFrom Trostle 2008, USDA

Explaining the Price Spike• World Bank – Don Mitchell – Ethanol
Demand 70% Keith Collins 60%• IFPRI – Joachim von Braun – Asian
Demand 60%• Purdue – Abbot, Hurt and Tyler – Decline
in the US $ - 66%• Chris Gilbert – Speculation and investment
in futures markets – 55%• So we have explained 251% of the
variance without even running a regression
• Thank you

Explanatory power of stock/use ratio
R e la t io n s h ip s b e tw e e n c e re a l s to c k s ra t io s a n d p r ic e s
0
5 0
1 0 0
1 5 0
2 0 0
2 5 0
1 9 8 9 /9 0 1 9 9 0 /9 1 1 9 9 1 /9 21 9 9 2 /9 31 9 9 3 /9 41 9 9 4 /9 51 9 9 5 /9 61 9 9 6 /9 71 9 9 7 /9 81 9 9 8 /9 9 1 9 9 9 /0 02 0 0 0 /0 12 0 0 1 /0 22 0 0 2 /0 32 0 0 3 /0 42 0 0 4 /0 52 0 0 5 /0 62 0 0 6 /0 7
G lo b a l s to c k -to -u s e ra t ioG lo b a l s to c k -to -u s e ra t io e x c C h in aS to c k -to -d is a p p e a ra n c e ra t io fo r m a jo r e xp o rte rsF A O C e re a ls P r ic e In d e x
C o r re la t io n c o e f fic ie n ts :
P r ic e w ith g lo b a l s to c k -to -u s e r a t io : r = - 0 .6 5
P r ic e w it h e x p o r te r s ' s to c k -to -d is a p p e a ra n c e r a t io : r = - 0 .4 7
P r ic e w ith g lo b a l s to c k - to -u s e r a t io e x c lu d in g C h in a : r = - 0 .4 9
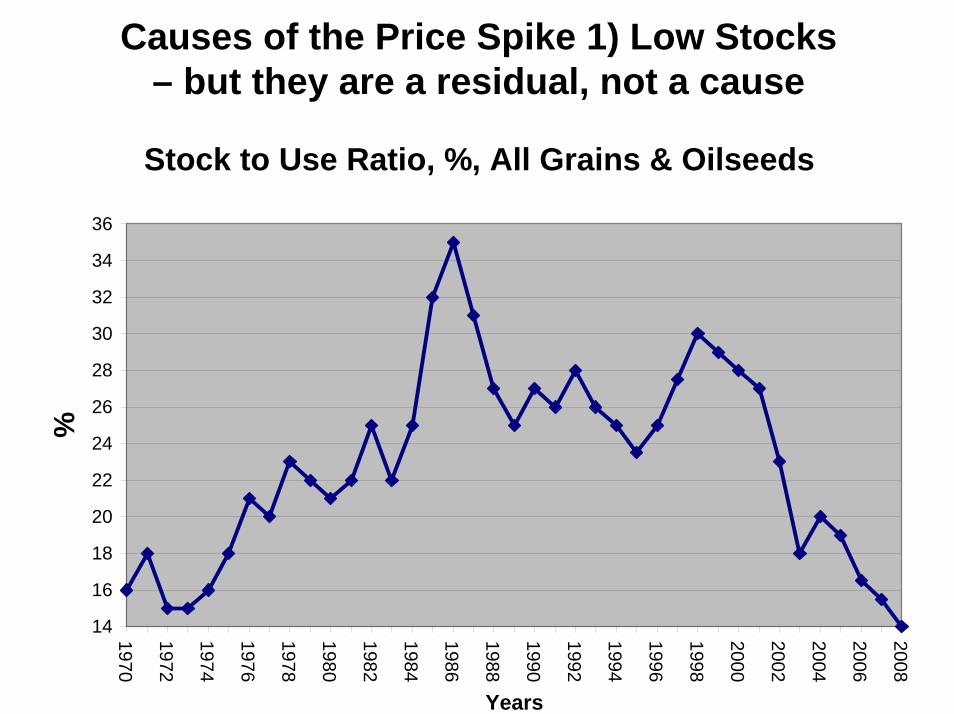
Causes of the Price Spike 1) Low Stocks – but they are a residual, not a cause
Stock to Use Ratio, %, All Grains & Oilseeds
14
16
18
20
22
24
26
28
30
32
34
36
1970
1972
1974
1976
1978
1980
1982
1984
1986
1988
1990
1992
1994
1996
1998
2000
2002
2004
2006
2008
Years
%

Causes of the Price Spike 2) Policies to Increase Demand, Reduce Supply and hence Stocks
• Since the 1990s the EU and USA has had policies such as set aside and decoupling
• Whole idea was to get rid of excessive and expensive stocks
• Add Ethanol and Biodiesel Demand• One third of the US maize crop and substantial
amounts of rape seed• So the lack of stocks is a policy determined
outcome• See Don Mitchell


Causes of the Price Spike 3) Harvest Failures
• Increasing volatility of the weather probably due to climate change
• Long drought in Australia• Floods in the EU and the USA• Further supply reductions• Act of God and/or the polluters?


Causes of the Price Spike 4) Non-food Commodity Markets – Real demand & speculation
• Spot and futures prices for metals, iron ore, building materials and oil rose sooner and faster than food prices
• China and India have reached the point in the structural transformation when numbers in agriculture fall and urbanisation means huge building booms
• With weak stock and housing markets commodities are attractive to speculators
• Plus long term investors such as pension funds, which is new on this scale – Chris Gilbert
• Currency speculation? Especially against the US $?

Causes of the Price Spike 5) Spot and Futures Markets for Food
• With weak stock and property markets speculators and investors are attracted
• Hard to lose betting on price rises when nobody has stocks to destroy your position
• It is a speculative bubble for most crops• Rice is a panic – little change in production or
consumption but panic buying at high prices – but a thin market – only 5% or about 35 mt traded
• Inward looking policies like export bans complete the picture

Causes of the Price Spike 6) Trade restraints in reaction to price rises
Rice is different almost no changes – a panic

Causes of the Price spike 7) Decline in the Value of the US $
• Food items and oil priced in US $, so both rise as the $ declines
• US is major exporter and cheap $ means importers can buy more – which also pushes prices up
• But the $ has dropped only about 20% relative to the Euro and much less relative to Asian currencies
• Not large or general enough to have doubled food prices since 2005 – a minor contributor
• But Purdue disagree – following Schuh and Rausser

Crude Oil Price Indices in Various Currencies, 1980-2008*Source: International Monetary Fund, International Financial Statistics. and Economic Research Service, USDA*
Crude oil prices are normalised to equal 1.0, on average, for 2002.
Abbot, Hurt and Tyler say 66% of the spike is due to the decline in the US$

Is the Price Spike history ? Prices are expected to remain about 40% above 2005 levels
• Markets overshoot and settle back to equilibrium –but how much higher than before?
• Better harvests, some supply response, less destructive bio-fuel initiatives.
• Export bans etc. will end as stability improves• But it is expensive and difficult to rebuild stocks
when prices are high.• Odd situation in which the WTO says
governments should not hold stocks – but the private sector has not stepped in sufficiently

Long run changes that will persist• Not the causes of the bubble – but these will
set the future level and direction of prices• Will food prices continue falling?• Will supply grow faster than demand?• What about energy demand?• Supply side factors • Then Demand

Supply Side Factors 1) Fertiliser and Fuel Prices
• This has not registered fully. The 1974 US food price spike was above 1945 prices
• The link between oil and food then was just supply side - input prices.
• Fertiliser prices have risen more than food prices (capacity?) – so yields will fall – not rise – where does more output come from?
• The technology is based on cheap nitrogen• Gone for good - how will LDCs manage?• Energy efficient, yield increasing technologies?
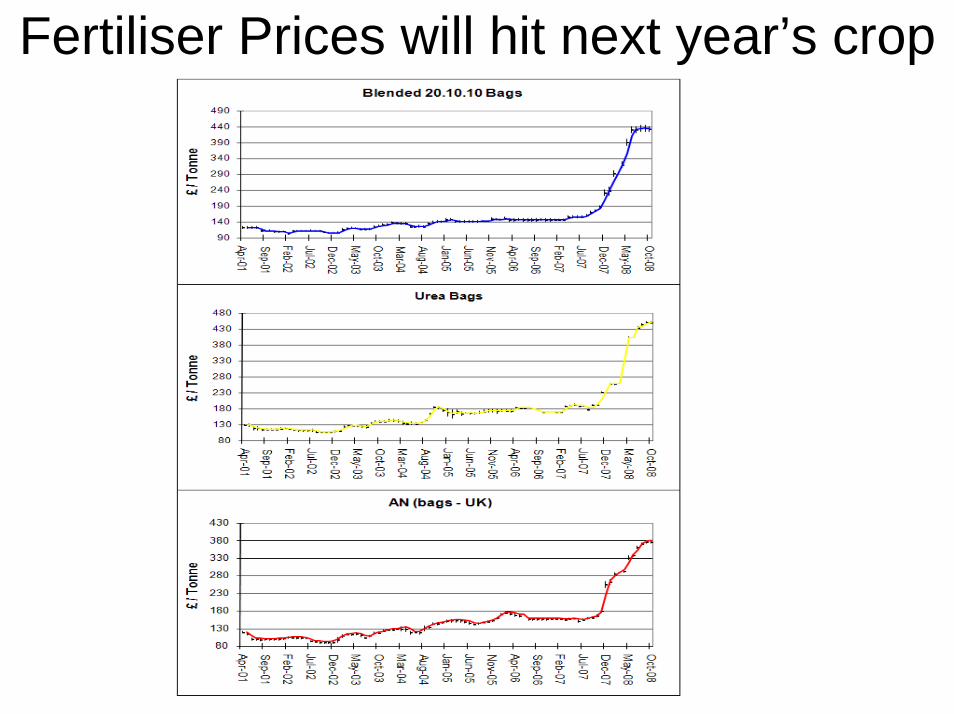
Fertiliser Prices will hit next year’s crop

Supply Side Factors 2) Lack of Investment in Agriculture
• Public R&D expenditures for the high income countries fell from 10,534m in constant 2000 international $ in 1991 to10,191m in 2000.
• Also fallen for SSA • This small fall is minor, but R&D was also
retargeted, away from productivity and towards public interest issues such as the environment, animal welfare and food safety
• Investment on farms has been hit but R&D is the big issue
• The private sector has not taken up the slack • Productivity growth has fallen in most countries and
practically ceased in others like the UK

Growth rates in public agricultural research expenditures, 1981–2000IFPRI, 2008

Supply Side Factors 3) Climate Change
• Increasing volatility• Poorest and most vulnerable countries hit
hardest?

Demand Side Factors 1) Population and Income Growth (in Asia)
• Gradual income growth can’t cause a sudden spike. Both India and China were small net exporters for most food – except China imported 35 mt of soybeans
• In the long run more meat and animal products • Dairy and white meat takes 3 times as much land as
cereals and red meat 7 times• But meat prices had not risen much and dairy prices
had fallen – will rise with more expensive feed • The causality is much more indirectly from demand for
building materials and oil and raising those prices has an impact on food prices.

Energy Consumption (kt of oil equivalent)
0
200
400
600
800
1000
1200
1400
1600
1800
197119721973 1974 1975 1976 1977 197819791980198119821983198419851986198719881989199019911992 1993 19941995199619971998199920002001200220032004
Years
Energy use
ChinaIndia

Demand Side Factors 2) Ethanol and Biodiesel Demand
• This is the fundamental change in the markets• Ethanol in the US was driven by subsidies• Now it will be hard to stop unless it is banned• Chris Hurt at Purdue says that a bushel of corn sells
for .05 times the oil price (1 tonne = 2 x oil price)• With oil at $140 corn hit $7 and they think $200 oil
would mean $10 corn – the ceiling price • Corn, soybeans and wheat compete for land so those
prices move with corn – the floor price • Corn is also the main feed so dairy, chickens and
meat are also linked. Just rice and sugar not linked.• Thus, ethanol demand puts a floor under food prices• Biodiesel extends it to oilseeds – leaves sugar & rice• If true the long fall in the relative price of food is over?

Predictions
• If FAO are right the corn price per tonne should settle at about $140 2005 US $
• If Purdue is right, say the oil price settles at $90 – then the corn price will not go below $180
• But the perfectly elastic energy demand may not kick in if oil price stays below $60
• The fertiliser price is likely to hold food prices up for the next season

