the world bank · afap pension fund administration mercosur south america’s southern cone common...
TRANSCRIPT
Document of The World Bank
Report No: ICR2288
IMPLEMENTATION COMPLETION AND RESULTS REPORT (TF-53298)
ON A
GLOBAL ENVIRONMENTAL FACILITY GRANT
IN THE AMOUNT OF US$6.88 MILLION
TO THE
ORIENTAL REPUBLIC OF URUGUAY
FOR AN
ENERGY EFFICIENCY PROJECT
July 10, 2012
Latin America Sustainable Development Department Country Management Unit for Argentina, Uruguay, and Paraguay Latin America and Caribbean Region
Pub
lic D
iscl
osur
e A
utho
rized
Pub
lic D
iscl
osur
e A
utho
rized
Pub
lic D
iscl
osur
e A
utho
rized
Pub
lic D
iscl
osur
e A
utho
rized
Pub
lic D
iscl
osur
e A
utho
rized
Pub
lic D
iscl
osur
e A
utho
rized
Pub
lic D
iscl
osur
e A
utho
rized
Pub
lic D
iscl
osur
e A
utho
rized
CURRENCY EQUIVALENTS
Exchange Rate Effective April 20, 2012 Currency Unit = Uruguayan Peso (Ur$)
Ur$ 1.00 = US$ 0.0502 US$ 1.00 = Ur$ 19.9
FISCAL YEAR
January 1–December 31
ABBREVIATIONS AND ACRONYMS AFAP Pension Fund Administration MERCOSUR South America’s Southern Cone Common Market BROU Banco de la República Oriental del Uruguay
(state-owned) MIEM Ministry of Industry, Energy and Mining
CAS Country Assistance Strategy MW Megawatt hour CFL Compact Fluorescent Lamp CND Corporación Nacional de Desarrollo NGO Non Governmental Organization CO2 Carbon Dioxide NOx Nitrogen Oxides CPS Country Partnership Strategy NPV Net Present Value DINAMA National Directorate of Environmental
Management OPP Office of Planning and Budget
DNE National Directorate of Energy PCD Project Concept Document DSM Demand Side Management PID Project Information Document ECLAC Economic Commission for Latin America and the
Caribbean PJ Penta Joule (1015 Joule)
ECLM Energy Conservation and Load Management PMU Program Management Unit EE Energy Efficiency SHS Solar Home Systems EPC Energy Performance Contracting SIGA Guarantee fund run by CND ESCO Energy Service Company Sox Sulfur Oxides ESU Energy Savings Unit TA Technical Assistance GEF Global Environmental Facility T&D Transmission and Distribution GHG Green House Gases TOR Terms of Reference GDP Gross Domestic Product TWh Terawatt hour GOU Government of the Oriental Republic of Uruguay UFEE Uruguay Fund for Energy Efficiency GWh Gigawatt hour UNDP Unite Nations Development Program IADB Inter-American Development Bank UNFCCC United Nations Framework Convention on
Climate Change IERR Internal Economic Rate of Return UNIT Technical Standards Institute of Uruguay kW Kilowatt URSEA Electricity and Water Service Regulation Office kWh kilowatt hour UTE Administración de Usinas y Transmisiones
Eléctricas ktoe Thousand tons of oil equivalent WTI West Texas Intermediate ktpe Thousands of tons of petroleum equivalent
Vice President: Hasan Tuluy
Country Director: Penelope Brook Sector Manager: Malcolm Cosgrove-Davies
Project Team Leader: Lucía Spinelli ICR Team Leader Fernando Lecaros

URUGUAY Energy Efficiency Project
CONTENTS
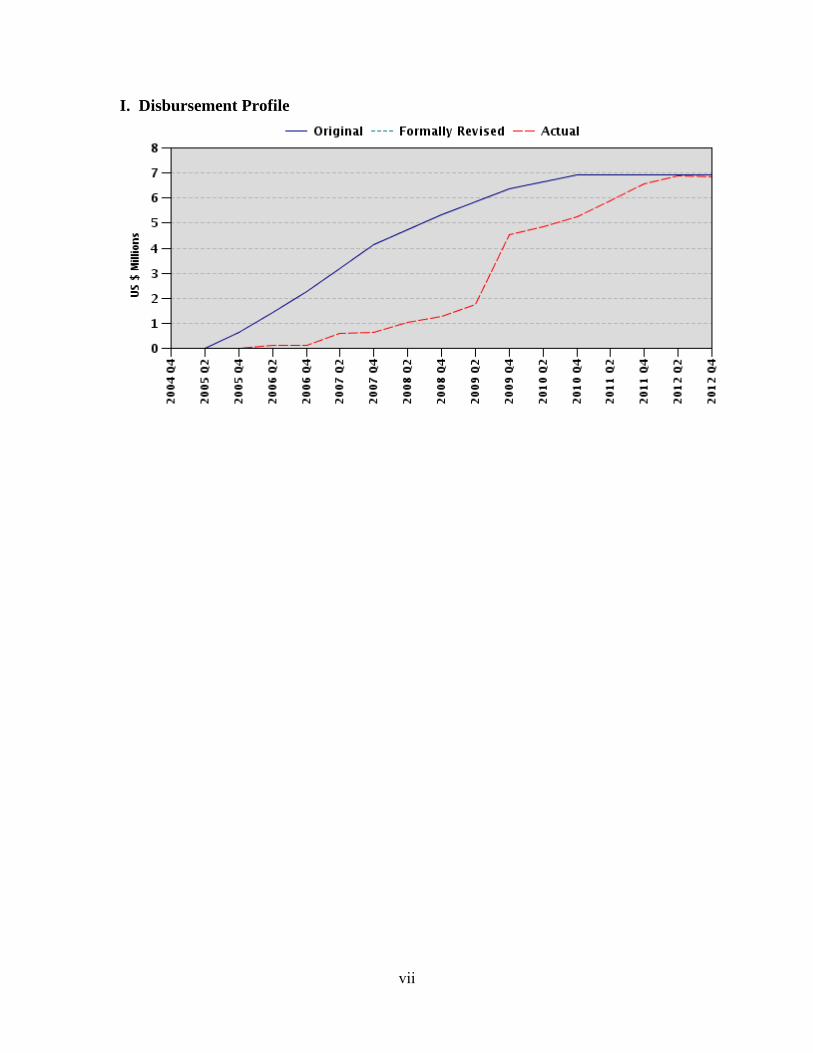
Data Sheet A. Basic Information B. Key Dates C. Ratings Summary D. Sector and Theme Codes E. Bank Staff F. Results Framework Analysis G. Ratings of Project Performance in ISRs H. Restructuring I. Disbursement Graph
1. Project Context, Global Environment Objectives and Design ................................... 12. Key Factors Affecting Implementation and Outcomes .............................................. 43. Assessment of Outcomes .......................................................................................... 11
4. Assessment of Risk to Development Outcome ............................................................. 135. Assessment of Bank and Borrower Performance ......................................................... 13
6. Lessons Learned ....................................................................................................... 147. Comments on Issues Raised by Borrower/Implementing Agencies/Partners .......... 15Annex 1. Project Costs and Financing .......................................................................... 16Annex 2. Outputs by Component ................................................................................. 18Annex 3. Economic and Financial Analysis ................................................................. 25Annex 4. Bank Lending and Implementation Support/Supervision Processes ............ 28Annex 5. Beneficiary Survey Results ........................................................................... 30Annex 6. Stakeholder Workshop Report and Results ................................................... 31Annex 7. Summary of Borrower's ICR and/or Comments on Draft ICR ..................... 32Annex 8. Comments of Cofinanciers and Other Partners/Stakeholders ....................... 36Annex 9. List of Supporting Documents ...................................................................... 37
MAP…………………………………………………………………………………….38


i
Basic Information
Country: Uruguay Project Name: Energy Efficiency Project
Project ID: P068124 L/C/TF Number(s): TF-53298 ICR Date: 07/10/2012 ICR Type: Core ICR
Lending Instrument: SIL Borrower: ORIENTAL REPUBLIC OF URUGUAY
Original Total Commitment:
USD 6.88M Disbursed Amount: USD 6.82M
Revised Amount: USD 6.82M Environmental Category: F Global Focal Area: C
Implementing Agencies: Direccion Nacional de Energía UTE - Administracion Nacional de Usinas y Transmisiones Electricas Cofinanciers and Other External Partners: B. Key Dates
Process Date Process Original Date Revised / Actual
Date(s)
Concept Review: 04/30/2002 Effectiveness: 03/31/2005 01/28/2005
Appraisal: 12/08/2003 Restructuring(s): 03/29/2007 04/13/2010 06/23/2011
Approval: 05/13/2004 Mid-term Review: 05/06/2009 Closing: 06/30/2010 12/31/2011 C. Ratings Summary C.1 Performance Rating by ICR
Outcomes: Moderately Satisfactory Risk to Global Environment Outcome Low or Negligible Bank Performance: Moderately Satisfactory Borrower Performance: Moderately Satisfactory
C.2 Detailed Ratings of Bank and Borrower Performance Bank Ratings Borrower Ratings
Quality at Entry: Moderately Satisfactory Government: Satisfactory
Quality of Supervision: Moderately Satisfactory Implementing Agency/Agencies: Moderately Satisfactory
Overall Bank Moderately Satisfactory Overall Borrower Moderately Satisfactory

ii
Performance: Performance: C.3 Quality at Entry and Implementation Performance Indicators
Implementation Performance
Indicators QAG Assessments
(if any) Rating
Potential Problem Project at any time (Yes/No):
No Quality at Entry (QEA):
None
Problem Project at any time (Yes/No):
No Quality of Supervision (QSA):
Satisfactory
GEO rating before Closing/Inactive status
Moderately Satisfactory
D. Sector and Theme Codes
Original Actual
Sector Code (as % of total Bank financing) Central government administration 6 10 Energy efficiency in Heat and Power 94 90
Theme Code (as % of total Bank financing) Climate change 67 85 Infrastructure services for private sector development 33 15 E. Bank Staff
Positions At ICR At Approval
Vice President: Hasan A. Tuluy David de Ferranti Country Director: Penelope J. Brook Axel van Trotsenburg Sector Manager: Susan G. Goldmark Malcolm Cosgrove-Davies Project Team Leader: Lucia Spinelli Victoria Susan Bogach ICR Team Leader: Fernando Lecaros ICR Primary Author: Fernando Lecaros

iii
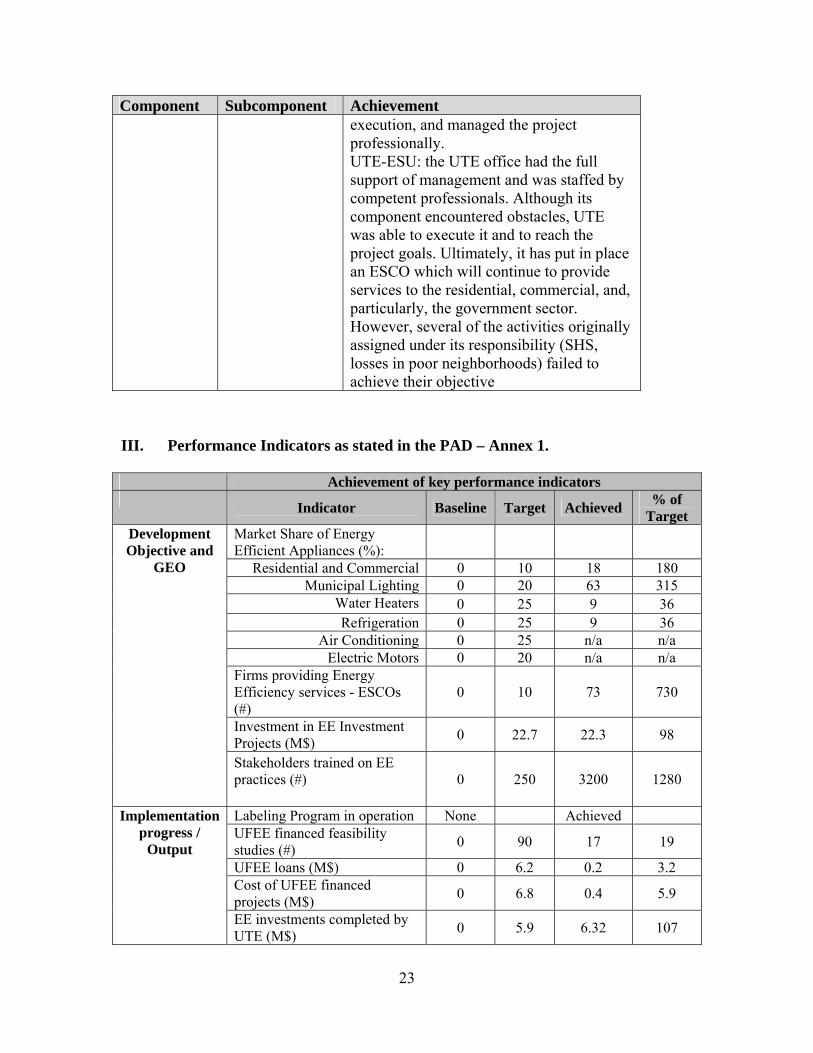
F. Results Framework Analysis Global Environment Objectives (GEO) and Key Indicators(as approved) The development objective of the project is to increase the demand for and competitive supply of energy efficient goods and services, contributing to : (a) increased efficiency of energy use; (b) reduced reliance of the Uruguayan economy on imported energy and fuels; and (c) reduced emission from the energy sector. The Project's global environmental objective (GEO) is to promote energy efficiency through (i) building capacity and know-how among stakeholders; (ii) stimulation of consumer demand; and (iii) promotion of project development and investment financing. Revised Global Environment Objectives (as approved by original approving authority) and Key Indicators and reasons/justifications (a) GEO Indicator(s)
Indicator Baseline Value
Original Target Values (from
approval documents)
Formally Revised Target Values
Actual Value Achieved at
Completion or Target Years
Indicator 1 : Increased market share of energy efficient appliances
Value (quantitative or Qualitative)
Residential and commercial 10%, Municipal lighting 20%, Water heaters 25%, Refrigeration 25%, air conditioning 25%, Electric Motors 20%
Residential and commercial 18%, Municipal lighting 63%, Water heaters 9%, Refrigeration 9%, air conditioning n/a, Electric Motors n/a
Date achieved 01/28/2011 12/28/2011
Comments (incl. % achievement)
Residential and commercial 180%, Municipal lighting 315%, Water heaters 36%, Refrigeration 36%, Air conditioning n/a, Electric Motors n/a
Indicator 2 : At least US$22.7 million cumulative investment in energy efficiency investment projects
Value (quantitative or Qualitative)
22.7 22.3
Date achieved 01/28/2005 12/28/2011 Comments (incl. % achievement)
98%
Indicator 3 : A minimum of 250 stakeholders trained on energy efficiency practices

iv
Value (quantitative or Qualitative)
250 3200
Date achieved 01/28/2005 12/28/2011 Comments (incl. % achievement)
1280%
Indicator 4 : At least 10 companies providing energy efficiency services in Uruguay Value (quantitative or Qualitative)
0 10 73
Date achieved 12/08/2003 01/28/2005 12/28/2011 Comments (incl. % achievement)
730%
(b) Intermediate Outcome Indicator(s)
Indicator Baseline Value
Original Target Values (from
approval documents)
Formally Revised
Target Values
Actual Value Achieved at
Completion or Target Years
Indicator 1 : A voluntary testing and labeling program in operation Value (quantitative or Qualitative)
In operation achieved
Date achieved 01/28/2005 12/28/2011 Comments (incl. % achievement)
The system is operating and for some appliances lables are compulsory.
Indicator 2 : Energy efficiency investment projects completed by UTE Value (quantitative or Qualitative)
US$ 5.9 million US$ 6.32 million
Date achieved 01/28/2005 12/28/2011 Comments (incl. % achievement)
107%
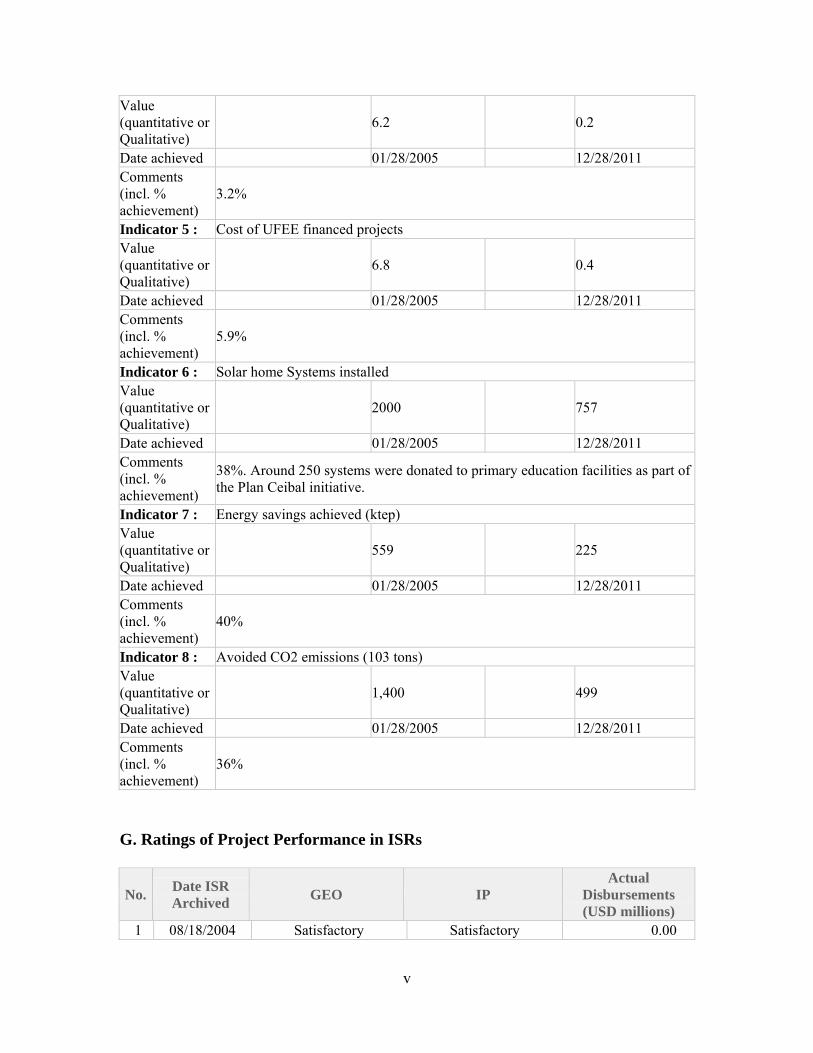
Indicator 3 : Feasibility studies financed by UFEE Value (quantitative or Qualitative)
90 17
Date achieved 01/28/2005 12/28/2011 Comments (incl. % achievement)
19%
Indicator 4 : UFEE Loans
v
Value (quantitative or Qualitative)
6.2 0.2
Date achieved 01/28/2005 12/28/2011 Comments (incl. % achievement)
3.2%
Indicator 5 : Cost of UFEE financed projects Value (quantitative or Qualitative)
6.8 0.4
Date achieved 01/28/2005 12/28/2011 Comments (incl. % achievement)
5.9%
Indicator 6 : Solar home Systems installed Value (quantitative or Qualitative)
2000 757
Date achieved 01/28/2005 12/28/2011 Comments (incl. % achievement)
38%. Around 250 systems were donated to primary education facilities as part of the Plan Ceibal initiative.
Indicator 7 : Energy savings achieved (ktep) Value (quantitative or Qualitative)
559 225
Date achieved 01/28/2005 12/28/2011 Comments (incl. % achievement)
40%
Indicator 8 : Avoided CO2 emissions (103 tons) Value (quantitative or Qualitative)
1,400 499
Date achieved 01/28/2005 12/28/2011 Comments (incl. % achievement)
36%
G. Ratings of Project Performance in ISRs
No. Date ISR Archived
GEO IP Actual
Disbursements (USD millions)
1 08/18/2004 Satisfactory Satisfactory 0.00

vi
2 11/22/2004 Satisfactory Satisfactory 0.00 3 04/27/2005 Satisfactory Satisfactory 0.00 4 07/30/2005 Satisfactory Moderately Satisfactory 0.00 5 11/15/2005 Satisfactory Moderately Satisfactory 0.13 6 06/02/2006 Moderately Satisfactory Moderately Satisfactory 0.13 7 12/12/2006 Moderately Satisfactory Moderately Satisfactory 0.40 8 06/26/2007 Moderately Satisfactory Satisfactory 0.63 9 12/04/2007 Moderately Satisfactory Satisfactory 0.77
10 06/12/2008 Moderately Satisfactory Satisfactory 1.24 11 12/16/2008 Moderately Satisfactory Satisfactory 1.66 12 05/15/2009 Moderately Satisfactory Satisfactory 4.42 13 11/17/2009 Moderately Satisfactory Satisfactory 4.83 14 06/11/2010 Satisfactory Satisfactory 5.19 15 02/22/2011 Moderately Satisfactory Satisfactory 5.92 16 08/10/2011 Moderately Satisfactory Satisfactory 6.55
H. Restructuring (if any)
Restructuring Date(s)
Board Approved
GEO Change
ISR Ratings at Restructuring
Amount Disbursed at
Restructuring in USD millions
Reason for Restructuring & Key Changes Made
GEO IP
03/29/2007 N MS MS 0.58 Modify the Fund in order to provide Garanties instead of Loans.
04/13/2010 N MS S 5.07
(a) extended the closing date from the original date (June 30, 2010) to December 31, 2011, and (b) reallocated grant resources
06/23/2011 MS S 6.38
(a) incorporated the UFEE Guarantee Fund into a national system of guarantees (SiGa), (b) executed a final reallocation of the grant’s resources, and (c) converted sub-loans into sub-grants.
vii
I. Disbursement Profile
1
1. Project Context, Global Environment Objectives and Design
1.1 Context at Appraisal
Uruguay is an Upper Middle Income country with a relatively low population of 3.3 million. It is one of the richest countries in Latin America, with a per capita income of US$9,0101 (above Brazil and Argentina and only slightly below Venezuela and Chile). With a Gini coefficient of around 0.46, Uruguay has the most egalitarian distribution of income in the region; it also has the lowest percentage of people under the poverty line; the official poverty headcount ratio declined from 46.2% in 1986 to 20.5 in 2009.
The 1990s were characterized by strong economic growth—the average rate of GDP growth was 4.1% from 1990 to 1998. This macroeconomic performance was halted by a recession that began in 1998-1999 and peaked in 2002, when the GDP fell 10.8% and the exchange rate increased 93%. When considering the whole 1990-2002 period, the average rate of growth was only 1.4%. Growth started to resume in 2004 when the project was being prepared.
Its per capita electricity use is around 2,400kWh, below Argentina and Venezuela (2,789 and 3,074 kWh respectively) and above Brazil (2,232kWh). Uruguay is poor in hydrocarbons and has reached the development limit of its hydroelectric resources (some of them in association with neighboring countries); plantation biomass is an important source of energy for industrial and commercial enterprises (the forest area increased from 9200km2 in 1990 to 17,400km2 in 2009). The country also has wind resources which were only developed since 2006; the private sector has installed 23MW and the public sector (UTE) has installed 20MW for a total of 43MW.
For electricity supply, and given its poor generation resources, Uruguay adopted a strategy in the late 90s based on imports from Argentina by taking advantage of low prices and large availability in the Argentinean wholesale market. Around 2004 Argentina imposed price controls on natural gas, which led to increasing consumption and reduced supply; as a consequence, the availability of energy for export to its neighbors (Uruguay and Chile) was curtailed, both with regard to natural gas and electricity.
At the time of project preparation (2003–2004), the Uruguayan power system was buying cheap energy from Argentina and running its most expensive units to meet demand and energy efficiency was not on the energy sector’s agenda. Initially, the state-owned Uruguayan electricity company, UTE, did not see an energy efficiency (EE) project as a priority on the grounds of its current energy availability and that an Energy Efficiency operation would reduce demand for its product. However, under circumstances in which it was difficult to supply the load, the project came to be seen as another source of energy, as opposed to a market-destroying mechanism, and UTE endorsed it. During project preparation a significant potential for EE came to light and has been advanced as a result of the project; EE is now an integral component of the power sector’s strategy developed by the Ministry of Industry, Energy and Mining (MIEM) and endorsed by a multiplicity of stakeholders.
1.2 Original Global Environment Objectives (GEO) and Key Indicators The development objective of the project is to increase the demand for and competitive supply of energy efficient goods and services, contributing to: (a) increased efficiency of energy use; (b)
1 World Bank, The Little Data Book 2011, Atlas method.

2
reduced reliance of the Uruguayan economy on imported energy and fuels; and (c) reduced emissions from the energy sector. The Project’s global environmental objective (GEO) is to promote energy efficiency through (i) building capacity and know-how among stakeholders; (ii) stimulation of consumer demand; and (iii) promotion of project development and investment financing.
Key indicators for evaluating the accomplishment of the PDO included:
Increased market share of energy efficient appliances; At least US$23 million cumulative investment in energy efficiency investment projects; A minimum of 250 stakeholders trained on energy efficiency practices; At least 10 companies providing energy efficiency services in Uruguay.
1.3 Revised GEO and Key Indicators, and reasons/justification The GEO and the key indicators were not revised.
1.4 Main Beneficiaries
The main economic benefits of the project derive from energy savings of industrial, commercial, and residential users. The savings come from (i) initial and replication energy efficiency investment projects; (ii) adoption of more efficient appliances and equipment resulting from testing, certification, and labeling activities; (iii) the use of renewable technologies in rural areas; and (iv) a conscious saving of energy associated with media and educational campaigns.
Regarding testing, certification, and labeling, the project addresses a source of market failure due to the incapacity of consumers to choose certain products according to their efficiency/price tradeoffs because of insufficient information regarding the characteristics of the products and the impossibility of testing them on an individual basis.
Two sub-components specifically benefit poor households. The poor neighborhoods sub-project carried out by UTE-ESU reduces electricity use and electricity costs of poor urban households through the use of more efficient lights and equipment. The solar home systems (SHS) target the provision of electricity services to isolated rural households, most of whom are poor. The massive bulb replacement campaign also benefitted poor households.
All components reduce emissions of pollutants, thereby benefitting the population at large by the reduction of CO2 emissions, and the population in the vicinity of specific industries (e.g. power plants) by the reduction of NOx and SOx emissions through reduced health damages. Additional beneficiaries of the project through reduced emissions consist of agricultural enterprises which are less affected by acid deposition.
1.5 Original Components The project was conceived with three main components:
Component 1: Energy Efficiency Market Development. This component to be implemented by the Ministry of Industry, Energy, and Mining (MIEM) would strengthen the market for energy efficient goods and services. The component would support energy efficiency activities in all economic sectors, and would support savings of all types of energy, including electricity and fuels. It included two main activities:

3
Market strengthening. The activities under this component included: (a) policies and regulations for promoting energy efficiency; (ii) awareness creation and capacity building programs; (iii) a labeling and standards program including a voluntary energy efficiency seal for main household appliances, lighting equipment, building thermal envelope and industrial and other equipment and materials; and (iv) standard contractual instruments to support Energy Service Company (ESCO)-based projects.
Uruguay Fund for Energy Efficiency (UFEE). The fund would facilitate financing of energy efficiency projects. It would support (i) fund management services, (ii) a Project Development Facility to provide contingent grants to cost-share feasibility studies, and (iii) a Project Finance Facility to provide term debt to energy investment projects by emergent ESCOs, business, and industry. It was conceived to be managed by a commercial bank on behalf of MIEM.
Component 2: Utility-Based Energy Efficiency Services. This component, to be implemented by UTE, would assist the creation and operation of an Energy Savings Unit within UTE (UTE-ESU). The unit would develop new business activities for UTE in energy efficiency services, especially demand side management (DSM). It would offer services (i) to UTE, (ii) through UTE to its clients, and (iii) directly to clients such as businesses. It was conceived with three separate sub-components:
Establishment of UTE-ESU. Support for technical assistance to advise UTE on establishing the unit and preparing a business plan, and to carry out market surveys. UTE’s own resources would support the costs of staffing, administration and office costs, marketing, training, and monitoring and evaluation of activities of the unit.
DSM and Energy Efficiency Investments by UTE-ESU. These activities were to comprise three initial projects defined during preparation and further follow-up investments to be determined during the early years of operation. The initial pipeline of projects included: (i) provision of efficient lights, water heaters and other energy efficient equipment to residential and commercial customers in the municipalities of Ciudad de la Costa, Paysandu, Colonia and San José; (ii) installation of new municipal lighting equipment in Maldonado, San José, Soriano and Lavalleja; and (iii) reduction of losses, and increased end-use efficiency and payment levels in poor urban areas. The business plan of the ESU would be reviewed and adjusted on an annual basis, to take into account the results of ongoing projects and lessons learned. New projects would be added, as long as they meet the criteria for energy efficiency investments, and the GEF/UTE financing ratio of one to four is maintained.
Solar Home Systems (SHS). This sub-component would include provision of efficient modern energy services to low-income rural customers using SHS.
Component 3: Project Management.
1.6 Revised Components In a project restructuring which took place in 2007, Component 1 was redefined. The UFEE would no longer operate as an investment fund, but would operate as a Guarantee fund for EE projects. This change was implemented due to the increased liquidity in the financial system where UFEE, with limited resources, was found to be unable to place loans. The Guarantee mechanism allowed the project to continue supporting EE with a more responsive tool. As a consequence, the allocations in the Grant Agreement were revised by eliminating those associated with UFEE and transferring them to the Guarantee fund.

4
1.7 Other significant changes
The project underwent the following changes:
A first amendment in 2004 to allow UTE to use commercial procurement procedures;
A second amendment in 2007 relating to the new concept of UFEE, as noted above;
A level-2 amendment in 2010 which (a) extended the closing date from the original date (June 30, 2010) to December 31, 2011, and (b) reallocated grant resources, including a works category to allow for the financing of testing laboratory equipment; and
A fourth amendment in June, 2011 which (a) incorporated the UFEE Guarantee Fund into a national system of guarantees (SiGa) established after the fund was capitalized, (b) executed a final reallocation of the grant’s resources, and (c) converted sub-loans into sub-grants: contingency loans already under the Fund were changed to sub-grants for audit studies to be handled directly by CND.
The following table summarizes the different resource allocation changes:
Grant Allocations (US$)
Original 2007
Amendment2010
Amendment 2011
Restructuring(1) Sub-grants under Part A of the Project1 500,000 — — —
(2) Sub-loans under Part A of the Project1 1,975,000 — — —
(3) Goods under Part B 1,360,000 1,360,000 1,608,114 1,621,993 (4) Consultant’s Services 1,600,000 2,000,000 2,227,799 2,155,009 (5) Fund Management Services 400,000 — — — (6) Incremental Operating Costs 300,000 300,000 404,087 548,282 (7) Unallocated 740,000 740,000 — — (8) Transfers to the UFEE1 — 2,475,000 2,475,000 2,475,000 (9) Works under Part (a) — — 160,000 74,716 Total 6,875,000 6,875,000 6,875,000 6,875,000 1Categories (1) and (2) under Part A of the project became category (8) to capitalize the Fund
2. Key Factors Affecting Implementation and Outcomes
2.1 Project Preparation, Design and Quality at Entry
The project was prepared when a Transmission and Distribution project (P008177) was under implementation, which included among its objectives the promotion of more efficient use of energy. However, UTE, the beneficiary, had found it difficult to invest in activities aimed at improving energy use due to a perceived contradiction of having a power company encourage less electricity consumption. However, improving EE became a prominent subject in the context of a situation of energy scarcity created by the supply conditions resulting from price and quantity constraints on natural gas exports imposed by Argentina. The EE project was therefore conceived as a complement to the institutional components of the Transmission and Distribution project with a view to stimulating UTE, the private sector, and the public sector to invest in energy efficiency improvements.
The project was in line with the CAS at the time, which supported the GOU’s strategy to enhance competition, encourage private sector participation, diversify energy sources, protect the
5
environment, support programs and technologies that promote the efficient supply and use of energy, and facilitate access of the poor to basic services.
The project was prepared on the basis of substantial prior information collected for this purpose, through extensive interviews and research on Uruguay’s industrial sector, which indicated significant potential for energy saving, as well as a base of technical knowledge and interest among a small number of entrepreneurs in providing energy efficiency services. A GEF PDF-B Grant (US$340,000) financed preparation work that included: (i) a market survey and research to estimate the potential for energy efficiency in Uruguay, and the incremental cost analysis; (ii) development of a financial model and draft fiduciary agreement for management of the Uruguay Fund for Energy Efficiency (UFEE); (iii) studies to confirm initial Project pipeline and prepare three initial projects for implementation by UTE-ESU; (iv) development of a business plan for UTE-ESU; (v) workshops to build consensus among all relevant stakeholders, including NGOs; and (vi) development of an operational manual for the project including a monitoring and evaluation (M&E) plan. The supporting study2 for the project was executed in June 2003 and revised in November 2003. It found a potential savings of 1,554ktpe based on a two-year payback in the Industrial, Residential, Commercial and Government sectors.
Despite the large potential, energy efficiency investments were not taking place and the preparation team identified the main barriers, which consisted of (i) lack of demand for energy efficient goods and services, (ii) limited capacity and know-how among key stakeholders, and (iii) lack of project development and investment financing. These factors allowed identifying strategic choices for the project, including (i) increasing awareness of stakeholders, (ii) encouraging the Energy Services Company (ESCO) mechanism, and (iii) facilitating access to finance through the UFEE.
During project preparation project alternatives were identified and evaluated, such as: (i) the business as usual option, which would not materialize efficiency benefits and would not help the GOU in its efforts to comply with commitments under the United Nations Framework Convention on Climate Change; (ii) an alternative consisting of direct investment in large energy efficiency projects which would have been less adaptive and was discarded in favor of the adopted market-based approach that would allow learning by doing, complemented by regulatory reform to encourage energy efficiency; and (iii) a strategy of relying only on the emergent ESCOs to build up capacity, which was considered too risky and was discarded in favor of the adopted multi-track approach, capitalizing on the experience of UTE while supporting the development of ESCOs.
The project was prepared taking into account Bank and GEF experience in other projects such as: the Brazil, Poland, Romania and Croatia Energy Efficiency projects, the Ecuador Power and Communications Modernization and Rural Services project (PROMEC), the China Energy Conservation project, the Uruguay Power Transmission and Distribution project, and the Argentina Renewable Energy in Rural Markets project (PERMER). The Bank’s projects in energy efficiency were rated as Satisfactory at the time of preparation, which provided reassurance that the project, if well designed, would be successful. Despite this, the team did not take measures at the time of preparation for ensuring that a financial organization would be effectively interested in managing a proposed EE fund (acknowledging that such a firm could not have been recruited at preparation without probably entering into a competitive bidding process),
2 Econergy, “Energy Sector and Capital Markets Assessment and Program Design, Uruguay Energy Efficiency Project, June 2003”

6
nor did it delve into the full range of options for implementing such a fund, which would prove to be an important obstacle during implementation.
Finally, the project design took into consideration mitigation measures for risks that would be faced, such as: (i) minimizing the impact of uncertainties of growth and credit (macro level risk) by conservatively estimating the size of the investments addressed by the project, lengthening the project life to six years, and allowing flexibility in the use of the UFEE; and (ii) minimizing the uncertainty of energy pricing through the use of technical assistance being provided, at the time of project preparation, to the GOU to maintain its policy (and past history) of commitment to economic prices.
In conclusion, the project was prepared by taking into account experience in other countries with similar approaches, analyzing alternatives, and designing the project to reasonably mitigate some of the risk factors it could encounter. However, project preparation failed to foresee that commercial interest in promoting a small fund for fostering energy efficiency investments, as the one incorporated under Component 1 - Energy Efficiency Market Development, would elicit little interest from the banking sector, particularly if liquidity conditions in the market were to improve, as they did. In addition, the choice of indicators is difficult to relate to the PDO and GEO. In particular, certain indicators such as reductions in NOx, SOx, and the emission of particulates are not measured consistently and are difficult to trace back to the project. As shown below in section 3.4 (overall outcome rating), the accomplishments of the project can be better explained by a number of outputs which are not directly linked to those chosen at preparation.
2.2 Implementation The project had a slow start due to elections (October 2004) and changes in authorities (March, 2005); effectiveness was declared on March 31, 2005, under the new Government. The new Government maintained stable economic policies which it had inherited, and supported the project. As designed, the project was implemented by assigning responsibilities to MIEM (Component 1) and to UTE (Component 2).
Component 1 – Energy Efficiency Market Development included the UFEE sub-component that was to achieve, together with UTE’s USEE at least US$14 million cumulative investment in energy efficiency investment projects as well as sub-components focused on policies and regulations, promoting energy efficiency, labeling, and the support of ESCOs. The Project initially envisaged the fund as an investment fund for direct co-financing of energy efficiency sub-projects. This structure was adequate when liquidity levels were low, as at the time of Project preparation. Throughout project execution, the PMU and the Bank team actively adapted the fund’s design to a changing environment in the financial sector and to the Fund’s own limitations in terms of size (and hence its attractiveness for commercial banks as a source of funds). Due to abundant liquidity in the market, it was initially converted into a guarantee fund and accordingly restructured in March 2007; because the banks could not use the guarantees as collateral vis à vis the Central Bank, it was further restructured in 2011 and incorporated into SIGA (Sistema Nacional de Garantías para Empresas) which allows the banks to use it as collateral. It is now expected to achieve its objective. Implementation of the fund and its successive transformations was attained by partnering with the National Development Corporation (Corporación Nacional para el Desarrollo—CND). The Fund will be further capitalized with resources from the Energy Efficiency law. It is important to note that the total levels of investments in EE included as targets for the PDO indicator (at least US$22.7 million cumulative investment in energy efficiency investment projects) were reached despite the fact that the Fund has not yet been seen as an appealing source of financing for the SMEs.

7
The other sub-components under MIEM were implemented very successfully (see Annex 2—Project Outputs), with a large number of accomplishments, such as the EE law and its secondary legislation (which were prepared with the support of the EE unit in MIEM), 37 diagnostics in public buildings, nine energy efficiency studies, a labeling program including the development of 49 norms, equipment for testing laboratories, dissemination of EE information using radio and TV, EE promotion for schoolchildren through publications and puppet shows, technical talks and courses, among others. It also supported a contest in which 10 projects costing up to $50,000 were subsidized up to 50 percent as demonstration projects to show the benefits of EE. The project also supported annual prizes for EE projects which provided an incentive to promote EE and were awarded to participating ESCOs. During ICR preparation several ESCOs were interviewed and they all acknowledged that the EE program was highly successful in providing training and in bringing EE to the fore in the public mind. As evidence, one of the ESCOs saw the number of its projects grow from about 35 in 2002-2004 to double this amount in 2006–2010; more strikingly, as evidence of the success of the program in raising the profile of EE, only 23 percent of the projects studied in the first period were implemented, whereas 78 percent were implemented in the second. All this explains why the number of registered ESCOs considerably surpasses the target indicator for the ESCO’s PDO. Even the number of very active ESCOs (19) almost doubles the 10 ESCOs original target.
One of the more successful initiatives in the project consisted of the labeling program. As noted in the preparation section, it addresses a market failure due to the impossibility faced by consumers in judging the efficiency of different devices vis à vis their price. The labeling process involves (a) developing norms to be complied with for different efficiency levels, (b) testing products in order to ascertain their efficiency level, (c) authorizing the producer or the importer to label their product accordingly, and (d) supervising compliance. It started off as a voluntary program, but subsequently became compulsory for certain appliances and lighting implements. In Uruguay this process was implemented with project support, as follows:
The Uruguayan Technical Norms Institute (UNIT), which established the technical specifications for different apparatus (it promulgated 49 norms under the project), and in particular for Compact Fluorescent Lamps (CFLs) and for water heaters (which are predominantly electrical in Uruguay);
Three technical laboratories which were equipped through project resources to test the equipment and which deliver a trial certificate to enable the producer or importer to label it;
The regulator (Unidad Reguladora de Servicios de Energía y Agua—URSEA), which supervises compliance with the labeling system through random market visits.
Currently all CFLs exhibit a compulsory efficiency label to guide consumers in their purchases. As from August 2012, water heaters and refrigerators will also require an efficiency certification label. By establishing a compulsory labeling system, the GOU went beyond what was agreed during project preparation. In addition, after the closing of the project UNIT was hired by the DNE to continue working in the development of norms related to energy efficiency in transport vehicles. Unfortunately, this success in the design and implementation of the labeling system is not fully reflected in the accomplishment of the PDO due to shortcomings in the project’s M&E design which were not addressed in the subsequent restructurings. The PDO specifically included 6 types of appliances but not all have been formally incorporated into the different stages of the labeling system. The norms have been developed by UNIT for all the appliances but rules have not yet been set for air conditioners and electric motors norms. The information provided by the importers was not robust enough to estimate the increase in market share of more efficient appliances.
8
Regarding the UTE component, it was oriented towards establishing a profitable ESCO within the company to market EE services. It included several target activities: (i) all non-industrial markets (residential, commercial, government), (ii) public lighting, including traffic lighting, (iii) loss reduction in poor neighborhoods, and (iv) rural Solar Home Systems (SHS) for low income users.
In the residential sector, the original orientation of the PAD consisted of changing incandescent lamps for compact fluorescent ones (CFLs), and changing water heaters for more efficient ones. UTE initially marketed CFLs by charging them to clients through their electricity bill according to the savings achieved. In 2007 the energy crisis in Uruguay prompted UTE to buy 2.4 million CFLs as a massive way of reducing demand; these were distributed among users at no cost, and under this circumstance the EE project did not make sense anymore. The cost of the lamps bought by UTE comprised a counterpart contribution to the project. Additionally, UTE supported educational campaigns, training of secondary school teachers, and prizes for EE projects. This policy contributed to surpassing the target for increased market share of efficient residential and commercial lighting.
In the commercial and government sectors, UTE oriented its actions towards EE in buildings. UTE provides a diagnosis and the client pays for the implementation of the EE measures. UTE has visited over 100 clients (17 of the municipal sector, 56 private sector, and 55 other public sector), covering a wide variety of projects, such as solar heating, lighting etc. Of these projects around 60 percent were implemented.
In the street lighting area, UTE changed lamps for departmental governments as an ESCO project which pays for itself through energy savings. In the process, UTE found a deteriorated infrastructure which was rehabilitated and public lighting lamps were changed, which increased the costs from $180,000 estimated in the PAD to $800,000. The process started in 2006 and is still being implemented. It is estimated that these investments pay for themselves in about 5 years from installation. These UTE investments helped achieve the target for increased market share of efficient Municipal lighting.
The poor neighborhoods component was conceived as a process through which improvements in the network reduce technical losses, and social actions lead to legalizing connections with the subsequent reduction in consumption due to the price effect. The approach consisted traditionally of refurbishing the community’s electricity network, but little was accomplished through the ESCO in this sense. On the social front, teams of a technician and a social worker visited the neighborhoods to legalize connections. The project managed 5 neighborhoods, and losses would reduce during the first three months but would increase thereafter, as users backslided into illegality. The project was closed around 2009 and wasn’t very successful. It is assumed that a lengthier intervention to consolidate the results would have been required.
The SHS sub-component consisted of the installation of 1,000 SHS acquired by UTE in 2001. They consisted of 50Wp panels and a battery. The project was conceived to include local installation and maintenance, but when installation was bid out it turned out to be far more expensive than originally conceived. UTE decided to do it on its own. The project installed 757 SHS and the excess was donated to primary education facilities as part of the Plan Ceibal initiative to provide computers to grade school children. The relative lack of success in this sub-project was partly attributable to the connection of potential beneficiaries to the grid.
2.3 Monitoring and Evaluation (M&E) Design, Implementation and Utilization Project M&E was designed around the aggregation upwards of sub-project indicators to assess the success of the Project. Data gathering on the identified indicators would be conducted as follows: (a) at the sub-project level, a monitoring system would record data on project activities,

9
and (ii) at the component level, UFEE and UTE-ESU would gather transaction information and benefits related to their project investment and implementation activities.
The Project Management Unit (PMU) within MIEM was responsible for recording, organizing, and presenting results from the different components, including the Standards and Labeling Program, and the Training and Education Programs, and for gathering the information for regular review of project monitoring indicators.
The key performance indicators were tracked and recorded by the PMU (see Section 3.2 for information on achieving the key PDO indicators goals). The M&E framework for the project included some implementation progress indicators that were difficult to obtain with reasonable resources. For example, the indicator related to reduce emissions of Sox and NOx particles required data base information from environmental authorities, which was not produced. Had these deficiencies been addressed during the project’s restructurings, the successful outcomes would have been more precisely captured.
Project monitoring and evaluation was accomplished formally by hiring an auditing firm for the financial aspects of the project and a consultant for the technical aspects. The auditing firm was PriceWaterhouseCoopers and the consulting firm was Mercados Energéticos. The latter produced two reports (in 2010 and 2011) covering years 2008 and 2009; the studies determined a methodology and its application to assess (i) the penetration of efficient equipment in the market, (ii) the incidence of labeling, (iii) the effectiveness of training and educational activities related to EE, and (iv) the savings and emissions reductions resulting from the implementation of EE projects. The studies also determined procedures to follow-up the information related to ESCOS and the EE unit of UTE. Together with the evaluation and tracking of project indicators, the Mercados reports provided a methodology for monitoring the project, which was applied by the PMU.
2.4 Safeguard and Fiduciary Compliance
Financial Management. The Project complied reasonably well throughout its life with prescribed FM arrangements and Bank requirements, such as acceptable periodic IFR reporting and up to date accounting records. Those arrangements provided reasonable assurance that the GEF funds were used for the purpose intended. Project transactions were mainstreamed in the PIU Financial Management Information System of MIEM, and the UTE Accounting Systems. Moreover, the project transactions, subject to the external oversight of the Tribunal de Cuentas de la República del Uruguay (TCR), showed unqualified (clean) audit opinions. Audit reports were reviewed and always deemed acceptable by the Bank. TCR has started the application of audit procedures for the audit of year 2011. The project audit report for 2011 is expected to be received at the Bank within the due date or with some minor delay.
Procurement. The organizational structure for project management and procurement activities proposed at appraisal was kept along project implementation. MIEM’s Project Management Unit (PMU) and UTE-USE – the Energy Savings Unit created within UTE to implement one project component - were established and staffed - including procurement capacity - and the procurement documents for the first year's activities were complete and ready for project implementation, as effectiveness conditions. To accelerate the provision of modern energy services based on solar panels to low-income dispersed rural populations, GEF resources were allocated to the retroactive financing of about 1,000 solar home systems (SHS) acquired by UTE following Bank's procurement rules.
The MIEM’s PMU was responsible for contracting works, goods and services, including consultant services, for Components 1- Energy Efficiency Market Development - and 3 - Project Management Component - while UTE-USE was responsible for procurement activities of

10
Component 2 - Utility Based Energy Efficiency Services - with the support of the Acquisitions and Contracts Department of UTE. Both units were successful in discharging their responsibilities, which included carrying out procurement activities from the preparation of TORs and technical specifications to supervision of contract’s execution.
Professional capacity of the staff involved in procurement activities along project execution, as well as the organization of the implementation units, were deemed adequate. Procurement plans were realistic and of satisfactory quality. MIEM and UTE used SEPA for planning and monitoring acquisitions and the ex-post reviews found that procurement activities were consistent with the information registered in SEPA. Both agencies published procurement announcements on their WEB sites, in addition to UNDP, dgMarket, SICE (Sistema Integrado de Compras Estatales), local newspapers and specialized publications, and also directly invited potential suppliers of goods and services.
Both agencies followed the requirements of the Bank procurement guidelines and the Grant Agreement, with the exception of minor deviations identified during Bank procurement supervision missions. A lesson learned was the need to provide more intensive training in procurement matters to the project implementation units, as well as the national agencies interacting with them, such as the Tribunal de Cuentas, the national auditing agency. Final project procurement rating was moderately satisfactory.
Safeguards. The project was classified as Environmental Category F (Financial intermediary assessment). No safeguards were triggered by the project and all the subprojects to be guaranteed by the UFEE needed to be category B or C in order to be eligible; ESCOs and other project sponsors were held responsible for assuring Environmental Compliance. Environmental effects from the project are positive, by contributing to reduce emissions and reducing the risks of global warming.
2.5 Post-completion Operation/Next Phase The project facilitated the transition from a situation where there was practically no knowledge of energy efficiency, including UTE, to the present condition where EE plays an important role in the National Energy Strategy and a number of private ESCOs are in operation and sustaining themselves commercially. The institutions created through the project, such as the certification laboratories, are expected to maintain themselves financially through the testing of new products. The same holds for the other organizations involved in the labeling process. Regarding the UFEE, it is expected that more projects will materialize now that it is part of the SIGA. In addition, a share of the resources from the EE Law will be assigned to the UFEE in order to assure its continuity. Regarding the educational aspects, as well as the dissemination of EE material, it has achieved its purpose and teachers prepared through the project are expected to disseminate its main ideas. Finally, the project output which most contributes to project sustainability is the EE law of September, 2009, which provides a legal basis for the National Energy Efficiency Plan, and creates the Uruguayan Energy Efficiency and Savings Trust Fund for providing financing technical assistance in EE, promoting EE, financing investment projects related to EE, and supporting research and development related to EE. The Fund is by law under the management of CND. Secondary legislation complementing and interpreting the EE law was issued in March 2012 through a Presidential Decree which provides the full procedures for putting the fund in place and its capitalization through public monies (0.13 percent of total energy sales, including oil and gas, and power). Consequently, EE initiatives are assured long term sustainability as an outcome of the project.

11
3. Assessment of Outcomes
In today’s context EE has acquired a high profile in the Uruguayan energy sector as a proven means of rationally managing energy use, complementing and including initiatives in the power sector such as demand-side management (DSM). The country has been able to address the energy shortages which emerged during project preparation (2004) by installing emergency units and developing renewables.
3.1 Relevance of Objectives, Design and Implementation
The price of West Texas Intermediate (WTI) oil in 2004, at the time of project preparation, was $43 per barrel; in early 2012 it is $105 per barrel. The energy bill for a country without any hydrocarbon reserves, such as Uruguay, is enormous and seeking to maximize efficiency within economic limits is a relevant objective from the country’s point of view. This was explicitly acknowledged in the 2005–2010 CAS where risks associated with energy dependence and programs for reducing losses and increasing efficiency are supported. The 2010–2015 CPS emphasizes facilitating availability and acquisition of energy efficient goods and services, as supported by the project.
3.2 Achievement of Project Development Objectives and Global Environmental Objectives
The four indicators for Project Development Objectives were:
At least US$23 million cumulative investment in energy efficiency investment projects;
A minimum of 250 stakeholders trained on energy efficiency practices;
At least 10 companies providing energy efficiency services in Uruguay.
Increased market share of energy efficient appliances;
The achievement of the indicators was as follows:
At least US$22.7 (exact target) million cumulative investments in energy efficiency investment projects. It is estimated that the project supported cumulative investments of around US$22.3 million, thereby achieving 98 percent of the target.
A minimum of 250 stakeholders trained on energy efficiency practices. Through its different educational activities, including workshops and seminars for professionals as well as training of teachers in schools, the project vastly exceeded the initial goal of 250 trained stakeholders: there are an estimated 3,200 trained stakeholders.
Firms providing Energy Efficiency Services (ESCOs). The target for this indicator was to have ten ESCOs in operation by the end of the project; the target was vastly exceeded, as there are 73 ESCOs registered and at least 19 ESCOs actively in operation.
Increased market share of energy efficient appliances. This indicator was broken down into six components with their corresponding target market share: residential and commercial (10%), municipal lighting (20%), water heating (25%), refrigeration (25%), air conditioning (25%), and electric motors. Of the six components, two (residential and commercial, and municipal lighting), exceeded the target by factors of 1.8 and 3.1; two components (water heaters and refrigeration), accomplished 36 percent of the target; and two components (air conditioning and electric motors)

12
failed to achieve any measurable progress. UNIT norms have been developed for air conditioning and electric motors but as indicated before, the whole labeling system is not yet in place for these two appliances. The average achievement of this indicator would be around 45 percent.
3.3 Efficiency
An economic analysis was performed to evaluate (a) direct benefits from GHG reductions, and (b) direct benefits from CFL introduction through UTE. Additionally, a counterfactual analysis was documented based on recent studies of energy efficiency in Uruguay. The direct benefits of GHG reduction yielded a B/C ratio of 0.96 to 1.4 depending on the price of carbon certificates, including the totality of the GEF grant as a cost. The direct benefits of the introduction of CFLs through UTE yielded a NPV of 2.9M$ at 12 percent discount, and an EIRR of 26 percent. The counterfactual analysis over 1970–2008 did not yield a definitive endorsement of the effectiveness of EE due to the mix of different incentives and technological progress (e.g. price increases of fuel and the improvements in efficiency in the transport sector, which was not covered by the project).
3.4 Justification of Overall Outcome Rating Rating: Moderately satisfactory This rating is closely linked to the achievement of the project development indicators shown in section 3.2, and is justified by the full (or in excess) accomplishment of three of them. As noted above, the first, second and third indicators fully achieved and in two cases vastly exceeded their targets; the fourth indicator was partially achieved but failed to reach the goals set out for air conditioning and electric motors. It must be noted that the latter are the least significant in terms of relative improvement to overall energy efficiency, whereas lighting, water heating, and refrigeration are the most effective in this respect.
3.5 Overarching Themes, Other Outcomes and Impacts
(a) Poverty Impacts, Gender Aspects, and Social Development The project improved the networks in low income neighborhoods through the UTE-executed component and provided benefits to consumers at large with the CFL distribution program, which included customers of UTE in poor areas.
(b) Institutional Change/Strengthening The institutional consequences of the project were significant, particularly concerning the adoption and putting in place of the EE law (with proprietary resources) which provides a means for supporting EE initiatives far into the future. The project was also instrumental in changing UTE’s orientation from a narrow perspective of selling electricity to a broader one of providing electricity services under economic conditions to benefit the customer. This included Demand Side Management actions and all of the activities associated with the UTE-ESU, which will be in operation beyond project closure and can be expected to implement a large number of projects benefitting public sector users.
(c) Other Unintended Outcomes and Impacts None identified.
3.6 Summary of Findings of Beneficiary Survey and/or Stakeholder Workshops (optional for Core ICR, required for ILI, details in annexes)

13
Not applicable
4. Assessment of Risk to Development Outcome Rating: Low The development outcome of the project is to raise the profile of EE so that it contributes to improving the delivery of energy services in Uruguay. Although there were particular physical outputs from the project, it can be characterized primarily as seeking behavioral change through better education and by opening up business opportunities for EE initiatives. In this sense there is little risk that the lessons of the project will be forgotten and, in fact, they will be continuously reinforced by everyday results, such as the labels on CFLs, water heaters, and eventually other appliances. In addition, as mentioned below, an important number of ESCOs have been strengthened and are working on EE on a daily basis.
5. Assessment of Bank and Borrower Performance
5.1 Bank (a) Bank Performance in Ensuring Quality at Entry Rating: Moderately Satisfactory The Bank prepared the project meticulously, specifying its functioning and its expected results. However, from an ex-post point of view, the problems encountered with UFEE point towards insufficient preparation insofar as a stronger effort towards involving financial institutions into the project during the design phase (some effort to do this took place, but it was insufficient). It also proposed a number of progress indicators which were difficult to monitor and were not directly linked to the objectives.
(b) Quality of Supervision Rating: Moderately Satisfactory The Bank followed the project closely and was responsive to the client’s needs. Supervision missions were programmed regularly and allowed a close monitoring of program results. The Bank had a proactive attitude, restructuring and amending the Grant Agreement when required. The restructurings responded mainly to the events surrounding the UFEE and the need for more time to reach operational status. All other activities that did not require any specific amendment were also supported by the bank team, assuring the achievement of the PDO indicators. However, the project team and the Bank did not consider updating the targets of the implementation progress indicators to better reflect project status and updating the list of appliances under the first PDO indicator to better reflect the success of the labeling component.
(c) Justification of Rating for Overall Bank Performance Rating: Moderately Satisfactory This rating combines the lending and supervision ratings.
5.2 Borrower
(a) Government Performance Rating: Satisfactory The Government supported the project by hosting the PMU in MIEM and by providing competent staff during project implementation. There was notably little staff rotation which allowed continuity in implementation with no political interference. A major contribution of Government to project success was through espousing and passing the EE law through Congress, and developing its secondary legislation which provides resources for an effective and sustainable support to EE initiatives.
14
(b) Implementing Agency or Agencies Performance Rating: Moderately Satisfactory PMU: as noted above, it was staffed with competent and dedicated personnel who tracked the project, provided twice-yearly performance reports, assisted in the preparation of the different laws and regulations, coordinated the actions of multiple agencies involved in project execution, and managed the project professionally.
UTE-ESU: the UTE office had the full support of management and was staffed by competent professionals. Although its component encountered obstacles, UTE was able to execute it and to reach the project goals. Ultimately, it has put in place an ESCO which will continue to provide services to the residential, commercial, and, particularly, the government sector. However, several of the activities originally assigned under its responsibility (SHS, losses in poor neighborhoods) failed to achieve their objective. The UTE-ESU team was entirely financed by UTE.
(c) Justification of Rating for Overall Borrower Performance Rating: Moderately Satisfactory This rating reflects the Government, PMU, and UTE performance.
6. Lessons Learned.
Sustainable Energy Efficiency interventions require an integral approach and working together with a multiplicity of actors. Having on board all the players since the beginning is a useful strategy. Preparing an EE project requires putting in place agreements and working closely with multiple agencies and institutions. This was accomplished since the design stage by informing the agencies with respect to the project and to the role they were expected to play and by organizing meetings of the Energy Efficiency Committee which incorporated staff from all these agencies. In the case of the present project, all this interaction was facilitated by the active role of the PMU, the size of the country and having all pertinent agencies in Montevideo.
Outreach activities play an essential role in raising Energy Efficiency awareness, understanding this role is not always easy from a traditional energy sector point of view. One of the main objectives of an EE project is to raise awareness with regard to EE in order to promote changes in consumer behavior. In the UY project this was achieved by seeking public support to disseminate information on EE at different levels (schools and the general public) and different media (such as TV/radio spots) complemented by publications and courses. These types of activities are usually not part of the common range of activities developed by an Energy Agency. Business as usual is more oriented towards hard interventions. The success of this particular experience was based in the early engagement of technical expertise in this area, together with a strongly committed PMU and leverage to implement well designed outreach activities.
The variety and the specificity of EE activities generate procurement challenges. An EE project might finance a multiplicity of relatively small activities range from hiring studies, buying and installing equipment, hiring ESCOS to do energy audits, to design and publishing books, financing theater plays for kids and the participation in multiple expositions and congresses. Adapting all this variety of activities to WB procurement Guidelines, especially in a small country can became a challenge. Upfront planning and a flexible design of contracts can help dealing with these issues.
International cooperation can leverage project results. The Uruguay EE project is a good example of how teachings from other agencies and interactions with other countries can be incorporated into the learning process for EE implementation. At different moments in project execution the PMU was invited (and financed) to take part in activities with a wide variety of

15
agents, including ECLAC, the Spanish cooperation organization, JICA and the German Chamber of Commerce which allowed interchanging experiences, attending courses and organizing training and visits to projects implemented elsewhere. All this interaction helped increased the leverage of the project and opened the door for new investments. For instance, the Japan cooperation is financing a concentrated solar plant in Salto Grande.
As reflected in the borrower evaluation report, in the Uruguayan context some procurement procedures and administrative measures became an issue.
Contracting could be improved. In general, contracting procedures took at least 150 days, and personnel contract renewal took at least 120 days;
Purchases should be oriented towards the reduction of costs and risks. Procurement training should take place prior to the initiation of activities, including the Comptroller’s office (Tribunal de Cuentas) in charge of overseeing public resource expenditures;
Reformulating the purchasing procedure to conform to the Bank’s norms was a lengthy procedure; unifying criteria and training in this respect should be emphasized;
Avoiding changes in procurement officers. During the project there were changes of procurement officers and changes of criteria which delayed numerous processes;
Challenges to contract awards should be dealt with in a way to conciliate local norms and Bank norms. Training encompassing the Comptroller’s office staff would help in this sense (see above).
If two agencies are involved, working with two implementing agencies seems simpler but that is not necessarily the case for all administrative aspects if not all the precautions are taken. The project had two implementation teams, one in MIEM and another one in UTE. Each unit had an account but the special account was managed only by MIEM, generating some difficulties for both agencies.
7. Comments on Issues Raised by Borrower/Implementing Agencies/Partners (a) Borrower/implementing agencies The beneficiaries provided two comments: (i) the UTE SHS component was less successful because in many cases the grid connected some of the potential beneficiaries, and (ii) the poor neighborhoods component of UTE may have required a prolonged intervention to have sustainable results.
(b) Cofinanciers
(c) Other partners and stakeholde
16
Annex 1. Project Costs and Financing
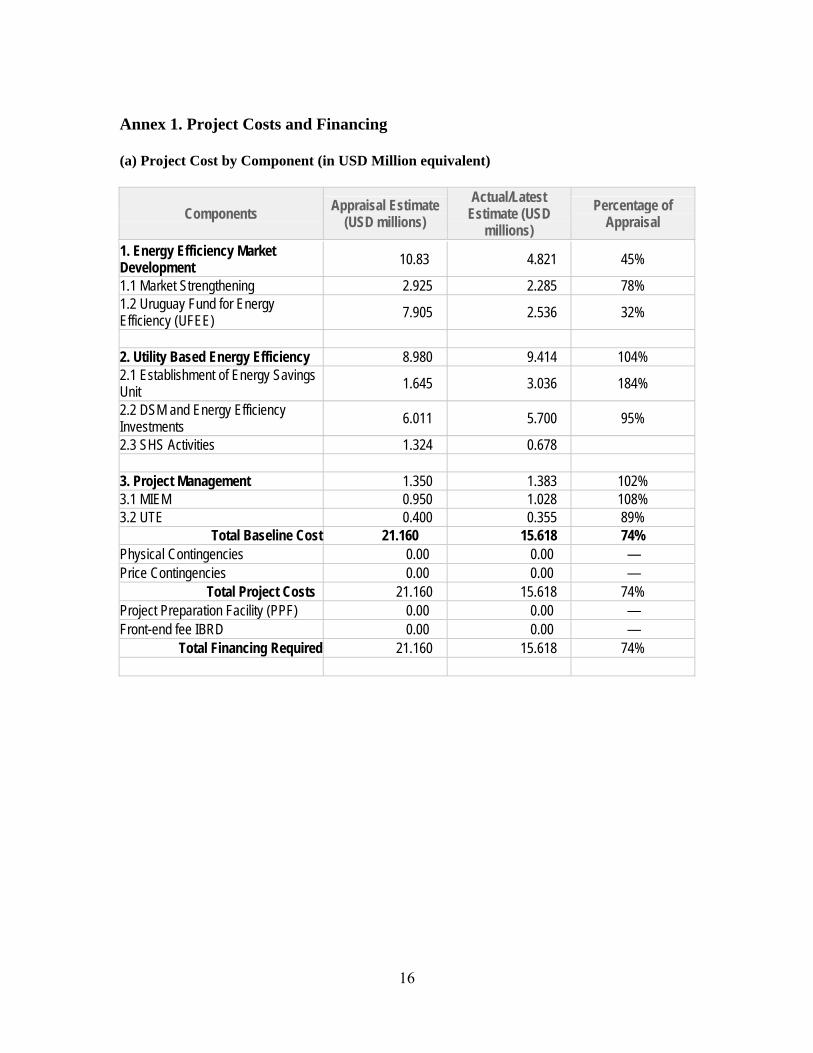
(a) Project Cost by Component (in USD Million equivalent)
Components Appraisal Estimate
(USD millions)
Actual/Latest Estimate (USD
millions)
Percentage of Appraisal
1. Energy Efficiency Market Development
10.83 4.821 45%
1.1 Market Strengthening 2.925 2.285 78% 1.2 Uruguay Fund for Energy Efficiency (UFEE)
7.905 2.536 32%
2. Utility Based Energy Efficiency 8.980 9.414 104% 2.1 Establishment of Energy Savings Unit
1.645 3.036 184%
2.2 DSM and Energy Efficiency Investments
6.011 5.700 95%
2.3 SHS Activities 1.324 0.678 3. Project Management 1.350 1.383 102% 3.1 MIEM 0.950 1.028 108% 3.2 UTE 0.400 0.355 89%
Total Baseline Cost 21.160 15.618 74% Physical Contingencies 0.00 0.00 — Price Contingencies 0.00 0.00 —
Total Project Costs 21.160 15.618 74% Project Preparation Facility (PPF) 0.00 0.00 — Front-end fee IBRD 0.00 0.00 —
Total Financing Required 21.160 15.618 74%

17
(b) Financing by component (in USD million equivalent)
Source of Funds
Global Environment
Facility
MIEM Budget
UTE Sub-
borrowers Total
1. Energy Efficiency Market Development Appraisal 4.5 0.3 0 6.03 10.83
Actual 4.292 0.53 0 0 4.822 % of Appraisal 95% 177% -- 0 45%
2. Utility Based Energy Efficiency Appraisal 1.875 0 7.105 0 8.98
Actual 1.872 0 7.541 0 9.413 % of Appraisal 99.8% -- 106% -- 105%
3. Project Management Appraisal 0.5 0.4 0.4 0.05 1.35
Actual 0.656 0.374 0.353 0 1.383 % of Appraisal 131% 94% 88% 0 102%
Total Appraisal 6.875 0.7 7.505 6.08 21.16
Actual 6.818 0.904 7.894 0 15.618 % of Appraisal 99% 129% 105% 0 74%
Percentage of Funding Appraisal 32.5% 3.3% 35.5% 28.7% 100%
Actual 43.7% 5.8% 50.5% 0 100%

18
Annex 2. Outputs by Component
I. By type of activities
o Component implemented under MIEM (Energy Efficiency Market Development)—$4.29 million of GEF Grant.
Studies. The project financed a number of studies which supported project development and included:
Energy efficiency law which supports the implementation of energy efficiency activities and corrects a number of uneconomic disincentives (such as the reversion of efficiency savings in public organizations, which did not incentivate energy efficiency investments. The law was approved and secondary legislation to put it into effect was developed with project support; it has been in effect since March 2012.
Three studies covering the cogeneration potential in Uruguay, the country’s solar thermal potential, and energy savings potential.
A study for the design of the UFEE. Studies for a project monitoring and evaluation methodology, as well as the actual
monitoring and evaluation. Studies for solar water heaters in low-income housing, which were subsequently put in
place (38 installations and a control system). Methods for auditing investment projects financed with UFEE guarantees. Methods and tools to enable the people to access energy sector information. Market instruments to capture the cogeneration potential in Uruguay.
Energy diagnostics. The project financed: Nine energy efficiency studies of which eight were implemented by ESCOs. 37 diagnostics in public sector buildings, developed by 12 ESCOs Six guarantees for EE studies. One guarantee for an EE project.
EE labeling. The project financed: The development and publication of EE national norms (49 have been published), and
norms for transportation. Design of the EE labeling system including the implementation of a compulsory system
for CFLs, electrical heaters and refrigerators. . Design and equipment for the water heater and lamp testing laboratories. Radio and TV dissemination campaigns. Publicity in buses in Montevideo and vicinity. Market study for feasibility of EE testing for refrigeration and air conditioning equipment.
Training, Education, and Dissemination. This item involved a large number of initiatives to reach out to the population in general in order to generate awareness and educate them regarding EE. They included:
Development and maintenance of the project’s website. The website’s usefulness received wide recognition from its users
TV and radio videos and spots production and broadcasting. Project presentation through alternative TV programs. The national EE prize (2009, 2010, 2011). Design, development and dissemination of a primary school EE text.
19
EE learning disseminated through puppet shows at schools. Technical talks and courses oriented to ESCOs, energy-related staff in the public sector,
students, and the public in general, which covered a large number of EE topics, such as: planning EE in the public sector, efficient lighting, efficient thermal insulation, efficiency in industrial combustion and steam processes, self-construction of thermal solar collectors, M&E of atmospheric emissions, improvements for the rice processing sector, courses for primary, secondary and community center teachers, energy audits for ESCOs, safety and EE in steam generation, and EE in public lighting.
Uruguayan Fund for Energy Efficiency (UFEE). The Fund was set up and its design was modified to adapt it to the changing financial environment in which it was implemented. It is now in operation as a guarantee fund associated with the National Guarantee System.
o Component implemented under UTE—$1.87 million of GEF Grant.
Studies and Energy Audits : Business plan for the UTE ESCO. 6 Energy audits (2 public sector, 4 private sector)
Investments in public and private sector projects: 17 projects executed between January 2008 and July 2010.
Projects in low income neighborhoods: support in normalizing connections, infrastructure works, and EE courses.
Public lighting projects: installation of efficient lights in public spaces, particularly traffic lights, in the departments of Lavalleja, Soriano, and Montevideo.
Photovoltaic systems: 757 systems installed.
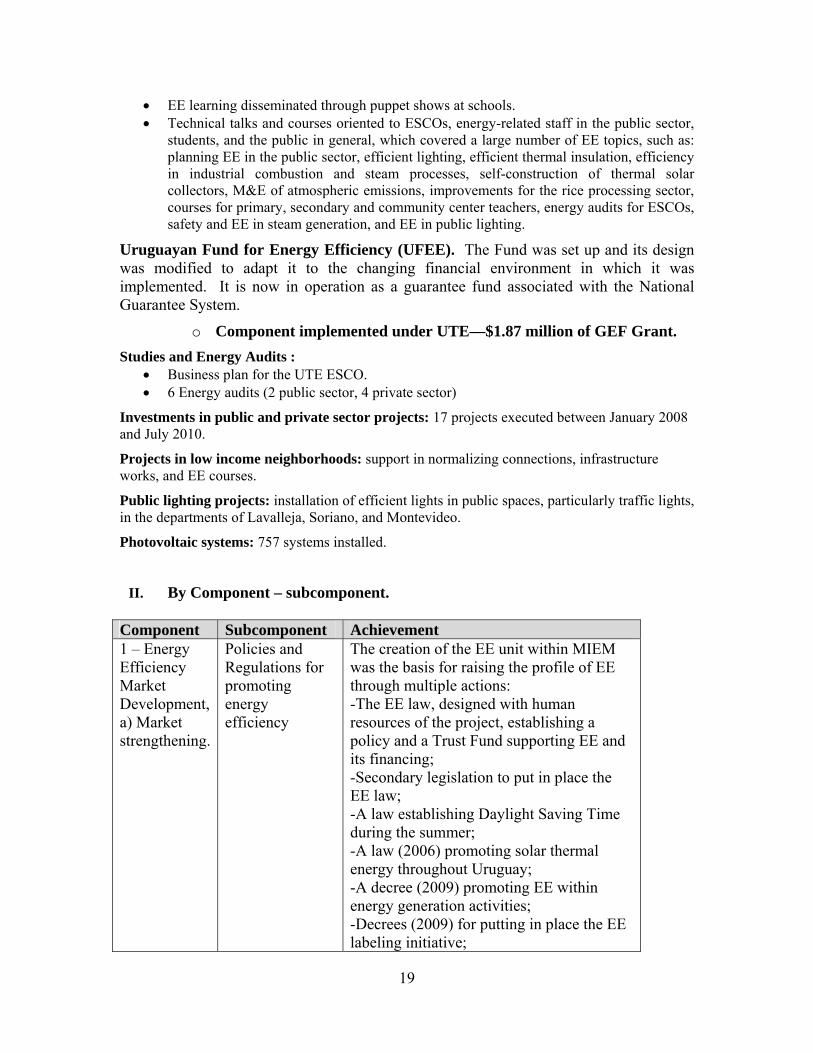
II. By Component – subcomponent. Component Subcomponent Achievement 1 – Energy Efficiency Market Development, a) Market strengthening.
Policies and Regulations for promoting energy efficiency
The creation of the EE unit within MIEM was the basis for raising the profile of EE through multiple actions: -The EE law, designed with human resources of the project, establishing a policy and a Trust Fund supporting EE and its financing; -Secondary legislation to put in place the EE law; -A law establishing Daylight Saving Time during the summer; -A law (2006) promoting solar thermal energy throughout Uruguay; -A decree (2009) promoting EE within energy generation activities; -Decrees (2009) for putting in place the EE labeling initiative;

20
Component Subcomponent Achievement -Regulations (2009) relative to thermal insulation of houses and buildings; -Decrees (2010) promoting EE in the public sector; -Decree (2008) providing incentives to measure public lighting services and incentivize EE.
Awareness creation and capacity building programs
-Organization of 8 demonstration programs oriented towards the industrial, commercial, public, and service sectors showing the benefits of EE; -Public media campaigns (TV and radio) organized by MIEM and UTE to promote changes in use patterns and the adoption of EE; -Technological dissemination through a cycle of technical talks for ESCOs in order to interchange information; -Development of technical instruction material on EE: 5 such publications were disseminated targeting areas such as lighting, transport and the public sector; -Support studies on EE: Study of the Solar Thermal Potential, Study on the Energy Savings Potential,, and Study on Cogeneration; -Support for energy audits: 10 in the private sector and 15 in the public sector, together with courses on energy audits oriented to ESCOs; -Capacity building: 14 courses were held for professional updating and 400 technicians were prepared in different EE areas; -Primary education: the unit prepared and distributed 60,000 booklets on EE, together with educational material for primary teachers; this was complemented through workshops for teachers, puppet shows and rural school hands-on demonstrations; -Secondary education: promotion of EE through contests of projects developed by students (34 schools and around 600 students have participated in these

21
Component Subcomponent Achievement contests); -Itinerant demonstrations were prepared for demonstrating EE through experiments; UTE manages a bus for this purpose which travels around the country; -Annual encouragement for EE through prizes for implemented projects with best results in three categories: industry, commerce and services, and the public sector.. -Development of a website and publication of a periodical newsletter to promote EE with over 1000 recipients (www.eficienciaenergetica.gub.uy)
Labeling and standards program including a voluntary energy efficiency seal for main household appliances and other equipment
-Testing laboratories: the project facilitated the development of three EE labs for testing water heaters and CFLs; -The project designed and put in place the labeling program by implementing the measures contemplated in the EE certification and labeling decree (see above); -Organization and coordination of the labs, two certifying entities, and the regulator who controls and monitors compliance through field surveys; -The project supported the development of 49 norms covering EE equipment; -The project financed visits to Brazil and Argentina in order to gain experience with the process.
Standard contractual instruments to support ESCO-based projects
The project developed blueprints for ESCO interventions and organized training courses for ESCO staff through a corporate development program. There are 56 registered ESCOs, of which 14 are in active operation.
1 – Energy Efficiency Market Development, b) UFEE
Uruguay fund for EE and complementary services
The Fund was established and capitalized. As noted in the implementation section, the Fund was unable to operate as initially conceived and was restructured twice. Now that it is incorporated in the
22
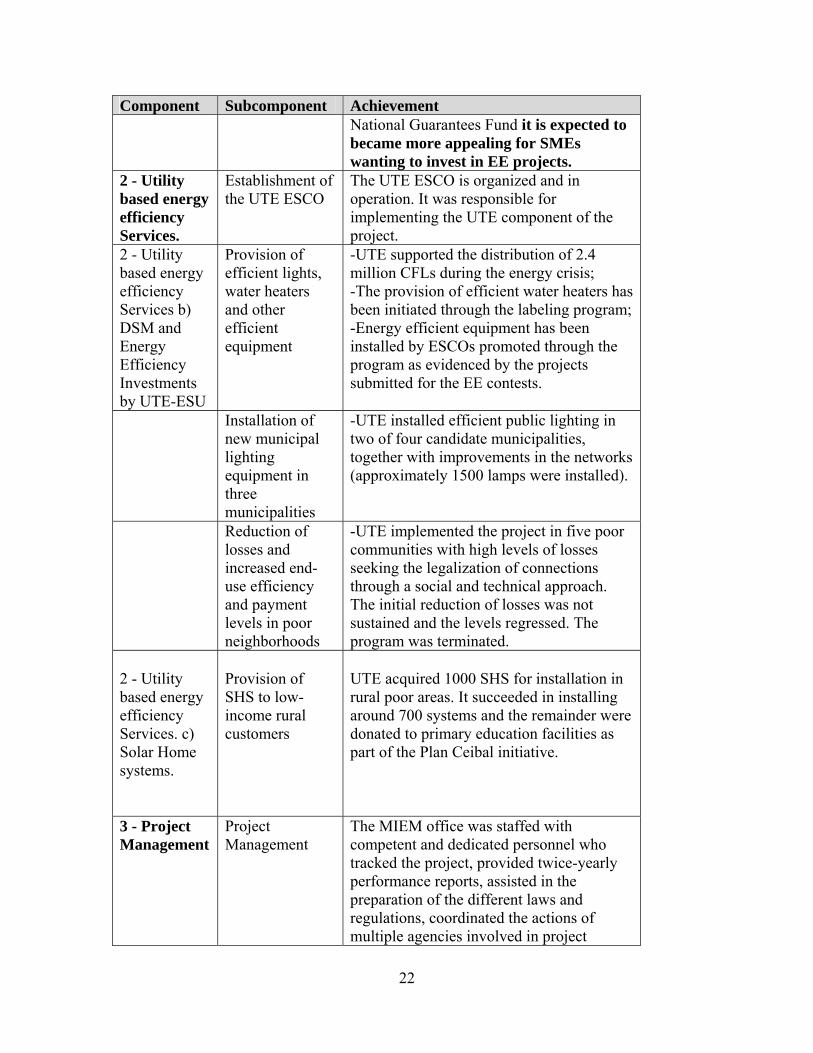
Component Subcomponent Achievement National Guarantees Fund it is expected to became more appealing for SMEs wanting to invest in EE projects.
2 - Utility based energy efficiency Services.
Establishment of the UTE ESCO
The UTE ESCO is organized and in operation. It was responsible for implementing the UTE component of the project.
2 - Utility based energy efficiency Services b) DSM and Energy Efficiency Investments by UTE-ESU
Provision of efficient lights, water heaters and other efficient equipment
-UTE supported the distribution of 2.4 million CFLs during the energy crisis; -The provision of efficient water heaters has been initiated through the labeling program; -Energy efficient equipment has been installed by ESCOs promoted through the program as evidenced by the projects submitted for the EE contests.
Installation of new municipal lighting equipment in three municipalities
-UTE installed efficient public lighting in two of four candidate municipalities, together with improvements in the networks (approximately 1500 lamps were installed).
Reduction of losses and increased end-use efficiency and payment levels in poor neighborhoods
-UTE implemented the project in five poor communities with high levels of losses seeking the legalization of connections through a social and technical approach. The initial reduction of losses was not sustained and the levels regressed. The program was terminated.
2 - Utility based energy efficiency Services. c) Solar Home systems.
Provision of SHS to low-income rural customers
UTE acquired 1000 SHS for installation in rural poor areas. It succeeded in installing around 700 systems and the remainder were donated to primary education facilities as part of the Plan Ceibal initiative.
3 - Project Management
Project Management
The MIEM office was staffed with competent and dedicated personnel who tracked the project, provided twice-yearly performance reports, assisted in the preparation of the different laws and regulations, coordinated the actions of multiple agencies involved in project
23
Component Subcomponent Achievement execution, and managed the project professionally. UTE-ESU: the UTE office had the full support of management and was staffed by competent professionals. Although its component encountered obstacles, UTE was able to execute it and to reach the project goals. Ultimately, it has put in place an ESCO which will continue to provide services to the residential, commercial, and, particularly, the government sector. However, several of the activities originally assigned under its responsibility (SHS, losses in poor neighborhoods) failed to achieve their objective
III. Performance Indicators as stated in the PAD – Annex 1. Achievement of key performance indicators
Indicator Baseline Target Achieved
% of Target
Development Objective and
GEO
Market Share of Energy Efficient Appliances (%):
Residential and Commercial 0 10 18 180 Municipal Lighting 0 20 63 315
Water Heaters 0 25 9 36 Refrigeration 0 25 9 36
Air Conditioning 0 25 n/a n/a Electric Motors 0 20 n/a n/a
Firms providing Energy Efficiency services - ESCOs (#)
0 10 73 730
Investment in EE Investment Projects (M$) 0 22.7 22.3 98
Stakeholders trained on EE practices (#)
0 250 3200 1280
Implementation progress /
Output
Labeling Program in operation None Achieved UFEE financed feasibility studies (#) 0 90 17 19
UFEE loans (M$) 0 6.2 0.2 3.2 Cost of UFEE financed projects (M$) 0 6.8 0.4 5.9
EE investments completed by UTE (M$) 0 5.9 6.32 107

24
Achievement of key performance indicators
Indicator Baseline Target Achieved % of
Target SHS installed (#) 0 2000 757 38
Total project Energy savings achieved (ktpe) 0 559 225 40 Avoided CO2 emissions (103 tons) 0 1,400 499 36
Avoided emissions of NOx (tons) 0 682 n/a1
Avoided emissions of SOx (tons) 0 5.5 n/a1
Avoided emissions of particulates (tons) 0 46 n/a1
1The data is being gathered by the environmental authorities. Latest data only available as of 2004.
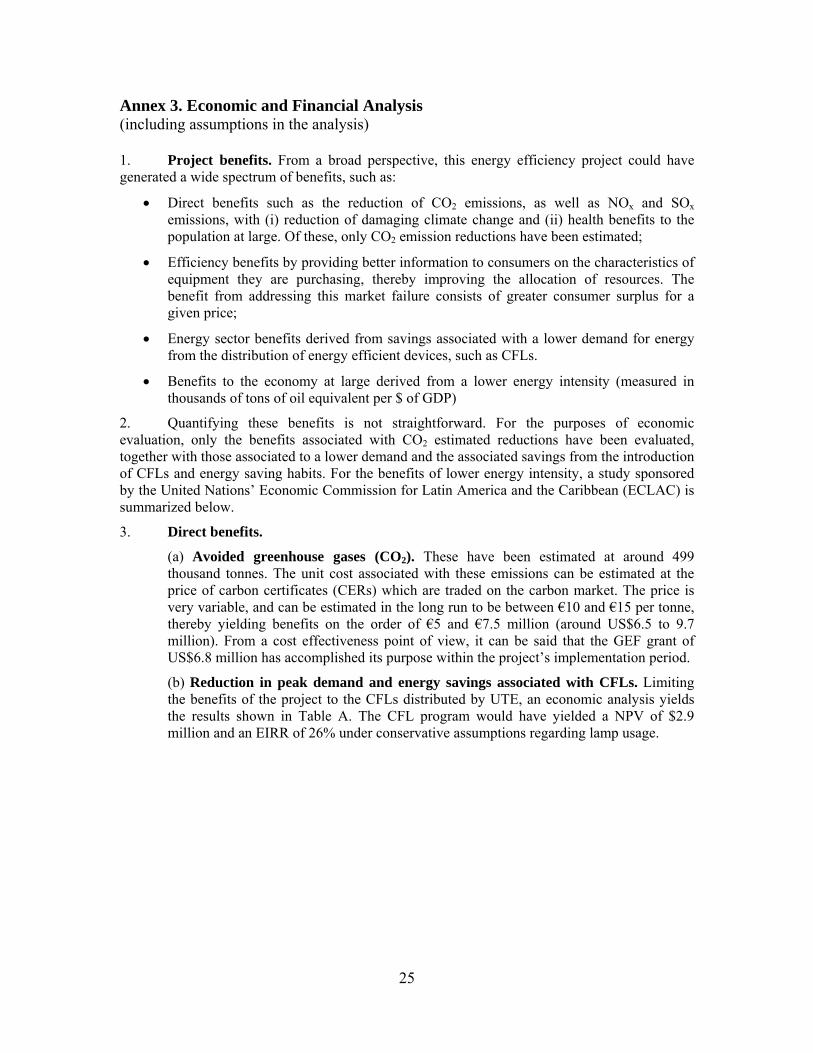
25
Annex 3. Economic and Financial Analysis (including assumptions in the analysis) 1. Project benefits. From a broad perspective, this energy efficiency project could have generated a wide spectrum of benefits, such as:
Direct benefits such as the reduction of CO2 emissions, as well as NOx and SOx emissions, with (i) reduction of damaging climate change and (ii) health benefits to the population at large. Of these, only CO2 emission reductions have been estimated;
Efficiency benefits by providing better information to consumers on the characteristics of equipment they are purchasing, thereby improving the allocation of resources. The benefit from addressing this market failure consists of greater consumer surplus for a given price;
Energy sector benefits derived from savings associated with a lower demand for energy from the distribution of energy efficient devices, such as CFLs.
Benefits to the economy at large derived from a lower energy intensity (measured in thousands of tons of oil equivalent per $ of GDP)
2. Quantifying these benefits is not straightforward. For the purposes of economic evaluation, only the benefits associated with CO2 estimated reductions have been evaluated, together with those associated to a lower demand and the associated savings from the introduction of CFLs and energy saving habits. For the benefits of lower energy intensity, a study sponsored by the United Nations’ Economic Commission for Latin America and the Caribbean (ECLAC) is summarized below.
3. Direct benefits.
(a) Avoided greenhouse gases (CO2). These have been estimated at around 499 thousand tonnes. The unit cost associated with these emissions can be estimated at the price of carbon certificates (CERs) which are traded on the carbon market. The price is very variable, and can be estimated in the long run to be between €10 and €15 per tonne, thereby yielding benefits on the order of €5 and €7.5 million (around US$6.5 to 9.7 million). From a cost effectiveness point of view, it can be said that the GEF grant of US$6.8 million has accomplished its purpose within the project’s implementation period.
(b) Reduction in peak demand and energy savings associated with CFLs. Limiting the benefits of the project to the CFLs distributed by UTE, an economic analysis yields the results shown in Table A. The CFL program would have yielded a NPV of $2.9 million and an EIRR of 26% under conservative assumptions regarding lamp usage.
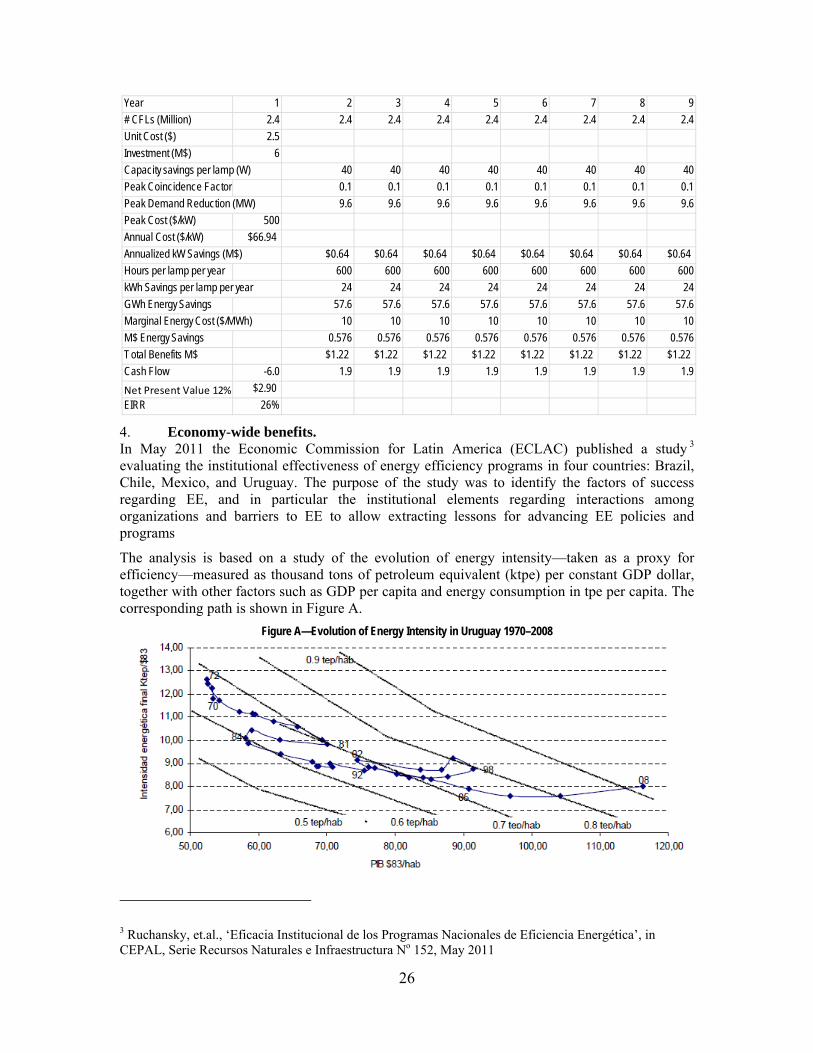
26
4. Economy-wide benefits. In May 2011 the Economic Commission for Latin America (ECLAC) published a study 3 evaluating the institutional effectiveness of energy efficiency programs in four countries: Brazil, Chile, Mexico, and Uruguay. The purpose of the study was to identify the factors of success regarding EE, and in particular the institutional elements regarding interactions among organizations and barriers to EE to allow extracting lessons for advancing EE policies and programs
The analysis is based on a study of the evolution of energy intensity—taken as a proxy for efficiency—measured as thousand tons of petroleum equivalent (ktpe) per constant GDP dollar, together with other factors such as GDP per capita and energy consumption in tpe per capita. The corresponding path is shown in Figure A.
Figure A—Evolution of Energy Intensity in Uruguay 1970–2008
3 Ruchansky, et.al., ‘Eficacia Institucional de los Programas Nacionales de Eficiencia Energética’, in CEPAL, Serie Recursos Naturales e Infraestructura No 152, May 2011
Year 1 2 3 4 5 6 7 8 9
# CFLs (Million) 2.4 2.4 2.4 2.4 2.4 2.4 2.4 2.4 2.4
Unit Cost ($) 2.5
Investment (M$) 6
Capacity savings per lamp (W) 40 40 40 40 40 40 40 40
Peak Coincidence Factor 0.1 0.1 0.1 0.1 0.1 0.1 0.1 0.1
Peak Demand Reduction (MW) 9.6 9.6 9.6 9.6 9.6 9.6 9.6 9.6
Peak Cost ($/kW) 500
Annual Cost ($/kW) $66.94
Annualized kW Savings (M$) $0.64 $0.64 $0.64 $0.64 $0.64 $0.64 $0.64 $0.64
Hours per lamp per year 600 600 600 600 600 600 600 600
kWh Savings per lamp per year 24 24 24 24 24 24 24 24
GWh Energy Savings 57.6 57.6 57.6 57.6 57.6 57.6 57.6 57.6
Marginal Energy Cost ($/MWh) 10 10 10 10 10 10 10 10
M$ Energy Savings 0.576 0.576 0.576 0.576 0.576 0.576 0.576 0.576
Total Benefits M$ $1.22 $1.22 $1.22 $1.22 $1.22 $1.22 $1.22 $1.22
Cash Flow -6.0 1.9 1.9 1.9 1.9 1.9 1.9 1.9 1.9
Net Present Value 12% $2.90
EIRR 26%

27
This figure shows the erratic path followed by energy intensity as a function of GDP per capita. The semi-straight lines represent approximate constant energy consumption per capita. The following features can be extracted from the figure:
Energy intensity follows a relatively downward sloping path (except for the period 2005–2008), despite periods of regression associated with reductions in GDP per capita;
Energy consumption per capita increases, reaching slightly over 0.9 tpe per capita in 2008; this is substantially lower than values for developed countries (e.g. 3.2 tpe per capita in Japan or France, and 6.5 tpe per capita in the U.S.) but it is in line with countries with a similar state of development (e.g. 1–1.4tpe per capita for Brazil and Chile, 1.5 tpe per capita for Argentina, 0.75 tpe per capita for Ecuador).
In the absence of any other data, it could be said that the counterfactual to the EE project shows that energy intensity, and therefore energy efficiency, is decreasing even in the absence of any EE programs. As noted in the article, if attention is concentrated solely on the impact of EE actions and a search for improvements, the result is “somewhat insatisfactory”.
Such a conclusion should be qualified by the following considerations:
As measured in Figure A, energy intensity encompasses all forms of energy and all sectors, some of which, such as the transport sector, have benefited from technological progress (e.g. more efficient engines) to a considerable degree spurred by price effects derived from the energy crises and increases in the price of oil products;
Although there have been no explicit EE programs in the 70s and 80s, UTE did take actions which induce energy conservation, such as: (i) a campaign to induce a switch to electricity in 1985, which coincided with the practical elimination of kerosene as a household fuel in a context of high excess availability of hydro generation, (ii) the implementation of time of day tariffs in 1994 which induced a switch of consumption to off-peak hours, (iii) the implementation of increasing tariffs for domestic consumption as an inducement to conserve electricity, and (iv) the company’s incorporation of EE and demand management actions in the 90s as part of its commercial strategy.
Despite the relatively inconclusive results from the economy-wide analysis, these considerations nevertheless show that EE has a role to play in providing consumers with more rational choices which are less energy-intensive, without compromising benefits and utility in their consumption patterns.
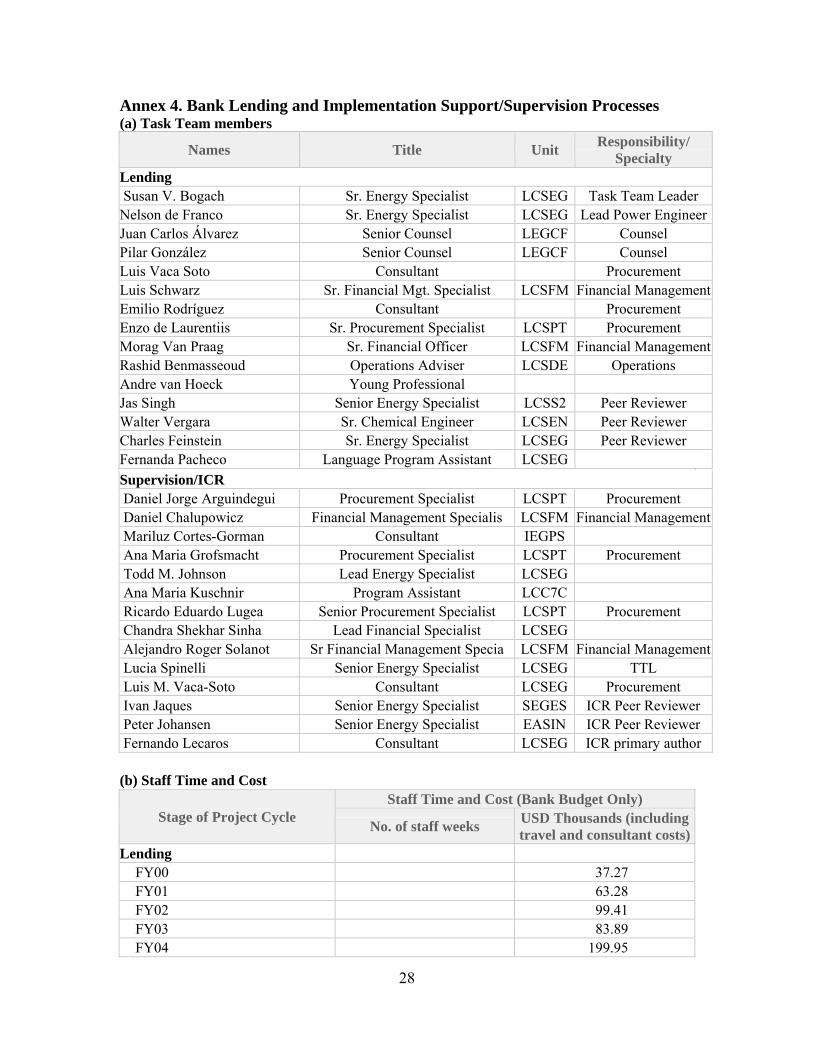
28
Annex 4. Bank Lending and Implementation Support/Supervision Processes (a) Task Team members
Names Title Unit Responsibility/
Specialty Lending Susan V. Bogach Sr. Energy Specialist LCSEG Task Team Leader Nelson de Franco Sr. Energy Specialist LCSEG Lead Power EngineerJuan Carlos Álvarez Senior Counsel LEGCF Counsel Pilar González Senior Counsel LEGCF Counsel Luis Vaca Soto Consultant Procurement Luis Schwarz Sr. Financial Mgt. Specialist LCSFM Financial ManagementEmilio Rodríguez Consultant Procurement Enzo de Laurentiis Sr. Procurement Specialist LCSPT Procurement Morag Van Praag Sr. Financial Officer LCSFM Financial ManagementRashid Benmasseoud Operations Adviser LCSDE Operations Andre van Hoeck Young Professional Jas Singh Senior Energy Specialist LCSS2 Peer Reviewer Walter Vergara Sr. Chemical Engineer LCSEN Peer Reviewer Charles Feinstein Sr. Energy Specialist LCSEG Peer Reviewer Fernanda Pacheco Language Program Assistant LCSEG
Supervision/ICR Daniel Jorge Arguindegui Procurement Specialist LCSPT Procurement Daniel Chalupowicz Financial Management Specialis LCSFM Financial Management Mariluz Cortes-Gorman Consultant IEGPS Ana Maria Grofsmacht Procurement Specialist LCSPT Procurement Todd M. Johnson Lead Energy Specialist LCSEG Ana Maria Kuschnir Program Assistant LCC7C Ricardo Eduardo Lugea Senior Procurement Specialist LCSPT Procurement Chandra Shekhar Sinha Lead Financial Specialist LCSEG Alejandro Roger Solanot Sr Financial Management Specia LCSFM Financial Management Lucia Spinelli Senior Energy Specialist LCSEG TTL Luis M. Vaca-Soto Consultant LCSEG Procurement Ivan Jaques Senior Energy Specialist SEGES ICR Peer Reviewer Peter Johansen Senior Energy Specialist EASIN ICR Peer Reviewer Fernando Lecaros Consultant LCSEG ICR primary author (b) Staff Time and Cost
Stage of Project Cycle Staff Time and Cost (Bank Budget Only)
No. of staff weeks USD Thousands (including travel and consultant costs)
Lending FY00 37.27 FY01 63.28 FY02 99.41 FY03 83.89 FY04 199.95
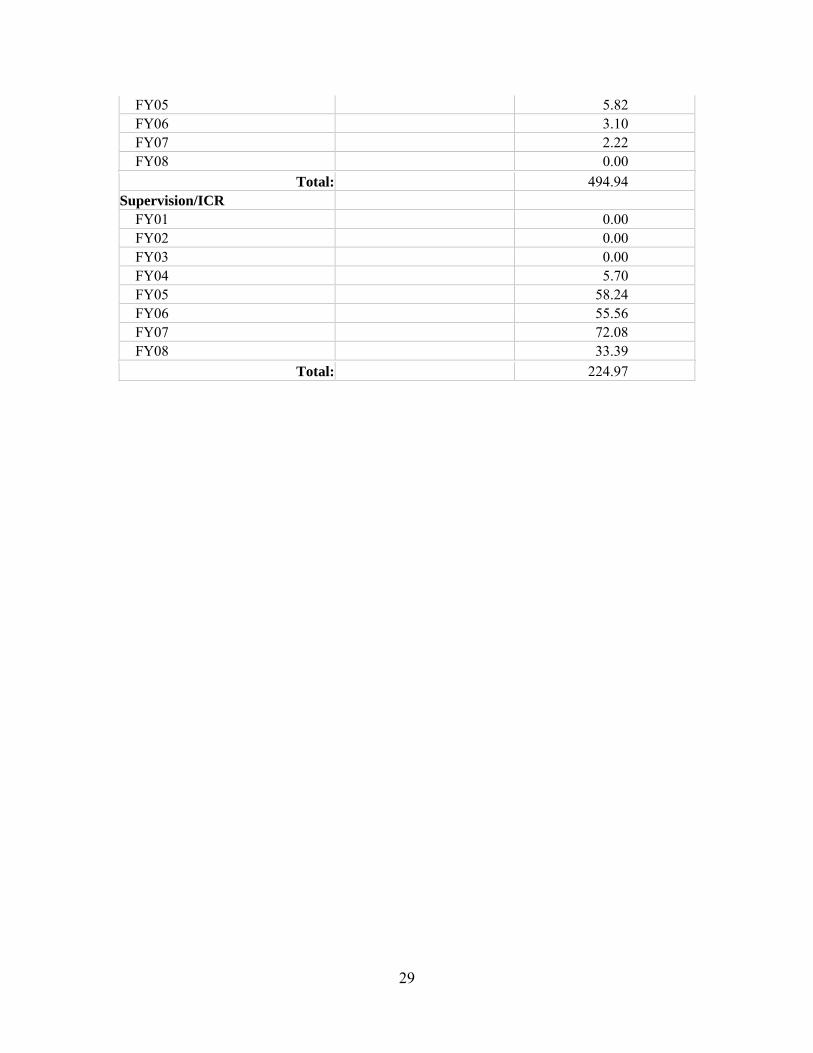
29
FY05 5.82 FY06 3.10 FY07 2.22 FY08 0.00
Total: 494.94 Supervision/ICR
FY01 0.00 FY02 0.00 FY03 0.00 FY04 5.70 FY05 58.24 FY06 55.56 FY07 72.08 FY08 33.39
Total: 224.97

30
Annex 5. Beneficiary Survey Results (if any) Not Applicable

31
Annex 6. Stakeholder Workshop Report and Results (if any) Not Applicable

32
Annex 7. Summary of Borrower's ICR and/or Comments on Draft ICR
General Comments
One of the main results of the EE project is its increased profile and its incorporation into the national agenda as a consequence of activities oriented to generating consciousness on EE in society as a whole.
Another aspect to note is the incorporation of EE in other sector policies, as in the areas of construction (buildings), transport, and social development, through joint work which was initiated with the pertinent authorities.
Finally, international interchange has been possible through contacts with similar agencies in other countries, and the participation in different forums to disseminate the different approaches to EE in Uruguay. Activities under MIEM
A new legal framework for EE Among the project’s achievements is the incorporation of EE as one of the four strategic axes of Energy Policy defined by the Government for 2008-2030. This approach was subsequently endorsed by a multiparty parliamentary commission, which effectively has incorporated EE as a state policy.
One of the principal outputs from the project has been the approval of the EE Law in September 2009, which establishes the framework for continuing project activities through MIEM’s Energy Directorate, including its budget through the Uruguayan Trust Fund for Energy Savings and Efficiency. Although secondary legislation to put the law into execution took a long time, this was achieved in 2012 and the Fund is being capitalized at present.
A national EE labeling system was established within the purview of the law, which currently covers CFLs, electric water heaters, and domestic refrigerators.
Regarding efficiency in buildings, the Montevideo municipality established minimum norms regarding thermal insulation, with support from the project and using the technical norm developed for this purpose. Similarly, the National Housing Directorate was enjoined to include EE criteria when evaluating housing proposals.
The Law for Investment Promotion established a specific fiscal benefit for services provided by ESCOs registered in MIEM’s Energy Directorate and classified under category A; to date 5 ESCOs enjoy these benefits.
Fiscal benefits were also implemented in the transport sector according to the efficiency of different vehicles, which now favors electric and hybrid ones. CFLs also benefitted from a reduction in import taxes from 18% to 2%, which was reflected directly in market prices. Based on this experience, a new proposed law developed in August 2011 would eliminate VAT for class ‘A’ CFLs; it is currently under study by the Ministry of Finance.
Consumer information, efficient technologies, local capacity building, and cultural change.
Consumer information. The main consumer information activity consisted of the labeling initiative, which was executed through a consultancy; it was complemented by the issuance, through the Uruguayan Technical Norms Institute, of over 40 norms which cover CFLs, water heaters, and refrigerators. The labeling effort was accompanied by a dissemination campaign through the media to inform consumers, as well as updating the EE website.
33
Adopting efficient technologies. Together with UTE, the “Plan a Todas Luces” exchanged two CFLs for two incandescent ones, ultimately distributing 1.7 million CFLs; this was accompanied by an information campaign which also introduced the labeling feature on the CFL. Solar thermal heaters were pioneered by installing two different technologies in a housing complex; the apparatus are being monitored to compare their performance with two other blocks of households with different technologies.
Developing local capacity. The main activity consisted of the promotion of ESCOs and efficient equipment dealers. Over 70 ESCOs have registered, of which 18 are in operation, and over 80 equipment dealers. Numerous talks and over 50 courses were organized to disseminate knowledge on EE. Public buildings were the subject of 37 energy audits. A testing lab for water heaters has facilitated updating the labeling norm for this type of equipment. Studies under the project identified the solar, cogeneration and energy savings potential at the national level.
Cultural change. Energy efficiency habits were encouraged through numerous communication and educational activities. The “La Energía es Increíble” book was distributed to 60,000 students, and has helped as a basis for the development of practical projects by primary and secondary schools students. A puppet show on the subject was particularly successful and has had over 100 presentations. An itinerant exhibiton (“Ciencia Viva”) includes didactical modules and has received over 14,000 visitors. In 2009 the first edition of the National Energy Efficiency Prize was instituted. On average there have been 15 candidates for the award in different categories.
Access to financing
Showcases. The project financed ten subprojects showcasing opportunities for energy efficiency implementation, and the benefits for final consumers and ESCOs. Eight of the ten projects were implemented.
The Energy Efficiency Fund. This fund was launched in late 2008 as a guarantee fund for EE projects. It has been operated by only two commercial banks and it has only guaranteed one project. It was modified in 2011 and was incorporated to the National Guarantee System, to be operated through all commercial banks and making it more attractive. The line for financing studies will partially reimburse the cost of energy diagnoses already accomplished.
Performance contracts in the public sector. Problems for implementation of EE measures in public buildings were resolved by a law which allowed Performance Contracts with ESCOs to remunerate them through the savings generated by their services. Energy Efficiency Certificates. The EE law put in place a certificate scheme to promote EE projects through income from the Energy Efficiency Fund.
Activities under UTE
PV systems. This component was initiated in 2001 with the acquisition of 1,000 SHS. The project had difficulties in its implementation due to the economic crisis in 2002; 757 systems were ultimately installed in isolated localities without access to the grid. The remaining equipment was donated to LATU as part of the Ceibal plan for computer penetration in schools.
Public lighting. The objective is to change existing public lighting lamps for energy efficient ones. The project had to include the rehabilitation of the public lighting network in many cases. Three cities were chosen for this purpose; one of the projects has concluded, and the other two are ongoing.
Reduction of losses in poor neighborhoods. This was accomplished through two teams: an educational and social work team in charge of disseminating educational teachings on efficient energy use among the communities, and a technical team in charge of disseminating appropriate
34
technologies in these neighborhoods. Unfortunately, after an initial period during which they declined, losses increased to pre-intervention levels.
Pilot project in the residential sector. The objective of this project was to target a community in order to promote EE equipment by explaining its advantages and how it offsets the initially higher cost. The chosen community was Ciudad de la Costa, next to Montevideo. The project targeted CFLs and water heaters. In the midst of the project an energy crisis occurred, during which UTE distributed CFLs for free, which annulled the project’s efforts. Regarding water heaters, the labeling process is still underway, which has not helped the pilot project. Also, few dwellers allowed metering equipment to be installed inside their houses.
Technical assistance for putting in place UTE’s EE unit business plan. The objective was to put in place an ESCO within UTE (USEE); a Canadian ESCO and consulting firm developed a plan for an economically attractive unit as a model for the development of other ESCOs in Uruguay. This was a learning-by-doing process which allowed the implementation of the unit based upon a performance-based remuneration, together with the methods for measuring efficiency improvement. The USEE has signed 36 contracts and has billed around US$5.2 million; estimated savings of its projects amount to around 4,200 tpe and have avoided 10.5 thousand tons of CO2 emissions.
Lessons learned
Simplicity of design. The project should be as simple as possible to minimize operative difficulties. In this case, there were two executing agencies (MIEM, UTE) with a single special account operated by MIEM. This generated difficulties for the UTE component. The same was true in practice regarding the procurement platform (SEPA).
Grant design. Any changes in the design of the grant imply lengthy procedures for changing it, such as the key indicators. Spending time during project design to minimize and to think out possible implementation difficulties is well spent.
Human resources. Although some measures were taken to allow for a continuity of activities and personnel once the project finished, the pertinent instruments did not turn out to be operative. As a consequence, there was an inevitable discontinuity between the finalization of the project and the taking over of the MIEM’s unit.
Interinstitutional agreements were key to project success. The project worked in close collaboration with URSEA, the regulating agency, with national certification organizations and with the Uruguayan Accreditation Organization for the development and implementation of the EE labeling initiative and with the Uruguayan Technical Norms Institute for the development of norms applicable to energy efficient equipment. This also required coordination with the Customs Directorate. Regarding education, there was coordination with the Primary Education Council. Finally, there was a close collaboration between MIEM and UTE which helped in putting in place the EE laboratory and cooperation for implementing different project components.
Procurement questions. A number of lessons were acquired in this respect:
Contracting could be improved. In general, contracting procedures took at least 150 days, and personnel contract renewal took at least 120 days;
Purchases should be oriented towards the reduction of costs and risks. Procurement training should take place prior to the initiation of activities, including the Comptroller’s office (Tribunal de Cuentas) in charge of overseeing public resource expenditures;
Reformulating the purchasing procedure to conform to the Bank’s norms was a lengthy procedure; unifying criteria and training in this respect should be emphasized;

35
Avoiding changes in procurement officers. During the project there were changes of procurement officers and changes of criteria which delayed numerous processes;
Challenges to contract awards should be dealt with in a way to conciliate local norms and Bank norms. Training encompassing the Comptroller’s office staff would help in this sense (see above).
Knowledge interchange. During the project, the implementation of cooperation agreements with different countries in order to exchange experiences was particularly valuable. Specifically, there were interchanges with Brazil, Argentina (including the Argentinean Normalization and Certification Institute), and participation in events organized by the Chilean EE Agency. There was also cooperation with ECLAC for the systematization and harmonization of an EE indicators database.

36
Annex 8. Comments of Cofinanciers and Other Partners/Stakeholders
37
Annex 9. List of Supporting Documents Project Appraisal Document, Report No. 29525-UY, April 19, 2004 Ruchansky, Beno et. al., “Eficacia institucional de los programas nacionales de eficiencia
energética: los casos de Brasil, Chile, México y Uruguay”, CEPAL (ECLAC) May 2011 Econergy, “Energy Sector and Capital Markets Assessment and Program Design,
Uruguay Energy Efficiency Project, June 2003 Law 18597 on Efficient Energy Use, September 2009 Secondary Legislation Decree of March 22, 2012 which regulates the EE law Blanco, Alfonso. “Alternativas para la Función Eléctrica Nacional: Eficiencia
Energética”, Universidad Católica del Uruguay, December 2010 Mercados Energéticos, “Consultoría para Monitoreo y Evaluación de Avance Anual del
Proyecto de Eficiencia Energética”, April 2010 and March 2011

Cerro CatedralCerro Catedral(514 m)(514 m)
CC hh uu cc hh ii ll llaa
dd eeHH aa ee dd oo
CC hh uu cc hh ii ll ll aa
GG rr aa nn dd ee
A RA R T I G A ST I G A S
S A LS A L T OT O
PPAAY S A N D UY S A N D U TTA C U A R E M B OA C U A R E M B O
D U R A Z N OD U R A Z N O
F L O R E SF L O R E SS O R I A N OS O R I A N O
R I O N E G R OR I O N E G R O
R O C H AR O C H AL AL AVVA L L E J AA L L E J A
F L O R I D AF L O R I D A
C O L O N I AC O L O N I A
C A N E -C A N E -L O N E SL O N E S
S A NS A NJ O S EJ O S E
M A L D O -M A L D O -N A D ON A D O
C E R R O L A R G OC E R R O L A R G O
T R E I N TT R E I N TAAY T R E SY T R E S
R I V E R AR I V E R A
ConstituciConstitucióónn
BelBeléénn
BaltasarBaltasarBrumBrum
JavierJavierde Vde Vianaiana
MasollerMasoller
GuichonGuichon
El EucaliptoEl EucaliptoQuebrachoQuebracho
San JavierSan Javier
ChapicuyChapicuy
TTresresArbelesArbeles
PiedraPiedraSolaSola
TTamboresambores
TTranquerasranqueras
AnsinaAnsina
KilKilóómetrometro329329
VVergaraergara
TTupambaeupambae
CebollatCebollatíí
Minas deMinas deCorralesCorrales
BiassiniBiassini
VVichaderoichadero
AceguAceguáá
BlanquilloBlanquillo
Pueblo delPueblo delCarCarmenmen
Rio BrancoRio Branco
JosJoséé Pedro PedroVVarelaarela
PirarajPirarajáá
MariscalaMariscala
Santa ClaraSanta Clarade Olimarde Olimar
SarandSarandíídel Ydel Yíí
Fray MarcosFray Marcos
CerroCerroColoradoColorado
Paso dePaso delos Tlos Torosoros
YYoungoung
DoloresDolores
CarCarmelomelo
CardonaCardona
JosJoséé E. Rodo E. Rodo
RosarioRosario
Juan I.Juan I.LacazeLacaze
CastillosCastillosAiguAiguáá
LazcanoLazcano ChuyChuy
San JosSan Josééde Mayode Mayo
CanelonesCanelones
FloridaFlorida
MinasMinas
ArArtigastigas
SaltoSalto
PaysandPaysandúú
TTacuarembacuarembóó
MeloMelo
TTreinta y Treinta y Trrèèss
DuraznoDuraznoMercedesMercedes
TTrinidadrinidad
RochaRocha
A R T I G A S
S A L T O
PAY S A N D U TA C U A R E M B O
D U R A Z N O
F L O R E SS O R I A N O
R I O N E G R O
R O C H AL AVA L L E J A
F L O R I D A
C O L O N I A
C A N E -L O N E S
MONTEVIDEO
S A NJ O S E
M A L D O -N A D O
C E R R O L A R G O
T R E I N TAY T R E S
R I V E R A
Bella Unión
Constitución
Belén
BaltasarBrum
Javierde Viana
Masoller
Guichon
El EucaliptoQuebracho
San Javier
Chapicuy
TresArbeles
PiedraSola
Tambores
Tranqueras
Ansina
Kilómetro329
Vergara
Tupambae
Cebollatí
Minas deCorrales
Biassini
Vichadero
Aceguá
Blanquillo
Pueblo delCarmen
Rio Branco
José PedroVarela
Pirarajá
Mariscala
Santa Clarade Olimar
Sarandídel Yí
Fray Marcos
CerroColorado
Paso delos Toros
Young
Dolores
Carmelo
Cardona
José E. Rodo
Rosario
Juan I.Lacaze
Atlantida San Carlos
Punta del Este
La Paloma
CastillosAiguá
Velazquez
Lazcano
La Coronilla
Chuy
San Joséde Mayo
Canelones
Florida
Minas
Maldonado
Artigas
Rivera
Salto
Paysandú
Tacuarembó
Melo
Treinta y Très
Durazno
Fray Bentos
Mercedes
Colonia delSacramento
Trinidad
Rocha
MONTEVIDEO
B R A Z I L
ARGENTINA
Negro
Cuareim
Urug
uay
Lago Artificialde Rincón del Bonete
Lagunade Castillos
LagunaNegra
LagunaMerin
Lago
a Man
gueir
a
Negro
Yáguarón
ATLANTICOCEAN
Rio de la Pla ta
LagoaMirim
To CuruzúCuatiá
To Uruguaiana
To Alegrete
To Rosáriodo Sul
To Bagé
To Pelotas
To Rio Grande
To Gualeguaychú
To Villaguay
To Federal
C h u c h i l la
d eH a e d o
C h u c h i l l a
G r a n d e
Cerro Catedral(514 m)
59°W 58°W 57°W 56°W 55°W 54°W 53°W
58°W 57°W 56°W 55°W 54°W 53°W
34°S
33°S
32°S
31°S
35°S
34°S
33°S
32°S
31°S
30°S
URUGUAY
0 5025 75
0 25 50 75 Miles
100 Kilometers
IBRD 33507
OCTOBER 2004
URUGUAYSELECTED CITIES AND TOWNS
DEPARTMENT CAPITALS
NATIONAL CAPITAL
RIVERS
MAIN ROADS
RAILROADS
DEPARTMENT BOUNDARIES
INTERNATIONAL BOUNDARIES
This map was produced by the Map Design Unit of The World Bank. The boundaries, colors, denominations and any other information shown on this map do not imply, on the part of The World Bank Group, any judgment on the legal status of any territory, o r any endorsemen t or a c c e p t a n c e o f s u c h boundaries.