the wizz wheel · pdf filethe wizz wheel simplified! ... often there are several different...
TRANSCRIPT
THE WIZZ WHEEL
…SIMPLIFIED!
INTRODUCTION
The Navigation Computer, more commonly known as the Wizz Wheel, is a marvellousbit of kit which enables the pilot to perform a large number of calculations.
But that’s just the problem – there are so many things that can be done it’s very easy tobecome confused!
Furthermore, often there are several different methods of doing the same calculation.
This booklet concentrates on the two most important Wizz Wheel calculations whichare vital to cross country flights and to passing the PPL Ground Examination.
THE NAVIGATION COMPUTER
also known as
FLIGHT COMPUTER or WIZZ WHEEL
Using the Navigation or Flight Computer accurately is vital. Errors in the calculations will make cross country flights verydifficult if not impossible. Also many of the questions in the PPL Navigation Theory Exam. are based on the use of the“Wizz Wheel”.
If you can understand vectors and the Triangle of Velocities as described on pages 4-8 it will help you makesense of using the Flight Computer. But don’t despair if you find this difficult: simply follow the steps given on pages 9onwards and summarised on page 33.
Note that there are several different methods for using the Nav. Computer and if you mix them up you are boundto get the wrong answer. So stick to the method shown in the following pages and if all is not clear, ask your instructor toexplain!
Abbreviations used :-
G/S ground speed
HDG heading
Kt knot
PLOG pilots log
TAS true airspeed
TRK track
W/V wind velocity
VECTORS
These are often referred to in aviation.
A vector refers to both the direction and the strength of whatever is being described.
For the calculations for the Pilot’s Log (the PLOG) the vectors we use have direction and speed.
If we consider two examples of wind velocity, they would be written as 180/15Kt or 300/45Kt and can berepresented in diagram 1 opposite where the direction of the wind is represented by the direction of the drawn line whilethe length of the line shows its speed (so the 45 Kt line is 3 times as long as the 15 Kt line).Note that wind vectors alwayshave 3 Chevrons (arrows) indicating the direction it is coming FROM.
Another vector we need to consider is the aircraft’s direction through the air (this is the Heading (HDG)) and itsspeed through the air (True Airspeed (TAS)) .Examples are shown in diagram 2.
The first example shows an aircraft flying on a HDG (always shown with one chevron) of 130 degrees and aTAS 50 Kt and the second one shows a HDG of 260 degrees and TAS of 70 Kts so that the second line is 40% greaterthan the first in proportion with the airspeed.
The third vector which concerns the PLOG is that of the direction over the ground ( the track (TRK)) shown withtwo chevrons), and the speed over the ground (G/S). Once again they can be shown in a diagram where the direction ofthe line represents the direction of the TRK and the length of the line is in scale with the G/S. Diagram 3.

THE TRIANGLE OF VELOCITIES
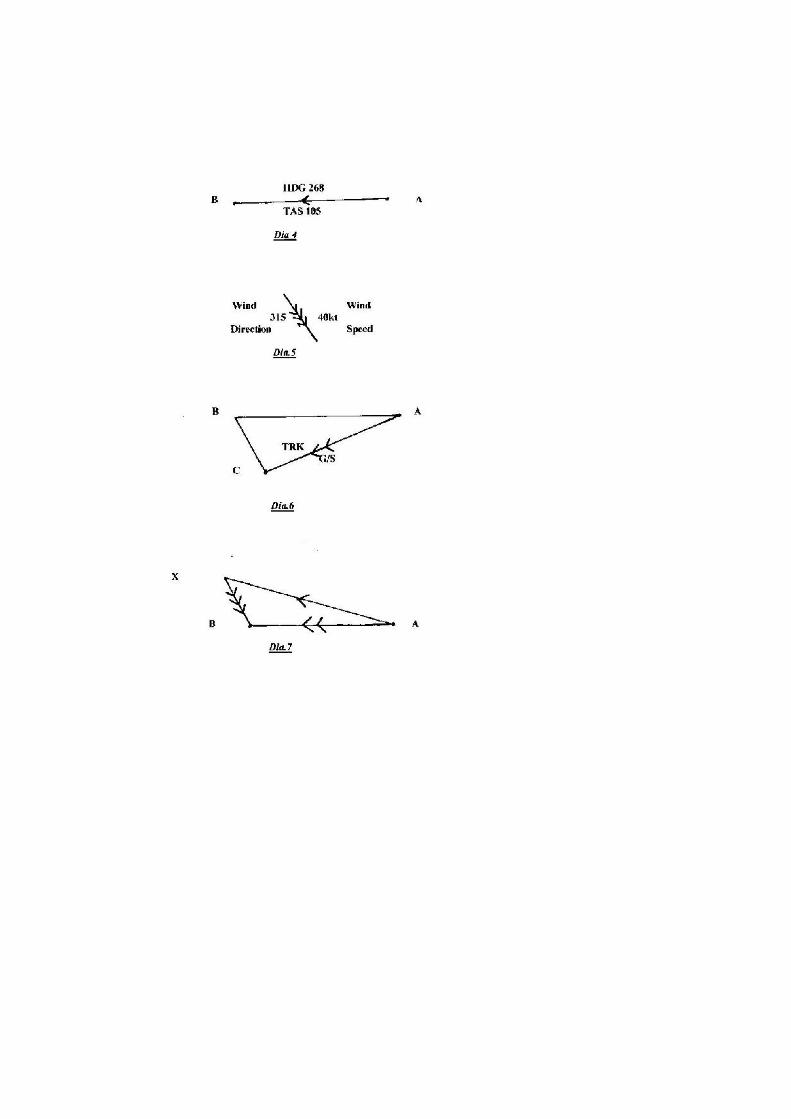
Lets imagine a pilot wishing to fly to B which is 268 from A .He forgets all about the wind and flies off at aTAS of 105 Kts. maintaining a heading of 268 We can draw in this vector in the correct direction and will make it 10.5cms. long using a scale of 1 cm per 10 Kt. See diagram 4.
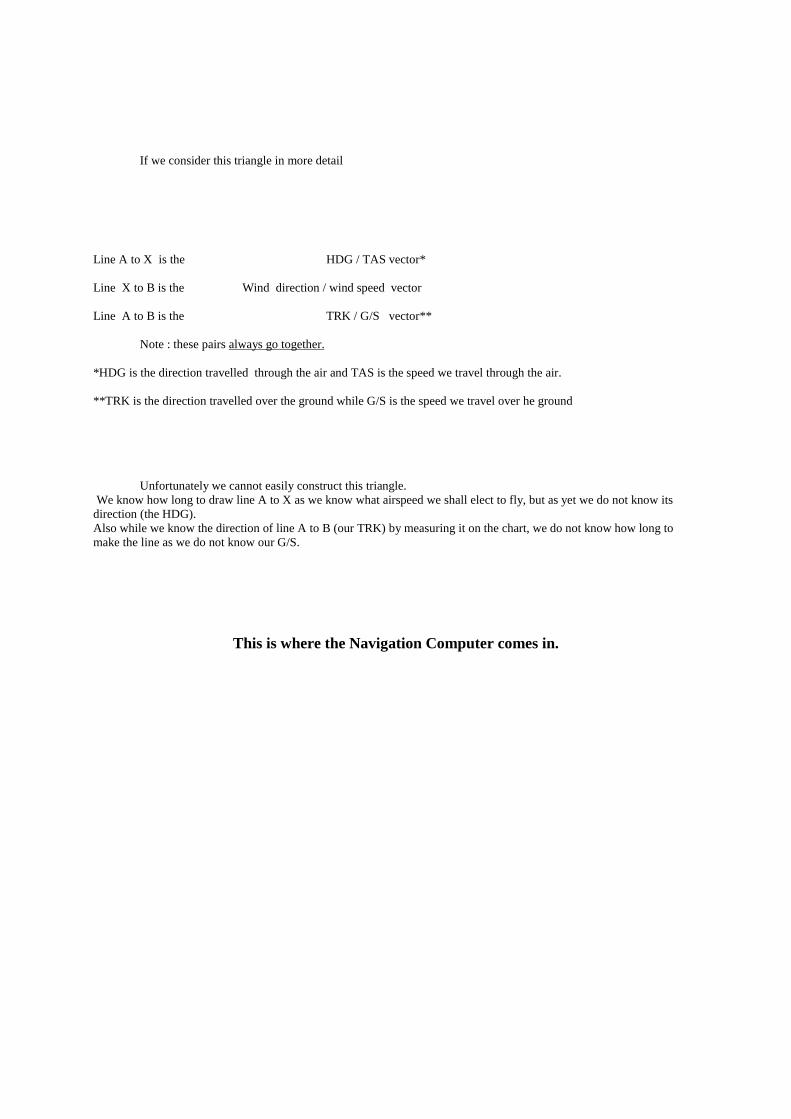
Unfortunately there is a strong wind blowing from 315 at 40 Kts. as shown in the vector drawn using the samescale.Diagram 5.
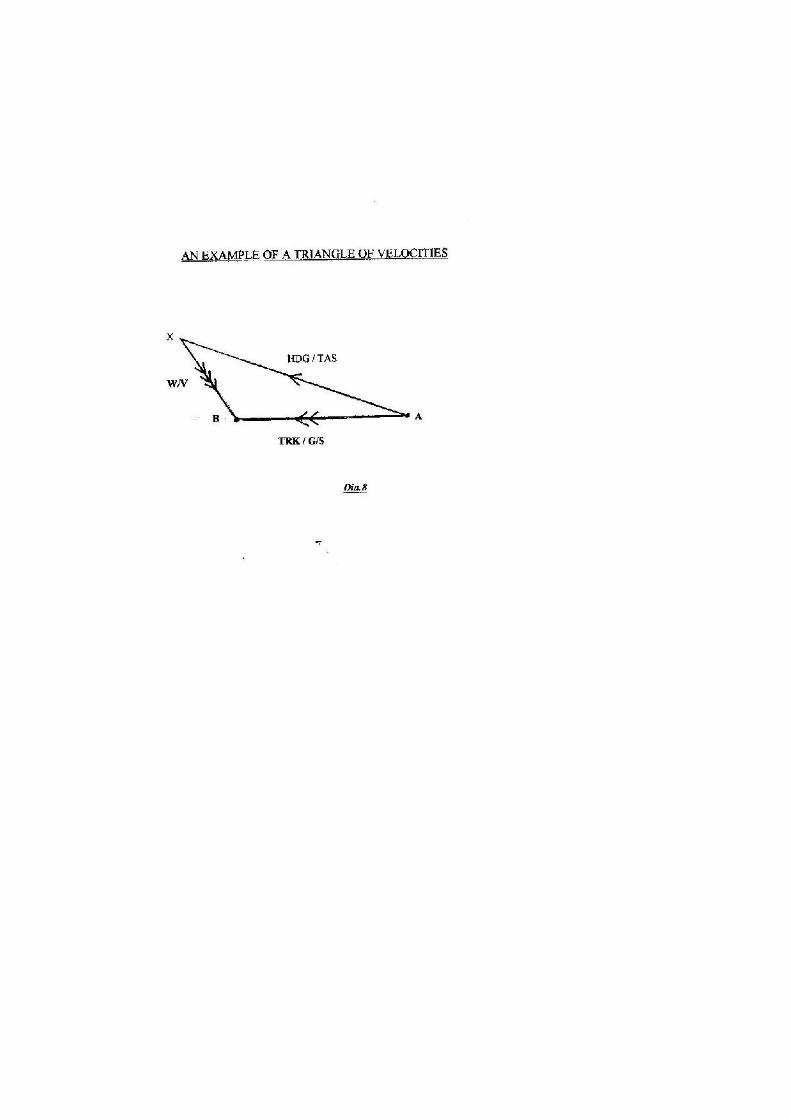
Combining these two we see that because of this wind the aircraft would end up arriving at C and that the linefrom A to C represents his TRK and the length of the line would enable us to measure the G/S using the scale of 1cm.=10Kts..Diagram 6.
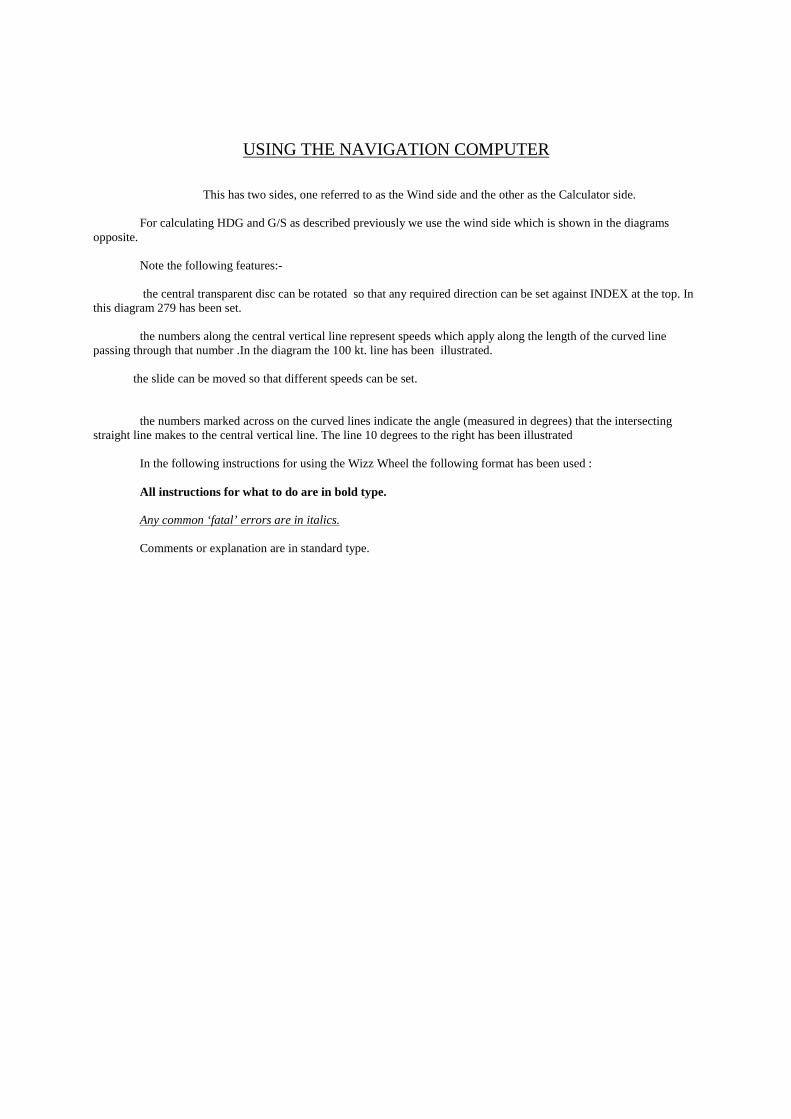
This would have been fine if the pilot had wanted to go to C but as he wished to arrive a B, his track should havebeen 268 so, making allowances for the wind the triangle should look more like diagram 7.
Of course the aircraft doesn’t really fly to X and then back down to B but this Triangle of Velocities shows us thedirection of the HDG needed to keep us on the required TRK taking into account the wind.
If we consider this triangle in more detail
Line A to X is the HDG / TAS vector*
Line X to B is the Wind direction / wind speed vector
Line A to B is the TRK / G/S vector**
Note : these pairs always go together.
*HDG is the direction travelled through the air and TAS is the speed we travel through the air.
**TRK is the direction travelled over the ground while G/S is the speed we travel over he ground
Unfortunately we cannot easily construct this triangle.We know how long to draw line A to X as we know what airspeed we shall elect to fly, but as yet we do not know its
direction (the HDG).Also while we know the direction of line A to B (our TRK) by measuring it on the chart, we do not know how long tomake the line as we do not know our G/S.
This is where the Navigation Computer comes in.
USING THE NAVIGATION COMPUTER
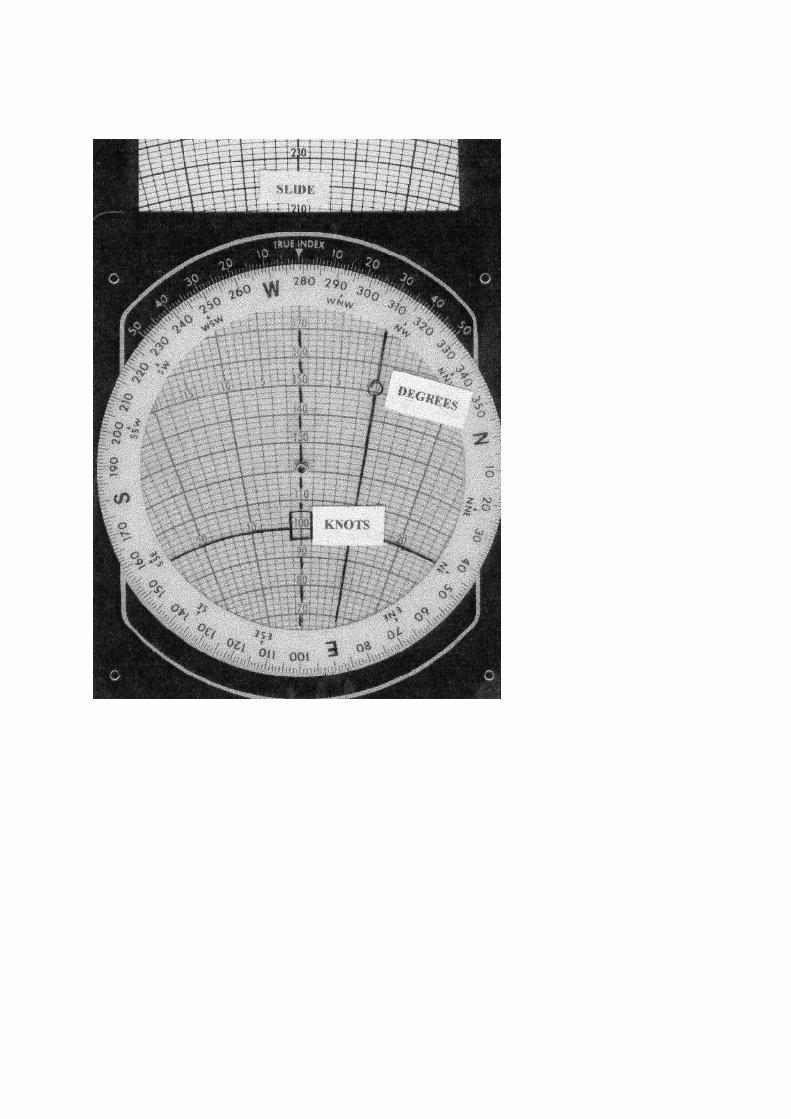
This has two sides, one referred to as the Wind side and the other as the Calculator side.
For calculating HDG and G/S as described previously we use the wind side which is shown in the diagramsopposite.
Note the following features:-
the central transparent disc can be rotated so that any required direction can be set against INDEX at the top. Inthis diagram 279 has been set.
the numbers along the central vertical line represent speeds which apply along the length of the curved linepassing through that number .In the diagram the 100 kt. line has been illustrated.
the slide can be moved so that different speeds can be set.
the numbers marked across on the curved lines indicate the angle (measured in degrees) that the intersectingstraight line makes to the central vertical line. The line 10 degrees to the right has been illustrated
In the following instructions for using the Wizz Wheel the following format has been used :
All instructions for what to do are in bold type.
Any common ‘fatal’ errors are in italics.
Comments or explanation are in standard type.

For the example which will be illustrated in the following pages we havethe following information:-
Wind direction / wind speed (306/40 Kts.)
True Airspeed 100 Kts..
Track 268(T)
We wish to calculate:-
Heading and Ground speed (and later on in the PLOG we will use G/S to calculate the time taken on this leg).
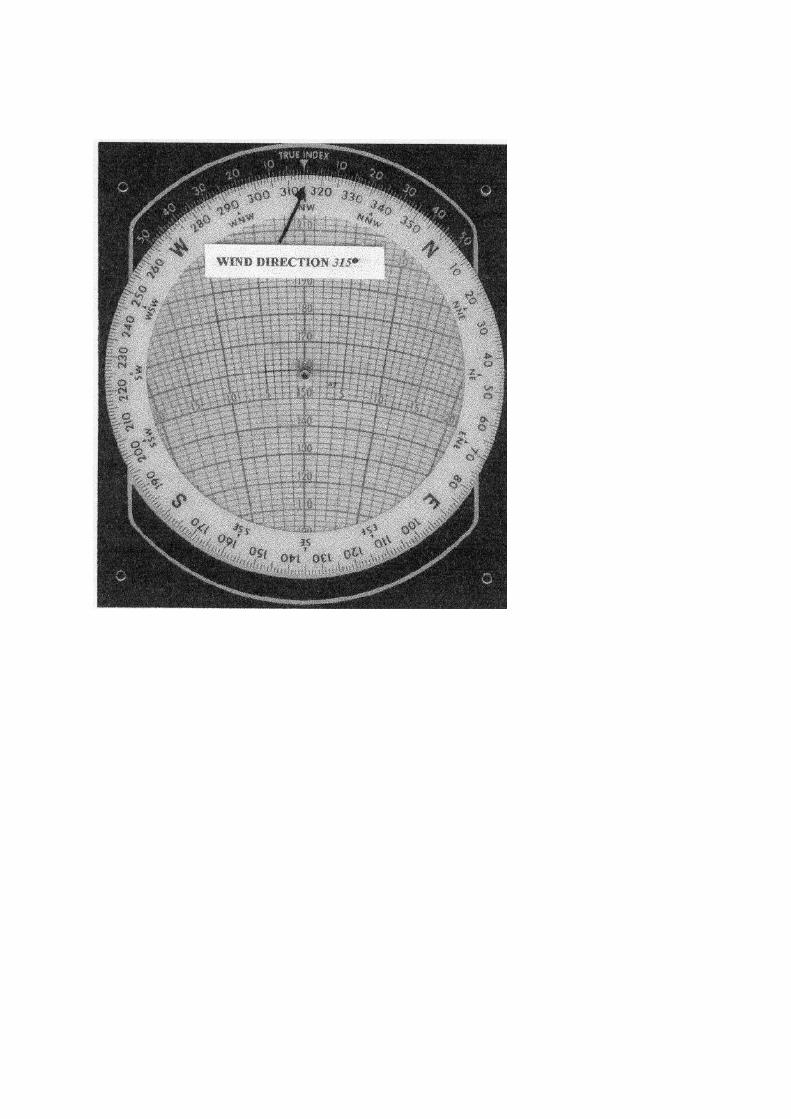
Step1……….Set the wind direction at the INDEX
INDEX may be called something different on your Wizz Wheel : always use what is marked in the 12 o’clock position.
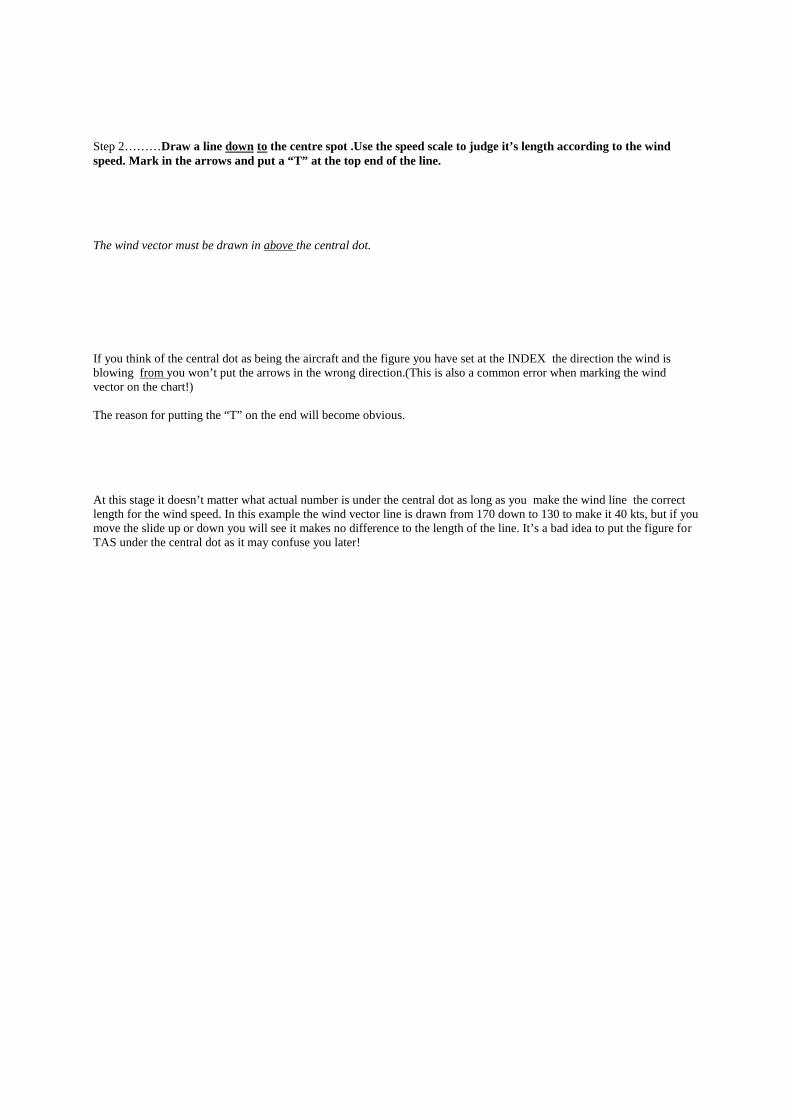
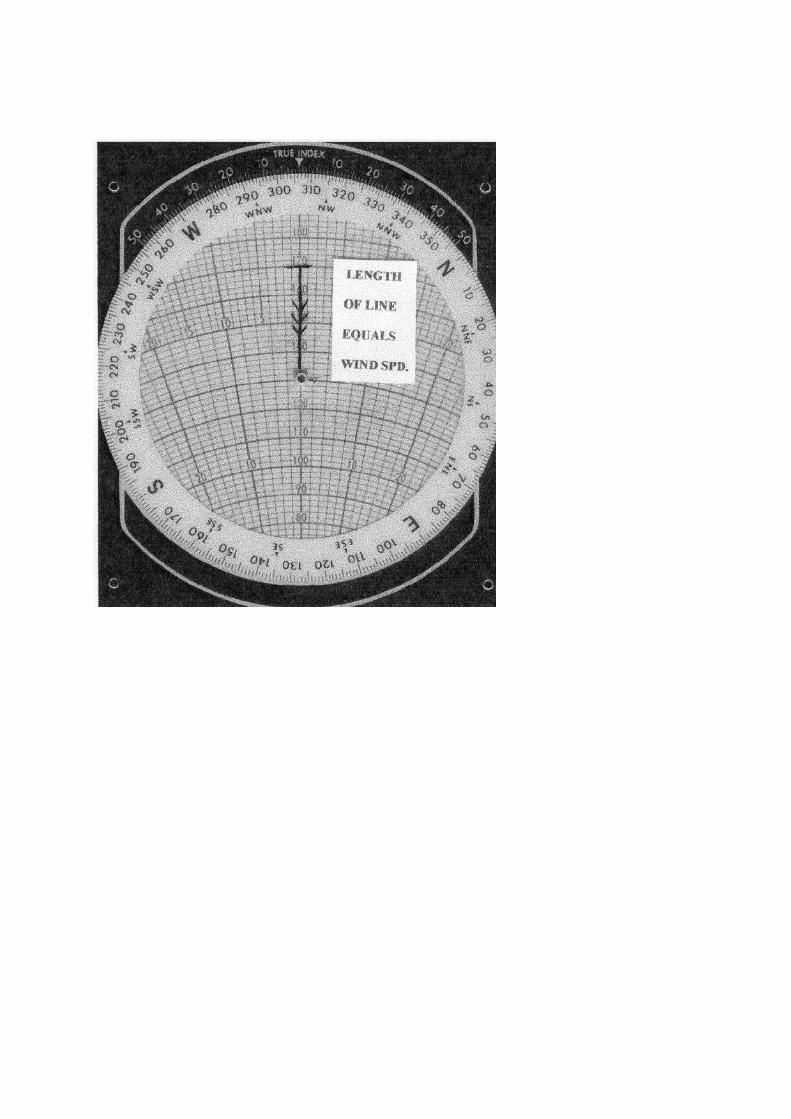
Step 2………Draw a line down to the centre spot .Use the speed scale to judge it’s length according to the windspeed. Mark in the arrows and put a “T” at the top end of the line.
The wind vector must be drawn in above the central dot.
If you think of the central dot as being the aircraft and the figure you have set at the INDEX the direction the wind isblowing from you won’t put the arrows in the wrong direction.(This is also a common error when marking the windvector on the chart!)
The reason for putting the “T” on the end will become obvious.
At this stage it doesn’t matter what actual number is under the central dot as long as you make the wind line the correctlength for the wind speed. In this example the wind vector line is drawn from 170 down to 130 to make it 40 kts, but if youmove the slide up or down you will see it makes no difference to the length of the line. It’s a bad idea to put the figure forTAS under the central dot as it may confuse you later!

Step 3……….Rotate the inner disc until the TRACK is set against the INDEX
I’ve drawn in the track as a line but once you are familiar with this method that won’t be necessary-(but I would alwaysmark the wind as a line and include the arrows and the “T”, rather than just marking a cross or dot as some booksrecommend)
By drawing in the track line I hope you can see that the triangle we looked at on page 8 is starting to be formed.


Step 4 Set the TAS by adjusting the slide until the curved line corresponding to Airspeed lies at the end ofthe wind vector.
i.e. PUT THE “T” ON THE TAS!
This is the commonest error. DO NOT set the TAS directly over the central line where the numbers are marked.
It is now possible to read off the angle of drift.
In this example it is 14 as seen by the position of the end of the wind vector (which is marked by the “T”)
If this is not obvious to you, go on to the next page and then refer back to this one!
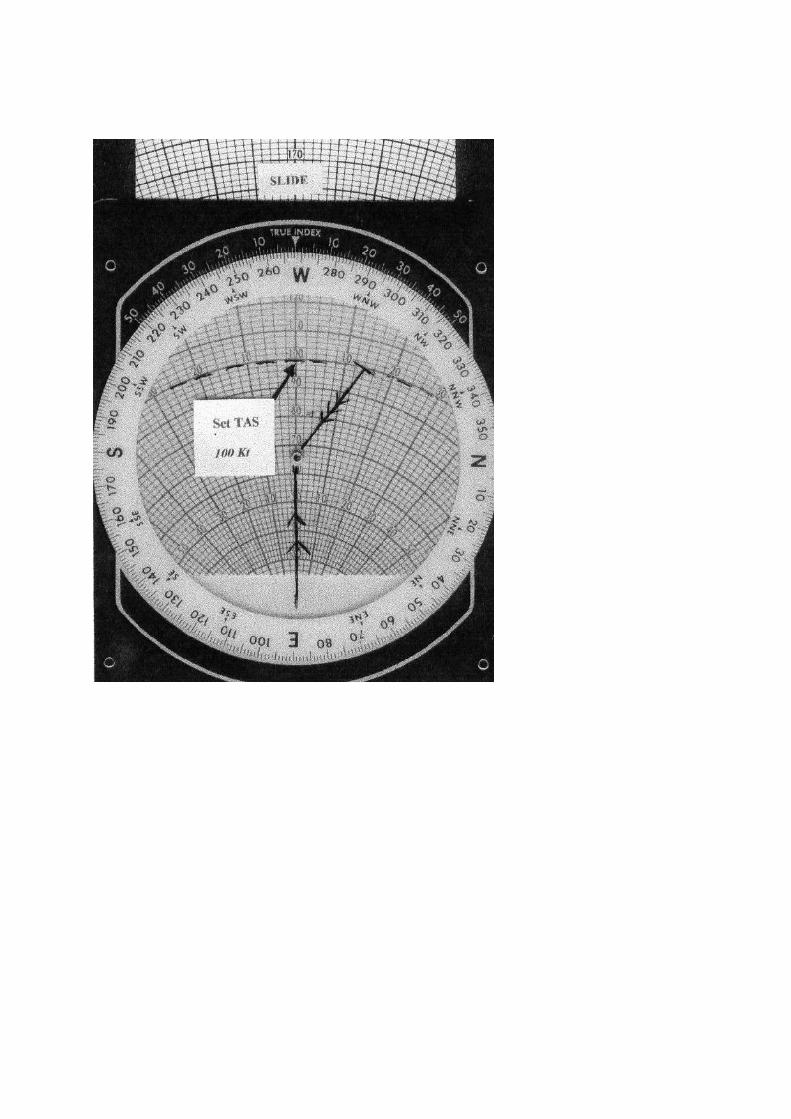
The line drawn and marked with a single arrow is the heading and it becomes possible to read off the drift angle byreference to the numbers marked across the slide. It is 14 in this example.
This triangle is identical with the one drawn on page 8 illustrating the triangle of velocities.
It’s not necessary to draw this HDG line in or to mark the drift angle as has been done here .All you need to do is to notethe position of the “T” in order to read off the drift angle.

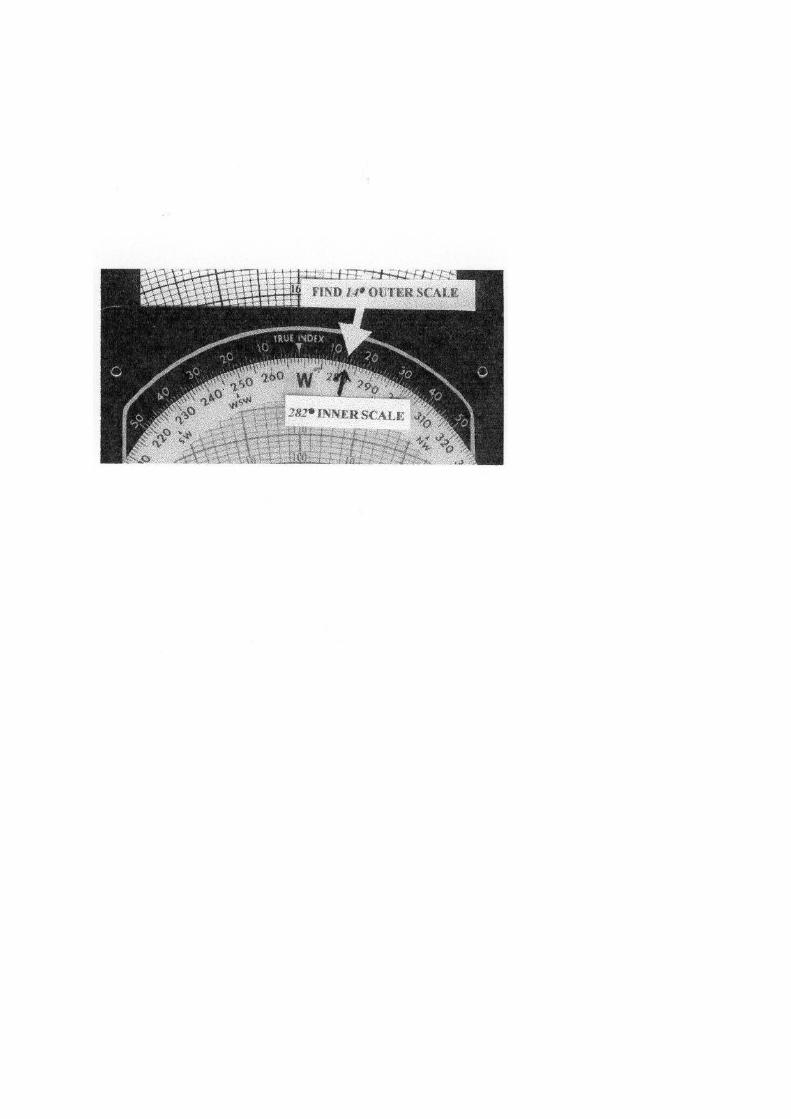
Step 5……….If the heading line is to the RIGHT of the track line then add the drift angle to the track to work outthe heading .If the heading is LEFT of the track then subtract the drift angle to work out the heading.
DO NOT apply the drift in the wrong direction – the aircraft always heads into wind.
The wind always blows from the heading to the track so if you mark in the wind vector with a line and arrows an error ismuch less likely. If your mathematics is not good you can use the scale adjacent to the INDEX as shown opposite.As shown here, the heading is 14 to the RIGHT of track. If we look at 14 degrees to the right on the outer scale and readoff opposite on the inner scale we see that the heading is 282.Ignore any words labelled on you Flight Computer near this scale as they often refer to a different way of using the WizzWheel.
Remember that all the directions (wind, heading and track) used so far are referenced to True North. You will need toapply variation at this stage (Add West \ Subtract East) to arrive at the magnetic heading [HDG(M)] which you will usein flight.
(Calculation of Compass heading, HDG(C), using Deviation is not included here but you need to understand this for thePPL theory exam.)

Step 6……….Read the number under the central dot. This is the Ground Speed. It measures 67Kt here.
Be sure you’ve not set the TAS under this central dot.
This may not be exactly over one of the numbers so use the small squares to arrive at the correct figure.

THE CALCULATOR SIDE OF THE WIZZ WHEEL
.
When you begin your cross country flying you may be surprised at the emphasis your instructor will place on TIME andthe use of your watch!
For this reason, having calculated your Ground Speed and having measured the distance between waypoints using a rule ofappropriate scale, you need to work out the length of time each leg will take.
If the calculator side of your Flight Computer is not clearly marked, for this type of calculation (the most common) youmight care to mark in “MILES” over the outer fixed part and “MINUTES” on the inner movable disc: it will help you toignore the numerous other labels which are not relevant at this stage.
N.B. there is an amazing number of calculations you can perform with this side of the Wizz Wheel. Until you areconfident with calculating time taken from ground speed and distance it may be advisable to limit yourself this sort ofcalculation as it is very easy to get confused!!
Step A……….Rotate the inner disc till 60 minutes is opposite the Ground Speed on the outer scale (Miles)
We have calculated G/S to be 67Kt.
By setting Ground Speed against 60 minutes we are saying that this is the number of miles travelled (over the ground) in60 minutes.
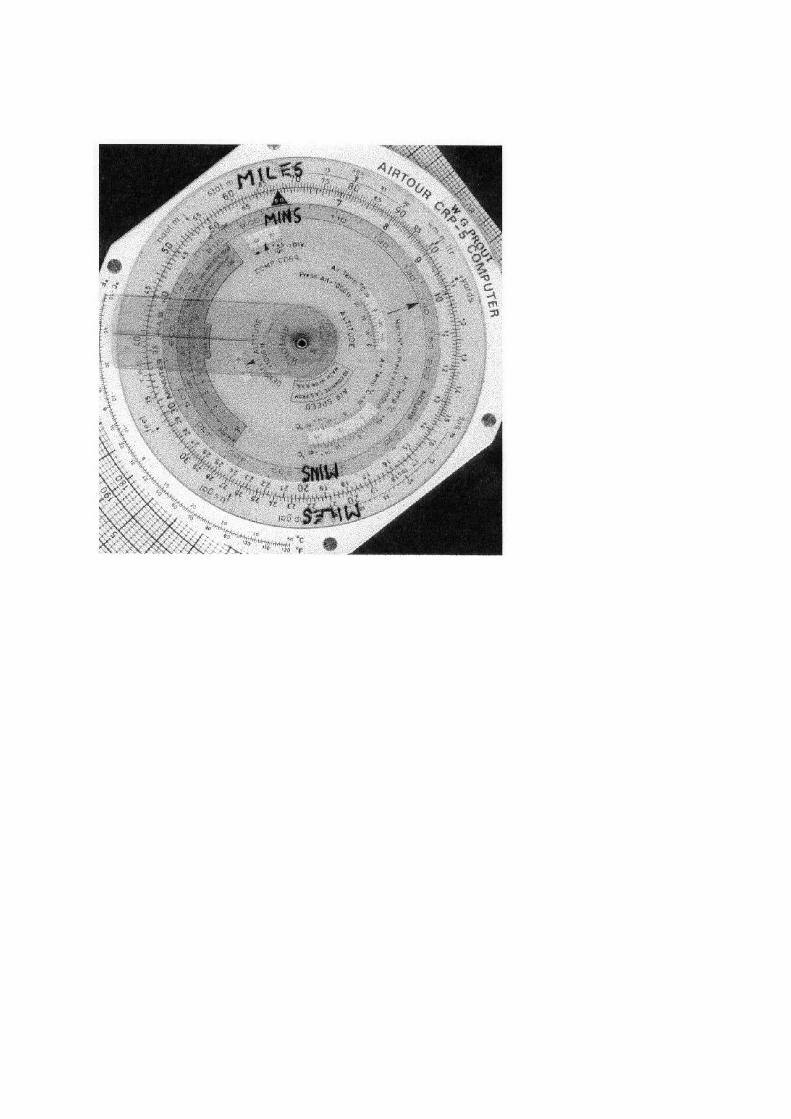
Step B……….Look on the outer scale for the number of miles you have to travel on that leg of the PLOG.
Let’s assume that this distance measures 45 nautical miles on your chart.
Remember - Miles are on the Outer Scale. Don’t look for this figure on the inner scale which is for Minutes.
The illustration shows a Nav Computer with a transparent arm which can be rotated till its centreline overlies the length of leg on the outer scale!


Step C……….Read the figure on the inner scale which is opposite the distance figure you have noted on the outerscale. This is the number of minutes taken to fly that leg.In this example it is 40 Mins..
Remember - Miles on the Outer Scale and Minutes on the Inner Scale.
The transparent plastic arm makes it easier to read off one figure against the other but it is still quite straight-forward evenif your calculator doesn’t have such an arm.
When you come to calculate the time for the next leg don’t forget to set the new Ground Speed against the 60 minutemark.


AND FINALLY………..
WHEN YOU HAVE COMPLETED YOUR PLOG:-
Draw the wind arrow on your chart remembering that the wind direction is FROM. Then check all the calculatedfigures in the PLOG and be sure that they make sense.
-are the headings all on the windward side of the desired tracks? The wind always blows from the Headingto the Track.
-is the Groundspeed greater or less than the Airspeed in accordance with the wind direction?
-from the Ground Speed and the length of the legs, does the time make sense? It’s even possible to make it10x too large or too small!
Errors in the PLOG will be very difficult to spot when you are also aviating and communicating so
Get it right afore you go!
OTHER WIZZ WHEEL
CALCULATIONS
When you are confident and competentat performing these two calculations you may care to investigate some of the other possibilities of the WizzWheel, bearing in mind that the batteries of electronic calculators have a nasty habit of being flat at the timeyou most need them!
They are:
Calculation of X-wind component.
Trip Fuel Requirments.
Conversions
-metres / feet
-miles / kilometres
-gallons / litres
-kilograms / pounds
More advanced functions:
IAS / TAS
Pressure altitude / density altitude

SUMMARY
1.Set the wind direction against the INDEX.Page 12
2.Draw the wind vector the correct length above the dot. Mark arrows and “T”.Page 14
3.Set TRK against the INDEX.Page 16
4.Adjust slide until TAS is under the “T”Page 18
5.Read drift angle.Page 20
6.Calculate HDG.Page 22
7.Apply Variation to get HDG(M)Page 22
8.Read G/S under central dot.Page 24
Using the other side of Wizz Wheel
9.Set 60 minutes against G/S.Page 26
10 Look for length of leg on outer scalePage 28
and read off minutes on inner scale.Page 30
If you have problems with any of these steps refer back to the page whose numberis shown.