the winning formula? a framework for choosing an
TRANSCRIPT

APCP-T(20)04
1
ADVISORY PANEL ON CONSUMER PRICES – TECHNICAL
The winning formula? A framework for choosing an appropriate index method for use on web scraped and scanner data
Status: Work in progress Expected publication: Alongside minutes
Purpose
1. A framework that assesses index number methods against pre-determined quality criteria has been developed to ensure that the methods chosen to produce UK consumer price statistics best meet user needs. Available index number methods have recently been assessed against this framework to produce a shortlist of appropriate methods for use in UK consumer price statistics.
Actions
2. Members of the Panel are invited to:
a. comment on the questions and scoring system used within the framework to assess the appropriateness of elementary aggregate methods
b. advise on any competing literature with regards to the assessments that have been made for index number methods within the framework
c. comment on our plans for future work
Introduction
3. Paper APCP-S(18)03 set out a high-level vision for the Consumer Prices Data Collection Strategy, focusing on a move towards more automated forms of data collection. We proposed four key areas of further work required: obtaining robust sources of alternative data, methods research, assessing the impact on consumer price statistics and the development of systems to support the inclusion of new data sources.
4. In May 2019, we presented APCP-T(19)09; Shortlisting appropriate index methods for use on web scraped and scanner data to the Technical Panel. This discussed the appropriateness of elementary aggregate (EA) methods when applied to alternative data sources and highlighted our chosen criteria as important properties a method should possess. On the advice of the APCP-T, we have since discussed these criteria with the APCP-Stakeholder and applied weights to reflect the relative importance of each criterion. Table 1 provides the criteria and their respective weights. The framework is detailed further in Annex A.
Table 1: Criteria weights within the Index Number Methods Framework.
Criterion Weight
a. Theoretical properties 55%
b. Resource 20%
c. Interpretability 15%
d. Flexibility 10%
e. Coherence 0% (used as a secondary filter)
APCP-T(20)04
2
5. Index number methods can be grouped into weighted and un-weighted formulae depending on whether quantities have been observed alongside prices (quantity data are needed to derive expenditure shares, with which price changes are weighted together in weighted indices). They can also be categorised as being either bilateral or multilateral. Bilateral indices consider price changes between two time periods, although these are not necessarily consecutive. By comparison, multilateral indices make use of three or more time periods simultaneously in the index formula, and typically make use of data in the intermittent time periods.
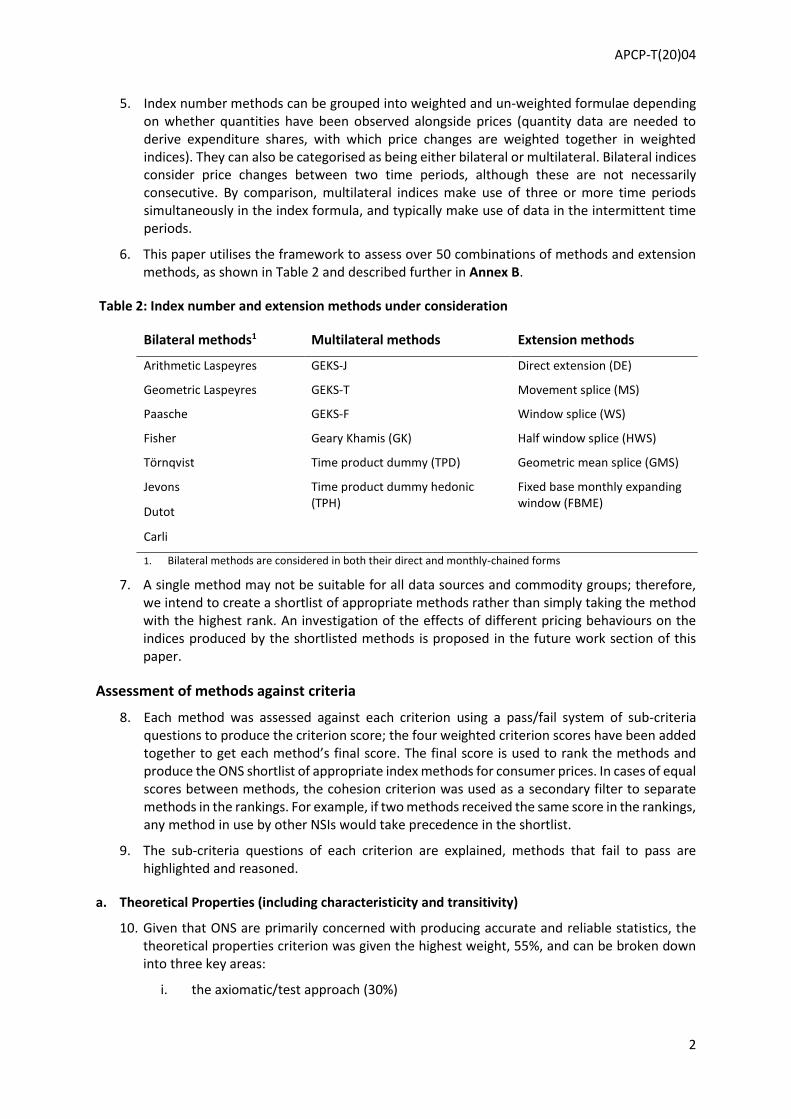
6. This paper utilises the framework to assess over 50 combinations of methods and extension methods, as shown in Table 2 and described further in Annex B.
Table 2: Index number and extension methods under consideration
Bilateral methods1 Multilateral methods Extension methods
Arithmetic Laspeyres GEKS-J Direct extension (DE)
Geometric Laspeyres GEKS-T Movement splice (MS)
Paasche GEKS-F Window splice (WS)
Fisher Geary Khamis (GK) Half window splice (HWS)
Törnqvist Time product dummy (TPD) Geometric mean splice (GMS)
Jevons Time product dummy hedonic (TPH)
Fixed base monthly expanding window (FBME)
Dutot
Carli
1. Bilateral methods are considered in both their direct and monthly-chained forms
7. A single method may not be suitable for all data sources and commodity groups; therefore, we intend to create a shortlist of appropriate methods rather than simply taking the method with the highest rank. An investigation of the effects of different pricing behaviours on the indices produced by the shortlisted methods is proposed in the future work section of this paper.
Assessment of methods against criteria
8. Each method was assessed against each criterion using a pass/fail system of sub-criteria questions to produce the criterion score; the four weighted criterion scores have been added together to get each method’s final score. The final score is used to rank the methods and produce the ONS shortlist of appropriate index methods for consumer prices. In cases of equal scores between methods, the cohesion criterion was used as a secondary filter to separate methods in the rankings. For example, if two methods received the same score in the rankings, any method in use by other NSIs would take precedence in the shortlist.
9. The sub-criteria questions of each criterion are explained, methods that fail to pass are highlighted and reasoned.
a. Theoretical Properties (including characteristicity and transitivity)
10. Given that ONS are primarily concerned with producing accurate and reliable statistics, the theoretical properties criterion was given the highest weight, 55%, and can be broken down into three key areas:
i. the axiomatic/test approach (30%)

APCP-T(20)04
3
ii. transitivity (15%)
iii. characteristicity (10%)
Transitivity and Characteristicity have been grouped into the Theoretical Properties criterion as all measures are concerned with statistical accuracy.
i. The axiomatic/test approach
11. There are already a known set of tests to measure a method’s suitability from a theoretical stand point, known as the axiomatic/test approach. Understanding of the axiomatic approach can be found in the ILO manual (Chapter 16) for bilateral index methods, and in Diewert’s chapter in International and Interarea Comparisons of Income, Output, and Prices, for multilateral methods.
12. There is an argument to be made that not all the axioms are as important as each other and, in principle, this presents an aggregation problem of its own, that is how to weight the different axioms. However, for the purpose of this framework, each of the axioms were given an equal weight. The scores for each method can be found in Annex C. For the bilateral methods, Fisher scores the highest and Törnqvist the lowest. For the multilateral methods, GEKS-T, GEKS-F and Geary-Khamis score the highest equally, while the hedonic approaches score the lowest.
13. There are two other approaches that are often considered when theoretical properties are discussed, the stochastic approach and the economic approach. The economic approach was given a zero weight within this framework owing to the fact that we do not currently consider a Cost of Living Index (COLI) our primary target1. The stochastic approach was considered but also given zero weight for the reasons highlighted in section 6 of Diewert’s “Note on the Stochastic Approach to Index Numbers”.
ii. Transitivity
14. Transitive indices are free of chain drift, that is they are directly equivalent to the direct, or bilateral index calculated between the start and end periods. In the static-universe, a lack of transitivity is not overly important since chaining is not required. However, transitivity is an important consideration in a dynamic-universe context. High frequency chaining can better account for dynamic prices and high churn but can also result in significant chain drift as a result of non-symmetric effects on quantities sold and expenditure shares before and after products are on sale. Some dynamic methods can be transitive, including some weighted multilateral indices in their purest form.
15. Within our framework, transitivity was measured over two sub-questions, as displayed in Table 3.
Table 3: Assessment of index number methods against the transitivity sub-criteria
Weight Question Sub-criteria question Failing methods (with extensions)
5% TP4 Is the method transitive across the whole of the time frame?
Paasche (Fixed base & Chained) Arithmetic Laspeyres (Fixed base & Chained) Fisher (Fixed base & Chained) Törnqvist (Fixed base & Chained) Carli (Fixed base & Chained) Geometric Laspeyres (Fixed base & Chained)
1 The economic approach considers how well an index number method approximates the consumers’ cost of living. The CPIH and CPI are not intended to approximate cost of living indices.

APCP-T(20)04
4
10% TP5 Is the method transitive across a given time window (13 months)?
Paasche (Fixed base & Chained) Laspeyres (Fixed base & Chained) Fisher (Fixed base & Chained) Törnqvist (Fixed base & Chained) Carli (Fixed base & Chained) Geometric Laspeyres (Fixed base & Chained) GEKS-J (FBME) GEKS-T (FBME) GEKS-F (FBME) TPD (FBME) TPH (FBME)
16. The reason that FBME extension causes the methods (other than GK) to fail TP5 is because the only time it uses a full 13 months of data is in the final month of each year. You could say that each month of data over a year becomes more transitive, but less characteristic of the binary comparisons.
17. GK is the exception that has been given a pass using a FBME extension. This is because, by design, the GK compares each period to a base period, rather than to each intermittent period. Therefore, the expanding window will not alter the transitive nature over the 13-month window.
iii. Characteristicity
18. Characteristicity requires transitive multilateral comparisons between member periods to
retain the essential features of the binary comparisons that existed between them before
transitivity. Prices from distant periods may unduly influence multilateral comparisons and we
feel that the impact of these influences should be kept to a minimum when they are
introduced into the binary comparison. For example; any multilateral method using a window
of nine quarters would have data from over two years previous feeding into its index
calculation. The resulting index should be more characteristic of the price movements that
occurred within that month, and less characteristic of price movements observed two years
ago. Characteristicity was measured over two sub-questions as displayed in Table 4.
Table 4: Assessment of index number methods against the characteristicity sub-criteria
Weight Question code
Sub-criteria question Failing methods (with extensions)
2% TP6 Is the price comparison accurate with the binary time periods being compared?
GEKS-J (DE, MS, WS, HWS, GMS) GEKS-T (DE, MS, WS, HWS, GMS) GEKS-F (DE, MS, WS, HWS, GMS) GK (MS, WS, HWS, GMS) TPD (DE, MS, WS, HWS, GMS) TPH (DE, MS, WS, HWS, GMS)
8% TP7 Is the price comparison accurate with the binary time periods being compared across the time window (13 months)?
19. The reason each multilateral method fails using one of the four splicing extension methods
(Movement, Window, Half-Window, Geometric Mean), is because each new period index is
spliced on to the previous period’s price index, and that price index was spliced on to the

APCP-T(20)04
5
period before that’s index. So essentially there will always be some contribution of a distant
price movement affecting the current index. Although as time moves forward any affect will
become more and more diluted by the continued splicing.
20. More important is that characteristicity is present over the chosen window and provided that
the window length is suitable and not overly long, each splicing extension method will reflect
the binary comparisons between periods.
21. The FBME extension approach calculates indices with respect to a base month so will reflect
the binary period comparisons.
b. Resource
22. This criterion was given a weight of 20%, it considers each method with the aim of making the
most effective use of alternative data in our suite of consumer prices. A change of method
could also offer the chance for automating routine manual processes and improving the use
of human resources, making it more viable to produce more frequent or timely outputs.
23. Although resource has a relatively low weight within the framework, any methods that would
hinder the timeliness or frequency of UK consumer price indices will not be considered. The
resources criteria were measured over four sub-questions, as displayed in Table 5.
Table 5: Assessment of index number methods against the resources sub-criteria
Weight Question code
Sub-criteria question Failing methods (with extensions)
8% R1 Can this method script be maintained without regular human input?
ESSENTIAL R2 Are the information processing requirements reasonable and manageable? – Method is no longer considered if fails.
GEKS-J (DE) GEKS-T (DE) GEKS-F (DE) TPD (DE) TPH (DE)
4% R3 Can we scale up the amount of information used without scaling up manual effort?
8% R4 Can we scale up the amount of information used within the ONS infrastructure?
24. Each of the resource’s sub-questions were assessed for each method based on the expected size and dimensions of the input data to be used, and the current capabilities within our infrastructure. Should either of these alter, each method should be reassessed. Given the current structure of the scanner and web-scraped data sets, and the infrastructure available to compute the index, each method passes R1, R3 and R4.
25. It is worth acknowledging bilateral methods will be less intensive than multilateral methods as they require less periods of data to compute the statistical output. Methods that use expenditure data (weighted methods) and/or product characteristics (hedonic methods), will also place higher burden on information resources due to the increase of variables used in the computation of the index. Simply put, as the input data sets becomes larger or more complex,

APCP-T(20)04
6
in either number of variables or number of products, these more complex methods will sooner find computational problems (slow processing speed and errors).
26. R2 has been deemed as an essential quality for any method to be chosen. All multilateral methods in combination with the direct extension approach failed this question. This is because the methods would not be producible on a monthly basis; a full year of data is required to make each month’s calculation, so it is not until December in each year that you could produce January’s index. The FBME will produce timely monthly indices whilst still adopting the same direct approach to annual chaining.
c. Interpretability
27. The interpretability criterion has been given a weight of 15%. It is vital for all statistical agencies to be transparent with the statistics that they produce, and justify the chosen methods used in published statistics. The interpretability criterion assesses how easily understood each method is for users of consumer prices indices.
28. While interpretability has a relatively low weight within the framework, it is deemed essential that the price movements calculated are understood by those involved in the implementation and those who use the output data. Any methods that do not meet this, as a minimum requirement, are not considered further within the assessment. The interpretability criteria were measured over three questions, as displayed in Table 6.
Table 6: Assessment of index number methods against the resources criteria
Weight Question code
Sub-criteria question Failing methods (with extensions)
10% I1 Is the method recognised and well represented in the ILO manual or other trusted literature?
GEKS-J (HWS, FBME) GEKS-T (HWS, FBME) GEKS-F (HWS, FBME) GK (DE, MS, WS, HWS, GMS) TPD (DE, FBME, MS, HWS, GMS) TPH (DE, FBME, MS, WS, HWS, GMS)
ESSENTIAL I2 Are the price movements calculated understood by those involved in the implementation, and/or those who use the output data? – Method is no longer considered if fails.
5% I3 Can the method be easily explained to a non-technical audience?
GEKS-J (WS, HWS, GMS) GEKS-T (WS, HWS, GMS) GEKS-F (WS, HWS, GMS) GK (WS, HWS, GMS) TPD (DE, FBME, MS, WS, HWS, GMS) TPH (DE, FBME, MS, WS, HWS, GMS)
29. The bilateral methods and the more established multilateral methods are recognised in the ILO manual and other significant literature. TPD and TPH are relatively new approaches, both considered as more product detail is collected than previously. While more literature is being produced on these hedonic methods, the focused research and implementation by NSIs has been predominantly on the TPD with a window splice, also knows as the fixed effects window splice (FEWS) approach.

APCP-T(20)04
7
30. Similarly, GK has been shown to produce reliable indices with the FBME extension method, as suggested by A.Chessa (A Comparison of Price Index Methods for Scanner Data, 2017), and as such there is little literature found, to date, that suggests alternative extension methods with GK.
31. The GEKS multilateral methods appear most regularly in the ILO manual and trusted research papers. Although due to the inconsistency of the balance between transitivity and characteristicity as each month is added, GEKS is not documented combined with FBME approach.
32. It was considered that interpretability for TPD and TPH may be more difficult for those from a non-statistical background due to the regression approach used to produce the statistical relationships and estimate decomposition.
d. Flexibility
33. This criterion has weight of 10%. It is advantageous for an index method to be flexible enough to be used for a range of purposes, data sources and item types. The flexibility criterion assesses how methods can be used for new products and data sources.
34. Flexibility has a small weight within the framework because if the method cannot adapt to the addition or removal of products, there are additional options to ensure that these behaviours can be accounted for. For example, we can look at following groups of products over time rather than following individual products over time. This would allow product churn to be controlled for without necessarily needing a flexible index number method.
35. It also is not a primary concern if the method is not flexible enough to be used for both scanner data (including quantity information) and web-scraped data (excluding quantity information) as different methods can be used for different data sources and weighted together, or expenditure approximations (using page rankings, for example) could be used.
36. The flexibility criteria were measured over three questions, as displayed in Table 7.
Table 7: Assessment of index number methods against the flexibility criteria
Weight Question code
Sub-criteria question Failing methods (with extensions)
3.33% F1 Does the method adapt to removal of old products?
3.33% F2 Does the method adapt to addition of new products?
Paasche (Fixed base) Arithmetic Laspeyres (Fixed base) Fisher (Fixed base) Törnqvist (Fixed base) Jevons (Fixed base) Dutot (Fixed base) Carli (Fixed base) Geometric Laspeyres (Fixed base) GEKS-J (DE, FBME) GEKS-T (DE, FBME) GEKS-F (DE, FBME) TPD (DE, FBME) TPH (DE, FBME)
3.33% F3 Does the method utilise available quantity data?
Jevons (Fixed base & Chained) Dutot (Fixed base & Chained) Carli (Fixed base & Chained) GEKS-J (DE, FBME, MS, WS, HWS, GMS)

APCP-T(20)04
8
37. There are many benefits to using a fixed base approach to calculating price indices however one drawback is that, without manual intervention, new products can only be introduced to the basket in the first period after rebasing. Therefore, all methods that make use of a fixed base fail F2.
Results - Index methods shortlisted for use on dynamic data sets
38. Two shortlists have been created using the framework described within this paper; one for data that has quantity information available (or approximated) and one where no quantity data are available, and quantities are unable to be approximated.
39. Table 8 provides the shortlisted methods for data where quantity information (whether actual or approximated) is available.
Table 8. Shortlisted methods for dynamic data with quantity information
40. Although the method did not rank within the top 10 on the shortlist, FEWS was also added to the shortlist using the cohesion criteria. It was the highest scoring approach that utilises hedonic pricing, and is widely acknowledged, if not used, by NSIs for scanner data sets in consumer statistics.
41. GEKS-Törnqvist with a movement splice (RYGEKS-T) and GEKS-Fisher with a movement splice (RYGEKS-F) scored equally in the shortlist. Again, the cohesion filter was used to rank these methods in the shortlist. Therefore RYGEKS-T has become the second-choice method (as other NSIs have begun to adopt this approach), with RYGEKS-F third-choice. For the same reason, chained monthly Dutot ranks higher than RYGEKS-J.
42. Table 9 provides the shortlisted methods for data where quantity information (whether actual or approximated) is unavailable.
Method Extension Rank Score Uses Quantity Data
Geary-Khamis FBME 1 0.95 Yes
GEKS-Törnqvist Movement Splice 2 0.93 Yes
GEKS-Fisher Movement Splice 3 0.93 Yes
Jevons Chained Monthly 4 0.90667 No
Dutot Chained Monthly 5 0.88667 No
GEKS-Jevons Movement Splice 6 0.88667 No
GEKS-Törnqvist Geometric Mean Splice =7 0.88 Yes
GEKS-Fisher Geometric Mean Splice =7 0.88 Yes
GEKS-Törnqvist Window Splice =7 0.88 Yes
Time Product Dummy Window Splice (FEWS) 17 0.83 Yes

APCP-T(20)04
9
Table 9. Shortlisted methods for dynamic data without quantity information
43. While fixed base Jevons, fixed base Dutot and GEKS-J extended with a geometric mean splice were not included in the earlier shortlist when quantity information is available, the decision was made to include them here to add to the available options when quantity data is unavailable and will provide further comparison with the first-choice approach; chained Jevons.
Future Work
44. A visualisation of the process for choosing an appropriate index method for each unique item
is shown in Figure 1. This paper addresses the left side of this figure (in blue), while future
work will begin to address the middle (green) and right side (yellow) of the figure.
Figure 1. Process for choosing an appropriate index number method for each unique item
Method Extension Rank Score Uses Quantity Data
Jevons Chained Monthly 4 0.90667 No
Dutot Chained Monthly 5 0.88667 No
GEKS-Jevons Movement Splice 6 0.88667 No
Jevons Fixed Base 12 0.87333 No
Dutot Fixed Base 13 0.85333 No
GEKS-Jevons Geometric Mean Splice 14 0.83667 No

APCP-T(20)04
10
45. The proposed follow on from this paper is therefore to take the shortlisted methods (Tables
8 and 9) and apply them to synthetic data sets that feature certain characteristics (for
example, high product churn, high price variance, clearance prices) that could be problematic
for an index number method, then suggest an appropriate alternative method from the
shortlist, should GK be unsuitable.
46. Future work will include case studies within the areas of the inflation basket that have been
predetermined as high priority areas for the use of web scraped or scanner data, and
comment on the appropriateness of GK and the shortlisted methods for each item. These
items were prioritised with APCP-S in September 2019, and include technological goods,
package holidays, clothing, used cars, chart collected items (CDs, DVDs, Books), airfares, rail
fares and groceries.
Alexander Rose Methodology, Office of National Statistics January 2020
List of Annexes
Annex A Summary of criteria & weights
Annex B Technical description of the shortlisted methods
Annex C Axiomatic assessment of bilateral and multilateral methods

APCP-T(20)04
11
Annex A – Summary of criteria and weights
1. Our guidelines for measuring statistical quality outline best practice for measuring and reporting on the statistical quality of outputs. These guidelines, in combination with the comprehensive literature review carried out in APCP-T(19)09, and input from technical experts and consumer prices stakeholders has led to the following criteria and associated weights.
Resources - 20%
2. The resources criteria would fall into the timeliness dimension of the ONS quality criteria and aims to answer the question “does this method enable more effective use of human and information resources?”.
3. In terms of computing requirements and processing power needed, bilateral methods will be less intensive than multilateral methods as they require less periods of data to compute the statistical output. Methods that use expenditure data (weighted methods) and/or product characteristics (hedonic methods), will also place higher burden on information resources due to the increase of variables used in the computation of the index.
Theoretical Properties – 55%
4. This criterion belongs to the accuracy and reliability dimension and can be broken down into three sub criteria; axiomatic approach to index numbers (30%); transitivity (15%); and characteristicity (10%).
5. The axiomatic/test approach is where the index is tested against some desirable properties (see International Labour Organisation (ILO) consumer price index manual chapter 16).
6. Price indices possess the transitive property when they give the same result as an index calculated directly between two periods using the same data. Transitivity is a desirable property for price comparisons because the results will be independent of the choice of base period.
7. Characteristicity is the property that requires transitive multilateral comparisons between member periods to retain the essential features of the binary comparisons that existed between them before transitivity, as prices from distant periods may unduly influence multilateral comparisons.
Flexibility – 10%
8. It is an advantage for an index method to be flexible enough to be used for a range of purposes, data sources and types of items. The flexibility criterion assesses how methods can be used for new products and data sources and falls into the cohesion and comparability dimension.
Interpretability – 15%
9. The accessibility and clarity dimension is relevant to this criterion. It is vital for all statistical agencies to be transparent with the statistics they produce, and justify the chosen methods used in published statistics. There are two aspects to the interpretability criterion; firstly, how easily understood the methods are for users to understand and; secondly, whether the price movements that each index produces are easy to interpret, particularly the products/categories of greatest influence and why.
Cohesion – No Weight, used as a secondary filter
10. Unsurprisingly this criterion coincides with the cohesion and comparability dimension within the guidelines. The cohesion criterion is twofold; internal cohesion across different areas of

APCP-T(20)04
12
the basket, and different data sources and; external cohesion with other NSI to aid comparison between countries.
11. The decision was made, given user feedback, that the cohesion criteria should be used as a secondary filter, to separate equal scoring methods, rather than to contribute to a method score. This is because a method should be chosen for its qualities, not simply because others are using the method. Ideally, should other NSI prioritise similar criteria as ONS, they would reach the same chosen methods for their indices.
Annex B –Technical descriptions of the shortlisted methods
1. The Geary-Khamis (GK) index was developed for PPPs, but unlike the GEKS, which compares
each period to each other, the GK index compares each period to a base period. It is an
implicit price index that divides a value index by a weighted quantity index. Using notation
like Chessa [2016] it is defined as:
𝑃𝐺𝐾𝑡 =
∑ 𝑝𝑖𝑡𝑞𝑖
𝑡𝑖∈𝑆∗
∑ 𝑝𝑖
𝑡0𝑞𝑖
0𝑖∈𝑆∗
∑ 𝑣𝑖𝑞𝑖𝑡
𝑖∈𝑆∗
∑ 𝑣𝑖𝑞𝑖0
𝑖∈𝑆∗
(1.1)
where the weights 𝑣𝑖 are as follows:
𝑣𝑖 = ∑ 𝜙𝑖𝑧 𝑝𝑖
𝑧
𝑃𝐺𝐾𝑧
𝑧∈𝑇
𝜙𝑖𝑧 =
𝑞𝑖𝑧
∑ 𝑞𝑖𝑠
𝑠∈𝑇
2. The GEKS-T is calculated as the geometric mean of the ratios of all matched-model bilateral
indices 𝑃𝑙,𝑡and 𝑃𝑙,𝑜where each period, l, is taken in turn as the base. The GEKS-T method can
be expressed as:
𝑃𝐺𝐸𝐾𝑆−𝑇(0,𝑡)
= ∏ (𝑃𝑇0,𝑙𝑃𝑇
𝑙,𝑡)1
𝑇+1𝑇𝑙=0 (1.2)
3. From the empirical viewpoint it can be expected that the GEKS-Fisher and the GEKS-Törnqvist
indices closely approximate each other. The GEKS-F method can be expressed as:
𝑃𝐺𝐸𝐾𝑆−𝐹(0,𝑡)
= ∏ (𝑃𝐹0,𝑙𝑃𝐹
𝑙,𝑡)1
𝑇+1𝑇𝑙=0 (1.3)
4. The Jevons index is calculated as a geometric mean of current period price relatives. The
Jevons formula is used in over 60% of items in the UK CPI but cannot be used when prices
fall to exactly zero. (Paul Johnson review, UK consumer price statistics - Chapter 10, 2015)
𝑃𝐽𝑒0,𝑡 = √∏
𝑝𝑖𝑡
𝑝𝑖0
𝑛
𝑖=1
𝑛
= √∏ 𝑅𝑖0,𝑡
𝑛
𝑖=1
𝑛
(1.4)

APCP-T(20)04
13
5. The Dutot index is calculated as the ratio of average prices in the current and base periods
(given a matched basket between both periods) and is usually used for homogeneous items
as the formula implicitly gives greatest weight to the highest priced product. The Dutot
formula is used for a small number of items in the UK CPI (generally those where the Jevons
formula cannot be applied).
𝑃𝐷𝑢0,𝑡 =
1
𝑛∑ 𝑝𝑖
𝑡𝑛𝑖
1
𝑛∑ 𝑝𝑖
0𝑛𝑖
= ∑ 𝑅𝑖0,𝑡 𝑝𝑖
0
∑ 𝑝𝑖0
𝑖𝑖 (1.5)
6. There is no justification in favouring taking the expenditure weights from either the base or
current periods, hence Fisher proposed taking an average of the Paasche and Laspeyres
indices to derive a single measure of price change. Taking a geometric mean leads to the so-
called Fisher ideal price index.
𝑃𝐹0,𝑡 = √𝑃𝐿
0,𝑡𝑃𝑃0,𝑡 (1.6)
Where,
𝑃𝐿0,𝑡 =
∑ 𝑝𝑖𝑡𝑞𝑖
𝑏𝑛𝑖=1
∑ 𝑝𝑖0𝑞𝑖
𝑏𝑛𝑖=1
(1.7)
𝑃𝑃0,𝑡 =
∑ 𝑝𝑖𝑡𝑞𝑖
𝑡𝑖
∑ 𝑝𝑖0𝑞𝑖
𝑡𝑖
(1.8)
7. The GEKS-J price index formula is defined as follows:
𝑃𝐺𝐸𝐾𝑆−𝐽(0,𝑡)
= ∏(𝑃𝐽0,𝑖
𝑡
𝑖=0
𝑃𝐽𝑖,𝑡)
1𝑡+1 (1.9)
8. The TPD aims to decompose the price of a product into how much of the price comes from
being that specific product and how much comes from it being observed in a specific time
period. The TPD method uses a regression approach that is like those of hedonic based
methods - it uses the statistical relationship between prices, products and time to estimate
the decomposition. The TPD model is expressed as:
ln 𝑝𝑖𝑡 = 𝛼 + ∑ 𝛿𝑡𝐷𝑖
𝑡
𝑇
𝑡=1
+ ∑ 𝛾𝑖𝐷𝑖 + 휀𝑖𝑡
𝑁−1
𝑖=1
(1.10)
where,
ln 𝑝𝑖𝑡 = log of price for item i in period t
𝛼= intercept term 𝛿𝑡= time parameter corresponding to time period t
𝐷𝑖𝑡= time dummy variable, equal to 1 if the price observation 𝑝𝑖
𝑡 was observed to period t and 0 otherwise 𝛾𝑖= product parameter corresponding to product i
𝐷𝑖= product dummy variable, equal to 1 if the price observation 𝑝𝑖𝑡pertains to item i and 0

APCP-T(20)04
14
otherwise
휀𝑖𝑡= error term
Extension methods
9. The movement splice method involves joining a new period into a new multilateral
comparison window and extending the index based on a price comparison from this new
window. The index level in this new period is calculated by multiplying the previous
published index level by the price movement between the previous and the new period, as
estimated using the new multilateral window (Ivancic, Fox and Diewert 2011). This is
equivalent to the approach used to produce chained bilateral indices and can be expressed
as:
𝑃𝑀𝑆𝑡 = 𝑃𝑡−1 × 𝑃𝑡−1,𝑡(𝑡 − 𝑇) (1.11)
where, 𝑃𝑀𝑆
𝑡 = index level in period t 𝑃𝑡−1= index level in the previous period 𝑃𝑡−1,𝑡(𝑡 − 𝑇) = price movement between t-1 and t using the latest multilateral window (of length T) to generate a price comparison between t-1 and t.
10. The window splice method, proposed by Krsinich (2016), uses the rolling window approach
to extend the index when a new period of data is available, similarly to the movement splice.
However, the methods use price movements from the latest multilateral comparison
window to update the index differently. Whereas the movement splice method joins the last
period-on-period movement from this window, the window splice method joins on the
latest full window onto the index level of T periods earlier. This can be expressed as:
𝑃𝑊𝑆𝑡 = 𝑃𝑡−1 ×
𝑃𝑡−𝑇,𝑡(𝑡−𝑇)
𝑃𝑡−𝑇,𝑡−1 (𝑡−𝑇−1) (1.12)
where, 𝑃𝑊𝑆
𝑡 = index level in period t 𝑃𝑡−1= index level in the previous period 𝑃𝑡−𝑇,𝑡(𝑡 − 𝑇)= price movement between t-T and t using the latest multilateral window between t-T and t 𝑃𝑡−𝑇,𝑡−1 (𝑡 − 𝑇 − 1)= price movement between t-T and t-1 using the previous multilateral window between t-T-1 and t-1.
11. FBME uses a time window with a fixed base month, which is shifted each year to the next
base month. To include data from a new month the time window is extended with each
month. To ensure price indices are free of chain drift the indices are calculated with respect
to the base month with the most recent set of parameter values. FBME can be expressed as:
𝑃𝐹𝐵𝑀𝐸𝑡 = 𝑃(0,𝑡) (1.13)

APCP-T(20)04
15
where,
𝑃𝐹𝐵𝑀𝐸𝑡 = Price index in period t
𝑃0= Price index level in the base period
12. Diewert and Fox (2017) propose the use of a "mean splice" by taking the geometric mean of
all the price indices that are obtained using every possible link period, given the window
length.
The ABS have identified some issues with movement and window splicing and highlight the
use of mean splice instead; the movement splice can yield downward drift due to
disappearing items with unusually low prices whereas the window splice can yield
downward drift due to new items entering with unusually high prices. However, the mean
splice acts more like a movement splice near the start of the window and more like a
window splice near the end; mitigating problems with disappearing and new items.

APCP-T(20)04
16
Annex C – Axiomatic assessment of bilateral and multilateral methods
Reference Bilateral Axiom Property Paasche Laspeyres Fisher Törnqvist Jevons Dutot Carli Geo
Laspeyres
TP1 Positivity Yes Yes Yes Yes Yes Yes Yes Yes
TP2 Continuity Yes Yes Yes Yes Yes Yes Yes Yes
TP3 Identity Yes Yes Yes Yes Yes Yes Yes Yes
TP4 Fixed Basket Test Yes Yes Yes No Yes Yes Yes Yes
TP5 Proportionality in current prices Yes Yes Yes Yes Yes Yes Yes Yes
TP6 Inverse Proportionality in base prices Yes Yes Yes Yes Yes Yes Yes Yes
TP7 Invariance to proportional changes in current quantities Yes Yes Yes Yes N/A N/A N/A Yes
TP8 Invariance to proportional changes in base quantities Yes Yes Yes Yes N/A N/A N/A Yes
TP9 Commodity reversal Yes Yes Yes Yes Yes Yes Yes Yes
TP10 Invariance to change in units of measurements Yes Yes Yes Yes Yes No Yes Yes
TP11 Time reversal test No No Yes Yes Yes Yes No No
TP12 Quantity reversal test No No Yes No N/A N/A N/A No
TP13 Price reversal test No No Yes No No No No No
TP14 Mean value test for prices Yes Yes Yes Yes Yes Yes Yes Yes
TP15 Mean value test for quantity Yes Yes Yes No N/A N/A N/A Yes
TP16 Paasche and Laspeyres bounding test Yes Yes Yes No No No No Yes
TP17 Monotonicity in current prices Yes Yes Yes No Yes Yes Yes Yes
TP18 Monotonicity in base prices Yes Yes Yes No Yes Yes Yes Yes
TP19 Monotonicity in current quantities Yes Yes Yes No N/A N/A N/A Yes
TP20 Monotonicity in base quantities Yes Yes Yes No N/A N/A N/A Yes
TP21 Additivity Yes Yes No No No No No Yes
Bilateral Axiom Score 0.257143 0.257143 0.285714 0.157143 0.24 0.22 0.22 0.257143

APCP-T(20)04
17
**These properties may not hold after extension
Axiom
Reference Multilateral Axiom Property GEKS-J GEKS-F GEKS-T
Geary-
Khamis
Time
Product
Dummy
Time
Product
Hedonic
TP22 Share Test Yes Yes Yes Yes Yes Yes
TP23 Proportional Quantities Test N/A Yes Yes Yes No No
TP24 Proportional Prices Test Yes Yes Yes Yes Yes Yes
TP25 Commensurability Test Yes Yes Yes Yes Yes Yes
TP26 Commodity Reversal Test Yes Yes Yes Yes Yes Yes
TP27 Multilateral period reversal test** Yes Yes Yes Yes Yes Yes
TP28 Monetary Units Test Yes Yes Yes Yes Yes Yes
TP29 Homogeneity in Quantities Test N/A Yes Yes No Yes Yes
TP30 Monotonicity Test** Yes Yes Yes No Yes Yes
TP31 Partitioning Test** No No No Yes No No
TP32 Bilateral Consistency in Aggregation Yes Yes Yes Yes No No
TP33 Additivity** No No No Yes No No
Multilateral Axiom Score 0.24 0.25 0.25 0.25 0.2 0.2

APCP-T(20)04
18
References
1. Chessa, A.G. (2016a). A New Methodology for Processing Scanner Data in the Dutch CPI.
2. Chessa, A.G. (2016b). Comparisons of the QU-Method with Other Index Methods for
Scanner Data.
3. Chessa, A.G. (2017a). The QU-method: A New Methodology for Processing Scanner Data.
4. Bentley & Krsinich (2017). Towards a big data CPI for New Zealand.
5. De Haan, J. and H.A. van der Grient (2011). Eliminating Chain Drift in Price Indices Based on
Scanner Data.
6. Diewert, W.E. (1999). Axiomatic and Economic Approaches to International Comparisons.
7. Diewert, W. E., & Fox, K. J. (2017). Substitution Bias in Multilateral Methods for CPI
Construction using Scanner Data.
8. Diewert, W.E. Note on the Stochastic Approach to Index Numbers.
9. ILO/IMF/OECD/UNECE/Eurostat/The World Bank (2004). Consumer price index manual:
Theory and practice. (Chapter 16)
10. Ivancic, L., W.E. Diewert and K. J. Fox (2011). Scanner Data, Time Aggregation and the
Construction of Price Indices.
11. Kalisch (2016). Making greater use of transactions data to compile the consumer price index,
Australia.
12. Mehrhoff J, European Commission (2018). Promoting the use of a publicly available scanner
data set in price index research and for capacity building.
13. ONS (2014a). Consumer Prices Indices - Technical Manual.
14. Rose, A. (2019). Shortlisting appropriate index methods for use on web scraped and scanner
data.
15. UN Taskforce lead by Chessa (2019). Scanner Data Methods: Instructional Guide.
16. Van der Grient, H.A. (2010). How to Analyse Changes in Price Indexes when Applying the
RYGEKS Formula.