the winner takes it all: event-related brain potentials reveal · pdf filethe winner takes it...
TRANSCRIPT

Full Terms & Conditions of access and use can be found athttp://www.tandfonline.com/action/journalInformation?journalCode=psns20
Download by: [Deutsche Sporthochschule Koeln], [Philip Furley] Date: 23 May 2016, At: 07:21
Social Neuroscience
ISSN: 1747-0919 (Print) 1747-0927 (Online) Journal homepage: http://www.tandfonline.com/loi/psns20
The winner takes it all: Event-related brainpotentials reveal enhanced motivated attentiontoward athletes’ nonverbal signals of leading
Philip Furley, Robert Schnuerch & Henning Gibbons
To cite this article: Philip Furley, Robert Schnuerch & Henning Gibbons (2016): The winnertakes it all: Event-related brain potentials reveal enhanced motivated attention toward athletes’nonverbal signals of leading, Social Neuroscience, DOI: 10.1080/17470919.2016.1182586
To link to this article: http://dx.doi.org/10.1080/17470919.2016.1182586
View supplementary material
Accepted author version posted online: 25Apr 2016.Published online: 10 May 2016.
Submit your article to this journal
Article views: 13
View related articles
View Crossmark data

The winner takes it all: Event-related brain potentials reveal enhancedmotivated attention toward athletes’ nonverbal signals of leadingPhilip Furleya*, Robert Schnuerchb* and Henning Gibbonsb
aInstitute of Cognitive and Team/Racket Sport Research, German Sport University Cologne, Köln, Germany; bDepartment of Psychology,University of Bonn, Bonn, Germany
ABSTRACTObservers of sports can reliably estimate who is leading or trailing based on nonverbal cues. Mostlikely, this is due to an adaptive mechanism of detecting motivationally relevant signals such ashigh status, superiority, and dominance. We reasoned that the relevance of leading athletesshould lead to a sustained attentional prioritization. To test this idea, we recorded electroence-phalography while 45 participants saw brief stills of athletes and estimated whether they wereleading or trailing. Based on these recordings, we assessed event-related potentials and focusedon the late positive complex (LPC), a well-established signature of controlled attention tomotivationally relevant visual stimuli. Confirming our expectation, we found that LPC amplitudewas significantly enhanced for leading as compared to trailing athletes. Moreover, this modula-tion was significantly related to behavioral performance on the score-estimation task. The presentdata suggest that subtle cues related to athletic supremacy are reliably differentiated in thehuman brain, involving a strong attentional orienting toward leading athletes. This mechanismmight be part of an adaptive cognitive strategy that guides human social behavior.
ARTICLE HISTORYReceived 23 October 2015Revised 21 March 2016Published online13 May 2016
KEYWORDSNonverbal behavior; ERPs;LPC; sport; status
Introduction
Observers of sport competitions can reliably estimatewho is leading or trailing without being aware of thecurrent score (Furley & Schweizer, 2014). This findinghas been attributed to our evolutionary past by arguingthat we have developed adaptive mechanisms of dis-playing and detecting relevant nonverbal signals(Furley & Schweizer, 2014; 2015; see also Furley &Dicks, 2012). Sending submissive or shameful signalswhen losing an antagonistic encounter increases thechances of avoiding further potentially life-threateningattacks for primates (de Waal, 2007). Likewise, sendingdominant or proud cues helps primates save valuableresources by communicating high status and theirsuperiority over the opponent (Archer, 2006).Although conflict rarely ends in a fight, there is a con-stant threat of potentially harmful clashes (de Waal,2007). Therefore, it is also of vital evolutionary impor-tance to detect and comprehend subtle nonverbal cuesin order to behave adaptively. Fittingly, even childrenare able to identify the leader of a group of chimpan-zees based solely on their observations of his self-con-fident behavior (de Waal, 2007).
Recent research has demonstrated that perceiversrated leading athletes as more dominant, more proud,and more confident than trailing athletes without beingaware of the score (Furley & Schweizer, 2016). All of thesedimensions have been associated with high social statusin the past (Driskell & Salas, 2005; Hall, Coats, & LeBeau,2005; Mazur, 2005) and suggest that athletes change theirnonverbal behavior along the verticality dimension whenthey are leading or trailing (Burgoon & Hoobler, 2002; Hall& Friedman, 1999). The vertical dimension of status insocial relations stands in contrast to the horizontal dimen-sion of emotional closeness (Burgoon & Hoobler, 2002; Hall& Friedman, 1999). In modern societies, sport competi-tions can be considered an institutionalized form of statuscontests (Llaurens, Raymond, & Faurie, 2009; Lombardo,2012; Mazur, 2005; Mehta, Jones, & Josephs, 2008). Inthese contests, sending cues such as dominance(Carney, Cuddy, & Yap, 2010; Carney, Hall, & SmithLeBeau, 2005), pride (Martens, Tracy, & Shariff, 2012),and confidence (Driskell & Salas, 2005; Mazur, 2005) servesthe adaptive function of navigating the social hierarchy byletting other people know who deserves high or lowstatus (Henrich & Gil-White, 2001).
CONTACT Philip Furley [email protected] Institute of Cognitive and Team/Racket Sport Research, German Sport University, Cologne, AmSportpark Müngersdorf 6, 50933 Köln, Germany
*These authors contributed equally to this work.The supplemental data for this article can be accessed here.
SOCIAL NEUROSCIENCE, 2016http://dx.doi.org/10.1080/17470919.2016.1182586
© 2016 Informa UK Limited, trading as Taylor & Francis Group
Dow
nloa
ded
by [
Deu
tsch
e Sp
orth
ochs
chul
e K
oeln
], [
Phili
p Fu
rley
] at
07:
21 2
3 M
ay 2
016

Of course, the evolutionary relevance of status displaysimplies that such cues are not only sent, but also reliablyperceived and correctly identified. According to the ecolo-gical theory of person perception (McArthur & Baron, 1983;Zebrowitz & Collins, 1997), our cognitive system hasbecome particularly attuned to perceptual cues that areof general adaptive relevance, such as status cues (seeAnderson, Hildreth, & Howland, 2015; Schmid Mast & Hall,2004). Efficient perception of status displays is most likelynot limited to its utility for the survival of the species, butalso serves adaptive functions at the level of individual goalattainment (McArthur & Baron, 1983; Zebrowitz & Collins,1997). One of the most essential strategies should be athorough representation of individuals that should beavoided in a confrontational situation (see Tracy & Robins,2008; Tracy, Shariff, & Cheng, 2010). Hence, leading athletes,whom we perceive as dominant, proud, confident, andcurrently superior (Furley & Schweizer, 2016), should be ofhigher ecological importance than neutral or low-statusdisplays (drawing athletes or trailing athletes, respectively).
Crucially, the importance of subtle nonverbal cuesdisplayed by leading athletes should have a distincteffect on basic cognitive processes. It is well establishedthat we orient our attention toward motivationally rele-vant stimuli (Ito, Larsen, Smith, & Cacioppo, 1998),which might allow a more thorough encoding and,thus, an enhanced mental representation of significantobjects. An elegant way of monitoring the deploymentof attentional resources toward different sensory eventsis via event-related brain potentials (ERPs), derived fromcontinuous electroencephalographic (EEG) recordings.Specifically, the late and sustained attentional selectionof motivationally relevant objects has been describedand validated in various previous studies: The late posi-tive complex (LPC; Sutton & Ruchkin, 1984), a broadlydistributed positivity starting as early as 200–400 msinto stimulus processing and extending up to severalseconds (Ito & Cacioppo, 2000), is a reliable indicator ofattentional variations during the processing of motiva-tionally relevant stimuli (Cacioppo, Crites, & Gardner,1996; Hajcak & Olvet, 2008; Ito & Cacioppo, 2000; Itoet al., 1998; Olofsson, Nordin, Sequeira, & Polich, 2008).The neural source of the LPC consists of a networkcoding both sensory and affective features in cortical(e.g., ventrolateral prefrontal and cingulate cortex) andsubcortical (e.g., amygdala) brain structures (Liu, Huang,McGinnis-Deweese, Keil, & Ding, 2012). Importantly,there is no simple correspondence between LPC ampli-tude and valence. Instead, it generally reflects thedegree of motivated attention, that is, an orientingtoward salient and relevant stimuli in a given context(e.g., Frühholz, Jellinghaus, & Herrmann, 2011; Gable &Harmon-Jones, 2010; Hajcak & Olvet, 2008; Kuhr,
Schomberg, Gruber, & Quirin, 2013; Pastor et al., 2008;Schupp et al., 2000; Weinberg & Hajcak, 2011).
Based onprevious research onour ability tomonitor andinterpret nonverbal behavior in sports (see, e.g., Furley &Schweizer, 2014, 2016) as well as on ecological theories ofperson perception (McArthur & Baron, 1983; Zebrowitz &Collins, 1997), we hypothesized that an LPC should bediscernible while participants viewed brief stills of athletesand estimated the current score along the leading-trailingdimension (Furley & Schweizer, 2014). Crucially, the LPCshould be more strongly pronounced for actually leadingthan trailing athletes, whichwould indicate a late, sustainedattentional prioritization of these socially relevant indivi-duals. We tested this idea in a straightforward ERP study.
Method
Participants
Forty-five healthy volunteers (M = 23.980 years,SD = 3.299; 25 women) participated in the experimentafter having given written informed consent. Theyreceived monetary compensation (8 euros per hour)for their participation. The sample size was based onFurley and Schweizer (2014) and data collection wasterminated after completing 45 participants. Forty-twoparticipants (93%) were students, most of themenrolled at German universities, majoring in a total of24 different subject areas. The largest number of stu-dents sharing the same major was four (four medicaland law students, each); only one psychology majorparticipated in the study. None of the participantswere professional athletes, nor did the sample includeany students majoring in sport science. All participantswere blind as to the specific hypotheses of the studyand were presented with the same standardized on-screen instructions. Thirty-seven participants (82%)reported being right-handed, while seven (16%) identi-fied themselves as left-handed and one (2%) as ambi-dextrous. Crucially, all analyses reported below wererepeated after excluding left-handed and ambidextrousparticipants, which yielded no significant changes toany of the behavioral and ERP results.
Stimuli and apparatus
Participants estimated the score of a total of 90 images(derived from Furley & Schweizer, 2014, 2016) of athletesthat were acquired by extracting the median frame (toavoid selection bias) from each video in a set of brief clipsof individual athletes from basketball, table tennis, andhandball (see supplementary material for the stimuli usedin the present study). We copied the image that appeared
2 P. FURLEY ET AL.
Dow
nloa
ded
by [
Deu
tsch
e Sp
orth
ochs
chul
e K
oeln
], [
Phili
p Fu
rley
] at
07:
21 2
3 M
ay 2
016

exactly halfway through each clip and used it as a still as wewanted to present stationary images rather than clips. Allimages were selected on the basis of the same criteria usedin similar previous investigations (Furley& Schweizer, 2014).They depicted athletes during breaks in their current game(e.g., time-outs and free throws in basketball, or breaksbetween points in table tennis). We did not include imagescontaining any obvious nonverbal signals of victory (suchas raising both fists above the head) or defeat (such ashiding the face behind the hands). This was done so as toavoid nonverbal cues that have been linked to the finaloutcome in sport and are therefore too informative forestimating the score (Furley & Schweizer, 2014; Tracy &Matsumoto, 2008).
All images were shown on a 23-inch FFT monitorwith a resolution of 1920 × 1080 pixels. A third of theimages showed athletes that were currently trailing,while a third depicted athletes during a draw, and thelast third showed athletes that were leading while thepicture was taken. Each category (trail, draw, lead) con-sisted of an equal number of images from each sport(basketball, table tennis, and handball). All images wereconverted to gray scale, cropped such that theyshowed only the athlete (upper part of the body andface), and rescaled to a size of 300 × 180 pixels. Toensure that the images from the different categoriesdid not differ in regard to physical attributes (e.g.,brightness, contrast, or spatial distribution), we mea-sured various physical parameters of all images usingthe software ImageJ, provided by the United StatesNational Institute of Health (Schneider, Rasband, &Eliceiri, 2012). Analysis confirmed that the images inthe different categories were not significantly differentregarding any relevant physical attribute.
Procedure
Participants were seated in an electrically shielded EEGchamber, gave written informed consent, and werethen prepared for the EEG session. After all electrodes
were properly prepared, participants read their instruc-tions on-screen. They were informed that they wouldsee brief grayscale images of athletes and were askedto estimate each athlete’s score after the image. To dothis, they used the scroll wheel of the mouse, thusmoving a tick mark on an 11-step vertical scale thatranged from “trail” at the bottom, via “draw” in themiddle, to “lead” on top. Participants clicked the leftmouse button to enter their rating after having movedthe tick mark to the desired location on the scale. Asshown in Figure 1, each trial began with a fixation crosslasting for 800–1200 ms, after which the target imageappeared for 500 ms, followed by a black blank screenfor another 500 ms. Then the rating scale appeared,prompting participants to enter their estimate via themouse wheel.
The experiment consisted of two main blocks: all 90images were presented in randomized order, after whichparticipants could take a short break. Subsequently, allimages were presented again in a newly randomizedorder. This was done to achieve a higher number oftrials, which is necessary to obtain clean and reliablemeasures of neural activity in the EEG. Thus, each parti-cipant performed a total of 180 trials, of which 60 con-tained images of lead, draw, and trail situations,respectively. After the experimental session, participantsfilled out a questionnaire comprising demographicquestions.
Behavioral data analysis
When somewhat arbitrary rating scales, such as thescore-estimate scale in the present study, are used,there is considerable variation regarding the use ofthe scale (Walker & Vul, 2014), with some participantsspreading their judgments more widely than others,and some responding on a much higher overall levelthan others. This can be circumvented quite easily bynormalizing each participant’s ratings before averagingor comparing across participants (see, e.g., Schnuerch,
+
~ 1000 ms 500 ms 500 ms until response
Fixation Target Stimulus Blank Screen Response
lead
trail
draw
ERP Epoch
Figure 1. Schematic illustration of the paradigm. Note that details are not drawn to scale. The athlete’s image is for illustrationpurposes only (courtesy of David Niblack, www.imagebase.net); different images were used in the experiment.
SOCIAL NEUROSCIENCE 3
Dow
nloa
ded
by [
Deu
tsch
e Sp
orth
ochs
chul
e K
oeln
], [
Phili
p Fu
rley
] at
07:
21 2
3 M
ay 2
016

Trautmann-Lengsfeld, Bertram, & Gibbons, 2014; Walker& Vul, 2014). To this end, the mean of all ratings givenby a certain participant was subtracted from each indi-vidual rating given by this participant, and the resultingdifference was divided by the standard deviation of allof this participant’s ratings. The resultant z-standardizedratings served as the main behavioral dependent vari-able in the present study.
EEG recording, preprocessing, and analysis
An EEG was recorded from 64 high-impedance ActiCapactive scalp electrodes (Brain Products, Gilching,Germany) placed according to the international 10-10system. During recording, all data were referenced toFCz and later re-referenced to the mean of mastoid elec-trodes TP9/10. Impedances were kept below 10 kΩ, sam-pling rate was 500 Hz, bandpass was 0.1–70 Hz. Eyemovements were recorded online and calculated offlinefor eye-motion correction (Gratton, Coles, & Donchin,1983). Data were filtered offline (0.1–15 Hz) and screenedfor artifacts (amplitudes exceeding ± 100 μV), by whichless than 10% of all trials in each condition of each parti-cipant were rejected.
As the EEG has a relatively coarse spatial resolution,so that most ERP components are registered at variouselectrodes, we created spatial clusters of electrodes. A3 × 3 grid was created with three levels of caudality(anterior, central, posterior) and three levels of laterality(left, medial, right). This resulted in the following elec-trode clusters: anterior left (AF7, AF3, F7, F5, F3), ante-rior medial (Fp1, Fp2, AFz, F1, Fz, F2), anterior right(AF8, AF4, F8, F6, F4); central left (FT9, FT7, FC5, FC3,T7, C5, C3), central medial (FC1, FCz, FC2, C1, Cz, C2),central right (FT10, FT8, FC6, FC4, T8, C6, C4); posteriorleft (TP7, CP5, CP3, P7, P5, P3, PO7, PO3), posteriormedial (CP1, CPz, CP2, P1, Pz, P2, POz, O1, Oz, O2),posterior right (TP8, CP6, CP4, P8, P6, P4, PO8, PO4).The two spatial factors caudality and laterality wereincluded in all ERP analyses, so we were able to roughlypinpoint the location of possible effects.
Statistical analysis
Behavioral and ERP data were analyzed by means ofrepeated-measures analyses of variance (ANOVAs).Whenever a test of sphericity (Mauchly, 1940) indicatedthat variances were not homogenous, degrees of free-dom were correct by means of the procedure proposedby Greenhouse and Geisser (1959). In these cases, theuncorrected degrees of freedom and the correctionfactor ε are reported. As a measure of effect size, wereport generalized eta squared (η2G; Bakeman, 2005).
Post hoc tests were corrected for multiple comparisons(Holm, 1979).
Results
Correlation of score estimates
Given that participants estimated the score of eachimage twice (once per half of the session), we wereable to assess how strongly these two estimationswere related. For each participant, we determined thecorrelation between first and second untransformedratings of all images, and the resulting correlation coef-ficients were Fisher-z-transformed. As shown in Figure 2(a), first and second ratings were correlated in all parti-cipants, with a mean Fisher-z-transformed correlationcoefficient of 0.473 (SD = 0.187). This is well abovezero [t(44) = 16.999, p < .001, d = 2.529], which meansthat ratings in the first and second half were indeedstrongly related. This justifies the previously describedaveraging of first and second ratings to obtain a singledependent variable.
Effect of actual score on score estimates
Normalized rating estimates were submitted to arepeated-measures ANOVA with three-level factorActual Score (trail vs. draw vs. lead). As shown inFigure 2(b), participants’ estimates varied strongly as afunction of the score in the images, which is clearlyindicated by a significant main effect of Actual Score[F(2, 88) = 21.171, p < .001, η2G = 0.070]. Post hocpairwise comparisons revealed that score estimateswere lower in the trail as compared to the draw(p < .001) and to the lead condition (p < .001).Estimates in the draw and lead conditions were notsignificantly different (p > .999). Given the strong lineartrend of estimate by actual score [F(1, 44) = 25.403,p < .001, η2G = 0.070], we determined a task-perfor-mance index for each participant as the linear increaseof score estimates by increasing actual score (i.e., theslope of the estimate increase across the three actual-score conditions).
As in previous investigations (Furley & Schweizer, 2014),there was an interaction of Actual Score and Sport [F(4,176) = 8.266, p < .001, η2G = 0.063]. Participants’ estimatesincreased strongly with increasing actual score for tabletennis and handball, as shown by large mean task-perfor-mance indices (table tennis:M=0.196, SD=0.352; handball:M= 0.252, SD = 0.419). For the basketball images, estimatesincreased only slightly with increasing actual score, asrevealed by a small mean task-performance index(M = 0.035, SD = 0.378). As we were not interested in the
4 P. FURLEY ET AL.
Dow
nloa
ded
by [
Deu
tsch
e Sp
orth
ochs
chul
e K
oeln
], [
Phili
p Fu
rley
] at
07:
21 2
3 M
ay 2
016

effect of a particular kind of sport, we averaged across sportconditions in all subsequent analyses. This also allowed ustomaintain both (a) a certain variety regarding thematerialupon which the analyses were based and (b) a sufficientnumber of trials to be able to assess ERPs in a clean andreliable fashion.
ERP results
Visual inspection revealed the expected LPC, broadlydistributed across the scalp (see Figure 3). As in simi-lar previous studies, the LPC started around 400 msinto stimulus processing and lasted for the entireduration of the epoch, including the 500 ms afterstimulus offset. Although a slight offset responsereflecting an update of perceptual processing can beseen at posterior electrodes (see Figure 3: posteriorclusters around 600 ms), the LPC is only temporarilyshifted by this effect. The offset response is clearly not
the cause of the LPC difference, which is observablewell before the offset. This is in keeping with the ideathat the LPC is robustly present both during stimuluspresentation and after its offset (Hajcak, MacNamara,& Olvet, 2010; Hajcak & Olvet, 2008). Based on ourvisual inspection and on a similar previous investiga-tion (Hajcak & Olvet, 2008), we scored LPC amplitudeas the mean voltage between 400 and 1000 ms afterstimulus onset. To analyze possible effects of thedifferent image categories and roughly localize theeffect, we submitted LPC amplitude values to a3 × 3 × 3 repeated-measures ANOVA with factorsActual Score (trail vs. draw vs. lead), Caudality (ante-rior vs. central vs. posterior), and Laterality (left vs.medial vs. right).
The ANOVA yielded a strong main effect of Caudality[F(2, 88) = 30.032, p < .001, η2G = 0.170, ε = 0.607],based on the fact that LPC amplitude was largest atposterior sensors (anterior: M = 2.075, SD = 3.407;
0.0
0.2
0.4
0.6
0.8
Participants (Sorted by Effect Size)
Cor
rela
tion
Coe
ffici
ent
(Fis
her−
z−T
rans
form
ed)
−0.3
−0.2
−0.1
0.0
0.1
0.2
0.3
Actual Score
Mea
n N
orm
aliz
ed E
stim
ate
DrawTrail Lead
−0.6
−0.4
−0.2
0.0
0.2
0.4
0.6
0.8
Participants (Sorted by Effect Size)
Tas
k P
erfo
rman
ce
ns
a b
c
Figure 2. Descriptive results of the score-estimation task. Error bars represent the 95% confidence interval of the mean. (a) Fisher-z-transformed parametric correlation coefficients between first and second rating of all images for all participants (gray columns) andaveraged across participants (black diamond). (b) Mean normalized estimates of the current score as a function of actual score. ***p < .001; ns = not significant. (c) Task-performance parameter (i.e., increase of score estimate across the three levels of actual score:trail, draw, lead) per participant, sorted by effect size. Note that the majority of participants (n = 33) had a positive taskperformance, indicating that they (correctly) estimated a higher score for leading than for trailing athletes. The black diamonddepicts the sample mean.
SOCIAL NEUROSCIENCE 5
Dow
nloa
ded
by [
Deu
tsch
e Sp
orth
ochs
chul
e K
oeln
], [
Phili
p Fu
rley
] at
07:
21 2
3 M
ay 2
016
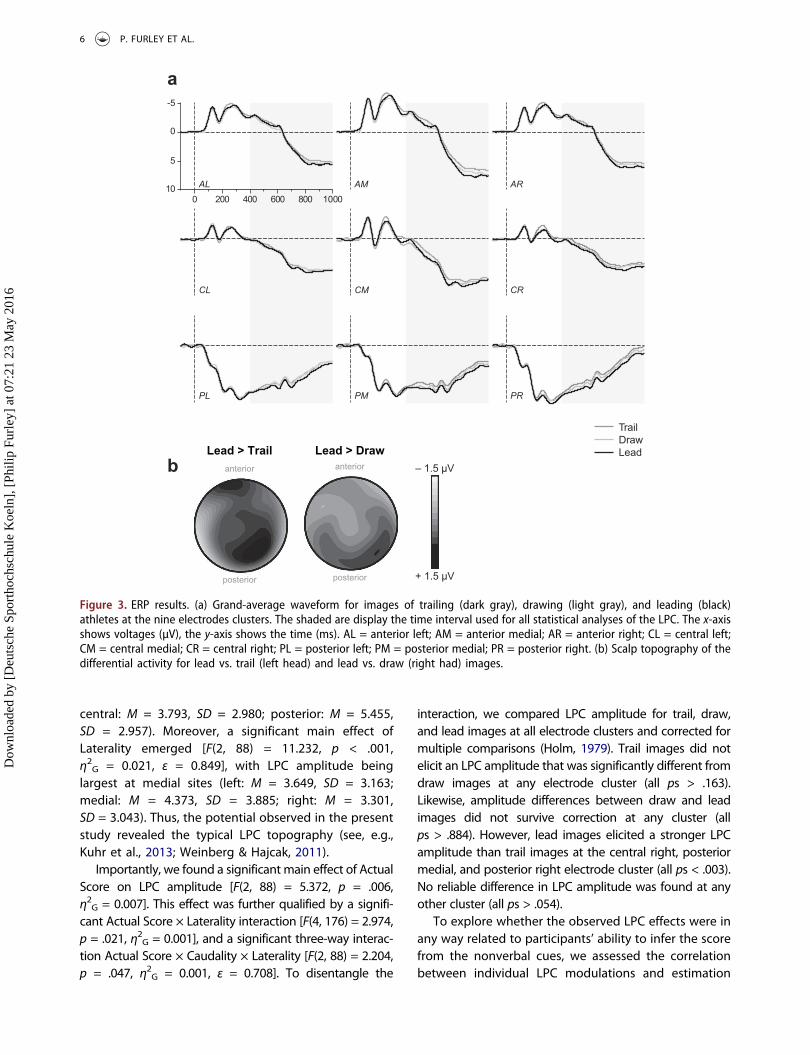
central: M = 3.793, SD = 2.980; posterior: M = 5.455,SD = 2.957). Moreover, a significant main effect ofLaterality emerged [F(2, 88) = 11.232, p < .001,η2G = 0.021, ε = 0.849], with LPC amplitude beinglargest at medial sites (left: M = 3.649, SD = 3.163;medial: M = 4.373, SD = 3.885; right: M = 3.301,SD = 3.043). Thus, the potential observed in the presentstudy revealed the typical LPC topography (see, e.g.,Kuhr et al., 2013; Weinberg & Hajcak, 2011).
Importantly, we found a significant main effect of ActualScore on LPC amplitude [F(2, 88) = 5.372, p = .006,η2G = 0.007]. This effect was further qualified by a signifi-cant Actual Score × Laterality interaction [F(4, 176) = 2.974,p = .021, η2G = 0.001], and a significant three-way interac-tion Actual Score × Caudality × Laterality [F(2, 88) = 2.204,p = .047, η2G = 0.001, ε = 0.708]. To disentangle the
interaction, we compared LPC amplitude for trail, draw,and lead images at all electrode clusters and corrected formultiple comparisons (Holm, 1979). Trail images did notelicit an LPC amplitude that was significantly different fromdraw images at any electrode cluster (all ps > .163).Likewise, amplitude differences between draw and leadimages did not survive correction at any cluster (allps > .884). However, lead images elicited a stronger LPCamplitude than trail images at the central right, posteriormedial, and posterior right electrode cluster (all ps < .003).No reliable difference in LPC amplitude was found at anyother cluster (all ps > .054).
To explore whether the observed LPC effects were inany way related to participants’ ability to infer the scorefrom the nonverbal cues, we assessed the correlationbetween individual LPC modulations and estimation
0 200 400 600 800 1000
-5
0
5
10 AL
CL CM CR
PL PM PR
AM AR
TrailDrawLead
b
a
– 1.5 µV
+ 1.5 µV
anterior
posterior
Lead > Trail
anterior
posterior
Lead > Draw
Figure 3. ERP results. (a) Grand-average waveform for images of trailing (dark gray), drawing (light gray), and leading (black)athletes at the nine electrodes clusters. The shaded are display the time interval used for all statistical analyses of the LPC. The x-axisshows voltages (µV), the y-axis shows the time (ms). AL = anterior left; AM = anterior medial; AR = anterior right; CL = central left;CM = central medial; CR = central right; PL = posterior left; PM = posterior medial; PR = posterior right. (b) Scalp topography of thedifferential activity for lead vs. trail (left head) and lead vs. draw (right had) images.
6 P. FURLEY ET AL.
Dow
nloa
ded
by [
Deu
tsch
e Sp
orth
ochs
chul
e K
oeln
], [
Phili
p Fu
rley
] at
07:
21 2
3 M
ay 2
016

performance. We assessed the LPC effect for each par-ticipant as the medial posterior amplitude differencebetween the two conditions that were reliably differ-entiated by the LPC (i.e., lead and trail images).Analogously, behavioral performance was measured asthe score-estimation difference between lead and trailimages. As neither of the two variables was normallydistributed (Kolmogorov–Smirnov test: both ps < .001),we submitted the scores to a nonparametric rank cor-relation analysis (Spearman, 1904). Given our expecta-tion that LPC should be positively related to behavioralperformance, a one-sided analysis was performed.Confirming our expectation, we observed a significantpositive correlation between LPC and the behavioraleffect [ρ(45) = 0.334, p = .015].
Discussion
The first notable finding of the present study was thereplication of the effect reported by Furley andSchweizer (2014) that sport scores are readily inferredfrom simple nonverbal cues, which is not a trivialresearch step considering the increasing calls for repli-cation in the psychological literature (Pashler &Wagenmakers, 2012; Simons, 2014; Yong, 2012).Participants in the present study were able to distin-guish between leading and trailing athletes: The currentscore of a sports game was estimated to be more infavor of a briefly observed athlete when this athlete wastruly in the lead than when the athlete was trailingwhen the picture was taken. In line with previousresearch, this finding suggests that humans are wellequipped for interpreting nonverbal changes alongthe vertical dimension of social relations occurringwith leading or trailing in sports competitions (Furley& Schweizer, 2016). This process is consistent with eco-logical approaches to person perception (McArthur &Baron, 1983; Zebrowitz & Collins, 1997). Specifically,nonverbal behavioral changes in sports competitionsoccur because signaling winning or losing during anagonistic encounter among group-living primates hasevolved as an important means of communicating sta-tus and facilitating intergroup coordination within dom-inance hierarchies (de Waal, 2007).
We found that the scores of leading athletes and ofthose in a draw were estimated very similarly, which isin contrast to Furley and Schweizer (2014, 2016). Thesimilarity of the ratings of leading and drawing athletesin the present study is in line with a study in whichathletes were asked to form impressions of opponentsdisplaying dominant and neutral nonverbal behaviors(Furley & Dicks, 2012). The ratings of the dominantand neutral opponents were highly similar and only
differed significantly from opponents displaying sub-missive nonverbal behavior. The authors argued thatacting in a neutral manner while performing in sportsseems to be perceived as a sign of relaxedness, compe-tence, and mastery of the situation (see Warner &Shields, 2007, for a similar argumentation). Hence, onemay speculate that the stills of both drawing and lead-ing athletes showed cues related to higher social statusas compared to the trailing athletes. This might mainlybe driven by a lack of differentiation (of drawing andleading) on the observer’s part (as claimed above), but itcould likewise be the consequence of insufficient differ-ences in the expression of being in a draw and being inthe lead. That is, people who are currently in a drawmight behave in a relaxed and confident way that ishard to distinguish from their behavior when they arein the lead.
The second, and more important, aspect of thepresent study was to investigate whether the proces-sing of leading athletes is characterized by anincreased LPC. As expected, we observed a robustmain effect of the actual score in the observed imageson LPC amplitude. The effect was carried by a largeramplitude for images of leading as compared to trail-ing athletes, which is in line with our hypothesis.Interestingly, the effect was found not only over med-ial centroparietal brain regions, but also at right-sidesensors. This parallels previous studies reporting aslight right-lateralization of LPC modulations, espe-cially when participants engaged in evaluative judg-ments (see, e.g., Cacioppo et al., 1996). Moreover, weobserved an LPC effect beyond the duration of theimage presentation, which is in keeping with a priorstudy demonstrating that the LPC extends up to sev-eral seconds after the offset of an image (Hajcak &Olvet, 2008). Notably, we found that LPC amplitudewas a predictor of participants’ estimates of the cur-rent score: Individuals with a robust LPC-based differ-entiation of leading and trailing athletes wereparticularly good at recognizing whether the athletewas currently in the lead. This strongly suggests thatthe LPC modulation observed in the present studywas not an artifact, but rather reflects a crucial neuraloperation that feeds into overt behavior.
Based on a remarkable body of prior evidenceregarding the functional significance of the LPC (e.g.,Cacioppo et al., 1996; De Cesarei, Codispoti, & Schupp,2009; Frühholz et al., 2011; Gable & Harmon-Jones,2010; Hajcak & Olvet, 2008; Ito & Cacioppo, 2000; Itoet al., 1998; Schacht & Sommer, 2009; Sutton & Ruchkin,1984; Van Strien, De Sonneville, & Franken, 2010), weinterpret these findings as support for our assumptionthat subtle differences in the display of nonverbal
SOCIAL NEUROSCIENCE 7
Dow
nloa
ded
by [
Deu
tsch
e Sp
orth
ochs
chul
e K
oeln
], [
Phili
p Fu
rley
] at
07:
21 2
3 M
ay 2
016

signals entail a sustained attentional prioritization ofvisual information related to athletic supremacy. Thisnotion is supported by recent findings that suggest thatLPC-like enhancements reflect an attentional biastoward highly relevant information during socialencounters (Bell et al., 2015; Schnuerch & Gibbons,2015). Presumably, higher-order neural hubs that codeaffective information or govern the distribution ofattentional resources provide top-down informationthat feeds, in a reentrant fashion, into structures codingbasic perceptual features (see Liu et al., 2012). This way,the visual representation of motivationally relevant sti-muli is enhanced.
Our findings and interpretation regarding the LPCare further supported by previous theorizing that theperception of athletes is based on capacities developedas part of an adaptive evolutionary profile (Furley &Schweizer, 2016). Detecting supremacy and high statusallows the individual to abide by the rules of the socialhierarchy and to avoid potentially harmful encounters.Our data indicate that the detection of subtle nonverbalsignals that indicate high status in sports competitions(Furley & Schweizer, 2016) is accompanied by a thor-ough prioritization of a visual impression during latestages of processing. Remarkably, this attentional biasoperates not only during actual encounters that arecompetitive and thus potentially harmful, but extendseven to the sheer observation of images. Moreover, thisbias appears to be stable and fundamental enough tooperate even when we view sports scenes, which trans-mit conflict and fight only in the figurative sense.
Finally, some limitations of the present findingsshould be discussed. First, the behavioral results indi-cate that draw and lead images were perceived assimilar, while trail images were rated as different fromboth of these categories. However, this pattern is notcompletely in accordance with the neurophysiologicalresults as LPC amplitude differed only between leadand trail images. As the LPC sometimes indicates impli-cit differentiations beyond explicit ratings ((De Cesareiet al., 2009; Frühholz et al., 2011; Ito & Cacioppo, 2000;Schacht & Sommer, 2009; Van Strien et al., 2010), it ispossible that the LPC represents the actual pattern ofdifferentiation more reliably than overt responses.Clearly, this is speculative and needs to be tested infuture studies. Second, the present study was clearlylimited to the context of sports, although a more gen-eral mechanism might be at the heart of our findings(see also Furley & Schweizer, 2014). Indeed, we tenta-tively posit that this constitutes a fundamental aspectof social cognition in human interactions: High-statusindividuals should be detected and attended to withparticular emphasis, so as to allow preparations of
appropriate responses to this socially relevant indivi-dual. Future studies are needed to scrutinize this claim.
In conclusion, the present research highlights thatpeople can distinguish between leading and trailingathletes based on briefly displayed images in whichkinematic information is missing. The finding that sus-tained attentional processing differed between stillimages of leading and trailing athletes suggests thathumans have evolved an efficient neural mechanism oforienting attention toward cues associated with highstatus and superiority, which should facilitate adaptivebehavior amongst primates. As a side note, our dataadd to recent findings (Bell et al., 2015; Schnuerch &Gibbons, 2015) that highlight the role of the LPC as asolid indicator of essential selection processes in socialcognition.
Acknowledgment
The authors thank Kristin Katschak, Hannah Kirsten, JanKrawczyk, Charlotte Pensel, and Christina Wittinghofer fortheir assistance in data collection.
Disclosure statement
No potential conflict of interest was reported by the authors.
References
Anderson, C., Hildreth, J. A. D., & Howland, L. (2015, iFirst). Isthe desire for status a fundamental human motive? Areview of the empirical literature. Psychological Bulletin,141, 574–601. doi:10.1037/a0038781
Archer, J. (2006). Testosterone and human aggression: Anevaluation of the challenge hypothesis. Neuroscience &Biobehavioral Reviews, 30, 319–345. doi:10.1016/j.neubiorev.2004.12.007
Bakeman, R. (2005). Recommended effect size statistics forrepeated measures designs. Behavior Research Methods,37, 379–384. doi:10.3758/BF03192707
Bell, R., Sasse, J., Möller, M., Czernochowski, D., Mayr, S., &Buchner, A. (2015). Event-related potentials in response tocheating and cooperation in a social dilemma game.Psychophysiology, doi:10.1111/psyp.12561
Burgoon, J. K., & Hoobler, G. D. (2002). Nonverbal signals. In M.L. Knapp & J. A. Daly (Eds.), Handbook of interpersonalcommunication (3rd ed., pp. 240–299). Thousand Oaks, CA:Sage.
Cacioppo, J. T., Crites, S. L., & Gardner, W. L. (1996). Attitudesto the right: Evaluative processing is associated with later-alized late positive event-related brain potentials.Personality and Social Psychology Bulletin, 22(12), 1205–1219. doi:10.1177/01461672962212002
Carney, D. R., Cuddy, A., & Yap, A. (2010). Power posing: Briefnonverbal displays affect neuroendocrine levels and risk tol-erance. Psychological Science, 21, 1363–1368. doi:10.1177/0956797610383437
8 P. FURLEY ET AL.
Dow
nloa
ded
by [
Deu
tsch
e Sp
orth
ochs
chul
e K
oeln
], [
Phili
p Fu
rley
] at
07:
21 2
3 M
ay 2
016

Carney, D. R., Hall, J. A., & Smith LeBeau, L. (2005). Beliefsabout the nonverbal expression of social power. Journalof Nonverbal Behavior, 29, 105–123. doi:10.1007/s10919-005-2743-z
De Cesarei, A., Codispoti, M., & Schupp, H. T. (2009). Peripheralvision and preferential emotion processing. NeuroReport,20, 1439–1443. doi:10.1097/WNR.0b013e3283317d3e
de Waal, F. (2007). Chimpanzee politics: Power and sex amongapes. Baltimore, MD: Johns Hopkins University Press.
Driskell, J. E., & Salas, E. (2005). The effect of content anddemeanor on reactions to dominance behavior. GroupDynamics: Theory, Research, & Practice, 9, 3–14.doi:10.1037/1089-2699.9.1.3
Frühholz, S., Jellinghaus, A., & Herrmann, M. (2011). Time courseof implicit processing and explicit processing of emotionalfaces and emotional words. Biological Psychology, 87, 265–274. doi:10.1016/j.biopsycho.2011.03.008
Furley, P., & Dicks, M. (2012). Hold your head high. The influ-ence of emotional versus neutral nonverbal expressions ofdominance and submissiveness in baseball. InternationalJournal of Sport Psychology, 43, 294–311.
Furley, P., & Schweizer, G. (2014). The expression of victoryand loss: Estimating who’s leading or trailing from nonver-bal cues in sports. Journal of Nonverbal Behavior, 38, 13–29.doi:10.1007/s10919-013-0168-7
Furley, P., & Schweizer, G. (2016). In a flash: Thin slice judg-ment accuracy of leading and trailing in sports. Journal ofNonverbal Behavior, 40, 83–100. doi:10.1007/s10919-015-0225-5
Gable, P. A., & Harmon-Jones, E. (2010). Late positive potentialto appetitive stimuli and local attentional bias. Emotion, 10,441–446. doi:10.1037/a0018425
Gratton, G., Coles, M. G. H., & Donchin, E. (1983). A newmethod for off-line removal of ocular artifact.Electroencephalography and Clinical Neurophysiology, 55,468–484. doi:10.1016/0013-4694(83)90135-9
Greenhouse, S. W., & Geisser, S. (1959). On methods in theanalysis of profile data. Psychometrika, 24, 95–112.doi:10.1007/BF02289823
Hajcak, G., MacNamara, A., & Olvet, D. M. (2010). Event-relatedpotentials, emotion, and emotion regulation: An integrativereview. Developmental Neuropsychology, 35, 129–155.doi:10.1080/87565640903526504
Hajcak, G., & Olvet, D. M. (2008). The persistence of attentionto emotion: Brain potentials during and after picture pre-sentation. Emotion, 8, 250–255. doi:10.1037/1528-3542.8.2.250
Hall, J. A., Coats, E. J., & LeBeau, L. S. (2005). Nonverbalbehavior and the vertical dimension of social relations: Ameta-analysis. Psychological Bulletin, 131, 898–924.doi:10.1037/0033-2909.131.6.898
Hall, J. A., & Friedman, G. B. (1999). Status, gender, and non-verbal behavior: A study of structured interactions betweenemployees of a company. Personality and Social PsychologyBulletin, 25, 1082–1091. doi:10.1177/01461672992512002
Henrich, J., & Gil-White, F. J. (2001). The evolution of pres-tige: Freely conferred deference as a mechanism forenhancing the benefits of cultural transmission.Evolution and Human Behavior, 22, 165–196.doi:10.1016/S1090-5138(00)00071-4
Holm, S. (1979). A simple sequentially rejective multiple testprocedure. Scandinavian Journal of Statistics, 6, 65–70.
Ito, T. A., & Cacioppo, J. T. (2000). Electrophysiological evi-dence of implicit and explicit categorization processes.Journal of Experimental Social Psychology, 36, 660–676.doi:10.1006/jesp.2000.1430
Ito, T. A., Larsen, J. T., Smith, N. K., & Cacioppo, J. T. (1998).Negative information weighs more heavily on the brain:The negativity bias in evaluative categorizations. Journalof Personality and Social Psychology, 75, 887–900.doi:10.1037/0022-3514.75.4.887
Kuhr, B., Schomberg, J., Gruber, T., & Quirin, M. (2013). Beyondpleasure and arousal appetitive erotic stimuli modulateelectrophysiological brain correlates of early attentionalprocessing. NeuroReport, 24, 246–250. doi:10.1097/WNR.0b013e32835f4eba
Liu, Y., Huang, H., McGinnis-Deweese, M., Keil, A., & Ding, M.(2012). Neural substrate of the late positive potential inemotional processing. The Journal of Neuroscience, 32,14563–14572. doi:10.1523/JNEUROSCI.3109-12.2012
Llaurens, V., Raymond, M., & Faurie, C. (2009). Ritual fights andmale reproductive success in a human population. Journalof Evolutionary Biology, 22, 1854–1859. doi:10.1111/j.1420-9101.2009.01793.x
Lombardo, M. P. (2012). On the evolution of sport.Evolutionary Psychology: An International Journal ofEvolutionary Approaches to Psychology and Behavior, 10, 1–28.
Martens, J. P., Tracy, J. L., & Shariff, A. F. (2012). Status signals:Adaptive benefits of displaying and observing the nonver-bal expressions of pride and shame. Cognition & Emotion,26, 390–406. doi:10.1080/02699931.2011.645281
Mauchly, J. W. (1940). Significance test for sphericity of anormal n-variate distribution. The Annals of MathematicalStatistics, 11, 204–209. doi:10.1214/aoms/1177731915
Mazur, A. (2005). Biosociology of dominance and deference.Lanham, MD: Rowman & Littlefield.
McArthur, L. Z., & Baron, R. M. (1983). Toward an ecologicaltheory of social perception. Psychological Review, 90, 215–238. doi:10.1037/0033-295X.90.3.215
Mehta, P. H., Jones, A. C., & Josephs, R. A. (2008). The socialendocrinology of dominance: Basal testosterone predictscortisol changes and behavior following victory and defeat.Journal of Personality and Social Psychology, 94, 1078–1093.doi:10.1037/0022-3514.94.6.1078
Olofsson, J. K., Nordin, S., Sequeira, H., & Polich, J. (2008).Affective picture processing: An integrative review of ERPfindings. Biological Psychology, 77, 247–265. doi:10.1016/j.biopsycho.2007.11.006
Pashler, H., & Wagenmakers, E.-J. (2012). Editors’ introductionto the special section on replicability in psychologicalscience: A crisis of confidence? Perspectives onPsychological Science, 7, 528–530. doi:10.1177/1745691612465253
Pastor, M. C., Bradley, M. M., Löw, A., Versace, F., Moltó, J., &Lang, P. J. (2008). Affective picture perception: Emotion,context, and the late positive potential. Brain Research,1189, 145–151. doi:10.1016/j.brainres.2007.10.072
Schacht, A., & Sommer, W. (2009). Emotions in word and faceprocessing: Early and late cortical responses. Brain andCognition, 69, 538–550. doi:10.1016/j.bandc.2008.11.005
Schmid Mast, M., & Hall, J. A. (2004). Who is the boss and who isnot? Accuracy of judging status. Journal of Nonverbal Behavior,28, 145–165. doi:10.1023/B:JONB.0000039647.94190.21
SOCIAL NEUROSCIENCE 9
Dow
nloa
ded
by [
Deu
tsch
e Sp
orth
ochs
chul
e K
oeln
], [
Phili
p Fu
rley
] at
07:
21 2
3 M
ay 2
016

Schneider, C. A., Rasband, W. S., & Eliceiri, K. W. (2012). NIHImage to Imagej: 25 years of image analysis. NatureMethods, 9, 671–675. doi:10.1038/nmeth.2089
Schnuerch, R., & Gibbons, H. (2015). Social proof in the humanbrain: Electrophysiological signatures of agreement anddisagreement with the majority. Psychophysiology, 52,1328–1342. doi:10.1111/psyp.12461
Schnuerch, R., Trautmann-Lengsfeld, S. A., Bertram, M., & Gibbons,H. (2014). Neural sensitivity to social deviance predicts attentiveprocessing of peer-group judgment. Social Neuroscience, 9,650–660. doi:10.1080/17470919.2014.934393
Schupp, H. T., Cuthbert, B. N., Bradley, M. M., Cacioppo, J. T.,Ito, T. A., & Lang, P. J. (2000). Affective picture processing:The late positive potential is modulated by motivationalrelevance. Psychophysiology, 37, 257–261. doi:10.1111/1469-8986.3720257
Simons, D. J. (2014). The value of direct replication. Perspectives onPsychological Science, 9, 76–80. doi:10.1177/1745691613514755
Spearman, C. (1904). The proof and measurement of associa-tion between two things. The American Journal ofPsychology, 15, 72–101. doi:10.2307/1412159
Sutton, S., & Ruchkin, D. S. (1984). The late positive complex.Annals of the New York Academy of Sciences, 425, 1–23.doi:10.1111/j.1749-6632.1984.tb23520.x
Tracy, J. L., & Matsumoto, D. (2008). The spontaneous dis-play of pride and shame: Evidence for biologicallyinnate nonverbal displays. Proceedings of the NationalAcademy of Sciences, 105, 11655–11660. doi:10.1073/pnas.0802686105
Tracy, J. L., & Robins, R. W. (2008). The automaticity ofemotion recognition. Emotion, 8, 81–95. doi:10.1037/1528-3542.8.1.81
Tracy, J. L., Shariff, A. F., & Cheng, J. T. (2010). A naturalist’sview of pride. Emotion Review, 2, 163–177. doi:10.1177/1754073909354627
Van Strien, J. W., De Sonneville, L. M. J., & Franken, I. H. A.(2010). The late positive potential and explicit versus impli-cit processing of facial valence. NeuroReport, 21, 656–661.doi:10.1097/WNR.0b013e32833ab89e
Walker, D., & Vul, E. (2014). Hierarchical encoding makesindividuals in a group seem more attractive.Psychological Science, 25, 230–235. doi:10.1177/0956797613497969
Warner, L. R., & Shields, S. A. (2007). The perception of cryingin women and men: Angry tears, sad tears, and the “rightway” to weep. In U. Hess & P. Phillipot (Eds.), Emotionrecognition across social groups (pp. 92–118). Cambridge,MA: Cambridge University Press.
Weinberg, A., & Hajcak, G. (2011). The late positive potentialpredicts subsequent interference with target processing.Journal of Cognitive Neuroscience, 23, 2994–3007.doi:10.1162/jocn.2011.21630
Yong, E. (2012). Replication studies: Bad copy. Nature, 485,298–300. doi:10.1038/485298a
Zebrowitz, L. A., & Collins, M. A. (1997). Accurate social per-ception at zero acquaintance: The affordances of aGibsonian approach. Personality and Social PsychologyReview, 1, 204–223. doi:10.1207/s15327957pspr0103_2
10 P. FURLEY ET AL.
Dow
nloa
ded
by [
Deu
tsch
e Sp
orth
ochs
chul
e K
oeln
], [
Phili
p Fu
rley
] at
07:
21 2
3 M
ay 2
016