the will and the ways: development and validation of an...
TRANSCRIPT

Journal of Personality and Social Psychology1991, Vol. 60, No. 4, 570-585
Copyright 1991 by the American Psychological Association, Inc.0022-3514/91/S3.00
The Will and the Ways: Development and Validationof an Individual-Differences Measure of Hope
C. R. Snyder, Cheri Harris, John R. Anderson, Sharon A. Holleran, Lori M. Irving,Sandra X Sigmon, Lauren \bshinobu, June Gibb, Charyle Langelle, and Pat Harney
University of Kansas
Defining hope as a cognitive set that is composed of a reciprocally derived sense of successful (a)agency (goal-directed determination) and (b) pathways (planning of ways to meet goals), an individ-ual-differences measure is developed. Studies demonstrate acceptable internal consistency andtest-retest reliability, and the factor structure identifies the agency and pathways components of theHope Scale. Convergent and discriminant validity are documented, along with evidence suggestingthat Hope Scale scores augmented the prediction of goal-related activities and coping strategiesbeyond other self-report measures. Construct validational support is provided in regard to pre-dicted goal-setting behaviors; moreover, the hypothesized goal appraisal processes that accompanythe various levels of hope are corroborated.
The importance of hope has long been recognized. In West-ern culture, the concept of hope was first elaborated in the mythof Pandora. As the story goes, Zeus was angry at Prometheusfor stealing fire from the gods. With revenge in mind, Zeus sentPandora to earth with a box full of evil creatures. Zeus toldPandora not to open the box, yet he knew that her curiositywould soon overwhelm her. As predicted, Pandora eventuallyopened the lid to look inside. When she did, a swarm of crea-tures flew out to forever plague humankind: gout, rheumatism,and colic for the body; envy, spite, and revenge for the mind.Only one creature remained in the box when Pandora finallymanaged to close the lid. That creature was hope, which suppos-edly makes human cares and troubles seem bearable as we jour-ney toward the myriad of goals in a lifetime (Smith, 1983).
Although the Pandora myth extols hope, other writings havecharacterized it as both a blessing and a curse. Tillich (1965)summarized this view by asserting that "hope is easy for thefoolish, but hard for the wise. Everybody can lose himself into
The present article is based, in part, on dissertations by Cheri Harrisand John R. Anderson, as well as on master's theses by Lauren Yoshi-nobu, Charyle Langelle, and Pat Harney, all under the supervision ofC. R. Snyder at the University of Kansas, and on a master's thesis inprogress by June Gibb at the University of Illinois at Urbana-Cham-paign under the supervision of C. R. Snyder. Parts of this article werepresented at the Nags Head Conferences, Kill Devil Hills, North Caro-lina, June 15,1988, and June 21,1990, and at the 97th Annual Conven-tion of the American Psychological Association, New Orleans, Louis-iana, August 13,1989.
This project was supported, in part, by National Institute of MentalHealth Grant 5 T32 MH17071, with C. R. Snyder as principal investi-gator. We are grateful to B. Kent Houston and Thomas Ashby Wills, aswell as to two anonymous reviewers, for comments on the presentarticle.
Correspondence concerning this article should be sent to C. R.Snyder, Doctoral and Postdoctoral Training Programs in Clinical Psy-chology, Department of Psychology, 305 Fraser Hall, University ofKansas, Lawrence, Kansas 66045.
foolish hope, but genuine hope is something rare and great" (p.17). Although one may agree that foolish hope is bad and genu-ine hope is good, any attempt to clarify this issue must startwith a definition. The typical dictionary definition of hopeemphasizes the perception "that something desired may hap-pen." Recent scholarly writings on the topic of hope have ampli-fied this definition principally by emphasizing the importanceof goals. Most writers have postulated that hope is a unidimen-sional construct involving an overall perception that goals can bemet (e.g., Cantril, 1964; Erickson, Post, & Paige, 1975; Farber,1968; Frank, 1968; Frankl, 1963; French, 1952; Gottschalk,1974; Lewin, 1938; Melges & Bowlby, 1969; Menninger, 1959;Mowrer, 1960; Schachtel, 1959; and see Stotland, 1969, for themost detailed description). According to these writers, expec-tancies for goal attainment can be used to explain diverse behav-iors, including those involving physical and mental health. So-matic disturbance and psychopathology, for example, are re-lated to exceptionally low expectancies for goal attainment(Erickson et al, 1975; Gottschalk, 1974; Melges & Bowlby,1969). Thus, the predominant view is that greater hope is gener-ally associated with positive outcomes and as such is not"foolish."
Although the previous conceptualizations of hope have as-sumed that people are goal directed and that such goal directed-ness is adaptive, they generally have not detailed the means bywhich goals are pursued. In an expansion of these earlier views,the present analysis draws upon goal concepts (see Lee, Locke,& Latham, 1989; Pervin, 1989) to elucidate the cognitive set ofhope. Within a goal-setting framework, we propose that thereare two major, interrelated elements of hope. First, we hypothe-size that hope is fueled by the perception of successful agencyrelated to goals. The agency component refers to a sense ofsuccessful determination in meeting goals in the past, present,and future. Second, we hypothesize that hope is influenced bythe perceived availability of successful pathways related togoals. The pathways component refers to a sense of being able togenerate successful plans to meet goals. More formally, hope is
570

HOPE SCALE 571
defined as a cognitive set that is based on a reciprocally derivedsense of successful (a) agency (goal-directed determination) and(b) pathways (planning of ways to meet goals).
The two components of hope are reciprocal, additive, andpositively related, although they are not synonymous. From thisperspective, the saying, "Where there is a will there is a way" isonly partly correct. People who have a sense of successful goal-directed agency (the will) typically should perceive paths (theways) to reach their goals, but they may not. One can imagineinstances in which the goal-directed agency is present but thepathways to the goal are not clearly perceived. Conversely, onemay perceive available pathways to a goal, but without theagency. To sustain movement toward the goals in one's life, wewould argue that both the sense of agency and the sense ofpathways must become operative. That is, both agency andpathways are necessary, but neither is sufficient to define hope.Furthermore, hope does not merely involve one iteration inwhich a person first assesses agency and then proceeds to ananalysis of available pathways, thereafter eliciting goal-directedbehaviors. Nor does one pathways analysis unleash the agencyto eventuate in goal-directed behavior. Rather, agency/path-ways and pathways/agency iterations continue throughout allstages of goal-directed behavior; as such, hope reflects the cu-mulative level of perceived agency and pathways.
The agency and pathways components emphasize cognitiveappraisals of goal-related capabilities, underscoring the pheno-menological nature of the present conceptualization of hope. Inthis view, hope is egocentric in that it taps the person's percep-tion in relation to his or her life goals. Important external fac-tors influencing goal-related activities are incorporated into thecognitive analyses of agency and pathways. Thus, hope in thepresent context is not a goal-related state that is objectively de-fined according to sources external to the person, but rather it isan enduring disposition that is subjectively defined as peopleassess their agency and pathways related to goals.
Additionally, note that the cognitive emphasis of the presentmodel does not imply that emotions are irrelevant, but ratherthat emotions are the sequelae of cognitive appraisals of goal-re-lated activities. The quality of emotion for a particular goal-re-lated setting depends on the person's perceived hope in thatsetting. More specifically, the high-hope person's analysis of suf-ficient agency and pathways in a given goal setting should leadto the perception of relatively high probability of goal attain-ment, a focus on success rather than failure, a sense of chal-lenge, and a relatively positive emotional state as goal-relatedactivities are conceptualized and undertaken. Conversely, thelow-hope person's analysis of insufficient agency and pathwaysin a given goal setting should lead to perceptions of relativelylow probability of goal attainment, a focus on failure ratherthan success, a sense of ambivalence, and a relatively negativeemotional state during goal-related activities. -
The present model assumes that hope is consistent acrosssituations and time. Although specific situations may exert aunique influence on the level of hope, there is nevertheless aresiliency once this cognitive set is established. Generally, be-cause of their underlying sense of agency and pathways inachieving goals, higher as compared with lower hope peopleshould have more goals across the various arenas of their life,and they should select and attain more difficult goals. Whatever
the enduring level of hope, the person must confront the rele-vant impediments in the selection, appraisal, and movementtoward a goal. Up until some extreme level of goal interference,higher hope people should sustain their agency and pathwaysbehaviors; conversely, lower hope people should be more proneto decrease their agency and pathways in the face of increas-ingly stronger goal impediments. Furthermore, as we havenoted, higher as compared with lower hope people should evalu-ate their goals and the intervening impediments with more posi-tive, challengelike appraisals.
It may be useful at this point to discuss the similarities be-tween the components in the present hope model and the typi-cal efficacy and outcome expectancies that are described inmotivational and personality research. An outcome expectancymay be viewed as a belief that a particular behavior will pro-duce a particular outcome (Bandura 1977,1982,1986; Maddux,1991). In contrast, an efficacy expectancy refers to a person'sconfidence in his or her ability to perform a given behavior thatwill lead to a desired outcome. For example, an outcome expec-tancy of a new assistant professor may be that producing sev-eral published manuscripts will lead to the desired goal of beingpromoted, but he or she may or may not have the efficacy ex-pectancy to achieve such a publication record. Note that theefficacy and outcome expectancies, respectively, parallel theagency and pathways components of the present hope model.Having briefly highlighted the similarities in these concepts, itmay be illustrative to contrast the present hope model with twoother models, optimism and self-efficacy, that use the notionsof outcome and efficacy expectancy.
Scheier and Carver (1985) define optimism as a generalizedexpectancy that good things will happen. They argue that opti-mists maintain positive expectations that are not limited to aspecific domain or class of settings. (This definition is similar toearlier views of hope that described it as a unidimensional con-struct involving an overall perception that goals will be met)Scheier and Carver hypothesize that optimism is a major deter-minant of the manner in which people pursue their goals andthat optimists' expectancy that good things will happen leadsthem to approach goals through "contingent striving" ratherthan "giving up and turning away" (see also Klinger, 1975;Kukla, 1972; S. Roth & Cohen, 1986). Furthermore, optimism isconstrued as a stable personality trait that is not limited to aspecific setting. Hope is similar to optimism in that it is concep-tualized as a stable cognitive set reflecting general rather thanspecific outcome expectancies. Hope and optimism differ, how-ever, in the hypothesized relationship between outcome andefficacy expectancies and the role that this relationship plays inthe prediction of goal-directed behavior. Scheier and Carver(1985) suggest that outcome expectancies per se are the bestpredictors of behavior. Although Scheier and Carver allow forthe possibility that efficacy expectancies may influence theanalysis of outcome expectancies, they would argue that out-come expectancies are the last and most powerful analyses de-termining goal-directed behavior. Hope in the present model,however, involves reciprocal action between an efficacy expec-tancy reflecting the self-belief that one can achieve goals(agency) and an outcome expectancy reflecting the perceptionof one or more available strategies for achieving those goals(pathways).
572 SNYDER ET AL.
Bandura's theory of self-efficacy (1977, 1982, 1986) also ispredicated on a central distinction between the concepts ofefficacy expectancies and outcome expectancies. Contrary tothe theory of optimism, however, expectancies that are basedon personal efficacy are viewed as the major determinants ofbehavior within the context of self-efficacy theory. AlthoughBandura (1989) has acknowledged the bidirectionality of out-come and efficacy expectancies, the latter are emphasized asthe most powerful expectancies eliciting goal-directed behav-ior. Scheier and Carver (1987) are critical of Bandura's relianceon efficacy rather than outcome expectancies, stressing thatpersonal efficacy expectancies cannot account for outcomesthat are based on forces that are beyond the control of the per-son (e.g., religious faith, luck, or interventions from powerfulothers). We disagree with Bandura's emphasis on efficacy ex-pectancies for the same reason that we disagree with Scheierand Carver's reliance on outcome expectancies. That is, if self-related cognitions pertaining to goal-directed behavior are thesum of the reciprocal action of efficacy expectancies and out-come expectancies, as we have posited in the present hopemodel, then focusing on either type of expectancy alone willnot completely tap the cognitive set; moreover, focusing on onlyone of the expectancies should lessen the predictive impact ofthe cognitive set on subsequent goal-related activities. Further-more, from Bandura's perspective, judgments of self-efficacyrefer to specific assessments of how well one will perform aparticular task in a particular setting. In contrast, hope (likeoptimism) is conceptualized as a more general cognitive set thatapplies across particular settings and, as such, hope may yield awider range of goal-related predictions.
Having described the present model of hope, and its similari-ties and differences in relation to optimism and self-efficacy, wenow present a series of studies that were undertaken to developand validate an individual differences, self-report measure ofthe hope construct.
Scale Development and Validation
In the first stage of scale development, 45 items were writtento reflect the hypothesized content of hope. In the fall of 1985,these 45 items were administered to 187 male and 197 femalestudents at the University of Kansas who participated in partialfulfillment of introductory psychology course requirements.Subjects were asked to read each item and to rate the extent towhich it applied to them on a 4-point scale (1 = definitely false,2 = mostly false, 3 = mostly true, 4 = definitely true). The pur-pose of this initial study (Harris, 1988) was to condense the 45items into a concise and psychometrically valid self-reportscale. To achieve acceptable internal consistency, items that didnot evidence a high item-remainder coefficient were discarded.The Harris study produced a reduced pool of 14 items withreasonably high item-remainder coefficients (all > .20). Subse-quently, the four items that most clearly reflected the agencycomponent and the four items that most clearly tapped thepathways component were selected for the final version of thescale by C. R. Snyder.
The Hope Scale (see Appendix) contains eight hope items,plus four fillers. The contents of the four agency items tap thesense of successful determination in relation to the person's
goals generally. In regard to this overall successful sense of goal-related determination, one item reflects the past ("I've beenpretty successful in life"), two items reflect the present ("I ener-getically pursue my goals," and "I meet the goals that I set formyself), and one item reflects the future ("My past experi-ences have prepared me well for my future"). The sense of suc-cessful determination in regard to goals is implicitly acknowl-edged in the wording of the two items referencing the past andfuture agency and is explicitly acknowledged in the wording ofthe two items reflecting present agency. The four pathwaysitems pertain to people's cognitive appraisals of their ability togenerate means for surmounting goal-related obstacles andreaching goals (e.g., "I can think of many ways to get out of ajam," "There are lots of ways around a problem," "I can think ofmany ways to get the things in life that are most important tome," and "Even when others get discouraged, I know I can finda way to solve the problem").
Descriptive Statistics
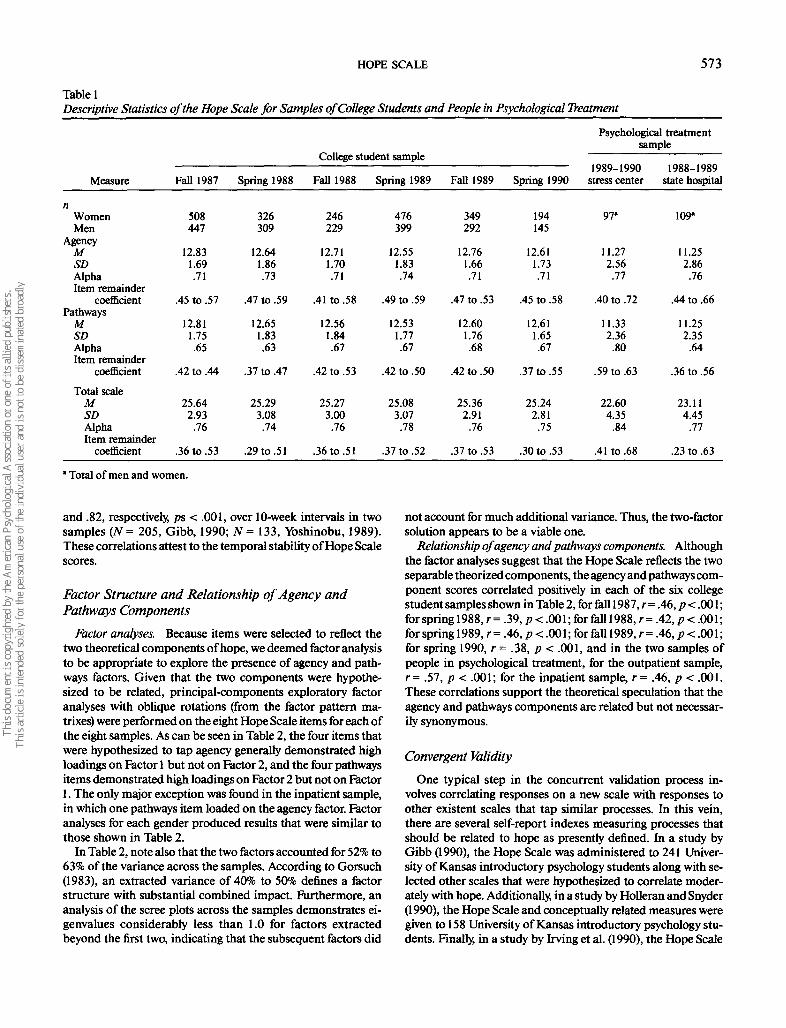
The Hope Scale was administered to six separate samples ofUniversity of Kansas introductory psychology students and twosamples (one outpatient and one inpatient) of people in psycho-logical treatment (see Table 1). The outpatient sample camefrom the Traumatic Stress Institute in South Windsor, Connecti-cut (Pearlman, McCann, & Johnson, 1990); the inpatient sam-ple came from Osawatomie State Hospital in Osawatomie,Kansas (Irving, Crenshaw, Snyder, Francis, & Gentry, 1990). Asone would expect, the average Hope Scale scores for the peoplein psychological treatment were lower than the scores obtainedby the college students (comparing each treatment sample withthe appropriate student sample taken during the same timeperiod, all t& > 17.38, all ps < .001). Although the treatmentsamples were significantly lower in hope than the college sam-ples, however, note that these treatment sample people weretoward the hopeful end of the response scale (i£., around a 3 onthe 4-point response scale for each hope item). The Hope Scalescores are not reported separately by gender in Table 1 becausethe scores of women and men were virtually identical across thevarious samples.
Reliability Indexes
Internal consistency. The information regarding the internalconsistency of the Hope Scale also is shown in Table 1. For thetotal scale, Cronbach's alphas ranged from .74 to .84 (item-re-mainder coefficients of .23 to .63). For the Agency subscale,Cronbach's alphas ranged from .71 to .76 (item remainder coeffi-cients of .40 to .72); moreover, for the Pathways subscale, Cron-bach's alphas ranged from .63 to .80 (item remainder coeffi-cients of .36 to .63). As Nunnally (1978, p. 245) notes, scaleswith internal reliabilities of .70 to .80 are acceptable for re-search purposes because correlations with such scales are notattenuated to any great degree by measurement error.
Temporal stability. The test-retest reliability of the HopeScale has been examined in four samples of University of Kan-sas undergraduates. The test-retest correlations were .85, p <.001, over a 3-week interval (N= 130; Anderson, 1988); .73, p <.001, over an 8-week interval (N = 115; Harney, 1989); and .76
HOPE SCALE 573
Table 1Descriptive Statistics of the Hope Scale for Samples of College Students and People in Psychological Treatment
Measure
nWomenMen
AgencyMSDAlphaItem remainder
coefficientPathways
MSDAlphaItem remainder
coefficient
Total scaleMSDAlphaItem remainder
coefficient
Fall 1987
508447
12.831.69.71
.45 to .57
12.811.75.65
.42 to .44
25.642.93
.76
.36 to .53
Spring 1988
326309
12.641.86.73
.47 to .59
12.651.83.63
.37 to .47
25.293.08.74
.29 to .51
College student sample
Fall 1988
246229
12.711.70.71
.41 to .58
12.561.84.67
.42 to .53
25.273.00.76
.36 to .51
Spring 1989
476399
12.551.83.74
.49 to .59
12.531.77.67
.42 to .50
25.083.07.78
.37 to .52
Fall 1989
349292
12.761.66.71
.47 to .53
12.601.76.68
.42 to .50
25.362.91
.76
.37 to .53
Spring 1990
194145
12.611.73.71
.45 to .58
12.611.65.67
.37 to .55
25.242.81
.75
.30 to .53
Psychological treatmentsample
1989-1990stress center
97"
11.272.56.77
.40 to .72
11.332.36
.80
.59 to .63
22.604.35
.84
.41 to .68
4 f\ClCl 4 4\Clf\
1988-1989state hospital
109*
11.252.86
.76
.44 to .66
11.252.35
.64
.36 to .56
23.114.45
.77
.23 to .63
* Total of men and women.
and .82, respectively, ps < .001, over 10-week intervals in twosamples (N= 205, Gibb, 1990; N= 133, Yoshinobu, 1989).These correlations attest to the temporal stability of Hope Scalescores.
Factor Structure and Relationship of Agency andPathways Components
Factor analyses. Because items were selected to reflect thetwo theoretical components of hope, we deemed factor analysisto be appropriate to explore the presence of agency and path-ways factors. Given that the two components were hypothe-sized to be related, principal-components exploratory factoranalyses with oblique rotations (from the factor pattern ma-trixes) were performed on the eight Hope Scale items for each ofthe eight samples. As can be seen in Table 2, the four items thatwere hypothesized to tap agency generally demonstrated highloadings on Factor 1 but not on Factor 2, and the four pathwaysitems demonstrated high loadings on Factor 2 but not on Factor1. The only major exception was found in the inpatient sample,in which one pathways item loaded on the agency factor. Factoranalyses for each gender produced results that were similar tothose shown in Table 2.
In Table 2, note also that the two factors accounted for 52% to63% of the variance across the samples. According to Gorsuch(1983), an extracted variance of 40% to 50% defines a factorstructure with substantial combined impact. Furthermore, ananalysis of the scree plots across the samples demonstrates ei-genvalues considerably less than 1.0 for factors extractedbeyond the first two, indicating that the subsequent factors did
not account for much additional variance. Thus, the two-factorsolution appears to be a viable one.
Relationship of agency and pathways components. Althoughthe factor analyses suggest that the Hope Scale reflects the twoseparable theorized components, the agency and pathways com-ponent scores correlated positively in each of the six collegestudent samples shown in Table 2, for fall 1987, r = .46, p < .001;for spring 1988, r = .39, p < .001; for fall 1988, r = .42, p < .001;for spring 1989, r = .46, p < .001; for fall 1989, r = .46, p < .001;for spring 1990, r - .38, p < .001, and in the two samples ofpeople in psychological treatment, for the outpatient sample,r= .57, p < .001; for the inpatient sample, r = .46, p < .001.These correlations support the theoretical speculation that theagency and pathways components are related but not necessar-ily synonymous.
Convergent Validity
One typical step in the concurrent validation process in-volves correlating responses on a new scale with responses toother existent scales that tap similar processes. In this vein,there are several self-report indexes measuring processes thatshould be related to hope as presently defined. In a study byGibb (1990), the Hope Scale was administered to 241 Univer-sity of Kansas introductory psychology students along with se-lected other scales that were hypothesized to correlate moder-ately with hope. Additionally, in a study by Holleran and Snyder(1990), the Hope Scale and conceptually related measures weregiven to 158 University of Kansas introductory psychology stu-dents. Finally, in a study by Irving et al. (1990), the Hope Scale

574 SNYDER ET AL.
1I
I|
si7 800 JS
II
I
4!IIS
(NJ i s ^« p«. ^^ oo ••" oo v*- - p o p r-# r*; «N *n ^t ~
ci O
^ , . , , . . . .if* »• ^
' i ^ ^ P °°. °̂ "̂ ^ ^ **?
(N OO
(S **
—i p p <N r-; r-# vo >o en oo
\Q ^5 Q ^5 ^ 00 "^ ^H ^1
c*i r̂ ^" fS O © ^f ^ oo(N—«<SfO oooovoin fsj p
^ ^
Cl OO
8 = 82 s8R5f R *.
r- ooI I **> ^
©—<f^Ov —• — 00 t - I——; p p p oo oi * « PI o»
S lO * o Ox OO * ^ f*"l *—• CN/~11~\ ^H r̂ . f-» \ o t o c*"& w^
' I* I ~ ̂£
• • • • ,- r • • < N vo
- m o o » fNr-<N«-i oo© p o p oo r-_ <o •• —. oo
t̂ . i/̂ i^ ̂ f^ ̂ Ox vo *Or~; c~- r- vq — ©;«if) p P4
I-
^ &
was administered along with other measures to 109 people whowere inpatients at a state mental health facility. Results fromthese studies are discussed in the following subsections.
Generalized positive outcome expectations. Given the under-lying importance of outcome expectancies to the present HopeScale, two indexes of generalized outcome expectancies wereused as convergent measures. First, optimism was measuredbecause persons who manifest a strong sense of agency andpathways for goals also should expect positive outcomes in theirlives. Scheier and Carver (1985) developed the Life OrientationTest (LOT) as a measure of disposition^ optimism, which tapsgeneralized positive outcome expectations. The LOT corre-lated .60 and .50 (ps < .005) with the Hope Scale in the Gibb(1990) and Holleran and Snyder (1990) studies, respectively. Sec-ond, the Generalized Expectancy for Success Scale (GESS; Fi-bel & Hale, 1978), which assesses cross-situational expectanciesfor attaining goals, was administered in the Gibb (1990) andHolleran and Snyder (1990) samples, and the correlations withthe Hope Scale were .55 and .54, respectively (ps < .005).
Control perceptions. Higher hope people should want to ex-ert personal control in their life. Desirability of control wasmeasured by the Burger-Cooper Life Experiences Survey(Burger & Cooper, 1979); items in this scale involve a generaldesire for control, decisiveness, preparation and preventioncoping in anticipation of stressors, avoidance of dependence,and leadership. The correlation between the Hope Scale andthis index was.54 (p< .005; Gibb, 1990). Similarly, higher hopepeople should perceive themselves as being facile at problem-solving activities. The Problem Solving Inventory (PSI;Heppner & Petersen, 1982) was administered because it tapsperceived problem-solving ability, rather than problem-solvingskills per se. The scale is composed of items involving self-per-ceptions related to problem-solving confidence, an approachrather than avoidant style, and personal control. The correla-tion between the Hope Scale and problem solving was -.62(p< .005; Gibb, 1990; lower scores reflect greater perceivedproblem solving).
Esteem. Persons with higher hope also should experience anenhanced sense of self-esteem across situations. The HopeScale correlated .58 (p < .005; Gibb, 1990) with responses to theRosenberg (1965) Self-Esteem Scale.
Hopelessness and depression. Certain scales should have aninverse relationship to hope. Most obviously, hope should relatenegatively to hopelessness. Beck, Weissman, Lester, andTrexler (1974) developed the Hopelessness Scale in a sample ofhospitalized inpatients to capture an overall hopeless attitude.The Hopelessness Scale contains items involving affective feel-ings about the future, motivations involving decisions to giveup, and cognitions involving anticipations of a generally darkfuture. The Hope Scale correlated -.51 (p < .005) with theHopelessness Scale (Gibb, 1990). Higher hope people alsoshould evidence less depression as they maneuver through theirlife in pursuit of goals. In this regard, the Hope Scale correlated-.42 (p < .005; Gibb; 1990) with depression as measured by theBeck Depression Inventory (Beck, Ward, Mendelsohn, Mock,&Erbaugh, 1961).
Minnesota Multiphasic Personality Inventory (MMPI) andRotter Incomplete Sentences Blank (ISB). People with higherhope should report (a) less severe psychological problems and

HOPE SCALE 575
(b) more positive perceptions of the stimuli in their life. Theseguiding hypotheses formed the basis of a study performed atOsawatomie State Hospital, a Kansas state inpatient mentalhealth facility (Irving et al., 1990). From June 1988 through July1989, the Hope Scale was administered to 109 inpatients duringinitial psychological testing upon admission to the hospital. Inaddition to the Hope Scale, the MMPI (1st ed., Hathaway &McKinley, 1951) and the ISB (Rotter & Rafferty, 1950) wereadministered.
The correlations of the Hope Scale with each of the 10 K-corrected MMPI clinical subscales were as follows: Hypochon-driasis, r = -.30, p < .001; Depression, r = -.60, p < .001;Hysteria, r = —.35, p < .001; Psychopathic Deviate, r = —.43,p < .001; Masculinity-Feminity, r= —.13, ns; Paranoia, r =-.34, p < .001; Psychasthenia, r = -.52, p < .001; Schizophre-nia, r = -.46, p < .001; Hypomania, r = -.08, ns; Social Intro-version, r = -.59, p < .001.
For the ISB, the original, complex scoring procedure wassimplified to assess the degree to which people provided nega-tive versus positive responses to the stimulus prompts. Eachstatement was rated as negative (e.g., "A mother is: neveraround"), neutral (e.g., "A mother is: a person"), or positive (e.g.,"A mother is: a great person"), with respective scores of 1,2, and3. Three raters reviewed all sentence completion responses; theinterrater reliabilities were .83, .83, and .65 (all ps < .001). There-fore, the raters' three scores were summed to derive an overallindex for each subject. The correlation between this sentencecompletion index and Hope Scale scores was .63 (p < .001).Thus, the data for the inpatient sample corroborated the hypoth-eses that higher hope people, as measured by the Hope Scale,would report less psychological disturbances and more positivecontent in response to open-ended stimulus prompts.
Social desirability/self-presentation. The previous traditionin test construction was that one must demonstrate the discrim-inant validity of a new scale in relation to measures that tapsome form of socially desirable responding. Increasingly in the1980s, however, socially desirable responding was viewed asproviding substantive rather than artifactual interpretations ofscale content (see, for excellent example, McCrae & Costa,1983). In other words, socially desirable responding can beviewed as providing convergent rather than discriminant valida-tional information. Consistent with this suggestion, socially de-sirable responding has been conceptualized as a positive self-presentational style that is part of adaptive coping; in this re-gard, the adaptiveness of maintaining positive illusions aboutoneself has been documented in recent reviews (Snyder, 1989;Snyder & Higgins, 1988; Taylor & Brown, 1988). On the basis ofthis newer line of thinking, therefore, we would argue thathigher hope should be moderately related to positive self-portrayal. Accordingly, Gibb (1990) administered the HopeScale along with two measures of socially desirable responding.First, the Marlowe-Crowne Social Desirability Scale (Crowne &Marlowe, 1960) exhibited a positive relationship, r = .30, p <.005, with the Hope Scale. Second, the Hope Scale correlatedpositively, r = .28, p < .005, with the Self-Presentation Scale(D. L. Roth, Harris, & Snyder, 1988; D. L. Roth, Snyder, & Pace,1986), which taps the extent to which people endorse positiveattributes that are actuarialry uncommon and deny negativeattributes that are actuarially common. Taken together, these
results suggest a tendency of higher hope people to presentthemselves in a favorable light.
In summary, the correlations described in this section onconvergent validity suggest that there are predictable relation-ships involving the shared nomological network of the presentHope Scale and its underlying construct and several relatedexistent measures and their underlying constructs.
Discriminant Validity
In the establishment of a new individual-differences mea-sure, it is important to demonstrate the independence of thismeasure from theoretically unrelated self-report measures. Toaddress this issue, the Hope Scale was given to introductorypsychology students along with two subscales of the Self-Consciousness Scale by Fenigstein, Scheier, and Buss (1975).The Self-Consciousness Scale was used because it yields scoreson (a) private self-consciousness (focus on attending to one'sinner thoughts and feelings) and (b) public self-consciousness(general awareness of the self as a social object). There was noobvious theoretical reason to predict that higher as comparedwith lower hope people would vary on these dimensions. Aspredicted, the correlations between the Hope Scale and thePrivate and Public Self-Consciousness subscales were not signif-icant (rs = .06 and -.03, respectively; Gibb, 1990), suggestingthat these scales share little variance. As should be the case,these latter correlations are smaller in magnitude than the .30to .60 correlations found in the previously discussed convergentvalidational studies.
Discriminant Utility
It also is instructive to examine the discriminant utility of anew scale for accounting unique variance in theoretically re-lated outcome measures. A new measure such as the HopeScale, while demonstrating moderate correlations with otherrelated constructs (e.g., negative affect or generalized positiveoutcome expectancies), also should account for additional vari-ance beyond that accounted for by these related constructs. Thestudies reported in this section address the discriminant utilityof the Hope Scale.
Negative affectivity. Recent writings in the area of personal-ity constructs have suggested that negative affectivity (or neu-roticism) should be considered as an alternate explanation forthe results that are supposedly obtained through the operationof other variables (Clark & Watson, 1991; Costa & McCrae,1987; Depue & Monroe, 1986; Holroyd & Coyne, 1987; T. WSmith, Pope, Rhodewalt, & Poulton, 1989; Watson & Penne-baker, 1989). Negative affectivity, which appears to be the affec-tive core of the neuroticism construct (see McCrae & Costa,1987), refers to "a broad, stable dimension of personality con-sisting of chronic negative emotions including sadness, anxiety,guilt, and anger, as well as low self-esteem, preoccupation, andinsecurity" (T. W Smith et al., 1989, p. 641).
In assessing the association of negative affectivity with HopeScale responses, we must first present our rationale as to whythese two constructs should be moderately related. Becausehigher hope people should be less prone to exhibit negativeaffect and self-deprecatory cognitions across goal-related situa-
576 SNYDER ET AL.
tions, Hope Scale scores should exhibit significant negativecorrelations with indexes of negative affectivity. Indeed, suchrelationships would provide convergent validational informa-tion for the Hope Scale. Considering the findings of Watsonand Clark (1984), who reviewed several measures of negativeaffect, the Taylor (1953) Manifest Anxiety Scale (TMAS) andthe State-Trait Anxiety Inventory, trait form (STAI; Spielberger,Gorsuch, & Luchene, 1970), were selected for inclusion alongwith the Hope Scale in a correlational study (Holleran &Snyder, 1990) with 158 University of Kansas introductory psy-chology students. Results showed that the Hope Scale was signif-icantly and negatively correlated with the two indexes of nega-tive affect: for TMAS, r = -.47, p < .001; for STAI, r = -.58,p<.001.
The question now turns to whether relations of the HopeScale responses with selected theoretically related coping behav-iors are basically explicable in terms of negative affect. To exam-ine this issue, the Problem-Focused Coping subscale of the re-vised Ways of Coping Checklist (Folkman & Lazarus, 1980;Folkman & Lazarus, 1985—the college sample) was examinedbecause it was hypothesized to be related to the present defini-tion of hope. In particular, we hypothesized that higher hopepeople would engage in increased problem-focused coping.The discriminant utility of the Hope Scale would emerge if itdemonstrated the predicted positive relationship with problem-focused coping strategy while controlling for the effect of nega-tive affect.
To test this question, Holleran and Snyder (1990) adminis-tered the college student version of the revised Ways of CopingChecklist (Folkman & Lazarus, 1985), the Hope Scale, and theTMAS and STAI as indexes of negative affect. With problem-focused coping as the criterion variable in hierarchical multipleregressions, forcing the TMAS and the STAI into the regressionequation at Step 1 resulted in R2 = .06, p < .01; when Hope Scalescores were forced in at Step 2, the prediction was significantlyaugmented, increment in R2 (hereafter referenced as A R2) =.03, p < .05. Conversely, if Hope Scale scores were forced in atStep 1, R2 = .09, p < .001, and the TMAS and STAI entered atStep 2 did not account for additional variance in coping, AR2 =.01, ns. Therefore, the Hope Scale contains unique predictivevariance in relation to problem-focused coping that cannot beexplained by negative affectivity.
Positive and negative affectivity. Drawing on previous person-ality literature defining the factors of extroversion and anxiety/neuroticism, Watson and Tellegen (1985) have presented a two-factor model of positive affect and negative affect. In a subse-quent article introducing the Positive and Negative AffectSchedule (PANAS), which reflects this two-factor model, Wat-son, Clark, and Tellegen (1988, p. 1063) define positive affect as"a state of high energy, full concentration, and pleasurable en-gagement," and negative affect as "a general dimension of sub-jective distress and unpleasurable engagement that subsumes avariety of aversive mood states, including anger, contempt, dis-gust, guilt, fear, and nervousness." Obviously, the concept ofpositive affect taps processes that relate to the present defini-tion and measurement of hope. Although we have examinedthe discriminant utility of Hope Scale scores in relation to nega-tive affectivity, the larger question of the possible roles of bothpositive and negative affect in accounting for the relationships
between hope and other criterion variables remains. The twosubsequent studies were conducted to address this question.
In the first study (Sigmon & Snyder, 1990b), 128 University ofKansas introductory psychology students (74 women, 54 men)completed the Hope Scale along with the Active Coping andPlanning subscales of a coping inventory (the COPE) developedby Carver, Scheier, and Weintrab (1989) and the PANAS (Wat-son et al, 1988). The instructions for the PANAS asked subjectsto "respond as they feel generally." In regard to the two subscalesof the COPE, active coping involves taking steps to eradicate orovercome the effects of stressors in a direct and effortful man-ner, and planning involves coming up with action strategies soas to handle stressors. These two coping strategies should bemanifested to a higher degree by people with greater hope.
As expected, the Hope Scale correlated positively with thePANAS positive affect items, r(126) = .30, p < .001, and nega-tively with the PANAS negative affect items, r(126) = -.18,p < .05.
Using active coping as the criterion variable in hierarchicalmultiple regressions, when negative affect was forced in at Step1, R2 = .01, ns; when positive affect was forced in at Step 2, itaugmented the prediction, AR2 = .075, p < .01; finally, whenHope Scale scores were forced in at Step 3, they augmentedprediction further, A R2 = .09, p < .001. Conversely, Hope Scalescores forced in at Step 1 predicted active coping, R2 =. 15, p <.001; positive affect entered at Step 2 augmented the prediction,A R2 = .03, p < .05; negative affect entered at Step 3, however,did not augment prediction, A R2 = .00, ns. With planning as thecriterion variable in hierarchical regressions, when negative af-fect was forced in at Step 1, R2 = .02, ns; when positive affect wasforced in at Step 2, it did not augment the prediction, A R2 =.028, ns; finally, when Hope Scale scores were forced in at Step 3,they augmented prediction, A R2 = .032, p < .05. Conversely,Hope Scale scores forced in at Step 1 predicted planning, R2 =.06, p< .01; positive affect entered at Step 2 did not augment theprediction, A R2 = .01, ns; furthermore, negative affect enteredat Step 3 did not augment the prediction, A R2 = .01, ns. Theseresults suggest that Hope Scale scores contributed unique vari-ance in relation to active coping and planning that was notexplained by positive and negative affect.
The second study was conducted to ascertain whether therelationship of Hope Scale scores to an overall index of well-be-ing could be accounted for by positive and negative affect. Inthis study (Sigmon & Snyder, 1990a), 210 University of Kansasintroductory psychology students completed the Hope Scale,along with (a) the PANAS as a measure of positive and negativeaffectivity, (b) the STAI as a second index of negative affectivity,and (c) the Mental Health Inventory (Veit & Ware, 1983). Theinstructions for the PANAS asked subjects to "respond as theyfeel generally" The 38-item Mental Health Inventory was devel-oped and validated to assess characteristics of psychologicalwell-being in a general population.
As was the case in the previously described Sigmon andSnyder (1990b) study, the Hope Scale evidenced the predictedpositive correlation with the positive PANAS items, r(208) =.55, p < .001, and a negative correlation with the negativePANAS items, r(208) = -.18, p < .01.
Using overall well-being as the criterion variable in hierarchi-cal regressions, when STAI scores were forced in at Step 1, the

HOPE SCALE 577
R2 = .40, p < .001; when negative affect was forced in at Step 2, itdid not augment the prediction, A R2 = .00, ns; when positiveaffect was entered at Step 3, it augmented the prediction, R2 =.035, p < .001; finally, when Hope Scale scores were forced in atStep 4, they further augmented prediction A R2 = .01, p < .05.Conversely, Hope Scale scores forced in at Step 1 predicted theoverall well-being index, R2 = .17, p < .001; positive affect en-tered at Step 2 augmented the prediction, A R2 = .05, p < .01;negative affect entered at Step 3 augmented the prediction, AR2 = .08, p < .001; finally, STAI scores entered at Step 4 aug-mented prediction, R2 = .16, p < .001. These results suggestthat hope, negative affect (as tapped by the STAI more so thanby the PANAS), and positive affect each accounted for uniquevariance in overall self-reported well-being.
In summary, the two studies using measures of both positiveaffect (as measured by the PANAS) and negative affect (as mea-sured by the PANAS and STAI) suggest that these two variablesdo not serve as viable alternative explanations for the obtainedrelations between Hope Scale scores and active coping, plan-ning, and psychological well-being.
Generalized positive outcome expectancies. Generalized posi-tive outcome expectancies represent another concept againstwhich the discriminant utility of the Hope Scale should betested. As we have shown in the previous section on convergentvalidity, the Hope Scale correlated positively with two measuresof generalized positive outcome expectancies, the LOT and theGESS. In a previously described study (Holleran & Snyder,1990), it also was possible to test whether Hope Scale scoresaccounted for significant variance in problem-focused copingbeyond that accounted for by the LOT and GESS.
Using the Problem-Focused Coping index of the RevisedWays of Coping Checklist (Folkman & Lazarus, 1985) as thecriterion variable in a hierarchical regression, when the LOTwas forced in at Step 1, the R2 = .04, p < .05; when the GESS wasforced in at Step 2, it augmented the prediction, A R2 = .04, p <.05; finally, when Hope Scale scores were forced in at Step 3,they augmented the prediction further, A R2 = .03, p < .05.Conversely, Hope Scale scores forced in at Step 1 predicted theProblem-Focused Coping index, R2 = .085, p < .001; the LOTentered at Step 2 did not augment prediction, A R2 = .005, ns;finally, the GESS entered at Step 3 also did not augment predic-tion, A R2 = .015, ns. Thus, the Hope Scale exhibited discrimi-nant utility in relation to the LOT and the GESS in predictingproblem-focused coping.
Negative affect and generalized positive outcome expectan-cies. An even more stringent test of discriminant utility per-tains to the question of whether the Hope Scale augments theprediction of problem-focused coping beyond measures ofboth negative affect and generalized positive outcome expec-tancies. Using the Holleran and Snyder (1990) data, with thecriterion variable of problem-focused coping, the negative af-fect measures (TMAS and STAI) forced in together at Step 1were significant, R2 = .02, p < .01; the LOT entered at Step 2 didnot augment the prediction, A R2 = .00, ns; the GESS entered atStep 3 tended to augment the prediction, AR2= .02, p < .06;and finally, Hope Scale scores entered at Step 4 tended to aug-ment prediction, A R2 = .02, p < .06. Additionally, note thatwhen the other measures were entered last in similar hierarchi-cal regressions, none of them came close to significantly aug-
menting the prediction of problem-focused coping as did HopeScale scores.
Life stress, optimism, and locus of control. In a prospectivestudy, Anderson (1988) addressed the discriminant utility of theHope Scale in relation to measures of life stress, optimism, andlocus of control. Initially, 130 introductory psychology students(68 men and 62 women) at the University of Kansas, all ofwhom 3 weeks earlier had scored in either the bottom, middle,or top third of the Hope Scale distribution given at a mass-screening session, completed the Hope Scale along with threeother measures that have conceptual similarity to the presenthope concept. First, the Schedule of Life Events (Boaz & Den-ney, 1986) was given as an index of life stress. Life stress wasincluded because this variable often accounts for major vari-ance in predicting health-related outcomes. This scale includes76 nonoverlapping items from other life stress questionnaires,and indexes of the total positive stress and total negative stressare derivable. Second, the LOT was given as an index of opti-mism. Third, the Locus of Control Scale (Rotter, 1966) wasadministered because it has proven to be a powerful individual-differences measure in predicting various health outcomes (seeLefcourt & Davidson-Katz, 1991).
Ten weeks after the initial testing session, subjects returnedto complete a measure of mental health symptoms. Subjectswere administered the Psychological Symptoms Measure, con-sisting of 60 items from the Symptom Distress Checklist, whichis a self-report measure that has been validated by Derogatis,Lipman, and Covi (1973). The symptoms measured includesomatization, obsessive-compulsive behavior, interpersonal hy-persensitivity, depression, anxiety, hostility, phobic anxiety, andparanoid ideation.
When number of overall mental health symptoms reportedwas used as the criterion variable, a hierarchical regression inwhich negative life stress was forced in at Step 1 yielded an R2 =.10, p < .001; locus of control entered at Step 2 augmented theprediction, A R2 = .04, p< .05; positive life stress entered at Step3 did not augment the prediction, A R2 = .00, ns; the LOTentered at Step 4 augmented the prediction, A R2 = .03, p < .05;finally, Hope Scale scores entered at Step 5 augmented predic-tion further, A R2 = .05, p < .01. Conversely, a hierarchicalregression in which hope was forced in at Step 1 produced anR2 = . 13, p< .001; the LOT entered at Step 2 did not augmentthe prediction, A R2 = .02, ns; positive life stress entered at Step3 did not augment the prediction, A R2 = .01, ns; locus of controlentered at Step 4 did not augment the prediction, A R2 = .02, ns;finally, negative life stress scores entered at Step 5 augmentedprediction further, A R2 = .04, p < .05. In this study, therefore,both negative life stress and hope contributed significant andunique variance to the prediction of mental health symptoms.
In summary, note that the Hope Scale contributed uniquevariance in relation to all other individual-differences disposi-tional measures discussed in the present section on discrimi-nant utility.
Construct Validation of Hope and Goal-Related Behaviors
The present conceptualization and operationalization ofhope are built on the importance of goals. Corroboration of thepredicted goal-related behaviors to be described next would
578 SNYDER ET AL.
provide additional construct validation for the Hope Scale. Thestudies in the following section address this issue.
Hope X Stressor interaction. Hope should be manifested inpeople's day-to-day activities (this is analogous to positing amain effect of hope in analysis of variance terms). Furthermore,the agency and pathways of high-hope people should be main-tained in the face of a stressor, such as an obstacle to a goal, andthe agency and pathways of low-hope people should deterioratewhen they encounter an obstacle (this is analagous to positing aHope X Stressor interaction in analysis of variance terms). Thispredicted interaction is captured in the saying "When the goinggets tough, the tough get going." To test these predictions, ananalogue study (Yoshinobu, 1989) was undertaken with 133 Uni-versity of Kansas introductory psychology students (69 womenand 64 men). Based on Hope Scale scores obtained earlier atmass-screening sessions, men and women scoring in the bot-tom 17%, the middle 14%, and the top 22% of the pool wererecruited to form the low-, medium-, and high-hope groups.The design was a 3 (level of hope: low, medium, high) X 2 (gradefeedback condition: none, negative) X 2 (sex: male, female) facto-rial.
Subjects in the no-feedback situation were asked to imaginethemselves in an introductory college course in a field that mayeventually be their major. Furthermore, these subjects were in-structed to imagine that they had set a grade goal of at least a Bin the course. In the negative-grade-feedback condition, thesubjects received the previously described instructions and alsowere told:
Although you have set your goal of getting a B, when your firstexamination score worth 30% of your final grade is returned, youhave received a D. It is now one week after you have learned aboutthe D grade.
Subjects were then given a questionnaire designed to assesstheir goal-related agency and pathways behaviors.
Subjects completed manipulation checks pertaining to thedegree to which they could imagine themselves in the situation,as well as the degree to which they felt involved in the experi-mental situation; there were no significant differences amongany of the conditions, and subjects reported a high level of in-volvement in the scenarios. For the eight manipulation checkitems involving affective terms (stressed, nervous, satisfied,challenged, content, threatened, relaxed, and tense), 3 (hopelevel: low, medium, high) X 2 (grade feedback: none, negativegrade) X 2 (sex: male, female) analyses of variance on the individ-ual items and on a combined index indicated that subjects inthe negative-grade-feedback condition reported more distressthan those in the no-feedback condition (all ps < .02 on individ-ual items, p < .001 on collapsed rating).
The dependent variable of agency was assessed by five items:(a) How much effort are you exerting to reach your grade goal ofa B? (1 = no effort, to 7 = extreme effort); (b) When I think aboutthis goal, I feel energized (1 = not at all, to 7 = extremely); (c)How confident are you of reaching your goal? (1 = not at all, to7 = extremely); (d) How important is achieving this grade goal toyou? (1 = not at all, to 7 = extremely); and (5) What is theprobability (0% to 100%) that you will reach your grade goal?Because the agency items were highly intercorrelated, subjects'scores on the five items were standardized, summed, and then
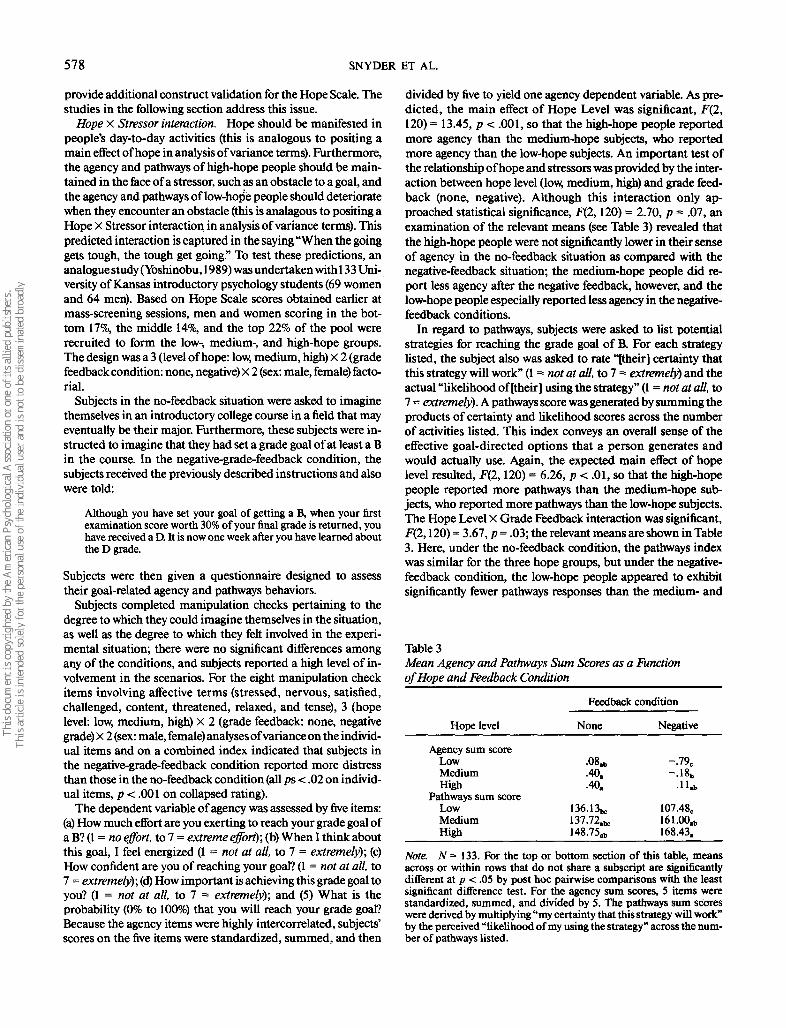
divided by five to yield one agency dependent variable. As pre-dicted, the main effect of Hope Level was significant, F(2,120) = 13.45, p < .001, so that the high-hope people reportedmore agency than the medium-hope subjects, who reportedmore agency than the low-hope subjects. An important test ofthe relationship of hope and stressors was provided by the inter-action between hope level (low, medium, high) and grade feed-back (none, negative). Although this interaction only ap-proached statistical significance, F(2,120) = 2.70, p = .07, anexamination of the relevant means (see Table 3) revealed thatthe high-hope people were not significantly lower in their senseof agency in the no-feedback situation as compared with thenegative-feedback situation; the medium-hope people did re-port less agency after the negative feedback, however, and thelow-hope people especially reported less agency in the negative-feedback conditions.
In regard to pathways, subjects were asked to list potentialstrategies for reaching the grade goal of B. For each strategylisted, the subject also was asked to rate "[their] certainty thatthis strategy will work" (1 = not at all, to 7 = extremely) and theactual "likelihood of [their] using the strategy" (1 = not at all, to7 = extremely). A pathways score was generated by summing theproducts of certainty and likelihood scores across the numberof activities listed. This index conveys an overall sense of theeffective goal-directed options that a person generates andwould actually use. Again, the expected main effect of hopelevel resulted, F(2,120) = 6.26, p < .01, so that the high-hopepeople reported more pathways than the medium-hope sub-jects, who reported more pathways than the low-hope subjects.The Hope Level X Grade Feedback interaction was significant,F(2,120) = 3.67, p = .03; the relevant means are shown in Table3. Here, under the no-feedback condition, the pathways indexwas similar for the three hope groups, but under the negative-feedback condition, the low-hope people appeared to exhibitsignificantly fewer pathways responses than the medium- and
Table 3Mean Agency and Pathways Sum Scores as a Functionof Hope and Feedback Condition
Hope level
Agency sum scoreLowMediumHigh
Pathways sum scoreLowMediumHigh
Feedback condition
None
•08*.40..40.
136.13*137.72.*148.75.b
Negative
-.79,-.18b
107.48c161.00.b168.43.
Note. N = 133. For the top or bottom section of this table, meansacross or within rows that do not share a subscript are significantlydifferent at p < .05 by post hoc pairwise comparisons with the leastsignificant difference test. For the agency sum scores, 5 items werestandardized, summed, and divided by S. The pathways sum scoreswere derived by multiplying "my certainty that this strategy will work"by the perceived "likelihood of my using the strategy" across the num-ber of pathways listed.

HOPE SCALE 579
high-hope people. Comparing the reactions with the no-feed-back and negative-feedback scenarios (although the differencesdo not reach statistical significance), it appeared that in the faceof an obstacle, medium- and high-hope people tended to ex-hibit more pathways but low-hope people exhibited fewer path-ways.
To examine the role of academic achievement in regard tothe relationship of hope level and reported agency and path-ways in the face of stressors, subjects were asked to report theircumulative high school and college grade point averages (GPA).High school GPA correlated .17, p < .10, and college GPAcorrelated . 13, ns, with Hope Scale scores. Additionally, GPAentered as a covariate in the aforementioned agency and path-ways analyses of variance did not tend to change the maineffects of hope or the Hope X Feedback interactions.
In summary, when confronted with a goal obstacle, high-hope people sustained agency and pathways behaviors; me-dium-hope people had less agency but nevertheless generatedpathways; and low-hope people evidenced both decreasedagency and pathways for the goal.
Hope and number of goals. Another prediction flowing fromthe hope model is that higher hope people, with their generallyenhanced goal-directed agency and sense of pathways to goals,should have a greater number of goals across their various lifearenas. An interview study of the self-reported goals was under-taken with residents of Lawrence, Kansas, to examine this pre-diction (Langelle, 1989). People in their 20s, 30s, and 40s, withan equal number of men and women from each cohort, werecontacted first by letter, then by telephone, resulting in a 50%rate of participation. The mean age for each of the cohorts was25 (15 men, 14 women), 35 (14 men, 15 women), and 45 (15 men,15 women). The sample was White, predominately middleclass, and 75% were married; the typical education level variedbetween some college and a college degree.
Respondents initially completed the Hope Scale; there wereno significant effects related to gender or age cohort. For each ofsix life arenas (family of origin, friendships, marriage or inti-mate relationships, employment, health, and personal or spiri-tual development), the respondent was asked whether they hada goal (yes or no). As predicted, the number of goals (0 to 6)summed across the six life arenas correlated positively withHope Scale scores, r = .24, p < .03.
Hope and preferred difficulty of goals. The elevated sense ofagency and pathways of higher in relation to lower hope peopleshould relate to their selection of more difficult goals. This hy-pothesis was tested in two studies. In a first study (Harris,1988), introductory psychology students at the University ofKansas completed the Hope Scale at mass screening; 88 sub-jects were recruited, with approximately a third from the bot-tom, the middle, and the top 20% of the Hope Scale distribu-tion. This latter selection procedure was used to assure a rangeof Hope Scale scores. Subjects were provided an ambiguoustask involving a lengthy series of multiple-choice tests (e.g, anal-ogies, sentence completions, and quantitative- and spatial-rea-soning items). The items were of varying difficulty; there weremany more items than could be completed in the time period.After subjects worked on these problems, the experimenter in-formed them that for the next part of the study, they could selectamong tests differing in difficulty (1 = very easy, to 5 = very
difficult). As hypothesized, the correlation between Hope Scalescores and level of task difficulty selected was positive, r = .45,p < .001. Thus, as hypothesized, higher hope people selectedmore difficult goals.
To ascertain whether the relationship of Hope Scale scores todifficulty of task selected was explained by other related vari-ables in the aforementioned Harris (1988) study, two additionalmeasures were administered along with the Hope Scale. First,because optimism could provide an alternative explanation fordifficulty of task selected, the LOT was administered. Second,because differences related to the cognitive capabilities ofhigher hope people could account for their selection of moredifficult tasks, students were^asked to report their cumulativehigh school GPA (almost all the subjects were college freshmenand therefore had not established a college GPA). In a hierarchi-cal regression, LOT scores forced in at Step 1 predicted thecriterion variable of difficulty of task selected, R2 =. 11, p < .01;high school GPA entered at Step 2 did not augment the predic-tion, AR2 = .02, ns; finally, Hope Scale scores entered at Step 3further augmented prediction, A R2 = .07, p < .05. When HopeScale scores were forced into a similar hierarchical regression atStep 1, they predicted the criterion variable of difficulty of taskselected R2 = .20, p< .001; high school GPA entered at Step 2did not augment the prediction, A R2 = .00, ns; finally, LOTscores entered at Step 3 did not augment prediction, A R2 =.00, ns.
The findings that LOT scores did not explain the variancepredicted by scores on the Hope Scale replicate previously dis-cussed discriminant utility findings related to other criterionvariables involving coping and mental health. In regard to therelationship between Hope Scale scores and high school cumu-lative GPA, note that the simple correlation was .49 (p < .001),suggesting that higher hope did relate to better high schoolperformance. What is noteworthy, however, is that the HopeScale nevertheless provided predictive information in relationto the selection of task difficulty beyond that which was attribut-able to GPA.
In a second study (Sigmon & Snyder, 1990b), subjects com-pleted the Hope Scale and the PANAS and were then asked toselect a subsequent task for the next phase of the experiment.Subjects could select from five tasks (varying from 1 = very easy,to 5 = very difficult). In a hierarchical regression using difficultyof task selected as the criterion variable, hope forced in at Step 1predicted difficulty of task selected, R2 = .06, p < .01; positiveaffect entered at Step 2 augmented the prediction, AR2 = .03,p < .05; finally, negative affect entered at Step 3 did not augmentprediction, A R2 = .00, ns. To ascertain whether the relationshipof hope to difficulty of task selected was explained solely bypositive and negative affect scores, another hierarchical regres-sion was performed. When negative affect was forced in at Step1, it did not predict difficulty of task selected, R2 = .00, ns;positive affect entered at Step 2 did augment the prediction, AR2 = .06, p < .01; finally, hope entered at Step 3 augmentedprediction further, A R2 = .04, p < .05. Thus, Hope Scale scorespredicted difficulty of task selected beyond variance that wasexplicable in terms of positive and negative affect.
Taken together, the two studies involving selection of tasksvarying in difficulty support the hypothesis that higher in rela-tion to lower hope people should select more difficult tasks.
580 SNYDER ET AL.
Furthermore, the discriminant utility of the Hope Scale is illus-trated by its ability to predict difficulty of task selected beyondvariance related to optimism, positive and negative affect,and cognitive/intellectual capabilities as measured by highschool GPA.
Hope, academic goal-setting, ongoing goal attainment ap-praisals, and goal attainment. Beyond demonstrating thathigher hope people set more difficult goals, one is still left withquestions about how people differing in level of hope may varyin terms of their perceived estimates of obtaining their goals asthey work toward them; moreover, do the higher hope peopleactually meet the more difficult goals that they set for them-selves?
These questions were addressed in another part of thepreviously described study by Anderson (1988). In this study,introductory psychology students took the Hope Scale duringmass testing. Approximately 3 weeks later, 130 students (68men, 62 women) from the bottom, middle, and top 20% of thedistribution were recruited to ensure a range of hope scores.The subjects were asked to set a realistic goal for their finalgrade in introductory psychology before any exams had beengiven in their introductory psychology course. Results revealedthat Hope Scale scores correlated positively with grade ex-pected, r = .32, p < .001, so that higher hope persons set highergrade goals.
Subjects returned 3 weeks later after receiving feedback ontheir first introductory psychology examination, and they wereasked to report their grade (F to A). Additionally, subjects werereminded of the particular grade goals that they had estab-lished earlier in the semester and then were asked to estimatethe probability (0% to 100%) of attaining this goal in light oftheir first grade. Using actual grade obtained on the first examas the criterion variable in a regression, Anderson (1988) foundthat Hope Scale scores were not a significant predictor, R2 = .01.Using probability of attaining the grade predicted at the begin-ning of the semester in light of the grade obtained on the firstexam as the criterion variable in a regression, Anderson foundthat Hope Scale scores approached significance, R2 = .02, p <.10. These latter results suggested that higher hope studentstended to believe that they would be more likely to reach theirhigher final grade goals, even though there was little evidenceafter the first examination that they were doing so.
The students' final psychology grades were obtained at theend of the semester (the letter grades were converted to num-bers, F to A = 1 to 5, respectively). With final grades as thecriterion variable in a regression, Hope Scale scores were asignificant predictor, R2 = .04, p < .05. To ascertain whether theaforementioned relationship between Hope Scale scores andfinal grade obtained occurred irrespective of the grade ob-tained on the first exam, another hierarchical regression wasperformed using final grade as the criterion variable; gradeobtained at the first exam predicted the final grade when en-tered at Step 1, R2 = .47, p < .001; additionally, however, HopeScale scores entered at Step 2 augmented the prediction of finalgrade, A R2 = .02, p < .05.
Overall, this study suggests that higher as compared withlower hope students (a) set higher grade goals, (b) tended toperceive that they would be more successful at attaining thosehigher grade goals despite early grade feedback that was not
supportive of their estimate, and (c) actually attained highergrades. In regard to this latter point, however, note that studentswith differing levels of hope were equally successful at attainingthe goals that they had set for themselves, although the higherhope students set and attained higher grade goals. Additionally,note that Hope Scale scores actually provided some enhance-ment in the ability to predict final semester grade beyond vari-ance related to grades on the first exam. Thus, the Hope Scaleappears to tap a cognitive set that is more than cognitive/intel-lectual capabilities as inferred by early course performance.
To provide another test of the possible relationship of cogni-tive capabilities and hope, as well as the influence of cognitivecapabilities on the hope-grade attainment relationship, an ad-ditional study was conducted (Harney, 1989). Female (n = 59)and male (n = 56) introductory psychology students at the Uni-versity of Kansas were recruited on the basis of having scored atthe mean or one standard deviation below or above the meanon Hope Scale scores. Subjects signed a consent form allowingthe experimenter to obtain their final introductory psychologygrade and their subsequent semester GPA from the universityregistrar. First, high school GPA and Hope Scale scores werenot significantly correlated, r = - . 10. Turning to the issue of thediscriminant utility of hope, high school GPA entered at Step 1was not a reliable predictor of final psychology course grade,R2 = .00, ns; additionally, however, Hope Scale scores entered atStep 2 augmented prediction, A R2 = .04, p < .05. Similarly,using subsequent semester GPA as the criterion variable in ahierarchical regression, high school GPA entered at Step 1 wasnot a reliable predictor, R2 = .00, ns; however, Hope Scale scoresentered at Step 2 augmented prediction, A R2 = .04, p < .05.Again, therefore, cognitive capability as measured by reportedhigh school GPA did not account for the hope-grade attain-ment relationship.
Before leaving the topic of the relation between Hope Scalescores and cognitive/intellectual capabilities, a finding from thepreviously discussed Irving et al. (1990) sample of psychiatricinpatients is worth noting. In that study, Shipley IQ equivalentscores (Shipley, 1967; Zachary, 1986) also were collected alongwith Hope Scale scores, and they correlated -.06, ns. Thus,Hope Scale scores were not explicable in terms of cognitive/in-tellectual capabilities as measured by Shipley IQ equivalentscores.
Hope and life goal appraisals. Following from the work ofLazarus and his colleagues (e.g., Lazarus & Folkman, 1984), wewould argue that the appraisals made about life goals are inte-gral to hope's relation to the coping process. That is, it is moreadaptive for people to perceive their life goals in a more positive,challenge-like set as compared with a less positive, ambivalentset. Thus, higher as compared with lower hope people shouldperceive their goals in a more challenging, positive perspective.In the previous section regarding academic goals, this generalquestion was addressed in the Anderson (1988) study. This lat-ter study also expands on this question by examining challenge-related appraisals related to goal arenas beyond just academics.
In a large group session, subjects completed the PersonalGoal Questionnaire (PGQ), which was developed specificallyto measure personal goals along with several beliefs and feel-ings about those goals. This questionnaire is based on the workof Wadsworth and Ford (1983), who developed a methodology

HOPE SCALE 581
for assessing personal goal hierarchies. In the first part of thePGQ, the subjects were asked to describe their most importantpersonal goal for the next 6 months in each of four life areas: (a)work and school, (b) primary family life (e.g., parents, siblings),(c) intimate relationships, and (d) personal changes or develop-ment. Subjects were instructed to take several minutes to con-ceptualize and specify their 6-month goals. Then, the goal ap-praisals were assessed, in part, by the method used by Folkmanand Lazarus (1985). Directions instructed the subjects to imag-ine themselves in relation to each particular goal before makingtheir ratings. Subjects were asked whether, in thinking abouteach goal, they focused on the consequences of failing or suc-ceeding (1 = exclusively on the consequences of failure to 5 =exclusively on the consequences of success). Additionally, sub-jects rated their probability of attaining each goal (0% to 100%).Finally, in an effort to tap positive and negative affect ap-praisals, subjects were asked to indicate on a 5-point scale (1 =not at all to 5 = a great deal) the extent to which they experi-enced particular emotions when considering each of theirgoals. The five positive affects were confident, inspired, eager,energized, and challenged; the five negative affects wereworried, fearful, shaky, anxious, and threatened. Subjects alsowere asked to formulate 1-month subgoals for their 6-monthgoals in each of the four arenas. After formulating these sub-goals, subjects completed the aforementioned additional ap-praisal items pertinent to the appropriate 1-month goal.
To collapse the appraisal data into more succinct units foranalyses, the scores for the variables were first summed acrossthe four life arenas. This yielded success/failure foci for 1- and6-month goals, probabilities of attaining the 1-month and 6-month goals, total positive affect related to the 1- and 6-monthgoals (summed across the five affects), and total negative affectsrelated to the 1- and 6-month goals (summed across the fiveaffects). Hope Scale scores produced the following correlationswith each of these variables: (a) success/failure focus for 1-month goals, r = .35, p < .001; (b) success/failure focus for6-month goals, r = .39, p < .001; (c) probability of attaining the1-month goals, r = .31, p < .001; (d) probability of attaining the6-month goals, r = .38, p < .001; (e) positive affect related to the1 -month goals, r = .41, p < .001; (f) positive affect related to the6-month goals, r = .50, p < .001; (g) negative affect related to the1-month goals, r = -.09, ns; and (h) negative affect related to the6-month goals, r = -.20, p < .05. These correlations suggest thathigher as compared with lower hope people, when thinkingabout their goals, tend to focus on success and perceive thatthey will have a higher probability of attaining their goals. Inaddition, higher hope people appear to appraise their goals inpositive affective terms, and negative affect is not as stronglyrelated to their appraisals. These findings serve to expand uponthe previous Anderson (1988) evidence for higher hope stu-dents' challenge-like set as they undertake specific academicgoals. That is, the present results suggest that higher hope peo-ple appraise their other life goals with a positive cognitive set.'
Summary and General Discussion
Although the hope motive may be rather ambiguous and dif-ficult for the layperson to define, scholars have consistentlyanchored this process in people's perception that goals can be
met. We have built on this premise in the present model bysuggesting that there are two fundamental goal-directed compo-nents to the cognitive set of hope. First, there is the agencycomponent, which involves a sense of successful goal-directeddetermination; second, there is the pathways component,which involves a sense of successful goal-directed planning.Higher levels of hope, therefore, involve greater reciprocallyderived perceptions of agency and pathways as people considergoals. Implicit in our reasoning has been the assumption thathope is not a dichotomous motive in which the person eitherdoes or does not have hope. Rather, our guiding view has beenthat there are individual differences involving degrees of hope;as such we have developed a scale to tap this process. Likewise,we have generated hypotheses about the role that hope, as wehave defined it, should play in the general process of goal-directed behavior.
The studies involving the psychometric characteristics of theHope Scale suggested that it possesses acceptable internal con-sistency and temporal stability. These results support our con-tention that the present model and measure of hope form acohesive structure; moreover, support emerges for the assump-tion that hope is relatively stable across time.
The descriptive data of the Hope Scale demonstrated thatpeople in psychological treatment, in relation to college stu-dents, exhibited a lower (albeit toward the hopeful end of theresponse continuum) level of hope. The somewhat surprisingfinding was that no sex differences in level of reported hopeemerged in any of the samples. Given the effects of traditionalsex roles in America, one may have expected men to producehigher levels of hope. Because the possible explanations for thelack of sex differences are multiple and as yet uninterpretable, adefinitive explanation for this intriguing lack of sex differencesmust await further research. One interesting possibility is thatgender differences in hope may emerge when different goals areexplored in subsequent research.
Factor analyses revealed that the theory-based componentsof agency and pathways were distinguishable. Thus, one prem-ise of the hope model is supported in that there is evidence forthe separation of the agency and pathways components. Further-
1 The reader may recognize that the appraisal data are part of thelarger Anderson (1988) study in which subjects reported number ofmental health symptoms. In this regard, it is possible to perform anomnibus test of the discriminant utility of Hope Scale scores in pre-dicting mental health symptoms beyond all the other self-report indi-vidual-differences variables measured in the study. Using mentalhealth symptoms (taken at the end of this study) as the criterion vari-able in a hierarchical regression and forcing in Hope Scale scores atStep 13 after success/failure focus for 1-month goals, success/failurefocus for 6-month goals, probability of attaining the 1-month goals,probability of attaining the 6-month goals, positive affect related to the1-month goals, positive affect related to the 6-month goals, negativeaffect related to the 1-month goals, negative affect related to the 6-month goals, negative life stress, positive life stress, optimism, andlocus of control, A R2 = .04, p < .01. Thus, Hope Scale scores contrib-uted variance in relation to reported mental health symptoms that wasnot shared by a host of other dispositional individual-differences mea-sures (e.g., Life Orientation Test, Locus of Control) and situationalgoal-related appraisal items taken during the study (e.g., success/failurefoci, affects).

582 SNYDER ET AL.
more, the intercorrelations of the agency and pathways compo-nents indicated that they are indeed related, but not synony-mous. For the present scale-development article, we have notattempted any analyses examining the separate contributions ofthe agency and pathways components to other criterion vari-ables. The only prerequisite that we used for the present seriesof studies was that the content of the agency and pathways itemshad face validity. Thus, the components per se have not beenvalidated in the present studies. This is because of our view thatthese two components are iterative and additive and becausethe underlying basis of the present theory and construct ofhope is to combine agency and pathways. Therefore, our effortshave focused on the combined agency and pathways compo-nents. Future research may unravel differential correlates ofagency and pathways and may yield information pertaining totheir separate construct validity and utility.
The various studies on convergent validity reveal a pattern ofpredicted correlations with concepts that are similar to the theo-rized process of hope. The nomological network of hope sharesvariance with other individual-differences measures that areconceptually related to goal-directed behaviors; as such, there iscorroboration for the convergent validity of the Hope Scale.Furthermore, in accordance with theoretical predictions, thediscriminant validity study indicates that the Hope Scale doesnot share consequential variance with another selected scale.Turning to what we have called discriminant utility, the relevantdata suggest that the relationship of Hope Scale responses tocoping strategies and mental health are not totally explicable interms of positive and negative affectivity, life stress, optimism,generalized outcome expectancies, or locus of control. TheHope Scale thus provides additional predictive power in com-parison to other individual-differences measures of cognitiveand emotional dispositions. Hope, as we have discussed it here,is a dispositional cognitive set; it is therefore important that itcontributes some unique predictive variance in relation to othercognitive- and emotion-based dispositional measures. Thesefindings should not be interpreted, however, as suggesting thatthese other constructs are not useful in predicting and under-standing various coping- and mental health-related responses.Indeed, these previous constructs and their associated individ-ual-differences measures have each provided important andextensive literatures relating individual-differences processesand coping more generally. Given the power of these other con-cepts and the associated measures, however, the present studiesare all the more encouraging in supporting the robustness ofthe Hope Scale.
Before leaving the topic of discriminant validity, some com-ments are warranted about the relationship of hope to achieve-ment and cognitive ability. Higher Hope Scale scores correlated-.10, .17, and .49 with better reported high school perfor-mance. Thus, for these three correlations, higher hope relatedto (a) somewhat lower high school performance (r = -.10), (b)somewhat better high school performance (r = .17), and (c)much better high school performance (r = .49). For college aca-demic achievement, on the other hand, note that the resultsconsistently suggest that the higher in relation to the lower hopepeople did better. Therefore, academic achievement appears tobe related to higher hope. It would be inaccurate, however, toconclude that the Hope Scale taps nothing but academic-
achievement-related variance. Indeed, the present studies showthat Hope Scale scores predicted goal setting and academicachievement beyond projections attributable to previous aca-demic achievement. Recall also that the magnitude of thecorrelation between intelligence scores (the Shipley) and theHope Scale scores for the inpatient sample was negligible. Al-though one must be cautious in drawing conclusions tooquickly on the basis of these scant data, such findings suggestthat hope is something more than one's cognitive/intellectualabilities and record of academic achievement.
The various construct validitional studies of the Hope Scalereveal pictures of higher as compared with lower hope peoplethat are consistent with the underlying model. For example,higher hope relates to more agency- and pathways-related re-sponses in several life arenas; moreover, the agency and path-ways are maintained under circumstances in which the personis stressed. In future research involving laboratory or real-lifestressors, it will be important to examine whether higher hopepeople manifest their agency and pathways behaviors as theyactually encounter the impediments to their goals. Assumingthat such research corroborates our initial findings, there are ahost of interesting developmental studies that should follow tofind out how people learn hopeful responses when encounter-ing circumstances in which their goals are blocked.
Because of their facility and heightened motivation in deal-ing with the goals in their lives, higher in relation to lower hopepeople would be expected to undertake a larger number ofgoals across life arenas and to select tasks that are more diffi-cult. Data from studies addressing hope and goal-directed be-haviors support both of these predictions. In regard to the moredifficult goals that higher hope people select, however, they donot perceive their goals as being more difficult. The presentdata suggest that higher hope people appraise their goals interms of challenges, success potential, and positive emotions.These findings are similar to the differences that Lazarus andLaunier (1978) have described in regard to people who makechallenge versus threat appraisals:
The difference seems to be a matter of positive versus negativetone, that is whether one emphasizes in the appraisal the potentialharm in the transaction [threat], or the difficult-to-attain, possiblyrisky, but positive mastery or gain [challenge] (p. 304).
Beyond the fact that higher hope people appear to set moredifficult goals (by objective but not phenomenological stan-dards) and that they evidence a more positive, challengelike setas they pursue these goals, the present results indicate thathigher hope people are more certain that they will attain theirgoals. However, note that higher and lower hope people in thepresent studies were equally likely to attain their goals. Thislatter conclusion must be placed in the context of the fact thatthe lower hope people attained their lower goals and the higherhope people attained their higher goals. Thus, higher hope isassociated with superior performance. When Lazarus andLaunier (1978) speak of "the difficult-to-attain, possibly risky"aspect of challenge appraisals, therefore, higher hope peoplemay not experience this sense of risk because they tend to re-port being more certain of reaching their goals while workingtoward them, and thereafter they actually appear to achievethose goals. In understanding the cognitive set and emotional

HOPE SCALE 583
sequelae that higher as compared with lower hope people haveas they establish and work on their goals, one senses that thegoals are experienced in a qualitatively more positive fashion byhigher hope people. Indeed, higher hope people appear to em-brace their goals.
Having provided initial evidence for the validity and poten-tial usefulness of the Hope Scale, we would like to close with anextrapolation of the present hope model and scale to variousarenas. Perhaps it is best to start at the most general level. It isour view that the analysis of goal-directed behavior undergirdsan enormous range of human activities. This view is echoed byother writers (see Pervin, 1989, for review). The point here is asimple one. When a careful analysis of almost any sequence ofhuman behavior is performed, it is unusual to find that somesort of goal-directed sequence is not involved. This is in largepart because of the developmental and survival necessity ofdeveloping goals and behaving in accordance with those goals.As such, the Hope Scale may provide a useful instrument forunderstanding how people relate to their goals in several differ-ent life arenas.
As the reader can surmise from many of the criteria variablesused in the present studies, our perspective often has empha-sized coping and mental health responses. With the explosionof interest in health psychology, psychologists and other relatedprofessionals have increasingly explored adaptive human behav-iors. Our view, and one that is shared by other writers (see Eiser& Gentle, 1988), is that health-related matters are easily concep-tualized in terms of people's goals. Accordingly, hope appearsto be a potentially useful construct for exploring health-relatedmatters. For example, we would expect that higher as comparedwith lower hope people are more likely to have a healthy life-style, to avoid life crises, and to cope better with stressors whenthey are encountered. That the Hope Scale evidenced such ro-bust predictive relationships in the present series of studies mayreflect the fact that coping processes and the present conceptu-alization of hope are both closely tied to goal-directed behav-iors (see Snyder, Irving, & Anderson, 1991).
One other specific arena to which the hope theory and theHope Scale may be applied is psychotherapy. Psychotherapyresearchers often have focused on two components: a nonspe-cific treatment factor and a specific treatment factor. Since theclassic meta-analysis of the effectiveness of psychological treat-ment by M. L. Smith and Glass (1977), researchers have at-tempted to examine the relative effectiveness of nonspecificand specific treatments to no-treatment control groups, as wellas to each other (i.e., nonspecific vs. specific treatments; seeBarker, Funk, & Houston, 1988; Landman & Dawes, 1982;Prioleau, Murdock, & Brody, 1983; Shapiro & Shapiro, 1982).The general conclusion of such meta-analyses is that treatmentresults in significantly more positive outcomes in relation tono-treatment control and nonspecific factors groups.
In the aforementioned meta-analyses, as well as other studiesexamining nonspecific factors; a common view is that suchnonspecific factors reflect the clients' generalized positive ex-pectations for improvement through treatment (Frank, 1973;Frank, Hoehn-Saric, Imber, Liberman, & Stone, 1978; Kazdin,1980). In the context of the present hope model, the nonspecificfactors parallel the agency component, and the treatmentgroups parallel the agency and the pathways components com-
bined. That is, the nonspecific factors reflect a generalized ex-pectation of meeting one's goals (improvement in psychother-apy, in this case), and the specific treatment groups reflect peo-ple who have a comparable level of expectation in meeting theirtherapy goals and are delivered a specific treatment strategy tomeet those goals. Results of such meta-analyses (for excellentexample, see Barker et al., 1988) have shown that the nonspe-cific factors (agency) groups exhibit a significantly improvedpsychotherapy outcome in relation to no-treatment controlgroups; moreover, the treatment (agency + pathways) groupsexhibit significant improvement in relation to the nonspecificfactors (agency) groups. Additionally, the magnitude of the im-provement for the treatment group (agency + pathways) in rela-tion to the no-treatment group typically is twice that exhibitedby the nonspecific factors (agency) group.
One implication of such meta-analyses is that the agency andpathways components of the present hope model may be con-ceptualized as mechanisms for understanding how psychother-apy works. The voluminous literature on treatment provides amenu of approaches for building a client's sense of agency andpathways. In this latter regard, the contribution of an individ-ual-differences measure such as the Hope Scale may be multi-ple. Do low-hope people profit by particular interventions thatare aimed at agency and pathways? More generally, what are theinteractions between the disposition^ variable of hope and thesituational variable of treatment? The present model and scalefor measuring hope obviously may open up many more impor-tant questions for which we can find answers. Perhaps this is themost fitting result of our attempt to lift the lid off the Pandorianbox.
References
Anderson, J. R. (1988). The role of hope in appraisal, goal-setting, expec-tancy, and coping. Unpublished doctoral dissertation, University ofKansas, Lawrence.
Bandura, A. (1977). Self-efficacy: Toward a unifying theory of behav-ior change. Psychological Review, 84,191-215.
Bandura, A. (1982). Self-efficacy mechanism in human agency. Ameri-can Psychologist, 37,122-147.
Bandura, A. (1986). Social foundations of thought and action: A socialcognitive theory. Englewood Cliffs, NJ: Prentice-Hall.
Bandura, A. (1989). Human agency in social cognitive theory. Ameri-can Psychologist, 44,1175-1184.
Barker, S. L., Funk, S. C, & Houston, B. K. (1988). Psychological treat-ment versus nonspecific factors: A meta-analysis of conditions thatengender comparable expectations for improvement. Clinical Psy-chology Review, 8, 579-594.
Beck, A. T, Ward, C. H., Mendelsohn, M., Mock, J, & Erbaugh, J.(1961). An inventory for measuring depression. Archives of GeneralPsychiatry, 4, 53-63.
Beck, A. X, Weissman, A., Lester, D., & Trexler, L. (1974). The measure-ment of pessimism: The Hopelessness Scale. Journal of Consultingand Clinical Psychology, 42, 861-865.
Boaz, T. L., & Denney, D. R. (1986). Utility assessment of three modera-tor variables in life stress research. Unpublished manuscript, Univer-sity of Kansas, Department of Psychology, Lawrence.
Burger, J. M., & Cooper, H. M. (1979). The desirability of control.Motivation and Emotion, 3, 381-393.
Cantril, H. (1964). The human design. Journal of Individual Psychol-ogy, 20,129-136.

584 SNYDER ET AL.
Carver, C. S., Scheier, M. E, & Weintrab, J. K. (1989). Assessing copingstrategies: A theoretically based approach. Journal of Personalityand Social Psychology, 56, 267-283.
Clark, L. A., & Watson, D. (1991). General affective dispositions inphysical and psychological health. In C. R. Snyder & D. R. Forsyth(Eds.), Handbook of social and clinical psychology: The health per-spective (pp. 221-245). Elmsford, NY: Pergamon Press.
Costa, P. X, Jr., & McCrae, R. R. (1987). Neuroticism, somatic com-plaints, and disease: Is the bark worse than the bite? Journal of Per-sonality, 55,299-316.
Crowne, D. P., & Marlowe, D. (1960). A new scale of social desirabilityindependent of psychopathology. Journal of Consulting and ClinicalPsychology, 24, 349-354.
Depue, R. A., & Monroe, S. M. (1986). Conceptualization and measure-ment of human disorder in life stress research: The problem ofchronic disturbance. Psychological Bulletin, 99, 36-51.
Derogatis, L. R., Lipman, R. S., & Covi, L. (1973). The SCL-90: Anoutpatient psychiatric rating scale. Psychopharmacology Bulletin, 9,13-28.
Eiser, J. R., & Gentle, P. (1988). Health behavior as goal-directed ac-tion. Journal of Behavioral Medicine, 11, 523-535.
Erickson, R. C, Post, R., & Paige, A. (1975). Hope as a psychiatricvariable. Journal of Clinical Psychology, 31, 324-329.
Farber, M. L. (1968). Theory of suicide. New York: Funk & Wagnall's.Fenigstein, A., Scheier, M. F., & Buss, A. H. (1975). Public and private
self-consciousness: Assessment and theory. Journal of Consultingand Clinical Psychology, 43, 522-527.
Fibel, B., & Hale, W. D. (1978). The Generalized Expectancy for Suc-cess Scale—A new measure. Journal of Consulting and Clinical Psy-chology, 46, 924-931.
Folkman, S., & Lazarus, R. S. (1980). An analysis of coping in a middle-aged community sample. Journal of Health and Social Behavior, 21,219-239.
Folkman, S., & Lazarus, R. S. (1985). If it changes it must be a process:Study of emotion and coping during three stages of college examina-tion. Journal of Personality and Social Psychology, 48,150-170.
Frank, J. D. (1968). The role of hope in psychotherapy. InternationalJournal of Psychiatry, 5, 383-395.
Frank, J. D. (1973). Persuasion and healing (Rev. ed.). Baltimore: JohnsHopkins University Press.
Frank, J. D., Hoehn-Saric, R., Imber, S. D., Liberman, B. L., & Stone,A. R. (1978). Effective ingredients of successful psychotherapy. NewYork: Brunner/Mazel.
Frankl, Y (1963). Man's search for meaning. New \brk: WashingtonSquare Press.
French, T. M. (1952). The integration of behavior: Vol. 1. Basic postulates.Chicago: University of Chicago Press.
Gibb, J. (1990). TheHopeScalerevisited: Further validation of'ameasureof individual differences in the hope motive. Unpublished master'sthesis, University of Illinois at Urbana-Champaign.
Gorsuch, R. L. (1983). Factor analysis. Hillsdale, NJ: Erlbaum.Gottschalk, L. A. (1974). A Hope Scale applicable to verbal samples.
Archives of General Psychiatry, 30, 779-785.Harney, P. (1989). The Hope Scale: Exploration of construct validity and
its influence on health. Unpublished master's thesis, University ofKansas, Lawrence.
Harris, C. B. (1988). Hope: Construct definition and the development ofan individual differences scale. Unpublished doctoral dissertation,University of Kansas, Lawrence.
Hathaway, S. R., & McKinley, J. C. (1951). The MMPI manual. NewYork: Psychological Corporation.
Heppner, P. P., & Petersen, C. H. (1982). The development and implica-tions of a personal problem-solving inventory. Journal of CounselingPsychology, 29, 66-75.
Holleran, S., & Snyder, C. R. (1990). Discriminant andconvergent valida-tion of the Hope Scale. Unpublished manuscript, University of Kan-sas, Lawrence.
Holroyd, K. A., & Coyne, J. (1987). Personality and health in the 1980s:Psychosomatic medicine revisited? Journal of Personality, 55, 359-375.
Irving, L. M., Crenshaw, W, Snyder, C. R., Francis, P, & Gentry, G.(1990, May). Hope and its correlates in a psychiatric inpatient settingPaper presented at the 62nd annual meeting of the Midwestern Psy-chological Association.
Kazdin, A. E. (1980). Research design in clinical psychology. New York:Harper & Row.
Klinger, E. (1975). Consequences of commitment to and disengage-ment from incentives. Psychological Review, 82,1-25.
Kukla, A. (1972). Foundations of an attributional theory of perfor-mance. Psychological Review, 79, 454-470.
Landman, J. T, & Dawes, R. M. (1982). Psychotherapy outcome: Smithand Glass's conclusions stand up under scrutiny. American Psycholo-gist, 37, 504-516.
Langelle, C. (1989). An assessment of hope in a community sample.Unpublished master's thesis, University of Kansas, Lawrence.
Lazarus, R. S., & Folkman, S. (1984). Stress, appraisal, and coping. New\brk: Springer.
Lazarus, R. S., & Launier, R. (1978). Stress-related transactions be-tween person and environment. In L. A. Pervin & M. Lewis (Eds.),Perspectives in interactional psychology (pp. 287-327). New "fork:Plenum Press.
Lee, T. W, Locke, E. A., & Latham, G. P. (1989). Goal setting theory andjob performance. In L. A. Pervin (Ed.), Goal concepts in personalityand social psychology (pp. 291-326). Hillsdale, NJ: Erlbaum.
Lefcourt, H., & Davidson-Katz, K. (1991). Locus of control and health.In C. R. Snyder & D. R. Forsyth (Eds), Handbook of social and clini-cal psychology: The health perspective (pp. 246-266). Elmsford, NY:Pergamon Press.
Lewin, K. (1938). The conceptual representation and measurement ofpsychological forces. Contributions to Psychological Theory, 1,1-36.
Maddux, J. (1991). Self-efficacy. In C. R. Snyder & D. R. Forsyth (Eds),Handbook of social and clinical psychology: The health perspective(pp. 57-78). Elmsford, NY: Pergamon Press.
McCrae, R. R., & Costa, P. T, Jr. (1983). Social desirability scales: Moresubstance than style. Journal of Consulting and Clinical Psychology,51, 882-888.
McCrae, R. R., & Costa, P. T, Jr. (1987). Validation of the five-factormodel of personality across instruments and observers. Journal ofPersonality and Social Psychology, 52, 81-90.
Melges, R., & Bowlby, J. (1969). Types of hopelessness in psychopatho-logical processes. Archives of General Psychiatry, 20, 690-699.
Menninger, K. (1959). The academic lecture on hope. American Jour-nal of Psychiatry, 116, 481-491.
Mowrer, O. H. (1960). The psychology of hope. San Francisco: Jossey-Bass, Inc.
Nunnally, J. C. (1978). Psychometric theory (2nd ed.). New York:McGraw-Hill.
Pearlman, L. A., McCann, L., & Johnson, G. (1990). The McPearl BeliefScale: A new measure of cognitive schemas. Unpublished manuscript,Traumatic Stress Institute, South Windsor, CT.
Pervin, L. A. (Ed.). (1989). Goal concepts in personality and social psy-chology. Hillsdale, NJ: Erlbaum.
Prioleau, L., Murdock, M., & Brody, N. (1983). An analysis of psycho-therapy versus placebo studies. The Behavioral and Brain Sciences, 6,275-310.
Rosenberg, M. (1965). Society and adolescent self-image. Princeton,NJ: Princeton University Press.
Roth, D. L., Harris, R. L., & Snyder, C. R. (1988). An individual differ-

HOPE SCALE 585
ences measure of attributive and repudiative tactics of favorable self-presentation. Journal of Social and Clinical Psychology, 6,159-170.
Roth, D. L, Snyder, C. R., & Pace, L. M. (1986). Dimensions of favor-able self-presentation. Journal of Personality and Social Psychology,51, 867-874.
Roth, S., & Cohen, L. J. (1986). Approach, avoidance, and coping withstress. American Psychologist, 41, 813-819.
Rotter, J. B. (1966). Generalized expectancies for internal versus exter-nal control of reinforcement. Psychological Monographs: Generaland Applied, 80 (1, Whole No. 609).
Rotter, J. B, & Rafferty, J. E. (1950). The manual for the Rotter Incom-plete Sentences Blank. New York: Psychological Corporation.
Schachtel, E. (1959). Metamorphosis. New York: Basic Books.Scheier, M. E, & Carver, C. S. (1985). Optimism, coping, and health:
Assessment and implications of generalized outcome expectancies.Health Psychology, 4, 219-247.
Scheier, M. F, & Carver, C. S. (1987). Dispositional optimism and physi-cal well-being: The influence of generalized outcome expectancies.Journal of Personality, 55,169-210.
Shapiro, D. A., & Shapiro, D. (1982). Meta-analysis of comparativetherapy outcome studies: A replication and refinement. Psychologi-cal Bulletin, 92, 581-604.
Shipley, W. C. (1967). Shipley Institute of Living Scale. Los Angeles:Western Psychological Services.
Sigmon, S. T., & Snyder, C. R. (1990a). The independent contributions ofpositive and negative affect and hope in predicting psychological/)^a///i. Unpublished manuscript, Department of Psychology, Univer-sity of Kansas, Lawrence.
Sigmon, S. T., & Snyder, C. R. (1990b). Positive and negative affect as acounter-explanation for the relationship between hope and copingstrategies. Unpublished manuscript, University of Kansas, Depart-ment of Psychology, Lawrence.
Smith, M. B. (1983). Hope and despair: Keys to the socio-psychody-namics of youth. American Journal of Orthopsychiatry, 53(3), 388-399.
Smith, M. L., & Glass, G. Y (1977). Meta-analysis of psychotherapyoutcome studies. American Psychologist, 32, 752-760.
Smith, T. W, Pope, M. K., Rhodewalt, F., & Poulton, J. L. (1989). Opti-mism, neuroticism, coping, and symptom reports: An alternativeinterpretation of the Life Orientation Test. Journal of Personalityand Social Psychology, 56, 640-648.
Snyder, C. R. (1989). Reality negotiation: From excuses to hope andbeyond. Journal of Social and Clinical Psychology, 8,130-157.
Snyder, C. R., & Higgins, R. L. (1988). Excuses: Their effective role inthe negotiation of reality. Psychological Bulletin, 104, 23-35.
Snyder, C. R., Irving, L. M, & Anderson, J. (1991). Hope and health. InC. R. Snyder & D. R. Forsyth (Eds.), Handbook of social and clinicalpsychology: The health perspective (pp. 285-305). Elmsford, NY:Pergamon Press.
Spielberger, C. D., Gorsuch, R. L., & Luchene, R. E. (1970). The State-Trait Anxiety Inventory. Palo Alto, CA: Consulting PsychologistsPress.
Stotland, E. (1969). The psychology of hope. San Francisco: Jossey-Bass.Taylor, J. A. (1953). A personality scale of manifest anxiety. Journal of
Abnormal and Social Psychology, 48, 285-290.Taylor, S. E., & Brown, J. D. (1988). Illusion and well-being: A social
psychological perspective on mental health. Psychological Bulletin,103,193-210.
Tillich, P. (1965). The right to hope. The University of Chicago Maga-zine, 58,16-22.
Veit, C. Y, & Ware, J. E. (1983). The structure of psychological distressand well-being in general populations. Journal of Consulting andClinical Psychology, 51, 730-742.
Wadsworth, M., & Ford, D. H. (1983). Assessment of personal goalshierarchies. Journal of Counseling Psychology, 30, 514-526.
Watson, D., & Clark, L. A. (1984). Negative affectivity: The dispositionto experience aversive emotional states. Psychological Bulletin, 96,465-490.
Watson, D., Clark, L. A., & Tellegen, A. (1988). Development and vali-dation of brief measures of positive and negative affect: The PANASscales. Journal of Personality and Social Psychology, 54,1063-1070.
Watson, D, & Pennebaker, J. W (1989). Health complaints, stress, anddistress: Exploring the central role of negative affectivity. Psychologi-cal Review, 96, 233-253.
Watson, D., & Tellegen, A. (1985). Toward a consensual structure ofmood. Psychological Bulletin, 98, 219-235.
Yoshinobu, L. R. (1989). Construct validation of the Hope Scale: Agencyand pathways components. Unpublished master's thesis, Universityof Kansas, Lawrence.
Zachary, R. A. (1986). Shipley Institute of Living Scale Revised. LosAngeles: Western Psychological Services.
Appendix
The Hope Scale
Directions: Read each item carefully. Using the scale shown below,please select the number that best describes YOU and put that numberin the blank provided.1 = Definitely False 2 = Mostly False 3 = Mostly True
4 = Definitely True1. I can think of many ways to get out of a jam. (Pathways)2. I energetically pursue my goals. (Agency)3. I feel tired most of the time. (Filler)4. There are lots of ways around any problem. (Pathways)5. I am easily downed in an argument. (Filler)6. I can think of many ways to get the things in life that are
most important to me. (Pathways)
7. I worry about my health. (Filler). 8. Even when others get discouraged, I know I can find a way
to solve the problem. (Pathways). 9. My past experiences have prepared me well for my future.
(Agency)10. I've been pretty successful in life. (Agency)
.11.1 usually find myself worrying about something. (Filler)
. 12. I meet the goals that I set for myself. (Agency)
Received October 5, 1989Revision received June 5, 1990Accepted September 12, 1990 •