the widening academic achievement gap between the rich and
TRANSCRIPT

The Widening Academic Achievement Gap Between the Rich and the Poor:
New Evidence and Possible Explanations
Sean F. Reardon
Stanford University
July 2011
Forthcoming in
Whither Opportunity? Rising Inequality, Schools, and Children’s Life Chances
(Russell Sage Foundation, 2011)
I appreciate the thoughtful feedback and comments from Richard Murnane, Greg Duncan, Sandy Jencks, and participants in seminars at the Brookings Institution, Stanford University, University of Virginia, Teachers College (Columbia University), New York University, Northwestern University, University of Chicago, Harvard University, Georgetown University, and Johns Hopkins University. This work would not have been possible without support from the Brookings Institution, the Russell Sage Foundation, and the Spencer Foundation, as well as excellent research assistance from Demetra Kalogrides, Anna Katyn Chmielewski, Elena Grewal, and Matt Kasman. Any errors are my own.

1
The Widening Academic Achievement Gap Between the Rich and the Poor:
New Evidence and Possible Explanations
Abstract
In this chapter I examine whether and how the relationship between family socioeconomic
characteristics and academic achievement has changed during the last fifty years. In particular, I
investigate the extent to which the rising income inequality of the last four decades has been
paralleled by a similar increase in the income achievement gradient. As the income gap between
high- and low-income families has widened, has the achievement gap between children in high- and
low-income families also widened?
The answer, in brief, is yes. The achievement gap between children from high- and low-
income families is roughly 30 to 40 percent larger among children born in 2001 than among those
born twenty-five years earlier. In fact, it appears that the income achievement gap has been
growing for at least fifty years, though the data are less certain for cohorts of children born before
1970. In this chapter, I describe and discuss these trends in some detail. In addition to the key
finding that the income achievement gap appears to have widened substantially, there are a
number of other important findings.
First, the income achievement gap (defined here as the average achievement difference
between a child from a family at the 90th percentile of the family income distribution and a child
from a family at the 10th percentile) is now nearly twice as large as the black-white achievement
gap. Fifty years ago, in contrast, the black-white gap was one and a half to two times as large as the
income gap. Second, as Greg Duncan and Katherine Magnuson note in chapter 3 of this volume, the
income achievement gap is large when children enter kindergarten and does not appear to grow (or
narrow) appreciably as children progress through school. Third, although rising income inequality
may play a role in the growing income achievement gap, it does not appear to be the dominant

2
factor. The gap appears to have grown at least partly because of an increase in the association
between family income and children’s academic achievement for families above the median income
level: a given difference in family incomes now corresponds to a 30 to 60 percent larger difference
in achievement than it did for children born in the 1970s. Moreover, evidence from other studies
suggests that this may be in part a result of increasing parental investment in children’s cognitive
development. Finally, the growing income achievement gap does not appear to be a result of a
growing achievement gap between children with highly and less-educated parents. Indeed, the
relationship between parental education and children’s achievement has remained relatively stable
during the last fifty years, whereas the relationship between income and achievement has grown
sharply. Family income is now nearly as strong as parental education in predicting children’s
achievement.
3
Introduction
The socioeconomic status of a child’s parents has always been one of the strongest
predictors of the child’s academic achievement and educational attainment. As Greg Duncan and
Katherine Magnuson point out in chapter 3 in this volume, students in the bottom quintile of family
socioeconomic status score more than a standard deviation below those in the top quintile on
standardized tests of math and reading when they enter kindergarten. They note that these
differences do not appear to narrow as children progress through school.
Duncan and Magnuson are not the first to point out this strong association. Almost fifty
years ago, in 1966, the Coleman Report famously highlighted the relationship between family
socioeconomic status and student achievement (Coleman et al. 1966). The federal Head Start
program was started in the 1960s as part of the War on Poverty to reduce poverty and thus to
weaken the link between family poverty and children’s cognitive and social development (Kagan
2002; Zigler and Muenchow 1992). The relationship between family socioeconomic characteristics
and student achievement is one of the most robust patterns in educational scholarship, yet the
causes and mechanisms of this relationship have been the subject of considerable disagreement
and debate (see, for example, Bowles and Gintis 1976, 2002; Brooks-Gunn and Duncan 1997;
Duncan and Brooks-Gunn 1997; Duncan, Brooks Gunn, and Klebanov 1994; Herrnstein and Murray
1994; Jacoby and Glauberman 1995; Lareau 1989, 2003).
An ironic consequence of the regularity of this pattern is that we tend to think of the
relationship between socioeconomic status and children’s academic achievement as a sociological
necessity, rather than as the product of a set of social conditions, policy choices, and educational
practices. As a result, much of the scholarly research on the socioeconomic achievement gradient
has focused largely on trying to understand the mechanisms through which socioeconomic
differences among families—in income, parental educational attainment, family structure,
neighborhood conditions, school quality, and parental preferences, investments, and choices— lead

4
to differences in children’s academic and educational success. The bulk of this prior research has
been based primarily on cross-sectional or single-cohort longitudinal studies. This research is less
concerned with documenting the size of socioeconomic achievement gradients than with
investigating the mechanisms that produce them.
As a result, we know little about the trends in socioeconomic achievement gaps over a
lengthy period of time. We do not know, for example, if socioeconomic gaps are larger or smaller
now than they were fifty years ago, or even twenty-five years ago. This is in contrast to what we
know about the trends in racial-achievement gaps, particularly the black-white gap, which have
received considerable scholarly and policy attention in the last decade or two (see, for example,
Jencks and Phillips 1998; Magnuson and Waldfogel 2008). Trends in socioeconomic achievement
gaps—the achievement disparities between children from high- and low-income families or
between children from families with high or low levels of parental educational attainment—have
received far less attention.
The question posed in this chapter is whether and how that relationship between family
socioeconomic characteristics and academic achievement has changed during the last fifty years.
In particular, I investigate the extent to which the rising income inequality of the last four decades
has been paralleled by a similar increase in the income achievement gradient. As the income gap
between high- and low-income families has widened, has the achievement gap between children in
high- and low-income families also widened?
The answer, in brief, is yes. The achievement gap between children from high- and low-
income families is roughly 30 to 40 percent larger among children born in 2001 than among those
born twenty-five years earlier. In fact, it appears that the income achievement gap has been
growing steadily for at least fifty years, though the data are less certain for cohorts of children born
before 1970. In this chapter I describe and discuss these trends in some detail. In addition to the
key finding that the income achievement gap appears to have widened substantially, there are a

5
number of other important findings.
First, the income achievement gap (defined here as the income difference between a child
from a family at the 90th percentile of the family income distribution and a child from a family at
the 10th percentile) is now more than twice as large as the black-white achievement gap. In
contrast to this, fifty years ago the black-white gap was one and a half to two times as large as the
income gap. Second, as Duncan and Magnuson (in chapter 3, this volume) note, the income
achievement gap is large when children enter kindergarten and does not appear to grow (or
narrow) appreciably as children progress through school. Third, although rising income inequality
may play a role in the growing income achievement gap, it does not appear to be the dominant
factor. The gap appears to have grown at least partly because of an increase in the association
between family income and children’s academic achievement for families above the median income
level: a given difference in family incomes now corresponds to a 30 to 60 percent larger difference
in achievement than it did for children born in the 1970s. Evidence from other studies suggests that
this may be in part a result of increasing parental investment in children’s cognitive development.
Finally, the growing income achievement gap does not appear to be a result of a growing
achievement gap between children with highly educated and less-educated parents. In fact, the
relationship between parental education and children’s achievement has remained relatively stable
during the last fifty years, while the relationship between income and achievement has grown
sharply. Family income is now nearly as strong as parental education in predicting children’s
achievement.
Data
Assembling information on trends in the relationship between socioeconomic status and academic
achievement requires examination of multiple sources of data. In this chapter I use data
from nineteen nationally representative studies, including studies conducted by the National

6
Center for Education Statistics (NCES), the Long-Term Trend and Main National Assessment of
Educational Progress (NAEP) studies, U.S. components of international studies, and other studies
with information on both family background and standardized-test scores.1 Although these studies
vary in a number of ways, each of them provides data on the math or reading skills, or both, of
nationally representative samples of students, together with some data on students’ family
socioeconomic characteristics, such as family income, parental education, and parental occupation.
Although the specific tests of reading and math skills used differ among the studies, they are similar
enough to allow broad conclusions about the rough magnitude of achievement gaps. Online
appendix table 5.A1 (available at: http://www.russellsage.org/duncan_murnane_
online_appendix.pdf ) lists the studies used here and several basic characteristics of each study,
including the age and grade of students when tested, the year and subject in which they are tested,
the approximate sample size, and whether or not the study includes data on family income.
Measuring Achievement Gaps
To compare the size of the achievement gap across studies, I report test-score differences between
groups (for example, students from high- and low-income families) in standard-deviation units,
adjusted for the estimated reliability of each test. This is standard practice when comparing
achievement gaps measured with different tests (see, for example, Clotfelter, Ladd, and Vigdor
2006; Fryer and Levitt 2004, 2006; Grissmer, Flanagan, and Williamson 1998; Hedges and
Nowell 1999; Neal 2006; Phillips et al. 1998; Reardon and Galindo 2009). So long as the true
variance of achievement remains constant over time, this allows valid comparisons in the size of the
gaps across different studies using different tests (see online appendix section 5.A2 for technical
details of the computation of the achievement gaps reported here and for data on the reported
reliabilities of the tests used).
7
Measures of Socioeconomic Status
In this chapter I rely on two key measures of socioeconomic status: family income and parental
educational attainment. Each of the nineteen studies used includes information on parental
educational attainment; twelve of the studies include information on family income. Nine of the
studies include parent-reported family income: National Education Longitudinal Study (NELS),
Education Longitudinal Study (ELS), Early Childhood Longitudinal Study, Kindergarten Cohort
(ECLS-K), Early Childhood Longitudinal Study, Birth Cohort (ECLS-B), the 1979 and 1997 National
Longitudinal Survey of Youth (NLSY79, NLSY97), National Longitudinal Study of Adolescent
Health (Add Health), Prospects, and the Study of Early Child Care and Youth Development
(SECCYD). Three include student-reported income: Project Talent, National Longitudinal Study
(NLS), and High School and Beyond (HS&B).2 In all studies, I adjust the estimated associations
between family income and achievement for measurement error in family income. I do not adjust
income for family size, as my interest here is in describing the simple association between family
socioeconomic characteristics and student achievement, rather than an inferred association
between income-to-needs ratio and achievement (though the latter is certainly worth investigating
as well). Online appendix section 5.A2 describes in detail how I estimate income achievement
gaps and adjust them for measurement error in family income and test scores.
Although each of the nineteen studies includes a measure of parental educational
attainment, in some studies this is reported by students—National Assessment of Educational
Progress, Long- Term Trends (NAEP-LTT), Main NAEP, Project Talent, NLS, Equality of Educational
Opportunity study (EEO), HS&B, Trends in International Math and Science Study (TIMSS), Program
for International Student Assessment (PISA), and the Progress in International Reading Literacy
Study (PIRLS)—while in others it is reported by parents. Because reports of their parents’
education are particularly unreliable for younger students, I include studies with student-reported
parental education only if the students were in high school themselves when reporting their

8
parents’ educational attainment. As a measure of parental educational attainment, I use the
maximum of the mother’s and father’s attainment (or the attainment of the single parent in the
home if both are not present). Online appendix section 5.A2 describes how I estimate the
association between parental education and achievement.
Trends in Socioeconomic Status–Achievement Gradients
To begin with, consider the difference in achievement between children from high- and low-
income families. One way to measure this difference is to compare the average math and reading
skills of children from families with incomes at the 90th percentile of the family income distribution
(about $160,000 in 2008) to those in families with incomes at the 10th percentile of the family
income distribution (about $17,500 in 2008).3 Hereafter I refer to this as the “90/10 income
achievement gap.”
Figures 5.1 and 5.2 present the estimated 90/10 income achievement gap for cohorts of
students born from the mid-1940s through 2001.4 These estimates are derived from the twelve
nationally representative studies available that include family income as well as reading and/or
math scores for school-age children.
Figures 5.1 & 5.2 here
Although the tests used are not exactly comparable across all the studies included, both
figures show a clear trend of increasing income achievement gaps across cohorts born over a nearly
sixty-year period. The estimated income achievement gaps among children born in 2001 are
roughly 75 percent larger than the estimated gaps among children born in the early 1940s. The gap
appears to have grown among cohorts born in the 1940s and early 1950s, stabilized for cohorts
born from the 1950s through the mid-1970s, and then grown steadily since the mid-1970s.
There are, however, several reasons to suspect that the trend in the estimated gaps for the
earliest cohorts, those born before 1970, is not as accurately estimated as the later trend. For one

9
thing, the quality of the achievement tests used in the early studies may not have been as good as
those used in the more recent studies. In addition, as I have noted, family income was reported by
students rather than by a parent in three of the early studies (Project Talent, NLS, and HS&B).
Furthermore, because Project Talent, NLS, and HS&B are school-based samples of students in high
school, they exclude dropouts, who are disproportionately low-income and low-achieving students.
Each of these factors might lead the gaps to be underestimated in the early cohorts relative to later
cohorts.
Despite each of these concerns, there is also some evidence to suggest that they may not
substantially bias the estimated trend in income achievement gaps. First, the estimated gaps are
adjusted for the estimated reliabilities of the achievement test and the family income measures.
Second, an assessment of the impact of excluding dropouts using data from the NELS, in which
dropouts were tested, shows that excluding dropouts from the sample introduces at most a trivial
amount of bias in the estimates (see online appendix section 5.A4). Third, if we focus only on the
trend in the income gap in studies conducted by the National Center for Education Statistic (NCES),
which use similar types of achievement tests (and many of the same test items), and ask parents to
report their income in a similar way (except for NLS and HS&B, in which students reported their
family income), the trend in the 90/10 achievement gap is clearly upward for cohorts born from the
mid-1970s through at least the mid-1990s (see online appendix section 5.A4 and appendix table
5.A1 for details). And although the two NLSY studies suggest that the income achievement gap as
measured in the NLSY97 cohort is virtually identical to the gap in the NLSY79 cohort, born twenty
years earlier, the NLSY97 cohort was born in the early 1980s, just as the trend evident in the NCES
studies appears to begin. Thus, the lack of an apparent trend in the income achievement gap in the
NLSY studies does not clearly contradict the evidence in the NCES studies of a rising gap among the
1980s and 1990s cohorts.
In sum, although the trend in achievement gaps prior to 1970 is somewhat unclear, the

10
trend from the mid-1970s to 2001 appears relatively clear. Figures 5.1 and 5.2 include fitted trend
lines from 1974 to 2001 (the solid lines); these indicate that the income achievement gap has
grown by roughly 40 to 50 percent within twenty-five years, a very sizable increase.
One important question is whether the trend in the income achievement gap is driven by
the changing racial and ethnic composition of the U.S. population. In additional analyses not shown
here (see online appendix 5.A4), I find that the income achievement gap grew within the white,
black, and Hispanic student populations separately, as well as within the population as a whole. For
whites and Hispanics, the income achievement gap appears relatively stable through the mid-1970s
and begins to grow rapidly thereafter; for blacks, the gap appears to grow steadily from the 1940s
through 2001.
In chapter 6 in this volume, Martha J. Bailey and Susan M. Dynarski show that the
association between family income and college completion grew very sharply between cohorts of
women born in the 1960s and cohorts born in the early 1980s, but did not grow substantially
among men in the same cohorts. One possible explanation for this pattern is that the association
between income and achievement grew most sharply for women during this same time period.
However, when I examine the income achievement gap trend separately for male and female
students, I find virtually identical trends (see online appendix 5.A4). There is no evidence that the
trend in the income achievement gradient varies by gender.
How Large Are These Gaps?
Figures 5.1 and 5.2 report income gaps in standard-deviation units. Although this is a metric
familiar to researchers and one that is useful for comparing the size of gaps across studies using
different tests, it may not be immediately obvious how large these gaps are in substantive terms.
One way to get a sense of the size of the gaps is to compare them to the amount that an average
student learns during the course of a year. Data from the NAEP indicate that the average student

11
gains 1.2 to 1.5 standard deviations in math and reading between fourth and eighth grade and
between 0.6 and 0.7 standard deviations in math and reading between eighth and twelfth grade.5
Thus, a gap of 1 standard deviation is substantively very large, corresponding to roughly 3 to 6
years of learning in middle or high school.
Another way of getting a sense of how large these gaps are (and how meaningful their trend
is) is to compare the income achievement gaps to contemporaneous black-white achievement gaps.
The black-white achievement gap narrowed substantially among cohorts born from the mid-1950s
through the mid-1970s—by roughly one-half a standard deviation—according to NAEP data
(Grissmer et al. 1998; Hedges and Nowell 1998, 1999; Magnuson and Waldfogel 2008; Neal
2006). Other data show that black-white differences in IQ and adult vocabulary narrowed by a
comparable amount over the same cohorts as well (Huang and Hauser 2001; Murray 2007).
Figures 5.3 and 5.4 display both the 90/10 income gaps (as shown in figures 5.1 and 5.2)
and the black-white achievement gaps as estimated from the same samples.6 In each figure the
solid line indicates the fitted trend of the 90/10 income achievement gap. For comparison, the
estimated black-white achievement gap from each study is displayed in the figure (the hollow
circles), along with a fitted line (the dark dashed line) describing the trend in the black-white
achievement gap during the same time period. For comparison, a third trend line is included in the
figure—the estimated trend in black-white gaps as estimated from NAEP data. Because the NAEP-
LTT tests are consistent over time (and the Main NAEP tests are relatively consistent over time),
trends in the black-white gap estimated from NAEP data provide a more reliable trend than do the
twelve studies that are used to estimate the income-gap trend.
Figures 5.3 & 5.4 here
Both the NAEP data and the data from the twelve studies with income data show that the
black-white gap narrowed in reading and math for cohorts born prior to the mid-1970s. Following
the mid-1970s, the reading gap, as measured by NAEP, has remained relatively constant (see online

12
appendix section 5.A5 for some discussion of why the reading gap in the twelve income studies
appears to decline more in recent years than indicated by NAEP data). In math, both the NAEP data
and the data from the studies used to estimate the income gaps show a continued decline in black-
white achievement gaps among cohorts born in more recent years. The similarity of the black-white
trends estimated from NAEP and from the twelve studies used in the income-gap analysis suggests
that the tests used in the income studies are comparable to the NAEP tests, a finding that lends
increased credence to the estimated income-gap trends.
The striking feature of figures 5.3 and 5.4, however, is not so much the well-known trends in
the black-white gaps but the difference between the trends in the income gaps and the black-white
gaps. For cohorts born in the 1940s to the 1960s, the black-white achievement gap was
substantially larger than the 90/10 income achievement gap, particularly in reading. For cohorts
born in the 1970s and later, however, the opposite is true. Among children born in the last two
decades (those cohorts currently in school), the 90/10 income gap at kindergarten entry was two to
three times larger than the black-white gap at the same time.
The Development of Income achievement Gaps as Students Age
Figures 5.1 to 5.4 display the magnitude of the income achievement gaps in relation to the year
students were born. The early studies focused largely on high school–age students (for example,
Talent, NLS, HS&B, and NLSY79 are all high school samples). However, many of the later studies
include younger students (ECLS-K, ECLS-B, SECCYD, and Prospects). As a result, it is possible that
the trends displayed in figures 5.1 and 5.2 confound trends across cohorts with developmental
changes as children age.
Figure 5.5 uses data from the eight cohorts of students (from six of the twelve studies) for
whom longitudinal data are available to examine the extent to which the income achievement gaps
change over time within individual cohorts. With the exception of the Prospects third-grade cohort,

13
none of the samples shows evidence of a narrowing of the income achievement gap as children age.
In fact, the income achievement gradient is remarkably stable across age within study samples.
Figure 5.5 provides no evidence to support the hypothesis that the trends evident in figures 5.1 and
5.2 are artifacts of the inclusion of younger students in the more recent studies (this is tested more
formally in online appendix section 5.A4; again there is no evidence that the varying age of the
samples confounds the estimated trends).
Figure 5.5 here
The cohort trend in the size of the gap can be seen in the six studies with students ages
fourteen to eighteen. Among these studies, the gaps are smallest in the early studies (HS&B, a
cohort born in 1964; NELS, a cohort born in 1974) and largest in the studies from later cohorts
(ELS, a cohort born in 1986; SECCYD, a cohort born in 1990; and ECLS-K, a cohort born in 1992).7
Why Has the Income Achievement Gap Grown?
The evidence thus far indicates that the relationship between a family’s position in the income
distribution and their children’s academic achievement has grown substantially stronger during the
last half-century. In the following section I discuss four broad possible explanations for this
increase: (1) income inequality has grown during the last forty years, meaning that the income
difference between families at the 90th and 10th percentiles of the income distribution has grown;
(2) family investment patterns have changed differentially during the last half-century, so that high-
income families now invest relatively more time and resources in their children’s cognitive
development than do lower-income families; (3) income has grown more strongly correlated with
other socioeconomic characteristics of families, meaning that high-income families increasingly
have greater socioeconomic and social resources that may benefit their children; and (4) increasing
income segregation has led to greater differentiation in school quality and schooling opportunities
between the rich and the poor.

14
Rising Income Inequality
After decades of decline, income inequality in the United States has grown substantially in the last
four decades and as of 2007 was at a level similar to the levels in 1925 to 1940, when U.S. income
inequality was at its twentieth-century peak (Burkhauser et al. 2009; Piketty and Saez 2003,
2008).8 Rising income inequality may affect income achievement gaps, though I am aware of no
existing research investigating this using U.S. data (one study looking at the relationship between
income inequality and educational attainment gaps in the United States is Mayer 2001). Existing
cross-national studies show little or no relationship between national income inequality and
socioeconomic achievement gaps, though this research typically is based on samples with little
variance in income inequality and weak measures of family socioeconomic status (Dupriez and
Dumay 2006; Dura-Bellat and Suchaut 2005; Marks 2005).
Figure 5.6 here
If rising income inequality is responsible for the growth in the income achievement gap, we
would expect to see that gap grow in a pattern similar to the growth in income inequality. To
investigate this, consider the trends in measures of family income inequality illustrated in figure
5.6, which shows the changes in the 90/10 family income ratio (the ratio of the family income of the
child at the 90th percentile of the family income distribution to that of the child at the 10th
percentile), the 90/50 family income ratio, and the 50/10 family income ratio among school-age
children from 1967 to 2008.9
Several key trends are evident in figure 5.6. First, the 90/10 family income ratio grew
rapidly from 1967 to the early 1990s, more than doubling in twenty-five years. In 1967, the family
income of the child at the 90th percentile of the family income distribution was 4.6 times greater
than that of the child at the 10th percentile; in 1993 this 90/10 ratio was 9.9. After 1993, the 90/10
ratio declined to 8.6 in 2000 before climbing again to 9.9 by 2005. Second, the growth in the ratio of

15
the incomes in the 90th to those in the 10th percentiles from 1967 to 1993 was driven largely by a
rapid increase in the 50/10 family income ratio, which grew from 2.5 in 1967 to 4.1 in 1987, a 64
percent increase in twenty years. After the late 1980s, however, the 50/10 family income ratio
leveled off and then declined to 3.6 by 2002. Third, the ratio between the 90th and the 50th family
income percentiles grew steadily from the early 1970s through 2008, increasing from 1.8 in 1974
to 2.5 in 2005, an increase of 36 percent. Thus, from the late 1960s through the late 1980s, the
increase in lower-tail family income inequality was largely responsible for the increase in the ratio
between the incomes of the 90th and 10th percentiles. After the late 1980s, however, increasing
upper-tail inequality and decreasing lower-tail inequality largely offset one another for the next
twenty years.
If the increasing income achievement gap is driven by increasing income inequality, we
would expect that gap to grow most sharply between students at the 50th and 10th percentiles of
the family income distribution from the 1960s through the 1980s (or for cohorts born in these
years), and then to grow among those at the high end of the income distribution after that.
Moreover, because the 50/10 ratio is larger than the 90/50 ratio, we might expect the 50/10
income achievement gap to be larger than the 90/50 income achievement gap as well.10 Figures 5.7
and 5.8 display the estimated 90/50 and 50/10 income achievement gaps for each of the studies
with income data.
Figures 5.7 & 5.8 here
Figures 5.7 and 5.8 do not exactly conform to what we would expect if the growing income
achievement gap were simply due to rising income inequality among families with school-age
children. Although the 50/10 income achievement gap in reading is generally larger than the
90/50 income achievement gap for cohorts born before 1990, the gaps are roughly similar in size in
math, and the 90/50 gap is actually equal or larger than the 50/10 gap in the most recent cohorts.
Moreover, the 90/50 gap appears to have grown faster than the 50/10 gap during the 1970s and

16
1980s, the opposite of what we would predict on the basis of the rates of growth of the 90/50 and
50/10 income ratios (indeed, the 50/10 gap in reading appears to have been basically flat through
this time period, when the 50/10 income ratio was growing most rapidly). In sum, figures 5.7 and
5.8 do not provide much support for the idea that the growing income achievement gap is
attributable to rising income inequality, at least not in any simple sense. Nor, however, do they rule
out the possibility that rising income inequality has contributed to the rising income achievement
gap.
One complexity in investigating the relationship between income inequality and income
achievement gaps is that it is unclear how the relationships among income, achievement, and
income inequality unfold through childhood and adolescence. Moreover, few of the studies I
use have information on family income throughout a child’s life, so I cannot disentangle the
associations among family income and income inequality during childhood, family income and
income inequality at the age when a child is tested, and a student’s test scores. Rather, the trends
described here are best understood as a set of repeated cross-sectional snapshots of the association
between a child’s current family income and his or her current academic achievement. Certainly, a
more thorough understanding of the relationship between family income during different phases of
childhood and later achievement would add to our understanding of the trends evident above, but
the data available do not permit such an analysis.
In addition, the analyses presented here show the association between a child’s family
income rank (as opposed to income measured in dollars) and his or her academic achievement.
Given that income inequality has risen for the last thirty to forty years, a given difference in income
ranks corresponds to a much larger difference in actual income (whether measured in dollars or
logged dollars), as is evident in figure 5.6. Thus, if achievement were a constant function of dollars,
we would expect a growing 90/10 income achievement gap even if the association between income
(measured in dollars or logged dollars) remained constant. In online appendix sections 5.A6 and

17
5.A7, I describe a set of analyses designed to determine to what extent the growth of the income
achievement gap is due to rising income inequality and to what extent it is due to the increasing
association between income and achievement. That is, I investigate whether the children of the rich
score higher than the children of the poor because the income difference between the rich and poor
is so much larger than it used to be, or because the relationship between achievement and dollars of
income has grown stronger. Does a dollar buy more achievement than it did before, or do the rich
just have more dollars than they did before?
These analyses, although not conclusive, suggest that the growth of the income achievement
gap is not explained solely by rising income inequality. Rather, the association if achievement with
family income (in logged dollars) has grown stronger over time, particularly among families in the
upper half of the income distribution. That is, the average difference in academic achievement
between two children from above-median income families whose family incomes differ by a factor
of 2 has grown substantially (by 30 to 60 percent) over the last several decades. Moreover, in
regression models that estimate the trend in the 90/10 income achievement gap, the time trend
remains roughly constant in size, albeit with a larger standard error, regardless of whether or how I
control for income inequality. Together, these analyses suggest that it is not rising income
inequality per se that has caused the income achievement gap; rather, a dollar of income (or factors
correlated with income) appears to buy more academic achievement than it did several decades
ago.
Differential Investments in Children’s Cognitive Development
The evidence showing that the returns to income have grown, at least among higher-income
families, suggests that families may be changing how they invest in their children’s cognitive
development. If so, this may explain some of the rising income achievement gap. Sociologists and
historians of the family have argued that parents, particularly those in the middle class, have
18
become increasingly focused on children’s cognitive development during the last fifty years
(Lareau 1989; Schaub 2010; Wrigley 1989). Evidence for this shift is necessarily indirect, yet it is
fairly compelling. Julia Wrigley (1989), for example, examined the types of parenting advice
contained in 1,017 articles published in popular magazines between 1900 and 1985 to assess
whether societal notions of childhood and the role of parents had changed during the twentieth
century. She found that articles published in the early part of the century were largely written by
medical doctors and focused overwhelmingly on medical and nutritional advice. Prior to
1930, fewer than one in six of the articles Wrigley addressed the issue of intellectual stimulation of
babies, and many of these argued that intellectual stimulation was actually harmful. Children were
seen in these articles as largely “vegetative” beings, and the primary role of parents was to keep
them healthy and quiet. Wrigley found that a focus on the intellectual development of children
became much more prominent beginning in 1960s. Almost half of all parenting articles published in
popular magazines between 1960 and 1985 discuss the intellectual development of children, more
than double the proportion in the 1950s. Although some of this shift was driven by the era’s
interest in social inequality and the need for compensatory preschool education for poor children,
Wrigley argues that children’s cognitive development quickly became a concern of middle-class
parents as well, as these parents increasingly saw education as essential for later economic success.
Another factor that may contribute to parents’ increasing focus on their children’s cognitive
development is the rise of test-based accountability systems in education. Although some forms of
standardized testing, including IQ tests and the SAT, have been prevalent for much of the twentieth
century (Lemann 1999), standardized achievement testing has become much more common with
the rise of the accountability movement following the 1983 publication of A Nation at Risk (National
Commission on Excellence in Education 1983). The combination of the increasing importance of
educational success in determining earnings (Levy and Murnane 1992) and the increasing
importance of test scores in defining educational success may have caused parents to focus more on
19
their children’s cognitive development.
Although both middle-class and low-income parents may have become increasingly aware
of the intellectual development of their children, Annette Lareau (1989, 2003) argues that middle-
and upper-class parents engage much more commonly in what she calls “concerted cultivation”—
the deliberate organization of childhood around intellectual and socioemotional development. If
this concerted cultivation is effective at improving children’s intellectual skills— at least, those
measured by standardized tests—then this may contribute to the rising income achievement gap.
If middle- and upper-income families are increasingly likely to invest in their children’s cognitive
development, we would expect to see evidence of this in the trends in parental investment in
children’s child care, education, and education-related activities. There is, however, little available
evidence with which to test this hypothesis. Studies of parental time use show that highly educated
and higher-income parents spend more time in child-care activities with their children than do less-
educated and lower-income children (Guryan, Hurst, and Kearney 2008; Ramey and Ramey 2010).
Moreover, the amount of time parents spend in child-care activities (broadly defined) has increased
from 1965 to 2008 and has increased more for college-educated parents than for less-educated
parents (Bianchi 2000; Ramey and Ramey 2010). In addition, in a recent paper using data from the
Consumer Expenditure Survey, Sabino Kornrich and Frank Furstenburg (2010) find that families’
spending on children increased substantially from 1972 to 2007, particularly among high-income
and college-educated families. Spending increases were particularly sharp among families with
preschool-age children. Consistent with this is evidence that the relationship between family
income and preschool enrollment among three- and four-year-old children grew from the late
1960s to the late 1980s (Bainbridge et al. 2005). These patterns are broadly consistent with the
hypothesis that the rising income achievement gap is at least partly driven by the increasing
investment of upper-income families in their children’s cognitive development, particularly during
the preschool years, though the evidence is far from conclusive on this point.

20
Changes in the Relationships among Family Income, Family Socioeconomic Characteristics, and
Children’s Achievement
Another possible explanation for the rising income achievement gap is that high-income families
not only have more income than low-income families but also have access to a range of other family
and social resources. On average, families with higher incomes tend to be those in which the
parent(s) are highly educated. This has long been true, though the link between parental
educational attainment and family income has grown stronger in recent decades, as the wage
returns to educational attainment have increased since 1979 (Levy and Murnane 1992). Because
highly educated parents are more able and more likely than less-educated parents to provide
resources and opportunities for their children to develop cognitive and academic skills in both the
preschool years and the school-age years (Lareau 1989), children of parents with college degrees
may have higher academic achievement, on average, than children of parents with lower levels of
education, all else being equal. Thus, the income achievement gap may be partly a result of the
effects of parental educational attainment.
This argument suggests two possible explanations for the rising income achievement gap.
First, the trend may result from an increase in the correlation between parental educational
attainment and family income—which would mean that high- and low-income families are
increasingly differentiated by education levels, leading to larger differences in children’s
achievement. Second, the trend may derive from an increase in the achievement returns to parental
education, net of income. This would mean that children of highly educated parents benefit more
from their parents’ educational attainment than they did in the past.
The trend in the correlation between family income and parental education is illustrated in
figure 5.9, which shows a relatively unambiguous trend of increasing correlation between parental
education and family income across cohorts.11 There are several possible explanations for this
trend. First, as Frank Levy and Richard Murnane (1992) point out, changes in the structure of the

21
economy and the composition of the labor force during the 1970s and 1980s, along with declines in
the real minimum wage and the weakening of unions, resulted in a decline in the real wages of
those with only a high-school degree and an increase in the wage premium for a college degree.
These changes would be reflected in the studies of cohorts born in the 1950s through the 1970s
because these students and their parents were surveyed in the 1970s and 1980s. It is not clear,
however, whether this explanation can account for the continued increase in the correlation
between income and education for studies conducted after the 1980s.
Figure 5.9 here
A second possible reason for increasing correlation between parental education and income
is the increasing polarization of families. Sara McLanahan (2004) argues that trends since 1960 in
family structure and composition have led to an increasingly polarized distribution of family
contexts for children—mothers with low levels of education are increasingly likely to be young,
unemployed, and single or divorced; mothers with high levels of education are, conversely,
increasingly likely to be older, employed, and married. As a result, the correlation of parental
education and income among families with children is likely to increase with time. Moreover,
McLanahan argues, this polarization in family structure implies a corresponding polarization in key
resources (income, parental time) available for children, which may have important implications
for the distribution of children’s academic achievement.
Related to this argument is the fact that marital homogamy (the tendency for individuals to
marry those with similar levels of educational attainment) has increased substantially since 1960
(Schwartz and Mare 2005). As a result, in two-parent families, the educational attainment of the
higher-educated parent is increasingly predictive of the educational attainment of the less educated
spouse. This trend, coupled with the increasing disparity in single parenthood and employment
between mothers with high and low levels of education described by McLanahan, and the
increasing wage premium to education described by Levy and Murnane, implies that children with

22
one highly educated parent are increasingly likely to have two highly educated, married parents
and a high family income, while children with one less-educated parent are increasingly likely to
live either with a single mother or with two parents, both with low levels of education and low
wages.
Given the increasing correlation of parental educational attainment and family income, we
might expect the association between parental education and children’s achievement to grow with
time in the same way that the income achievement gap does. This does not, however, appear to be
the case. Online appendix section 5.A8 describes a set of analyses of the trends in the association
between parental educational attainment and math and reading scores from all available studies.
On the whole, the data suggest that the association between parental educational attainment and
student achievement has not changed dramatically during the last fifty years, though there is some
evidence that it may be increasing in recent decades.
Because income and parental education are correlated, and increasingly so with time, as
shown in figure 5.9, I conduct a set of analyses to determine whether the growth in the income
achievement gap is due to increases in the association between income and achievement or
parental education and achievement. For each study with measures of both family income and
parental education, I estimate the association between income and achievement, controlling for
parental education, and the association between parental education and achievement, controlling
for family income (see online appendix section 5.A8). These partial associations are shown in
figures 5.10 and 5.11.
The key result evident in figures 5.10 and 5.11 is that the income coefficient grew steeply
for cohorts born from the 1940s to 2000. The income coefficient for reading increased fourfold
during this period, and it more than doubled for math. At the same time, the parental-education
coefficient has been generally unchanged during the six decades of cohorts in the studies. Even if
we focus only on the cohorts born since the mid-1970s, the income coefficient has increased

23
substantially, more than doubling in reading and increasing more than 50 percent in math. In this
same time period, the coefficient on educational attainment appears to have grown as well, albeit at
a slower rate.
Figures 5.10 & 5.11 here
It is instructive to compare the trends in figures 5.10 and 5.11 with those in figures 5.1 and
5.2 and those in online appendix figures 5.A19 and 5.A20; because each of these figures reports
estimated gaps between a child at the 90th and 10th percentiles of the income or educational-
attainment distribution, the magnitudes of the coefficients can be directly compared. First, note that
income accounts for relatively little of the gap in achievement between children from families with
more- and less-educated parents (this is evident by comparing the unadjusted gaps in figures A19
and A20 to the adjusted gaps in figures 5.10 and 5.11). For cohorts from the 1940s through 2001,
family income and race together account for generally less than 20 percent of the association
between parental education and achievement. Parental education, however, accounts for a large
proportion of the association between income and achievement in the early cohorts, but that
proportion declines across cohorts (this is evident by comparing the unadjusted gaps in figures 5.1
and 5.2 to the adjusted gaps in figures 5.10 and 5.11). In reading, for example, parental education
accounts for roughly 60 to 80 percent of the income achievement gap in the studies of cohorts born
in the 1940s, 1950s, and 1960s. But among cohorts born between 1980 and 2001, parental
education and race explain only 40 to 60 percent of the income gap. The trend is similar, but
weaker, for math. This pattern is at odds with the explanation that the growing income gap is due to
the increasing correlation of income and parental education: all else being equal, we would expect
the increasing correlation between the two to mean that education should explain more of the
income gap over time, not less.
A second lesson evident in figures 5.10 and 5.11 is that the association between parental
education and children’s academic achievement, controlling for family income and race, remains
24
larger than the association between family income and achievement, controlling for parental
education and race. That is, although the association between income and achievement has grown
rapidly during the last fifty years, parental educational attainment is still a more powerful predictor
of student achievement than is family income.12
Increased Segregation by Income
A final possible explanation for the rising income achievement gap is the pattern of increasing
income segregation during the last forty years. Several recent studies have found that residential
segregation by income increased from 1970 to 2000, partly as a result of rising income inequality
and likely partly as a result of low-income housing policy (Jargowsky 1996; Reardon and Bischoff
2011; Watson 2009). In particular, rising income inequality has led to the increasing segregation of
high-income families from middle- and low-income families; high-income families increasingly live
spatially far from the middle class (Reardon and Bischoff 2011). Because residential patterns are
closely linked to school-attendance patterns, the rise of residential income segregation has likely
led to a concurrent rise in school segregation by income, though there is little empirical evidence on
this.13 Because the growth in income segregation has been largely a result of increasing segregation
of the affluent, this might explain the pattern of the rising association between income and
achievement among higher-income families.
Greater residential income segregation may affect the school-quality differential between
high- and low-income students, because high-income parents are better able to garner resources
for their schools. Likewise, increased income segregation may lead to less variance of test scores
within schools and more variance of test scores between schools, given that higher-income
students generally have higher scores than lower-income students.14
It is not clear, however, that these factors would lead to increases in the income
achievement gap. The evidence on the effects of school socioeconomic composition is somewhat

25
weak, though a new study taking advantage of quasi-random variation in school poverty rates
experienced by low-income students in Montgomery County, Maryland, finds evidence that low-
income students perform better on math tests after moving to low-poverty schools (Schwartz
2010). Likewise, some studies of peer effects find evidence that the academic-achievement level of
one’s classmates may impact one’s own achievement (for recent evidence, see Lavy, Silma, and
Weinhardt 2009). Nonetheless, the evidence is far from clear if, how, and how much differences
among schools in peers and school quality may affect achievement. As a result, there is little
evidence to answer the question of whether rising income segregation has played a role in the
increasing income achievement gap.
Conclusion
Most, but not all, of the evidence presented in this chapter suggests that the achievement gap
between children from high- and low-income families has grown substantially in recent decades.
The income achievement gap is now considerably larger than the black-white gap, a reversal of the
pattern fifty years ago. In some ways, this is not surprising. The 1950s and 1960s were
characterized by historically low levels of income inequality and high levels of racial inequality, not
only in educational achievement and attainment but in access to educational opportunity, labor
markets, housing markets, and health care. Beginning in the 1970s, this pattern began to reverse.
Efforts to desegregate schools and hospitals, affirmative-action programs, enforcement of fair
housing laws, and gradual but important changes in racial attitudes all led to reductions in the stark
racial disparities of the 1950s and 1960s. Although racial disparities are still manifestly evident in
many aspects of U.S. society, these disparities are considerably smaller in many ways than they
were fifty years ago.
At the same time, however, income inequality in the United States began to grow sharply in
the 1970s, a trend that continues to the present. The gap between the rich and the poor has

26
widened significantly, particularly among families with children. Moreover, the Reagan-era changes
in social policy—particularly changes in housing policies, income-support policies, and other social
safety nets for low-income families (Katz 1989, 1995)—have made life much more difficult for low-
income families. Not only do the poor have less money than they did before, they may have fewer
social support systems as well.
It is tempting to read this chapter as evidence of a profound shift from a society in which
race is more consequential than family income to one in which family income appears more
determinative than race. Certainly the trends in the income- and racial-achievement gaps are
consistent with this explanation. The fact that the relationship between parental education and
achievement has changed relatively little during the same time period is consistent with this as
well, suggesting that income, not human capital (at least as measured by parental education), is the
important socioeconomic factor at work.
However, many of the other patterns in this chapter are not fully consistent with the simple
explanation that income inequality has driven these trends. First, the analyses described in the
chapter and the online appendix show that the income achievement gaps do not grow in the ways
that would be predicted by the changes in income inequality. Although income inequality grew
sharply for families with below-median incomes during the 1970s and 1980s, the income
achievement gap among children from these families was largely unchanged. The achievement gap
did grow among children from above-median-income families, but this appears to be better
explained by an increase in the association between income and achievement, not by increases in
income inequality. Evidence from other studies suggests that parental investment in their children’s
cognitive development has grown during the last half-century, particularly for higher-income
families, a pattern that may explain the growing returns to income during this time period.
There are a number of other possible explanations for the evident trends in the income
achievement gap. Education policy increasingly focuses on standardized-test scores as outcome

27
measures for schools; as these scores become more important, families may be increasingly likely
to invest in improving their children’s scores. Likewise, cultural perceptions of the role of parents
have changed throughout the twentieth century to focus increasingly on early-childhood cognitive
and psychological development, which may lead parents with resources to invest more in their
young children’s development.
In sum, the forces at work behind the rising income achievement gap are likely complex and
interconnected. Certainly more research to understand the causes of these trends is necessary.
Equally important, however, is research to understand the consequences of these patterns.
At the same time that family income has become more predictive of children’s academic
achievement, so have educational attainment and cognitive skills become more predictive of adults’
earnings. The combination of these trends creates a feedback mechanism that may decrease
intergenerational mobility. As the children of the rich do better in school, and those who do better
in school are more likely to become rich, we risk producing an even more unequal and economically
polarized society.
28
Notes
Online appendix available at: http://www.russellsage.org/duncan_murnane_online_appendix.pdf.
1. The included NCES studies are the National Longitudinal Study (NLS), High School and Beyond
(HS&B), the National Education Longitudinal Study (NELS), the Education Longitudinal Study
(ELS), the Early Childhood Longitudinal Study, Kindergarten Cohort (ECLS-K), and the Early
Childhood Longitudinal Study, Birth Cohort (ECLS-B). The included international studies are the
Third International Mathematics and Science Study (TIMSS), the Program of International
Assessment (PISA), and the Progress in International Reading Study (PIRLS). The additional
included studies are the National Longitudinal Survey of Youth: 1979 (NLSY79), the National
Longitudinal Survey of Youth: 1997 (NLSY97), Prospects: The Congressionally Mandated Study
of Educational Growth and Opportunity (Prospects), the National Longitudinal Study of
Adolescent Health (Add Health), the Longitudinal Survey of American Youth (LSAY), the NICHD
Study of Early Child Care and Youth Development (SECCYD), the Equality of Educational
Opportunity study (EEO), and Project Talent.
2. The names of these studies are provided in full in note 1. Although HS&B includes parent-
reported family income for a subsample of roughly 15 percent of the full sample, the measure of
family income appears highly unreliable (see online appendix 5.A2 for detail). I rely instead on
the student-reported family income measure for HS&B, as described in online appendix 5.A2.
NLSY79 includes parent-reported income for subjects who live with their parents; I use only the
sample of sixteen- to eighteen-year-olds from NLSY79 for this reason.

29
3. My calculations, based on 2009 Current Population Survey data. See online appendix section
5.A3 for details.
4. Figures 5.1 and 5.2 display estimated 90/10 income achievement gaps from all available
nationally representative studies that include reading- or math-achievement test scores for
school-age children and family income. Labels indicate the modal grade in which students were
tested in a given sample. For most of the longitudinal studies (HS&B, NELS, Prospects, ELS, and
ECLS-K), only estimates from the initial wave of the study are included. ECLS-B estimates come
from wave 4, when children were five years old and tested on school readiness; SECCYD come
from wave 5, when children were in third grade and were first administered a broad academic
achievement test. The quartic fitted regression line is weighted by the inverse of the sampling
variance of each estimate. Included studies are Project Talent, NLS, HS&B, NLSY79, NELS, Add
Health (reading only), Prospects, NLSY97, ELS, SECCYD, ECLS-K, and ECLS-B. Family income is
student-reported in Project Talent, NLS, and HS&B. See online appendix for details on
computation of 90/10 gaps.
5. My calculations, based on Main NAEP math and reading scores. See National Center for
Education Statistics website, available at:
http://nces.ed.gov/nationsreportcard/naepdata/dataset.aspx (accessed March 7, 2011).
6. Figures 5.3 and 5.4 show estimated 90/10 income gaps (solid symbols) and estimated black-
white gaps (hollow symbols) based on the twelve studies with family income data. The
estimated trends in the income and black-white gaps are fitted lines (quartic for income gaps,
quadratic for black-white gaps), weighted by the inverse of the sampling variance of each
estimate. The estimated black-white gap trend from NAEP is a fitted line (quartic for reading,

30
cubic for math) through all available NAEP-LTT and Main NAEP black-white gap estimates. The
NAEP trend is adjusted for the age of the NAEP samples and the difference between Main and
LTT NAEP (the line is the predicted trend for thirteen-year-old students in NAEP-LTT). See
appendix section 5.A5 for details.
7. The exception here is the Prospects seventh-grade cohort (born roughly 1978), for whom the
estimated gaps are much smaller than the NELS cohort (born roughly 1974), particularly in
math. The magnitude of the estimated gaps from the Prospects study—especially the Prospects
math gaps in the third- and seventh-grade cohorts—is generally not consistent with the size of
the estimated gaps from other contemporaneous studies. Moreover, it is difficult to find
documentation on the content and psychometric properties of the Prospects tests. These tests
may be much less reliable than other tests; as a result, I am inclined to discount their
importance in describing the trends.
8. Figure 5.A12 in the online appendix displays the trend in U.S. income inequality throughout the
last century.
9. My calculations, based on Current Population Survey, 1968–2009. See appendix section 5.A3 for
details.
10. We would expect this if we thought the relationship between achievement and log income was
linear, which may not be the case. See online appendix section 5.A6 for discussion.
11. The same trend is evident if the correlations are plotted against the year of the study rather
than against birth year.

31
12. The income coefficients displayed in figures 5.9 and 5.10 are roughly 20 to 40 percent the size
of the parental-education coefficients in the earliest cohorts, but they are 60 to 90 percent the
size of the parental-education coefficients in the later cohorts. The income coefficients here are
adjusted for the estimated reliability of family income, so these differences in the magnitudes of
the income and education coefficients are likely not substantially biased by the less reliable
measurement of family income. Figure 5.9 shows the Spearman rank-order correlation between
parental educational attainment (coded as the maximum level of educational attainment of both
parents, if two are present in the home) and family income. Because both income and parental
education are measured by ordered categories in most studies (parental education is measured
in four to eight categories; income in five to fifteen categories), I compute the rank-order
correlation between income and parental education for each of the twelve studies with
measures of both income and parental education. Correlations are disattenuated for estimated
measurement error in both family income and parental educational attainment. Note that
because these are rank-order correlations, they are not directly comparable to standard
(Pearson) correlation coefficients.
13. Because of the relatively small within-school samples in many of the studies that include
measures of family income, it is difficult to assess the trends in school income segregation using
the data available.
14. An examination (not shown) of the intracluster correlations of test scores from the school-
based studies included in this chapter provides some evidence that the intracluster correlation
has grown with time, but these estimates are very noisy because of the small sample sizes
within each school in most of the studies.

32
References
Bainbridge, J., M. K. Meyers, S. Tanaka, and Jane Waldfogel. 2005. “Who Gets an Early Education?
Family Income and the Enrollment of Three- to Five-Year-Olds from 1968 to 2000.” Social
Science Quarterly 86(3): 724–45.
Bianchi, Susan. 2000. “Maternal Employment and Time with Children: Dramatic Change or
Surprising Continuity?” Demography 37(4): 401–14.
Bowles, S., and H. Gintis. 1976. Schooling in Capitalist America: Educational Reform and the
Contradictions of Economic Life. New York: Basic Books.
———. 2002. “The Inheritance of Inequality.” Journal of Economic Perspectives 16(3): 3–30.
Brooks-Gunn, Jeanne, and Greg Duncan. 1997. “The Effects of Poverty on Children.” Future of
Children 7(2): 55–71.
Burkhauser, R. V., A. Feng, S. P. Jenkins, and J. Larrimore. 2009. “Recent Trends in Top Income
Shares in the USA: Reconciling Estimates from March CPS and IRS Tax Return Data.” NBER
Working Paper No. 15320. Cambridge, Mass.: National Bureau of Economic Research.
Clotfelter, C. T., H. F. Ladd, and J. L. Vigdor. 2006. “The Academic Achievement Gap in Grades Three
to Eight.” NBER Working Paper No. 12207. Cambridge, Mass.: National Bureau of Economic
Research.
Coleman, James S., Ernest Q. Campbell, Carol J. Hobson, James McPartland, Alexander M. Mood,
Frederic D. Weinfeld, and Robert L. York. 1966. Equality of Educational Opportunity.
Washington, D.C.: U.S. Department of Health, Education, and Welfare, Office of Education.
Duncan, Greg J., and Jeanne Brooks-Gunn. 1997. “Income Effects Across the Life-Span: Integration
and Interpretation.” In Consequences of Growing Up Poor, edited by Greg J. Duncan and
Jeanne Brooks-Gunn. New York: Russell Sage Foundation.
Duncan, Greg J., Jeanne Brooks-Gunn, and P. K. Klebanov. 1994. “Economic Deprivation and Early
Childhood

33
Development.” Child Development 65(2): 296–318.
Dupriez, V., and X Dumay. 2006. “Inequalities in School Systems: Effect of School Structure or of
Society Structure?”Comparative Education 42(2): 243–60.
Dura-Bellat, M., and B. Suchaut. 2005. “Organisation and Context, Efficiency and Equity of
Educational Systems: What PISA Tells Us.” European Educational Research Journal 4(3):
181–94.
Flanagan, John C., David V. Tiedeman, William V. Clemans, and Lauress L. Wise. n.d. Project Talent
Public Use File, 1960-1976 [Computer file]. ICPSR07823-v1. Ann Arbor, Mich.: Inter-
university Consortium for Political and Social Research [distributor]. Ordering information
available at http://www.projecttalent.org/contact (accessed June 24, 2011).
Fryer, R. G., and S. D. Levitt. 2004. “Understanding the Black-White Test Score Gap in the First Two
Years of
School.” Review of Economics and Statistics 86(2): 447–64.
———. 2006. “The Black-White Test Score Gap Through Third Grade.” American Law and
Economics Review 8(2): 249–81.
Grissmer, D. W., A. Flanagan, and S. Williamson. 1998. “Why Did the Black-White Score Gap Narrow
in the 1970s and 1980s?” In The Black-White Test Score Gap, edited by C. Jencks and M.
Phillips. Washington, D.C.: Brookings Institution Press.
Guryan, J., E. Hurst, and M. Kearney. 2008. “Parental Education and Parental Time with Children.”
Journal of
Economic Perspectives 22(3): 23–46.
Harris, Kathleen Mullan. 2009. The National Longitudinal Study of Adolescent Health (Add Health),
Waves I & II, 1994–1996; Wave III, 2001–2002; Wave IV, 2007–2009 [machine-readable
data file and documentation]. Chapel Hill, N.C.: Carolina Population Center, University of
North Carolina at Chapel Hill. Ordering information available at
34
http://www.cpc.unc.edu/projects/addhealth/data/restricteduse (accessed June 24, 2011).
Hedges, Larry V., and A. Nowell. 1998. “Black-White Test Score Convergence Since 1965.” In The
Black-White Test Score Gap, edited by C. Jencks and M. Phillips. Washington, D.C.: Brookings
Institution Press.
———. 1999. “Changes in the Black-White Gap in Achievement Test Scores.” Sociology of Education
72(2): 111–35.
Herrnstein, R. J., and C. Murray. 1994. The Bell Curve: Intelligence and Class Structure in American
Life. New York: Free Press.
Huang, M.-H., and R. M. Hauser. 2001. “Convergent Trends in Black-White Verbal Test-Score
Differentials in the U.S.: Period and Cohort Perspectives.” EurAmerica 31(2): 185–230.
Jacoby, R., and N. Glauberman, eds. 1995. The Bell Curve Debate: History Documents Opinions. New
York: Random House.
Jargowsky, P. A. 1996. “Take the Money and Run: Economic Segregation in U.S. Metropolitan Areas.”
American Sociological Review 61(6): 984–98.
Jencks, C., and M. Phillips, eds. 1998. The Black-White Test Score Gap. Washington D.C.: Brookings
Institution Press.
Kagan, J. 2002. “Empowerment and Education: Civil Rights, Expert-Advocates, and Parent Politics in
Head Start, 1964–1980.” Teachers College Record 104(3): 516–62.
Katz, M. B. 1989. The Undeserving Poor: From the War on Poverty to the War on Welfare. New York:
Random House.
———. 1995. Improving Poor People: The Welfare State the “Underclass” and Urban Schools as
History. Princeton, N.J.: Princeton University Press.
King, Miriam, Steven Ruggles, J. Trent Alexander, Sarah Flood, Katie Genadek, Matthew B.
Schroeder, Brandon Trampe, and Rebecca Vick. 2010. Integrated Public Use Microdata
Series, Current Population Survey: Version 3.0. [Machine-readable database]. Minneapolis:

35
University of Minnesota.
Kornrich, Sabino, and Frank Furstenberg. 2010. “Investing in Children: Changes in Parental
Spending on Children, 1972 to 2007.” Unpublished manuscript.
Lareau, Annette. 1989. Home Advantage: Social Class and Parental Intervention in Elementary
Education. London: Falmer Press.
———. 2003. Unequal Childhoods: Class Race and Family Life. Berkeley: University of California
Press.
Lavy, V., O. Silma, and F. Weinhardt. 2009. “The Good, the Bad, and the Average: Evidence on the
Scale and Nature of Peer Effects in Schools.” NBER Working Paper No. 15600. Cambridge,
Mass.: National Bureau of Economic Research.
Lemann, N. 1999. The Big Test: The Secret History of The American Meritocracy. New York: Farrar,
Straus and Giroux.
Levy, Frank, and Richard J. Murnane. 1992. “U.S. Earnings Levels and Earnings Inequality: A Review
of Recent Trends and Proposed Explanations.” Journal of Economic Literature 30(3): 1333–
81.
Magnuson, Katherine, and Jane Waldfogel, eds. 2008. Steady Gains and Stalled Progress: Inequality
and the Black-White Test Score Gap. New York: Russell Sage Foundation.
Marks, G. N. 2005. “Cross-National Differences and Accounting for Social Class Inequalities in
Education.” International Sociology 20(4): 483–505.
Mayer, S. E. 2001. “How Did the Increase in Economic Inequality Affect Educational Attainment?”
American Journal of Sociology 107(1): 1–32.
McLanahan, Sara. 2004. “Diverging Destinies: How Children Are Faring Under the Second
Demographic Transition.” Demography 41(4): 607–27.
Miller, Jon. 1994. Longitudinal Survey of American Youth [dataset]. Ordering information available
at: http://www.lsay.org (accessed June 24, 2011).
36
Murray, C. 2007. “The Magnitude and Components of Change in the Black-White IQ Difference from
1920 to 1991: A Birth Cohort Analysis of the Woodcock-Johnson Standardizations.”
Intelligence 35(4): 305–18.
National Commission on Excellence in Education. 1983. A Nation at Risk: The Imperative for
Educational Reform. Washington, D.C.: National Commission on Excellence in Education.
National Institute of Child Health and Human Development. 2010. Study of Early Child Care and
Youth Development [dataset]. Received 2010. Ordering information available at:
http://www.nichd.nih.gov/research/supported/seccyd/datasets.cfm (accessed June 24,
2011).
Neal, D. A. 2006. “Why Has Black-White Skill Convergence Stopped?” In Handbook of the Economics
of Education, edited by E. A. Hanushek and F. Welch. Vol. 1. New York: Elsevier.
Phillips, M., Jeanne Brooks-Gunn, Greg J. Duncan, P. Klebanov, and J. Crane. 1998. “Family
Background, ParentingPractices, and the Black-White Test Score Gap.” In The Black-White
Test Score Gap, edited by C. Jencks andM. Phillips. Washington, D.C.: Brookings Institution
Press.
Piketty, T., and E. Saez. 2003. “Income Inequality in the United States, 1913–1998.” Quarterly
Journal of Economics 118(1): 1–39.
———. 2008. “Income Inequality in the United States, 1913–1998; Tables and Figures Updated to
2006.” Available at: http://www.econ.berkeley.edu/∼saez/TabFig2006.xls (accessed
September 2, 2009).
Ramey, G., and V. A. Ramey. 2010. “The Rug Rat Race.” Unpublished paper.
Reardon, Sean F., and K. Bischoff. 2011. “Income Inequality and Income Segregation.” American
Journal of Sociology 116(4): 1092–153.
Reardon, Sean F., and C. Galindo. 2009. “The Hispanic-White Achievement Gap in Math and Reading
in the Elementary Grades.” American Educational Research Journal 46(3): 853–91.
37
Schaub, M. 2010. “Parenting for Cognitive Development from 1950 to 2000: The Institutionalization
of Mass Education and the Social Construction of Parenting in the United States.” Sociology
of Education 83(1): 46–66.
Schwartz, C. R., and R. D. Mare. 2005. “Trends in Educational Assortative Marriage from 1940–
2003.” Demography 42(4): 621–46.
Schwartz, H. 2010. Housing Policy Is School Policy: Economically Integrative Housing Promotes
Academic Success in Montgomery County, Maryland. New York: Century Foundation.
U.S. Bureau of Labor Statistics. 1980. National Longitudinal Survey of Youth, 1979 [dataset].
Available at: http://www. bls.gov/nls/nlsy79.htm (accessed June 24, 2011).
———. 1999. National Longitudinal Survey of Youth, 1997 [dataset]. Available at:
http://www.bls.gov/nls/nlsy97.htm (accessed June 24, 2011).
U.S. Department of Education. 1995. Prospects: The Congressionally Mandated Study of Educational
Growth and Opportunity [dataset]. Ordering information available at:
http://www.ed.gov/pubs/Prospects/index.html (accessed June 24,2011).
U.S. Department of Education, Center for Education Statistics. n.d. National Assessment of
Educational Progress-Main [dataset]. Ordering information available at:
http://nces.ed.gov/nationsreportcard/researchcenter/datatools.asp (accessed June 24,
2011).
———. 1999. National Longitudinal Study of the Class of 1972 [Computer file]. ICPSR version.
Chicago, Ill: National Opinion Research Center [producer], 1992. Ann Arbor, Mich.: Inter-
university Consortium for Political and Social Research [distributor]
doi:10.3886/ICPSR08085.
———. 2000. Early Childhood Longitudinal Survey-Kindergarten (Base Year) [dataset]. Ordering
information available at: http://nces.ed.gov/ecls/kinderdatainformation.asp (accessed June
24,2011).
38
———. 2001. High School and Beyond, 1980: A Longitudinal Survey of Students in The United States
[Computer file].2nd ICPSR version. Chicago, Ill.: National Opinion Research Center
[producer], 1980. Ann Arbor, Mich.: Interuniversity Consortium for Political and Social
Research [distributor]. doi:10.3886/ICPSR07896.
———. 2004. National Education Longitudinal Study: Base Year Through Fourth Follow-Up, 1988–
2000 [Computer file]. ICPSR version. Washington, D.C.: U.S. Department of Education,
National Center for Education Statistics [producer], 2002. Ann Arbor, Mich: Inter-university
Consortium for Political and Social Research [distributor].
———. 2005. National Assessment of Educational Progress-Long Term Trend [dataset]. Ordering
information available at:
http://nces.ed.gov/nationsreportcard/researchcenter/datatools.asp (accessed June 24,
2011).
———. 2009. Early Childhood Longitudinal Survey-Birth Cohort (9 Month-Kindergarten) [dataset].
Ordering information available at: http://nces.ed.gov/ecls/birthdatainformation.asp
(accessed June 24, 2011).
———. 2010. Education Longitudinal Study: Base Year Through Second Follow-Up, 2002–2006
[dataset]. Washington, D.C.: U.S. Department of Education, National Center for Education
Statistics [producer], 2010. Available at:
http://nces.ed.gov/surveys/els2002/orderingcds.asp (accessed June 24, 2011).
Watson, T. 2009. “Inequality and the Measurement of Residential Segregation by Income.” Review of
Income and Wealth 55(3): 820–44.
Wrigley, Julia. 1989. “Do Young Children Need Intellectual Stimulation? Experts’ Advice to Parents,
1900–1985.” History of Education Quarterly 29(1): 41–75.
Zigler, E., and S. Muenchow. 1992. Head Start: The Inside Story of America’s Most Successful
Educational Experiment. New York: Basic Books.

39
FIGURE 5.1 Trend in 90/10 Income Achievement Gap in Reading, by Birth Cohort (1943 to 2001 Cohorts)
Source: Author’s compilation based on data from Project Talent (Flanagan et al. n.d.); NLS, HS&B, NELS, ELS, ECLS-K, ECLS-B (U.S. Department of Education, Center for Education Statistics 1999, 2000, 2001, 2004, 2009, 2010); Prospects (U.S. Department of Education 1995); NLSY79, NLSY97 (U.S. Bureau of Labor Statistics 1980, 1999); SECCYD (National Institute of Child Health and Human Development 2010); and Add Health (Harris 2009, reading only). Note: See note 4 and online appendix for further details.
0.00
0.25
0.50
0.75
1.00
1.25
1.50
Ave
rage
Diff
eren
ce in
Sta
ndar
dize
d Te
st S
core
sB
etw
een
90th
& 1
0th
Inco
me
Per
cent
ile F
amili
es
1940 1950 1960 1970 1980 1990 2000Cohort Birth Year
TALENTNLSHS&BNLSY79NELSAdd HealthProspectsNLSY97ELSSECCYDECLS-KECLS-BQuartic Fitted Trend1943-2001Fitted Trend1974-2001
Study
Trend in 90/10 Income Gap in Reading, 1943-2001 Cohorts

40
FIGURE 5.2 Trend in 90/10 Income Achievement Gap in Math, by Birth Cohort (1943 to 2001 Cohorts)
Source: Author’s compilation based on data from Project Talent (Flanagan et al. n.d.); NLS, HS&B, NELS, ELS, ECLS-K, ECLS-B (U.S. Department of Education, Center for Education Statistics 1999, 2000, 2001, 2004, 2009, 2010); Prospects (U.S. Department of Education 1995); NLSY79, NLSY97 (U.S. Bureau of Labor Statistics 1980, 1999); and SECCYD (National Institute of Child Health and Human Development 2010). Note: See note 4 and online appendix for further details.
0.00
0.25
0.50
0.75
1.00
1.25
1.50
Ave
rage
Diff
eren
ce in
Sta
ndar
dize
d Te
st S
core
sB
etw
een
90th
& 1
0th
Inco
me
Per
cent
ile F
amili
es
1940 1950 1960 1970 1980 1990 2000Cohort Birth Year
TALENTNLSHS&BNLSY79NELSAdd HealthProspectsNLSY97ELSSECCYDECLS-KECLS-BQuartic Fitted Trend1943-2001Fitted Trend1974-2001
Study
Trend in 90/10 Income Gap in Math, 1943-2001 Cohorts

41
FIGURE 5.3 Comparison of Income and Black-White Reading-Gap Trends (1943 to 2001 Cohorts)
Source: Author’s compilation based on data from Project Talent (Flanagan et al. n.d.); NLS, NAEP, HS&B, NELS, ELS, ECLS-K, ECLS-B (U.S. Department of Education, Center for Education Statistics n.d., 1999, 2000, 2001, 2004, 2005, 2009, 2010); Prospects (U.S. Department of Education 1995); NLSY79, NLSY97 (U.S. Bureau of Labor Statistics 1980, 1999); SECCYD (National Institute of Child Health and Human Development 2010); and Add Health (Harris 2009, reading only). Note: Solid symbols represent 90/10 income achievement gaps; hollow symbols denote black-white achievement gaps. See note 6 and online appendix section 5.A5 for further details.
0.00
0.25
0.50
0.75
1.00
1.25
1.50
Ave
rage
Diff
eren
ce in
Sta
ndar
dize
d Te
st S
core
s(9
0/10
Inco
me
Gap
or B
lack
-Whi
te G
ap)
1940 1950 1960 1970 1980 1990 2000Cohort Birth Year
TALENTNLSHS&BNLSY79NELSAdd HealthProspectsNLSY97ELSSECCYDECLS-KECLS-BIncome GapBlack-WhiteGapBlack-WhiteGap (NAEP)
Study
Trends in Income and Black-White Gaps in Reading, 1943-2001 Cohorts

42
FIGURE 5.4 Comparison of Income and Black-White Math-Gap Trends (1943 to 2001 Cohorts)
Source: Author’s compilation based on data from Project Talent (Flanagan et al. n.d.); NLS, NAEP, HS&B, NELS, ELS, ECLS-K, ECLS-B (U.S. Department of Education, Center for Education Statistics n.d., 1999, 2000, 2001, 2004, 2005, 2009, 2010); Prospects (U.S. Department of Education 1995); NLSY79, NLSY97 (U.S. Bureau of Labor Statistics 1980, 1999); SECCYD (National Institute of Child Health and Human Development 2010); and Add Health (Harris 2009, reading only). Note: Solid symbols represent 90/10 income achievement gaps; hollow symbols denote black-white achievement gaps. See note 6 and online appendix section 5.A5 for further details.
0.00
0.25
0.50
0.75
1.00
1.25
1.50
Ave
rage
Diff
eren
ce in
Sta
ndar
dize
d Te
st S
core
s(9
0/10
Inco
me
Gap
or B
lack
-Whi
te G
ap)
1940 1950 1960 1970 1980 1990 2000Cohort Birth Year
TALENTNLSHS&BNLSY79NELSAdd HealthProspectsNLSY97ELSSECCYDECLS-KECLS-BIncome GapBlack-WhiteGapBlack-WhiteGap (NAEP)
Study
Trends in Income and Black-White Gaps in Math, 1943-2001 Cohorts
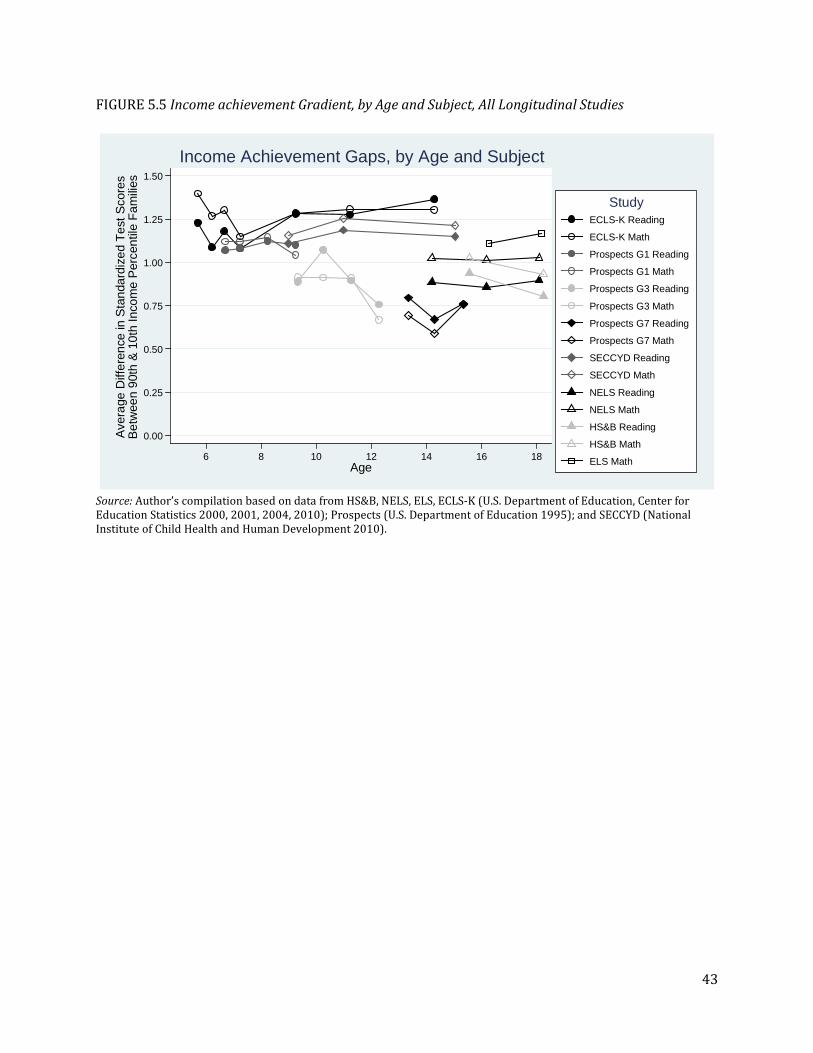
43
FIGURE 5.5 Income achievement Gradient, by Age and Subject, All Longitudinal Studies
Source: Author’s compilation based on data from HS&B, NELS, ELS, ECLS-K (U.S. Department of Education, Center for Education Statistics 2000, 2001, 2004, 2010); Prospects (U.S. Department of Education 1995); and SECCYD (National Institute of Child Health and Human Development 2010).
0.00
0.25
0.50
0.75
1.00
1.25
1.50
Ave
rage
Diff
eren
ce in
Sta
ndar
dize
d Te
st S
core
sB
etw
een
90th
& 1
0th
Inco
me
Per
cent
ile F
amili
es
6 8 10 12 14 16 18Age
ECLS-K Reading
ECLS-K Math
Prospects G1 Reading
Prospects G1 Math
Prospects G3 Reading
Prospects G3 Math
Prospects G7 Reading
Prospects G7 Math
SECCYD Reading
SECCYD Math
NELS Reading
NELS Math
HS&B Reading
HS&B Math
ELS Math
Study
Income Achievement Gaps, by Age and Subject

44
FIGURE 5.6 Trends in Family-Income Inequality Among School-Age Children, 1967 to 2008 (Weighted by Number of School-Age Children)
Source: Author’s calculations, based on U.S. Bureau of the Census (King et al. 2010). Note: Each line shows the trends in the ratio of household incomes at two percentiles of the income distribution. All trends are divided by their value in 1967 in order to put the trends on a common scale.
0.8
1.0
1.2
1.4
1.6
1.8
2.0
2.2
Inco
me
Rat
io (R
elat
ive
to 1
967)
1970 1980 1990 2000 2010Year
90/10 Income Ratio
50/10 Income Ratio
90/50 Income Ratio
Weighted by Number of School-Age ChildrenIncome Inequality Trends, 1967-2008, All Families with School-Age Children

45
FIGURE 5.7 Trend in 90/50 and 50/10 Income Achievement Gap, Reading, by Birth Year (1943 to 2001 Cohorts)
Source: Author’s compilation based on data from Project Talent (Flanagan et al. n.d.); NLS, HS&B, NELS, ELS, ECLS-K, ECLS-B (U.S. Department of Education, Center for Education Statistics 1999, 2000, 2001, 2004, 2009, 2010); Prospects (U.S. Department of Education 1995); NLSY79, NLSY97 (U.S. Bureau of Labor Statistics 1980, 1999); SECCYD (National Institute of Child Health and Human Development 2010); and Add Health (Harris 2009, reading only). Note: Solid symbols represent 90/50 income achievement gaps; hollow symbols represent 50/10 income achievement gaps.
0.00
0.25
0.50
0.75
1.00
Ave
rage
Diff
eren
ce in
Sta
ndar
dize
d Te
st S
core
s
1940 1950 1960 1970 1980 1990 2000Cohort Birth Year
TALENTNLSHS&BNLSY79NELSAdd HealthProspectsNLSY97ELSSECCYDECLS-KECLS-BFitted Trend90/50 GapFitted Trend50/10 Gap
Study
Trends in 90/50 and 50/10 Income Gaps in Reading, 1943-2001 Cohorts

46
FIGURE 5.8 Trends in 90/50 and 50/10 Income Achievement Gap in Math, by Birth Year (1943 to 2001 Cohorts)
Source: Author’s compilation based on data from Project Talent (Flanagan et al. n.d.); NLS, HS&B, NELS, ELS, ECLS-K, ECLS-B (U.S. Department of Education, Center for Education Statistics 1999, 2000, 2001, 2004, 2009, 2010); Prospects (U.S. Department of Education 1995); NLSY79, NLSY97 (U.S. Bureau of Labor Statistics 1980, 1999); and SECCYD (National Institute of Child Health and Human Development 2010). Note: Solid symbols represent 90/50 income achievement gaps; hollow symbols represent 50/10 income achievement gaps.
0.00
0.25
0.50
0.75
1.00
Ave
rage
Diff
eren
ce in
Sta
ndar
dize
d Te
st S
core
s
1940 1950 1960 1970 1980 1990 2000Cohort Birth Year
TALENTNLSHS&BNLSY79NELSAdd HealthProspectsNLSY97ELSSECCYDECLS-KECLS-BFitted Trend90/50 GapFitted Trend50/10 Gap
Study
Trends in 90/50 and 50/10 Income Gaps in Math, 1943-2001 Cohorts

47
FIGURE 5.9 Trend in Correlation Between Parental Education and Family Income (1943 to 2001 Cohorts)
Source: Author’s compilation based on data from Project Talent (Flanagan et al. n.d.); NLS, HS&B, NELS, ELS, ECLS-K, ECLS-B (U.S. Department of Education, Center for Education Statistics 1999, 2000, 2001, 2004, 2009, 2010); Prospects (U.S. Department of Education 1995); NLSY79, NLSY97 (U.S. Bureau of Labor Statistics 1980, 1999); SECCYD (National Institute of Child Health and Human Development 2010); and Add Health (Harris 2009, reading only). Note: See note 12 for further details.
0.00
0.20
0.40
0.60
0.80
Spe
arm
an R
ank-
Ord
er C
orre
latio
n
1940 1950 1960 1970 1980 1990 2000Cohort Birth Year
Estimates Based on Parent ReportEstimates Based on Student ReportFitted Trend
Trend in Correlation Between Parent Education and Income, 1943-2001 Cohorts

48
FIGURE 5.10 Estimated Partial Associations Between Reading Test Scores and Both Income and Parental Education, by Birth Cohort (1943 to 2001 Cohorts)
Source: Author’s compilation based on data from Project Talent (Flanagan et al. n.d.); NLS, HS&B, NELS, ELS, ECLS-K, ECLS-B (U.S. Department of Education, Center for Education Statistics 1999, 2000, 2001, 2004, 2009, 2010); Prospects (U.S. Department of Education 1995); NLSY79, NLSY97 (U.S. Bureau of Labor Statistics 1980, 1999); and SECCYD (National Institute of Child Health and Human Development 2010). Note: Solid symbols represent regression-adjusted 90/10 income coefficients; hollow symbols represent regression-adjusted parental education coefficients. See note 12 for further details.
0.00
0.20
0.40
0.60
0.80
1.00
Reg
ress
ion-
Adj
uste
d 90
/10
Ach
ieve
men
t Gap
1940 1950 1960 1970 1980 1990 2000Cohort Birth Year
TALENTNLSHS&BNLSY79NELSAdd HealthProspectsNLSY97ELSSECCYDECLS-KECLS-BIncomeCoefficientParentalEducationCoefficient
Study
Trends in Adjusted Associations Between Readingand Both Income and Parental Education, 1943-2001 Cohorts
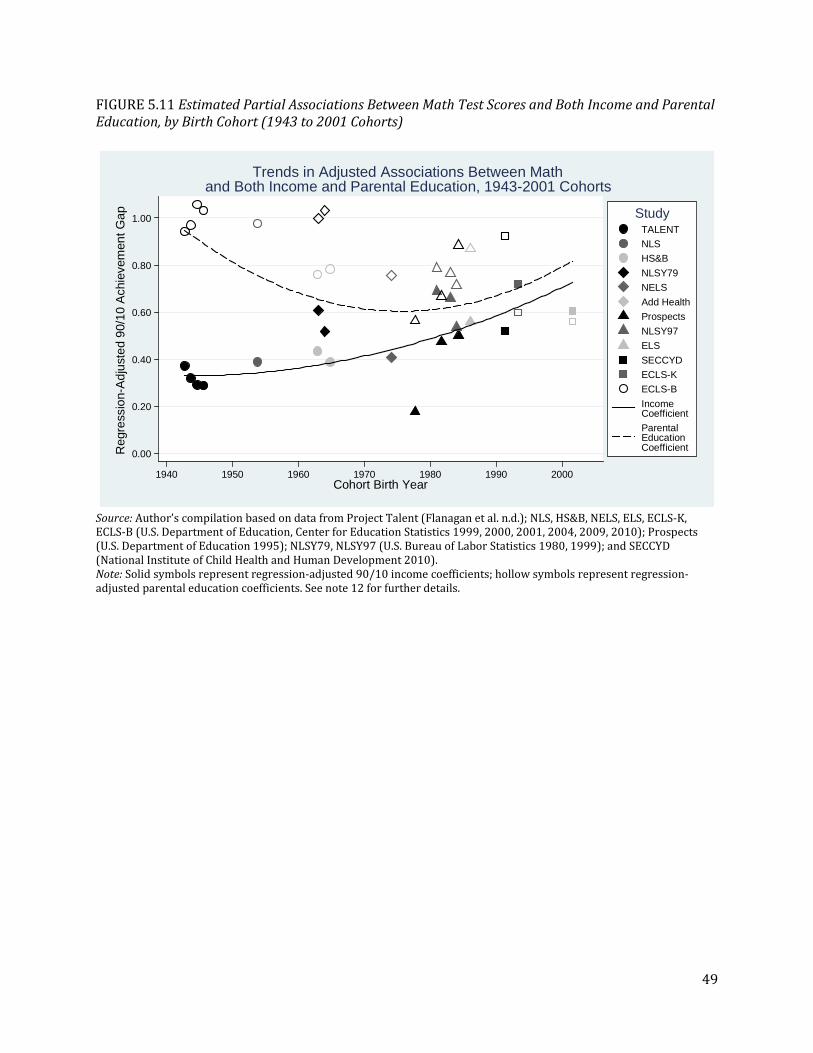
49
FIGURE 5.11 Estimated Partial Associations Between Math Test Scores and Both Income and Parental Education, by Birth Cohort (1943 to 2001 Cohorts)
Source: Author’s compilation based on data from Project Talent (Flanagan et al. n.d.); NLS, HS&B, NELS, ELS, ECLS-K, ECLS-B (U.S. Department of Education, Center for Education Statistics 1999, 2000, 2001, 2004, 2009, 2010); Prospects (U.S. Department of Education 1995); NLSY79, NLSY97 (U.S. Bureau of Labor Statistics 1980, 1999); and SECCYD (National Institute of Child Health and Human Development 2010). Note: Solid symbols represent regression-adjusted 90/10 income coefficients; hollow symbols represent regression-adjusted parental education coefficients. See note 12 for further details.
0.00
0.20
0.40
0.60
0.80
1.00
Reg
ress
ion-
Adj
uste
d 90
/10
Ach
ieve
men
t Gap
1940 1950 1960 1970 1980 1990 2000Cohort Birth Year
TALENTNLSHS&BNLSY79NELSAdd HealthProspectsNLSY97ELSSECCYDECLS-KECLS-BIncomeCoefficientParentalEducationCoefficient
Study
Trends in Adjusted Associations Between Mathand Both Income and Parental Education, 1943-2001 Cohorts