the western north atlantic bloom experiment -...
TRANSCRIPT
Deep-Sea Research II. Vol. 40. No. 1/2, pp. 279-305. 1993. 0967~)645/93 $5,00 + 0.00 Printed in Great Britain. Pergamon Press Ltd
The western North Atlantic Bloom Experiment
W. G. HARRISON,* E. J. H. HEAD,* E. P. W. HORNE,* B. IRWIN,*
W, K. W. LI,* A . R. LONGHURST,* M. A . PARANJAPEt a n d T. PLAIT*
(Received 13 May 1991; in revised form 1 January 1992; accepted 20 March 1992)
Abstract--An investigation of the spring bloom was carried out in the western North Atlantic (40-50°W) as one component of the multi-nation Joint Global Ocean Flux Study (JGOFS) North Atlantic Bloom Experiment (NABE). The cruise track included an extended hydrographic section from 32 to 47°N and process studies at two week-long time-series stations at 40 and 45°N.
Biological and chemical data collected along the transect indicated that the time-series stations were located in regions where the spring bloom was well developed; algal biomass was high and surface nutrient concentrations were reduced from maximum wintertime levels. Despite simi- larities in the vertical structure and magnitude of phytoplankton hiomass and productivity, the two stations clearly differed in physical, chemical and other biological characteristics.
Detailed depth profiles of the major autotrophic and heterotrophic microplankton groups (bacteria, phytoplankton, microzooplankton) revealed a strong vertical coherence in distribution at both sites, with maximum concentrations in the upper 50 m being typical of the spring bloom. Ultraplankton (<10 um) were an important component of the primary producers at 40°N, whereas larger netplankton (diatoms, dinoflagellates) were more important at 45°N. Silicate depletion was clearly evident in surface waters at 45°N, where diatoms were most abundant. Despite the relative importance of diatoms at 45°N, dinoflagellates dominated the biomass of the netplankton at both sites; however, much of this community may have been heterotrophic.
Bacterial biomass and production were high at both stations relative to phytoplankton levels, particularly at 45°N, and may have contributed to the unexpectedly high residual ammonium concentrations observed below the chlorophyll maximum layer at both stations. Microzooplankton grazing dominated phytoplankton losses at both stations, with consumption as high as 88% of the daily primary production. Grazing losses to the mesozooplankton, on the other hand, were small (< 10%), but mesozooplankton contribution to the vertical flux of organic matter (fecal pellets) was important at 45°N. F-ratios estimated by 15N tracer methods and sediment trap fluxes were similar and suggested that -30% of the daily primary production was lost by direct sedimentation during the observation period. Numerous similarities in bloom characteristics were noted between the western and eastern Atlantic study sites.
I N T R O D U C T I O N
SATELLITE remote sensing methods have clearly established the spring phytoplankton "bloom" in the North Atlantic to be one of the most prominent variable features of the global ocean color field (BROWN et al., 1985; ISAIAS et al., 1986; LEWIS, 1989). Further- more, it has become evident that the growth cycle of ocean biota strongly influences the exchange of CO2 between the atmosphere and the surface ocean (e.g. TAYLOR et al., 1991).
* Biological Oceanography Division, Bedford Institute of Oceanography, Box 1006, Dartmouth, Nova Scotia B2Y 4A2, Canada.
tNorthwest Atlantic Fisheries Centre. Box 5667, St. John's, Newfoundland A1C 5X1, Canada.
279

280 w . G . HARRISON et al.
These, among other considerations, were the bases for selecting the North Atlantic Bloom Experiment (NABE) as the first of many multination investigations of biogeochemicat processes planned under the JGOFS program (DucKLOW, 1989; SCOR, 1990a,c). This large-scale process study was centered in the eastern Atlantic along 20°W longitude at 33. 47 and 60°N, and covered the period March-September 1989 (DucKLOW, 1989).
The Canadian component of NABE took place considerably further west (40-50°W), providing an opportunity for large-scale (> 1000 km longitudinal separation) comparative' studies of bloom processes at similar latitudes and times of year on opposing sides of the North Atlantic basin.
Objectives of the Canadian cruise were to establish initially from survey work one ~,r more representative sites from which detailed studies could be made of carbon biomass and cycling of the major planktonic components of the spring bloom. Experimental work focussed on the productivity and distributional relationships of autotrophs and micrt~- heterotrophs and the nature and magnitude of losses of biogenic carbon from the euphoric zone, including zooplankton grazing and passive particle sinking.
We report here some of the major hydrographic, chemical and biological features of the western North Atlantic spring bloom during the period mid-April to mid-May 1989.
METHODS
Sampling
JGOFS studies were carried out as part of the CSS BAFFIN western North Atlantic cruise 89-003 during the period 20 April-18 May 1989. The sampling strategy was designed around an initial meridional transect, beginning in the subtropical gyre (32°N) east of the main eddy field of the Gulf Stream and just north of Bermuda (Fig. 1) and proceeding
Fig. 1.
60
"-- 50 Z v
-~ 40
30
20
- 8 0 - 6 0 - 4 0 - 2 0 0
"~- _ ~ _ ~ ~ •• '~fr~60 5o
,.,,,,,: o 4°
' _ . . . . . . . . . . . _L_ . . . . . . . . ~ ...... J_ .. . . . J
- 8 0 - 6 0 - 4 0 - 2 0 0
Longitude (W) Principal sites of eastern and western North Atlantic Bloom Exper iments (NABE). Open
circles indicate western N A B E time-series stations.

The western North Atlantic Bloom Experiment 281
north, to establish an "optimum" location for the planned process studies of the spring bloom. Continuous measurements of in vivo fluorescence (Turner Designs), temperature and salinity (Guildline) were made using surface ( -4 m) seawater from the ship's intake system and logged, along with position and time (GMT), on a portable computer. Discrete samples were collected using a rosette-style sampler equipped with 18 8-1 PVC sampling bottles, a CTD (Guildline), fluorometer (Aquatracka) and 4 Jr light meter (LI-COR SPH). Sampling was confined to the upper 200 m. Time-series measurements were made at two locations: 40°N, 47°W from 27 April to 4 May, and 45°N, 41°W from 8 to 13 May (Fig. 1). At these stations, rosette samples were collected twice daily, in the morning (-0800h local time) and at sunset (1900-2000 h). Actual sampling locations were determined by the positions of free-floating sediment trap arrays deployed at the beginning of each of the time-series studies. Strict adherence to JGOFS recommended sampling procedures, i.e. "ultra-clean" techniques (SCOR, 1990b) could not be followed, but our rosette bottles, incubation vessels (see below) and other containers were thoroughly cleaned (dilute HCL) and rinsed (demineralized water) before the cruise; periodic acid cleaning and daily rinsing also were done at sea. The rosette bottles were custom designed (Crooks Mechanical Systems, Dartmouth, Nova Scotia) to circumvent toxicity from latex rubber: the need for internal springs was avoided by adopting an external closing mechanism. Furthermore, the closure seals were made of Teflon. Despite these precautions, however, metal contamination in our productivity experiments was evident (J. MARTIN, personal communication), although detrimental effects were not apparent based on comparisons of our primary productivity values with those where contamination was minimal. Other core measurement protocols followed JGOFS recom- mendations (see below).
Hydrography, nutrients and particulates
Temperatures, salinity and depth were measured using a Guildline CTD. Inorganic nutrients were collected from the rosette bottles (or Niskin bottles in the case of productivity experiments, see below) and measured either by automated methods (NO3, PO4, SiO3) using an Alpkem RFA autoanalyser or manually (NH4) using the standard hypochlorite method of SOLORZANO (1969). All nutrient analyses were done immediately after sample collection; NH 4 samples were prefiltered through a glass-fiber filter (What- man GF/F) before analysis. Particulate organic carbon (POC) and nitrogen (PON) were determined by high-temperature combustion (Perkin-Elmer Elemental Analyzer) of samples concentrated on precombusted GF/F filters. Hydrography, nutrients and phyto- plankton biomass (chlorophyll a) were measured at all stations, whereas abundance of other plankton forms and rate process measurements (see below) were concentrated at the time-series stations at 40 and 45°N.
Phytoplankton pigments and cell counts
Phytoplankton pigments were measured by standard fluorometric methods and by HPLC. Chlorophyll a (Chl a) and phaeopigments were determined on acetone extracts of replicate (100 ml) samples collected on glass-fiber filters (Whatman GF/F). The fluoro- metric method of HOLM-HANSEN et al. (1965) was employed using a Turner Designs instrument. Additional Chl a samples were collected occasionally for size-fractionation (using Nuclepore membrane filters; IRWIN et al., in press) to assess the relative importance

282 w.G. HARIUSON et al.
of the < 1 pm and > 1 pm size fractions. For HPLC analysis, water samples ((}.5-1.5 1) were filtered onto glass-fiber filters, which then were frozen in liquid nitrogen and stored in the dark at - 20C for later analysis ashore. Immediately before being run, samples were ground in 1 ml 90% acetone-water, using a Teflon-glass homogenizer. The glass fibers were removed by centrifugation (2 rain at 12,000 g). The samples were then diluted 1:2 with aqueous ammonium acetate (0.5 M) and 250 pl of the mixtures were injected onto a Beckman C-18 3#m Ultrasphere reversed-phase column (4.6 x 70ram). The samples were run using a gradient elution system of aqueous ammonium acetate-methanol (20:80) as solvent 1 and ethyl acetate-methanol (30:70) as solvent 2. The gradient was run over 15 min from 0 to 100% solvent 2. Eluting pigments were detected using a Beckman 167 UV-vis scanning detector set at 430 nm. Peaks were generally identified by comparisons ol their retention times and those of standards obtained from Sigma Chemical Co. (chloro- phylls a and b) and Dr R. Bidigare (chlorophyll c and most carotenoids). Alpha-carotene was identified by comparison of its retention time with a peak found in a culture of prochlorophytes provided by Dr F. Partensky. Relative concentration units, given in the results, are the relative areas under the peaks in absorbance traces. According to BIDIGARE et al. (1990), "primary taxonomic markers" fucoxanthin, peridinin, prasinoxanthin. zeaxanthin, 19'-hexanoyloxyfucoxanthin and chlorophyll b indicate the presence of diatoms, photosynthetic dinoflageltates, prasinophytes, coccoid cyanobacteria, prymne- siophytes and "green" algae, respectively. Prochlorophytes may be distinguished by "alpha-carotene and divinyl chlorophyll a-like" pigments (CHISHOLM et al., 1988).
In addition to pigments, samples were collected for cell counts by direct microscopic analysis or by flow cytometry. Phytoplankton cells were enumerated by light microscopy from samples for microzooplankton (see below). Cells were settled from 50 or 10(I ml aliquots and were identified and counted with a Zeiss inverted microscope (HASLE, 1978). Cell volumes were estimated by assigning the appropriate geometric cell shapes (Ro'H, 1981), and organic carbon content was calculated by the relations of STRATHMANN (1967) for diatoms and other phytoplankton. Unicellular cyanobacteria were enumerated by epifluorescence microscopy (LI et al., 1992). Other autofluorescent plankton were determined by flow cytometric analysis that differentiated two groups of phytoplankton: the photosynthetic nanoplankton (PNAN), red-fluorescing cells with or without phyco- erythrin in the size range >2/~m but < i0/~m equivalent spherical diameter (ESD), and the "very small red-fluorescing cells" (VSRF), red cells lacking phycoerythrin and in the size range <2 #m ESD. Thus, the < 10 #m phytoplankters include the cyanobacteria, PNAN and VRSF cells and will be collectively referred to as ultraplankton; methodological details are given by LI et al. (1993).
Heterotrophic bacteria, microzoop lank ton and mesozoop lank ton abundance
Heterotrophic bacteria were enumerated by epifluorescent microscopic examination of DAPI-stained cells concentrated on 0.2 #m black polycarbonate (Nuclepore) filters (Ll et al., 1993).
Samples for microzooplankton were collected by following JGOFS protocols. Three types of samples were coUected from each depth. (1) A 50 ml sample from the rosette bottles was fixed in 2% filtered gluteraldehyde, stained with DAPI (PORTER and FEI(;, 1980) andfiltered through a 0.8 pm pore size black Nuelepore filter and mounted in low- fluorescence immersion oil on a glass slide and kept frozen at -20°C until they could be

The western North AtLantic Bloom Experiment 283
counted (BLoEM et al., 1986). This sample was used to enumerate heterotrophic and autotrophic pico- and nanoflagellates by epifluorescence. (2) A 500 ml whole water sample was fixed with 1% alkaline Lugol solution and preserved with 1% buffered formaldehyde. This sample was used to enumerate ciliates and other protists (as well as phytoplankton) by light microscopy. (3) A 20 1 whole water sample was gently filtered through a 30/~m mesh, concentrated to a final volume of 500 ml and preserved with alkaline Lugol and formaldehyde as above. This sample was used to enumerate sarcodines and small metazoa. In this report, results from the first two types of samples are discussed.
The frozen slides were examined for heterotrophic and autotrophic nanoflagellates on a Zeiss epifluorescence microscope equipped with a 50 W mercury lamp and appropriate filter combinations. At least 100 cells per slide were counted. Flagellates were measured with an eyepiece reticule and volumes were estimated by assuming sphere or prolate spheroid shapes.
The numerical abundance of ciliates was estimated from the whole water samples by methods described in PARANJAPE et al. (1985) and PARANJAPE (1988). A 50 ml aliquot was allowed to settle and was examined with a Zeiss inverted microscope. Biovolumes of various taxa were estimated by assuming simple geometric shapes or combinations of shapes.
Mesozooplankton densities were determined using the BIONESS multiple opening/ closing net sampler (SAMEOXO et al., 1980). At 40 and 45°N, daytime and nighttime BIONESS tows were made to 500 m, divided into 16 and 19 depth intervals, respectively. Dry weights were determined for two size fractions: >1 mm and <1 mm but <200 urn. Samples representing the <200 ,urn fraction were not taken. Zooplankton were sorted and enumerated to the level of genus or species, depending on their abundance in the t o w s .
Carbon biomass conversions
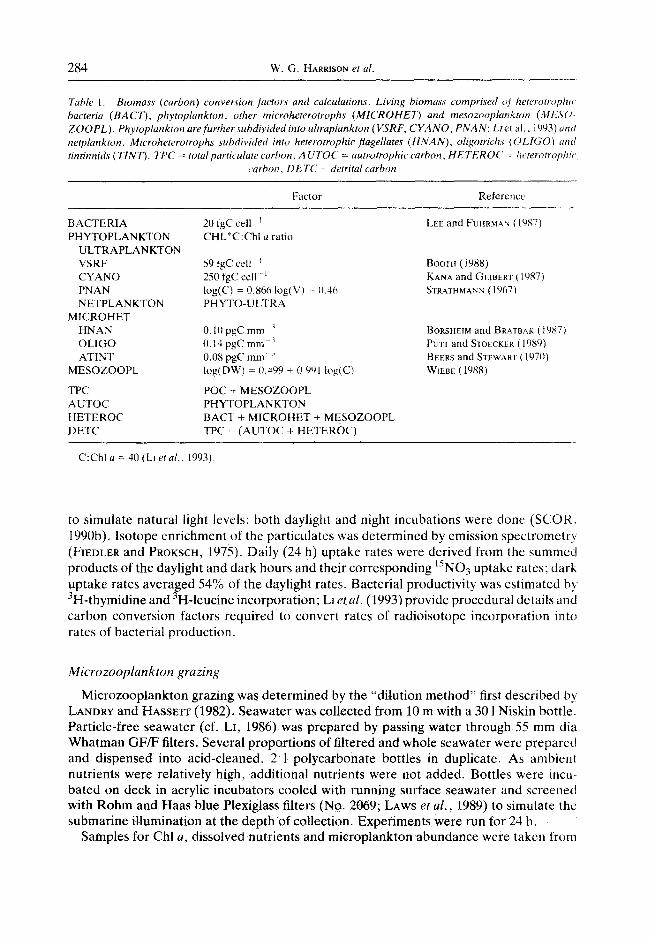
To facilitate comparison of stocks among the various plankton groups investigated, abundance estimates were converted to carbon biomass using established relationships based on either C/cell and C/cell volume (Table 1). For "total" phytoplankton, based on Chl a levels, a conversion factor of 40 (C : Chi a) was used. LI et al. (1993) discuss the rationale for the selection of this factor.
Phytop lank ton and bacterial product ivi ty
Primary productivity was measured by the 14C method employing m situ incubations (SCOR, 1990b). Samples were collected daily at the time-series stations before dawn from 11 depths in the upper 100 m using 12 1 Niskin bottles. Samples were recovered at sunset (-12 h later), filtered onto GF/F glass filters and processed for radioactivity analysis by liquid scintillation spectrometry. As in the case of Chl a, parallel samples were size- fractionated (post-incubation) on a number of occasions to assess the contributions of the <1 /~m and >1 #m size fractions to the total productivity. "New" productivity was estimated by the uptake of aSN-labeled nitrate (DUGDALE and GOERING, 1967). To 500 ml samples collected from 8-10 depths in the upper 100 m, 15NO 3 (99 atom %) was added at
10% ambient nutrient level and incubated on deck for 2-4 h in perforated screen boxes
284 w.G. HARRISON et al.
Table 1. Biomass (carbon) conversion ]hctotw and calculations. Living biomass comprised oj heterotrophw bacteria (BACT), phytoplankton, other microheterotrophs (MICROHET) and mesozooplankton (MESO ~ ZOO PL ). Phytoplankton are further subdivided into uhraphmkton ( VSRF, CYANO, PNAN; Llct al., 19931 and netplankton. Microheterotrophs subdivMed into heterotrophic flagellates (HNAN), oligotrictTs (OLIGO) and tintinnids (TINT). TPC = total particulate carbon, A UTOC = autrotrophic carbon, HETERO(" = heterotrophic
carbon, DETC = detrital carbon
Factor Reference
LEE and FUHRMAN (1987) BACTERIA PHYTOPLANKTON
ULTRAPLANKTON VSRF CYANO PNAN NETPLANKTON
MICROHET HNAN OLIGO ATINT
MESOZOOPL
TPC AUTOC HETEROC DETC
20 fgC cell I CHL*C:Chl a ratio
59 fgC cell t 25(I fgC cell " log(C) = 0:866 log(V) - {I.4~ PHYTO-ULTRA
0.10 pgC mm ~ 3 0.14 pgC mm- 0.08 pgC mm log(DW) = 0.499 + 0.991 log(C)
POC + MESOZOOPL PHYTOPLANKTON BACT + MICROHET + MESOZOOPL TPC - (AUTOC + HETEROC)
BOOTH (19881 KANA and GLIBERT ( 19871 STRATHMAN N (19671
BORSHEIM and BRATBAK (19871 Pu3~ and STOECKER (19891 BEERS and STEWARr(197(I) WIEBE(I988)
C:Chl a = 40 (kl et al., 1993).
to simulate natural light levels; both daylight and night incubations were done (SCOR, 1990b). Isotope enrichment of the particulates was determined by emission spectrometry (FIEDLER and PROKSCH, 1975). Daily (24 h) uptake rates were derived from the summed products of the daylight and dark hours and their corresponding 15NO3 uptake rates; dark uptake rates averaged 54% of the daylight rates. Bacterial productivity was estimated by 3H-thymidine and 3H-leucine incorporation; L~ et al. (1993) provide procedural details and carbon conversion factors required to convert rates of radioisotope incorporation into rates of bacterial production.
M i c r o z o o p l a n k t o n graz ing
Microzooplankton grazing was determined by the ',dilution method" first described by LANDRV and HASSErr (1982), Seawater was collected from 10 m with a 30 1 Niskin bottle. Particle-free seawater (cf. LI, 1986)was prepared by passing water through 55 mm dia Whatman GF/F filters. Several proportions of filtered and whole seawater were prepared and dispensed into acid-cleaned, 2 1 polycarbonate bottles in duplicate. As ambient nutrients were relatively high, additional nutrients were not added. Bottles were incu- bated on deck in acrylic incubators cooled with running surface seawater and screened with Rohm and Haas blue Plexiglass filters (No. 2069; LAws et al . , 1989) to simulate the submarine illumination at the depth of collection. Experiments were run for 24 h.
Samples for Chl a, dissolved nutrients and microplankton abundance were taken from

The western North Atlantic Bloom Experiment 285
all experimental bottles at the beginning and at the end of incubations. We also ran true controls (100% filtered seawater) to monitor leakage and subsequent growth of auto- trophic cells during incubation (LI, 1990); these were also treated in a similar manner as the experimental bottles. We did not detect any Chl a, assayed by fluorometry, in the filtered seawater before or after incubation, nor did we detect the presence of autotrophic cells by light microscopy.
Microzooplankton were enumerated as described earlier. The growth rates of phyto- plankton and grazing rates on them were calculated as described in previous work (PARANJAPE, 1987, 1990).
Mesozooplankton grazing, defecation and excretion rates
Daily pigment defecation rates were calculated for individual copepod species or groups of species by measuring gut evacuation rates in incubation experiments, using copepods either >505 ~m or between 200 and 505/~m, in filtered seawater every 4 h for 24 or 48 h. Initial rates in these experiments were averaged over either night or daytime periods, if the two were different. They were then summed over the densities of individual species or groups of species in the mixed layer of the water column during either the night or the day to give community nighttime, daytime and hence 24 h pigment defecation rates.
Community carbon defecation rates were derived from community pigment defecation rates by measuring the carbon-pigment ratio in fecal pellets collected from copepods (>505/~m), which had fed in situ and which were allowed to defecate for 3 h in filtered seawater (SCOR, 1990b). The fecal pellet collection experiments were carried out during the day and at night, but no substantial differences were seen in the ratio at different times of day, so that only one carbon-pigment conversion factor was used: factors were - 170 at 40°N and -300 at 45°N.
Grazing rates were estimated from defecation rates as follows. Firstly, the fraction of ingested pigment, which was destroyed during passage through copepod guts, was measured. This was done either by looking at total pigment budgets during in vitro grazing experiments, using copepods which had been starved for 12 h prior to feeding, or by comparing ratios of pigment to a conservative tracer (biogenic silica, CONOVER et al., 1986) in food and feces in these same feeding experiments. Ratios of pigment-silica in pellets from copepods, which had fed in situ, were also compared with those of particulate material in the water column to demonstrate that the in vitro results were consistent with apparent degrees of pigment destruction in situ. Using median values for these estimates of the degree of pigment destruction ( -50-70%), pigment grazing rates were calculated. Equivalent phytoplankton carbon grazing rates were then calculated from these by using the appropriate C:Chl a conversion ratio (i.e. 100:1).
Excretion rates were measured in the same time-course incubation experiments in which gut evacuation rates were measured. Ammonium concentrations were measured in seawater from which copepods had been screened, using the method of 8OLORZANO (1969). The time courses of ammonium accumulation were fitted to curvelinear plots (HEAD e t al., 1988) and the initial rates were used together with estimates of the total numbers of copepods in the incubations to give "average individual" excretion rates. These were converted to daily community rates by multiplying by the total copepod densities (similar to the method used above for community defecation rates, except that the contributions of individual species could not be evaluated).

286 w . G . HakmSOY et al.
Sediment traps
Free-floating sediment traps of the MULTI-TRAP design (KNAUER et al., 1979) were deployed at the beginning of each time-series station and followed for the duration of the station work. Four trap tubes were positioned at each of three depths: 150,250 and 500 m ', recoveries were after 163 h at 40°N and 92 h at 45°N. Trap contents were pooled for a particular depth and analysed for POC, PON and pigments (Chl a, phaeopigments) after "swimmers" were removed. Only results from the 150 m traps will be discussed.
R E S U L T S
N-S transect
The continuous record of in vivo fluorescence and salinity/temperature from the ship!s seawater intake system revealed a number of interesting features in the N-S transect (Fig. 2). Most prominent were: (1) strong property transitions, particularly at ~37°N, (2) maximum surface fluorescence in the 40--45°N region, and (3) marked variability in properties in the region of the 40°N time-series station compared with the 45°N station; fluorescence and temperature were highly (inversely) correlated. Although not as well resolved spatially, seven hydrographic stations occupied along the transect provided a
Fig. 2.
2 2
2(I ~ :3
E
r-
14
12 3 2
~.8
- 3
-~ - 3 . 4
- 3 . 6 ,./
3 . 8
_4 ¸
t F ~ t
3 5 38 41
^
J
i 1 ,, ~ r~
/
4 4 4 7
3 2 35 3 8 41 4 4 4 7
Latitude (N)
Continuous tracers of sea surface temperature and relative fluoxescence a l o n g N - S
transect of the western N A B E .

The western North Atlantic Bloom Experiment 287
Fig. 3.
'ill 0 0 I I I I I ' I I I
5O g
l O 0
1 5 0 -
20(1
:?IS , :itra:e , ,f/~<~l
5 0 -
x: 100 -
1 5 0 -
2 0 0
Chlorophyll a
I I I I I I ~ - - ! - ~ i I
5 0
az 100
1 5 0 -
J
Salinity
2 0 0 I I
3 2 3 4
O
Anomaly J l I I I I " ~ I
3 6 3 8 4O
Latitude (N)
,! ) o~ , ~ ) f !
4 2 4 4 4 6
Contour plots of temperature (°C). nitrate (mmol m 3), Chl a (mg m 3) and salinity anomaly from CTD casts along N-S transect of the western N A B E .
more complete (three-dimensional) picture of the N-S hydrography, nutrient and phyto- plankton biomass fields (Fig. 3). Noteworthy were similarities in N O 3 and temperature distributions, showing a - 3 8 ° N transition clearly through the 200 m depth contour, and the relationship between the Chl a distribution and NO3. Maximum N-S gradient in Chl a concentrations coincided with the surface "outcropping" of the 18°C isotherm and the 1 mmol m 3 NO3 contour ( - 3 8 ° N ) ; highest recorded surface Chl a concentrations (at - 4 0 and - 4 5 ° N ) coincided with surface depressions in NO3 concentration. Note that the apparent latitudinal differences in the property transition zones in Figs 2 and 3 (i.e. 37 vs

288 W.G. HARI~ISON et al.
38°N) originated from the software used to contour the data in Fig. 3. The location indicated in Fig, 2, therefore, is probably more accurate.
A T - S analysis of the transect data was made using ARMI and BRAV'S (1982) algorithm for western North Atlantic water to help characterize the water mass composition, particularly at the sites of the two time-series stations (Fig. 3). Two important features were revealed from this analysis: firstly, the ~38°N transition was clearly evident, and secondly, a very strong negative salinity anomaly was seen in the near surface water~ (<100 m) centered at 45°N. The large negative salinity anomaly is characteristic of waters originating from the Labrador shelf, some 1500 km to the west (J. LAZIER, personal communication),
Time-series stations
Small scale variability in chemical and biological properties was apparent over the course of the week long studies at both time-series stations, although the general vertical structure persisted (Figs 4 and 5). Integrated Chl a (0-50 m) tended to decrease with time at both stations; integrated NO3 concentrations showed no clear temporal pattern at 40°N but tended to decrease with time at 45°N. LI et al. (1993) discuss changes in ultraplankton and bacterial populations at the time-series stations. Other components of the plankton were not sampled frequently enough to discern temporal trends.
Temperature , density and NO 3 profiles indicated a weak mixed-layer in the upper 25-40 m (Fig. 6). Biological consumption of NO3 at both stations was significant but not complete since surface concentrations were still - 2 mmol m -3 (maximum wintertime concentrations - 1 0 mmol m-3: GLOVER and BREWER. 1988). Similarities also were seen in the magnitude and vertical distribution of phytoplankton biomass (Chl al and primary productivity at the two stations although the Chl a layer extended somewhat deeper al 45°N than at 40°N (Figs 4.5 and 7). Primary productivity profiles indicated a euphoric zone of - 5 0 m at both stations. Surface Chl a levels (~2 mg m -3) and column productivitie~ (~1 g C m -2 day - 1) were indicative of oceanic bloom conditions.
Beyond these similarities, the stations differed considerably with regard to other physical/chemical and biological properties. The most notable difference in the chemistr~ of the two stations was the near surface depletion of silicate at 45°N. which had not occurred at the more southerly station (Fig. 8), suggesting that diatoms were a morc important component of the phytoplankton at the northerly station. Indeed. pigment analysis and floristics supported this view. HPLC pigment analysis showed the prevalence of diatom pigments at 45°N. while the 40°N analysis revealed a mixture of pigments found at 45°N and at the southerly most station at 32°N. but not at both (Fig. 9). Microscopic analysis revealed that diatoms were approximately an order of magnitude more abundant at 45°N than at 40°N, dominated by Rhizosolenia sp., Fragilariopsis sp., Thalassionema sp., Thalassiosira sp. and several species of Nitzchia.
At both stations, major components of phytoplankton identified by light microscopy were diatoms, dinoflagellates, prymnesiophytes, cryptophytes and chlorophytes. Near- surface samples contained filaments of Oscillatoria sp., presumably broken away from bundles or mats, but these could not be enumerated with precision. A! 40°N. phyto- ptankters ranged from 4 x 10⁴ to 2 × 10⁵ t -~ in the upper 50 m. Dinoflagellates and prymnesiophytes were dominant numerically with dinoflageUates accounting for >70% of the phytoplankton carbon biomass in the upper 100 m (Fig. 10). Despite the relatively

The western North Atlantic Bloom Experiment 289 250 • ° • o
Nitrate -
0 I ,~ t
100l f I : / X ~ 0 24 48 72 96 120 144
120 t °
"1 Chlorophyll a "" "" ?
'211 100 I - - I - - l ~
0 24 48 72 96 12f} 144
Time on Station (h)
Fig. 4. Near surface nitrate and Chl a concentrations at the 40°N time-series station. Contoured values in units of mmol m 3 and mg m 3, respectively; scatter points are integrated values (0-50 m)
in units of mmol m - 2 and mg m -z, respectively.
greater importance of diatoms at 45°N (see above), dinoflagellates, prymnesiophytes, and cryptophytes still dominated numerically. Dinoflagellates, in fact, contributed >80% of the estimated carbon biomass of the phytoplankton community.
Station differences also were apparent in the size distribution of the bulk Chl a and pr imary productivity. More than 80% of the Chl a and productivity were associated with plankton >1 ,um at 45°N; the percentage was significantly lower (40-69%) at 40°N (Fig. 11). A more detailed investigation of the distribution and abundance of the ultraplankton (<10/~m) was carried out using microscopy and flow cytometry (LI et al., 1993). Three major groups were differentiated based on size and pigment composition: very small red- fluorescing cells (VSRF) of which the prochlorophytes are a member , cyanobacteria (CYANO) and photosynthetic nanoplankton (PNAN) (see Table 1). Vertical distri- butions of the ul traplankton (i.e. the sum of cyanobacteria, PNAN and VSRF cells)

290 W.G. HARRISON et al.
2 5 0 q ~ . . . . . . . o o .
d Nitrate "
i - " " / J ' [, \ . . . . . . . "
2{
~i 4(
x :
24 ;g
1 O{
0 ?2 9 0 I 2(! 14-;
Fig. 5.
12{I t " . >
~ Chlorophyll a 0 - 1 . . . . . ~ . ~ - : : : - . - ~ X N - / 7 . . . . . . . . . . ~ . . . . . - " \ "~
. . . . . . . . . 3 5 ; . . . . - -
6 ~2---- ~ . . . . . . . . . ..." "" \ ~ / "---._~ , .....
gO - " -
45 N " ">. I(XI -
2a x .... I ? 1 1,:
Time on Station (h)
Near surface nitrate and Chl a concentrations at the 45°N time-series station, I,nits as m F'ig. 4.
paralleled those of the bulk Chl a; highest levels were found in the upper - 5 0 m (Fig. 12) Ultraplankton carbon biomass at both stations was dominated by the nanoplankton, followed by the cyanobacteria and VSRF. Biomasses summed and compared with estimates based on Chl a showed that the ultraplankton accounted for virtually all of the phytoplankton biomass at the 40°N station but only about half at 45°N. [ J e t al. (1993) provide a more detailed analysis of the ultraplankton at these stations.
Heterot rophic bacteria were abundant at both stations (max: 2 × 10⁹ cells 1 t Ll et al, ,
1993). Vertical biomass distributions were similar to those of phytoplankton, i.e. maxi- mum levels in the upper - 5 0 m (Fig. 12) although depth gradients were less pronounced, Bacterial carbon production in the upper 100 m represented only a small fraction ( - 12%) of the photosynthetic production at 40°N but made a much larger contribution (35-80%) at 45°N (see L~ et al . , 1993, Table 2).

The western North Atlantic Bloom Experiment 291
NO 3 (mmol ~3) 0 I
TEMP (C) 10
20
40
60
80_
Fig. 6.
100
26
2 4 6 8 10 I I I I I
l l 12 13 14 15 I . I I I
/
' :(:! ,] I I I ~ I
26.2 26 .4 26.6 26.8 27
0 2 4 6 8 10 I I I I I I
10 I I 12 13 14 15
2 0 -
4 0 _ ,,
6 0 . : - . : \ £ .
80. : K :,
100. 26 26.2 26.4 26.6 26.8 27
Sigma-T Sigma-T
Vertical profiles of temperature (7"), density (o 0 and nitrate (NO3) at the two time-series stations (40°N, 45°N); mean values (horizontal bars = ± 1 S.D ).
T h r e e g roups of m i c r o z o o p l a n k t o n were examined : h e t e r o t r o p h i c nanof lage l l a tes ( H N A N ) , o l igot r ichs ( O L I G O ) and t in t inn ids (T IN T ) . Numer i ca l a b u n d a n c e and ca rbon b iomass of all t h ree g roups p e a k e d in the u p p e r 50 m like p h y t o p l a n k t o n and bacter ia• The a b u n d a n c e of H N A N was abou t 1 x 10⁶ 1 - t at bo th s ta t ions , and the i r ca rbon b iomass r anged f rom 1 to 6 mg C m -3 in the mixed layer (Fig. 12). Mos t H N A N were in the size range 2-5 ,am. Ol igo t r ichs and t in t innids were genera l ly m o r e a b u n d a n t at the sou the rn stat ion• Ol igo t r i ch a b u n d a n c e r anged f rom 1 x 10³ to 5 x 10³ 1 1 at 40°N and 1 x 10³ to 9 x 10³ 1 1 at 45°N. T in t inn ids c o n t r i b u t e d l i t t le to n u m b e r s or b iomass at 45°N, while at 40°N they r anged f rom 3 x 10² to 1.6 x 1031-1 . Ol igo t r ichs con t r i bu t ed most to the ca rbon b iomass at bo th s ta t ions ; howeve r , at the sou the rn s ta t ion thei r b iomass (4-15 mg C m ~) was a lmos t two-fo ld h igher than at the n o r t h e r n s ta t ion (2-8 mg C m - 3 ) . T in t inn id ca rbon at the sou the rn s ta t ion r anged f rom 1 to 3 mg C m - 3 in the u p p e r 50 m and was in t race am oun t s at the n o r t h e r n s ta t ion. Severa l sizes of o l igot r ichs of the gene ra Strombidium,
Lohmanniella, Tontonia and Halteria were p re sen t at bo th s ta t ions . Larges t d ivers i ty of t in t innid species was o b s e r v e d at the sou the rn s ta t ion. Species of the gene ra
Table 2. Mesozoopkankton carbon fluxes (retool m 2 day L)
40°N 45°N
% Prim. prod. % Prim. prod. Grazing: Carbon 4.71 5 9.14 9
Nitrogen 0.54 4 1.12 8 % Trap flux % Trap flux
Defecation: Carbon 2.08 10 13.84 104 Nitrogen 0.23 9 1.54 73
% NH4-uptake % NHa-uptake Excretion: Nitrogen 0.19 2 0.31 4

292 W.G. HARRISON et at.
(I 0
20
4 0
60
8(}
Chlo rophy l l a (rag m 3)
4 0 N
1 O0 I &, ,
{I 0.05 II. l O. l 5
Nil (retool m ;) 4
0 2
2 0
4 0
60
8 0
1 0 0
0
C h l o r o p h y l l a ( m g m ~ )
1 2 ~
- S ! l
);
' O ' i
O. 1 0 2 (13
NH (retool m
4 5 N r
0 4 ~!.";
20
~" 4 ( I -
60
8(1 -
3 Pr im. Prod. ( m g C m
2(1 4() 6tJ
/ #
j J
/ f~
/
0 0- - -
1 .07 g C m - ' d I
2fl
4 0 -
6 0 -
8(b
100 100
P r i m . P r o d . ( m g C m d ~i
20 40 60
/ . t ~ ' /
l j J ~"
1 .16 g C m 2(] 1
Fig. 7. Vertical profiles of Chl a and pr imary product iv i ty at the two t ime-ser ies station~: mean values (hor izonta l bars = t l S .D.) . Dashed lines in uppe r panels are m e a n a m m o n i u m (NH~) concentrations: values in lower panels are mean primary productivities integrated over the
e u p h o t i c zone .
Ascampbelliella, Protorhabdonella, Amphorella, Codonellopsis, Eutintinnus, Climacocy- lis and Salpingella were most common, while at the northern station species of the g e n e r a
Parafavella and Acanthostomella were present in small numbers. Microzooplankton grazing, measured by the dilution method at the beginning and at the
end of the time-series station at 40°N, remained virtually unchanged. The grazing coefficients were 0.21 and 0.23 day-- 1 on the two experimental days and 0.34 d a y t at 45°N This level of grazing activity represents 20% removal of the standing stock of Chl a/day or

The western North Atlantic Bloom Experiment 293
Fig. 8.
"6 E
6
5
4
3
2
1
0 -- ~--~ 0 2
40N o~O~o~
, "~ 45N
• 8 "
i"
[ I
4 6 I I I q
8 10 12 14
Nitrate (mmol m ~3)
Silicate versus nitrate plots from the two time-series stations: data from the upper 100 m. Dashed lines arc linear least-squares fits.
50% of the pr imary production per day at the southern station and 24 and 88% at the northern station, respectively. If a linear grazing response is assumed (see GALLEGOS, 1989), the phytoplankton growth rates ranged with 0.4 to 0.7 doublings day -1, consistent with independent estimates for the ul t raphytoplankton growth made during the same study (LI et al., 1993).
Mesozooplankton carbon biomass levels were similar at both time-series stations with maxima observed in the upper 100 m; day/night variations were prominent (Fig. 13). Shallow water maxima were evident during the day and night at 45°N, but only at night at 40°N. Mesozooplankton at the more northerly station were dominated by the boreal Calanus finmarchicus, whereas warm water, oceanic species such as Euchirella sp. were more common at 40°N. Metabolic measurements suggested that mesozooplankton grazing was an insignificant loss term for phytoplankton at both stations, representing < 10% of the pr imary production (Table 2). Mesozooplankton N H 4 excretion could have met only a small fraction (2-5%) of the N H 4 requirement of the primary producers.
Particulate carbon export at 150 m (sediment traps) represented - 2 4 % of the primary production at 40°N and - 1 4 % at 45°N (Table 3). Fecal pellets represented a significant fraction of this flux at the 45°N station (Table 2). "New" production in the upper 50 m based on lSN uptake measurements was approximately two times greater than the 150 m sediment trap N flux but were similar when sediment trap fluxes were extrapolated to the depth of the photic zone, - 5 0 m (Table 3). Decreases in near surface NO3 concentrations over time also were used to estimate new production (Figs 4 and 5); net changes were undetectable at 40°N, but NO 3 disappearance at 45°N was comparable to the 15NO3 uptake estimates (Table 3).
DISCUSSION
The spring bloom
Phytoplankton biomass and productivity levels and near surface nutrient distributions suggested that the spring bloom was well underway at both time-series stations. The

2 9 4 w . G . HARRISON et al.
Fig. 9.
50] 4O Diatoms
30
,0 ! ! t " 0 I I I [ ~ t [ I I
5O } 1 4 0 N
22) 30 1
° N > 20 i Dinoflagellatcs
I0 [ ~ 1
0 ~ F ~ r ~ ' ~ = F ~ I ~ = ' ~ ' ~ , ~
5o ]~ 3 2 N 4O
30
20
,o-td 0 r ~ F
5 z
C3, anobacleria Pryrnnes~hytes ~ Prochlor~phytes
, . , illm;|,1
a
HPLC pigment analyses from the two time-series stations and the southernmos! transect station (32°N),
Table 3. Export fluxes (mmolin z da5 t)
Sediment Pnew (15N) dNO3/dt Trap C-Flux /:ratio trap (150 m) f(0-50 m) f(0-50 m) (% Prim. Prod. ) (I~N)
45°N Carbon 13.3 Nitrogen 2. I 4.6 -5.b; Diel migrant N-flux 0,21
4(I°N Carbon 21.6 Nitrogen 2,5 4.5 n.d. Diel migrant N-flux 0.26
26%* (5(/m) (I.32 14')o (15(I m)
38%* (50 m) !~ 3~ 24% ( 15(I m)
*Extrapolated value using normalized power function (MARTIN et al., 1987). n.d. = Not determined.

The western North Atlantic Bloom Exper iment 295
e',
Phytoplankton (mgC m3) 0 1 2 3 4 1 I
1 5 ~ ' ~ l 40N 10] t ~71
20~ t ~ l l 2 5 ~ I I , , . 30 I [ I 40 35 4 50
50 1 CRYPTO 70 6 I 75
8 0 [ ] D I A T 8 5 90
90 [] DINO 95 10 10
I I I I
Phytoplankton (mgC m3) 0 5 10 15 20 25 30
I I I I 1 . . . I
a 45N ill
3 0 J _ _ L~ UI
Fig. 10. Vertical profiles of the major phytoplankton groups identified by light microscopy at the two time-series stations, expressed as carbon biomass; chlorophytes ( C H L O R O ) . cryptophytes
(CRYPTO) , prymnesiophytes (PRYMNES) , diatoms (DIAT) and dinoflagellates (DINO).
limited experimental work at these stations ( -1 week) was not sufficient to construct a clear picture of the temporal stage of the bloom at the time of sampling. Moreover, large- scale advection as evidenced by salinity anomaly analysis complicated interpretation of temporal evolution of water masses for the particular geographic regions of the time-series stations. Recent studies in the eastern and western North Atlantic, however, have provided a reasonably good picture of the latitudinal and temporal patterns of spring bloom development (SxRASS and WOODS, 11988; SIEGEL et al., 1990; F~ZEL and BERBER- Ia~, 1990), showing a poleward migration beginning in early spring (February/March) in the southern latitudes and late summer (July/August) at high latitudes. Based on historical CZCS data, maximum spring bloom development at our study site should have occurred during the March-May period, the timing being somewhat earlier at the 40°N than at 45°N (Fig. 14). Bloom development at the major study site in the eastern Atlantic (47°N) should be later (June) based on the satellite color data although the 1989 experimental data did not show this apparent time lag (SCOR, 1990c), suggesting that bloom progression at similar latitudes in the eastern and western Atlantic appeared to be comparable.
Biomass partitioning
Particulate organic carbon partitioning based on the plankton groupings discussed in this paper (see Table 1) revealed that the major component in the upper 100 m was apparently non-living (i.e. detritus: - 60%) at both time-series stations, with the balance equally divided between planktonic heterotrophs (bacteria, micro and mesozooplankton) and autotrophs (pico, nano and microphytoplankton; Fig. 15). Of the living component, similar proportions of zooplankton ( -10%) and bacteria ( -30-40%) were found at the two time-series stations. They differed, however, with respect to the phytoplankton size groups; the ultraphytoplankton (<10 urn) dominated at 40°N and the larger phyto- plankton (>10/~m) were more important at 45°N. Because potentially important corn-

296 w.G. HARRISON et at.
0 0
20
40
60
80
100
C H L ( % > I urn)
20 40 60 80
o o o
oo o
o oo
o o o
4 0 N
I00 ! 0
20
40
60
80
100
CI - - IL(%>lum)
20 40 60 I I I
4 5 N
80 lO0
cJ)o
G
0 0 0
0
20
~ 40
e~
~ 60
80
F i g . 11 .
P r i m . P rod . ( % > l u m )
,20 40 60 80 I o l v ~ u
o o or)
o o o o
o o o o
o o o o
o o o
o
10G
100 I 0
20
40
60
80
1 O0
P r i m . Prod. ( % > l u r e )
20 40 60 80 ~00 I I I L w 'ty ......
o c
o o
o o
o o
V e r t i c a l p r o f i l e s o f s i z e - f r a c t i o n a t e d C h l a a n d p r i m a r y p r o d u c t i v i t y f r o m r c p e a t c d
s a m p l i n g s a t t h e t w o t i m e - s e r i e s s t a t i o n s ; % r e t a i n e d o n 1 : ~ m f i l t e r s ,
ponents of the microzooplankton were not considered in this analysis (i.e. the heterotro- phic dinoflagellates and microzooplankton in the -50-200/zm size range), the relative contributions of heterotrophs to the living biomass and living biomass to the total particulates were probably underestimated.
P h y t o p l a n k t o n
Contrary to the traditional characterization of the spring bloom dominated by large phytoplankton, principally diatoms (ROBINSON, 1970; PARSONS and LALLI, 1988), the nanoplankton and picoplankton were important components of the phytoplankton assem- blages at both time-series stations; at 40°N the ultraphytoplankton, particularly the nanoplankton, accounted for virtually all of the phytoplankton biomass (LI et al . , 1992.

The western North Atlantic Bloom Experiment 297
Ultraplankton (mgC m 3)
0 10 20 30 40 50 60 70 80 0 L ~1 I I. I I I I~ I 0
VSRF 20 _~ {5 ~BACT ? 20
.-~"~ 40 t ! / ~ N AN 40
~" 60 60
8{} ~ 4 0 N 80 ,00J . 100
Microzooplankton (mgC m3)
0 5 10 15 20 0
50
100
150
200
g
50
100
Ultraplankton (mgC m-3)
10 20 30 40 50 60 o I I I ~ .~ I I
6
l 45N
Microzooplankton (mgC m-3)
0 2 4 6 8 10
T | N T ~ . i ""
~ OLIGO
_~ ~) l ." H N A N
150
200 Fig. 12. Vertical profiles of ultraplankton (top panels) and microzooplankton (lower panels) at the two time-series stations, expressed as carbon biomass. Ultraplankton comprised of heterotro- phic bacteria (BACT) and autotrophs, including "very small red-fluorescing cells" (VSRF), cyanobacteria (CYANO) and photosynthetic nanoplankton (PNAN). Microzooplankton com- prised of heterotrophic nanoflagellates (HNAN), tintinnids (TINT) and oligotrichous ciliates
(OLIGO).
1993) and most of the pr imary productivi ty. Half or more of the biomass and product ivi ty were at t r ibutable to these small forms at the more nor ther ly stat ion (45°N), with the balance at t r ibutable principally to diatoms, dinoflagellates, p rymnes iophytes and crypto- phytes. Of these larger phy top lank ton , dinoflagellates accounted for most of the est imated ca rbon biomass (70-80%) at bo th time-series stations. The dominance of dinoflagellates was unexpec ted at 45°N since o ther lines of evidence pointed to the s trong influence of dia toms (i.e. the deplet ion of silicate in surface waters, prevalence of fucoxanthin in

298 w.G. HARRISON et al.
e~
100
2 0 0
300
400
500
Mesozooplankton (mgC m'3) Mesozooplankton (mgC m-311
o + - - [ °:--°
- " ' o
- ~- /~ 40N
0.2 0.4 0.6 08 1 1.2 0 0.2 0.4 0.6 0.8 I 1.2 L . . . . . 5 _ . _ _ ~ _ J . . . . . . . . ± ....... 0 _ l _ _ _ _ ~ t _ _ _ _ ~ _ i _ _ _ I k . . . . . . . . J
IO0 ( 0 . 2 - 1 . 0 m m )
200 I ' o I & .
300 " )¢)
i
4 0 0
5oo 4 5 N
0 2 4 6 8 0 2 4 6 8 0 l ........... 1 ...... .-2 ............ ,r- l [ .......... L ............ J
100 101J I>l .0 mm)
g 200
300 300 " e
400 41tll ~ ' ~ ,
500 i i 50O
Fig. 13. Vertical profiles o! mesozooplankton at the two time-series stations, sorted by siz,_': ft.2-1.0 mm (upper panels), >1.0 mm (lower panels) and expressed as carbon biomass Open
circles/dashed lines = daylight tows: closed circles/solid lines = night tows.
pigment analyses); surface silicate depletion also was noted in the eastern NABE study (J . MARRA, personal communication). This apparent inconsistency could be explained if many or most of the dinoflageilates were heterotrophic rather than photoautotrophic. From our preserved samples, it was not possible to distinguish between autotrophic and heterotrophic dinoflagellates with light microscopy. The major genera present at both stations were Ceratium, Dinophysis, Prorocentrum, Gymnodinium, Gyrodinium, Oxy- toxum, Polykrikos, Protoperidinium and Zygabikodinium. Many species of these genera are known to be heterotrophs or facultative heterotrophs (LESSARD, 1984; GAINES and ELBRACHTER, 1987). Most species of Gymnodinium, Gyrodinium, Oxytoxum and Proto- peridinium were <20/~m in diameter and were distributed throughout the water column. Some larger athecate species had diatoms, other dinoflagellates and unrecognizable inclusions in their food vacuoles. We conclude that a significant proportion of this

The western North Atlantic Bloom Experiment 299
4
3 -
I I I I I I t I I I I
60N 20W
CZCS Pigments (Monthly Means, 1979-86
4 I I t I I l I I I I I
3 - E
v 2 -
c
._m 0- 1
45N 41W
oO O Ooo o I I I I I I I I I I I
1 2 3 4 5 6 7 8 9 1011 12
'E
2 - E
,O} a. 1
0
I I I I I I I I I t I
40N 47W
I I I I I I I t I I t
1 2 3 4 5 6 7 8 9 1011 1
Month
2 -
1 2 3 4 5 6 7 8 9 1 0 1 1 1 2
4
3
2-
1
0
I I I I r I I { I 1 I
47N 20W
I I I I I I t I I
1 2 3 4 5 6 7 8 9 10 12
4
3
2 -
1
0
I I ] l l l l J l l l
34N 20W
1 1 1 1 1 1 1 1 1 1 1
1 2 3 4 5 6 7 8 9 1 0 1 1 1
Month
Fig. 14. Temporal variations in near surface pigment concentrations for eastern and western NABE study sites derived from CZCS ocean color data. Monthly mean values (1979-1986) for 1 ° squares based on analysis of grey-scale (GS) data and derived from the relationship:
Pigment concentration = l0 (GS-I 1~ 51/83 3
community was heterotrophic and that diatoms, indeed, played a more important role in the autotrophic metabolism at 45°N than apparent from estimates of phytoplankton carbon biomass. HPLC pigment analysis also supported this view; peridinin, a major carotenoid pigment of photosynthetic dinoflagellates was present in relatively small proportions at the two time-series stations, but particularly so at 45°N.

300 w . G . HARRISON et al.
4 5 N
E AUTO ~ 0 DETRITUS
4 5 N 4%
MESOZ MICROZ PHYTO>10 PHYTO< II 1 BAUF
/ /
\ \,
4 0 N 4 0 N 3%
Total Particulates Living Biomass Fig. 15. Partitioning of particulate carbon into detrital and living (planktonic) components for the two time-series stations, Values (g C m -'~) and percentages based on mean water column
integrated values (0-100 m). See Table 1 for computat ional details and definitions.
Bacteria
The spring phytoplankton bloom supported a significant bacterial biomass and activity at both time-series stations. In the upper 100 m, bacterial production was 12-39% of the primary production. If we assume bacterial growth efficiency to be 50% (COLE eta[.. 1988), then there was an implied bacterial carbon demand (production + respiration) of 24-78% of the primary production, with the higher values found at the more northerly site. Li et al. (1993) have noted that these levels of bacterial demand are equal to or higher than previously published values. Bacterial biomass, although large, did not dominate the phytoplankton in the euphoric zone (<50 m) but did exceed phytoplankton biomass below that depth. For that reason, bacterial activity (i.e. nutrient regeneration) may have contributed to the unexpectedly high NH4 concentrations seen below the Chl a maximum layer at both time-series stations (Fig. 7). A similar but much more pronounced subsurface N H 4 maximum was observed at the 47°N, 20°W site (C. GARSIDE, personal communi- cation).
Micro- and mesozooplankton
Microzooplankton represented the largest sink for primary production at both time- series stations with grazing losses equivalent to 50-88%/day, the largest fraction occurring at the more northerly station. This is certainly consistent with the emerging view that

The western North Atlantic Bloom Experiment 301
microzooplankton, particularly the protozoa, play a major role in the cycling of carbon and other nutrients in the surface ocean (e.g. REID et al., 1991). Because the abundance of the microzooplankton decreased with depth to a lesser degree than did the phytoplankton (as in the case of the bacteria), it is likely that microzooplankton nitrogen excretion also contributed to the development of the subsurface NH4 maximum observed at both time-series stations as discussed previously. One outstanding question remaining relates to the specific contribution of heterotrophic dinoftagellates to the microzooplankton stand- ing stock, their metabolic activity and role in carbon cycling during the bloom. Future studies should focus on those aspects of dinoflagellate biology.
Mesozooplankton metabolic activity (grazing, NH4 excretion) had an insignificant impact on primary productivity at either of the time-series stations. Grazing losses represented <10% of the daily production, a figure similar to that found at the JGOFS 20°W site (MORALES et al., 1991) and of the same magnitude found during the spring bloom in other north temperate latitude studies (e.g. D A ~ et al., 1982; BAARS and FRANSZ, 1984). As was the case for grazing, mesozooplankton NH 4 excretion contributed little (<5%) to the phytoplankton demands at the time-series stations as has been found in other spring bloom studies (e.g. DAcc etal . , 1982; BAMSTEDT, 1985). If, on an annual time scale, mesozooplankton are more important grazers and nutrient recyclers than our results suggest, then phytoplankton and mesozooplankton production cycles in the North Atlantic are not well "phased" during the spring bloom, as PARSONS and LALLI (1988) previously pointed out. The extensive continuous plankton recorder (CPR) data for the North Atlantic also support this view (COLEBROOK, 1979). Temporal mismatch in producer-consumer cycles was apparently not a consideration with regard to the micro- zooplankton (see above). Fecal pellet production at the 40°N station contributed - 10% to the particulate organic C and N flux to sediment traps, consistent with mesozooplankton grazing of primary producers. At the 45°N station, however, pellets accounted for virtually all of the trap flux, suggesting that carbon and nitrogen sources other than phytoplankton constituted a major portion of the mesozooplankton diet. High fecal pellet contributions to sedimenting organic matter despite low grazing impact on primary producers is not an uncommon occurrence in subtropical oligotrophic waters (e.g. SMALL et al., 1983, 1987), but has been less commonly observed during spring bloom conditions at temperate latitudes (BATHMANN et al., 1987; SMETACEK, 1980).
Export fluxes
Particulate organic carbon export at the base of the euphotic zone represented 26-38% of the daily primary productivity at the time-series stations, the higher value associated with the more southerly station (40°N). Particulate organic nitrogen fluxes from sediment traps (150 m) were lower by a factor of two than "new" production estimates based on 15NO3 tracer experiments and NO 3 disappearance in the euphotic zone but, as in the case of carbon, were comparable when extrapolated using the formulation of MARTIN et al. (1987) to the same depth horizon. 15N-based f-ratios were similar at the two stations (0.32-0.33) and consistent with f-ratios based on carbon fluxes (sediment trap flux/ primary productivity). BUESSELER et al. (in press) derived f-ratios of the same magnitude (0.29-0.46) from 234Th:238U disequilibria estimates at approximately the same time (24 April-30 May) at the JGOFS 20°W site (47°N). Model investigations of the seasonal plankton production cycle have yielded similar f-ratios for the spring growth period

302 W.G. HARRISON et al.
@ratio: ~0.20-4).40; FASHAM etal., 1990; see also YENTSCH, 1990). An additional nitrogen export term, associated with mesozooplankton diel migration, which has been found to bc significant in some ocean regions (LONGHURST and HARRISON, 1988), was small (i. e. -,~ 10'~,; of sediment trap fluxes) during the western NABE (Table 3).
S U M M A R Y
The spring bloom in the western North Atlantic was well-developed during the Canadian NABE investigation. 20 April-18 May 1989. Processes studies concentrated on two sites (40°N, 47°N: 45°N. 41°W) along an extended N-S transect (32-47°N) where bloom development was maximum. The two time-series sites were similar with regard to various biological properties including: bulk Chl a. primary productivity, zooplankton biomass and activity and the general vertical structure of the plankton communities (bacteria, phytoplankton and zooplankton). Dinoflagellates dominated the biomass of the netplankton at both sites but may have been largely heterotrophs.
The time-series sites differed markedlv, however, in other properties (c.g. water chemistry, plankton community size structure and composition). Surface silicate depletion was evident at 45°N but not at 40°N, consistent with the relatively greater importance of diatoms at the more northerly site. Ultraphytoplankton (< 10~m) were dominant at 40°N, accounting for virtually all of the Chl a biomass: at 45°N the ultraphytoplankton comprised ~50% of the biomass. Bacterial biomass and production were important at both sites, bu~ most significant at 45°N where bacteria comprised ~30% of the total plankton biomass0 and bacterial production and respiration demand on primary productivity exceeded 75%. Microzooplankton grazing dominated phytoplankton losses (50-88% of the daily primar) production). Despite their small impact on phyt0plankton losses (via grazing), mesozoo- plankton fecal matter comprised the bulk of the organic carbon (and nitrogen) matter caught in sediment traps at 45°N. but not at the more southerly station. Export fluxes a~ measured by sediment traps accounted for 25-30% of the daily primary production. Mare of the general hydrographic, chemical and biological features described here were also observed in the eastern Atlantic study (20°W).
Acknowledgements--The authors thank Jeff Arming, Carla Caverhilt. Paul Dickic, Leslie Harris, Mark Hodgson, Cheryl LeDrew and AI MacDonald for expert technical assistance and Richard Outerbridge l t~ analysis of CZCS data. Dr Cynthia McKenzie helped in phytoplankton taxonomy.
R E F E R E N C E S
ARMI L. and N. A. BRAY (1982) A standard analytic curve of potential temperature versus salinity for the ,,~. cslcrn North Atlantic. Journal of Physical Oceanography, 12,384-387.
BAARS M. A. and H. G. FRANSZ (1984) Grazing pressure of copepods on the phytoplankton stock of the cenlrai North Sea. Netherlands Journal of Sea Research, 18, 120-142.
BAMSTEDT U. (1985) Seasonal excretion rates of macrozooplankton from tire Swedish west coast, Limnology and Oceanography, 30, 607-617.
BATHMANN U. V., T. T. NoJI, M. Voss and R. PE~NERT (1987) Copepod fecal pellets: abundance, sedimentation and content at a permanent station in the Norwegian Sea in May/June 1986. Marine Ecology Progrevs Series, 38, 45-51.

The western North Atlantic Bloom Experiment 303
BEERS J. R. and G. L. STEWART (1970) Numerical abundance and estimated biomass of microzooplankton In: The ecology of the plankton of La Jolla, California, in the period April through September, 1967, (Part IV), J. D. H. STRICKLAND, editor, Bulletin of Scripps Institution of Oceanography, Vol. 17, pp. 67-87.
BIDIGARE R. R., J. MARRA, T. D. DICKEY, R. ITURRIAGA, K. S. BAKER, R. C. SMITH and H. PAK (1990) Evidence for phytoplankton succession and chromatic adaptation in the Sargasso Sea during spring 1985. Marine Ecology Progress Series, 60, 113-122.
BLOEM J., M. B. BAR-GILISSEN and T. E. CAPPENBERG (1986) Fixation, counting and manipulation of heterotrophic nanoflagellates. Applied and Environmental Microbiology, 52, 1266-1272.
BOOTH B. C. (1988) Size classes and major taxonomic groups of phytoplankton at two locations in the subarctic Pacific Ocean in May and August, 1984. Marine Biology, 97,275-286.
BORSHEIM K. Y. and G. BRATBAK (1987) Cell volume to cell carbon conversion factors for a bactivorous Monas sp. enriched from seawater. Marine Ecology Progress Series, 36, 171-175.
BROWN O. B., R. H. EVANS, J. W. BROWN, H. R. GORDON, R. C. SMETH and K. S. BAKER (1985) Phytoplankton blooming off the U.S. East Coast: a satellite description. Science, 229,163-167.
BUESSELER K. O., M. P. BACON, J. K. COCHRAN and H. D. LIVINGSTON (1992) Carbon and nitrogen export during the JGOFS North Atlantic Bloom Experiment estimated from 234Th:23Su disequilibria. Deep-Sea Research, 39, 1115-1137.
CHISHOLM S. W., R. J. OLSON, E. R. ZETTLER, R. GOERICKE, J. B. WATERBURY and N. A. WELSCHMEYER (1988) A novel free-living prochlorophyte abundant in the oceanic euphotic zone. Nature, 334, 340-343.
COLE, J. J., S. F1NDLAY and M. L, PACE (1988) Bacterial production in fresh and saltwater ecosystems: a cross-system overview. Marine Ecology Progress Series, 43, 1-10.
COLEBROOK J. M. (1979) Continuous Plankton Records: seasonal cycles of phytoplankton and copepods in the North Atlantic Ocean and the North Sea. Marine Biology, 51, 23-32.
CONOVER R. J., S. ROY and R. WANG (1986) Probable loss of chlorophyll-derived pigments during passage through the gut of zooplankton, and some of the consequences. Limnology and Oceanography, 31,878- 887.
DAGG M. J., J. VIDAL, T. E. WHITLEDGE, R. L. IVERSON and J. J. GOERING (1982) The feeding, respiration and excretion of zooplankton in the Bering Sea during the spring bloom. Deep-Sea Research, 290, 45-63.
DUCKLOW H. W. (1989) Joint Global Ocean Flux Study: the 1989 North Atlantic Bloom Experiment. Oceanography, 2, 4-7.
DUGDALE R. C. and J. J. GOER1NG (1967) Uptake of new and regenerated forms of nitrogen in primary productivity. Limnology and Oceanography, 12,196-206.
EPPLEY R. W. and B. J. PETERSON (1979) Particulate organic matter flux and planktonic new production in the deep ocean. Nature, 282, 677-680.
ESAIAS W. E., G. C. FELDMAN, C. R. McCLA1N and J. A. ELROD (1986) Monthly satellite-derived phytoplankton pigment distribution for the North Atlantic Ocean Basin. Eos, 67, 835-837.
FASHAM M. J. R., H. W. DUCKLOW and S. M. MCKELVIE (1990) A nitrogen-based model of plankton dynamics in the oceanic mixed layer. Journal of Marine Research, 48,591-639.
F1EDLER R. and G. PROKSCH (1975) The determination of nitrogen-15 by emission and mass spectrometry in biochemical analysis: a review. Analytica Chimica Acta, 78, 1-62.
FRAZEL D. W. and G. BERBERIAN (1990) Distributions of chlorophyll and primary productivity in relation to water column structure in the eastern North Atlantic Ocean. Global Biogeochemical Cycles, 4,241-251.
GAINES G. and M. ELBRACHTER (1987) Heterotrophic nutrition. In: The biology of dinoflagellates, F. J. R. TAYLOR, editor, Blackwell Scientific Publications, Oxford, pp. 224-268.
GALLEGOS C. L. (1989) Microzooplankton grazing on phytoplankton in the Rhode River, Maryland: nonlinear feeding kinetics. Marine Ecology Progress Series, 57, 23-33.
GLOVER D. M. and P. G. BREWER (1988) Estimates of wintertime mixed layer nutrient concentrations in the North Atlantic. Deep-Sea Research, 35, 1525-1546.
HASLE G. R. (1978) Using the inverted microscope. In: Phytoplankton manual. Unesco monographs on oceanographic methodology No. 6, A. SOURNIA, editor, UNESCO, Paris, pp. 88-96.
HEAD E. J. H., A. BEDO and L. R. HARRIS (1988) Grazing, defecation and excretion rates of copepods from inter-island channels of the Canadian Arctic archipelago. Marine Biology, 99, 333-340.
HOLM-HANSEN O., C. J. LORENZEN, R. W. HOLMES and J. D. H. SXRICKLAND (1965) Fluorometric determination of chlorophyll. Journal du Conseil, 30, 3-15.
IRWIN B., J. ANNING, J. GOES, M. HODGSON, E. HORNE, A. MACDONALD and T. PLATr (in press) The North Atlantic Pilot Project--April 20-May 18 1989. Canadian Data. Report of Fisheries and Aquatic Sciences.

304 W . G . HARRISON et al.
KANA T, M. and P. M. GLIBERT (1987) Effect of irradiances up to 2000/~E m -2 s 1 on marine Synechococcu,~ WH7803--I. Growth, pigmentation, and cell composition. Deep-Sea Research, 34, 479-495.
KNAUER G. A., J. H. MARTIN and K. W. BRULAND (1979) Flux of particulate carbon, nitrogen and phosphorus i~t the upper water column of the northeast Pacific. Deep-Sea Research, 26, 97-108.
LANDRY M. R. and R. P. HASSETI (1982) Estimating the grazing impact of marine microzooplankton. Marine Biology, 67,283-288.
LAWS E. A., G. R. DITULLIO, P. R. BETZER, D. M. KARL and K. L. CARDER (1989) Autotrophic production an0 elemental fluxes at 26°N, 155°W in the north Pacific subtropical gyre. Deep-Sea Research, 36, t03-123.
LEE S. and J. A. FUHRMAN (1987) Relationships between biovolume and biomass of naturally derived marine bacterioplankton. Applied and Environmental Microbiology, 53, 1298-1303.
LESSARD E. J. (1984) Oceanic heterotrophic dinoflagetlates: distribution, abundance and role as microzooplank. ton. Ph.D. Thesis, University of Rhode Island, Kingston, 146 pp.
LEWIS M. R. (1989) The variegated ocean', a view from space. New Scientist, 1685, 37-40. LI W. K. W. (1986) Experimental approaches to field measurements: methods and interpretation. CanadiaJ~
Bulletin of Fisheries and Aquatic Sciences, 214,251-286, LI W. K. W. (1990) Particles in "particle-free" water: growth of ultraphytoplankton and implications for dilutior~
experiments. Canadian Journal of Fisheries and Aquatic Sciences, 47, 1258-1268. LI W. K. W., P. M. DICKIE, B. D. IRWIN and A. M. WOOD (1992) Biomass of bacteria, cyanobacteria.
prochlorophytes and photosynthetic eukaryotes in the Sargasso Sea. Deep-Sea Research, 39, 501-519. LI W. K. W., P. M. DlCKIE, W. G. HARRISON and B. D. IRWIN (1993) Biomass and production of bacteria ant]
phytoplankton during the spring bloom in the western North Atlantic Ocean. Deep-Sea Research I1, 40. 307-327.
LONGHVRST A. R. and W. G. HARRISON (1988) Vertical nitrogen flux from the oceanic photic zone by diel migran~ zooplankton and nekton. Deep-Sea Research, 35,881-889.
MARTIN J. H., G. A. KNAUER, D. M. KARL and W. W. BROENKOW (1987) VERTEX: carbon cycling in the northeast Pacific. Deep-Sea Research, 34, 267-285.
MORALES C. E., A. BEDO, R. P. HARRIS and P. R. G. TRANTER (1991) Grazing of copepod assemblages in the north-east Atlantic: the importance of the small fraction. Journal of Plankton Research, 13,455-472.
PARANJAPE M. A. (1987) Grazing by microzooplankton in the eastern Canadian Arctic in summer 1983. Marine Ecology Progress Series, 40, 239-246.
PARANJAPE M. A. (1988) Microzooptankton in Lancaster Sound (eastern Canadian Arctic) in summer: biomass and distribution, Deep-Sea Research, 35, 1547-1563.
PARANJAPE M. A, (1990) Microzooplankton herbivory on the Grand Banks (Newfoundland, Canada): a seasomti study. Marine Biology, 107,321-328.
PARANJAPE M. A., R. J. CONOVER, G. C. HARDING and N. J. PROWSE (1985) Micro- and macro-zooplankton on the Nova Scotian Shelf in the prespring bloom period: a comparison of their resource utilization. Canadiar~ Journal of Fisheries and Aquatic Sciences, 42, 1484-1492.
PARSONS T. R. and C. M. LALLI (1988) Comparative oceanic ecology of the plankton communities of the subarctic Atlantic and Pacific Oceans. Oceanography and Marine Biology. An Annual Review, 26, 317-359.
PORTER K. G. and Y. S. FEIG (1980) The use of DAPI for identifying and counting aquatic microflora. Limnolog) and Oceanography, 25,943-948.
P u ~ M. and D. K. STOECKER (1989) An experimentally determined carbon:volume ratio for marine "oligotrl- chous" ciliates from estuarine and coastal waters. Limnology and Oceanography, 34, 1097-1103.
REID P. C., C. M. TURLEY and P. H. BURKILL (1991) Protozoa and their role in marine processes. NATO-ASi Series Vol. G25, Springer, Berlin.
ROBINSON G. A. (1970) Continuous plankton records: variation in the seasonal cycle of phytoplankton in the North Atlantic. Bulletin of Marine Ecology, 6, 333-345.
Ro'rr E. (1981) Some results from phytoplankton counting intercalibrations. Schweizerische Zeitschr(B fur Hydrologie, 43, 34--62.
SAMEOTO D. D., L. O. JAROSZYNSKI and W. B. FRASER (t980) BIONESS, a new design in multiple ne~ zooplankton samplers. Canadian Journal of Fisheries and Aquatic Sciences, 37, 772-774.
SCOR (1990a) Joint Global Ocean Flux Study: science plan. JGOFS Report No. 5. SCOR (1990b) Joint Global Ocean Flux Study: core measurement protocols. Reports of the core measurement
working groups. JGOFS Report No. 6. SCOR (1990c) Joint Global Ocean Flux Study: JGOFS North Atlantic Bloom Experiment--Internationa!
Scientific Symposium, Washington, November 1990, JGOFS Report No. 7.

The western North Atlantic Bloom Experiment 305
SIEGEL D. A., R. ITURRIAGA, R. R. BIDIGARE, R. C. SMITH, H. PAK, T. D. DICKEY, J. MARRA and K. S. BAKER (1990) Meridional variations of the springtime phytoplankton community in the Sargasso Sea. Journal of Marine Research, 48,379-412.
SMALL L. F., S. W. FOWLER, S. A. MOORE and J. LAROSA (1983) Dissolved and fecal pellet carbon and nitrogen release by zooplankton in tropical waters. Deep-Sea Research, 30, 1199-1220.
SMALL L. F., G. A. KNAUER and M. D. TUEL (1987) The role of sinking pellets in stratified euphotic zones. Deep- Sea Research, 34, 1705-1712.
SMETACEK V. S. (1980) Zooplankton standing stock, copepod faecal pellets and particulate detritus in Kiel Bight. Estuarine and Coastal Marine Science, 11,477-490.
SOLORZANO L. (1969) Determination of ammonia in natural waters by the phenolhypochlorite method. Limnology and Oceanography, 14, 799-801.
STRASS V. and J. D. WOODS (1988) Horizontal and seasonal variation of density and chlorophyll profiles between the Azores and Greenland. In: Toward a theory on biological-physical interactions in the world ocean, B. ROTHSCHILD, editor. Kluwer Academic, Dordrecht, Netherlands, pp. 113-136.
STRATHMANN R. R. (1967) Estimating the organic carbon content of phytoplankton from cell volume or plasma volume. Limnology and Oceanography, 12,411-418.
STRICKLAND J. D. H. and T. R. PARSONS (1972) A practical handbook of seawater analysis. Bulletin of Fisheries Research Board of Canada, 167, 1-311.
TAYLOR A. I-I., A. J. WATSON, M. AINSWORTH, J. E. ROBERTSON and D. R. TURNER (1991) A modelling investigation of the role of phytoplankton in the balance of carbon at the surface of the North Atlantic. Global Biogeochemical Cycles, 5,151-171.
W1EBE P. H. (1988) Functional regression equations for zooplankton displacement volume, wet weight, dry weight, and carbon: a correction. Fisheries Bulletin, 86,833-835.
YENTSCn C. S. (1990) Estimates of "new production" in the Mid-North Atlantic. Journal of Plankton Research, 12,717-734.