the west virginia consolidated public retirement board3010911 state board of occupational therapy...
TRANSCRIPT
Certified Public Accountants
Audited Schedules of Employer Allocations and Pension Amounts By Employer
West Virginia Public Employees’ Retirement System
Administered by
The West Virginia Consolidated Public Retirement Board
As of and for the Year Ended June 30, 2015

West Virginia Public Employees’ Retirement System
Audited Schedules of Employer Allocations and Pension Amounts By Employer
As of and for the Year Ended June 30, 2015
TABLE OF CONTENTS
Page Independent Auditor’s Report 1-2 Schedule of Employer Allocations as of and for the Year Ended June 30, 2015 3-14 Schedule of Pension Amounts By Employer as of and for the Year Ended June 30, 2015 15-28 Notes to Schedules of Employer Allocations and Pension Amounts By Employer 29-31

Certified Public Accountants
300 Chase Tower707 Virginia Street, EastCharleston, West Virginia 25301
Office: 304.345.8400Fax: 304.345.8451
gandkcpas.comGibbons & Kawash, A.C.
INDEPENDENT AUDITOR’S REPORT To the Members of the West Virginia Consolidated Public Retirement Board Charleston, West Virginia Report on the Schedules We have audited the accompanying schedule of employer allocations of the West Virginia Public Employees’ Retirement System (PERS), administered by the West Virginia Consolidated Public Retirement Board, as of and for the year ended June 30, 2015, and the related notes. We have also audited the total for all entities of the columns titled net pension liability, total deferred outflows of resources, total deferred inflows of resources, and total pension expense (specified column totals) included in the accompanying schedule of pension amounts by employer of the PERS as of and for the year ended June 30, 2015, and the related notes. Management’s Responsibility for the Schedules Management is responsible for the preparation and fair presentation of these schedules in accordance with accounting principles generally accepted in the United States of America; this includes the design, implementation, and maintenance of internal control relevant to the preparation and fair presentation of the schedules that are free from material misstatement, whether due to fraud or error. Auditor’s Responsibility Our responsibility is to express an opinion on the schedule of employer allocations and the specified column totals included in the schedule of pension amounts by employer based on our audit. We conducted our audit in accordance with auditing standards generally accepted in the United States of America. Those standards require we plan and perform the audit to obtain reasonable assurance about whether the schedule of employer allocations and specified column totals included in the schedule of pension amounts by employer are free from material misstatement. An audit involves performing procedures to obtain audit evidence about the amounts and disclosures in the schedule of employer allocations and specified column totals included in the schedule of pension amounts by employer. The procedures selected depend on the auditor’s judgment, including the assessment of the risks of material misstatement of the schedule of employer allocations and specified column totals included in the schedule of pension amounts by employer, whether due to fraud or error. In making those risk assessments, the auditor considers internal control relevant to the entity’s preparation and fair presentation of the schedule of employer allocations and specified column totals included in the schedule of pension amounts by employer in order to design audit procedures that are appropriate in the circumstances, but not for the purpose of expressing an opinion on the effectiveness of the entity’s internal control. Accordingly, we express no such opinion. An audit also includes evaluating the appropriateness of accounting policies used and the reasonableness of significant accounting estimates made by management, as well as evaluating the overall presentation of the schedule of employer allocations and specified column totals included in the schedule of pension amounts by employer.

gandkcpas.comGibbons & Kawash, A.C.
2
We believe that the audit evidence we have obtained is sufficient and appropriate to provide a basis for our audit opinion.
Opinion
In our opinion, the schedules referred to above present fairly, in all material respects, the employer allocations and net pension liability, total deferred outflows of resources, total deferred inflows of resources, and total pension expense for the total of all participating entities for the West Virginia Public Employees’ Retirement System, as of and for the year ended June 30, 2015, in accordance with accounting principles generally accepted in the United States of America.
Other Matter
We have audited, in accordance with auditing standards generally accepted in the United States of America, the financial statements of the West Virginia Consolidated Public Retirement Board as of and for the year ended June 30, 2015, and our report thereon dated March 30, 2016, expressed an unmodified opinion on those financial statements.
Restrictions on Use
Our report is intended solely for the information and use of the West Virginia Consolidated Public Retirement Board, the West Virginia Public Employees’ Retirement System’s participating employers and their auditors and is not intended to be used by anyone other than these specified parties.
Charleston, West Virginia December 8, 2016

3
Employer
Number State/Nonstate Employer Name
Employer
Contributions
Employer
Allocation
Percentage
778000 State Jobs Investment Trust Board 39,121 0.020605%
930000 State WV Parkways Authority 1,987,948 1.047062%
930100 State WV Housing Development Fund 785,305 0.413624%
930200 State WV Secondary School Activities Commission 88,289 0.046502%
990000 State State Bar 150,217 0.079120%
3010100 State Governors Office 374,763 0.197389%
3010200 State WV Department of Administration 4,261,618 2.244614%
3010303 State Division of Banking 208,739 0.109944%
3010304 State Division of Tourism 256,180 0.134931%
3010305 State Division of Forestry 558,961 0.294407%
3010306 State WV Geological Survey 228,574 0.120391%
3010307 State WV Development Office 558,399 0.294112%
3010308 State WV Division of Labor 413,586 0.217838%
3010310 State Division of Natural Resources 3,401,308 1.791485%
3010311 State WV Environmental Quality Board 10,598 0.005582%
3010312 State WV Solid Waste Management Board 70,918 0.037353%
3010313 State Department of Environmental Protection 5,538,372 2.917087%
3010314 State WV Office of Miners' Health, Safety & Training 1,066,916 0.561950%
3010315 State Oil & Gas Conservation Commission 8,673 0.004568%
3010316 State WV Water Development Authority 124,076 0.065352%
3010319 State Miner's Health Safety & Training 19,550 0.010297%
3010323 State Workforce West Virginia 1,880,370 0.990400%
3010327 State WV Commerce Office of the Secretary 138,842 0.073129%
3010328 State WV Division of Energy 40,103 0.021122%
3010431 State Department of Education & the Arts 257,757 0.135762%
3010432 State WV Division of Culture & History 470,066 0.247586%
3010433 State WV Library Commission 204,045 0.107471%
3010439 State Educational Broadcasting Authority 426,992 0.224899%
3010450 State Higher Education Central Office 10,416 0.005486%
3010501 State Department of Health & Human Resources - Secretary 40,713 0.021444%
3010505 State Board of Barbers & Cosmetologists 36,802 0.019384%
3010506 State Department of Health & Human Resources - Health 4,459,924 2.349063%
3010507 State Health Care Authority 346,169 0.182329%
3010508 State Bureau of Senior Services 217,219 0.114410%
3010509 State Hospital Finance Authority 7,189 0.003786%
3010510 State WV Human Rights Commission 106,332 0.056006%
3010511 State Department of Health & Human Resources - Human Ser 14,546,674 7.661803%
3010601 State Department of Military Affairs & Public Safety - Secretary 170,108 0.089597%
3010603 State Adjutant General 25,186 0.013266%
3010605 State Parole Board 92,545 0.048744%
3010606 State Division of Homeland Security and Emergency Management 191,852 0.101049%
3010608 State West Virginia Division of Corrections 1,685,709 0.887871%
3010612 State State Police 1,599,728 0.842584%
3010613 State Division of Veterans Affairs 718,213 0.378286%
3010615 State Regional Jail Authority 4,401,546 2.318315%
3010618 State Veterans Home 138,008 0.072689%
3010619 State State Fire Commission 199,066 0.104849%
3010620 State Division of Criminal Justice Services 174,818 0.092077%
3010621 State WV Division of Juvenile Services 2,268,407 1.194781%
3010622 State WV Division of Protective Services 165,549 0.087195%
3010701 State State Tax Department - Office of the Secretary 85,617 0.045095%
3010702 State State Tax Department 1,809,158 0.952892%
3010703 State State Budget Office 62,609 0.032977%
3010704 State WV Offices of the Insurance Commissioner 1,739,962 0.916446%
3010705 State Lottery 1,035,067 0.545175%
WEST VIRGINIA PUBLIC EMPLOYEES' RETIREMENT SYSTEM
SCHEDULE OF PENSION AMOUNTS BY EMPLOYER
As of and for the Year Ended June 30, 2015

4
Employer
Number State/Nonstate Employer Name
Employer
Contributions
Employer
Allocation
Percentage
3010706 State Municipal Bond Commission 20,248 0.010665%
3010707 State Racing Commission 281,790 0.148420%
3010708 State Alcohol Beverage Control Administration 360,106 0.189669%
3010709 State WV Office of Tax Appeals 35,844 0.018879%
3010802 State West Virginia Division of Motor Vehicles 2,295,974 1.209300%
3010803 State Division of Highways 25,452,820 13.406122%
3010804 State WV State Rail Authority 60,111 0.031661%
3010805 State Division of Public Transit 50,804 0.026759%
3010806 State Public Port Authority 18,221 0.009597%
3010807 State WV Department of Transportation Aeronautics Comm 17,598 0.009269%
3010808 State DOT - Office of Admin Hearnings 134,804 0.071002%
3010901 State WV Real Estate Appraiser Licensing & Certification Board 17,711 0.009329%
3010902 State Board of Funeral Service Examiners 10,120 0.005330%
3010903 State WV Board of Professional Surveyors 9,856 0.005191%
3010904 State Board of Counseling 11,276 0.005939%
3010905 State Board of Social Work Examiners 8,876 0.004675%
3010906 State WV Board of Examiners for Licensed Practical Nurses 43,266 0.022788%
3010907 State WV Board of Examiners for Registered Professional Nurses 90,607 0.047723%
3010908 State WV Board of Chiropractic 5,233 0.002756%
3010909 State WV Board of Dental Examiners 14,855 0.007824%
3010911 State Board of Occupational Therapy 4,140 0.002181%
3010912 State West Virginia Board of Optometry 6,243 0.003288%
3010913 State WV Board of Pharmacy 39,319 0.020710%
3010914 State WV Board of Examiners of Psychologists 5,263 0.002772%
3010915 State WV Medical Imaging & Radiation Therapy Technology Board of Exam 11,207 0.005903%
3010917 State WV Board of Registration for Professional Engineers 46,684 0.024589%
3010918 State WV Board of Accountancy 18,378 0.009680%
3010919 State WV State Board of Architects 7,301 0.003845%
3010921 State WV Board of Osteopathy 17,458 0.009195%
3010922 State Board of Physical Therapy 9,681 0.005099%
3010923 State WV Board of Veterinary Medicine 12,583 0.006628%
3010926 State Public Service Commission of WV 1,622,948 0.854814%
3010927 State WV Real Estate Commission 37,266 0.019628%
3010930 State WV Board of Examiners for Speech Pathology & Audiology 6,949 0.003660%
3010932 State WV Division of Rehabilitation Services 2,833,908 1.492633%
3010935 State WV Board of Respiratory Care 5,783 0.003046%
3010938 State Board of Massage Therapy 8,463 0.004458%
3010939 State WV Courthouse Facilities Improvement Authority 9,117 0.004802%
3010942 State Coal Heritage Highway Authority & Board 27,831 0.014659%
3010943 State WV Center for Nursing 952 0.000501%
3010944 State WV Economic Development Authority 84,516 0.044515%
3010945 State WV Board of Medicine 85,482 0.045024%
3010946 State WV Municipal Pensions Oversight Board 29,089 0.015321%
3010947 State WV ERP Board 299,600 0.157801%
3011200 State Auditor's Office 1,326,478 0.698662%
3011300 State Treasurer's Office 849,297 0.447329%
3011400 State Department of Agriculture 1,692,246 0.891314%
3011500 State Attorney General 1,565,446 0.824528%
3011600 State Secretary of State 313,308 0.165021%
3012100 State Senate 432,374 0.227733%
3012200 State House of Delegates 525,533 0.276801%
3012300 State Joint Committee on Government & Finance 706,386 0.372057%
3012400 State Supreme Court of Appeals 9,845,653 5.185752%
3012841 State Hopemont Hospital 498,418 0.262519%
3012842 State Lakin Hospital 559,430 0.294654%
WEST VIRGINIA PUBLIC EMPLOYEES' RETIREMENT SYSTEM
SCHEDULE OF PENSION AMOUNTS BY EMPLOYER
As of and for the Year Ended June 30, 2015

5
Employer
Number State/Nonstate Employer Name
Employer
Contributions
Employer
Allocation
Percentage
3012843 State John Manchin Sr Health Care Center 259,002 0.136418%
3012844 State Jackie Withrow Hospital 595,731 0.313775%
3012845 State Welch Community Hospital 1,269,538 0.668672%
3012926 State William R Sharpe Jr Hospital 1,819,863 0.958530%
3012927 State Mildred Mitchell Bateman Hospital 1,928,296 1.015643%
3018210 State West Virginia Military Authority 2,302,190 1.212574%
3018380 State Anthony Correctional Center 354,453 0.186692%
3018381 State Salem Correctional Center 736,221 0.387771%
3018383 State Ohio County Correctional Complex 109,509 0.057679%
3018384 State Huttonsville Correctional Center 1,486,279 0.782830%
3018387 State Pruntytown Correctional Center 548,977 0.289149%
3018389 State Northern Correctional Facility 469,101 0.247078%
3018390 State Mount Olive Correctional Complex 1,396,312 0.735444%
3018391 State Saint Marys Correctional Center 922,019 0.485632%
3018392 State Denmar Correctional Center 341,589 0.179916%
3018393 State Lakin Correctional Center 658,650 0.346914%
3018394 State Martinsburg Correctional Center 280,232 0.147600%
X00100 Nonstate Barbour County Commission 181,812 0.095761%
X00200 Nonstate Berkeley County Commission 1,177,065 0.619966%
X00300 Nonstate Boone County Commission 584,196 0.307699%
X00400 Nonstate Braxton County Commission 231,642 0.122007%
X00500 Nonstate Brooke County Commission 191,067 0.100636%
X00600 Nonstate Cabell County Commission 947,573 0.499091%
X00700 Nonstate Calhoun County Commission 112,246 0.059121%
X00800 Nonstate Clay County Commission 98,021 0.051628%
X00900 Nonstate Doddridge County Commission 250,291 0.131830%
X01000 Nonstate Fayette County Commission 543,366 0.286193%
X01100 Nonstate Gilmer County Commission 101,918 0.053681%
X01200 Nonstate Grant County Commission 225,369 0.118703%
X01300 Nonstate Greenbrier County Commission 451,591 0.237855%
X01400 Nonstate Hampshire County Commission 330,652 0.174156%
X01500 Nonstate Hancock County Commission 392,706 0.206840%
X01600 Nonstate Hardy County Commission 233,317 0.122889%
X01700 Nonstate Harrison County Commission 1,085,045 0.571498%
X01800 Nonstate Jackson County Commission 388,072 0.204399%
X01900 Nonstate Jefferson County Commission 1,024,710 0.539720%
X02000 Nonstate Kanawha County Commission 1,967,281 1.036176%
X02100 Nonstate Lewis County Commission 395,987 0.208568%
X02200 Nonstate Lincoln County Commission 237,899 0.125303%
X02300 Nonstate Logan County Commission 737,925 0.388669%
X02400 Nonstate McDowell County Commission 956,474 0.503779%
X02500 Nonstate Marion County Commission 756,113 0.398248%
X02600 Nonstate Marshall County Commission 444,484 0.234112%
X02700 Nonstate Mason County Commission 351,115 0.184934%
X02800 Nonstate Mercer County Commission 511,394 0.269354%
X02900 Nonstate Mineral County Commission 317,454 0.167204%
X03000 Nonstate Mingo County Commission 465,353 0.245104%
X03100 Nonstate Monongalia County Commission 1,102,128 0.580496%
X03200 Nonstate Monroe County Commission 142,595 0.075105%
X03300 Nonstate Morgan County Commission 232,989 0.122716%
X03400 Nonstate Nicholas County Commission 307,826 0.162134%
X03500 Nonstate Ohio County Commission 453,634 0.238931%
X03600 Nonstate Pendleton County Commission 151,619 0.079858%
X03700 Nonstate Pleasants County Commission 217,468 0.114541%
X03800 Nonstate Pocahontas County Commission 228,209 0.120199%
WEST VIRGINIA PUBLIC EMPLOYEES' RETIREMENT SYSTEM
SCHEDULE OF PENSION AMOUNTS BY EMPLOYER
As of and for the Year Ended June 30, 2015

6
Employer
Number State/Nonstate Employer Name
Employer
Contributions
Employer
Allocation
Percentage
X03900 Nonstate Preston County Commission 402,736 0.212123%
X04000 Nonstate Putnam County Commission 600,437 0.316253%
X04100 Nonstate Raleigh County Commission 754,689 0.397498%
X04200 Nonstate Randolph County Commission 327,027 0.172247%
X04201 Nonstate Randolph County Emergency Squad 10,926 0.005755%
X04300 Nonstate Ritchie County Commission 146,816 0.077329%
X04400 Nonstate Roane County Commission 170,380 0.089740%
X04500 Nonstate Summers County Commission 193,855 0.102104%
X04600 Nonstate Taylor County Commission 146,957 0.077403%
X04700 Nonstate Tucker County Commission 197,843 0.104205%
X04800 Nonstate Tyler County Commission 188,505 0.099287%
X04900 Nonstate Upshur County Commission 321,716 0.169450%
X04901 Nonstate Upshur County Development Authority 8,916 0.004696%
X05000 Nonstate Wayne County Commission 400,561 0.210978%
X05100 Nonstate Webster County Commission 149,072 0.078517%
X05200 Nonstate Wetzel County Commission 308,040 0.162246%
X05300 Nonstate Wirt County Commission 57,839 0.030464%
X05400 Nonstate Wood County Commission 868,207 0.457289%
X05500 Nonstate Wyoming County Commission 453,916 0.239080%
X10100 Nonstate Barbour County Health Department 49,838 0.026250%
X10200 Nonstate Berkeley County Health Department 104,433 0.055005%
X10300 Nonstate Boone County Health Department 35,707 0.018807%
X10400 Nonstate Braxton County Health Department 23,094 0.012164%
X10500 Nonstate Brooke County Health Department 42,203 0.022228%
X10600 Nonstate Cabell-Huntington Health Department 191,805 0.101025%
X10800 Nonstate Clay County Health Department 66,666 0.035113%
X10900 Nonstate Doddridge County Health Department 21,968 0.011571%
X11000 Nonstate Fayette County Health Department 32,013 0.016861%
X11100 Nonstate Gilmer County Health Department 14,115 0.007434%
X11101 Nonstate Gilmer County Health Center 4,033 0.002124%
X11200 Nonstate Grant County Health Department 40,632 0.021401%
X11300 Nonstate Greenbrier County Board of Health 44,878 0.023637%
X11400 Nonstate Hampshire County Health Department 34,602 0.018225%
X11500 Nonstate Hancock County Board of Health 32,688 0.017217%
X11600 Nonstate Hardy County Health Department 33,073 0.017420%
X11700 Nonstate Harrison-Clarksburg Health Department 76,049 0.040055%
X11800 Nonstate Jackson County Health Department 46,729 0.024612%
X11900 Nonstate Jefferson County Health Department 68,055 0.035845%
X12000 Nonstate Kanawha Charleston Health Department 194,443 0.102414%
X12100 Nonstate Lewis County Health Department 29,434 0.015503%
X12200 Nonstate Lincoln County Health Department 23,945 0.012612%
X12300 Nonstate Logan County Board of Health 34,643 0.018247%
X12400 Nonstate McDowell County Health Department 22,498 0.011850%
X12500 Nonstate Marion County Health Department 47,027 0.024769%
X12600 Nonstate Marshall County Health Department 42,545 0.022408%
X12700 Nonstate Mason County Health Department 27,056 0.014251%
X12800 Nonstate Mercer County Board of Health 52,780 0.027799%
X12900 Nonstate Mineral County Health Department 36,878 0.019424%
X13000 Nonstate Mingo County Board of Health 25,831 0.013605%
X13100 Nonstate Monongalia County Health Department 302,788 0.159480%
X13300 Nonstate Morgan County Health Department 23,439 0.012345%
X13400 Nonstate Nicholas County Health Department 28,511 0.015017%
X13500 Nonstate Wheeling-Ohio County Health Department 98,755 0.052015%
X13600 Nonstate Pendleton County Health Department 23,032 0.012131%
X13800 Nonstate Pocahontas County Board of Health 9,862 0.005194%
SCHEDULE OF PENSION AMOUNTS BY EMPLOYER
As of and for the Year Ended June 30, 2015
WEST VIRGINIA PUBLIC EMPLOYEES' RETIREMENT SYSTEM

7
Employer
Number State/Nonstate Employer Name
Employer
Contributions
Employer
Allocation
Percentage
X13900 Nonstate Preston County Health Department 33,165 0.017468%
X14100 Nonstate Beckley-Raleigh County Board of Health 94,472 0.049759%
X14200 Nonstate Randolph-Elkins Health Department 102,857 0.054175%
X14500 Nonstate Summers County Health Department 20,852 0.010983%
X14600 Nonstate Grafton-Taylor County Board of Health 57,775 0.030431%
X14700 Nonstate Tucker County Health Department 12,945 0.006818%
X14900 Nonstate Upshur-Buckhannon Health Department 27,234 0.014344%
X15000 Nonstate Wayne County Health Department 34,329 0.018081%
X15100 Nonstate Webster County Health Department 14,765 0.007777%
X15200 Nonstate Wetzel-Tyler Health Department 25,149 0.013246%
X15400 Nonstate Mid-Ohio Valley Health Department 292,313 0.153963%
X15500 Nonstate Wyoming County Health Department 24,963 0.013148%
X20100 Nonstate City of Montgomery 73,682 0.038809%
X20200 Nonstate City of Follansbee 164,955 0.086882%
X20300 Nonstate Town of Grant Town 14,702 0.007744%
X20400 Nonstate Town of Pineville 46,413 0.024446%
X20500 Nonstate City of Nitro 111,567 0.058763%
X20600 Nonstate City of Williamson 19,441 0.010240%
X20601 Nonstate Williamson Utility Board 9,272 0.004884%
X20602 Nonstate City of Williamson Board of Parks & Rec 2,779 0.001463%
X20700 Nonstate Town of Belle 30,355 0.015988%
X20701 Nonstate Belle Sanitary Board 6,921 0.003645%
X20800 Nonstate City of Hinton 94,645 0.049850%
X20900 Nonstate City of Salem 65,046 0.034260%
X21000 Nonstate City of Elkins 282,622 0.148858%
X21100 Nonstate City of Wellsburg 113,230 0.059639%
X21200 Nonstate City of Huntington 752,930 0.396572%
X21300 Nonstate Village of Valley Grove 1,929 0.001016%
X21400 Nonstate City of Lewisburg 242,709 0.127836%
X21500 Nonstate Town of Fayetteville 96,958 0.051068%
X21600 Nonstate City of Fairmont 645,070 0.339761%
X21700 Nonstate Town of Bath 25,338 0.013346%
X21701 Nonstate Berkeley Springs Water Works 31,574 0.016630%
X21800 Nonstate City of Bridgeport 877,699 0.462288%
X21901 Nonstate City of Charleston 2,441,094 1.285736%
X22000 Nonstate City of Hurricane 190,668 0.100426%
X22001 Nonstate City of Hurricane Water & Sewer 183,981 0.096904%
X22100 Nonstate Town of Hundred 3,106 0.001636%
X22300 Nonstate City of Ravenswood 125,285 0.065988%
X22500 Nonstate City of Grafton 113,488 0.059775%
X22600 Nonstate City of Mannington 49,810 0.026235%
X22700 Nonstate City of Parkersburg 614,139 0.323470%
X22800 Nonstate City of Romney 92,396 0.048665%
X22900 Nonstate City of Saint Albans 237,001 0.124830%
X23000 Nonstate Mary H Weir Public Library 29,978 0.015789%
X23001 Nonstate City of Weirton 270,920 0.142695%
X23002 Nonstate Weirton Area Water Board 135,351 0.071290%
X23003 Nonstate City of Weirton Sanitary Board 115,950 0.061072%
X23004 Nonstate City of Weirton Board of Park Commissioners 39,426 0.020766%
X23100 Nonstate City of Weston 49,489 0.026066%
X23200 Nonstate Town of Rivesville 18,418 0.009701%
X23300 Nonstate City of Clarksburg 590,024 0.310768%
X23500 Nonstate City of Saint Marys 73,903 0.038925%
X23600 Nonstate Town of Fairview 9,370 0.004935%
X23700 Nonstate City of Buckhannon 457,981 0.241221%
WEST VIRGINIA PUBLIC EMPLOYEES' RETIREMENT SYSTEM
SCHEDULE OF PENSION AMOUNTS BY EMPLOYER
As of and for the Year Ended June 30, 2015

8
Employer
Number State/Nonstate Employer Name
Employer
Contributions
Employer
Allocation
Percentage
X23802 Nonstate City of Charles Town 234,891 0.123718%
X23900 Nonstate Town of Matewan 2,757 0.001452%
X23901 Nonstate Town of Matewan Water Department 2,415 0.001272%
X24001 Nonstate City of McMechen 36,710 0.019335%
X24002 Nonstate City of McMechen Water & Sewer 7,660 0.004034%
X24100 Nonstate City of Beckley 675,449 0.355762%
X24200 Nonstate City of Philippi 204,714 0.107824%
X24300 Nonstate City of Paden City 65,983 0.034753%
X24400 Nonstate City of Dunbar 151,625 0.079861%
X24500 Nonstate City of Keyser 153,449 0.080822%
X24600 Nonstate Town of Elizabeth 16,850 0.008875%
X24700 Nonstate City of South Charleston 499,750 0.263221%
X24800 Nonstate Town of Farmington 13,424 0.007071%
X24900 Nonstate City of Summersville 241,094 0.126985%
X25000 Nonstate Town of Grantsville 28,035 0.014766%
X25100 Nonstate City of Benwood 96,694 0.050929%
X25200 Nonstate Town of West Union 39,257 0.020677%
X25300 Nonstate City of Bluefield 260,038 0.136963%
X25400 Nonstate City of Cameron 42,490 0.022380%
X25500 Nonstate City of Shinnston 104,411 0.054994%
X25600 Nonstate City of Kingwood 101,079 0.053239%
X25700 Nonstate Town of Monongah 40,489 0.021326%
X25800 Nonstate Town of Moorefield 159,548 0.084035%
X25900 Nonstate Town of Franklin 32,490 0.017113%
X26000 Nonstate City of Oak Hill 140,952 0.074240%
X26100 Nonstate Town of Davis 26,309 0.013857%
X26200 Nonstate City of New Martinsville 369,457 0.194595%
X26300 Nonstate Town of Athens 53,966 0.028424%
X26600 Nonstate City of Williamstown 88,822 0.046783%
X26700 Nonstate City of Gary 22,763 0.011989%
X26800 Nonstate City of Mullens 31,556 0.016620%
X26900 Nonstate City of Ripley 232,687 0.122557%
X27000 Nonstate City of Princeton 167,162 0.088045%
X27001 Nonstate Princeton Sanitary Board 103,603 0.054568%
X27100 Nonstate City of Spencer 56,536 0.029778%
X27200 Nonstate Town of Sophia 32,549 0.017144%
X27300 Nonstate City of Madison 74,913 0.039457%
X27400 Nonstate City of Stonewood 56,747 0.029889%
X27500 Nonstate Town of Marlinton 37,085 0.019533%
X27600 Nonstate City of Glen Dale 114,899 0.060518%
X27700 Nonstate Town of Anmoore 38,026 0.020029%
X27800 Nonstate City of Belmont 29,795 0.015693%
X28000 Nonstate City of Glenville 22,362 0.011778%
X28100 Nonstate City of Kenova 92,318 0.048625%
X28200 Nonstate Town of Nutter Fort 93,000 0.048983%
X28300 Nonstate Town of Middlebourne 33,663 0.017731%
X28400 Nonstate Town of Gauley Bridge 13,775 0.007255%
X28500 Nonstate Town of Clendenin 26,564 0.013991%
X28600 Nonstate Town of Wardensville 10,602 0.005584%
X28700 Nonstate Town of Marmet 48,842 0.025725%
X28800 Nonstate Village of Barboursville 293,520 0.154598%
X28900 Nonstate Town of Union 9,535 0.005022%
X29000 Nonstate Town of Winfield 62,338 0.032834%
X29100 Nonstate Town of Ansted 18,463 0.009724%
X29200 Nonstate City of White Sulphur Springs 114,182 0.060140%
WEST VIRGINIA PUBLIC EMPLOYEES' RETIREMENT SYSTEM
SCHEDULE OF PENSION AMOUNTS BY EMPLOYER
As of and for the Year Ended June 30, 2015

9
Employer
Number State/Nonstate Employer Name
Employer
Contributions
Employer
Allocation
Percentage
X29300 Nonstate City of Parsons 52,047 0.027413%
X29400 Nonstate Town of Clay 26,011 0.013700%
X29500 Nonstate Town of New Haven 28,398 0.014957%
X29600 Nonstate City of Thomas 22,119 0.011650%
X29700 Nonstate Town of Hamlin 17,752 0.009350%
X29800 Nonstate Town of Capon Bridge 6,748 0.003554%
X29900 Nonstate City of Milton 66,508 0.035030%
X29901 Nonstate City of Milton Water Department 52,862 0.027843%
X30000 Nonstate City of Richwood 68,704 0.036187%
X30100 Nonstate City of Logan 48,460 0.025524%
X30101 Nonstate City of Logan Sanitary Board 14,152 0.007454%
X30200 Nonstate City of Welch 158,589 0.083529%
X50100 Nonstate Center Public Service District 13,758 0.007246%
X50200 Nonstate Moundsville-Marshall County Public Library 35,764 0.018837%
X50500 Nonstate Williamson Housing Authority 48,322 0.025451%
X50600 Nonstate Nitro Regional Wastewater Utility 63,552 0.033473%
X50800 Nonstate Charleston Sanitary Board 514,307 0.270888%
X50900 Nonstate Huntington WV Housing Authority 230,617 0.121467%
X51000 Nonstate City of Saint Albans Municipal Water and Sewer 185,929 0.097930%
X51200 Nonstate Upshur County Public Library 19,281 0.010156%
X51300 Nonstate Weston Sanitary Board 47,686 0.025116%
X51400 Nonstate Pocahontas Memorial Hospital 776,546 0.409010%
X51600 Nonstate Wheeling Ohio County Airport 27,120 0.014284%
X51800 Nonstate Charleston-Kanawha Housing Authority 355,433 0.187208%
X52100 Nonstate Greater Huntington Park & Recreation District 131,138 0.069071%
X52200 Nonstate Buckhannon Housing Authority 19,287 0.010159%
X52300 Nonstate Huntington Sanitary Board 440,815 0.232180%
X52301 Nonstate Huntington Stormwater Utility 3,548 0.001869%
X52700 Nonstate Charles W Gibson Public Library 8,149 0.004292%
X52800 Nonstate Parkersburg Utility Board 480,304 0.252979%
X53200 Nonstate Saint Albans Housing Authority 17,415 0.009173%
X53300 Nonstate Charleston Urban Renewal Authority 18,053 0.009509%
X53400 Nonstate Housing Authority of City of South Charleston 30,544 0.016087%
X53600 Nonstate Beckley Raleigh County Convention Center 25,893 0.013638%
X53700 Nonstate Keyser-Mineral County Library 14,651 0.007717%
X53800 Nonstate Wheeling Housing Authority 148,697 0.078320%
X53900 Nonstate Kanawha Falls Public Service District 52,930 0.027878%
X54100 Nonstate North Beckley Public Service District 66,498 0.035025%
X54200 Nonstate Cabell County Public Library 333,775 0.175801%
X54400 Nonstate City County Building Management Commission 19,063 0.010041%
X54500 Nonstate Ohio County Public Library 78,061 0.041115%
X54900 Nonstate Raleigh County Public Library 81,113 0.042723%
X55000 Nonstate South Charleston Public Library 32,397 0.017064%
X55100 Nonstate Bluefield Sanitary Board 191,778 0.101011%
X55300 Nonstate Greenbrier Valley Airport Authority 63,695 0.033548%
X55400 Nonstate Central West Virginia Regional Airport Authority 378,473 0.199344%
X55401 Nonstate Raleigh County Memorial Airport 42,223 0.022239%
X55500 Nonstate Kanawha County Parks & Recreation 88,545 0.046637%
X55600 Nonstate Morgantown Public Library 83,200 0.043822%
X55800 Nonstate City of South Charleston Sanitary Board 111,493 0.058724%
X55900 Nonstate West Virginia Association of Counties 19,934 0.010499%
X56100 Nonstate Prestera Center 14,204 0.007481%
X56300 Nonstate Martinsburg Public Library 109,485 0.057666%
X56500 Nonstate Elkins Housing Authority 18,509 0.009749%
X56700 Nonstate Parkersburg & Wood County Public Library 83,039 0.043737%
WEST VIRGINIA PUBLIC EMPLOYEES' RETIREMENT SYSTEM
SCHEDULE OF PENSION AMOUNTS BY EMPLOYER
As of and for the Year Ended June 30, 2015

10
Employer
Number State/Nonstate Employer Name
Employer
Contributions
Employer
Allocation
Percentage
X56800 Nonstate Union Public Service District 48,662 0.025631%
X56900 Nonstate Kingwood Water Works 33,770 0.017787%
X57100 Nonstate Lubeck Public Service District 89,740 0.047267%
X57200 Nonstate Sissonville Public Service District 35,779 0.018845%
X57300 Nonstate BCKP Regional Intergovernmental Council 52,158 0.027472%
X57400 Nonstate Fayette County Public Library 53,713 0.028291%
X57600 Nonstate Dunbar Sanitary Board 64,899 0.034182%
X57700 Nonstate Point Pleasant Housing Authority 27,733 0.014607%
X57900 Nonstate Claywood Park Public Service District 110,672 0.058291%
X58000 Nonstate Region 8 Planning & Development Council 125,499 0.066101%
X58300 Nonstate Greenbrier Valley Conservation District 5,120 0.002697%
X58400 Nonstate City of Spencer Sanitary Board 11,436 0.006023%
X58600 Nonstate City of Spencer Waterworks 40,074 0.021107%
X58700 Nonstate Mid Ohio Valley Regional Airport 50,852 0.026784%
X58800 Nonstate Brooke County Public Library 12,884 0.006786%
X58900 Nonstate Region VII Planning & Development Council 29,432 0.015502%
X59000 Nonstate Region 4 Planning & Development Council 47,660 0.025103%
X59100 Nonstate Craft Memorial Library 23,065 0.012148%
X59200 Nonstate Green Acres Regional Center Inc 58,512 0.030818%
X59300 Nonstate Region 1 Planning & Development Council 50,159 0.026419%
X59500 Nonstate Lavalette Public Service District 68,062 0.035848%
X59600 Nonstate Clarksburg Water Board 264,905 0.139527%
X59700 Nonstate Craigsville Public Service District 69,149 0.036421%
X59800 Nonstate Nettie-Leivasy Public Service District 31,995 0.016852%
X59900 Nonstate Putnam County Parks & Recreation Commission 36,101 0.019015%
X60000 Nonstate Spencer Housing Authority 34,585 0.018216%
X60200 Nonstate Region II Planning & Development Council 28,574 0.015050%
X60300 Nonstate Valley Healthcare System 7,031 0.003703%
X60400 Nonstate Buffalo Creek Public Service District 39,374 0.020738%
X60600 Nonstate Shortline Public Service District 19,444 0.010241%
X60700 Nonstate Boone Madison Public Library 16,622 0.008755%
X60800 Nonstate Westbrook Health Services Inc 4,899 0.002581%
X61200 Nonstate Armstrong Deepwater Public Service District 18,735 0.009868%
X61300 Nonstate Kyova Interstate Planning Commission 53,482 0.028169%
X61400 Nonstate Wood County Parks & Recreation Commission 7,277 0.003833%
X61600 Nonstate Beckley Housing Authority 62,571 0.032956%
X61800 Nonstate Central WV Transit Authority 163,442 0.086086%
X61900 Nonstate Marion County Parks & Recreation Commission 39,934 0.021033%
X62000 Nonstate Arbuckle Public Service District 16,920 0.008912%
X62100 Nonstate Wetzel County Hospital 473,298 0.249288%
X62200 Nonstate Clarksburg-Harrison Public Library 38,696 0.020381%
X62300 Nonstate Ohio County Public Service District 54,357 0.028630%
X62500 Nonstate Greenbrier Public Service District #1 25,615 0.013491%
X62700 Nonstate Ohio Valley Regional Transportation Authority 241,942 0.127432%
X62800 Nonstate Berkeley County Public Service Water District 297,711 0.156806%
X62900 Nonstate Parkersburg Housing Authority 80,890 0.042605%
X63000 Nonstate Marion County Public Library 65,632 0.034568%
X63100 Nonstate Mason County Public Service District 100,608 0.052991%
X63200 Nonstate Monroe County Public Library 3,774 0.001988%
X63300 Nonstate Kanawha County Emergency Ambulance Authority 191,530 0.100880%
X63400 Nonstate Southern Jackson County Public Service District 34,875 0.018369%
X63500 Nonstate Jackson County Public Library 27,392 0.014427%
X63800 Nonstate Raleigh County Public Service District 68,773 0.036223%
X63900 Nonstate Jackson County Housing Authority 41,389 0.021800%
X64200 Nonstate Burnsville Public Utility Board 11,105 0.005849%
WEST VIRGINIA PUBLIC EMPLOYEES' RETIREMENT SYSTEM
SCHEDULE OF PENSION AMOUNTS BY EMPLOYER
As of and for the Year Ended June 30, 2015

11
Employer
Number State/Nonstate Employer Name
Employer
Contributions
Employer
Allocation
Percentage
X64300 Nonstate Kenova Municipal Water Works 47,739 0.025144%
X64500 Nonstate Malden Public Service District 48,119 0.025344%
X64600 Nonstate Boone County Parks & Recreation Board 29,718 0.015653%
X64700 Nonstate Hardy County Rural Development Authority 16,672 0.008781%
X64800 Nonstate Mineral Wells Public Service District 44,179 0.023269%
X64900 Nonstate Housing Authority of Mingo County 47,814 0.025184%
X65000 Nonstate Upper Ohio Conservation District 1,949 0.001026%
X65200 Nonstate Town of West Hamlin 36,544 0.019248%
X65300 Nonstate Eastern Panhandle Regional Planning & Development Council 29,510 0.015543%
X65400 Nonstate Marshall County Public Service District #1 14,534 0.007655%
X65700 Nonstate Warm Springs Public Service District 25,086 0.013213%
X65800 Nonstate Wilderness Public Service District 45,660 0.024050%
X65900 Nonstate Bradley Public Service District 28,823 0.015181%
X66000 Nonstate Wood County Recreation Commission 5,757 0.003032%
X66500 Nonstate Raleigh County Housing Authority 53,814 0.028344%
X66600 Nonstate Fairmont Housing Authority 117,904 0.062100%
X66700 Nonstate Town of Beverly 36,063 0.018995%
X66900 Nonstate Southern Conservation District 21,618 0.011386%
X67000 Nonstate Pocahontas County Public Service District 46,532 0.024509%
X67100 Nonstate Huttonsville Public Service District 36,770 0.019367%
X67200 Nonstate Grant County Housing Authority 14,549 0.007663%
X67300 Nonstate Board of Parks & Recreation Commission 78,112 0.041142%
X67400 Nonstate Putnam County Development Authority 17,658 0.009301%
X67500 Nonstate Taylor County Public Library 10,196 0.005370%
X67600 Nonstate Monroe Health Center 378,665 0.199444%
X67700 Nonstate Louis Bennett Public Library 7,966 0.004196%
X67800 Nonstate Region VIII Solid Waste Authority 38,516 0.020286%
X67900 Nonstate Roane County Public Library 14,944 0.007871%
X68300 Nonstate Cool Ridge-Flat Top Public Service District 18,759 0.009881%
X68400 Nonstate Dunbar Housing Authority 24,068 0.012677%
X68500 Nonstate Richwood Public Library 5,743 0.003025%
X68600 Nonstate Glenville Utility 53,724 0.028297%
X68700 Nonstate Flatwoods Canoe Run Public Service District 79,739 0.041999%
X68800 Nonstate Raleigh County Emergency Services 150,050 0.079032%
X68900 Nonstate Berkeley County Development Authority 24,599 0.012957%
X69000 Nonstate Mount Hope Housing Authority 22,973 0.012100%
X69100 Nonstate Doddridge County Public Library 12,631 0.006653%
X69200 Nonstate Berkeley County Public Service Sewer District 243,372 0.128185%
X69300 Nonstate Kanawha Public Service District 63,295 0.033338%
X69500 Nonstate Logan County Public Service District 217,025 0.114308%
X69800 Nonstate Workforce Investment Board of Kanawha County 26,576 0.013998%
X69901 Nonstate Bluewell Public Service District 66,911 0.035242%
X70100 Nonstate Ritchie County Public Library 16,631 0.008760%
X70200 Nonstate Keyser Housing Authority 29,807 0.015699%
X70300 Nonstate Branchland Midkiff Public Service District 16,497 0.008689%
X70500 Nonstate Sugar Creek Public Service District 7,212 0.003798%
X70600 Nonstate Southwestern Water District 24,202 0.012747%
X70700 Nonstate Grant County Public Service District 29,466 0.015520%
X70800 Nonstate Big Bend Public Service District 16,482 0.008681%
X70900 Nonstate Benedum Airport Authority 81,104 0.042718%
X71100 Nonstate Valley Head Public Library 2,593 0.001366%
X71200 Nonstate Taylor County Public Service District 33,751 0.017777%
X71300 Nonstate Webster Springs Public Service District 15,416 0.008120%
X71400 Nonstate Eastern WV Regional Airport Authority 15,990 0.008422%
X71500 Nonstate Huntington Cabell Wayne Animal Shelter 9,193 0.004842%
WEST VIRGINIA PUBLIC EMPLOYEES' RETIREMENT SYSTEM
SCHEDULE OF PENSION AMOUNTS BY EMPLOYER
As of and for the Year Ended June 30, 2015

12
Employer
Number State/Nonstate Employer Name
Employer
Contributions
Employer
Allocation
Percentage
X71600 Nonstate Boone County Housing & Redevelopment Authority 34,377 0.018106%
X71700 Nonstate Craigsville Public Library 7,799 0.004108%
X71800 Nonstate Charleston Convention & Visitors Bureau 58,853 0.030998%
X72000 Nonstate Randolph County Housing Authority 60,442 0.031835%
X72100 Nonstate Berkeley County Fire Service Board 18,160 0.009565%
X72300 Nonstate Cowen Public Service District 42,401 0.022333%
X72400 Nonstate Vienna Public Library 25,199 0.013272%
X72500 Nonstate White Oak Public Service District 17,643 0.009292%
X72600 Nonstate Marshall County Park & Recreation 31,259 0.016464%
X72700 Nonstate Martinsburg Berkeley County Parks & Recreation Board 76,385 0.040233%
X72900 Nonstate Mannington Sanitary Board 9,696 0.005107%
X73000 Nonstate Elk Valley Public Service District 44,548 0.023463%
X73100 Nonstate Lewis County Convention & Visitors Bureau 8,120 0.004277%
X73300 Nonstate Leadsville Public Service District 15,026 0.007914%
X73500 Nonstate Union Williams Public Service District 55,534 0.029250%
X73600 Nonstate Coalfield Community Action Partnership Inc 326,943 0.172202%
X73900 Nonstate Tucker County Solid Waste Authority 43,625 0.022977%
X74000 Nonstate Hamrick Public Service District 18,116 0.009542%
X74200 Nonstate Raleigh County Solid Waste Authority 234,730 0.123633%
X74300 Nonstate Fayette County Solid Waste Authority 4,981 0.002623%
X74400 Nonstate Red Sulphur Public Service District 37,231 0.019610%
X74500 Nonstate Greenbrier County Public Service District #2 49,611 0.026130%
X74700 Nonstate Putnam County Fire Service Board 14,186 0.007472%
X74800 Nonstate Mercer County Solid Waste Authority 46,320 0.024397%
X74900 Nonstate 4C Economic Development Authority 35,343 0.018615%
X75000 Nonstate Kanawha County Solid Waste Authority 11,686 0.006155%
X75200 Nonstate Lincoln Public Service District 39,867 0.020998%
X75300 Nonstate Sun Valley Public Service District 32,913 0.017335%
X75400 Nonstate Pocahontas County Solid Waste Authority 17,908 0.009432%
X75600 Nonstate Bluefield Housing Authority 43,521 0.022923%
X75800 Nonstate Romney Public Housing Authority 18,361 0.009671%
X75900 Nonstate Putnam County Solid Waste Authority 5,455 0.002873%
X76000 Nonstate Ohio County Solid Waste Authority 3,103 0.001634%
X76100 Nonstate Pleasants County Public Library 4,288 0.002259%
X76200 Nonstate Kingwood Parks & Recreation Commission 6,222 0.003277%
X76400 Nonstate Lynn Murray Memorial Library 5,980 0.003150%
X76500 Nonstate Swaney Memorial Library 3,209 0.001690%
X76600 Nonstate Wood County Solid Waste Authority 3,500 0.001843%
X76800 Nonstate Mingo County Redevelopment Authority 32,898 0.017328%
X76900 Nonstate Mountain Top Public Service District 21,033 0.011078%
X77100 Nonstate Morgantown-Monongalia United Initiative 4,522 0.002382%
X77200 Nonstate Northern Jackson County Public Service District 16,044 0.008450%
X77300 Nonstate Hammond Public Service District 26,621 0.014021%
X77400 Nonstate Harrison County Solid Waste Authority 17,836 0.009394%
X77700 Nonstate Midland Public Service District 35,215 0.018548%
X77800 Nonstate Danese Public Service District 19,092 0.010056%
X77900 Nonstate Boone County Public Service District 38,731 0.020400%
X78200 Nonstate Grandview-Doolin Public Service District 16,510 0.008696%
X78300 Nonstate Jefferson County Parks & Recreation Commission 28,987 0.015267%
X78400 Nonstate Putnam Public Service District 253,688 0.133619%
X78600 Nonstate Chestnut Ridge Public Service District 17,007 0.008958%
X78700 Nonstate Weirton Transit Corporation 16,941 0.008923%
X78800 Nonstate Greenbrier County Solid Waste Authority 39,247 0.020672%
X78900 Nonstate Harpers Ferry Bolivar Public Service District 16,158 0.008510%
X79100 Nonstate Jefferson County Public Service District 67,214 0.035402%
WEST VIRGINIA PUBLIC EMPLOYEES' RETIREMENT SYSTEM
SCHEDULE OF PENSION AMOUNTS BY EMPLOYER
As of and for the Year Ended June 30, 2015

13
Employer
Number State/Nonstate Employer Name
Employer
Contributions
Employer
Allocation
Percentage
X79300 Nonstate Barbour County Development Authority 887 0.000467%
X79400 Nonstate Wyoming County Economic Development Authority 16,356 0.008615%
X79600 Nonstate Northern Wayne County Public Service District 37,423 0.019711%
X79700 Nonstate Lincoln Economic Development Authority 8,252 0.004346%
X79800 Nonstate Gauley River Public Service District 18,477 0.009732%
X79900 Nonstate Elkins Road Public Service District 12,413 0.006538%
X80300 Nonstate Crab Orchard MacArthur Public Service District 56,763 0.029897%
X80400 Nonstate McDowell County Emergency Commission 61,094 0.032178%
X80500 Nonstate Roane County Economic Development Authority 4,891 0.002576%
X80600 Nonstate Metro Emergency Operations Center 474,963 0.250165%
X80700 Nonstate Mercer County Airport Authority 19,250 0.010139%
X80900 Nonstate Town of Eleanor 16,504 0.008693%
X81100 Nonstate Wetzel County Emergency Ambulance Authority 3,343 0.001761%
X81200 Nonstate Town of Harpers Ferry 60,642 0.031940%
X81400 Nonstate Upper Kanawha Valley Enterprise Community 10,925 0.005754%
X81600 Nonstate Brooke County Public Service District 16,438 0.008658%
X81700 Nonstate Hancock County Shelter Workshop 140,316 0.073905%
X81900 Nonstate Hampshire County Development Authority 14,910 0.007853%
X82000 Nonstate Crum Public Service District 18,951 0.009982%
X82100 Nonstate Central Communications Inc 55,512 0.029239%
X82200 Nonstate Corridor G Regional Development Authority 6,300 0.003318%
X82300 Nonstate Tucker County Parks and Recreation Commission 3,805 0.002004%
X82400 Nonstate Berkeley County Emergency Ambulance Authority 29,113 0.015334%
X82600 Nonstate Raleigh County Recreation Authority 14,242 0.007501%
X82700 Nonstate Enlarged Hepzibah Public Service District 20,185 0.010631%
X82900 Nonstate County Commissioners Association of WV 16,240 0.008554%
X83100 Nonstate Greenbrier County Convention & Visitor Bureau 30,513 0.016071%
X83300 Nonstate Boone County Ambulance Authority 24,905 0.013117%
X83500 Nonstate Hamlin-Lincoln County Public Library 19,428 0.010233%
X83700 Nonstate Greater Paw Paw Sanitary District 12,899 0.006794%
X83900 Nonstate Greenbrier County Housing Authority 17,927 0.009442%
X84100 Nonstate Elkins-Randolph County Airport 6,664 0.003510%
X84300 Nonstate Summers County Public Library 8,967 0.004723%
X84400 Nonstate Ritchie County Economic Development Authority 5,767 0.003037%
X84600 Nonstate West Virginia Municipal League 38,525 0.020291%
X84700 Nonstate Pride Community Services Inc 168,226 0.088605%
X84900 Nonstate Jackson County Development Authority 16,148 0.008505%
X85000 Nonstate Five Rivers Public Library 5,736 0.003021%
X85100 Nonstate Hardy County Public Service District 36,321 0.019131%
X85200 Nonstate Ritchie County Ambulance Authority 84,923 0.044729%
X85300 Nonstate Preston County Senior Citizens Inc 60,144 0.031678%
X85500 Nonstate Piedmont Housing Authority 19,276 0.010153%
X85700 Nonstate Benwood-McMechen Housing Authority 38,128 0.020082%
X85800 Nonstate Fairmont Marion County Transit Authority 115,321 0.060740%
X86000 Nonstate Nicholas County Solid Waste Authority 48,718 0.025660%
X86100 Nonstate Hatfield McCoy Regional Recreation Authority 117,692 0.061989%
X86400 Nonstate City of Martinsburg 573,089 0.301849%
X86500 Nonstate City of Point Pleasant 142,189 0.074892%
X86700 Nonstate Norton-Harding-Jimtown Public Service District 10,319 0.005435%
X86800 Nonstate Clarksburg-Harrison Regional Housing Authority 110,309 0.058100%
X86900 Nonstate Marshall County Public Service District #4 15,387 0.008105%
X87000 Nonstate Northern Panhandle Community Criminal Justice Board 78,675 0.041438%
X87200 Nonstate Region 1 Workforce Investment Board 67,808 0.035715%
X87300 Nonstate Century Volga Public Service District 23,015 0.012122%
X87400 Nonstate Frankfort Public Service District 62,717 0.033033%
As of and for the Year Ended June 30, 2015
WEST VIRGINIA PUBLIC EMPLOYEES' RETIREMENT SYSTEM
SCHEDULE OF PENSION AMOUNTS BY EMPLOYER

14
Employer
Number State/Nonstate Employer Name
Employer
Contributions
Employer
Allocation
Percentage
X87500 Nonstate WV Affordable Housing Trust Fund 8,348 0.004397%
X87600 Nonstate Clay County Public Service District 13,790 0.007263%
X87700 Nonstate Adrian Public Service District 15,578 0.008205%
X87900 Nonstate Marshal County Public Service District #3 18,680 0.009839%
X88000 Nonstate Mercer County Communications Center 84,904 0.044719%
X88100 Nonstate Charles Town Utitlity Board 162,868 0.085784%
X88200 Nonstate Phillippi Public Library 3,969 0.002091%
X88300 Nonstate Cottageville Public Service District 22,641 0.011925%
X88400 Nonstate Mingo County Public Service District 71,336 0.037573%
X88500 Nonstate City of Sistersville 50,213 0.026447%
X88700 Nonstate Canaan Valley Public Service District 9,449 0.004977%
X88900 Nonstate McDowell County Solid Waste Authority 7,770 0.004092%
X89000 Nonstate Monongalia County Urban Mass Transit Authority 11,692 0.006158%
X89100 Nonstate Ohio County Development Authority 97,411 0.051307%
X90001 Nonstate Public Defender Corporation - 1st Judicial Circuit 99,642 0.052482%
X90002 Nonstate Public Defender Corporation - 2nd Judicial Circuit 41,587 0.021904%
X90005 Nonstate Public Defender Corporation - 5th Judicial Circuit 72,438 0.038153%
X90006 Nonstate Public Defender Corporation for the Sixth & Twenty-Fourth Circui 161,755 0.085197%
X90007 Nonstate Public Defender Corporation - 7th Judicial Circuit 49,764 0.026211%
X90008 Nonstate Public Defender Corporation for the Eighth Judicial Circuit 38,938 0.020509%
X90009 Nonstate Public Defender Corporation for the Ninth Judicial Circuit 78,637 0.041418%
X90010 Nonstate Public Defender Corporation for the Tenth Judicial Circuit 92,691 0.048821%
X90011 Nonstate Public Defender Corporation - 11th Judicial Circuit 47,816 0.025185%
X90012 Nonstate Public Defender Corporation - 12th Judicial Circuit 47,088 0.024802%
X90013 Nonstate Public Defender Corporation - 13th Judicial Circuit 256,261 0.134974%
X90015 Nonstate Public Defender Corporation for the Fifteenth Judicial Circuit 90,924 0.047890%
X90018 Nonstate Public Defender Corporation - 18th Judicial Circuit 37,443 0.019722%
X90023 Nonstate Public Defender Corporation - 23rd Judicial Circuit 209,768 0.110486%
X90025 Nonstate Public Defender Corporation - 25th Judicial Circuit 69,388 0.036547%
X90028 Nonstate 28th Judicial Circuit Public Defender Corp 29,868 0.015731%
X90030 Nonstate Public Defender Corporation for the Thirtieth Judicial Circuit 46,074 0.024268%
X99903 Nonstate Boone County Board of Education 1,747 0.000920%
X99908 Nonstate Clay County Board of Education 493 0.000260%
X99911 Nonstate Gilmer County Board of Education 470 0.000248%
X99918 Nonstate Jackson County Board of Education 1,702 0.000897%
X99925 Nonstate Marion County Board of Education 1,456 0.000767%
X99926 Nonstate Lincoln County Board of Education 1,568 0.000826%
X99931 Nonstate McDowell County Board of Education 2,419 0.001274%
X99936 Nonstate Pendleton County Board of Education 1,008 0.000531%
X99937 Nonstate Pocahontas County Board of Education 2,240 0.001180%
X99940 Nonstate Tyler County Board of Education 784 0.000413%
X99941 Nonstate Hancock County Board of Education 1,120 0.000590%
X99955 Nonstate Wyoming County Board of Education 829 0.000437%
X99960 Nonstate Raleigh County Board of Education 2,106 0.001109%
TOTALS: 189,859,680 100.000000%
The accompanying notes are an integral part of this schedule.
WEST VIRGINIA PUBLIC EMPLOYEES' RETIREMENT SYSTEM
SCHEDULE OF PENSION AMOUNTS BY EMPLOYER
As of and for the Year Ended June 30, 2015

15
Employer
Number State/Nonstate Employer Name
Net Pension
Liability
Net Difference
Between
Projected and
Actual
Investment
Earnings on
Pension Plan
Investments
Differences
Between
Expected and
Actual
Experience
Changes in
Proportion and
Differences
Between
Employer
Contributions
and
Proportionate
Share of
Contributions
Total Deferred
Outflows of
Resources
Net Difference
Between
Projected and
Actual
Investment
Earnings on
Pension Plan
Investments
Changes of
Assumptions
Changes in
Proportion and
Differences
Between
Employer
Contributions
and
Proportionate
Share of
Contributions
Total
Deferred
Inflows of
Resources
Proportionate
Share of
Pension
Expense
Net
Amortization of
Deferred
Amounts from
Changes in
Proportion and
Differences
Between
Employer
Contributions
and
Proportionate
Share of
Contributions
Total
Employer
Pension
Expense
778000 State Jobs Investment Trust Board 115,059 35,104 23,532 - 58,637 60,335 13,840 7,623 81,797 13,243 (2,740) 10,503
930000 State WV Parkways Authority 5,846,836 1,783,859 1,195,818 - 2,979,677 3,065,954 703,280 126,042 3,895,277 672,978 (45,463) 627,515
930100 State WV Housing Development Fund 2,309,693 704,683 472,388 83,701 1,260,771 1,211,153 277,819 - 1,488,972 265,849 36,847 302,696
930200 State WV Secondary School Activities Commission 259,669 79,225 53,109 9,154 141,487 136,165 31,234 - 167,399 29,888 3,523 33,411
990000 State State Bar 441,809 134,795 90,361 36,857 262,013 231,675 53,143 1,714 286,532 50,853 15,665 66,518
3010100 State Governors Office 1,102,228 336,288 225,432 33,010 594,730 577,985 132,580 55,737 766,302 126,868 (4,037) 122,831
3010200 State WV Department of Administration 12,534,014 3,824,104 2,563,506 - 6,387,610 6,572,566 1,507,640 76,246 8,156,452 1,442,681 (29,771) 1,412,910
3010303 State Division of Banking 613,932 187,309 125,564 11,734 324,607 321,933 73,846 - 395,779 70,664 4,009 74,673
3010304 State Division of Tourism 753,460 229,879 154,101 - 383,980 395,098 90,629 63,086 548,813 86,724 (24,671) 62,053
3010305 State Division of Forestry 1,643,980 501,575 336,233 17,768 855,577 862,068 197,744 20,700 1,080,512 189,224 927 190,151
3010306 State WV Geological Survey 672,268 205,108 137,495 - 342,603 352,523 80,863 75,310 508,696 77,379 (30,327) 47,052
3010307 State WV Development Office 1,642,333 501,073 335,896 5,585 842,554 861,204 197,546 187,260 1,246,010 189,035 (59,961) 129,074
3010308 State WV Division of Labor 1,216,416 371,126 248,786 - 619,912 637,862 146,315 98,021 882,199 140,011 (37,680) 102,331
3010310 State Division of Natural Resources 10,003,724 3,052,117 2,046,001 - 5,098,118 5,245,737 1,203,287 684,370 7,133,393 1,151,441 (245,999) 905,442
3010311 State WV Environmental Quality Board 31,170 9,510 6,375 98 15,983 16,345 3,749 - 20,094 3,588 36 3,624
3010312 State WV Solid Waste Management Board 208,581 63,638 42,660 5,842 112,139 109,375 25,089 7,678 142,142 24,008 13 24,021
3010313 State Department of Environmental Protection 16,289,130 4,969,783 3,331,518 263,525 8,564,825 8,541,668 1,959,320 34,905 10,535,893 1,874,899 104,454 1,979,353
3010314 State WV Office of Miners' Health, Safety & Training 3,137,951 957,383 641,786 - 1,599,169 1,645,474 377,445 173,022 2,195,941 361,182 (58,333) 302,849
3010315 State Oil & Gas Conservation Commission 25,508 7,782 5,217 366 13,365 13,376 3,068 - 16,444 2,936 137 3,073
3010316 State WV Water Development Authority 364,928 111,339 74,637 24,375 210,350 191,360 43,895 - 235,255 42,004 8,716 50,720
3010319 State Miner's Health Safety & Training 57,499 17,543 11,760 3,026 32,329 30,151 6,916 - 37,067 6,618 1,067 7,685
3010323 State Workforce West Virginia 5,530,433 1,687,325 1,131,106 - 2,818,431 2,900,040 665,222 257,687 3,822,949 636,560 (105,042) 531,518
3010327 State WV Commerce Office of the Secretary 408,355 124,588 83,518 18,136 226,243 214,133 49,119 2,438 265,689 47,002 4,972 51,974
3010328 State WV Division of Energy 117,946 35,985 24,123 - 60,108 61,848 14,187 30,213 106,248 13,576 (10,750) 2,826
3010431 State Department of Education & the Arts 758,100 231,295 155,050 57,116 443,461 397,531 91,187 - 488,719 87,258 20,788 108,046
3010432 State WV Division of Culture & History 1,382,530 421,807 282,761 - 704,568 724,969 166,296 68,647 959,912 159,131 (25,792) 133,339
3010433 State WV Library Commission 600,122 183,096 122,739 - 305,836 314,691 72,185 36,752 423,628 69,075 (12,400) 56,675
3010439 State Educational Broadcasting Authority 1,255,845 383,156 256,850 20,050 660,056 658,538 151,058 37,476 847,072 144,549 (9,825) 134,724
3010450 State Higher Education Central Office 30,634 9,346 6,265 8 15,620 16,064 3,685 159 19,908 3,526 (50) 3,476
3010501 State Department of Health & Human Resources - Secretary 119,744 36,534 24,491 74,281 135,305 62,791 14,403 25,536 102,731 13,783 24,211 37,994
3010505 State Board of Barbers & Cosmetologists 108,241 33,024 22,138 3,896 59,058 56,759 13,020 7,974 77,753 12,459 (942) 11,517
3010506 State Department of Health & Human Resources - Health 13,117,262 4,002,052 2,682,794 - 6,684,846 6,878,409 1,577,795 384,183 8,840,387 1,509,813 (155,173) 1,354,640
3010507 State Health Care Authority 1,018,132 310,630 208,232 29,660 548,523 533,887 122,465 8,863 665,215 117,188 10,111 127,299
3010508 State Bureau of Senior Services 638,870 194,918 130,664 77,882 403,464 335,010 76,846 - 411,855 73,535 27,426 100,961
3010509 State Hospital Finance Authority 21,141 6,450 4,324 13 10,787 11,086 2,543 34 13,663 2,433 (7) 2,426
3010510 State WV Human Rights Commission 312,740 95,416 63,963 24,009 183,388 163,994 37,618 36,062 237,674 35,997 (1,445) 34,552
3010511 State Department of Health & Human Resources - Human Ser 42,783,814 13,053,261 8,750,315 - 21,803,576 22,434,908 5,146,203 919,977 28,501,088 4,924,471 (391,897) 4,532,574
3010601 State Department of Military Affairs & Public Safety - Secretary 500,313 152,645 102,326 60,541 315,512 262,353 60,180 1,720 324,253 57,587 26,096 83,683
3010603 State Adjutant General 74,078 22,601 15,151 103,384 141,136 38,845 8,910 178,374 226,129 8,526 (13,915) (5,389)
3010605 State Parole Board 272,188 83,044 55,669 8,247 146,960 142,730 32,740 2,545 178,015 31,329 1,629 32,958
3010606 State Division of Homeland Security and Emergency Management 564,262 172,155 115,405 - 287,560 295,887 67,872 63,703 427,461 64,947 (26,269) 38,678
3010608 State West Virginia Division of Corrections 4,957,907 1,512,648 1,014,011 772,168 3,298,827 2,599,819 596,356 - 3,196,176 570,661 267,194 837,855
3010612 State State Police 4,705,023 1,435,494 962,290 199,545 2,597,328 2,467,212 565,938 - 3,033,151 541,554 69,594 611,148
3010613 State Division of Veterans Affairs 2,112,364 644,478 432,029 - 1,076,507 1,107,678 254,083 191,042 1,552,803 243,136 (69,092) 174,044
3010615 State Regional Jail Authority 12,945,564 3,949,667 2,647,678 - 6,597,345 6,788,374 1,557,143 420,511 8,766,027 1,490,051 (168,467) 1,321,584
3010618 State Veterans Home 405,898 123,839 83,016 4,123 210,978 212,844 48,823 10,845 272,512 46,719 (1,800) 44,919
3010619 State State Fire Commission 585,481 178,629 119,745 - 298,374 307,014 70,424 67,235 444,673 67,390 (27,345) 40,045
3010620 State Division of Criminal Justice Services 514,162 156,870 105,158 25,314 287,342 269,615 61,845 2,552 334,013 59,181 7,314 66,495
3010621 State WV Division of Juvenile Services 6,671,705 2,035,524 1,364,524 49,841 3,449,889 3,498,498 802,499 1,927,875 6,228,871 767,922 (832,688) (64,766)
3010622 State WV Division of Protective Services 486,900 148,552 99,583 - 248,135 255,320 58,566 30,257 344,143 56,043 (10,795) 45,248
Deferred Outflows of Resources Deferred Inflows of Resources Pension Expense
WEST VIRGINIA PUBLIC EMPLOYEES' RETIREMENT SYSTEM
SCHEDULE OF PENSION AMOUNTS BY EMPLOYER
As of and for the Year Ended June 30, 2015

16
Employer
Number State/Nonstate Employer Name
Net Pension
Liability
Net Difference
Between
Projected and
Actual
Investment
Earnings on
Pension Plan
Investments
Differences
Between
Expected and
Actual
Experience
Changes in
Proportion and
Differences
Between
Employer
Contributions
and
Proportionate
Share of
Contributions
Total Deferred
Outflows of
Resources
Net Difference
Between
Projected and
Actual
Investment
Earnings on
Pension Plan
Investments
Deferred
Difference in
Assumptions
Changes in
Proportion and
Differences
Between
Employer
Contributions
and
Proportionate
Share of
Contributions
Total
Deferred
Inflows of
Resources
Proportionate
Share of
Pension
Expense
Net
Amortization of
Deferred
Amounts from
Changes in
Proportion and
Differences
Between
Employer
Contributions
and
Proportionate
Share of
Contributions
Total
Employer
Pension
Expense
3010701 State State Tax Department - Office of the Secretary 251,812 76,827 51,502 48,104 176,433 132,045 30,289 - 162,334 28,984 19,942 48,926
3010702 State State Tax Department 5,320,987 1,623,423 1,088,269 - 2,711,692 2,790,211 640,029 368,350 3,798,590 612,452 (152,090) 460,362
3010703 State State Budget Office 184,145 56,182 37,662 9,022 102,866 96,562 22,150 - 118,711 21,195 3,277 24,472
3010704 State WV Offices of the Insurance Commissioner 5,117,471 1,561,331 1,046,645 - 2,607,976 2,683,491 615,549 319,062 3,618,103 589,027 (123,734) 465,293
3010705 State Lottery 3,044,279 928,804 622,628 41,644 1,593,076 1,596,354 366,178 35,594 1,998,126 350,400 6,480 356,880
3010706 State Municipal Bond Commission 59,554 18,170 12,180 3,138 33,488 31,229 7,163 - 38,392 6,855 1,245 8,100
3010707 State Racing Commission 828,783 252,860 169,506 - 422,366 434,596 99,689 97,000 631,285 95,394 (41,413) 53,981
3010708 State Alcohol Beverage Control Administration 1,059,119 323,135 216,615 21,861 561,612 555,379 127,395 87,369 770,143 121,906 (31,200) 90,706
3010709 State WV Office of Tax Appeals 105,421 32,164 21,561 - 53,725 55,281 12,680 22,029 89,990 12,134 (7,423) 4,711
3010802 State West Virginia Division of Motor Vehicles 6,752,780 2,060,260 1,381,105 112,771 3,554,136 3,541,012 812,251 - 4,353,262 777,253 41,501 818,754
3010803 State Division of Highways 74,860,371 22,839,756 15,310,739 307,682 38,458,176 39,255,169 9,004,495 1,738,872 49,998,536 8,616,517 (663,462) 7,953,055
3010804 State WV State Rail Authority 176,796 53,940 36,159 - 90,099 92,708 21,266 21,437 135,411 20,349 (9,061) 11,288
3010805 State Division of Public Transit 149,423 45,589 30,561 2,129 78,278 78,354 17,973 18,312 114,640 17,199 (5,167) 12,032
3010806 State Public Port Authority 53,590 16,350 10,960 - 27,311 28,101 6,446 11,729 46,276 6,168 (4,331) 1,837
3010807 State WV Department of Transportation Aeronautics Comm 51,758 15,791 10,586 622 26,999 27,141 6,226 11,893 45,260 5,957 (3,691) 2,266
3010808 State DOT - Office of Admin Hearnings 396,478 120,965 81,089 31,766 233,820 207,904 47,690 54,388 309,982 45,635 (13,370) 32,265
3010901 State WV Real Estate Appraiser Licensing & Certification Board 52,094 15,894 10,654 12,633 39,181 27,317 6,266 - 33,583 5,996 4,687 10,683
3010902 State Board of Funeral Service Examiners 29,763 9,081 6,087 11,067 26,235 15,607 3,580 9,552 28,739 3,426 (518) 2,908
3010903 State WV Board of Professional Surveyors 28,987 8,844 5,928 - 14,772 15,200 3,487 5,907 24,594 3,336 (2,063) 1,273
3010904 State Board of Counseling 33,164 10,118 6,783 1,890 18,791 17,390 3,989 1,157 22,536 3,817 121 3,938
3010905 State Board of Social Work Examiners 26,105 7,965 5,339 - 13,304 13,689 3,140 11,756 28,585 3,005 (4,332) (1,327)
3010906 State WV Board of Examiners for Licensed Practical Nurses 127,249 38,823 26,025 2,312 67,161 66,727 15,306 - 82,033 14,647 826 15,473
3010907 State WV Board of Examiners for Registered Professional Nurses 266,487 81,305 54,503 10,174 145,982 139,740 32,054 8,105 179,899 30,673 1,780 32,453
3010908 State WV Board of Chiropractic 15,390 4,695 3,148 962 8,805 8,070 1,851 - 9,921 1,771 384 2,155
3010909 State WV Board of Dental Examiners 43,690 13,330 8,936 562 22,827 22,910 5,255 4,511 32,676 5,029 (1,257) 3,772
3010911 State Board of Occupational Therapy 12,179 3,716 2,491 450 6,657 6,386 1,465 16 7,867 1,402 143 1,545
3010912 State West Virginia Board of Optometry 18,360 5,602 3,755 13 9,370 9,628 2,208 11 11,847 2,113 2 2,115
3010913 State WV Board of Pharmacy 115,645 35,283 23,652 12,286 71,221 60,642 13,910 - 74,552 13,311 4,663 17,974
3010914 State WV Board of Examiners of Psychologists 15,479 4,723 3,166 54 7,942 8,117 1,862 - 9,979 1,782 21 1,803
3010915 State WV Medical Imaging & Radiation Therapy Technology Board of Exam 32,963 10,057 6,742 1,082 17,880 17,285 3,965 4,092 25,342 3,794 (1,441) 2,353
3010917 State WV Board of Registration for Professional Engineers 137,306 41,892 28,082 20,961 90,935 72,000 16,516 9,717 98,233 15,804 5,994 21,798
3010918 State WV Board of Accountancy 54,054 16,492 11,055 13,503 41,050 28,344 6,502 33,630 68,476 6,222 (5,262) 960
3010919 State WV State Board of Architects 21,471 6,551 4,391 13 10,955 11,259 2,583 39 13,880 2,471 (9) 2,462
3010921 State WV Board of Osteopathy 51,345 15,665 10,501 10,196 36,363 26,924 6,176 - 33,100 5,910 3,475 9,385
3010922 State Board of Physical Therapy 28,473 8,687 5,823 3,865 18,375 14,931 3,425 723 19,078 3,277 1,461 4,738
3010923 State WV Board of Veterinary Medicine 37,011 11,292 7,570 1,638 20,500 19,408 4,452 - 23,860 4,260 648 4,908
3010926 State Public Service Commission of WV 4,773,316 1,456,330 976,257 - 2,432,587 2,503,024 574,153 252,346 3,329,522 549,415 (97,637) 451,778
3010927 State WV Real Estate Commission 109,604 33,440 22,417 - 55,856 57,474 13,184 3,428 74,085 12,616 (1,436) 11,180
3010930 State WV Board of Examiners for Speech Pathology & Audiology 20,438 6,235 4,180 3,839 14,254 10,717 2,458 - 13,175 2,352 1,467 3,819
3010932 State WV Division of Rehabilitation Services 8,334,922 2,542,969 1,704,691 137,448 4,385,108 4,370,653 1,002,557 29,729 5,402,939 959,360 32,720 992,080
3010935 State WV Board of Respiratory Care 17,009 5,189 3,479 32 8,700 8,919 2,046 - 10,965 1,958 12 1,970
3010938 State Board of Massage Therapy 24,894 7,595 5,091 1,646 14,332 13,054 2,994 - 16,048 2,865 690 3,555
3010939 State WV Courthouse Facilities Improvement Authority 26,815 8,181 5,484 50 13,715 14,061 3,225 6,837 24,123 3,086 (2,994) 92
3010942 State Coal Heritage Highway Authority & Board 81,856 24,974 16,742 1,397 43,113 42,924 9,846 - 52,770 9,422 613 10,035
3010943 State WV Center for Nursing 2,798 854 572 - 1,426 1,467 337 67,591 69,395 322 (27,865) (27,543)
3010944 State WV Economic Development Authority 248,574 75,839 50,839 16,774 143,453 130,347 29,899 - 160,246 28,611 6,266 34,877
3010945 State WV Board of Medicine 251,416 76,706 51,421 43,707 171,834 131,837 30,241 - 162,078 28,938 16,575 45,513
3010946 State WV Municipal Pensions Oversight Board 85,553 26,102 17,498 1,616 45,216 44,862 10,291 - 55,153 9,847 632 10,479
3010947 State WV ERP Board 881,167 268,842 180,220 640,168 1,089,230 462,065 105,990 - 568,055 101,423 261,791 363,214
3011200 State Auditor's Office 3,901,357 1,190,296 797,921 151,898 2,140,115 2,045,787 469,270 55,788 2,570,845 449,051 48,319 497,370
WEST VIRGINIA PUBLIC EMPLOYEES' RETIREMENT SYSTEM
SCHEDULE OF PENSION AMOUNTS BY EMPLOYER
As of and for the Year Ended June 30, 2015
Deferred Outflows of Resources Deferred Inflows of Resources Pension Expense

17
Employer
Number State/Nonstate Employer Name
Net Pension
Liability
Net Difference
Between
Projected and
Actual
Investment
Earnings on
Pension Plan
Investments
Differences
Between
Expected and
Actual
Experience
Changes in
Proportion and
Differences
Between
Employer
Contributions
and
Proportionate
Share of
Contributions
Total Deferred
Outflows of
Resources
Net Difference
Between
Projected and
Actual
Investment
Earnings on
Pension Plan
Investments
Deferred
Difference in
Assumptions
Changes in
Proportion and
Differences
Between
Employer
Contributions
and
Proportionate
Share of
Contributions
Total
Deferred
Inflows of
Resources
Proportionate
Share of
Pension
Expense
Net
Amortization of
Deferred
Amounts from
Changes in
Proportion and
Differences
Between
Employer
Contributions
and
Proportionate
Share of
Contributions
Total
Employer
Pension
Expense
3011300 State Treasurer's Office 2,497,903 762,105 510,881 - 1,272,987 1,309,846 300,457 129,460 1,739,764 287,512 (48,890) 238,622
3011400 State Department of Agriculture 4,977,133 1,518,514 1,017,943 - 2,536,457 2,609,901 598,669 292,876 3,501,446 572,874 (117,044) 455,830
3011500 State Attorney General 4,604,197 1,404,732 941,669 141,133 2,487,534 2,414,342 553,811 238,787 3,206,939 529,949 (58,148) 471,801
3011600 State Secretary of State 921,484 281,143 188,466 17,422 487,031 483,206 110,840 - 594,046 106,064 6,139 112,203
3012100 State Senate 1,271,670 387,984 260,087 112,581 760,652 666,836 152,961 97,244 917,042 146,371 17,180 163,551
3012200 State House of Delegates 1,545,668 471,580 316,126 19,862 807,568 810,515 185,919 72,159 1,068,593 177,908 (15,304) 162,604
3012300 State Joint Committee on Government & Finance 2,077,581 633,866 424,915 - 1,058,781 1,089,439 249,900 196,170 1,535,508 239,132 (70,355) 168,777
3012400 State Supreme Court of Appeals 28,957,447 8,834,862 5,922,492 940,001 15,697,355 15,184,659 3,483,114 - 18,667,773 3,333,038 376,520 3,709,558
3012836 State WV Nursing Home Licensing Board - - - - - - - 15,896 15,896 - (7,003) (7,003)
3012841 State Hopemont Hospital 1,465,917 447,248 299,815 - 747,063 768,695 176,326 76,107 1,021,128 168,729 (26,522) 142,207
3012842 State Lakin Hospital 1,645,360 501,996 336,515 20,257 858,769 862,791 197,910 121,777 1,182,478 189,383 (31,669) 157,714
3012843 State John Manchin Sr Health Care Center 761,764 232,413 155,799 - 388,212 399,452 91,628 57,020 548,100 87,680 (20,049) 67,631
3012844 State Jackie Withrow Hospital 1,752,132 534,572 358,353 34,089 927,014 918,780 210,753 13,715 1,143,248 201,673 10,444 212,117
3012845 State Welch Community Hospital 3,733,891 1,139,203 763,670 71,454 1,974,327 1,957,972 449,127 - 2,407,099 429,776 30,739 460,515
3012926 State William R Sharpe Jr Hospital 5,352,470 1,633,028 1,094,708 - 2,727,737 2,806,720 643,816 578,366 4,028,901 616,076 (202,586) 413,490
3012927 State Mildred Mitchell Bateman Hospital 5,671,391 1,730,331 1,159,935 347,921 3,238,187 2,973,955 682,177 - 3,656,132 652,784 132,723 785,507
3018210 State West Virginia Military Authority 6,771,062 2,065,838 1,384,844 228,984 3,679,666 3,550,598 814,450 499,562 4,864,610 779,358 (143,742) 635,616
3018380 State Anthony Correctional Center 1,042,496 318,063 213,215 - 531,279 546,662 125,395 90,278 762,336 119,993 (37,491) 82,502
3018381 State Salem Correctional Center 2,165,329 660,638 442,862 1,895,551 2,999,050 1,135,452 260,454 - 1,395,906 249,232 823,355 1,072,587
3018383 State Ohio County Correctional Complex 322,082 98,267 65,873 - 164,140 168,893 38,741 36,630 244,264 37,072 (12,637) 24,435
3018384 State Huttonsville Correctional Center 4,371,354 1,333,692 894,047 - 2,227,738 2,292,244 525,803 346,772 3,164,819 503,148 (125,333) 377,815
3018387 State Pruntytown Correctional Center 1,614,620 492,617 330,228 - 822,846 846,672 194,213 72,709 1,113,593 185,845 (27,325) 158,520
3018389 State Northern Correctional Facility 1,379,693 420,942 282,180 - 703,122 723,481 165,955 65,513 954,949 158,804 (27,918) 130,886
3018390 State Mount Olive Correctional Complex 4,106,749 1,252,961 839,929 - 2,092,890 2,153,490 493,976 361,336 3,008,802 472,692 (131,453) 341,239
3018391 State Saint Marys Correctional Center 2,711,789 827,362 554,626 - 1,381,987 1,422,003 326,184 82,012 1,830,200 312,130 (31,558) 280,572
3018392 State Denmar Correctional Center 1,004,658 306,519 205,477 - 511,996 526,821 120,844 34,210 681,875 115,637 (12,705) 102,932
3018393 State Lakin Correctional Center 1,937,182 591,030 396,200 54,528 1,041,759 1,015,816 233,012 15,463 1,264,291 222,972 11,365 234,337
3018394 State Martinsburg Correctional Center 824,204 251,463 168,570 26,357 446,390 432,195 99,138 - 531,333 94,867 11,296 106,163
X00100 Nonstate Barbour County Commission 534,733 163,146 109,366 26,640 299,152 280,403 64,320 23,880 368,602 61,548 (1,639) 59,909
X00200 Nonstate Berkeley County Commission 3,461,915 1,056,224 708,045 427,033 2,191,301 1,815,353 416,413 - 2,231,766 398,471 166,404 564,875
X00300 Nonstate Boone County Commission 1,718,204 524,221 351,414 66,597 942,231 900,989 206,672 45,193 1,152,854 197,767 14,273 212,040
X00400 Nonstate Braxton County Commission 681,292 207,861 139,341 18,660 365,861 357,255 81,948 18,301 457,504 78,418 2,120 80,538
X00500 Nonstate Brooke County Commission 561,955 171,452 114,933 7,002 293,387 294,677 67,594 2,135 364,406 64,682 2,372 67,054
X00600 Nonstate Cabell County Commission 2,786,944 850,291 569,997 140,225 1,560,513 1,461,413 335,224 - 1,796,638 320,781 54,544 375,325
X00700 Nonstate Calhoun County Commission 330,134 100,723 67,520 8,464 176,708 173,115 39,710 4,386 217,211 37,999 890 38,889
X00800 Nonstate Clay County Commission 288,293 87,958 58,963 - 146,920 151,175 34,677 59,893 245,745 33,183 (21,530) 11,653
X00900 Nonstate Doddridge County Commission 736,144 224,596 150,559 130,758 505,913 386,018 88,546 - 474,564 84,731 47,828 132,559
X01000 Nonstate Fayette County Commission 1,598,113 487,581 326,852 43,791 858,225 838,016 192,227 27,905 1,058,148 183,945 9,989 193,934
X01100 Nonstate Gilmer County Commission 299,757 91,455 61,307 1,275 154,038 157,186 36,056 5,875 199,117 34,502 (2,162) 32,340
X01200 Nonstate Grant County Commission 662,842 202,232 135,567 42,373 380,172 347,580 79,729 - 427,309 76,294 15,530 91,824
X01300 Nonstate Greenbrier County Commission 1,328,192 405,229 271,647 111,199 788,075 696,475 159,760 - 856,235 152,877 43,903 196,780
X01400 Nonstate Hampshire County Commission 972,494 296,706 198,898 46,554 542,158 509,955 116,975 8,968 635,898 111,935 11,569 123,504
X01500 Nonstate Hancock County Commission 1,155,003 352,389 236,226 46,166 634,781 605,659 138,928 - 744,587 132,942 20,123 153,065
X01600 Nonstate Hardy County Commission 686,217 209,364 140,348 66,294 416,005 359,837 82,541 - 442,378 78,984 26,591 105,575
X01700 Nonstate Harrison County Commission 3,191,268 973,650 652,691 165,624 1,791,964 1,673,432 383,858 - 2,057,290 367,319 68,203 435,522
X01800 Nonstate Jackson County Commission 1,141,372 348,230 233,438 51,386 633,054 598,511 137,289 - 735,800 131,373 19,271 150,644
X01900 Nonstate Jefferson County Commission 3,013,818 919,510 616,398 71,189 1,607,097 1,580,381 362,514 92,550 2,035,445 346,894 510 347,404
X02000 Nonstate Kanawha County Commission 5,786,048 1,765,312 1,183,386 395,930 3,344,628 3,034,079 695,968 - 3,730,047 665,981 153,148 819,129
X02100 Nonstate Lewis County Commission 1,164,652 355,333 238,199 106,787 700,319 610,718 140,089 - 750,807 134,053 38,030 172,083
X02200 Nonstate Lincoln County Commission 699,697 213,476 143,105 68,227 424,808 366,906 84,162 - 451,068 80,536 29,847 110,383
WEST VIRGINIA PUBLIC EMPLOYEES' RETIREMENT SYSTEM
SCHEDULE OF PENSION AMOUNTS BY EMPLOYER
As of and for the Year Ended June 30, 2015
Deferred Outflows of Resources Deferred Inflows of Resources Pension Expense
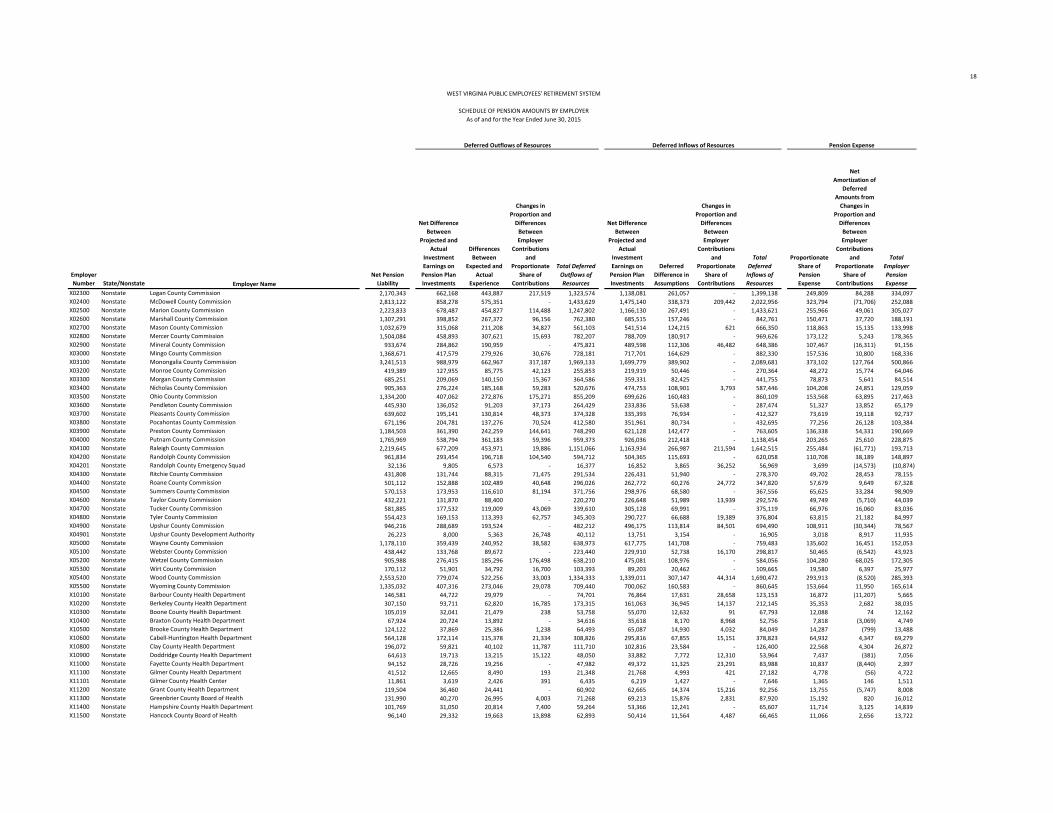
18
Employer
Number State/Nonstate Employer Name
Net Pension
Liability
Net Difference
Between
Projected and
Actual
Investment
Earnings on
Pension Plan
Investments
Differences
Between
Expected and
Actual
Experience
Changes in
Proportion and
Differences
Between
Employer
Contributions
and
Proportionate
Share of
Contributions
Total Deferred
Outflows of
Resources
Net Difference
Between
Projected and
Actual
Investment
Earnings on
Pension Plan
Investments
Deferred
Difference in
Assumptions
Changes in
Proportion and
Differences
Between
Employer
Contributions
and
Proportionate
Share of
Contributions
Total
Deferred
Inflows of
Resources
Proportionate
Share of
Pension
Expense
Net
Amortization of
Deferred
Amounts from
Changes in
Proportion and
Differences
Between
Employer
Contributions
and
Proportionate
Share of
Contributions
Total
Employer
Pension
Expense
X02300 Nonstate Logan County Commission 2,170,343 662,168 443,887 217,519 1,323,574 1,138,081 261,057 - 1,399,138 249,809 84,288 334,097
X02400 Nonstate McDowell County Commission 2,813,122 858,278 575,351 - 1,433,629 1,475,140 338,373 209,442 2,022,956 323,794 (71,706) 252,088
X02500 Nonstate Marion County Commission 2,223,833 678,487 454,827 114,488 1,247,802 1,166,130 267,491 - 1,433,621 255,966 49,061 305,027
X02600 Nonstate Marshall County Commission 1,307,291 398,852 267,372 96,156 762,380 685,515 157,246 - 842,761 150,471 37,720 188,191
X02700 Nonstate Mason County Commission 1,032,679 315,068 211,208 34,827 561,103 541,514 124,215 621 666,350 118,863 15,135 133,998
X02800 Nonstate Mercer County Commission 1,504,084 458,893 307,621 15,693 782,207 788,709 180,917 - 969,626 173,122 5,243 178,365
X02900 Nonstate Mineral County Commission 933,674 284,862 190,959 - 475,821 489,598 112,306 46,482 648,386 107,467 (16,311) 91,156
X03000 Nonstate Mingo County Commission 1,368,671 417,579 279,926 30,676 728,181 717,701 164,629 - 882,330 157,536 10,800 168,336
X03100 Nonstate Monongalia County Commission 3,241,513 988,979 662,967 317,187 1,969,133 1,699,779 389,902 - 2,089,681 373,102 127,764 500,866
X03200 Nonstate Monroe County Commission 419,389 127,955 85,775 42,123 255,853 219,919 50,446 - 270,364 48,272 15,774 64,046
X03300 Nonstate Morgan County Commission 685,251 209,069 140,150 15,367 364,586 359,331 82,425 - 441,755 78,873 5,641 84,514
X03400 Nonstate Nicholas County Commission 905,363 276,224 185,168 59,283 520,676 474,753 108,901 3,793 587,446 104,208 24,851 129,059
X03500 Nonstate Ohio County Commission 1,334,200 407,062 272,876 175,271 855,209 699,626 160,483 - 860,109 153,568 63,895 217,463
X03600 Nonstate Pendleton County Commission 445,930 136,052 91,203 37,173 264,429 233,836 53,638 - 287,474 51,327 13,852 65,179
X03700 Nonstate Pleasants County Commission 639,602 195,141 130,814 48,373 374,328 335,393 76,934 - 412,327 73,619 19,118 92,737
X03800 Nonstate Pocahontas County Commission 671,196 204,781 137,276 70,524 412,580 351,961 80,734 - 432,695 77,256 26,128 103,384
X03900 Nonstate Preston County Commission 1,184,503 361,390 242,259 144,641 748,290 621,128 142,477 - 763,605 136,338 54,331 190,669
X04000 Nonstate Putnam County Commission 1,765,969 538,794 361,183 59,396 959,373 926,036 212,418 - 1,138,454 203,265 25,610 228,875
X04100 Nonstate Raleigh County Commission 2,219,645 677,209 453,971 19,886 1,151,066 1,163,934 266,987 211,594 1,642,515 255,484 (61,771) 193,713
X04200 Nonstate Randolph County Commission 961,834 293,454 196,718 104,540 594,712 504,365 115,693 - 620,058 110,708 38,189 148,897
X04201 Nonstate Randolph County Emergency Squad 32,136 9,805 6,573 - 16,377 16,852 3,865 36,252 56,969 3,699 (14,573) (10,874)
X04300 Nonstate Ritchie County Commission 431,808 131,744 88,315 71,475 291,534 226,431 51,940 - 278,370 49,702 28,453 78,155
X04400 Nonstate Roane County Commission 501,112 152,888 102,489 40,648 296,026 262,772 60,276 24,772 347,820 57,679 9,649 67,328
X04500 Nonstate Summers County Commission 570,153 173,953 116,610 81,194 371,756 298,976 68,580 - 367,556 65,625 33,284 98,909
X04600 Nonstate Taylor County Commission 432,221 131,870 88,400 - 220,270 226,648 51,989 13,939 292,576 49,749 (5,710) 44,039
X04700 Nonstate Tucker County Commission 581,885 177,532 119,009 43,069 339,610 305,128 69,991 - 375,119 66,976 16,060 83,036
X04800 Nonstate Tyler County Commission 554,423 169,153 113,393 62,757 345,303 290,727 66,688 19,389 376,804 63,815 21,182 84,997
X04900 Nonstate Upshur County Commission 946,216 288,689 193,524 - 482,212 496,175 113,814 84,501 694,490 108,911 (30,344) 78,567
X04901 Nonstate Upshur County Development Authority 26,223 8,000 5,363 26,748 40,112 13,751 3,154 - 16,905 3,018 8,917 11,935
X05000 Nonstate Wayne County Commission 1,178,110 359,439 240,952 38,582 638,973 617,775 141,708 - 759,483 135,602 16,451 152,053
X05100 Nonstate Webster County Commission 438,442 133,768 89,672 - 223,440 229,910 52,738 16,170 298,817 50,465 (6,542) 43,923
X05200 Nonstate Wetzel County Commission 905,988 276,415 185,296 176,498 638,210 475,081 108,976 - 584,056 104,280 68,025 172,305
X05300 Nonstate Wirt County Commission 170,112 51,901 34,792 16,700 103,393 89,203 20,462 - 109,665 19,580 6,397 25,977
X05400 Nonstate Wood County Commission 2,553,520 779,074 522,256 33,003 1,334,333 1,339,011 307,147 44,314 1,690,472 293,913 (8,520) 285,393
X05500 Nonstate Wyoming County Commission 1,335,032 407,316 273,046 29,078 709,440 700,062 160,583 - 860,645 153,664 11,950 165,614
X10100 Nonstate Barbour County Health Department 146,581 44,722 29,979 - 74,701 76,864 17,631 28,658 123,153 16,872 (11,207) 5,665
X10200 Nonstate Berkeley County Health Department 307,150 93,711 62,820 16,785 173,315 161,063 36,945 14,137 212,145 35,353 2,682 38,035
X10300 Nonstate Boone County Health Department 105,019 32,041 21,479 238 53,758 55,070 12,632 91 67,793 12,088 74 12,162
X10400 Nonstate Braxton County Health Department 67,924 20,724 13,892 - 34,616 35,618 8,170 8,968 52,756 7,818 (3,069) 4,749
X10500 Nonstate Brooke County Health Department 124,122 37,869 25,386 1,238 64,493 65,087 14,930 4,032 84,049 14,287 (799) 13,488
X10600 Nonstate Cabell-Huntington Health Department 564,128 172,114 115,378 21,334 308,826 295,816 67,855 15,151 378,823 64,932 4,347 69,279
X10800 Nonstate Clay County Health Department 196,072 59,821 40,102 11,787 111,710 102,816 23,584 - 126,400 22,568 4,304 26,872
X10900 Nonstate Doddridge County Health Department 64,613 19,713 13,215 15,122 48,050 33,882 7,772 12,310 53,964 7,437 (381) 7,056
X11000 Nonstate Fayette County Health Department 94,152 28,726 19,256 - 47,982 49,372 11,325 23,291 83,988 10,837 (8,440) 2,397
X11100 Nonstate Gilmer County Health Department 41,512 12,665 8,490 193 21,348 21,768 4,993 421 27,182 4,778 (56) 4,722
X11101 Nonstate Gilmer County Health Center 11,861 3,619 2,426 391 6,435 6,219 1,427 - 7,646 1,365 146 1,511
X11200 Nonstate Grant County Health Department 119,504 36,460 24,441 - 60,902 62,665 14,374 15,216 92,256 13,755 (5,747) 8,008
X11300 Nonstate Greenbrier County Board of Health 131,990 40,270 26,995 4,003 71,268 69,213 15,876 2,831 87,920 15,192 820 16,012
X11400 Nonstate Hampshire County Health Department 101,769 31,050 20,814 7,400 59,264 53,366 12,241 - 65,607 11,714 3,125 14,839
X11500 Nonstate Hancock County Board of Health 96,140 29,332 19,663 13,898 62,893 50,414 11,564 4,487 66,465 11,066 2,656 13,722
WEST VIRGINIA PUBLIC EMPLOYEES' RETIREMENT SYSTEM
SCHEDULE OF PENSION AMOUNTS BY EMPLOYER
As of and for the Year Ended June 30, 2015
Deferred Outflows of Resources Deferred Inflows of Resources Pension Expense

19
Employer
Number State/Nonstate Employer Name
Net Pension
Liability
Net Difference
Between
Projected and
Actual
Investment
Earnings on
Pension Plan
Investments
Differences
Between
Expected and
Actual
Experience
Changes in
Proportion and
Differences
Between
Employer
Contributions
and
Proportionate
Share of
Contributions
Total Deferred
Outflows of
Resources
Net Difference
Between
Projected and
Actual
Investment
Earnings on
Pension Plan
Investments
Deferred
Difference in
Assumptions
Changes in
Proportion and
Differences
Between
Employer
Contributions
and
Proportionate
Share of
Contributions
Total
Deferred
Inflows of
Resources
Proportionate
Share of
Pension
Expense
Net
Amortization of
Deferred
Amounts from
Changes in
Proportion and
Differences
Between
Employer
Contributions
and
Proportionate
Share of
Contributions
Total
Employer
Pension
Expense
X11600 Nonstate Hardy County Health Department 97,274 29,678 19,895 - 49,573 51,008 11,700 1,301 64,010 11,196 (439) 10,757
X11700 Nonstate Harrison-Clarksburg Health Department 223,669 68,241 45,746 - 113,987 117,287 26,904 25,769 169,960 25,745 (9,546) 16,199
X11800 Nonstate Jackson County Health Department 137,434 41,931 28,109 2,429 72,469 72,068 16,531 1,782 90,381 15,819 475 16,294
X11900 Nonstate Jefferson County Health Department 200,160 61,068 40,937 86,886 188,892 104,960 24,076 - 129,036 23,039 29,245 52,284
X12000 Nonstate Kanawha Charleston Health Department 571,884 174,481 116,964 - 291,445 299,884 68,788 120,785 489,457 65,825 (51,285) 14,540
X12100 Nonstate Lewis County Health Department 86,569 26,412 17,706 21,132 65,250 45,395 10,413 - 55,808 9,964 7,552 17,516
X12200 Nonstate Lincoln County Health Department 70,426 21,487 14,404 - 35,891 36,930 8,471 16,636 62,037 8,106 (5,802) 2,304
X12300 Nonstate Logan County Board of Health 101,892 31,087 20,839 7,868 59,794 53,430 12,256 2,842 68,528 11,728 2,519 14,247
X12400 Nonstate McDowell County Health Department 66,171 20,189 13,534 3,689 37,411 34,699 7,959 3,690 46,348 7,616 394 8,010
X12500 Nonstate Marion County Health Department 138,311 42,198 28,288 446 70,932 72,527 16,637 3,235 92,399 15,920 (882) 15,038
X12600 Nonstate Marshall County Health Department 125,127 38,176 25,592 1,652 65,420 65,614 15,051 11,767 92,432 14,402 (4,633) 9,769
X12700 Nonstate Mason County Health Department 79,578 24,279 16,276 - 40,555 41,729 9,572 1,694 52,995 9,160 (636) 8,524
X12800 Nonstate Mercer County Board of Health 155,231 47,361 31,748 3,281 82,390 81,400 18,672 10,766 110,837 17,867 (3,649) 14,218
X12900 Nonstate Mineral County Health Department 108,464 33,092 22,184 734 56,010 56,876 13,047 18,312 88,235 12,484 (5,782) 6,702
X13000 Nonstate Mingo County Board of Health 75,971 23,179 15,538 785 39,501 39,837 9,138 4,704 53,680 8,744 (1,223) 7,521
X13100 Nonstate Monongalia County Health Department 890,543 271,703 182,137 30,064 483,904 466,981 107,118 31,743 605,842 102,503 (3,962) 98,541
X13300 Nonstate Morgan County Health Department 68,935 21,032 14,099 - 35,131 36,148 8,292 9,054 53,494 7,935 (3,657) 4,278
X13400 Nonstate Nicholas County Health Department 83,856 25,584 17,150 - 42,735 43,972 10,086 9,948 64,006 9,652 (3,596) 6,056
X13500 Nonstate Wheeling-Ohio County Health Department 290,454 88,617 59,405 - 148,022 152,308 34,937 39,346 226,591 33,432 (15,173) 18,259
X13600 Nonstate Pendleton County Health Department 67,740 20,667 13,854 926 35,448 35,521 8,148 2,910 46,579 7,797 (563) 7,234
X13800 Nonstate Pocahontas County Board of Health 29,004 8,849 5,932 - 14,781 15,209 3,489 6,682 25,379 3,338 (2,700) 638
X13900 Nonstate Preston County Health Department 97,542 29,760 19,950 81 49,791 51,149 11,733 9,865 72,747 11,227 (3,253) 7,974
X14100 Nonstate Beckley-Raleigh County Board of Health 277,856 84,773 56,828 - 141,602 145,702 33,422 28,521 207,644 31,982 (10,073) 21,909
X14200 Nonstate Randolph-Elkins Health Department 302,515 92,297 61,872 2,693 156,862 158,633 36,388 18,138 213,158 34,820 (7,091) 27,729
X14500 Nonstate Summers County Health Department 61,330 18,712 12,543 3,425 34,680 32,160 7,377 1,657 41,194 7,059 956 8,015
X14600 Nonstate Grafton-Taylor County Board of Health 169,928 51,845 34,754 29,039 115,638 89,107 20,440 20,043 129,589 19,559 851 20,410
X14700 Nonstate Tucker County Health Department 38,072 11,616 7,787 3,838 23,240 19,964 4,579 541 25,085 4,382 1,510 5,892
X14900 Nonstate Upshur-Buckhannon Health Department 80,097 24,438 16,382 11,871 52,690 42,001 9,634 - 51,636 9,219 4,684 13,903
X15000 Nonstate Wayne County Health Department 100,965 30,804 20,650 - 51,454 52,944 12,144 12,653 77,741 11,621 (5,434) 6,187
X15100 Nonstate Webster County Health Department 43,427 13,250 8,882 3,519 25,650 22,772 5,224 478 28,474 4,999 1,390 6,389
X15200 Nonstate Wetzel-Tyler Health Department 73,966 22,567 15,128 - 37,695 38,786 8,897 15,136 62,819 8,514 (6,172) 2,342
X15400 Nonstate Mid-Ohio Valley Health Department 859,736 262,304 175,837 25,451 463,591 450,827 103,412 21,536 575,775 98,957 4,032 102,989
X15500 Nonstate Wyoming County Health Department 73,419 22,400 15,016 893 38,309 38,499 8,831 10,344 57,674 8,451 (4,258) 4,193
X20100 Nonstate City of Montgomery 216,711 66,118 44,323 21,908 132,349 113,639 26,067 - 139,705 24,944 9,065 34,009
X20200 Nonstate City of Follansbee 485,153 148,019 99,225 1,521 248,765 254,404 58,356 518 313,278 55,842 497 56,339
X20300 Nonstate Town of Grant Town 43,243 13,193 8,844 8,543 30,580 22,676 5,201 2,768 30,645 4,977 1,630 6,607
X20400 Nonstate Town of Pineville 136,507 41,648 27,919 30,056 99,623 71,582 16,420 5,064 93,065 15,712 11,553 27,265
X20500 Nonstate City of Nitro 328,135 100,113 67,111 245 167,470 172,067 39,469 4,615 216,151 37,769 (1,951) 35,818
X20600 Nonstate City of Williamson 57,181 17,446 11,695 861 30,001 29,984 6,878 5,183 42,045 6,582 (1,349) 5,233
X20601 Nonstate Williamson Utility Board 27,272 8,321 5,578 1,061 14,960 14,301 3,280 5,588 23,170 3,139 (1,396) 1,743
X20602 Nonstate City of Williamson Board of Parks & Rec 8,169 2,492 1,671 8,333 12,496 4,284 983 - 5,267 940 2,778 3,718
X20700 Nonstate Town of Belle 89,278 27,238 18,259 51,217 96,715 46,815 10,739 49,259 106,813 10,276 6,141 16,417
X20701 Nonstate Belle Sanitary Board 20,354 6,210 4,163 1,196 11,569 10,673 2,448 5,215 18,336 2,343 (1,898) 445
X20800 Nonstate City of Hinton 278,364 84,928 56,932 24,293 166,154 145,968 33,483 18,154 197,605 32,040 102 32,142
X20900 Nonstate City of Salem 191,309 58,368 39,127 28,193 125,688 100,318 23,011 - 123,330 22,020 11,716 33,736
X21000 Nonstate City of Elkins 831,229 253,606 170,006 26,894 450,507 435,879 99,983 23,336 559,198 95,676 4,068 99,744
X21100 Nonstate City of Wellsburg 333,027 101,606 68,112 8,692 178,410 174,632 40,058 10,096 224,786 38,332 (1,550) 36,782
X21200 Nonstate City of Huntington 2,214,474 675,632 452,913 249,644 1,378,189 1,161,222 266,366 152,200 1,579,788 254,889 59,241 314,130
X21300 Nonstate Village of Valley Grove 5,673 1,731 1,160 1,440 4,331 2,975 682 74 3,731 653 609 1,262
X21400 Nonstate City of Lewisburg 713,841 217,792 145,998 15,674 379,463 374,323 85,864 9,945 470,132 82,164 3,589 85,753
WEST VIRGINIA PUBLIC EMPLOYEES' RETIREMENT SYSTEM
SCHEDULE OF PENSION AMOUNTS BY EMPLOYER
As of and for the Year Ended June 30, 2015
Deferred Outflows of Resources Deferred Inflows of Resources Pension Expense

20
Employer
Number State/Nonstate Employer Name
Net Pension
Liability
Net Difference
Between
Projected and
Actual
Investment
Earnings on
Pension Plan
Investments
Differences
Between
Expected and
Actual
Experience
Changes in
Proportion and
Differences
Between
Employer
Contributions
and
Proportionate
Share of
Contributions
Total Deferred
Outflows of
Resources
Net Difference
Between
Projected and
Actual
Investment
Earnings on
Pension Plan
Investments
Deferred
Difference in
Assumptions
Changes in
Proportion and
Differences
Between
Employer
Contributions
and
Proportionate
Share of
Contributions
Total
Deferred
Inflows of
Resources
Proportionate
Share of
Pension
Expense
Net
Amortization of
Deferred
Amounts from
Changes in
Proportion and
Differences
Between
Employer
Contributions
and
Proportionate
Share of
Contributions
Total
Employer
Pension
Expense
X21500 Nonstate Town of Fayetteville 285,166 87,004 58,323 2,363 147,690 149,535 34,301 3,571 187,407 32,823 (150) 32,673
X21600 Nonstate City of Fairmont 1,897,239 578,844 388,031 155,361 1,122,236 994,871 228,207 - 1,223,078 218,375 62,535 280,910
X21700 Nonstate Town of Bath 74,525 22,737 15,242 - 37,979 39,079 8,964 8,760 56,803 8,578 (3,792) 4,786
X21701 Nonstate Berkeley Springs Water Works 92,863 28,332 18,993 3,929 51,254 48,695 11,170 3,401 63,266 10,689 (187) 10,502
X21800 Nonstate City of Bridgeport 2,581,435 787,591 527,965 150,447 1,466,003 1,353,649 310,505 - 1,664,154 297,126 58,080 355,206
X21901 Nonstate City of Charleston 7,179,601 2,190,483 1,468,401 169,247 3,828,130 3,764,828 863,590 87,885 4,716,303 826,381 45,262 871,643
X22000 Nonstate City of Hurricane 560,783 171,094 114,694 16,450 302,237 294,062 67,453 12,389 373,905 64,547 3,117 67,664
X22001 Nonstate City of Hurricane Water & Sewer 541,116 165,093 110,671 11,829 287,594 283,749 65,088 - 348,837 62,283 4,101 66,384
X22100 Nonstate Town of Hundred 9,135 2,787 1,868 3,003 7,659 4,790 1,099 1,064 6,953 1,052 967 2,019
X22300 Nonstate City of Ravenswood 368,480 112,422 75,363 11,604 199,389 193,223 44,322 7,917 245,462 42,412 2,472 44,884
X22500 Nonstate City of Grafton 333,786 101,837 68,267 28,793 198,898 175,030 40,149 - 215,179 38,419 10,965 49,384
X22600 Nonstate City of Mannington 146,497 44,696 29,962 7,717 82,375 76,820 17,621 1,725 96,166 16,862 2,824 19,686
X22700 Nonstate City of Parkersburg 1,806,269 551,089 369,425 99,729 1,020,244 947,169 217,265 - 1,164,434 207,904 39,401 247,305
X22800 Nonstate City of Romney 271,747 82,910 55,579 15,150 153,638 142,498 32,687 5,349 180,534 31,278 4,891 36,169
X22900 Nonstate City of Saint Albans 697,056 212,670 142,565 9,973 365,208 365,521 83,845 12,451 461,817 80,232 243 80,475
X23000 Nonstate Mary H Weir Public Library 88,166 26,899 18,032 15,539 60,471 46,233 10,605 - 56,838 10,148 6,045 16,193
X23001 Nonstate City of Weirton 796,815 243,107 162,968 14,785 420,859 417,832 95,844 28,036 541,712 91,714 (2,833) 88,881
X23002 Nonstate Weirton Area Water Board 398,086 121,455 81,418 62,362 265,236 208,748 47,883 - 256,631 45,820 24,678 70,498
X23003 Nonstate City of Weirton Sanitary Board 341,028 104,047 69,748 32,206 206,002 178,828 41,020 854 220,702 39,253 13,902 53,155
X23004 Nonstate City of Weirton Board of Park Commissioners 115,958 35,379 23,716 8,553 67,648 60,806 13,948 - 74,754 13,347 3,312 16,659
X23100 Nonstate City of Weston 145,554 44,408 29,769 42,581 116,758 76,325 17,508 - 93,833 16,753 15,643 32,396
X23200 Nonstate Town of Rivesville 54,171 16,527 11,079 - 27,607 28,406 6,516 7,343 42,265 6,235 (3,144) 3,091
X23300 Nonstate City of Clarksburg 1,735,341 529,449 354,919 59,355 943,723 909,975 208,734 2,397 1,121,106 199,740 25,347 225,087
X23500 Nonstate City of Saint Marys 217,359 66,316 44,455 17,191 127,962 113,978 26,145 - 140,123 25,018 6,740 31,758
X23600 Nonstate Town of Fairview 27,557 8,408 5,636 - 14,044 14,450 3,315 8,690 26,455 3,172 (3,638) (466)
X23700 Nonstate City of Buckhannon 1,346,988 410,963 275,491 97,782 784,237 706,331 162,021 - 868,352 155,040 42,410 197,450
X23802 Nonstate City of Charles Town 690,846 210,776 141,295 40,412 392,482 362,265 83,098 - 445,363 79,517 15,569 95,086
X23900 Nonstate Town of Matewan 8,108 2,474 1,658 1,408 5,540 4,252 975 2,210 7,437 933 (117) 816
X23901 Nonstate Town of Matewan Water Department 7,103 2,167 1,453 - 3,620 3,725 854 94 4,673 818 (32) 786
X24001 Nonstate City of McMechen 107,967 32,941 22,082 8,785 63,808 56,616 12,987 - 69,603 12,427 3,258 15,685
X24002 Nonstate City of McMechen Water & Sewer 22,526 6,873 4,607 - 11,480 11,812 2,710 22,074 36,596 2,593 (7,533) (4,940)
X24100 Nonstate City of Beckley 1,986,589 606,105 406,305 79,395 1,091,805 1,041,724 238,955 166,242 1,446,921 228,659 (20,439) 208,220
X24200 Nonstate City of Philippi 602,094 183,698 123,143 32,617 339,457 315,725 72,422 - 388,147 69,302 12,637 81,939
X24300 Nonstate City of Paden City 194,062 59,208 39,690 26,477 125,375 101,762 23,343 6,966 132,071 22,337 9,341 31,678
X24400 Nonstate City of Dunbar 445,947 136,058 91,207 99,470 326,734 233,845 53,640 - 287,485 51,329 38,128 89,457
X24500 Nonstate City of Keyser 451,313 137,695 92,304 14,555 244,554 236,659 54,286 36,700 327,645 51,947 (5,822) 46,125
X24600 Nonstate Town of Elizabeth 49,558 15,120 10,136 6,943 32,199 25,987 5,961 927 32,875 5,704 1,907 7,611
X24700 Nonstate City of South Charleston 1,469,837 448,444 300,617 - 749,061 770,751 176,798 148,615 1,096,163 169,180 (50,970) 118,210
X24800 Nonstate Town of Farmington 39,485 12,047 8,076 2,914 23,036 20,705 4,749 513 25,967 4,545 1,113 5,658
X24900 Nonstate City of Summersville 709,089 216,342 145,026 20,661 382,029 371,831 85,292 10,481 467,604 81,617 5,608 87,225
X25000 Nonstate Town of Grantsville 82,454 25,157 16,864 12,523 54,543 43,237 9,918 - 53,155 9,491 5,171 14,662
X25100 Nonstate City of Benwood 284,390 86,767 58,164 - 144,931 149,128 34,207 27,271 210,606 32,734 (10,625) 22,109
X25200 Nonstate Town of West Union 115,461 35,227 23,615 15,294 74,136 60,545 13,888 - 74,433 13,290 5,204 18,494
X25300 Nonstate City of Bluefield 764,807 233,341 156,421 145,041 534,803 401,048 91,994 7,364 500,406 88,030 45,103 133,133
X25400 Nonstate City of Cameron 124,971 38,128 25,560 17,589 81,277 65,532 15,032 1,020 81,584 14,384 5,415 19,799
X25500 Nonstate City of Shinnston 307,089 93,692 62,807 47,797 204,296 161,031 36,938 35,959 233,927 35,346 9,069 44,415
X25600 Nonstate City of Kingwood 297,289 90,702 60,803 145 151,650 155,892 35,759 11,557 203,208 34,218 (3,789) 30,429
X25700 Nonstate Town of Monongah 119,085 36,333 24,356 - 60,688 62,446 14,324 8,603 85,373 13,707 (3,486) 10,221
X25800 Nonstate Town of Moorefield 469,255 143,169 95,974 51,278 290,421 246,067 56,444 - 302,511 54,012 22,135 76,147
X25900 Nonstate Town of Franklin 95,560 29,155 19,544 1,435 50,134 50,109 11,494 1,265 62,869 10,999 (79) 10,920
WEST VIRGINIA PUBLIC EMPLOYEES' RETIREMENT SYSTEM
SCHEDULE OF PENSION AMOUNTS BY EMPLOYER
As of and for the Year Ended June 30, 2015
Deferred Outflows of Resources Deferred Inflows of Resources Pension Expense

21
Employer
Number State/Nonstate Employer Name
Net Pension
Liability
Net Difference
Between
Projected and
Actual
Investment
Earnings on
Pension Plan
Investments
Differences
Between
Expected and
Actual
Experience
Changes in
Proportion and
Differences
Between
Employer
Contributions
and
Proportionate
Share of
Contributions
Total Deferred
Outflows of
Resources
Net Difference
Between
Projected and
Actual
Investment
Earnings on
Pension Plan
Investments
Deferred
Difference in
Assumptions
Changes in
Proportion and
Differences
Between
Employer
Contributions
and
Proportionate
Share of
Contributions
Total
Deferred
Inflows of
Resources
Proportionate
Share of
Pension
Expense
Net
Amortization of
Deferred
Amounts from
Changes in
Proportion and
Differences
Between
Employer
Contributions
and
Proportionate
Share of
Contributions
Total
Employer
Pension
Expense
X26000 Nonstate City of Oak Hill 414,559 126,481 84,787 21,324 232,592 217,386 49,865 4,664 271,915 47,716 7,838 55,554
X26100 Nonstate Town of Davis 77,378 23,608 15,826 1,388 40,822 40,575 9,307 - 49,883 8,906 572 9,478
X26200 Nonstate City of New Martinsville 1,086,626 331,528 222,241 35,904 589,673 569,803 130,704 - 700,507 125,072 14,357 139,429
X26300 Nonstate Town of Athens 158,721 48,425 32,462 4,465 85,353 83,230 19,092 - 102,321 18,269 1,795 20,064
X26600 Nonstate City of Williamstown 261,238 79,703 53,429 40,761 173,894 136,988 31,423 - 168,410 30,069 17,274 47,343
X26700 Nonstate City of Gary 66,947 20,425 13,692 12,959 47,077 35,106 8,053 9,159 52,317 7,706 2,655 10,361
X26800 Nonstate City of Mullens 92,807 28,315 18,981 39,616 86,912 48,666 11,163 47,671 107,500 10,682 (7,794) 2,888
X26900 Nonstate City of Ripley 684,363 208,798 139,969 56,619 405,386 358,865 82,318 - 441,183 78,771 21,802 100,573
X27000 Nonstate City of Princeton 491,647 150,001 100,554 46,884 297,438 257,809 59,137 - 316,946 56,589 15,821 72,410
X27001 Nonstate Princeton Sanitary Board 304,710 92,966 62,320 34,652 189,939 159,783 36,652 - 196,435 35,072 14,586 49,658
X27100 Nonstate City of Spencer 166,282 50,732 34,009 15,091 99,832 87,194 20,001 - 107,195 19,139 5,215 24,354
X27200 Nonstate Town of Sophia 95,733 29,208 19,580 89,831 138,619 50,200 11,515 - 61,715 11,019 34,035 45,054
X27300 Nonstate City of Madison 220,329 67,222 45,063 14,667 126,952 115,536 26,502 7,730 149,768 25,360 1,485 26,845
X27400 Nonstate City of Stonewood 166,901 50,921 34,135 30,332 115,389 87,519 20,076 - 107,595 19,211 11,698 30,909
X27500 Nonstate Town of Marlinton 109,073 33,278 22,308 12,503 68,089 57,196 13,120 7,507 77,822 12,554 3,005 15,559
X27600 Nonstate City of Glen Dale 337,935 103,103 69,116 10,403 182,622 177,206 40,648 14,764 232,618 38,897 (339) 38,558
X27700 Nonstate Town of Anmoore 111,843 34,123 22,875 61,837 118,835 58,648 13,453 11,199 83,300 12,873 15,680 28,553
X27800 Nonstate City of Belmont 87,630 26,736 17,923 2,300 46,958 45,951 10,541 1,857 58,349 10,086 394 10,480
X28000 Nonstate City of Glenville 65,769 20,066 13,451 5,638 39,155 34,488 7,911 - 42,399 7,570 2,329 9,899
X28100 Nonstate City of Kenova 271,524 82,841 55,533 22,244 160,619 142,381 32,660 - 175,041 31,253 8,978 40,231
X28200 Nonstate Town of Nutter Fort 273,523 83,451 55,942 24,158 163,551 143,430 32,900 - 176,330 31,483 8,513 39,996
X28300 Nonstate Town of Middlebourne 99,011 30,208 20,250 42,977 93,435 51,919 11,909 2,234 66,062 11,396 13,342 24,738
X28400 Nonstate Town of Gauley Bridge 40,512 12,360 8,286 6,541 27,187 21,244 4,873 6,653 32,770 4,663 664 5,327
X28500 Nonstate Town of Clendenin 78,126 23,836 15,979 2,170 41,985 40,968 9,397 8,066 58,431 8,992 (2,830) 6,162
X28600 Nonstate Town of Wardensville 31,181 9,513 6,377 - 15,891 16,351 3,751 32,835 52,936 3,589 (13,382) (9,793)
X28700 Nonstate Town of Marmet 143,649 43,827 29,380 - 73,207 75,327 17,279 28,997 121,602 16,534 (10,220) 6,314
X28800 Nonstate Village of Barboursville 863,281 263,386 176,562 82,496 522,443 452,686 103,839 - 556,525 99,365 28,950 128,315
X28900 Nonstate Town of Union 28,043 8,556 5,735 262 14,553 14,705 3,373 79 18,157 3,228 88 3,316
X29000 Nonstate Town of Winfield 183,346 55,939 37,499 55,362 148,799 96,143 22,054 - 118,196 21,103 21,811 42,914
X29100 Nonstate Town of Ansted 54,299 16,567 11,105 2,517 30,189 28,473 6,531 9,678 44,683 6,250 (3,424) 2,826
X29200 Nonstate City of White Sulphur Springs 335,824 102,459 68,684 24,976 196,119 176,099 40,394 19,589 236,082 38,654 4,472 43,126
X29300 Nonstate City of Parsons 153,075 46,703 31,308 23,814 101,825 80,269 18,412 - 98,682 17,619 9,162 26,781
X29400 Nonstate Town of Clay 76,501 23,340 15,646 - 38,987 40,116 9,202 11,629 60,947 8,805 (4,930) 3,875
X29500 Nonstate Town of New Haven 83,520 25,482 17,082 8,607 51,171 43,796 10,046 13,112 66,955 9,613 (580) 9,033
X29600 Nonstate City of Thomas 65,054 19,848 13,305 7,373 40,526 34,113 7,825 - 41,938 7,488 2,882 10,370
X29700 Nonstate Town of Hamlin 52,211 15,929 10,678 - 26,608 27,378 6,280 14,750 48,408 6,010 (6,223) (213)
X29800 Nonstate Town of Capon Bridge 19,846 6,055 4,059 513 10,627 10,407 2,387 3,608 16,402 2,284 (1,418) 866
X29900 Nonstate City of Milton 195,609 59,680 40,007 7,564 107,251 102,573 23,529 9,946 136,048 22,515 (1,860) 20,655
X29901 Nonstate City of Milton Water Department 155,476 47,436 31,799 8,981 88,215 81,528 18,701 12,725 112,955 17,896 (285) 17,611
X30000 Nonstate City of Richwood 202,070 61,651 41,328 3,798 106,777 105,961 24,306 - 130,267 23,258 1,289 24,547
X30100 Nonstate City of Logan 142,527 43,485 29,150 1,394 74,029 74,738 17,144 9,928 101,810 16,405 (2,696) 13,709
X30101 Nonstate City of Logan Sanitary Board 41,623 12,699 8,513 792 22,004 21,826 5,007 1,051 27,884 4,791 (199) 4,592
X30200 Nonstate City of Welch 466,429 142,307 95,396 - 237,703 244,585 56,104 4,439 305,128 53,687 (1,687) 52,000
X50100 Nonstate Center Public Service District 40,462 12,345 8,275 2,430 23,050 21,217 4,867 - 26,084 4,657 892 5,549
X50200 Nonstate Moundsville-Marshall County Public Library 105,187 32,092 21,513 5,001 58,606 55,158 12,652 - 67,810 12,107 1,669 13,776
X50500 Nonstate Williamson Housing Authority 142,119 43,360 29,067 7,222 79,649 74,524 17,095 - 91,619 16,358 2,664 19,022
X50600 Nonstate Nitro Regional Wastewater Utility 186,915 57,027 38,229 8,847 104,103 98,014 22,483 3,970 124,467 21,514 2,574 24,088
X50800 Nonstate Charleston Sanitary Board 1,512,649 461,506 309,373 87,646 858,526 793,201 181,947 22,215 997,363 174,108 31,205 205,313
X50900 Nonstate Huntington WV Housing Authority 678,277 206,941 138,724 - 345,665 355,674 81,586 116,801 554,060 78,070 (45,239) 32,831
X51000 Nonstate City of Saint Albans Municipal Water and Sewer 546,845 166,841 111,843 69,726 348,410 286,754 65,777 - 352,530 62,943 29,271 92,214
WEST VIRGINIA PUBLIC EMPLOYEES' RETIREMENT SYSTEM
SCHEDULE OF PENSION AMOUNTS BY EMPLOYER
As of and for the Year Ended June 30, 2015
Deferred Outflows of Resources Deferred Inflows of Resources Pension Expense

22
Employer
Number State/Nonstate Employer Name
Net Pension
Liability
Net Difference
Between
Projected and
Actual
Investment
Earnings on
Pension Plan
Investments
Differences
Between
Expected and
Actual
Experience
Changes in
Proportion and
Differences
Between
Employer
Contributions
and
Proportionate
Share of
Contributions
Total Deferred
Outflows of
Resources
Net Difference
Between
Projected and
Actual
Investment
Earnings on
Pension Plan
Investments
Deferred
Difference in
Assumptions
Changes in
Proportion and
Differences
Between
Employer
Contributions
and
Proportionate
Share of
Contributions
Total
Deferred
Inflows of
Resources
Proportionate
Share of
Pension
Expense
Net
Amortization of
Deferred
Amounts from
Changes in
Proportion and
Differences
Between
Employer
Contributions
and
Proportionate
Share of
Contributions
Total
Employer
Pension
Expense
X51200 Nonstate Upshur County Public Library 56,712 17,303 11,599 1,993 30,894 29,738 6,821 - 36,560 6,528 805 7,333
X51300 Nonstate Weston Sanitary Board 140,249 42,790 28,684 22,972 94,446 73,543 16,870 16,757 107,170 16,143 276 16,419
X51400 Nonstate Pocahontas Memorial Hospital 2,283,928 696,822 467,118 501,681 1,665,621 1,197,643 274,720 3,519 1,475,881 262,883 165,678 428,561
X51600 Nonstate Wheeling Ohio County Airport 79,762 24,335 16,313 - 40,649 41,826 9,594 6,514 57,934 9,181 (2,446) 6,735
X51800 Nonstate Charleston-Kanawha Housing Authority 1,045,377 318,943 213,805 - 532,747 548,173 125,742 48,360 722,275 120,324 (20,573) 99,751
X52100 Nonstate Greater Huntington Park & Recreation District 385,695 117,675 78,884 19,873 216,432 202,250 46,393 5,322 253,965 44,394 4,280 48,674
X52200 Nonstate Buckhannon Housing Authority 56,728 17,308 11,602 553 29,463 29,747 6,823 9,483 46,054 6,529 (2,918) 3,611
X52300 Nonstate Huntington Sanitary Board 1,296,502 395,560 265,166 272,476 933,202 679,858 155,948 - 835,806 149,229 94,008 243,237
X52301 Nonstate Huntington Stormwater Utility 10,437 3,184 2,135 10,646 15,965 5,473 1,255 - 6,728 1,201 3,549 4,750
X52700 Nonstate Charles W Gibson Public Library 23,967 7,312 4,902 1,115 13,329 12,568 2,883 17 15,467 2,759 485 3,244
X52800 Nonstate Parkersburg Utility Board 1,412,645 430,995 288,920 29,388 749,303 740,760 169,918 - 910,679 162,597 10,619 173,216
X53200 Nonstate Saint Albans Housing Authority 51,222 15,628 10,476 3,383 29,487 26,860 6,161 6,631 39,652 5,896 (1,793) 4,103
X53300 Nonstate Charleston Urban Renewal Authority 53,099 16,200 10,860 1,320 28,380 27,844 6,387 210 34,441 6,112 510 6,622
X53400 Nonstate Housing Authority of City of South Charleston 89,830 27,407 18,372 2,234 48,014 47,105 10,805 - 57,910 10,340 792 11,132
X53600 Nonstate Beckley Raleigh County Convention Center 76,155 23,235 15,576 - 38,810 39,934 9,160 28,660 77,754 8,766 (10,772) (2,006)
X53700 Nonstate Keyser-Mineral County Library 43,092 13,147 8,813 1,847 23,808 22,597 5,183 2,238 30,018 4,960 66 5,026
X53800 Nonstate Wheeling Housing Authority 437,342 133,432 89,447 3,178 226,057 229,333 52,605 3,779 285,717 50,339 (605) 49,734
X53900 Nonstate Kanawha Falls Public Service District 155,672 47,495 31,839 9,962 89,296 81,631 18,725 - 100,356 17,918 4,081 21,999
X54100 Nonstate North Beckley Public Service District 195,581 59,671 40,001 2,982 102,654 102,558 23,525 5,678 131,762 22,512 (580) 21,932
X54200 Nonstate Cabell County Public Library 981,680 299,509 200,777 26,067 526,353 514,772 118,080 - 632,852 112,993 9,364 122,357
X54400 Nonstate City County Building Management Commission 56,069 17,107 11,468 13,921 42,495 29,402 6,744 5,901 42,047 6,454 2,042 8,496
X54500 Nonstate Ohio County Public Library 229,588 70,047 46,956 12,794 129,797 120,391 27,616 - 148,007 26,426 4,760 31,186
X54900 Nonstate Raleigh County Public Library 238,567 72,786 48,793 2,875 124,454 125,099 28,696 - 153,795 27,459 1,136 28,595
X55000 Nonstate South Charleston Public Library 95,286 29,072 19,488 5,617 54,177 49,966 11,461 1,566 62,993 10,968 1,952 12,920
X55100 Nonstate Bluefield Sanitary Board 564,049 172,090 115,362 42,241 329,693 295,775 67,846 - 363,621 64,923 14,526 79,449
X55300 Nonstate Greenbrier Valley Airport Authority 187,333 57,155 38,314 8,543 104,012 98,234 22,533 4,517 125,284 21,562 2,257 23,819
X55400 Nonstate Central West Virginia Regional Airport Authority 1,113,145 339,618 227,665 39,337 606,620 583,709 133,893 10,817 728,419 128,124 8,347 136,471
X55401 Nonstate Raleigh County Memorial Airport 124,183 37,888 25,398 5,698 68,985 65,119 14,937 - 80,056 14,294 2,488 16,782
X55500 Nonstate Kanawha County Parks & Recreation 260,423 79,455 53,263 - 132,717 136,560 31,325 25,398 193,283 29,975 (10,754) 19,221
X55600 Nonstate Morgantown Public Library 244,704 74,659 50,048 253 124,959 128,317 29,434 7,860 165,611 28,166 (2,509) 25,657
X55800 Nonstate City of South Charleston Sanitary Board 327,917 100,047 67,067 25,337 192,451 171,953 39,443 - 211,396 37,744 9,015 46,759
X55900 Nonstate West Virginia Association of Counties 58,627 17,887 11,991 3,518 33,396 30,743 7,052 6,761 44,556 6,748 (705) 6,043
X56100 Nonstate Prestera Center 41,774 12,745 8,544 1,153 22,442 21,905 5,025 4,676 31,606 4,808 (1,051) 3,757
X56200 Nonstate Town of Pratt Water Works Company - - - - - - - 41,312 41,312 - (16,887) (16,887)
X56300 Nonstate Martinsburg Public Library 322,009 98,244 65,859 2,028 166,131 168,855 38,733 4,392 211,979 37,064 (571) 36,493
X56500 Nonstate Elkins Housing Authority 54,439 16,609 11,134 3,805 31,548 28,547 6,548 1,469 36,564 6,266 1,186 7,452
X56700 Nonstate Parkersburg & Wood County Public Library 244,229 74,514 49,951 19,470 143,935 128,068 29,377 - 157,445 28,111 7,846 35,957
X56800 Nonstate Union Public Service District 143,125 43,667 29,272 - 72,939 75,051 17,216 35,601 127,868 16,474 (14,145) 2,329
X56900 Nonstate Kingwood Water Works 99,323 30,303 20,314 7,940 58,557 52,083 11,947 8,023 72,053 11,432 (887) 10,545
X57100 Nonstate Lubeck Public Service District 263,941 80,528 53,982 39,137 173,647 138,405 31,748 - 170,153 30,380 14,145 44,525
X57200 Nonstate Sissonville Public Service District 105,231 32,106 21,522 4,032 57,660 55,181 12,658 1,631 69,470 12,112 626 12,738
X57300 Nonstate BCKP Regional Intergovernmental Council 153,405 46,803 31,375 9,403 87,581 80,442 18,452 9,614 108,508 17,657 936 18,593
X57400 Nonstate Fayette County Public Library 157,978 48,199 32,310 31,743 112,252 82,840 19,002 - 101,843 18,183 11,865 30,048
X57600 Nonstate Dunbar Sanitary Board 190,874 58,235 39,038 6,044 103,317 100,090 22,959 4,397 127,446 21,970 1,197 23,167
X57700 Nonstate Point Pleasant Housing Authority 81,566 24,886 16,682 1,842 43,410 42,771 9,811 - 52,583 9,388 689 10,077
X57900 Nonstate Claywood Park Public Service District 325,499 99,309 66,572 27,198 193,080 170,685 39,152 - 209,837 37,465 11,707 49,172
X58000 Nonstate Region 8 Planning & Development Council 369,111 112,615 75,492 962 189,069 193,554 44,398 65,916 303,868 42,485 (21,548) 20,937
X58300 Nonstate Greenbrier Valley Conservation District 15,060 4,595 3,080 - 7,675 7,897 1,811 5,706 15,415 1,733 (1,938) (205)
X58400 Nonstate City of Spencer Sanitary Board 33,633 10,261 6,879 3,606 20,746 17,636 4,045 8,749 30,431 3,871 (2,652) 1,219
X58600 Nonstate City of Spencer Waterworks 117,862 35,960 24,106 11,004 71,069 61,804 14,177 8,532 84,513 13,566 2,002 15,568
WEST VIRGINIA PUBLIC EMPLOYEES' RETIREMENT SYSTEM
SCHEDULE OF PENSION AMOUNTS BY EMPLOYER
As of and for the Year Ended June 30, 2015
Deferred Outflows of Resources Deferred Inflows of Resources Pension Expense

23
Employer
Number State/Nonstate Employer Name
Net Pension
Liability
Net Difference
Between
Projected and
Actual
Investment
Earnings on
Pension Plan
Investments
Differences
Between
Expected and
Actual
Experience
Changes in
Proportion and
Differences
Between
Employer
Contributions
and
Proportionate
Share of
Contributions
Total Deferred
Outflows of
Resources
Net Difference
Between
Projected and
Actual
Investment
Earnings on
Pension Plan
Investments
Deferred
Difference in
Assumptions
Changes in
Proportion and
Differences
Between
Employer
Contributions
and
Proportionate
Share of
Contributions
Total
Deferred
Inflows of
Resources
Proportionate
Share of
Pension
Expense
Net
Amortization of
Deferred
Amounts from
Changes in
Proportion and
Differences
Between
Employer
Contributions
and
Proportionate
Share of
Contributions
Total
Employer
Pension
Expense
X58700 Nonstate Mid Ohio Valley Regional Airport 149,563 45,631 30,589 6,729 82,950 78,428 17,990 - 96,418 17,215 2,385 19,600
X58800 Nonstate Brooke County Public Library 37,893 11,561 7,750 - 19,311 19,870 4,558 10,239 34,667 4,362 (4,447) (85)
X58900 Nonstate Region VII Planning & Development Council 86,564 26,410 17,704 - 44,115 45,392 10,412 11,361 67,165 9,964 (4,874) 5,090
X59000 Nonstate Region 4 Planning & Development Council 140,176 42,767 28,669 460 71,897 73,505 16,861 24,436 114,802 16,134 (7,943) 8,191
X59100 Nonstate Craft Memorial Library 67,835 20,696 13,874 3,969 38,539 35,571 8,159 3,383 47,114 7,808 620 8,428
X59200 Nonstate Green Acres Regional Center Inc 172,089 52,504 35,196 26,366 114,066 90,240 20,700 26,475 137,414 19,808 2,789 22,597
X59300 Nonstate Region 1 Planning & Development Council 147,525 45,010 30,172 - 75,182 77,359 17,745 21,099 116,203 16,980 (8,025) 8,955
X59500 Nonstate Lavalette Public Service District 200,177 61,074 40,941 15,476 117,490 104,968 24,078 14,645 143,691 23,041 (1,293) 21,748
X59600 Nonstate Clarksburg Water Board 779,124 237,709 159,350 59,131 456,190 408,556 93,716 - 502,272 89,678 23,297 112,975
X59700 Nonstate Craigsville Public Service District 203,376 62,050 41,595 - 103,645 106,646 24,463 5,320 136,429 23,409 (2,258) 21,151
X59800 Nonstate Nettie-Leivasy Public Service District 94,102 28,710 19,246 12,399 60,356 49,345 11,319 - 60,664 10,831 5,043 15,874
X59900 Nonstate Putnam County Parks & Recreation Commission 106,181 32,395 21,716 13,830 67,942 55,679 12,772 8,225 76,676 12,222 3,351 15,573
X60000 Nonstate Spencer Housing Authority 101,719 31,034 20,804 7,205 59,043 53,339 12,235 2,307 67,881 11,708 2,405 14,113
X60200 Nonstate Region II Planning & Development Council 84,040 25,640 17,188 3,746 46,575 44,069 10,109 2,199 56,376 9,673 918 10,591
X60300 Nonstate Valley Healthcare System 20,678 6,309 4,229 - 10,538 10,843 2,487 9,111 22,441 2,380 (3,378) (998)
X60400 Nonstate Buffalo Creek Public Service District 115,802 35,331 23,684 2,170 61,185 60,724 13,929 5,397 80,050 13,329 (1,654) 11,675
X60600 Nonstate Shortline Public Service District 57,186 17,447 11,696 13,448 42,591 29,987 6,879 - 36,866 6,582 5,548 12,130
X60700 Nonstate Boone Madison Public Library 48,888 14,916 9,999 11,556 36,471 25,636 5,880 - 31,516 5,627 4,963 10,590
X60800 Nonstate Westbrook Health Services Inc 14,412 4,397 2,948 1,791 9,136 7,558 1,734 - 9,291 1,659 655 2,314
X61200 Nonstate Armstrong Deepwater Public Service District 55,103 16,812 11,270 285 28,367 28,895 6,628 1,998 37,521 6,342 (785) 5,557
X61300 Nonstate Kyova Interstate Planning Commission 157,297 47,991 32,171 44,655 124,817 82,483 18,920 - 101,403 18,105 16,132 34,237
X61400 Nonstate Wood County Parks & Recreation Commission 21,404 6,530 4,378 1,279 12,187 11,224 2,575 10,754 24,552 2,464 (3,021) (557)
X61600 Nonstate Beckley Housing Authority 184,028 56,146 37,638 10,497 104,282 96,500 22,136 6,777 125,413 21,182 514 21,696
X61800 Nonstate Central WV Transit Authority 480,708 146,663 98,316 47,626 292,605 252,073 57,821 5,793 315,687 55,330 19,050 74,380
X61900 Nonstate Marion County Parks & Recreation Commission 117,449 35,834 24,021 14,479 74,334 61,588 14,127 - 75,715 13,519 5,323 18,842
X62000 Nonstate Arbuckle Public Service District 49,765 15,183 10,178 10,040 35,401 26,096 5,986 - 32,082 5,728 3,554 9,282
X62100 Nonstate Wetzel County Hospital 1,392,034 424,707 284,704 - 709,411 729,953 167,439 415,257 1,312,649 160,225 (157,552) 2,673
X62200 Nonstate Clarksburg-Harrison Public Library 113,808 34,723 23,277 5,427 63,426 59,679 13,689 5,843 79,211 13,099 441 13,540
X62300 Nonstate Ohio County Public Service District 159,871 48,776 32,697 - 81,474 83,833 19,230 21,027 124,090 18,401 (7,013) 11,388
X62500 Nonstate Greenbrier Public Service District #1 75,334 22,984 15,408 13,759 52,151 39,504 9,061 - 48,565 8,671 4,843 13,514
X62700 Nonstate Ohio Valley Regional Transportation Authority 711,585 217,103 145,536 32,613 395,253 373,140 85,592 - 458,732 81,904 10,904 92,808
X62800 Nonstate Berkeley County Public Service Water District 875,611 267,147 179,083 32,912 479,143 459,151 105,322 29,291 593,764 100,784 (1,932) 98,852
X62900 Nonstate Parkersburg Housing Authority 237,908 72,585 48,658 9,985 131,228 124,754 28,617 8,754 162,124 27,384 (527) 26,857
X63000 Nonstate Marion County Public Library 193,029 58,893 39,479 4,876 103,248 101,220 23,218 96 124,535 22,218 2,115 24,333
X63100 Nonstate Mason County Public Service District 295,904 90,280 60,519 34,095 184,894 155,166 35,592 - 190,758 34,059 13,070 47,129
X63200 Nonstate Monroe County Public Library 11,101 3,387 2,270 24 5,681 5,821 1,335 1,902 9,058 1,278 (625) 653
X63300 Nonstate Kanawha County Emergency Ambulance Authority 563,318 171,867 115,212 27,567 314,646 295,392 67,758 14,263 377,413 64,839 7,389 72,228
X63400 Nonstate Southern Jackson County Public Service District 102,573 31,295 20,979 4,945 57,219 53,787 12,338 - 66,125 11,806 1,882 13,688
X63500 Nonstate Jackson County Public Library 80,561 24,579 16,477 5,745 46,801 42,244 9,690 1,646 53,581 9,273 1,982 11,255
X63800 Nonstate Raleigh County Public Service District 202,271 61,712 41,369 - 103,082 106,066 24,330 51,907 182,303 23,282 (20,913) 2,369
X63900 Nonstate Jackson County Housing Authority 121,732 37,140 24,897 - 62,037 63,834 14,642 45,022 123,498 14,012 (16,233) (2,221)
X64200 Nonstate Burnsville Public Utility Board 32,661 9,965 6,680 6,485 23,130 17,127 3,929 - 21,055 3,759 2,497 6,256
X64300 Nonstate Kenova Municipal Water Works 140,405 42,837 28,716 24,179 95,733 73,625 16,888 17,072 107,586 16,161 541 16,702
X64500 Nonstate Malden Public Service District 141,522 43,178 28,945 10,761 82,884 74,211 17,023 2,750 93,984 16,289 3,823 20,112
X64600 Nonstate Boone County Parks & Recreation Board 87,407 26,668 17,877 415 44,960 45,834 10,514 9,425 65,773 10,061 (4,013) 6,048
X64700 Nonstate Hardy County Rural Development Authority 49,033 14,960 10,029 8,458 33,447 25,712 5,898 2,832 34,442 5,644 1,573 7,217
X64800 Nonstate Mineral Wells Public Service District 129,935 39,643 26,575 597 66,815 68,135 15,629 4,653 88,417 14,956 (1,289) 13,667
X64900 Nonstate Housing Authority of Mingo County 140,628 42,905 28,762 - 71,667 73,743 16,915 22,264 112,922 16,187 (8,533) 7,654
X65000 Nonstate Upper Ohio Conservation District 5,729 1,748 1,172 - 2,920 3,004 689 2,315 6,008 659 (976) (317)
X65200 Nonstate Town of West Hamlin 107,482 32,792 21,983 - 54,775 56,361 12,928 544 69,833 12,371 (217) 12,154
WEST VIRGINIA PUBLIC EMPLOYEES' RETIREMENT SYSTEM
SCHEDULE OF PENSION AMOUNTS BY EMPLOYER
As of and for the Year Ended June 30, 2015
Deferred Outflows of Resources Deferred Inflows of Resources Pension Expense

24
Employer
Number State/Nonstate Employer Name
Net Pension
Liability
Net Difference
Between
Projected and
Actual
Investment
Earnings on
Pension Plan
Investments
Differences
Between
Expected and
Actual
Experience
Changes in
Proportion and
Differences
Between
Employer
Contributions
and
Proportionate
Share of
Contributions
Total Deferred
Outflows of
Resources
Net Difference
Between
Projected and
Actual
Investment
Earnings on
Pension Plan
Investments
Deferred
Difference in
Assumptions
Changes in
Proportion and
Differences
Between
Employer
Contributions
and
Proportionate
Share of
Contributions
Total
Deferred
Inflows of
Resources
Proportionate
Share of
Pension
Expense
Net
Amortization of
Deferred
Amounts from
Changes in
Proportion and
Differences
Between
Employer
Contributions
and
Proportionate
Share of
Contributions
Total
Employer
Pension
Expense
X65300 Nonstate Eastern Panhandle Regional Planning & Development Council 86,793 26,480 17,751 4,511 48,742 45,512 10,440 36,210 92,162 9,990 (14,447) (4,457)
X65400 Nonstate Marshall County Public Service District #1 42,746 13,042 8,743 3,993 25,777 22,415 5,142 3,263 30,820 4,920 (107) 4,813
X65700 Nonstate Warm Springs Public Service District 73,782 22,511 15,090 10,942 48,543 38,690 8,875 6,334 53,898 8,492 858 9,350
X65800 Nonstate Wilderness Public Service District 134,296 40,974 27,467 8,761 77,201 70,422 16,154 - 86,576 15,458 3,846 19,304
X65900 Nonstate Bradley Public Service District 84,771 25,864 17,338 4,087 47,288 44,452 10,197 - 54,649 9,757 1,694 11,451
X66000 Nonstate Wood County Recreation Commission 16,931 5,166 3,463 - 8,628 8,878 2,037 3,722 14,637 1,949 (1,377) 572
X66500 Nonstate Raleigh County Housing Authority 158,274 48,289 32,371 - 80,660 82,995 19,038 3,477 105,510 18,218 (1,166) 17,052
X66600 Nonstate Fairmont Housing Authority 346,769 105,799 70,923 18,243 194,964 181,838 41,711 - 223,549 39,914 7,155 47,069
X66700 Nonstate Town of Beverly 106,069 32,361 21,694 1,895 55,950 55,620 12,758 4,436 72,815 12,209 (645) 11,564
X66900 Nonstate Southern Conservation District 63,580 19,398 13,004 1,031 33,433 33,340 7,648 10,438 51,426 7,318 (4,254) 3,064
X67000 Nonstate Pocahontas County Public Service District 136,859 41,755 27,991 3,967 73,713 71,766 16,462 - 88,228 15,753 1,697 17,450
X67100 Nonstate Huttonsville Public Service District 108,146 32,995 22,118 25,830 80,944 56,709 13,008 - 69,718 12,448 9,828 22,276
X67200 Nonstate Grant County Housing Authority 42,790 13,055 8,752 1,121 22,928 22,438 5,147 - 27,585 4,925 466 5,391
X67300 Nonstate Board of Parks & Recreation Commission 229,739 70,093 46,987 - 117,080 120,470 27,634 16,195 164,299 26,443 (6,240) 20,203
X67400 Nonstate Putnam County Development Authority 51,937 15,846 10,622 1,595 28,063 27,235 6,247 2,876 36,358 5,978 (735) 5,243
X67500 Nonstate Taylor County Public Library 29,986 9,149 6,133 1,687 16,969 15,724 3,607 - 19,331 3,451 638 4,089
X67600 Nonstate Monroe Health Center 1,113,703 339,789 227,779 57,633 625,201 584,002 133,961 3,644 721,606 128,189 17,607 145,796
X67700 Nonstate Louis Bennett Public Library 23,431 7,149 4,792 3,850 15,791 12,287 2,818 7,619 22,724 2,697 (2,073) 624
X67800 Nonstate Region VIII Solid Waste Authority 113,278 34,561 23,168 24,334 82,063 59,400 13,625 - 73,026 13,038 9,815 22,853
X67900 Nonstate Roane County Public Library 43,952 13,410 8,989 5,317 27,716 23,047 5,287 - 28,334 5,059 2,235 7,294
X68300 Nonstate Cool Ridge-Flat Top Public Service District 55,176 16,834 11,285 8,932 37,051 28,933 6,637 - 35,570 6,351 3,781 10,132
X68400 Nonstate Dunbar Housing Authority 70,789 21,598 14,478 90 36,166 37,120 8,515 12,468 58,103 8,148 (4,117) 4,031
X68500 Nonstate Richwood Public Library 16,892 5,154 3,455 662 9,270 8,858 2,032 - 10,889 1,944 248 2,192
X68600 Nonstate Glenville Utility 158,012 48,209 32,317 2,868 83,394 82,858 19,006 1,418 103,282 18,187 790 18,977
X68700 Nonstate Flatwoods Canoe Run Public Service District 234,524 71,553 47,966 15,049 134,568 122,979 28,209 1,121 152,310 26,994 6,255 33,249
X68800 Nonstate Raleigh County Emergency Services 441,318 134,645 90,260 8,161 233,066 231,418 53,083 4,271 288,772 50,796 2,170 52,966
X68900 Nonstate Berkeley County Development Authority 72,352 22,075 14,798 3,634 40,506 37,940 8,703 3,588 50,231 8,328 (368) 7,960
X69000 Nonstate Mount Hope Housing Authority 67,567 20,615 13,819 2,734 37,168 35,431 8,127 3,539 47,097 7,777 (647) 7,130
X69100 Nonstate Doddridge County Public Library 37,151 11,335 7,598 2,885 21,818 19,481 4,469 - 23,950 4,276 1,130 5,406
X69200 Nonstate Berkeley County Public Service Sewer District 715,790 218,386 146,396 24,344 389,126 375,345 86,098 131,745 593,188 82,388 (49,921) 32,467
X69300 Nonstate Kanawha Public Service District 186,161 56,797 38,074 38,613 133,485 97,619 22,392 16,402 136,413 21,427 5,646 27,073
X69500 Nonstate Logan County Public Service District 638,300 194,744 130,548 30,672 355,964 334,711 76,777 - 411,488 73,469 13,083 86,552
X69800 Nonstate Workforce Investment Board of Kanawha County 78,165 23,848 15,987 4,266 44,101 40,988 9,402 42,974 93,364 8,997 (17,509) (8,512)
X69901 Nonstate Bluewell Public Service District 196,793 60,041 40,249 12,402 112,692 103,194 23,671 7,485 134,350 22,651 2,969 25,620
X70100 Nonstate Ritchie County Public Library 48,916 14,924 10,005 - 24,929 25,651 5,884 7,153 38,687 5,630 (2,454) 3,176
X70200 Nonstate Keyser Housing Authority 87,664 26,746 17,929 8,771 53,446 45,969 10,545 2,452 58,966 10,090 1,845 11,935
X70300 Nonstate Branchland Midkiff Public Service District 48,520 14,803 9,923 1,462 26,189 25,443 5,836 - 31,279 5,585 643 6,228
X70500 Nonstate Sugar Creek Public Service District 21,208 6,471 4,338 - 10,808 11,121 2,551 3,566 17,238 2,441 (1,365) 1,076
X70600 Nonstate Southwestern Water District 71,180 21,717 14,558 660 36,935 37,325 8,562 725 46,612 8,193 (98) 8,095
X70700 Nonstate Grant County Public Service District 86,664 26,441 17,725 2,748 46,914 45,445 10,424 3,907 59,776 9,975 (93) 9,882
X70800 Nonstate Big Bend Public Service District 48,475 14,790 9,914 2,776 27,480 25,419 5,831 1,378 32,628 5,580 763 6,343
X70900 Nonstate Benedum Airport Authority 238,539 72,778 48,787 37,650 159,215 125,085 28,692 - 153,777 27,456 14,445 41,901
X71100 Nonstate Valley Head Public Library 7,628 2,327 1,560 146 4,033 4,000 918 125 5,042 878 23 901
X71200 Nonstate Taylor County Public Service District 99,267 30,286 20,303 5,621 56,210 52,054 11,940 - 63,994 11,426 1,912 13,338
X71300 Nonstate Webster Springs Public Service District 45,342 13,834 9,274 917 24,024 23,777 5,454 19 29,250 5,219 297 5,516
X71400 Nonstate Eastern WV Regional Airport Authority 47,029 14,348 9,619 3,769 27,736 24,661 5,657 2,763 33,081 5,413 739 6,152
X71500 Nonstate Huntington Cabell Wayne Animal Shelter 27,038 8,249 5,530 - 13,779 14,178 3,252 25,028 42,458 3,112 (9,784) (6,672)
X71600 Nonstate Boone County Housing & Redevelopment Authority 101,105 30,847 20,678 3,211 54,736 53,017 12,161 2,551 67,729 11,637 563 12,200
X71700 Nonstate Craigsville Public Library 22,939 6,999 4,692 1,563 13,253 12,029 2,759 - 14,788 2,640 525 3,165
X71800 Nonstate Charleston Convention & Visitors Bureau 173,094 52,811 35,402 9,416 97,629 90,767 20,820 12,913 124,500 19,923 (157) 19,766
WEST VIRGINIA PUBLIC EMPLOYEES' RETIREMENT SYSTEM
SCHEDULE OF PENSION AMOUNTS BY EMPLOYER
As of and for the Year Ended June 30, 2015
Deferred Outflows of Resources Deferred Inflows of Resources Pension Expense

25
Employer
Number State/Nonstate Employer Name
Net Pension
Liability
Net Difference
Between
Projected and
Actual
Investment
Earnings on
Pension Plan
Investments
Differences
Between
Expected and
Actual
Experience
Changes in
Proportion and
Differences
Between
Employer
Contributions
and
Proportionate
Share of
Contributions
Total Deferred
Outflows of
Resources
Net Difference
Between
Projected and
Actual
Investment
Earnings on
Pension Plan
Investments
Deferred
Difference in
Assumptions
Changes in
Proportion and
Differences
Between
Employer
Contributions
and
Proportionate
Share of
Contributions
Total
Deferred
Inflows of
Resources
Proportionate
Share of
Pension
Expense
Net
Amortization of
Deferred
Amounts from
Changes in
Proportion and
Differences
Between
Employer
Contributions
and
Proportionate
Share of
Contributions
Total
Employer
Pension
Expense
X72000 Nonstate Randolph County Housing Authority 177,768 54,237 36,358 16,907 107,501 93,218 21,383 18,494 133,094 20,461 1,282 21,743
X72100 Nonstate Berkeley County Fire Service Board 53,411 16,296 10,924 16,345 43,565 28,008 6,425 - 34,432 6,148 7,179 13,327
X72300 Nonstate Cowen Public Service District 124,708 38,048 25,506 8,538 72,092 65,394 15,000 170 80,565 14,354 2,772 17,126
X72400 Nonstate Vienna Public Library 74,111 22,611 15,158 - 37,769 38,862 8,914 9,449 57,226 8,530 (3,172) 5,358
X72500 Nonstate White Oak Public Service District 51,887 15,831 10,612 4,124 30,567 27,208 6,241 - 33,450 5,972 1,744 7,716
X72600 Nonstate Marshall County Park & Recreation 91,936 28,049 18,803 13,875 60,727 48,209 11,058 7,848 67,115 10,582 1,168 11,750
X72700 Nonstate Martinsburg Berkeley County Parks & Recreation Board 224,663 68,544 45,949 30,588 145,081 117,808 27,023 - 144,832 25,859 12,435 38,294
X72900 Nonstate Mannington Sanitary Board 28,518 8,701 5,833 1,919 16,452 14,954 3,430 1,565 19,949 3,282 (50) 3,232
X73000 Nonstate Elk Valley Public Service District 131,018 39,973 26,796 13,476 80,246 68,703 15,759 15,026 99,489 15,080 928 16,008
X73100 Nonstate Lewis County Convention & Visitors Bureau 23,883 7,287 4,885 3,267 15,438 12,524 2,873 - 15,396 2,749 1,105 3,854
X73300 Nonstate Leadsville Public Service District 44,192 13,483 9,038 1,621 24,142 23,173 5,316 28,828 57,317 5,087 (8,896) (3,809)
X73500 Nonstate Union Williams Public Service District 163,333 49,833 33,406 4,801 88,039 85,648 19,646 269 105,564 18,800 1,483 20,283
X73600 Nonstate Coalfield Community Action Partnership Inc 961,583 293,377 196,667 14,826 504,870 504,233 115,663 21,920 641,816 110,679 (4,714) 105,965
X73900 Nonstate Tucker County Solid Waste Authority 128,304 39,145 26,241 251 65,638 67,280 15,433 2,250 84,963 14,768 (639) 14,129
X74000 Nonstate Hamrick Public Service District 53,283 16,257 10,898 2,145 29,299 27,940 6,409 - 34,349 6,133 814 6,947
X74200 Nonstate Raleigh County Solid Waste Authority 690,372 210,631 141,198 3,430 355,259 362,016 83,041 14,969 460,026 79,463 (3,479) 75,984
X74300 Nonstate Fayette County Solid Waste Authority 14,647 4,469 2,996 318 7,782 7,681 1,762 6 9,448 1,686 104 1,790
X74400 Nonstate Red Sulphur Public Service District 109,503 33,409 22,396 15,444 71,249 57,421 13,171 5,633 76,225 12,604 4,926 17,530
X74500 Nonstate Greenbrier County Public Service District #2 145,911 44,517 29,842 10,774 85,133 76,513 17,551 - 94,063 16,795 4,034 20,829
X74700 Nonstate Putnam County Fire Service Board 41,724 12,730 8,534 2,164 23,427 21,879 5,019 489 27,387 4,802 789 5,591
X74800 Nonstate Mercer County Solid Waste Authority 136,234 41,565 27,863 24,951 94,379 71,438 16,387 - 87,825 15,681 9,418 25,099
X74900 Nonstate 4C Economic Development Authority 103,947 31,714 21,260 21,942 74,916 54,508 12,503 - 67,011 11,964 8,511 20,475
X75000 Nonstate Kanawha County Solid Waste Authority 34,370 10,486 7,029 7,917 25,433 18,023 4,134 41,333 63,490 3,956 (15,569) (11,613)
X75200 Nonstate Lincoln Public Service District 117,254 35,774 23,981 1,806 61,561 61,485 14,104 16,121 91,710 13,496 (6,500) 6,996
X75300 Nonstate Sun Valley Public Service District 96,799 29,533 19,798 17,065 66,396 50,759 11,643 2,402 64,805 11,142 4,631 15,773
X75400 Nonstate Pocahontas County Solid Waste Authority 52,669 16,069 10,772 852 27,693 27,618 6,335 3,189 37,143 6,062 (689) 5,373
X75600 Nonstate Bluefield Housing Authority 128,003 39,053 26,180 1,260 66,493 67,122 15,397 17,271 99,790 14,733 (5,202) 9,531
X75800 Nonstate Romney Public Housing Authority 54,003 16,476 11,045 6,279 33,800 28,318 6,496 5,633 40,447 6,216 888 7,104
X75900 Nonstate Putnam County Solid Waste Authority 16,043 4,895 3,281 2,651 10,827 8,413 1,930 - 10,342 1,847 1,007 2,854
X76000 Nonstate Ohio County Solid Waste Authority 9,124 2,784 1,866 720 5,370 4,785 1,098 119 6,001 1,050 277 1,327
X76100 Nonstate Pleasants County Public Library 12,614 3,849 2,580 - 6,429 6,615 1,517 3,003 11,135 1,452 (1,151) 301
X76200 Nonstate Kingwood Parks & Recreation Commission 18,299 5,583 3,743 3,493 12,819 9,596 2,201 - 11,797 2,106 1,493 3,599
X76400 Nonstate Lynn Murray Memorial Library 17,590 5,367 3,598 2,916 11,880 9,224 2,116 2,246 13,585 2,025 (16) 2,009
X76500 Nonstate Swaney Memorial Library 9,437 2,879 1,930 - 4,809 4,949 1,135 4,050 10,134 1,086 (1,493) (407)
X76600 Nonstate Wood County Solid Waste Authority 10,291 3,140 2,105 10,497 15,742 5,397 1,238 - 6,634 1,185 3,500 4,685
X76800 Nonstate Mingo County Redevelopment Authority 96,760 29,521 19,790 4,955 54,266 50,739 11,639 24,840 87,218 11,137 (6,098) 5,039
X76900 Nonstate Mountain Top Public Service District 61,860 18,873 12,652 567 32,092 32,438 7,441 2,432 42,311 7,120 (562) 6,558
X77100 Nonstate Morgantown-Monongalia United Initiative 13,301 4,058 2,720 671 7,450 6,975 1,600 27,648 36,223 1,531 (8,922) (7,391)
X77200 Nonstate Northern Jackson County Public Service District 47,185 14,396 9,650 4,713 28,760 24,743 5,676 - 30,418 5,431 1,599 7,030
X77300 Nonstate Hammond Public Service District 78,294 23,887 16,013 19,440 59,340 41,056 9,417 6,135 56,608 9,012 3,779 12,791
X77400 Nonstate Harrison County Solid Waste Authority 52,456 16,004 10,729 - 26,733 27,507 6,310 18,959 52,776 6,038 (8,212) (2,174)
X77700 Nonstate Midland Public Service District 103,573 31,600 21,183 15,567 68,350 54,311 12,458 - 66,769 11,921 6,350 18,271
X77800 Nonstate Danese Public Service District 56,153 17,132 11,485 9,125 37,742 29,445 6,754 5,994 42,194 6,463 402 6,865
X77900 Nonstate Boone County Public Service District 113,914 34,755 23,298 4,528 62,581 59,734 13,702 2,890 76,326 13,112 236 13,348
X78200 Nonstate Grandview-Doolin Public Service District 48,559 14,815 9,931 4,397 29,144 25,463 5,841 - 31,304 5,589 1,687 7,276
X78300 Nonstate Jefferson County Parks & Recreation Commission 85,252 26,010 17,436 15,408 58,854 44,704 10,254 7,610 62,568 9,813 4,251 14,064
X78400 Nonstate Putnam Public Service District 746,134 227,644 152,602 11,351 391,597 391,256 89,748 4,420 485,424 85,881 3,527 89,408
X78600 Nonstate Chestnut Ridge Public Service District 50,022 15,262 10,231 844 26,336 26,230 6,017 - 32,247 5,758 354 6,112
X78700 Nonstate Weirton Transit Corporation 49,826 15,202 10,191 7,750 33,143 26,128 5,993 6,642 38,763 5,735 1,200 6,935
X78800 Nonstate Greenbrier County Solid Waste Authority 115,433 35,218 23,609 5,048 63,875 60,531 13,885 21,172 95,587 13,287 (4,834) 8,453
WEST VIRGINIA PUBLIC EMPLOYEES' RETIREMENT SYSTEM
SCHEDULE OF PENSION AMOUNTS BY EMPLOYER
As of and for the Year Ended June 30, 2015
Deferred Outflows of Resources Deferred Inflows of Resources Pension Expense

26
Employer
Number State/Nonstate Employer Name
Net Pension
Liability
Net Difference
Between
Projected and
Actual
Investment
Earnings on
Pension Plan
Investments
Differences
Between
Expected and
Actual
Experience
Changes in
Proportion and
Differences
Between
Employer
Contributions
and
Proportionate
Share of
Contributions
Total Deferred
Outflows of
Resources
Net Difference
Between
Projected and
Actual
Investment
Earnings on
Pension Plan
Investments
Deferred
Difference in
Assumptions
Changes in
Proportion and
Differences
Between
Employer
Contributions
and
Proportionate
Share of
Contributions
Total
Deferred
Inflows of
Resources
Proportionate
Share of
Pension
Expense
Net
Amortization of
Deferred
Amounts from
Changes in
Proportion and
Differences
Between
Employer
Contributions
and
Proportionate
Share of
Contributions
Total
Employer
Pension
Expense
X78900 Nonstate Harpers Ferry Bolivar Public Service District 47,520 14,498 9,719 2,967 27,184 24,919 5,716 3,506 34,140 5,470 (554) 4,916
X79100 Nonstate Jefferson County Public Service District 197,686 60,314 40,432 2,939 103,684 103,662 23,778 1,076 128,517 22,754 936 23,690
X79300 Nonstate Barbour County Development Authority 2,608 796 533 - 1,329 1,367 314 7,340 9,021 300 (2,516) (2,216)
X79400 Nonstate Wyoming County Economic Development Authority 48,107 14,677 9,839 3,556 28,072 25,226 5,786 - 31,012 5,537 1,476 7,013
X79600 Nonstate Northern Wayne County Public Service District 110,067 33,581 22,511 12,767 68,860 57,717 13,239 - 70,956 12,669 4,993 17,662
X79700 Nonstate Lincoln Economic Development Authority 24,268 7,404 4,963 717 13,085 12,726 2,919 1,011 16,656 2,793 (205) 2,588
X79800 Nonstate Gauley River Public Service District 54,344 16,580 11,115 - 27,695 28,497 6,537 1,840 36,873 6,255 (685) 5,570
X79900 Nonstate Elkins Road Public Service District 36,508 11,139 7,467 162 18,768 19,144 4,391 - 23,536 4,202 58 4,260
X80300 Nonstate Crab Orchard MacArthur Public Service District 166,946 50,935 34,144 15,972 101,051 87,543 20,081 759 108,383 19,216 4,990 24,206
X80400 Nonstate McDowell County Emergency Commission 179,683 54,821 36,750 36,916 128,487 94,222 21,613 - 115,835 20,682 14,300 34,982
X80500 Nonstate Roane County Economic Development Authority 14,384 4,389 2,942 2,454 9,785 7,543 1,730 - 9,273 1,656 1,002 2,658
X80600 Nonstate Metro Emergency Operations Center 1,396,931 426,201 285,706 57,008 768,915 732,521 168,028 - 900,549 160,789 22,247 183,036
X80700 Nonstate Mercer County Airport Authority 56,617 17,274 11,579 13,461 42,314 29,689 6,810 - 36,499 6,517 5,492 12,009
X80900 Nonstate Town of Eleanor 48,542 14,810 9,928 2,529 27,267 25,454 5,839 - 31,293 5,587 1,083 6,670
X81100 Nonstate Wetzel County Emergency Ambulance Authority 9,833 3,000 2,011 846 5,857 5,156 1,183 159 6,498 1,132 319 1,451
X81200 Nonstate Town of Harpers Ferry 178,354 54,416 36,478 - 90,893 93,525 21,453 9,540 124,518 20,529 (3,446) 17,083
X81400 Nonstate Upper Kanawha Valley Enterprise Community 32,131 9,803 6,571 - 16,374 16,849 3,865 33,318 54,031 3,698 (12,271) (8,573)
X81500 Nonstate Town of Whitesville - - - - - - - 6,180 6,180 - (2,723) (2,723)
X81600 Nonstate Brooke County Public Service District 48,347 14,750 9,888 8,042 32,681 25,352 5,815 8,954 40,121 5,565 558 6,123
X81700 Nonstate Hancock County Shelter Workshop 412,688 125,910 84,405 - 210,315 216,405 49,640 28,777 294,822 47,501 (11,265) 36,236
X81900 Nonstate Hampshire County Development Authority 43,851 13,379 8,969 490 22,838 22,995 5,275 654 28,923 5,047 (3) 5,044
X82000 Nonstate Crum Public Service District 55,740 17,006 11,400 9,826 38,232 29,229 6,705 - 35,933 6,416 3,496 9,912
X82100 Nonstate Central Communications Inc 163,272 49,814 33,393 2,568 85,775 85,616 19,639 1,553 106,808 18,793 173 18,966
X82200 Nonstate Corridor G Regional Development Authority 18,528 5,653 3,789 1,523 10,965 9,716 2,229 979 12,923 2,133 344 2,477
X82300 Nonstate Tucker County Parks and Recreation Commission 11,190 3,414 2,289 - 5,703 5,868 1,346 791 8,005 1,288 (321) 967
X82400 Nonstate Berkeley County Emergency Ambulance Authority 85,626 26,124 17,513 5,196 48,833 44,900 10,299 17,168 72,368 9,856 (3,434) 6,422
X82600 Nonstate Raleigh County Recreation Authority 41,886 12,779 8,567 17,407 38,753 21,964 5,038 - 27,002 4,821 7,521 12,342
X82700 Nonstate Enlarged Hepzibah Public Service District 59,364 18,112 12,141 12,121 42,374 31,129 7,141 7,419 45,689 6,833 773 7,606
X82900 Nonstate County Commissioners Association of WV 47,766 14,573 9,769 4,377 28,720 25,047 5,745 - 30,793 5,498 1,584 7,082
X83100 Nonstate Greenbrier County Convention & Visitor Bureau 89,741 27,380 18,354 6,738 52,472 47,058 10,794 2,441 60,294 10,329 1,172 11,501
X83300 Nonstate Boone County Ambulance Authority 73,246 22,347 14,981 - 37,328 38,409 8,810 42,471 89,690 8,431 (16,248) (7,817)
X83500 Nonstate Hamlin-Lincoln County Public Library 57,141 17,434 11,687 2,467 31,588 29,964 6,873 - 36,837 6,577 1,066 7,643
X83700 Nonstate Greater Paw Paw Sanitary District 37,938 11,575 7,759 8,003 27,337 19,894 4,563 641 25,098 4,367 2,386 6,753
X83900 Nonstate Greenbrier County Housing Authority 52,725 16,086 10,783 7,985 34,855 27,648 6,342 8,025 42,014 6,069 842 6,911
X84100 Nonstate Elkins-Randolph County Airport 19,600 5,980 4,009 3,286 13,275 10,278 2,358 7 12,642 2,256 1,093 3,349
X84300 Nonstate Summers County Public Library 26,373 8,046 5,394 774 14,214 13,830 3,172 4,644 21,646 3,036 (1,787) 1,249
X84400 Nonstate Ritchie County Economic Development Authority 16,959 5,174 3,468 927 9,570 8,893 2,040 - 10,933 1,952 356 2,308
X84600 Nonstate West Virginia Municipal League 113,306 34,569 23,174 3,707 61,450 59,415 13,629 516 73,560 13,042 1,010 14,052
X84700 Nonstate Pride Community Services Inc 494,774 150,955 101,193 35,409 287,557 259,449 59,513 - 318,962 56,949 11,960 68,909
X84900 Nonstate Jackson County Development Authority 47,492 14,490 9,713 3,463 27,666 24,904 5,713 6,579 37,195 5,466 (1,743) 3,723
X85000 Nonstate Five Rivers Public Library 16,869 5,147 3,450 943 9,540 8,846 2,029 - 10,875 1,942 384 2,326
X85100 Nonstate Hardy County Public Service District 106,828 32,593 21,849 10,629 65,071 56,018 12,850 - 68,868 12,296 4,639 16,935
X85200 Nonstate Ritchie County Ambulance Authority 249,769 76,204 51,084 14,934 142,222 130,973 30,043 6,914 167,930 28,749 4,273 33,022
X85300 Nonstate Preston County Senior Citizens Inc 176,891 53,969 36,178 - 90,148 92,758 21,277 4,729 118,764 20,360 (1,929) 18,431
X85500 Nonstate Piedmont Housing Authority 56,695 17,297 11,595 - 28,893 29,730 6,819 27,220 63,769 6,526 (9,927) (3,401)
X85700 Nonstate Benwood-McMechen Housing Authority 112,139 34,213 22,935 419 57,567 58,803 13,488 2,352 74,644 12,907 (601) 12,306
X85800 Nonstate Fairmont Marion County Transit Authority 339,175 103,482 69,369 15,522 188,373 177,856 40,797 - 218,653 39,039 6,408 45,447
X85900 Nonstate Midland Trail Scenic Highway - - - - - - - 38,620 38,620 - (17,014) (17,014)
X86000 Nonstate Nicholas County Solid Waste Authority 143,286 43,716 29,306 - 73,022 75,136 17,235 105,942 198,313 16,492 (37,017) (20,525)
X86100 Nonstate Hatfield McCoy Regional Recreation Authority 346,149 105,609 70,796 89,627 266,032 181,513 41,636 - 223,149 39,842 33,831 73,673
WEST VIRGINIA PUBLIC EMPLOYEES' RETIREMENT SYSTEM
SCHEDULE OF PENSION AMOUNTS BY EMPLOYER
As of and for the Year Ended June 30, 2015
Deferred Outflows of Resources Deferred Inflows of Resources Pension Expense

27
Employer
Number State/Nonstate Employer Name
Net Pension
Liability
Net Difference
Between
Projected and
Actual
Investment
Earnings on
Pension Plan
Investments
Differences
Between
Expected and
Actual
Experience
Changes in
Proportion and
Differences
Between
Employer
Contributions
and
Proportionate
Share of
Contributions
Total Deferred
Outflows of
Resources
Net Difference
Between
Projected and
Actual
Investment
Earnings on
Pension Plan
Investments
Deferred
Difference in
Assumptions
Changes in
Proportion and
Differences
Between
Employer
Contributions
and
Proportionate
Share of
Contributions
Total
Deferred
Inflows of
Resources
Proportionate
Share of
Pension
Expense
Net
Amortization of
Deferred
Amounts from
Changes in
Proportion and
Differences
Between
Employer
Contributions
and
Proportionate
Share of
Contributions
Total
Employer
Pension
Expense
X86400 Nonstate City of Martinsburg 1,685,537 514,254 344,733 28,637 887,624 883,859 202,743 - 1,086,602 194,007 12,545 206,552
X86500 Nonstate City of Point Pleasant 418,200 127,592 85,532 - 213,124 219,295 50,303 35,984 305,582 48,135 (15,540) 32,595
X86700 Nonstate Norton-Harding-Jimtown Public Service District 30,349 9,260 6,207 201 15,668 15,914 3,651 1,082 20,647 3,493 (273) 3,220
X86800 Nonstate Clarksburg-Harrison Regional Housing Authority 324,433 98,984 66,354 4,528 169,866 170,126 39,024 5,447 214,597 37,343 (890) 36,453
X86900 Nonstate Marshall County Public Service District #4 45,259 13,808 9,256 13,368 36,433 23,733 5,444 12,056 41,233 5,209 (854) 4,355
X87000 Nonstate Northern Panhandle Community Criminal Justice Board 231,391 70,597 47,325 64,816 182,738 121,337 27,833 - 149,169 26,633 25,327 51,960
X87200 Nonstate Region 1 Workforce Investment Board 199,434 60,847 40,789 5,138 106,774 104,579 23,989 71,413 199,981 22,955 (29,747) (6,792)
X87300 Nonstate Century Volga Public Service District 67,690 20,652 13,844 14,948 49,444 35,495 8,142 285 43,922 7,791 6,490 14,281
X87400 Nonstate Frankfort Public Service District 184,458 56,278 37,726 - 94,004 96,726 22,187 7,287 126,200 21,231 (2,828) 18,403
X87500 Nonstate WV Affordable Housing Trust Fund 24,553 7,491 5,022 199 12,712 12,875 2,953 10 15,838 2,826 62 2,888
X87600 Nonstate Clay County Public Service District 40,557 12,374 8,295 - 20,669 21,267 4,878 7,607 33,752 4,668 (2,955) 1,713
X87700 Nonstate Adrian Public Service District 45,817 13,979 9,371 4,670 28,019 24,025 5,511 - 29,537 5,274 2,044 7,318
X87900 Nonstate Marshal County Public Service District #3 54,941 16,763 11,237 22,231 50,230 28,810 6,609 - 35,419 6,324 8,861 15,185
X88000 Nonstate Mercer County Communications Center 249,713 76,187 51,072 - 127,259 130,944 30,036 9,430 170,410 28,742 (3,435) 25,307
X88100 Nonstate Charles Town Utitlity Board 479,021 146,148 97,971 33,085 277,205 251,188 57,619 - 308,807 55,136 11,154 66,290
X88200 Nonstate Phillippi Public Library 11,676 3,562 2,388 966 6,916 6,123 1,404 - 7,527 1,344 380 1,724
X88300 Nonstate Cottageville Public Service District 66,590 20,316 13,619 11,348 45,284 34,918 8,010 2,438 45,366 7,665 4,186 11,851
X88400 Nonstate Mingo County Public Service District 209,809 64,012 42,911 866 107,789 110,019 25,237 8,828 144,084 24,149 (2,562) 21,587
X88500 Nonstate City of Sistersville 147,681 45,057 30,204 1,071 76,333 77,441 17,764 26,468 121,672 16,998 (11,303) 5,695
X88700 Nonstate Canaan Valley Public Service District 27,792 8,479 5,684 7,029 21,192 14,573 3,343 1,646 19,562 3,199 2,548 5,747
X88900 Nonstate McDowell County Solid Waste Authority 22,850 6,971 4,673 12,618 24,263 11,982 2,748 302 15,032 2,630 5,458 8,088
X89000 Nonstate Monongalia County Urban Mass Transit Authority 34,387 10,491 7,033 - 17,524 18,032 4,136 11,912 34,080 3,958 (4,455) (497)
X89100 Nonstate Ohio County Development Authority 286,500 87,411 58,596 203,322 349,329 150,235 34,461 - 184,696 32,977 84,992 117,969
X90001 Nonstate Public Defender Corporation - 1st Judicial Circuit 293,062 89,413 59,938 1,822 151,173 153,675 35,251 13,500 202,426 33,732 (5,339) 28,393
X90002 Nonstate Public Defender Corporation - 2nd Judicial Circuit 122,313 37,317 25,016 6,386 68,719 64,138 14,712 6,032 84,882 14,078 802 14,880
X90005 Nonstate Public Defender Corporation - 5th Judicial Circuit 213,048 65,001 43,573 13,471 122,045 111,718 25,626 1,292 138,636 24,522 5,503 30,025
X90006 Nonstate Public Defender Corporation for the Sixth & Twenty-Fourth Circui 475,743 145,148 97,301 52,627 295,076 249,470 57,224 - 306,694 54,759 19,780 74,539
X90007 Nonstate Public Defender Corporation - 7th Judicial Circuit 146,363 44,655 29,935 43 74,633 76,750 17,605 10,594 104,949 16,847 (3,513) 13,334
X90008 Nonstate Public Defender Corporation for the Eighth Judicial Circuit 114,523 34,941 23,423 233 58,596 60,053 13,775 3,942 77,771 13,182 (1,659) 11,523
X90009 Nonstate Public Defender Corporation for the Ninth Judicial Circuit 231,280 70,563 47,302 8,020 125,885 121,278 27,819 6,431 155,528 26,621 1,389 28,010
X90010 Nonstate Public Defender Corporation for the Tenth Judicial Circuit 272,618 83,175 55,757 6,477 145,409 142,955 32,792 10,139 185,886 31,379 (527) 30,852
X90011 Nonstate Public Defender Corporation - 11th Judicial Circuit 140,634 42,907 28,763 8,661 80,331 73,745 16,916 8,453 99,114 16,187 998 17,185
X90012 Nonstate Public Defender Corporation - 12th Judicial Circuit 138,495 42,255 28,326 228 70,808 72,624 16,659 5,299 94,582 15,941 (2,258) 13,683
X90013 Nonstate Public Defender Corporation - 13th Judicial Circuit 753,700 229,953 154,150 - 384,102 395,224 90,658 142,798 628,680 86,752 (49,305) 37,447
X90015 Nonstate Public Defender Corporation for the Fifteenth Judicial Circuit 267,420 81,589 54,694 - 136,283 140,229 32,166 12,406 184,801 30,780 (4,566) 26,214
X90018 Nonstate Public Defender Corporation - 18th Judicial Circuit 110,128 33,600 22,524 210 56,334 57,749 13,247 3,670 74,666 12,676 (1,546) 11,130
X90023 Nonstate Public Defender Corporation - 23rd Judicial Circuit 616,958 188,233 126,183 - 314,416 323,520 74,210 31,101 428,831 71,013 (11,585) 59,428
X90025 Nonstate Public Defender Corporation - 25th Judicial Circuit 204,080 62,264 41,739 8,262 112,266 107,015 24,548 - 131,563 23,490 2,823 26,313
X90028 Nonstate 28th Judicial Circuit Public Defender Corp 87,843 26,801 17,966 755 45,521 46,063 10,566 - 56,629 10,111 281 10,392
X90030 Nonstate Public Defender Corporation for the Thirtieth Judicial Circuit 135,513 41,345 27,716 - 69,061 71,060 16,300 3,410 90,770 15,598 (1,144) 14,454
X99903 Nonstate Boone County Board of Education 5,137 1,567 1,051 2,314 4,932 2,694 618 1,635 4,947 591 475 1,066
X99908 Nonstate Clay County Board of Education 1,452 443 297 - 740 761 175 2,057 2,993 167 (687) (520)
X99911 Nonstate Gilmer County Board of Education 1,385 423 283 347 1,053 726 167 427 1,320 159 10 169
X99918 Nonstate Jackson County Board of Education 5,009 1,528 1,024 120 2,673 2,627 602 - 3,229 577 52 629
X99919 Nonstate Jefferson County Board of Education - - - - - - - 1,564 1,564 - (689) (689)
X99925 Nonstate Marion County Board of Education 4,283 1,307 876 5,790 7,973 2,246 515 2,438 5,199 493 1,738 2,231
X99926 Nonstate Lincoln County Board of Education 4,612 1,407 943 171 2,522 2,419 555 57 3,030 531 57 588
X99931 Nonstate McDowell County Board of Education 7,114 2,170 1,455 1,676 5,301 3,730 856 2,067 6,653 819 48 867
X99935 Nonstate Ohio County Board of Education - - - 1,853 1,853 - - 2,313 2,313 - 45 45
X99936 Nonstate Pendleton County Board of Education 2,965 905 606 578 2,089 1,555 357 922 2,834 341 (54) 287
WEST VIRGINIA PUBLIC EMPLOYEES' RETIREMENT SYSTEM
SCHEDULE OF PENSION AMOUNTS BY EMPLOYER
As of and for the Year Ended June 30, 2015
Deferred Outflows of Resources Deferred Inflows of Resources Pension Expense

28
Employer
Number State/Nonstate Employer Name
Net Pension
Liability
Net Difference
Between
Projected and
Actual
Investment
Earnings on
Pension Plan
Investments
Differences
Between
Expected and
Actual
Experience
Changes in
Proportion and
Differences
Between
Employer
Contributions
and
Proportionate
Share of
Contributions
Total Deferred
Outflows of
Resources
Net Difference
Between
Projected and
Actual
Investment
Earnings on
Pension Plan
Investments
Deferred
Difference in
Assumptions
Changes in
Proportion and
Differences
Between
Employer
Contributions
and
Proportionate
Share of
Contributions
Total
Deferred
Inflows of
Resources
Proportionate
Share of
Pension
Expense
Net
Amortization of
Deferred
Amounts from
Changes in
Proportion and
Differences
Between
Employer
Contributions
and
Proportionate
Share of
Contributions
Total
Employer
Pension
Expense
X99937 Nonstate Pocahontas County Board of Education 6,589 2,010 1,348 2,420 5,778 3,455 793 - 4,248 758 813 1,571
X99940 Nonstate Tyler County Board of Education 2,306 704 472 360 1,535 1,209 277 - 1,487 265 133 398
X99941 Nonstate Hancock County Board of Education 3,295 1,005 674 288 1,967 1,728 396 39 2,163 379 113 492
X99942 Nonstate Putnam County Board of Education - - - - - - - 1,524 1,524 - (620) (620)
X99955 Nonstate Wyoming County Board of Education 2,440 745 499 2,336 3,580 1,280 294 - 1,573 281 871 1,152
X99960 Nonstate Raleigh County Board of Education 6,193 1,889 1,267 5,790 8,946 3,247 745 489 4,481 713 2,387 3,100
X99961 Nonstate Harrison County Board of Education - - - 405 405 - - 478 478 - 19 19
558,404,000 170,368,000 114,207,000 18,932,411 303,507,411 292,815,000 67,167,000 18,932,411 378,914,411 64,273,000 - 64,273,000
The accompanying notes are an integral part of this schedule.
WEST VIRGINIA PUBLIC EMPLOYEES' RETIREMENT SYSTEM
SCHEDULE OF PENSION AMOUNTS BY EMPLOYER
As of and for the Year Ended June 30, 2015
Deferred Outflows of Resources Deferred Inflows of Resources Pension Expense

29
WEST VIRGINIA PUBLIC EMPLOYEES’ RETIREMENT SYSTEM
NOTES TO SCHEDULES OF EMPLOYER ALLOCATIONS AND PENSION AMOUNTS BY EMPLOYER
1 - SUMMARY OF SIGNIFICANT ACCOUNTING POLICIES Introduction
The Government Accounting Standards Board (GASB) Statement No. 68, Accounting and Financial Reporting for Pensions, establishes financial reporting requirements for governments that provide employees with pension benefits. GASB 68 requires governmental employers to recognize a net pension liability and/or a net pension asset as employees earn pension benefits. Governments participating in the West Virginia Public Employees’ Retirement System (the PERS) will recognize their proportionate share of the collective pension amounts for all benefits provided through the plan.
Basis of Accounting
The schedules of employer allocations and pension amounts by employer for the PERS have been prepared in conformity with accounting principles generally accepted in the United States of America (GAAP) as applied to governmental units. The GASB is the accepted standard setting body for establishing governmental accounting and financial reporting principles for governmental units. Basis of Allocation Pension amounts have been allocated to each participating employer based on their proportionate share of employer contributions to the PERS for the fiscal year ended June 30, 2015. Employer contributions are recognized when due. Retroactive service, military service, out of state service, and back pay employer contributions have been excluded from the allocation.
Accounting Estimates
The preparation of the schedule of employer allocations and pension amounts by employer in accordance with accounting principles generally accepted in the United States of America requires management to make estimates and assumptions that affect the reported amounts of the net pension liability, deferred inflows of resources, deferred outflows of resources, and pension expense as of the measurement date. Actual amounts could differ from those estimates. Measurement Date Net pension liability, deferred inflows of resources, deferred outflows of resources, and pension expense were determined by actuarial valuations as of June 30, 2014 rolled forward to June 30, 2015, which is the measurement date.
2 - AMORTIZATION The net difference between projected and actual investment earnings on pension plan investments is amortized over a five year period. All other deferred outflows of resources and deferred inflows of resources relating to pension amounts reported in these schedules are amortized and included in pension expense over the average remaining service life, rounded to the nearest whole year, of 4 years. The amortization of the deferred outflows and deferred inflows related to changes in the proportionate share of contributions from year to year for each entity is available from the West Virginia Consolidated Public Retirement Board.

30
WEST VIRGINIA PUBLIC EMPLOYEES’ RETIREMENT SYSTEM
NOTES TO SCHEDULES OF EMPLOYER ALLOCATIONS AND PENSION AMOUNTS
(Continued)
2 - AMORTIZATION (Continued)
Information regarding the amortization of deferred outflows and deferred inflows of resources related to pension amounts are as follows.
Net Difference Between Projected and Actual Investment Earnings on Pension Plan Investments (in thousands):
Deferred Deferred Outflows of Inflows of
Measurement date 6/30 2014 2015 Resources Resources Total
Amount $ (488,025) $ 212,961 Recognition period (years) 5.00 5.00 Amount recognized in fiscal year
2014 $ (97,605) $ - $ - $ (97,605) $ (97,605) 2015 (97,605) 42,593 42,593 (97,605) (55,012) 2016 (97,605) 42,593 42,593 (97,605) (55,012) 2017 (97,605) 42,593 42,593 (97,605) (55,012) 2018 (97,605) 42,593 42,593 (97,605) (55,012) 2019 - 42,589 42,589 - 42,589
Balance as of June 30 2014 $ (390,420) $ - $ - $ (390,420) $ (390,420)2015 (292,815) 170,368 170,368 (292,815) (122,447) 2016 (195,210) 127,775 127,775 (195,210) (67,435) 2017 (97,605) 85,182 85,182 (97,605) (12,423) 2018 - 42,589 42,589 - 42,589
Differences Between Expected and Actual Experience (in thousands):
Deferred Deferred Outflows of Inflows of
Measurement date 6/30 2014 2015 Resources Resources Total
Amount $ - $ 152,277Recognition period (years) 4.00 Amount recognized in fiscal year
2014 $ - $ - $ - $ - $ - 2015 - 38,070 38,070 - 38,0702016 - 38,070 38,070 - 38,0702017 - 38,070 38,070 - 38,0702018 - 38,067 38,067 - 38,067
Balance as of June 30 2014 $ - $ - $ - $ - $ - 2015 - 114,207 114,207 - 114,2072016 - 76,137 76,137 - 76,1372017 - 38,067 38,067 - 38,067

31
WEST VIRGINIA PUBLIC EMPLOYEES’ RETIREMENT SYSTEM
NOTES TO SCHEDULES OF EMPLOYER ALLOCATIONS AND PENSION AMOUNTS
(Continued)
2 - AMORTIZATION (Continued)
Changes of Assumptions (in thousands) Deferred Deferred June 30 June 30 Outflows of Inflows of Measurement date 6/30 2014 2015 Resources Resources Total
Amount $ - $ (89,556) Recognition period (years) 4.00 Amount recognized in fiscal year 2014 $ - $ - $ - $ - $ - 2015 - (22,389) - (22,389) (22,389) 2016 - (22,389) - (22,389) (22,389) 2017 - (22,389) - (22,389) (22,389) 2018 - (22,389) - (22,389) (22,389) Balance as of June 30 2014 $ - $ - $ - $ - $ - 2015 - (61,167) - (67,167) (67,167) 2016 - (44,778) - (44,778) (44,778) 2017 - (22,389) - (22,389) (22,389)
3 - ACTUARIAL REVISIONS
Subsequent to the issuance of the West Virginia Consolidated Public Retirement Board’s June 30, 2015 Comprehensive Annual Financial Report, certain actuarial amounts from the actuarial valuation as of June 30, 2014 rolled forward to June 30, 2015 were revised relating to the PERS. The amounts revised as of June 30, 2015 were used to prepare these schedules and are described below: Total pension liability $ 6,411,960,000 Plan fiduciary net position (5,853,556,000) Net pension liability $ 558,404,000 Plan fiduciary net position as a percentage of the total pension liability 91.29% Current 1% Decrease Discount Rate 1% Increase Sensitivity of Discount Rate (6.5%) (7.5%) (8.5%) Total net pension liability (asset) $ 1,287,826,000 $ 558,404,000 $ (57,848,000)