the wealth of stellar variability
TRANSCRIPT

The CoRoT Legacy Bookc© The authors, 2016DOI: 10.1051/978-2-7598-1876-1.c043
IV.3The wealth of stellar variability
Stellar rotation and activity, Binaries and Stars with disksF. Baudin1, C. Maceroni2, and S. H. P. Alencar3
1 Institut d’Astrophysique Spatiale, UMR8617, CNRS, Universite Paris XI, Batiment 121, 91405 Orsay Cedex, France2 INAF-Osservatorio Astronomico di Roma, via di Frascati 33, 00040 Monteporzio Catone, Italy
3 Departamento de Fısica – ICEx – Universidade Federal de Minas Gerais Av. Antonio Carlos, 6627 – 31270-901 Belo Horizonte, MG –Brasil
1. IntroductionCoRoT made a decisive step forward not only in stellar seis-mology and galactic populations studies but also in a num-ber of other physical phenomena encompassed by stellarvariability. Surface activity is one example and is the out-ward sign of surface rotation and magnetic activity as de-scribed in Sect. 2. In this domain, CoRoT observations mo-tivated the investigation of the surface rotational behaviorof stars along with their evolution (Sect. 2.1), the highlight-ing of spot evolution and magnetic cycles (Sect. 2.2), as wellas the study of surface convection across the Hertzsprung–Russell diagram (Sect. 2.3). CoRoT’s dataset then openedthe way to a multivariate-like approach in which rotation,convection, and magnetic field are investigated together askey ingredients of stellar dynamos. Moreover, it is worthmentioning that such studies were previously restricted tothe Sun but, with the advent of ultra-precise and long-duration photometry, we are beginning to address similarissues in other stars.
CoRoT also led to important advances in the field of bi-nary stars as described in Sect. 3. Indeed, a few targets inthe bright fields were dedicated to the observation of knownbinaries but it appears that a large number of binaries havebeen discovered in the faint fields. As for red giants, thisled to a number of discoveries and surprises. For instance,it allowed for statistical investigations (Sect. 3.1) as well asthe discovery of new type of binary stars (Sect. 3.2). In thatrespect, CoRoT’s main contributions relied on the precisionand the duration of the observations which made it possibleto follow the evolution of several binary systems and to un-ravel physical processes occuring on different time-scales.Finally, CoRoT’s observations demonstrated the fruitfulsynergy between binarity and asteroseismology as a tool fordetermining independently the stellar parameters of eachcomponent (Sect. 3.3).
Last but not least, a rich harvest of observational con-straints has been obtained on young stars as described in
Sect. 4. This allowed a further step in our knowledge ofstar-disk interactions which is crucial for the scenarios ofstar formation but also for our understanding of the initialsteps of stellar evolution. A striking example is the coordi-nated synoptic investigation of NGC 2264 (Sect. 4.2), whichconsisted in a multiwavelenght observational campaign in-cluding space-borne and ground-based facilities. Due to itsintrinsic abilities, CoRoT contributed significantly by pro-viding 40 days of continuous observations. This campaignmade it possible to investigate several young stars and theirenvironement by providing a wealth of data which led to aharvest of scientific results.
2. Stellar rotation and activity(by F. Baudin)
The two main objectives of the CoRoT mission (namelysearch for exoplanets and stellar seismology) were basedon a sole capacity: ultra precise photometry. This capac-ity allows many more scientific objectives to be aimed at,concerning the physics responsible for the micro-variabilityof stars, beyond that caused by oscillations. Manifestationsof magnetic fields and signature of granulation are amongthe main sources of this micro-variability (binaries or stellardisks for example are others, see Sects. 3 and 4).
2.1. Thousands of star’s rotation periodsmeasured
Stars show very different behaviors concerning their rota-tion. Some rotate faster than others, some show differentialrotation (in surface or in their interior - but here, we willfocus on surface rotation). These behaviors are related tothe structure and evolution of the stars and are also a fon-damental ingredient of stellar magnetism (with a direct ap-plication to gyrochronology). Rotation is driven by several
209

The CoRoT Legacy Book
mechanisms, mainly star contraction and expansion dur-ing its evolution, but also its interaction with its disk inits early phases of evolution. CoRoT data, thanks to theirultra-high photometric precision for a very large sample ofstars, are perfectly suited to tackle the questions related tothese physical mechanisms.
Among works aiming at rotation measurements basedon CoRoT data, Affer et al. (2012) used some of the firstobservation runs, LRc01 and LRa01, thus covering fieldstars in the center and anti-center directions. An initialsample of 8341 light curves was used to measure rotationperiods by two methods: the Lomb-Scargle Normalized pe-riodogram and an auto-correlation analysis. About 2000light curves had to be rejected because of the discontinu-ities caused by particle impacts on the detector1. Finally,after checking for coherence between the two analysis meth-ods and some other rejections (due for example to eclips-ing binaries or pulsators), a total of 1727 periods of rota-tions were reliably measured, including F, G and K stars(however, only 4 F stars were identified in the center direc-tion preventing any interpretation). Resulting distributionsshow bimodal shapes (Fig. IV.3.1). A first peak, with pe-riods from 5 to 15 days is interpreted as representing apopulation of young stars, while a second peak, includingperiods from 15 to 35 days is interpreted as due to an olderpopulation. Using gyrochronology expressing the rotationperiod as a function of age and B − V , Affer et al. (2012)have found that more than 500 stars of their sample areyounger than the Hyades (∼650 Myr). The observed sam-ple is consistent with results from X-ray surveys supportingthe presence of an excess of young stars in the solar neigh-borhood. However, as pointed out by the authors, it shouldnot be forgotten that the CoRoT sample is biased towardsdwarfs because of the exoplanet search objective that drovethe target selection.
An even larger analysis was performed by De Medeiroset al. (2013) who started from all light curves available atthat time (a total of 124 471). The analysis was based ona semi-automated process and a severe selection of lightcurves in order to ensure the reliability of the results.Among other criteria, this selection process rejected lowsignal-to-noise ratios and tested against signals that couldmimic that of rotation modulation, such as semi-regularpulsators’. Attention was also paid to the influence of dis-continuities in the data1. This process resulted in the mea-surement of 4206 rotation periods, across the H-R diagram(Fig. IV.3.3). 216 targets were common with Affer et al.(2012) and the results show an excellent agreement withthem. Results (Fig. IV.3.4) show an increase of rotationperiods with the color difference J − H (which increaseswith increasing effective temperature - for main sequencestars and unreddened measurements). This increase can beat least partially explained by evolution since higher valuesof J −H correspond to a bias towards evolved –thus rotat-ing slower– stars, as seen in Fig. IV.3.3 . An excess of longperiods is noted in the galactic center, due to an excess ofgiants, whereas in the total sample, only one star is similarto the Sun in terms of rotation period and J −H value.
As mentioned by several authors, rotation measure-ments are obviously biased towards young stars since theyare more active and thus showing clearer photometric
1 Early versions of data were used for this work but most ofthese discontinuities are now corrected in the final version.
Fig. IV.3.1. Figure 10 of showing the bi-modal distribution ofthe rotation periods of the field stars they studied c© MNRAS,424, 11.
Fig. IV.3.2. Figure 5 of showing the distribution of the rotationperiods of the CTTS and WTTS stars they studied c© MNRAS,430, 1433.
210
The wealth of stellar variability
Fig. IV.3.3. Figure 9 of De Medeiros et al. (2013), showing thetotal number of targets considered at the start (in black) andthe remaining ones at the end of the process (see text) c© A&A.
Fig. IV.3.4. Figure 13 of De Medeiros et al. (2013), showingthe rotation periods measured versus the color index J − H.Symbol size relates to variability amplitude and color to lumi-nosity class. The increase seen is compatible with stellar evolu-tion c© A&A.
modulation due to rotation. Stars similar to the Sun interms of mass and age, with periods around solar valuesare thus rare. One case was found by do Nascimento et al.(2013) after a detailed analysis of CoRoT targets (us-ing spectroscopic results from Sarro et al. 2013): CoRoT-102684698 which has a similar mass and also similarLithium abundance, and a period Prot = 29± 5 days.
However, any conclusion about stars sharing solar char-acteristics is made very difficult due to their very smallnumber. In order to estimate if the Sun’s rotation isanomalous or not, Leao et al. (2015) deepen the work ofDe Medeiros et al. (2013) by selecting a subsample fromtheir catalog (plus other samples from Kepler catalogs),gathering solar type stars and comparing them to syntheticsamples built in order to take into account the low num-ber of solar rotators. Leao et al. (2015) propose that theirsubsample of 173 stars with Teff and log(g) close to solarvalues is made of two populations, one of young stars, morenumerous than the other group made of older stars. From
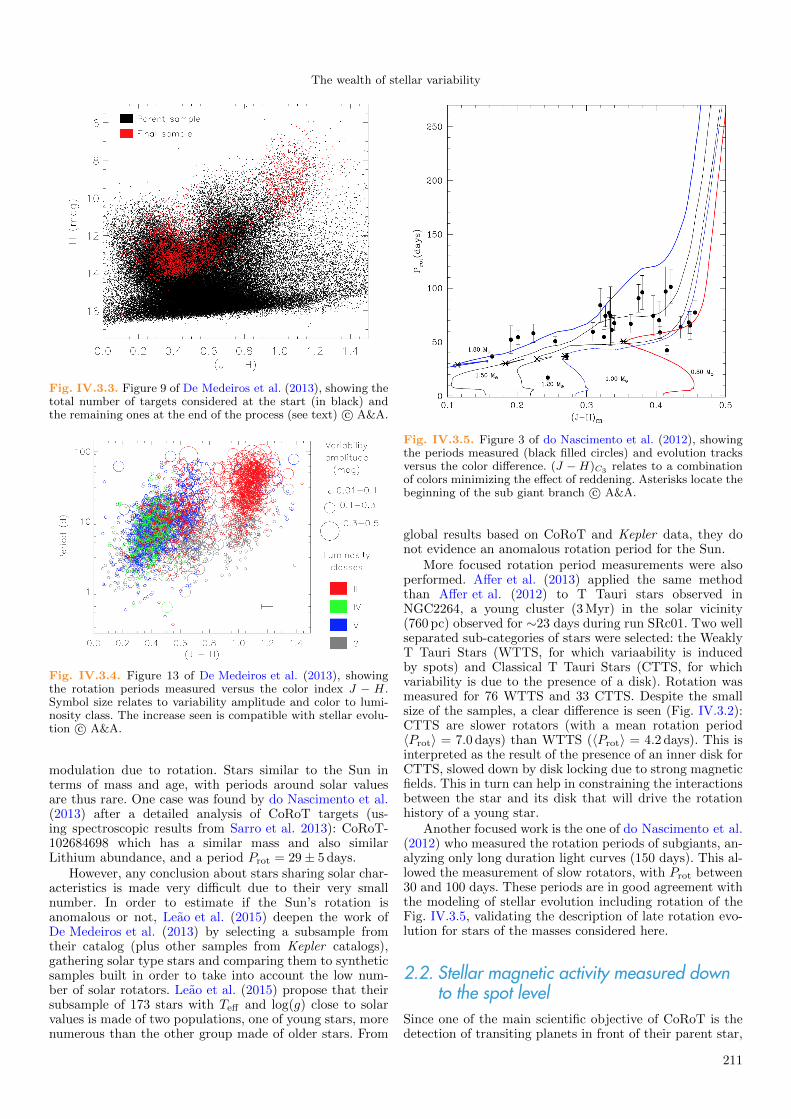
Fig. IV.3.5. Figure 3 of do Nascimento et al. (2012), showingthe periods measured (black filled circles) and evolution tracksversus the color difference. (J −H)C3 relates to a combinationof colors minimizing the effect of reddening. Asterisks locate thebeginning of the sub giant branch c© A&A.
global results based on CoRoT and Kepler data, they donot evidence an anomalous rotation period for the Sun.
More focused rotation period measurements were alsoperformed. Affer et al. (2013) applied the same methodthan Affer et al. (2012) to T Tauri stars observed inNGC2264, a young cluster (3 Myr) in the solar vicinity(760 pc) observed for ∼23 days during run SRc01. Two wellseparated sub-categories of stars were selected: the WeaklyT Tauri Stars (WTTS, for which variaability is inducedby spots) and Classical T Tauri Stars (CTTS, for whichvariability is due to the presence of a disk). Rotation wasmeasured for 76 WTTS and 33 CTTS. Despite the smallsize of the samples, a clear difference is seen (Fig. IV.3.2):CTTS are slower rotators (with a mean rotation period〈Prot〉 = 7.0 days) than WTTS (〈Prot〉 = 4.2 days). This isinterpreted as the result of the presence of an inner disk forCTTS, slowed down by disk locking due to strong magneticfields. This in turn can help in constraining the interactionsbetween the star and its disk that will drive the rotationhistory of a young star.
Another focused work is the one of do Nascimento et al.(2012) who measured the rotation periods of subgiants, an-alyzing only long duration light curves (150 days). This al-lowed the measurement of slow rotators, with Prot between30 and 100 days. These periods are in good agreement withthe modeling of stellar evolution including rotation of theFig. IV.3.5, validating the description of late rotation evo-lution for stars of the masses considered here.
2.2. Stellar magnetic activity measured downto the spot level
Since one of the main scientific objective of CoRoT is thedetection of transiting planets in front of their parent star,
211

The CoRoT Legacy Book
Fig. IV.3.6. Figure 6 of Mosser et al. (2009a), showing the dis-tribution of rotation periods of individual spots. Their distribu-tion is consistent with the wide rotation peak observed in theFourier spectra of the light curve c© A&A.
its ultra-high photometric precision allows also the detec-tion of transiting inhomogeneities on stellar surfaces. Themost visible are magnetic spots, like sunspots which sig-nature is visible in disk-integrated solar light curves. Theclear signature of starspots in some CoRoT light curves al-lows the modeling of the observed intensity variation byassuming simple models of starspots. An extreme exam-ple is HD175726, showing intensity peak-to-peak variationsup to 1% (Mosser et al. 2009b).The difficulty lies in thedegeneracy of the problem since many parameters are nec-essary to describe the signature of a transiting starspot:its size and intensity contrast (obviously correlated), its in-trinsic temporal behavior (which is modulated by the ro-tation period) but also its position on the star (linked tothe inclination angle of the star). Several methods were ap-plied to achieve such a modeling. For example, Mosser et al.(2009a) modeled 4 light curves which, except for HD175726,shows intensity variations of the order of 2–3 mmag, com-parable to an active Sun. All are relatively rapid rotators(2.7 d ≤ Prot ≤ 3.9 d). The high degeneracy of the prob-lem was overcome by imposing a small number (2–3) ofstarspots per rotation. The methods was tested with simu-lated light curves that showed the reliability of the resultsin terms of rotation period and differential rotation for mid-inclined stars (with a risk of under-estimation). Pole-on andedge-on stars appear to be the most difficult cases. However,the method showed its reliability by applying it to sub-seriesof long time series of the same star and leading to similarresults. For example, differential rotation is observed in 3out of the 4 modeled stars (Figs. IV.3.6 and IV.3.7).
Other attempts to model the light curves of starsin order to extract an information on the presence ofstarspots were achieved by Lanza et al. (2009b,a, 2010,2011). These works focus on stars hosting planets: re-spectively CoRoT-2a, -4a, and -6a. They rely on anothermethod for the light curve modeling, based on the divisionthe star’s surface in small elements, each associated to a pa-rameter accounting for the presence of spot or faculae (or nomagnetic signature at all). The parameters for each elementare fitted in order to reproduce the observed integrated lightcurve. The application of this method to stars hosting tran-siting planets allows the inclination angle of the star to befixed. A striking results of these works is that, as in 3 stars
Fig. IV.3.7. Figure 8 of Mosser et al. (2009a), showing the ro-tation period of individual spots increasing with their latitude,as a signature of differential rotation c© A&A.
Fig. IV.3.8. Figure 4 of Lanza et al. (2009b), showing (in redand green) the fitted spotted area of CoRoT-2a. The inclinedridges are the signature of the differential rotation. Results ofSilva-Valio & Lanza (2011) are superimposed as white circlesthat represent the spots derived from their independent analysisusing the transits of the planet (see text) c© A&A.
out of 4 in Mosser et al. (2009a), differential rotation wasdetected in the 3 planet hosting stars. The measured am-plitude of this differential rotation varies from one star toanother, from very few percent up to more than 10%. A sig-nature of this differential rotation is visible in the map ofthe fitted spotted area (Fig. IV.3.8) of CoRoT-2a’s star, ayoung Sun ∼0.5 Gyr old that has been observed for 142 dayswhile the measured rotation period of the star is 4.5 days.The flux modulation of this star is 20 times larger thanthat of the Sun at maximum of activity. The star hostingCoRoT-2a presents another striking result: the modulationof the measured spotted area with time, which shows anapparent short-term periodicity (Fig. IV.3.9) with a pe-riod of ∼(28.9± 4.8) days. This could be the signature of astar-planet interaction2 as proposed by Lanza (2008) sinceits period approaches 10 times the synodic period of theplanet. This cyclicity could also be compared to the so-called Rieger cycle observed in the Sun (Rieger et al. 1984)which corresponds to a short-term periodicity (154 days)in the occurrence of solar flares, and also in the spottedarea (Oliver et al. 1998). A proposed interpretation for this
2 For more findings about star-planet relations, see Sect. III.9.1
212

The wealth of stellar variability
Fig. IV.3.9. Figure 6 of Lanza et al. (2009b), showing the fittedtotal spot area (for two models) along time. For both models, aclear periodicity is visible c© A&A.
Fig. IV.3.10. Fig. 1 of showing how mode frequencies and am-plitudes evolve in an anti-correlated manner for the two firstobservations of HD49933 by CoRoT. The activity also shows acorrelated behavior with a ∼30-day lag c© Science, 329, 1032.
oscillation is the propagation of Rossby-type waves in thesub-photospheric layers (Lou 2000).
This star presents also a common feature with the starhosting CoRoT-6a: the presence of active longitudes areobserved in the fitted spot map. In CoRoT-2a, two activelongitudes are found, 180◦ apart, with one of them affectedby a retrograde migration. In the case of CoRoT-2a, anindependent analysis of Huber et al. (2010) as well as an-other of Silva-Valio & Lanza (2011) (see below) confirmedthe presence of these active longitudes. The active longi-tude detected in the case of CoRoT-6a (an F9 star with arotation period of ∼6.3 days, observed for 145 days) is evenmore interesting since it appears to remain at a somewhatconstant distance in longitude to the sub-planetary point(with however an important gap: ∼200◦). A related obser-vation is made in CoRoT-4a host star: the spotted area,if not showing an active longitude, shows nevertheless itsmaximum at a constant longitude with respect to the sub-planetary point. However, some caution is necessary sincethis star was observed for only 58 days.
As stated above, light curve modeling with the aim ofmapping spots (or other heterogeneities) is a highly degen-erated problem. There is however a case particularly fa-vorable to this modeling: when a planet transits a spotted
Fig. IV.3.11. Fig. 2 of Silva-Valio et al. (2010), showing thedetails of a planet transit (CoRoT-2a) during which the signa-ture of occulted spots become visible (red curve) compared to atransit with almost no spot occulted (black curve) c© A&A.
stellar photosphere, the details of the light curve duringtransits is rich in information about the occulted spots. Thisapproach has been developed by Silva-Valio et al. (2010),Silva-Valio & Lanza (2011) in the case of CoRoT-2a. Withthe hypothesis of a planet orbiting in the equatorial plane,the latitude of the spots can be fixed. The little varia-tions in the light curve during the transit (see Fig. IV.3.11)can be fitted with three parameters: the longitude of thespot, its size (its radius when it is supposed circular)and its intensity. The details of the light curve bringadditional information for the determination of the ra-dius, limiting the degeneracy with the intensity of thespot. A first analysis (Silva-Valio et al. 2010) was basedon 7 to 9 spots per transit modeling. A second analysis(Silva-Valio & Lanza 2011) used a smaller number (5 spotsin average), consequently increasing the average size ofthe spots from 0.46Rp to 0.53Rp (Rp being the radiusof the planet). In both cases, it makes the average size ofthe spots of the order of 100 000 km, several times largerthan the largest sunspots. In average, 16.5% of the starsurface are covered by spots, confirming that CoRoT-2astar is much more active than the Sun. The re-analysisof Silva-Valio & Lanza (2011) is particularly interestingsince the results of Lanza et al. (2009b) for the same starshowed the existence of active longitudes. The results ofSilva-Valio & Lanza (2011) are superimposed to those ofLanza et al. (2009b) in Fig. IV.3.8 and show an excellentagreement about the spot distribution as obtained by thetwo different methods, confirming the existence of the ac-tive longitudes.
The link between the manifestation of magnetism insurface and the interior of the Sun, evidenced by the fre-quency shift of acoustic oscillations is well known. The Sunwas the only star in which such a link had been observed.One more time, the CoRoT ultra-high precision photome-try allowed similar observations in another star, HD49933,in which oscillation frequency shifts were related to surfaceactivity (Garcıa et al. 2010). The oscillations of this star be-have like those of the Sun: mode frequencies increase whentheir amplitudes decrease, in correlation with the observed
213

The CoRoT Legacy Book
magnetic activity (see Fig. IV.3.10). Frequency shifts andamplitude variations were measured globally for HD49933from the two first CoRoT time series of this star (of 60and 137 days, spanning more than 400 days in total), whilethe activity was measured through a proxy made from thevariance of the intensity variations. This star, rotating muchfaster than the Sun (P ∼ 3.4 days), seems to present a muchshorter activity cycle, rising in approximately 60 days dur-ing the second time series used. As in the solar case, fre-quencies increase when the activity increases but a timelag of ∼30 days is observed in the case of HD49933. Thesame authors (Salabert et al. 2011) confirmed their find-ings by studying the frequency shifts versus frequency fortwo periods of 90 and 47 days corresponding to a quiet andan active regime respectively. They found a behavior quitesimilar to that of the Sun, with the frequency shifts reach-ing their maximum of 2 µHz at 2100 µHz (for HD49933,νmax ∼ 1800 µHz), followed by a downturn at 2300 µHz(and an upturn at higher frequency).
Mathur et al. (2013) looked for the same correlatedbehavior between modes properties and magnetic activ-ity for three other stars observed by CoRoT (HD49385,HD52265 and HD181420) but did not reach significant re-sults despite using complementary spectroscopic observa-tions (Ca H profiles).
2.3. Another source of micro-variability seenby CoRoT: surface convection
Signatures of magnetic features are not the only ones orig-inating from the photosphere or above and seen in lightcurves. An important physical process contributes too: thesurface convection. The granules induced by this convectionhave a characteristic time close to the acoustic oscillationperiods and thus exhibit power in the Fourier spectra in theform of a continuous background on the top of which the os-cillation modes appear as narrow peaks. This background isoften modeled as a more or less modified Lorentzian profileP (ν) centered on the zero frequency, following the initialidea of Harvey (1985) based on the description of a noiseprocess with memory:
P (ν) =4σ2τ
1 + (2πντ)α, (1)
where σ and τ characterize the height and width of theprofile. Harvey (1985) uses α = 2 but other authors (e.g.Aigrain et al. 2004; Michel et al. 2009) use other values.Ludwig et al. (2009) compared spectra from 3D hydro-dynamical simulations to spectra from F stars observedby CoRoT (mainly HD49933, but also HD181420 andHD181906). While the simulated spectra (derived from asolar model) are in agreement with observations of the Sun,some non negligible discrepancies appear between simu-lated spectra for HD49933 and the observed one. Even ifthese hydrodynamical models are sensitive to the globalcharacteristics of the star (such as log(g) or Teff), thespectra of HD181420 and HD181906 (which have sim-ilar stellar characteristics) are very similar to that ofHD49933, suggesting a lack in the hydrodynamical descrip-tion. Samadi et al. (2013) compared characteristics of thegranulation spectra (σ and τ) from grid of models to ob-served ones (from Kepler) and noted that the largest dis-crepancies occur for F stars. They suggest that the source of
the discrepancies could be the photospheric magnetic fieldof these stars, following the results of Chaplin et al. (2011)who noted that acoustic oscillations in F stars were themost sensitive to damping by magnetic field. Since oscilla-tion are excited by surface convection, it strongly suggeststhat a proper description of the effect of magnetic field onconvection in the hydrodynamical models is necessary.
3. Binaries (by C. Maceroni)CoRoT lead to a revolution also in the field of binary stars.The two main assets of the mission, high accuracy and longterm monitoring, provided extraordinary data for binarystar studies, allowing the detection of effects immeasurablebefore. Besides, CoRoT made possible a fruitful synergy be-tween asteroseismology and binarity, two independent andcomplementary sources of information on stellar properties.
Among the bright field targets there were a few knownbright eclipsing binaries (EBs), but others were added tothis list when their unknown binary nature was revealedby the observations (e.g. HD 174884, see below). In thefaint fields EBs resulted to be, as expected, the majority ofregular variables.
3.1. Statistical properties of the eclipsingbinaries in the faint fields
A complete list of CoRoT eclipsing binaries from the exo-planet fields is in preparation and will be available in Ex-odat (http://cesam.oamp.fr/exodat/) (M. Deleuil, pri-vate communication), but several partial lists have beencompiled during the mission. So far the most complete anduseful for eclipsing binary studies is the CoRoT unofficialonline catalog3 assembled by J. Devor. This catalog pro-vides not only the parameters describing the light curve(orbital period, eclipse depth and duration), but as well thesystem parameters, as derived by a new algorithm based onJKTEBOP eclipsing binary model (Popper & Etzel 1981;Southworth et al. 2004) and Markov Chain Monte Carlo(MCMC). A full analysis of this data set will appear else-where (Devor et al., in prep.), we use here some of the onlinedata for a first look at the orbital period distribution.
The catalog contains the eclipsing/ellipsoidal bina-ries detected in the initial run (IRa01), in eleven longruns (LRc01...LRc06, LRa01...LRa05) and five shortruns (SRc01, SRc02, SRa01...SRa03) for a total numberof 1437 systems. Some of the selected objects, however,had doubtful classification because of the difficulty in dis-criminating, with an automatic algorithm and on the ba-sis of a single light curve, between light variation due tolow-inclination ellipsoidal systems and that due to sur-face spots or pulsation. We performed, therefore, a manualvetting of the curves which yielded a “bona fide” sampleof 1142 binaries.
The binary frequency in the observed fields has a meanvalue of 0.9 ± 0.2%, i.e. about twice the frequency ob-tained from large ground-based surveys (e.g. OGLE). Thatis due to the long term monitoring and high accuracy ofCoRoTphotometry, which allows to detect systems diffi-cult to discover from the ground.
3 www.astro.tau.ac.il/~jdevor/CoRoT_catalog/catalog.html
214

The wealth of stellar variability
−0.5 0.0 0.5 1.0 1.5log P(d)
0
20
40
60
80
N
Fig. IV.3.12. Period distribution of the bona fide sample. Theerror bars are derived from the Poisson statistics uncertain-ties based on the number of systems. The red broken line isan estimate of the effects of discovery selection according toMaceroni & Rucinski (1999) c© A&A.
The orbital period distribution of the “bona fide” sam-ple is shown in Fig. IV.3.12. The secondary peak at shortperiod is a well known feature and is generally attributed tothe effect of secular evolution producing orbit shrinking inwider binaries. That can be due to angular momentum loss,due to magnetic braking of wind, in synchronized solar-type binaries (Vilhu 1982; van’t Veer & Maceroni 1989),and/or to the Kozai mechanism in triple systems (Kozai1962; Fabrycky & Tremaine 2007). The drop after maxi-mum is essentially due to the decrease of the probabilityof eclipse with increasing period, because of the reducedrange of inclinations producing eclipses. Moreover, the tailof the distribution is affected by the run duration (vary-ing from ∼160 d to ∼80 days for long runs and from ∼60to ∼30 days for the initial and the short runs). For illustra-tive purpose, the dashed line is the expected observed dis-tribution of EBs from a population of binaries with a flat logP distribution. The curve corresponds to a selection effectproportional to P−4/3, according to a simplified computa-tion proposed by Maceroni & Rucinski (1999). Their simpleestimate computes the probability that a distant observernotices eclipses by evaluating the solid angle subtended bythe sum of the fractional radii (R/a, with a the systemsemi-axis) relative to visible hemisphere, i.e., by dividing itby 2π sr. This relative solid angle is given by the integralof the eclipse relative durations over the range of inclina-tions that can result in eclipses. The same proportionalityis obtained by considering the fraction of the sky that onestar ‘sees’ covered by the companion. If it is assumed thatthe range of variation of the sum of the component radii ismuch smaller than that of the orbital separation, this prob-ability scales as a−2 and hence P−4/3. The displayed curveis the best fit, with fixed exponent, to the distribution forlogP > 0.5.
Figure IV.3.13 shows the period distribution of subsam-ples, according to the galactic coordinates. Panel a) showsthe distribution dividing the whole sample according to thedirection (Center and Anticenter). The former has a moremarked bimodal distribution, with a larger fraction of sys-tems in the short period bins. A Kolmogorov-Smirnoff testof the hypothesis that the two samples are drawn from the
same population yields a very low probability KS = 0.0018.The difference could be an indication of an older popula-tion in the direction of the galactic center fields, as thatwill imply a larger fraction of low-mass components (whichcan accomodate in a smaller orbit) and a longer time forefficient shrinking of the orbit.
This indication is in qualitative agreement with the re-sults of differential population studies by means of oscil-lating giants (Miglio et al. 2013) in the first CoRoT longruns (LRa01 and LRc01). According to their analysis thesample of giants in LRc01 is characterised by a lower meanmass and higher age than that in the opposite direction.The fields considered in their study, however, have differ-ent galactic latitude, b, (b ' −8 for LRc01 and b ' −2 forLRa01) and a difference in b could also be a factor modify-ing the distributions.
To disentangle the effect of galactic latitude and lon-gitude on the distribution, samples from fields of similarlatitude or longitude are compared in the other panels. Allthe distribution pairs have a low value of KS. Evidently, anhigher percentage of shorter period binaries appears in thehigher latitude fields for both center and anticenter direc-tions, and, as well, in the center direction with respect tothe anticenter.
We also checked if the effect could also be related tothe different amount of interstellar absorption, which israther different and patchy in the various fields. To thispurpose we used the population synthesis code TRILEGAL(Girardi et al. 2005) to compute the expected distributionof mass and age in the different CoRoT fields, using thereddening maps of Schlafly & Finkbeiner (2011). We alsochecked the effect on the results of varying AV , the totalabsorption along the line of sight, of the same field. The de-tails will be published elsewhere, but in general we can saythat higher absorption provides slightly older and less mas-sive “observed” samples and hence, indirectly, a larger num-ber of shorter period binaries, because of the above men-tioned mechanisms (angular momentum loss in spin-orbitsynchronised solar-type binaries and Kozai mechanism intriple systems). Looking at panels b) and c) of Fig. IV.3.13we see instead that the distribution is more bimodal, witha secondary peak in the period domain typical of contactbinaries, in the high-b fields, where the average absorptionis lower. We can conclude, therefore, that the effect is dueto a difference in population.
The situation is less clear when comparing the distribu-tions in the d) panel (LRc versus LRa high-b fields), whereone probably sees the combination of two effects working inthe same sense: the simulations suggest indeed older pop-ulation for the LRc fields, which however have, as well, ahigher average interstellar absorption. The difference in thepopulation properties should be, however, the main reasonof the different distribution shape, because the simulationsshow that the effect of absorption is a secondary one, evenin presence of strong variations.
3.2. New binary typesThe in-depth study of a number of CoRoT eclipsing systemslead to many discoveries. The accuracy played a fundamen-tal role in the detection of new variable types, the monitor-ing with dense sampling over several months allowed to fol-low processes evolving on different timescales, from minutesto hundred days.
215

The CoRoT Legacy Book
−0.5 0.0 0.5 1.0 1.50
20
40
60N
−0.5 0.0 0.5 1.0 1.5log P(d)
0
10
20
30
40
N
−0.5 0.0 0.5 1.0 1.50
10
20
30
40
−0.5 0.0 0.5 1.0 1.5log P(d)
0
10
20
30
40
LRa
LRc
LRa high b
LRa low b
LRc high b
LRc low b
LRa high b
LRc high b
KS = 0.0018
KS = 0.11
KS = 0.0017
KS = 0.024
a) b)
c) d)
Fig. IV.3.13. The orbital period distribution of different EB subsamples. Panel a): LRa and LRc indicate, respectively, the fieldsin the CoRoT Anticenter and Center directions. Other panels: the high and low galactic latitude refer to fields with galactic latitudeabsolute value |b| > 5 and ≤5.
CoRoT photometry discovered several beaming bina-ries, as predicted before the launch by Zucker et al. (2007)and first observed in the light curve of a Kepler target,KIC 7975824 (KPD 1946+4340) (Bloemen et al. 2011).These binaries show minute flux variations due to relativis-tic beaming (of the order of a few hundred ppm for systemswith orbital period of 10–100 days and late-type compo-nents). Beaming (also called Doppler beaming or boosting)is due to the star radial velocity (RV): because of the motionthe spectrum is shifted in wavelength, the photon emissionrate is modulated, and the photons are slightly beamedin the direction of motion (light aberration). The result-ing tiny light variation contains information on the radialvelocity of the components. Beaming is, however, a sub-tractive effect, being the radial velocity of the componentsin anti-phase. Effects of opposite sign sum up weighted bythe component fluxes, so that the effect strength is largerin binaries with components of very different flux (where,in practice, beaming from only one star is measured) and isnull for identical components. In the most favourable casethe analysis of the beaming effect in a light curve allowsto extract the RV curve of the brighter component, butmore frequently only its RV amplitude. Beaming providesthe same information of a single-lined spectroscopic binary,with the advantage of a less demanding effort in termsof observing time. Moreover, beaming allows to discovernon-eclipsing binaries from photometry alone. The exampleis the discovery of seventy-two non-eclipsing binaries from
CoRoT light curves by Tal-Or et al. (2015). These are shortperiod non-eclipsing binaries discovered thanks to the com-bined effect of beaming, ellipsoidal variations and reflection.
The beaming effect was invoked to interpret the unequalheight of light-curve maxima (the so-called O’Connell ef-fect) in CID 105906206 (da Silva et al. 2014). The systemis a short period (P ' 3d.69) totally eclipsing detached bi-nary, with a δ Sct primary component. The asymmetry oflight-curve maxima appeared after pre-whitening the lightcurve with more than 200 frequencies found by using a har-monic analysis. The detached configuration, the stability ofthe feature over 160 days (and ∼50 rotation cycles being thesystem components close to corotation), and the agreementof the beaming parameters with the radial velocity ampli-tude suggested the interpretation of the feature as due tobeaming.
Another recently defined class of binaries is that ofHeartbeat binaries (HBB). These are short period systemscharacterized by a strongly eccentric orbit and ellipsoidallight variation. The name derives from the unusual light-curve shape which, in non-eclipsing systems, recalls thatof ECG tracings. In this case the light curve shows a sin-gle variation around periastron due to surface deformationand mutual irradiation of the components. The presenceof tidally induced pulsation in the light curve is anotherdistinctive property.
The shape of the HBB light curve was theoretically pre-dicted by Kumar et al. (1995). The iconic heartbeat binary
216

The wealth of stellar variability
Fig. IV.3.14. Upper panel: the complete CoRoT light curveof HD 174884 as normalized flux vs HJD. Lower panel: ablow-up, spanning approximately three periods, showing thetiny secondary minimum (first occurrence at reduced HJD ofaround 4218). Reprinted from Astronomy and Astrophysics(Maceroni et al. 2009) c© A&A.
is the Kepler target KOI-54 (Welsh et al. 2011) which wasthe first announced system of the class; more than hundredheartbeat binaries were discovered afterwards among theKepler targets (Hambleton et al. 2013).
The original criteria for HBB definition excluded eclips-ing systems, but this restriction was dropped afterwards(Hambleton et al. 2013), considering that eclipse is onlyan aspect-dependent event. With this broader definitionthe ante-litteram example of heartbeat systems is actu-ally a CoRoT target: the eclipsing binary HD 174884,(Maceroni et al. 2009) whose light curve is shown inFig. IV.3.14. The system is formed by two late B stars andthe difference in depth between the two minima (the sec-ondary depth is 1% of the primary) is entirely due to thehigh eccentricity (e ' 0.3) and the orientation of the or-bit with respect to the observer. The pulsation analysis onthe residual curve, after removal of the binary signal, re-vealed the presence of overtones of the orbital frequency,which can actually even be spotted by eye in the originalcurve (Fig. IV.3.15) and were interpreted as tidally inducedpulsations.
A more classical HBB is HD 51844 (Hareter et al. 2014),a double-lined spectroscopic binary with a δ Sct compo-nent of spectral type Am. The system has an orbital pe-riod of 33.498 days, a high eccentricity (e ' 0.48) and isformed by almost twin components of mass '2 M�. Inspite of that, only one star (the secondary) pulsates withmeasurable amplitude. The fact that similar stars exhibitcompletely different stability against pulsation is not new:only a fraction of field stars in the δ Sct instability strip ofthe HR diagram pulsates. When, however, the twin starsare components of close binaries, the conclusion is that thepulsational properties can significantly differ even for starsof the same age and chemical composition, which poses achallenging problem to theory.
The periastron brightening of the light curve ofHD 51844 (Fig. IV.3.16) allowed to constrain the binarymodel even in absence of eclipses. Additional remarkable
Fig. IV.3.15. Sections of the original light curve of HD 174884,phased according to the orbital period of 3.657 days and verti-cally shifted for better clarity. The seven observed orbital pe-riods go bottom-up. An quasi regular pattern can clearly beseen in each curve. Reprinted from Astronomy and Astrophysics(Maceroni et al. 2009) c© A&A.
0.994
0.996
0.998
1.000
1.002
1.004
1.006
3240 3260 3280 3300 3320 3340 3360
HJD - 2451545
HD 51844 prewhitened LC data
Re
lative
Flu
x
ObservedRadiative Only Solution
Radiative solution residual + 0.996
Fig. IV.3.16. The periastron brightenings in the light curveof HD 51844 and the corresponding best fit. Reprinted fromAstronomy and Astrophysics (Hareter et al. 2014) c© A&A.
findings of this investigation are the high overtones of theorbital period in the frequency spectrum (interpreted astidally induced pulsations) and the discovery of resonances,found for the first time in a δ Sct star.
3.3. Case studiesCoRoT offered for the first time the possibility of combiningin an effective way the information coming from duplicityand from pulsation, thanks to the continuous monitoringof a large number of targets. When the pulsating stars be-long to a binary there is an independent way of determiningthe component absolute parameters. This is of fundamen-tal importance for asteroseismic studies as it allows to con-strain the component modeling. A few cases have alreadybeen described in the previous section, but other are worthmentioning for the new insight offered by the synergy withasteroseismic studies.
Only one eclipsing system with a γ Dor componentwas known before CoRoT launch (VZ CVn, Ibanoglu et al.2007) but its sparse photometry from ground did not al-low to really exploit the combination of eclipses and pul-sations. CoRoT discovered a number of γ Dor pulsators
217

The CoRoT Legacy Book
8.3
8.4
8.5
8.6
8.7
8.8
8.9
9
9.1
130 140 150 160 170 180 190
Ma
gn
itu
de
Time (HJD−2454000)
8.3
8.4
8.5
8.6
8.7
8.8
8.9
9
9.1
130 140 150 160 170 180 190
Ma
gn
itu
de
Time (HJD−2454000)
8.35 8.4
8.45
Fig. IV.3.17. The complete CoRoT light curve of AU Mon.The upper panel shows an enlarged segment of the curve withvery clear rapid non-orbital variations. Reprinted from MonthlyNotices of the Royal Astronomical Society (Desmet et al. 2010)c© Monthly Notices of the Royal Astronomical Society.
in EBs (Sokolovsky et al. 2010; Maceroni et al. 2013) in-cluding hybrid γ Dor/δ Sct (Chapellier & Mathias 2013)and a possible detection in a triple system (Dolez et al.2009). In addition, CoRoT made possible to investigateseismically unexplored regions of the HR diagram, suchas that of very massive stars: the investigation of theyoung O-type binary HD 46149 (a double-lined spectro-scopic binary Degroote et al. 2010) evidenced the presenceof solar-like oscillations in a massive O-type star, whilethat of HD 50230 (Degroote et al. 2012) revealed a a pro-totypical hybrid pulsator in a B-type wide binary and al-lowed to put constraint on the component internal structure(Degroote et al. 2010).
The continuous monitoring over months and the densesampling of the light curve offered as well the opportunityto study in depth binary systems with a complex config-uration and presenting variability on different time scales.An example is the analysis of the eclipsing binary AU Mon(Desmet et al. 2010), a strongly interacting Be + G semi-detached system with an orbital period of ∼11.11 days,whose light curve is shown in Fig. IV.3.17. In addition toeclipses, the study evidenced variability on a long time scale(416d), which was detected by combining of the CoRoTlight curve (spanning 56d) with pre-existing photometryof the system. The variability was interpreted in terms ofmatter surrounding the mass exchanging components and,thanks to eclipse mapping, modeled as an accretion discby Mimica & Pavlovski (2012). Afterwards, a complemen-tary investigation, based on optical and archival UV spec-troscopy, evidenced the presence of a stream+disc+bright-spot around the Be primary (Atwood-Stone et al. 2012).The CoRoT photometry showed, as well, additional peri-odic variability (on a scale of a tenth of a day) which wasinterpreted as due to non-radial pulsations of the Be star.To be noticed that the corresponding frequencies are notpredicted by theory but were observed in other CoRoT Betargets (as HD 49300, Huat et al. 2009). Finally, the Scar-gle periodogram of the CoRoT light curve is characterizedby a power excess in agreement with solar-type pulsationsof the G-type component.
Another complex and rare system is CID 223992193(Gillen et al. 2014), a detached EB formed by two pre-main
Fig. IV.3.18. The light curve of CID 223992193 as obtainedby CoRoT in the run SRa05 (December 2011/January 2012),the system was observed also during the short run SRa01(March 2008). Reprinted from Astronomy and Astrophysics(Gillen et al. 2014) c© A&A.
sequence dwarfs (Porb ' 3d.84). The detailed modelling ofthe large amplitude out-of-eclipse variations (Fig. IV.3.18)combined to that of high-resolution spectroscopy and ofthe infrared SED revealed the presence of dust in the innercavity of a circumbinary disc. The small amount of dustnecessary to explain the out-of-eclipse variations could bepresent in the accretion streams from the disc itself.
Finally unusual binaries were detected as by-productsof planet transit search, which ended sometimes in theserendipitous discovery of rarely observed binary sys-tems, as for CID 110680825 (CoRoT LRa02 E2 0121,Tal-Or et al. 2011). In this case a Neptun-sized planet can-didate target turned out to be a hierarchical triple systemformed by a far giant primary and a grazing eclipsing binaryof orbital period '36d.3. The inner system is formed by A-and F-type components. The reason for the false positiveplanet detection is dilution of the inner-binary light curveby the light of the giant companion, mimicking a less deeptransit. A very sophisticate analysis allowed to detect alsoa tiny secondary minimum, only 0.07% deep, and to char-acterise the system, which is the second known of this typeafter HD 181068 (Derekas et al. 2011). The original lightcurve and the minima of the phase-folded one are shown inFig. IV.3.19.
Similarly, the study of the transit candidate CID101186644 (Tal-Or et al. 2013) revealed a strongly eccen-tric eclipsing binary with a period of ∼20.7 days. The in-teresting system component is in this case a low-mass, denselate M-dwarf secondary, the smallest and densest detectedso far (R = 0.104 R�, M = 0.096 M�). The detection isimportant because of the small number of stars in the re-gion of very low mass stars (M < 0.2 M�). At variancewith most other similar objects this M-dwarf has a radiusin agreement (or perhaps even smaller) than that predictedby theoretical models. Its discovery weakens, therefore, theclaim that low-mass star are larger than predicted by evo-lutionary models.
In conclusion CoRoT provided a rich harvest of scientificresults in the field of binary stars and certainly much morewill come from the exploitation of its legacy archive.
4. Stars with disks (by S.H.P. Alencar)Disks are ubiquitous to the star formation process. Theyare the sites of planet formation and may interact with
218

The wealth of stellar variability
−0.01 −0.005 0 0.005 0.01
0
5
10
Re
lative
ma
gn
itu
de
[m
ma
g]
0.51 0.515 0.52 0.525 0.53
Phase
Fig. IV.3.19. Upper figure: The white light curve ofCID 110680825. Top: the calibrated light curve (up-shiftedby 10 mmag) after rebinning and removal of outliers; the long-term trend is overplotted in black. Middle: the detrended lightcurve. Insets: zoom on the three individual transit-like events.Lower figure: the primary and secondary eclipses in the phase-folded light curve with the best model overplotted with a solidred line. The residuals are downshifted by 10 mmag. Reprintedfrom Astronomy and Astrophysics (Tal-Or et al. 2011) c© A&A.
the central star through the stellar magnetic field. T Tauristars are low (M ≤ 2 M�) mass stars of a few mil-lion years. Many of them, called classical T Tauri stars(CTTSs), still present accretion signatures from a circum-stellar disk (Menard & Bertout 1999). Understanding theaccretion process acting in the star-disk system and diskevolution are some of the major challenges in the studyof star formation nowadays. Accretion has a long and im-portant impact in the initial evolution of low mass stars,regulating its fundamental properties (mass and angularmomentum), and some of its most remarkable features (en-ergy excess with respect to stars of the same age and massthat no longer accrete and mass loss through collimatedjets). The discovery of thousands of extrasolar planets inthe last decades has increased the importance of the evolu-tion and dissipation of accretion disks around young stars,since they directly impact the study of planetary formation.The characterization of the accretion process in young stel-lar systems and their disks is therefore an important stepto the establishment of credible scenarios of star and planetformation.
In young low-mass stars, magnetic fields can reach sev-eral kilogauss (Johns-Krull et al. 2001), causing the trun-cation of the inner disk region and directing the accretingmaterial towards the star. The magnetospheric accretionprocess leads to the development of magnetic accretioncolumns that extend from the inner disk regions, at a few
stellar radii from the star, to the stellar surface, originat-ing accretion shocks at the surface of the star, where theaccreting, nearly free-fall, material is rapidly decelerated(Bouvier et al. 2007b). The stellar magnetic field is alsoresponsible for the transfer of angular momentum fromthe star to the disk, allowing the young accreting systemsto rotate well below break-up velocity, despite the accre-tion and contraction processes at work (Affer et al. 2013;Gallet & Bouvier 2015). These various components (innerdisk structure, accretion columns and shocks) are not di-rectly observable due to our distance to star forming re-gions, but they generate spectral and photometric featuresthat can be analysed to understand the accretion and out-flow flux structure and its dynamics.
4.1. First CoRoT observations of NGC 2264
The CoRoT satellite allowed the observation of additionalprograms in short runs, not necessarily related to itsmain objectives of finding exoplanets and studying as-troseismology. The first additional program completed byCoRoT, in 2008, was the 23-day continuous observation ofNGC 2264, a young (∼3 Myr) stellar cluster located atabout 760 pc from the Sun (Dahm 2008). This was the onlyyoung cluster in the CoRoT “eyes” and a unique opportu-nity to study young stars with precise and high-cadencephotometry. The CoRoT data on NGC 2264 yielded themost exquisite light curves ever obtained of young star-disksystems and originated very detailed analysis of variabil-ity in these systems. This initial campaign provided clueson the relation between accretion and X-ray variability(Flaccomio et al. 2010), it allowed the study of the circum-stellar structure of accreting systems (Alencar et al. 2010),rotation in the Pre-Main Sequence (Affer et al. 2013), pul-sations in young intermediate mass stars (Zwintz et al.2013), and several young eclipsing binary systems were alsodiscovered (Gillen et al. 2014).
Alencar et al. (2010) analysed the light curves of all theclassical T Tauri stars of NGC 2264 observed by CoRoTand classified them in three simple categories: spot-like,which are periodic light curves dominated by variabilitydue to starspots, AA Tau-like, periodic light curves whosevariability is due to extinction by circumstellar dust, andirregular, which includes all the non-periodic light curves(Fig. IV.3.20). They showed that the highly dynamical star-disk interaction mediated by the stellar magnetic field ob-served in the classical T Tauri star AA Tau (Bouvier et al.1999, 2003, 2007a) is apparently common among CTTSs(28% ± 6% of CTTSs in their sample presented AA Tau-like light curves). AA Tau-like light curves are observed inhigh inclination systems with respect to our line of sightand the light curves are dominated by extinction due tocircumstellar material located at the inner disk edge. Theinteraction of the stellar magnetic field with the inner diskcreates a warp that occults the star as the system rotates.The observed minima typically vary at each rotational cy-cle (Fig. IV.3.20), implying that the star-disk interactionand the inner disk structure is dynamic on a rotationaltimescale. Alencar et al. (2010) also showed that the innerdisk warp is located close to the disk corotation radius, bycomparing the period distribution of AA Tau-like systemsand spot-like ones, the latter ones necessarily corresponding
219

The CoRoT Legacy Book
Fig. IV.3.20. CoRoT light curves of classical T Tauri stars, showing different morphological types. Spot-like light curves are peri-odic and due to spots at the stellar surface. AA Tau-like light curves are also periodic and due to obscuration of the central star byan inner disk warp. The irregular light curves include accretion-burst systems (e), non-periodic circumstellar dust distribution (f)and light curves that are not clearly dominated by a unique physical process. Figure adapted from Alencar et al. (2010) c© A&A.
Fig. IV.3.21. Optical and soft X-ray variability for the WTTSs (green points) and CTTSs (red points) of NGC 2264 observed byCoRoT and Chandra. The lines indicate the effect of absorption on a constant source with average AV = 1.0, assuming a standardinterstellar gas/dust ratio (dotted lines), and a 5 times higher gas/dust ratio (solid lines). The four lines in each set refer to thecombinations of two plasma temperatures, 0.6 and 5.0 keV, and two different assumptions for the spectrum-dependent extinctionlaw in the wide CoRoT band: ACoRoT /AV = 1.0 and ACoRoT /AV = AI/AV = 0.61. Figure from Flaccomio et al. (2010) c© A&A.
to the stellar rotation periods, since the spots are locatedat the stellar surface.
Flaccomio et al. (2010) showed that, for CTTSs, soft-X-ray (0.5–1.5 keV) and optical variabilities were correlated(Fig. IV.3.21), while no correlation was found between op-tical and hard X-rays (1.5–8.0 keV), or between optical and
either soft or hard X-rays for the non-accreting weak lineT Tauri stars (WTTSs). The observed correlation was ex-plained in terms of variable absorption from circumstel-lar material, in a scenario similar to the one proposed forAA Tau-like systems. The slope of the observed correla-tion implies a significant dust depletion in the circumstellar
220

The wealth of stellar variability
Fig. IV.3.22. Mass-radius relation for the three lowest-masseclipsing binaries known in the Orion Nebula Cluster (blackpoints) and CoRoT 223992193 (red points) compared with the-oretical isochrones of Baraffe et al. (1998) with Y = 0.282,[M/H] = 0 and mixing length α = 1.9. Figure from Gillen et al.(2014) c© A&A.
material (gas/dust ratio ∼5 times higher than the standardvalue for interstellar material).
Affer et al. (2013) presented a detailed analysis of theperiod distribution of all the CoRoT observed membersof NGC 2264. They showed that CTTSs rotate slowerthan the WTTSs (Fig. IV.3.2), as also observed by otherauthors (Lamm et al. 2005; Cieza & Baliber 2007). Thisagrees with the proposed disk-locking scenario (Shu et al.1994; Hartmann 2002), in which the interaction between thestellar magnetic field and the inner disk is able to transferangular momentum from the star to the disk, despite theongoing accretion and contraction.
Some eclipsing binary systems were discovered with theCoRoT observations of NGC 2264 and the most promisingones are being followed-up. CID 223992193 was the first bi-nary system analysed from the sample and turned up to bea very interesting double-lined, detached eclipsing binary,composed of two young M dwarfs, possibly surrounded by acircumbinary disk from which the young stars may still beaccreting (see Sect. 3.3 as well as Figs. IV.3.18 and IV.3.22and Gillen et al. 2014). This binary system allows to testevolutionary models in a region where only a few stars areknown and may also constitute a good laboratory to un-derstand accretion from circumbinary disks.
4.2. The Coordinated Synoptic Investigationof NGC 2264
In December 2011, a new multiwavelength observationalcampaign of NGC 2264, called the Coordinated Synop-tic Investigation of NGC 2264 (CSI 2264), was organised.It included 40 days of continuous and simultaneous opti-cal photometric observations with the CoRoT and MOSTsatellites, 30 days of infrared (IR) photometry with theSpitzer satellite and 3.5 days of X-ray observations withthe Chandra satellite (Cody et al. 2014). Eleven ground-based telescopes were also involved in the campaign,
providing, among other data, u-band observations withMegacam/CFHT and 20 epochs of VLT/FLAMES in twocluster fields. Very precise optical, 3.6 and 4.5 µm lightcurves were obtained for nearly 500 NGC 2264 members,about a third of which are accreting star-disk systems. Thewealth of data from CSI 2264, combined with the 2008 cam-paign, permitted to probe young stellar systems variabilityin different timescales, from minutes to years, with opticaland IR photometry of very high quality.
The CSI 2264 campaign demonstrated the diversity ofthe photometric behaviour of classical T Tauri stars andshowed that 81% of the disk-bearing stars were variablein the optical and 91% in the mid-infrared. The CTTSlight curves could be grouped in seven different variabil-ity classes, according to a light curve morphology analysisbased on metrics of periodicity, stochasticity, and sym-metry, that were associated with different physical pro-cesses and system geometries (Fig. IV.3.23 and Cody et al.2014). The data are consistent with variability due to vari-able circumstellar obscuration, unsteady accretion, rotat-ing starspots, and rapid structural changes in the disk, butsometimes more than one process could be acting simul-taneously. Cody et al. (2014) showed that periodical andaperiodical optical dippers constitute the largest variabilitycategory (21% of the variable sample), and that the opticaland IR variability were not correlated in over 50% of theobserved systems (Fig. IV.3.24).
The spatial association between the inner disk warpcaused by the stellar magnetosphere, the accretion columnsalong magnetic field lines and the accretion shock, thatwas previously only demonstrated for the classical T Tauristar AA Tau (Bouvier et al. 2007a), was confirmed for thestars with periodic and aperiodic extinction events (“dip-pers”) in NGC 2264 (Fonseca et al. 2014; McGinnis et al.2015). Average values of inner disk warp maximum heightof 0.23 times its radial location were found, consistentwith AA Tau, with variations on average of 11% be-tween rotation cycles, indicating a very dynamical star-diskinteraction.
Short duration, narrow flux dips associated with cir-cumstellar material lifted up above the disk midplane wereobserved in the CoRoT and Spitzer light curves of a fewsystems (Stauffer et al. 2015). These narrow flux dips canbe associated with dust in the inner disk region and theaccretion funnel. Some of the narrow dips were periodicaland occured superposed on sinusoidal variariations due tocold spot at the stellar photosphere, like in the light curveof Mon-21 (Fig. IV.3.25). Since both variabilities presentedthe same period, it confirms that, at least in this case, thestellar rotation rate is locked to the Keplerian rotation pe-riod at the inner disk, a long debated theoretical prediction(Koenigl 1991; Collier Cameron & Campbell 1993).
A well populated class of young stars with accretion-burst light curves was observed in detail for the first time(Fig. IV.3.26 and Stauffer et al. 2014). This type of sys-tems were predicted by magneto-hydrodynamic simulations(Kulkarni & Romanova 2008), but difficult to find due totheir rapid variability. Typically, optical and infrared burstslast from several hours to one day, with amplitudes ofabout 5%−50% the quiescent value. The high cadence ofthe CoRoT and Spitzer observations allowed the identifica-tion of several burst systems, whose variability arises fromenhanced mass accretion rates, as confirmed by their highUV excess and very strong Hα emission lines.
221

The CoRoT Legacy Book
Fig. IV.3.23. Distribution of optical and IR light curves among the different light curve classes. c© The Astronomical Journal,147, 82.
Fig. IV.3.24. Simultaneous CoRoT and Spitzer light curves of CTTSs in NGC 2264 that show different degrees of correlation.The top panel shows a system that presents very well correlated optical and IR light curves. The middle panel presents a systemwhere the optical and IR variations are almost anti-correlated, while the bottom panel shows a CTTS that presents no correlationbetween the optical and IR light curves. Figures from McGinnis et al. (2015) c© A&A.
222

The wealth of stellar variability
Fig. IV.3.25. CoRoT light curve of Mon-21 that shows spot-like sinusoidal variations with narrow dips due to circumstellarmaterial superposed. c© The Astronomical Journal, 149, 130.
Fig. IV.3.26. CoRoT light curves of CTTSs that show accretion bursts. c© The Astronomical Journal, 147, 83.
The association between accretion and inner disk evolu-tion was demonstrated and is related to the morphology ofthe CoRoT light curves (Sousa et al. 2015). Accretion burstsystems present high mass accretion rates and thick innerdisks, the AA Tau-like systems show intermediate mass ac-cretion rates and have disks in the transition region be-tween thick to anemic, while most Classical T Tauri starswith spot-like light curves present low mass accretion ratesand low mid-infrared excess. Accretion was observed to behighly dynamic and to occur in stable and unstable regimes,as predicted by MHD simulations (Kurosawa & Romanova2013). It was also shown that the star-disk systems canalternate between stable and unstable accretion states intimescales of just a few years (Sousa et al. 2015).
Acknowledgements. C.M. acknowledges J. Devor and T. Mazeh formaking available the unofficial Corot binary catalog. S.H.P.A acknowl-edges financial support from CNPq, CAPES and Fapemig.
References
Affer, L., Micela, G., Favata, F., & Flaccomio, E. 2012,MNRAS, 424, 11
Affer, L., Micela, G., Favata, F., Flaccomio, E., & Bouvier,J. 2013, MNRAS, 430, 1433
Aigrain, S., Favata, F., & Gilmore, G. 2004, A&A, 414,1139
Alencar, S. H. P., Teixeira, P. S., Guimaraes, M. M., et al.2010, A&A, 519, A88
Atwood-Stone, C., Miller, B. P., Richards, M. T., Budaj,J., & Peters, G. J. 2012, ApJ, 760, 134
Baraffe, I., Chabrier, G., Allard, F., & Hauschildt, P. H.1998, A&A, 337, 403
Bloemen, S., Marsh, T. R., Østensen, R. H., et al. 2011,MNRAS, 410, 1787
223

The CoRoT Legacy Book
Bouvier, J., Chelli, A., Allain, S., et al. 1999, A&A, 349,619
Bouvier, J., Grankin, K. N., Alencar, S. H. P., et al. 2003,A&A, 409, 169
Bouvier, J., Alencar, S. H. P., Boutelier, T., et al. 2007a,A&A, 463, 1017
Bouvier, J., Alencar, S. H. P., Harries, T. J., Johns-Krull,C. M., & Romanova, M. M. 2007b, Protostars and Plan-ets V, 479
Chapellier, E., & Mathias, P. 2013, A&A, 556, A87Chaplin, W. J., Bedding, T. R., Bonanno, A., et al. 2011,
ApJ, 732, L5Cieza, L., & Baliber, N. 2007, ApJ, 671, 605Cody, A. M., Stauffer, J., Baglin, A., et al. 2014, AJ, 147,
82Collier Cameron, A., & Campbell, C. G. 1993, A&A, 274,
309da Silva, R., Maceroni, C., Gandolfi, D., Lehmann, H., &
Hatzes, A. P. 2014, A&A, 565, 55Dahm, S. E. 2008, The Young Cluster and Star Forming
Region NGC 2264, ed. B. Reipurth, 966De Medeiros, J. R., Ferreira Lopes, C. E., Leao, I. C., et al.
2013, A&A, 555, A63Degroote, P., Aerts, C., Baglin, A., et al. 2010, Nature, 464,
259Degroote, P., Aerts, C., Michel, E., et al. 2012, A&A, 542,
A88Derekas, A., Kiss, L. L., Borkovits, T., et al. 2011, Science,
332, 216Desmet, M., Fremat, Y., Baudin, F., et al. 2010, MNRAS,
401, 418do Nascimento, J.-D., da Costa, J. S., & Castro, M. 2012,
A&A, 548, L1do Nascimento, Jr., J.-D., Takeda, Y., Melendez, J., et al.
2013, ApJ, 771, L31Dolez, N., Vauclair, S., Michel, E., et al. 2009, A&A, 506,
159Fabrycky, D., & Tremaine, S. 2007, ApJ, 669, 1298Flaccomio, E., Micela, G., Favata, F., & Alencar, S. P. H.
2010, A&A, 516, L8Fonseca, N. N. J., Alencar, S. H. P., Bouvier, J., Favata,
F., & Flaccomio, E. 2014, A&A, 567, A39Gallet, F., & Bouvier, J. 2015, A&A, 577, A98Garcıa, R. A., Mathur, S., Salabert, D., et al. 2010, Science,
329, 1032Gillen, E., Aigrain, S., McQuillan, A., et al. 2014, A&A,
562, A50Girardi, L., Groenewegen, M. A. T., Hatziminaoglou, E., &
da Costa, L. 2005, A&A, 436, 895Hambleton, K., Degroote, P., Conroy, K., et al. 2013,
in EAS PS, 64, eds. K. Pavlovski, A. Tkachenko, &G. Torres, 285
Hareter, M., Paparo, M., Weiss, W., et al. 2014, A&A, 567,A124
Hartmann, L. 2002, ApJ, 566, L29Harvey, J. 1985, in Future Missions in Solar, Heliospheric
& Space Plasma Physics, eds. E. Rolfe, & B. Battrick,ESA SP, 235, 199
Huat, A.-L., Hubert, A.-M., Baudin, F., et al. 2009, A&A,506, 95
Huber, K. F., Czesla, S., Wolter, U., & Schmitt, J. H. M. M.2010, A&A, 514, A39
Ibanoglu, C., Tas, G., Sipahi, E., & Evren, S. 2007,MNRAS, 376, 573
Johns-Krull, C. M., Valenti, J. A., Piskunov, N. E., Saar,S. H., & Hatzes, A. P. 2001, in Magnetic Fields Acrossthe Hertzsprung-Russell Diagram, eds. G. Mathys, S. K.Solanki, & D. T. Wickramasinghe, ASP Conf. Ser., 248,527
Koenigl, A. 1991, ApJ, 370, L39Kozai, Y. 1962, AJ, 67, 591Kulkarni, A. K., & Romanova, M. M. 2008, MNRAS, 386,
673Kumar, P., Ao, C. O., & Quataert, E. J. 1995, ApJ, 449,
294Kurosawa, R., & Romanova, M. M. 2013, MNRAS, 431,
2673Lamm, M. H., Mundt, R., Bailer-Jones, C. A. L., & Herbst,
W. 2005, A&A, 430, 1005Lanza, A. F. 2008, A&A, 487, 1163Lanza, A. F., Aigrain, S., Messina, S., et al. 2009a, A&A,
506, 255Lanza, A. F., Pagano, I., Leto, G., et al. 2009b, A&A, 493,
193Lanza, A. F., Bonomo, A. S., Moutou, C., et al. 2010, A&A,
520, A53Lanza, A. F., Bonomo, A. S., Pagano, I., et al. 2011, A&A,
525, A14Leao, I. C., Pasquini, L., Ferreira Lopes, C. E., et al. 2015,
A&A, 582, A85Lou, Y.-Q. 2000, ApJ, 540, 1102Ludwig, H.-G., Samadi, R., Steffen, M., et al. 2009, A&A,
506, 167Maceroni, C., & Rucinski, S. M. 1999, AJ, 118, 1819Maceroni, C., Montalban, J., Michel, E., et al. 2009, A&A,
508, 1375Maceroni, C., Montalban, J., Gandolfi, D., Pavlovski, K.,
& Rainer, M. 2013, A&A, 552, A60Mathur, S., Garcıa, R. A., Morgenthaler, A., et al. 2013,
A&A, 550, A32McGinnis, P. T., Alencar, S. H. P., Guimaraes, M. M., et al.
2015, A&A, 577, A11Menard, F., & Bertout, C. 1999, in NATO Advanced Sci-
ence Institutes (ASI) Series C, 540, eds. C. J. Lada, &N. D. Kylafis, 341
Michel, E., Samadi, R., Baudin, F., et al. 2009, A&A, 495,979
Miglio, A., Chiappini, C., Morel, T., et al. 2013, in Eur.Phys. J. Web Conf., 43, 3004
Mimica, P., & Pavlovski, K. 2012, in IAU Symp. 282, eds.M. T. Richards, & I. Hubeny, 63
Mosser, B., Baudin, F., Lanza, A. F., et al. 2009a, A&A,506, 245
Mosser, B., Michel, E., Appourchaux, T., et al. 2009b,A&A, 506, 33
Oliver, R., Ballester, J. L., & Baudin, F. 1998, Nature, 394,552
Popper, D. M., & Etzel, P. B. 1981, AJ, 86, 102Rieger, E., Kanbach, G., Reppin, C., et al. 1984, Nature,
312, 623Salabert, D., Regulo, C., Ballot, J., Garcıa, R. A., &
Mathur, S. 2011, A&A, 530, A127Samadi, R., Belkacem, K., Ludwig, H.-G., et al. 2013, A&A,
559, A40Sarro, L. M., Debosscher, J., Neiner, C., et al. 2013, A&A,
550, A120Schlafly, E. F., & Finkbeiner, D. P. 2011, ApJ, 737, 103Shu, F., Najita, J., Ostriker, E., et al. 1994, ApJ, 429, 781
224

The wealth of stellar variability
Silva-Valio, A., & Lanza, A. F. 2011, A&A, 529, A36Silva-Valio, A., Lanza, A. F., Alonso, R., & Barge, P. 2010,
A&A, 510, A25Sokolovsky, K., Maceroni, C., Hareter, M., et al. 2010, Com-
munications in Asteroseismology, 161, 55Sousa, A., Alencar, S., Bouvier, J., et al. 2015, ArXiv e-
printsSouthworth, J., Maxted, P. F. L., & Smalley, B. 2004, MN-
RAS, 351, 1277Stauffer, J., Cody, A. M., Baglin, A., et al. 2014, AJ, 147,
83Stauffer, J., Cody, A. M., McGinnis, P., et al. 2015, AJ,
149, 130
Tal-Or, L., Santerne, A., Mazeh, T., et al. 2011, A&A, 534,A67
Tal-Or, L., Mazeh, T., Alonso, R., et al. 2013, A&A, 553,A30
Tal-Or, L., Faigler, S., & Mazeh, T. 2015, A&A, 580, A21van’t Veer, F., & Maceroni, C. 1989, A&A, 220, 128Vilhu, O. 1982, A&A, 109, 17Welsh, W. F., Orosz, J. A., Aerts, C., et al. 2011, The ApJS,
197, 4Zucker, S., Mazeh, T., & Alexander, T. 2007, ApJ, 670,
1326Zwintz, K., Fossati, L., Ryabchikova, T., et al. 2013, A&A,
550, A121
Acknowledgements: The CoRoT space mission has been developed and operated by CNES, with the contribution of Austria, Belgium, Brazil, ESA, Germany, and Spain.
225