the wealth effects of australian reverse takeovers
TRANSCRIPT

1
The wealth effects of Australian Reverse Takeovers
Student: Makantasi Maria-Irene
SCHOOL OF ECONOMICS, BUSINESS ADMINISTRATION & LEGAL STUDIES
A thesis submitted for the degree of Master of Science (MSc) in Banking and Finance
October 2015
Thessaloniki-Greece

2
Student Name: Makantasi Maria Irene
SID: 1103140014
Supervisor: Prof. Apostolos Dasilas
03/12/2015
X
Signed by: Apostolos Dasilas
I hereby declare that the work submitted is mine and that where I have made use of another’s work, I have attributed the source(s) according to the Regulations set in the Student’s Handbook.
October 2015
Thessaloniki, Greece

3
Abstract
This dissertation was written as part of the MSc in Banking and Finance at the
International Hellenic University.
This study examines a sample of 47 private firms in Australia and New Zealand that
chose to go public through a reverse takeover (RTs) transaction. The proposed
dissertation aims at exploring the wealth effects of such transactions in Australia and
New Zealand which have recently experienced an unprecedented wave of RTs.
Especially, the current study is going to examine the main reasons of going public via
a reverse takeover in the Australian and New Zealand’s market for 47 reverse
takeovers that took place between 1993 and 2014. Another task of the study is to
unveil the main characteristics of reverse takeovers, the benefits and costs for a firm
going public this way and the post-merger operating performance of the new entity.
Reverse takeover is a process that allows a private company to go public by acquiring
a public one. When the transaction is completed, the new merged company usually
operates under the management of the private-target company. Furthermore, the
public company undertakes the target’s name in order to operate as a new entity
after the merger. The public company is most of the times a poor performer or a
non-operating shell which chooses to undertake a RT process in order to improve its
future performance. It has been observed that there are significant gains for the
shareholders during a short term period around the event, but in the long run, the
post-merger performance seems weak. Though the RT process is considered to be a
cheaper and less time consuming method compared with an IPO, it appears to be
risky, if one takes into consideration the long-term performance of the merged
entity. After analyzing our sample we concluded that the announcement of an RT
generates abnormal returns which seem to increase the wealth of the shareholders.
The investors’ reaction is more slow when compared to the results of other studies
but this can be due to the information asymmetry that characterizes the companies
we examine. The post-merger performance analysis gave also good results, showing
that even though the firms do grow in size after the merger, they do not grow in
financial matters at the desired levels. Some of them do not survive as well.
Makantasi Maria Irene
October 2015
Keywords: Reverse Takeovers; RTs; Australia and New Zealand; going public.
4
Acknowledgments
I would like to express my deep gratitude to Dr. Apostolos Dasilas for his valuable
suggestions, guidance and support during all the stages of this dissertation, from the
data collection and planning to the writing up and revision of this master thesis.
Furthermore, I would like to express my gratitude to Fanourakis Foundation for their
valuable help throughout my studies in the International Hellenic University. At the
end, I would like to thank my family and my friends for the support all this time.

5
Table of Contents
Chapter 1:Introduction .............................................................................................................. 7
Chapter 2:Literature Review ..................................................................................................... 9
Chapter 3:Reverse Takeovers .................................................................................................. 14
3.1 The Reverse Takeover Process ...................................................................................... 14
3.2 The regulation ............................................................................................................... 16
3.3 Going Public ................................................................................................................... 17
3.4 The Australian case ........................................................................................................ 17
Chapter 4:Data and descriptive statistics ................................................................................ 21
4.1 Data Sources .................................................................................................................. 21
Chapter 5:Methodology .......................................................................................................... 23
5.1 Multivariate Regression................................................................................................. 24
5.2 Long Term Performance ................................................................................................ 24
Chapter 6:Empirical Results..................................................................................................... 25
6.1 Stock price reaction to RT event ................................................................................... 25
6.2Multivariate Regression ................................................................................................. 27
6.3 Financial Performance ................................................................................................... 28
Chapter 7:Conclusion .............................................................................................................. 31
References ............................................................................................................................... 33
6
List of Tables
Table 1: Distribution of reverse takeovers announcements in Australia and New Zealand
1993-2014……………………………………………………………………………………………………………………..…...21
Table 2: Abnormal Returns and Cumulative Abnormal returns around RT………………………...25
Table 3: Cumulative abnormal returns around the RT………………..………………………………..……26
Table 4: Multivariate regression of 3-day (-1,1) cumulative abnormal returns……….……..…..27
Table 5: Multivariate regression of 3-day (-1,1) cumulative abnormal returns.…………..…..…28
Table 6: Public companies in the year of the event………………..…………………………………….……29
Table 7: Public companies one year after the event…………………………………..………………………29
Table 8: Mean and Medians of fundamentals around the event…………………………………..…...30
List of Figures
Figure 1: Reverse Takeovers in Australia and New Zealand (1993-2014)…………………………...22

7
Chapter 1
Introduction
In the last two decades reverse takeovers (RTs) are alleged to outnumber of
traditional Initial Public Offering (IPOs) as an alternative mechanism to go public. The
reason for this fact is that the IPO process is considered to be very expensive, due to
the high registration fees as well as the underwriting and other hidden expenses.
Because of the fact of being such a time consuming process, IPO seems that has
begun to lose its “reputation” as the preferred mechanism to go public.
Notwithstanding their growing popularity, the wealth effects of RT announcements
are relatively under researched especially in the Australasian region. The Reverse
Takeover process refers to the technique where a private firm wants to go public
without undertaking the high registration and underwriting fees of an IPO process.
Those private firms are usually small, young and most of the times do not meet the
listing criteria, so they choose an alternative way to go public, such as a Reverse
Takeover. RT is a back door of going public because the private company is acquired
by a listed “shell” company in order to obtain the public listing. The shell company
has motivations in order to undertake this process as well. This kind of companies
usually have no assets or operations prior to the takeover, so they expect that
through the merger they will recover their operations and start grow again. Also, it is
a good opportunity for the shareholders to recover some of the losses that occurred
by investing in the shell company. The RT is called Reverse because the new entity
which is formed after the merger is based on the private company-the target. The
academic interest is concentrated on the companies’ motivation and the
understanding of going public this way, the quality and viability of the new entities
as well as the post-performance of the entities after the merger.
Every year RTs seem to gain more popularity as an alternative way to go public.
Lately, more and more researches have been conducted in order to answer
significant questions, such as
What are the main reasons that companies choose Reverse Takeovers to go
public rather than an IPO or another mechanism.
In what way Reverse Takeovers create wealth effects for the shareholders of
the public entity.
What is the post-merger operating performance of the new entity.
The current study aims to answer these questions using data from Australia and New
Zealand. For that reason, a sample of 47 RTs that took place in these countries from
1993 to 2014 was created.

8
Little research has been conducted in order to examine the value relevance of RTs in
the Australian region (see Brown et al. (2010), so we believe that this study will fill
the gap and it will be of the best interest of shareholders, researchers and policy
makers as well.
The structure of our study is as follows: In Chapter 2 we review the literature and the
studies that have been conducted until recently. Chapter 3 is a description of the
process of RTs and their regulation as well, the characteristics and the motivations pf
the firms that chose this process and an Australian case as well. In Chapter 4 we
provide a description of our data collections, In Chapter 5 we present the
methodology used in order to draw conclusions. Chapter 6 is an analysis of the
empirical results and finally in Chapter 7 we provide our conclusions and
recommendations.

9
Chapter 2
Literature Review
In the early stages of a company’s operations, capital is the necessary fuel which is
provided usually from a small number of investors. Most of the times, when the
business cycle gets larger, the company needs more capital in order to expand its
operations and be competitive, so the next step is to sell shares in a larger number of
investors and a way to do that is to go public.
Going public has advantages and disadvantages as well. It may strengthens the
capital base, make a potential acquisition easier, diversify the ownership and
increase the prestige and reputation of the company, but it increases costs, it forces
disclosure to the public and imposes restrictions on management as well. Arellano et
al. (2002) suggest that the IPO process is chosen by high quality firms whereas the
low quality companies prefer the RT method. This explains the significant percentage
of delisted firms after an RT, (32.6%), in the U.S. stock exchange between 1990 and
2000. RT companies are those that did not fulfill any initial listing requirement or
continued listing requirements implying that most of these companies are low
quality firms which should not be listed. In a previous study, Gleason et al. (2003)
investigated a big sample of firms in order to examine special characteristics that
contribute to a reverse takeover to take place. Among their conclusions,
management and the financial position of the private firm are the most common
reasons for a company to participate in a RT. They also claimed that even though the
public firm prior to the announcement of the RT is usually a poor performance firm,
after the announcement the shareholders receive significant wealth gains. In
contrast, after two years of the merger, there is no significant improvement in the
financial and profitability position of the new entity.
Gleason et al. (2005) describes the public status of a firm as the ability to gain access
to capital markets, increase their liquidity and the owners have the possibility to
diversify their holdings. A big drawback of the IPO process is the significant costs that
are associated with this process. The direct costs are considered to be the
underwriting, auditing and legal costs, whereas the indirect are the increased
disclosure requirements and all the management effort needed to conduct this
procedure, (Ritter, 1998). Gleason et al. (2005) investigated the characteristics and
motivation of firms that choose the reverse takeover method and the short and long
stock price performance after the reverse takeover transaction. They employed a
sample of 121 listed in NYSE NASDAQ and AMEX. The authors tried to unveil a

10
hidden relationship between the industry market of the shell company and the
private company in order to go dipper into the RT process. They concluded that the
RT is more beneficial for firms which are trying to recover a part of their investments
and for distressed firms as well. But despite the fact that the authors found
significantly positive abnormal returns on the RT announcement period (one day
prior to the event and one day after), the post-merger performance not only does
not seem to be improved but also, only a 46% of the sample firms seem to survive
two years after the event. They also concluded the motivation of the private
companies choosing to go public through RTs, is the opportunities of growth and the
expansion of their current operations in related or different industry sectors.
The level of information asymmetry is negatively related to the firm size (Aydoglou
et al., 2007) meaning that a small-sized firm is more likely to reject the IPO process in
order to go public and prefer an alternative one, such as the RT process. Poulsen and
Stegemoller (2008) compared outright sell-outs to IPOs and found that another
characteristic of the firms that are more possibly to select an alternative process to
the IPO is the high information asymmetry. Aydoglou et al. (2007) tried to uncover
any unusual trading behavior surrounding reverse mergers via trading activity
analysis. They found sporadic and statistically significant positive returns surrounding
the reverse merger reflecting the increase in value of the shell companies. The
positive CARs following reverse merger announcements supported the initial
findings. Asquith and Rock (2011) focused on the reasons that a company should
choose between an IPO and a RT process to go public. The authors compared the
two methods on a yearly basis and analyzed the 3-Day Excess stock return and the 3-
Day Excess trading volume. They observed that excess returns for the bidding firm,
which is 21.8%, were similar to the excess returns of the firms completing an IPO, so
they concluded that, since the shareholders retain a large percentage of their stock
once the merger is completed, the RTO process can be served as an alternative of
the IPO process, with no extreme differences characterizing the two mechanisms.
Gleason et al. (2008) found that the firms opted for going public via RTs have a very
low ROA in the year of the transaction, but in comparison with firms that chose the
IPO process, they have no difference in ROE. The most common characteristic of the
firms employing RTs is the significantly low balance sheet liquidity, the likelihood of
financial distress and greater financial leverage. By examining the post going public
market performance, Gleason et al. (2008) found that the firms using alternative
methods to go public, such as RTs, outperform the firms that chose the traditional
method of IPOs in the short term. In the long term, they seem to be very volatile,
have lower liquidity and lower institutional participation than their matched
traditional IPO counterparts.
Sjostrom (2008) sees RTs as a way to open the door to Private Investments in Public
Equity (PIPEs) for private companies that have limited alternative funding options.
He found that even though RTs are cheaper and quicker than the traditional IPO
process, the end results, not only in financial matters, between a company that

11
chooses an RT and a company that chooses an IPO are not comparable. The firms
that choose the RT process seem to be significantly less profitable, having
significantly lower balance sheet liquidity, and having significantly more leverage
than comparable IPO firms in the year they went public. So he concluded that the
RM process allows companies to go public even though when they cannot secure the
support of underwriters. Carpentier et al. (2009) tested whether regulation and
disclosure have a significant impact on the value and the long-term performance of
the companies that go public. In order to achieve that, they tested a sample of 1,455
Canadian RTs and IPOs from 1993 to 2003. They also found that due to the listing
requirements, the shareholders’ wealth declines and the performance of the RTs is
poor compared to the corresponding IPOs.
Prior evidence has shown that public firms involved in a reverse takeover are
unprofitable ones with little or none of real business activity. Floros and Sapp (2011)
examined the value that a shell firm brings to a private company in the case where
investors in trading shell companies earn a positive return over time. Their sample
consisted of 585 shell companies. The main question was how these firms that have
no systematic risk, assets and operation still have investors for their shares which
have a declining value over time. They found that these firms have three-month
abnormal returns of 48.1 % which appears to be a compensation for the illiquidity
and the uncertainty that accompanies the reverse takeover process. The shell
companies’ returns at the integration of a reverse merger are much greater than
those of a similar company. In a previous study, Floros and Shastri (2010) argued
that RTs cannot be considered an alternative to IPOs as they are smaller. So, they
compared RTs to PSIPOS- penny stock Initial Public Offerings- as these are thought to
be more comparable than IPOs. They concluded that RTs may be an alternative way
to go public for firms that have low profitability, low liquidity, highly information
asymmetric and are in a primary stage of development and need to invest more in
R&D. These companies do not choose the PSIPO path in order to go public because
of the large discount of their stock price and the misevaluation and ignorance from
the investors as a result of the high information asymmetry that surrounds them.
Semenenko (2011) examined the timing that firms decide to go public and concluded
that when markets are unfavorable, small firms decide to merge with financially
distressed firms. But in the case of RTs the companies have a more strategical
behavior, as they time the market when they merge with publicly traded firms and
sell overvalued capital to their investors. In both studies of Semenenko (2011) and
Ojha et al. (2013) the conclusion was that RTs are becoming more favorable for the
firms that want to go public because they are time and money savers, but they are
becoming a source of big frauds, as many firms tried to get themselves in the US
stock exchange via this way. This is the reason why SEC changed the rules to more
restricted laws in order to ensure a good function of the RT process.
When choosing between RTs and IPOs, the anticipation of insider transactions is
another consideration (LoSardo and Zhu, 2012). It is accepted that insider

12
shareholders can sell their shares more easily after an RTO transaction, since it is a
merger. On the other hand, according to Brau et al. (2003), the insiders who sell a
large amount of their shares during the IPO process, send a signal that the company
is overvalued. This kind of misleading negative information is less likely to spread
during an RT because the acquiring firms might face fewer information asymmetries
relating to the target firm’s value.
The RT process is a viable option for private firms looking to the public capital
markets. This is essential for firms that have no intensive funding demands and need
increased liquidity (LoSardo and Zhu, 2012). They found that IPOs and RTs have an
inverse relationship, suggesting that RTs are used in some cases instead of an IPO, as
an alternative method to go public. “While most IPOs begin their life on the NYSE,
AMEX, or NASDAQ, most RTs begin trading on the OTC Bulletin Board or as “Pink
Sheet” stocks. Therefore, IPO firms are not an ideal benchmark by which to evaluate
the aftermarket performance of RT firms”, (Lee, et al, 2013). In this study, Lee et al.
(2013), examine the earnings quality of the firms that chose to go public through RT
process in the U.S. stock exchange in contrast with the earnings quality of firms that
chose the IPO process. Emphasis was given to the firms originated from China. One
of the most important conclusions was that the RT firms engage in more earnings
management than the IPO firms and generally the non-RT firms.
Siegel and Wang (2013) tried to find whether adopting U.S. institutions leads to a
high uniform level of corporate governance and concluded that when choosing the
RT rout, the rules of the SEC and the Big Four auditors must be followed in order to
allow a company to go public. On the other hand, if Nevada’s laws are followed
instead, there is evidence of negative corporate governance and bad economic
outcomes. Lee, Li and Zhang (2013) stated that there is a difference when it comes
to RTs in the US and Europe and RTs in China. Usually, RTs are small firms that trade
over-the-counter (OTC) and most of the times are early-stage companies. The
Chinese RTs on the other hand, are mature companies and less speculative. Despite
the fact that most of the Chinese firms that chose RTs have been accused of
accounting fraud, they outperform their peers in the US. Darrough and Huang
(2013), on the other hand, suggested that Chinese RTs are lower quality in various
aspects, such as profitability and accounting quality when compared to Chinese IPOs.
Chen et al. (2013) investigated a sample of 193 Chinese firms that trade on the major
stock exchanges in order to explain the reasons that Chinese RTs have lower financial
reporting quality compared to US RTs and Chinese ADR (American Depository
Receipt) as well. The results showed that this low quality in financial reporting comes
from the weak legal enforcement over Chinese firms and the joint effect of the less
scrutinized RT process. Another conclusion was that Chinese companies that have
weak bonding incentives and lower CEO turnover-performance sensitivity choose the
RT process.
Givory et al. (2014) tested a sample of public companies which were formed via a
reverse merger. The main conclusion was that the reporting quality of those firms,

13
regardless of the country of origin, is lower than that of their domestic industry
peers and foreign cross-listed companies. On the other hand, the evidence is less
convincing regarding the alleged inferior quality of foreign RM firms and that of RM
firms originating in the U.S. Zhu et al. (2014), tested whether geographical location,
audit quality and equity offering play a role in the earnings quality of RT firms. They
concluded that firm characteristics are more important and indicative to manage
earnings than geographical location, which was the popular view until then.

14
Chapter 3
Reverse Takeovers
3.1 The Reverse Takeover Process
The Reverse Takeover is a process that allows a private company to go public
without choosing the time and money consuming IPO process. The process for a RT
is very simple and very practical for many companies that wish to go public. A
privately held company, which is the target, is acquired by a publicly held company,
also known as shell company or vehicle company, usually one that is almost defunct
or a non-operating shell (Dasilas et.al. 2009).Initially, the shareholders of the private
company buy enough shares to control a publicly traded company. Then, they
exchange the shares with the shares of the publicly traded company in order the
private company to become a publicly traded one. In most RTs the shareholders of
the private firm hold a huge portion of the shares of the publicly traded company,
which most of the times reaches 90% of the shares. After this transaction, the
combined company which is formed by the takeover, is owned by the private
company and most of the times it changes its name to take the owners. Usually, the
management of the private company replaces the management of the new entity
formed after the takeover, and from that time the target company can raise capital
through markets (Gleason et. al., 2008).
The decision for the appropriate shell company that will be used as a vehicle for the
private one in order to go public is usually undertaken by consulting firms, which
provide any additional information needed. In some cases, small investments
banking outfits or clearinghouses are hired to handle the transaction completely
(Gleason et al., 2005). According to Brenner and Schroff (2004), when the shell
company is detected, the management of the private firm contacts the shell’s
management in order to find out whether they are interested in taking part in the
takeover and agree on further details. The typical process takes from one month to
six, which is a very short period compared to what is needed for an IPO in order to
be completed.
Evidence has shown that the scrutiny of the SEC is less when compared to the IPO
process. Even though the companies that are involved in the RT process are required
to provide financial statements within two weeks that the transaction takes place,
most of the companies declare an “inability to file” form indicating the difficulties of
obtaining a comprehensive set of financial statements so soon after the merger
(Gleason et al., 2005).
15
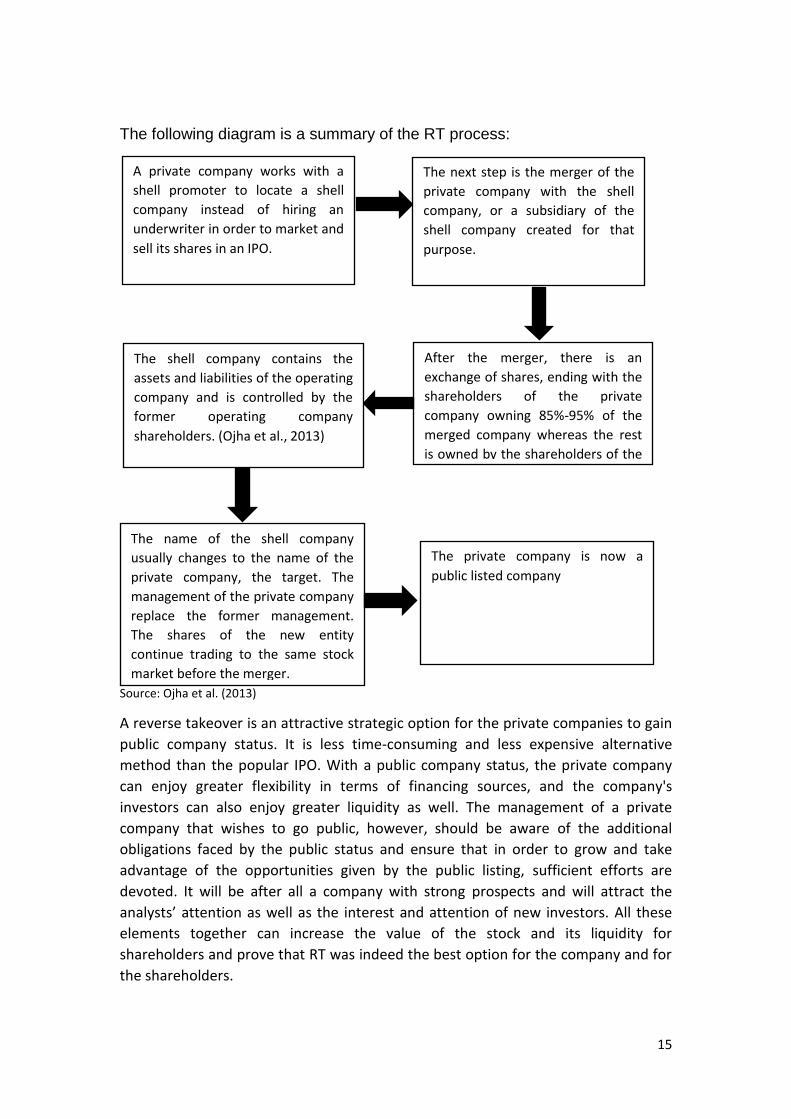
The following diagram is a summary of the RT process:
Source: Ojha et al. (2013)
A reverse takeover is an attractive strategic option for the private companies to gain
public company status. It is less time-consuming and less expensive alternative
method than the popular IPO. With a public company status, the private company
can enjoy greater flexibility in terms of financing sources, and the company's
investors can also enjoy greater liquidity as well. The management of a private
company that wishes to go public, however, should be aware of the additional
obligations faced by the public status and ensure that in order to grow and take
advantage of the opportunities given by the public listing, sufficient efforts are
devoted. It will be after all a company with strong prospects and will attract the
analysts’ attention as well as the interest and attention of new investors. All these
elements together can increase the value of the stock and its liquidity for
shareholders and prove that RT was indeed the best option for the company and for
the shareholders.
A private company works with a
shell promoter to locate a shell
company instead of hiring an
underwriter in order to market and
sell its shares in an IPO.
The next step is the merger of the
private company with the shell
company, or a subsidiary of the
shell company created for that
purpose.
After the merger, there is an
exchange of shares, ending with the
shareholders of the private
company owning 85%-95% of the
merged company whereas the rest
is owned by the shareholders of the
shell company.
The shell company contains the
assets and liabilities of the operating
company and is controlled by the
former operating company
shareholders. (Ojha et al., 2013)
The name of the shell company
usually changes to the name of the
private company, the target. The
management of the private company
replace the former management.
The shares of the new entity
continue trading to the same stock
market before the merger.
The private company is now a
public listed company

16
3.2 The regulation
One of the two entities that take part in the Reverse Takeover transaction is the
publicly held company, which is known as the shell company. Usually these types of
companies are companies without active business operations or significant assets.
These companies sometimes are established only for the purpose of merging with
another company or to act as tax avoidance for legitimate companies. The shell
companies are legal entities, however, they are usually connected to fraud, stock
price manipulation and are known to be used in black or gray market activities.
That’s the reason why the RT process rules are getting tighter over time. Even
though RTs are considered to be fraud cases, some legitimate transactions have
taken places over time having used the SEC rule 419, which is designed to protect
the shareholders from fraud in reverse takeover transactions, (Feldman, 2006). This
rule significantly helped to decrease fraud and not legitimate reverse merger
transactions. With new rules published in “Use of Form S-8, Form 8-K, and Form 20-F
by Shell Companies,” private companies transacting with public shells now have to
produce a major filing within four days of closing prices, as well as adhere to other
minor changes in rules, LoSardo and Zhu (2012).
In Korea, for example, after 2006 reverse takeover companies had to meet the
criteria of KOSDAQ listing standards, where the minimum requirements are equity of
at least 3 billion won and a minimum of 10% ROE, (Song et al., 2014). The Financial
Services Authority (FSA) have made various changes in order to tighten the Listing
Rules concerned the Reverse Takeover process in 2012. The following are relevant
indicators.
The extent to which the transaction will change the strategic direction or
nature of the issuer’s business;
Whether the issuer’s business will be part of a different industry sector
following completion of the transaction; or
Whether the issuer’s business will deal with fundamentally different suppliers
or end users (Linklaters, 2012).
When it comes to RT rules, many stock exchanges have tried to renew them and
keep them tight enough in order to avoid fraud cases. A recent example is the
Toronto stock exchange which announced on the 25th of October 2014 new rules
which allow for a more formal and structured review process regarding the resulting
capitalization structure, exchange ratios, dilution, size, industry, and post transaction
leadership.
The majority of the reverse takeovers we are examining in our study are Australian
companies so it would be helpful to examine the rules that are imposed by the
Australian Regulatory Authorities. According to ASX listing rules (Australian Stock

17
Exchange), being party to a back door listing, such as an RT process, will usually
involve a significant change to the scale of a listed entity’s activities and any
accompanying issue of securities will often be significantly dilutive to existing
security holders. ASX considers this to be a factor that warrants the imposition of a
requirement under Listing Rule 11.1.2 that the transaction be approved by security
holders. Furthermore a back door listing will usually involves a significant change to
the nature of the listed entity’s activities or result in a significant change to the listed
entity’s board of directors, with representatives of the vendor(s) being appointed to
the board. In either case where that is so, ASX considers this to be a further factor
that warrants the imposition of a requirement under Listing Rule 11.1.2 that the
transaction be approved by security holders. ASX will invariably exercise its
discretion under Listing Rule 11.1.3 to require a listed entity that facilitates a back
door listing to re-comply with the admission requirements. This is on the principle
that a person seeking to have an undertaking listed should not be able to achieve by
the back door what they cannot achieve by the front door, (official ASX web page,
2015). These are the main rules taken into consideration when a back door listing
occurs and the same rules seem to be followed by the New Zealand’s stock
exchange.
3.3 Going Public
Reverse Takeovers are considered to be a merger. In strategic management there
are two aspects that a company can follow in order expand without subsidiaries,
child entities or joint ventures. Mergers are usually undertaken by firms in order to
grow and profit from synergy effects (Dasilas et al., 2009). Reverse Takeovers are
considered to be an ideal vehicle for the companies that wish to expand their
operations and profit from any synergies. Such synergies could be the case where
two companies of the same industry can take advantage of the economies of scale,
after the merger. Other advantages for the companies that choose this road such is
the easier access to capital, the greater liquidity, the ability to grow through
acquisitions or strategic partnerships, the ability to use stock options to attract
senior executives and retain them as well, and the increased shareholder confidence
in management (Feldman, 2007). The fraud cases, the public disclosure, the
significant costs are some of the drawbacks that a company has to take into
consideration when going public
3.4 The Australian case
Reverse Takeovers and backdoor listing, in general, are very popular procedures in
Australia as there are plenty of listed shell companies on the Australian Stock
Exchange (ASX). Unfortunately, even though our initial sample with all completed
RTs in the Australian and New Zealand region was approximately 175, due to missing
data we formed a sample of 47 RTs. The ASX has been dominated by the mining
sector, with a large number of junior exploration companies. Given the riskiness of
their endeavors and the cyclical nature of the mining sector, it is not unusual to
witness a fair proportion of these firms facing financial distress when their funding

18
dries up (Brown et al., 2010). These companies, which face distress, appear to be the
ideal candidates for being a shell for backdoor listing. In his research, Sjostrom
(2008) argued that IPOs and RTs are not comparable methods for a firm to go public
when it comes to capital raising and liquidity. However, Brown et al. (2010) showed
through their research that the sample with the Australian RTs they tested,
represent almost an 80 percent of the cases where the capital raisings are present.
Thus they concluded that Australian RT firms are closer substitutes for IPOs than
their U.S. or Canadian counterparts. The Australian market would, therefore, be an
interesting laboratory to examine the motivations of private companies to go public
through RTs.
SWOT analysis for the two alternative methods to go public
Reverse Mergers SWOT analysis
Strengths 1. Cheaper than IPOs 2. Time effective 3. Simple procedure to go public 4. No initial listing requirements 5. Separates the listing process
and the fundraising
Weaknesses 1. No underwriter certification 2. Weak initial trading 3. Complicated or illegal shell
companies 4. Auditing conflicts 5. May not be noticed by
investors
Opportunities 1. Tax benefits 2. Growth opportunities 3. PIPE financing 4. More choices and alternatives
to raise money
Threats 1. Risk to damage the reputation
of the firm 2. Company’s stock might trade at
discount due to uneven information
3. Probability of reverse stock split
4. Default or fraud cases
Source: Ojha et.al. (2013)
19
IPO SWOT analysis
Source : Loshardo and Zhu (2012)
3.3.3 An Australian RT example
Several notable examples of Reverse mergers have taken place in recent years:
1. US Airways and America West Airlines (27th of September, 2005)
2. New York Stock Exchange and Archipelago Holdings ( 27th of February, 2006)
3. Stobart Group and Westbury Property Fund (15th of August, 2007)
But since we are investigating the Australian market, it would be useful to examine
an RT in Australia.
The case of Cocoon and Prime Minerals. (Source: businessinsider.com)
Cocoon Data, a software security startup company, and Covata trading entities
completed a merger with the shell company Prime Minerals, listed in the ASX, in
November 2014. After the merger the company altered its name to Covata and $15
million were raised. With a total market cap of $74 million, Covata was one of the
biggest RTOs that year. According to its management, the company was looking to
raise a minimum of $2.5 million.
Before the RT, Cocoon was posting huge losses: In 2012 the company reported a
total loss of more than $11.1 million, in 2013 that number was $8.376 million and in
June 2014 a loss of $9.769 million. This is because high tech technologies are known
to make huge losses in the early stage of their product development.
Cocoon Data managed to agree a reverse takeover with the mining company, Prime
Minerals a binding for AU$ 57 million on May 2014. Under the terms of the Bid
Implementation Agreement, Prime Minerals acquired 100 percent of issued Cocoon
Strengths 1. Gain prestige 2. Shareholders’ equity increases 3. Company’s public exposure
increases-name recognition
Weaknesses 1. Expensive procedure 2. Time consuming 3. File many documents 4. Direct fees to investment
banks and lawyers
Opportunities 1. Raise capital 2. Pay down debt 3. Increase liquidity
Threats 1. May be affected by capital
markets 2. Stock dilution 3. Stock sale lock-up period for
insiders

20
shares via the reverse takeover offer, with Cocoon shareholders offering total non-
cash consideration of AU$ 57,281,673. Also, the Cocoon option-holders replaced
their existing 28,825,000 Cocoon options with existing Prime options.
After the merger, the company managed to close several agreements with
companies such as NSC Global Services and Verizon Australia, enhancing more its
market profile and its market credibility. This merger helped Covata grow more
aggressively and pursue new opportunities around the world.
In its first day in the ASX, Covata’s shares traded at 20 cents per share.
21
Chapter 4
Data and descriptive statistics
4.1 Data Sources
The purpose of this study is to examine the wealth effects of reverse takeovers that
took place in Australia and New Zealand between 1993 and 2014. The sample was
formed by applying the following criteria: 1) Both acquirers and targets should be
located in Australia and New Zealand. 2) The transaction of RTs must be completed.
By imposing these criteria, the Thomson One database, gave us an initial sample of
353 reverse takeovers. After eliminating all RT transactions that were not completed
and all with missing data, which in our case were a lot, we ended up in a final sample
of 47 RT deals which is not a big sample, however, we will allow us to make the
appropriate inferences. Fundamentals and stock prices were derived from
Bloomberg Database and Thomson One as well.
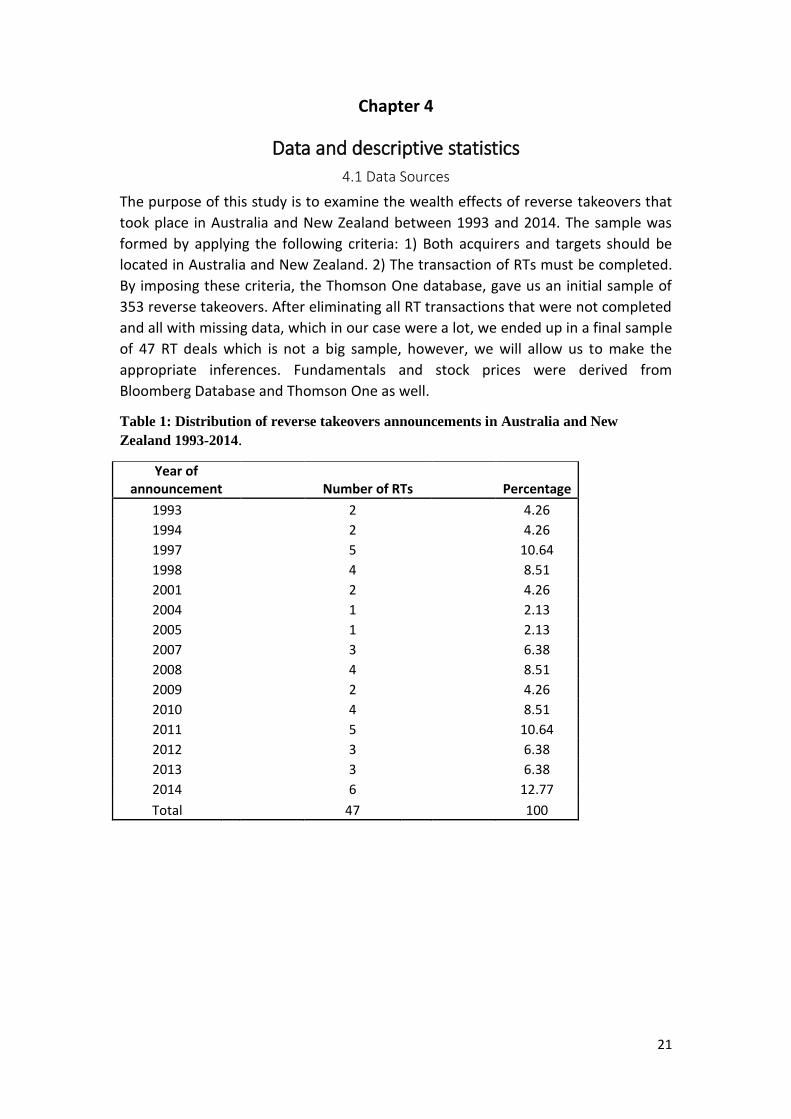
Table 1: Distribution of reverse takeovers announcements in Australia and New
Zealand 1993-2014.
Year of announcement Number of RTs
Percentage
1993
2
4.26
1994
2
4.26
1997
5
10.64
1998
4
8.51
2001
2
4.26
2004
1
2.13
2005
1
2.13
2007
3
6.38
2008
4
8.51
2009
2
4.26
2010
4
8.51
2011
5
10.64
2012
3
6.38
2013
3
6.38
2014
6
12.77
Total
47
100

22
Figure 1: Reverse Takeovers in Australia and New Zealand (1993-2014)
The reverse takeover mechanism grows in popularity between the years 1993 and
1998 while more firms later choose RTs as a means of going public. Between 2001
and 2005, the number of RTs decline and then increases again even when the global
financial crisis started (2008). One reason that might explain the decline of RTs in
2001 is the tech/dotcom bubble burst in 2001, which affected the IPO market and
probably the RT market as well.
It is important to mention that most of the firms we examine, public and private, that
are involved in the RT process come from a wide range of industries with good
growth opportunities. The most popular view that holds for RTs is that this market
consists of small private firms in speculative sectors merging with failing public firms
in low growth opportunity industries (Gleason et al., 2005). The sectors of the
companies that we examine are the following:
industry
No.
1. Consumer products and services
4
2. Consumer staples
1
3. Energy and power
6
4. Financials
2
5. Healthcare
4
6. High technology
5
7. Industrials
17
8. Materials
4
9. Media and entertainment
2
10. Real estate
1
11. Retail
1

23
Chapter 5
Methodology We used the classical event study methodology in order to measure the stock price
reaction to the announcement of a reverse takeover. What the current study examines
is whether the announcement of a RT affects the stock price of the public firm and
creates value for the shareholders of the company. The classical event study
methodology is considered to be the most popular method in order to test market
efficiency and gauge the wealth effects of corporate events such as RTs.
The market model and market adjusted model are employed as return-generating
models. With the market-adjusted model the ex-ante expected return on a stock is
constant across stocks and can differ across time (Sudarsanam, 2010). The expected
return for stock i in time t is given by: (1)
The equation for the market model is: E(Rit)=ai +bi RMt (2)
In order to estimate the parameters ai and bi we use the Scholes and Williams (1977)
technique which takes into account the thin trading problem which is a very
common situation of shell companies, where the transactions are less so the prices
are more volatile and the assets less liquid. The equation for bi is:
where S1 is the beta of the share and Index’ closing prices, S2 is the beta of the share
and the Index’ closing prices leaving out the first day prices of the share and the last
day prices of the Index, S3 is the beta is the same as before but now we eliminate the
last day price of the share and the first day price of the index and M1 indicates the
correlation between the share and the Index prices. The parameters for the market
model, where we estimated the mean and the standard deviation, are estimated by
regressing the stock returns on the market return for the estimation period that
ranges from t-250 to t-11 where t=0 is the announcement date.
The difference between the actual return and the expected return on the security are
the abnormal returns and the equation is: ARit=Rit – E(Rit) (3)
In the above equation, ARit is the abnormal return, Rit is the realized return and E(𝑅𝑖𝑡) is the expected return on security i for the t period.
With a combination of equations (1) and (3), we conclude that the abnormal returns
based on the market-adjusted model are calculated as follows: 𝐴𝑅𝑖𝑡=𝑅𝑖𝑡−RM𝑡 (4)
The abnormal returns based on the market model, are calculated by combining
equations (2) and (3): 𝐴𝑅𝑖𝑡=𝑅𝑖𝑡−(𝑎𝑖+𝑏𝑖𝑅𝑀𝑡) (5)

24
Now, by combining equations (4) and (5) we are able to calculate the abnormal
returns of one security. In order to calculate the abnormal returns of the sample, we
use the formula of Average Abnormal Return (AAR): 𝐴𝐴𝑅𝑡=∑N
i=1 (6)
Where N is the number of stocks involved in a RT.
After calculating the abnormal returns based on the two models, we calculate the
cumulative abnormal returns which are the sum of the abnormal returns for a specific
period T. The formula is: CARit=ΣT
t=1ARit (7)
The Cumulative abnormal returns (CARs) are computed for the following event
periods: (10,10), (-10,-1), (+1,+10), (-5,+5), (-5,-1), (+1,+5), (-1,+1) and (-1,0). We
compute CARs prior and post-RTs in order to capture possible information leakages
or slow market reaction and check for market efficiency. We also calculate abnormal
volatility, based on the market model. Following Landsman and Maydew (2002), we
estimate abnormal volatility (AVAR) as follows: AVARit= (8)
AR2
it is the squared abnormal return that is calculated by the market model and σi2 is
the variance of the company’s market model returns which are calculated during the
estimation period from t-250 to t-11. It is widely known that abnormal volatility takes
only positive values. When this value is below the unity, there is a reduction in
volatility, while a value above unity, implies an increase in volatility during the
specific period.
5.1 Multivariate Regression
Going deeper into the valuation effects of RTs, we used pooled cross-sectional
regression analysis having CARs of three days (-1, 1) as dependent variable. As
independent variables we use the logarithm of Total Assets (size), Return on Assets
(ROA) Return on Equity (ROE), the Cash to Asset ratio and year dummies. We base
the selection of the variables on prior studies investigating RTs (for example, Gleason
et al., 2005a). In both regressions we checked for multicollinearity by looking at the
correlation matrix. We did not find any correlated pairs among variables.
5.2 Long Term Performance
Moreover, we evaluate the long-term performance of RTs examined in this study. To
be more specific, we used a number of financial ratios for the year in which the event
took place as well as for the year after the event. The reason why we opted this
technique is to find out whether there is an improvement in the financial performance
of the RTs firms after the event took place. We calculated, mean, median, maximum,
minimum and standard deviation of the ratios, in order to have a more general view of
the sample and then we performed test of equality in order to go dipper into our
analysis and be more specific to our conclusions.

25
Chapter 6
Empirical Results
6.1 Stock price reaction to RT event
In Table 2 we indicate the average abnormal returns of our sample stocks for the 20
days surrounding the event of the RT process (day 0). Using the market model, our
results show significant abnormal returns in day 0 and day 2 as well, which means
that the shareholders receive significant price appreciations and depreciations
respectively, as in day 2 we have negative results. In the market adjusted model on
the other hand, we have abnormal returns in the day prior to the event and seven
days (day -7) prior to the event. The results should be interpreted carefully because
of the small sample size. These results indicate that the investors react with
consciousness and slow enough in an announcement of RT since we have abnormal
returns after the event. In previous studies, see Gleason et al. (2005), the reaction of
the investors is quick and we do not observe abnormal returns after the
announcement day but we observe significant positive returns in the 10-day period
prior to the event. In this case, the shareholders see the opportunity given to them
to gain back the investment they lost due to investing in distressed companies.
Table 2: Abnormal Returns and Cumulative Abnormal returns around RT.
market model
market adjusted model
CARs % t-Statistic
CARs % t-Statistic
CAR (-10 -1) 6.11%* 1.67
0.064*** 2.67
CAR (+1 +10) -5.25% -1.43
-0.058* -1.95
CAR (-5 -1) 3.38% 1.30
0.037 1.94
CAR (+1 +5) -4.88%* -1.88
-0.044*** -2.20
CAR (-1 +1) 5.40%*** 2.69
0.052 1.14
CAR (-1 0) 6.32%*** 3.85
0.061*** 2.32

26
Table 3 : Cumulative abnormal returns around the RT
market model
market-adjusted model
Days AAR (%) T-statistic
AAR (%) T-statistic
-10 0.708 0.61
0.844 1.45
-9 0.213 0.18
-0.016 -0.02
-8 0.330 0.28
0.303 0.44
-7 1.474 1.27
1.707** 2.66
-6 0.005 0.00
-0.099 -0.13
-5 -0.442 -0.38
-0.059 -0.12
-4 -0.022 -0.02
0.085 0.11
-3 0.142 0.12
0.360 0.35
-2 1.786 1.54
1.544 1.30
-1 1.919 1.65
1.733** 2.08
0
4.401*** 3.80
4.357 1.52
1 -0.919 -0.79
-0.892 -0.70
2 -1.988* -1.71
-1.897 -1.47
3 -1.798 -1.55
-1.521 -1.38
4 -0.658 -0.57
-0.51 -0.28
5 0.482 0.42
0.401 0.52
6 -1.291 -1.11
-1.479 -1.02
7 -0.770 -0.66
-1.071 -1.15
8 0.978 0.84
0.900 0.97
9 0.667 0.58
0.447 0.42
10 0.046 0.04 -0.222 -0.31 Note: * indicates a significant difference from zero at the 10% level. ** indicates a significant
difference from zero at the 5% level and *** indicates a significant difference from zero at the 1%
level.
Table 3 presents the cumulative abnormal returns that surround the RT process. As
we can see, we have statistically significant results that range from 1.67 to 3.85 and
2.67 to 2.32 in the market model and market adjusted respectively, which indicate
that the RT is a process that increases the wealth of the shareholders of the shell
companies involved in the process. Comparing our results with previous studies, we
observe that there are positive abnormal returns on days -3 -2 and -1, (Gleason et
al., 2005b). The most possible explanation that could be given, is that the
shareholders of the shell companies, which are in distress as we have already
mentioned, perceive that RTs are a big opportunity in order to recover or gain back
their losses from investing in such distressed companies. Brown et al. (2002) also
find that the returns on the event day are significantly positive.
27
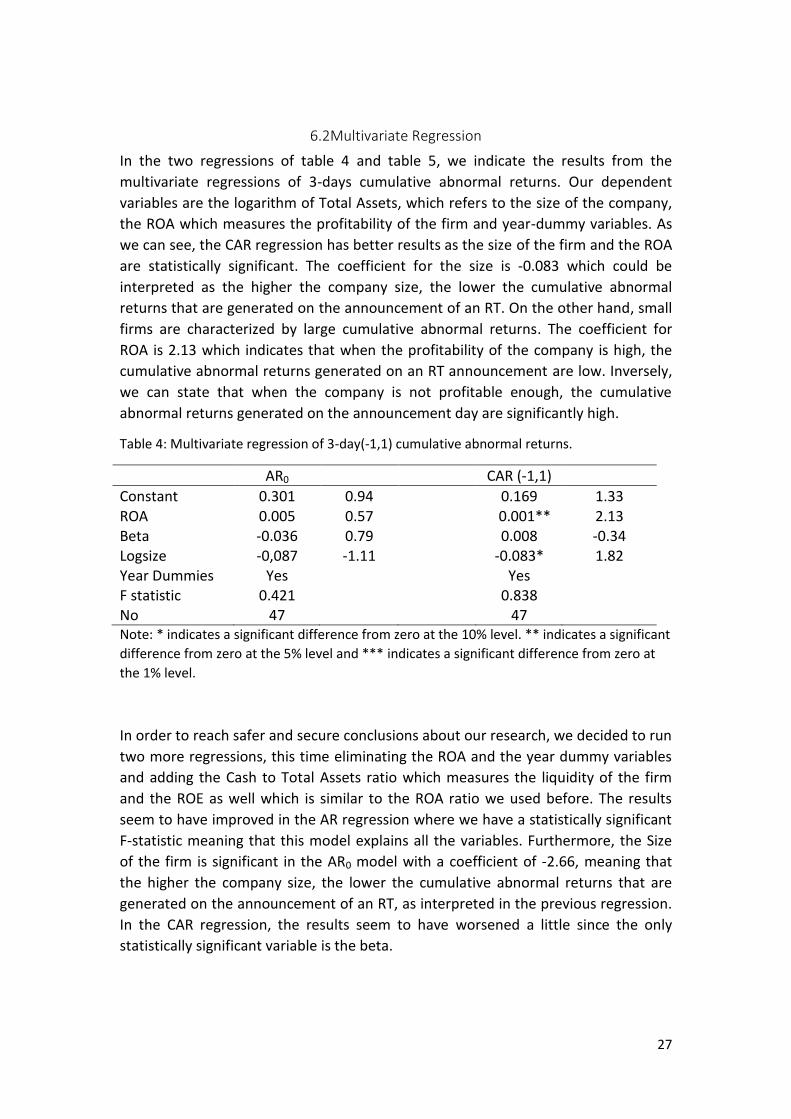
6.2Multivariate Regression
In the two regressions of table 4 and table 5, we indicate the results from the
multivariate regressions of 3-days cumulative abnormal returns. Our dependent
variables are the logarithm of Total Assets, which refers to the size of the company,
the ROA which measures the profitability of the firm and year-dummy variables. As
we can see, the CAR regression has better results as the size of the firm and the ROA
are statistically significant. The coefficient for the size is -0.083 which could be
interpreted as the higher the company size, the lower the cumulative abnormal
returns that are generated on the announcement of an RT. On the other hand, small
firms are characterized by large cumulative abnormal returns. The coefficient for
ROA is 2.13 which indicates that when the profitability of the company is high, the
cumulative abnormal returns generated on an RT announcement are low. Inversely,
we can state that when the company is not profitable enough, the cumulative
abnormal returns generated on the announcement day are significantly high.
Table 4: Multivariate regression of 3-day(-1,1) cumulative abnormal returns.
AR0
CAR (-1,1) Constant 0.301 0.94
0.169 1.33
ROA 0.005 0.57
0.001** 2.13 Beta -0.036 0.79
0.008 -0.34
Logsize -0,087 -1.11
-0.083* 1.82 Year Dummies Yes
Yes
F statistic 0.421
0.838 No 47
47
Note: * indicates a significant difference from zero at the 10% level. ** indicates a significant
difference from zero at the 5% level and *** indicates a significant difference from zero at
the 1% level.
In order to reach safer and secure conclusions about our research, we decided to run
two more regressions, this time eliminating the ROA and the year dummy variables
and adding the Cash to Total Assets ratio which measures the liquidity of the firm
and the ROE as well which is similar to the ROA ratio we used before. The results
seem to have improved in the AR regression where we have a statistically significant
F-statistic meaning that this model explains all the variables. Furthermore, the Size
of the firm is significant in the AR0 model with a coefficient of -2.66, meaning that
the higher the company size, the lower the cumulative abnormal returns that are
generated on the announcement of an RT, as interpreted in the previous regression.
In the CAR regression, the results seem to have worsened a little since the only
statistically significant variable is the beta.

28
Table 5: Multivariate regression of 3-day(-1,1) cumulative abnormal returns.
AR0 CAR (-1,1)
Constant 0.149 2.91
0.155 0.96
ROE -0.001 0.80
-0.073 1.25
Cash -0.001 0.54
-0.0003 0.47
Beta 0.008 0.67
0.036* 1.89
Logsize -0.058* -2.66
0.0032 1.02
Year Dummies No
No F statistic 1.92*
0.715
No 47 47 Note: * indicates a significant difference from zero at the 10% level. ** indicates a significant
difference from zero at the 5% level and *** indicates a significant difference from zero at the 1%
level.
Most of the public firms (shell companies) of our sample that participated in a
reverse takeover transaction are firms with small capitalization, known as penny
stocks or shell companies. Most of the shares that we examine are undervalued, and
that is because of information asymmetry. Small firms, like the ones that we
examine, are not followed by analysts and cannot provide the public with all the
information needed. As Aydoglou et al. (2007) state, the firm size is negatively
related to information asymmetry and thus, small firms are also highly information
asymmetric. So the negative relationship between the size of the firm and the
cumulative abnormal returns is explained by the above theory. The large abnormal
returns of the shell company’s stock are generated because the announcement of
the reverse merger transaction attracts public’s interest and the stock becomes
more liquid and all relevant information is incorporated in the stock price (Andres et
al., 2007). So, after these facts have taken place the stock begins to trade at higher
prices and at some point, it is traded in its fair value.
6.3 Financial Performance
In this section we investigate the financial performance of the new entities that were
formed after the RT. We performed test of equality in means and medians of the
fundamentals surrounding the event. That is the only way to have a clear view of the
ratios and whether they do change. Table 8 indicates the results from the test.
Looking at Total Assets, which indicate the firm size, we observe a significant
increase. That means that the firm size of the new entity increases after the merger.
As we can see from the p-values in table 8, we cannot reject the null hypothesis of
having no change between the year of the event and a year after for the Cash to
Total Assets Ratio, The Return on Assets and the Return on Equity as well, but there
is a slightly improvement to their values. On the other hand, there is a statistically
significant difference in Debt to Total Assets ratio. That can be a sign that the long-
term and short-term debt of these companies’ increases even more, maybe because

29
of expansion efforts. Nevertheless, our sample was quite small and that fact may
manipulated the results.
The fact that there is no change in the ratios of Return on Assets, Return on Equity
and the Total Asset ratio, indicate that these firms, even after the merger, are not
very profitable. Return on Assets is a measure of how efficient the management uses
the Total Assets of the company to generate profits. Return on Equity is a similar
ratio of profitability, indicating how much profit is generated from every unit of
shareholders equity. Cash to Total Assets is an indicator of liquidity and in our
sample it seems that it gets better after the RT. But still, we are conscious about the
results and very careful because we have a small sample which does not allow us to
have clear and safe estimations. We also observe a decline in the number of
observations being examined, which means that some companies, even after the
merger, did not survive even after the merger. That is the case for many companies
which do not have the capability to go public and when merging with a distressed
company, the situation worsens.
Table 6: Public companied in the year of RT.
No Mean Median Maximum Minimum
Standard Deviation
Total Assets(in thousands of Euros) 41 318.86 26.7 5053.5 0.1 878.25
ROA% 41 35.44 10.16 306.97 0 60.26
ROE% 30 48.34 13.765 391.28 0.67 81.74
Cash to Total Assets % 35 4.06 1.1 53.4 0 10.03
Debt to Total Assets % 31 26.481 25.1 87.6 0 27.46
Table 7 : Public companies one year after the event
No Mean Median Maximum Minimum
Standard Deviation
Total Assets(in thousands of Euros) 31 1758.07 52 35908 1.8 6510.11
ROA% 27 26.29 9.06 262.26 0.42 51.43
ROE% 27 77.39 19.2 589.88 0.47 151.32
Cash to Total Assets % 25 3.81 1.2 32.4 0 7.059
Debt to Total Assets % 29 24.258 23.1 80.6 0 24.90

30
Table 8: Mean and Medians of fundamentals around the event
Panel A: Cash to Total Assets
Years 0 1 Period (0.+1)
Mean 3.81 4.06 Change 0.25
Median 1.1 1.2 P value 0.99
> Overall median 13 15 Wilcoxon P-value 0.982
N 25 35
Panel B: Debt to Total Assets
Years 0 1 Period (0.+1)
Mean 1758.07 2425.8 Change 667.73
Median 23.1 52.00 P value 0.098*
> Overall median 9 21 Wilcoxon P-value 3.72
N 29 31
Panel C: Return on Assets
Years 0 1 Period (0.+1)
Mean 26.29 35.54 Change 9.25
Median 9.06 10.16 P value 0.51
> Overall median 13 21 Wilcoxon P-value 0.006
N 27 41
Panel D: Return on Equity
Years 0 1 Period (0.+1)
Mean 48.34 77.39 Change 29.05
Median 19.2 13.76 P value 0.37
> Overall median 14 14 Wilcoxon P-value 1.15
N 27 30
Note: * indicates a significant difference from zero at the 10% level. ** indicates a significant
difference from zero at the 5% level and *** indicates a significant difference from zero at the 1%
level.

31
Chapter 7
Conclusion A reverse Takeover is a mechanism for companies in order to go public without an
IPO and it seems to gain more reputation the last decades because it is considered a
more “easy” access to the public listing. The process of an RT is when a private
company, the target, is acquired by a public company, a shell company, in order to
obtain its public listing. The new entity usually operates under the management and
the name of the former private company, as that is the actual aggressors that start the
negotiations for a Reverse Takeover.
Even though Reverse Takeover grow in popularity with a fast pace, little research has
been done in order to examine this topic, leaving many gaps to be explored in the
future. In this study, we tried to analyze the wealth effects of the RT process in
Australia and New Zealand as well. This region has experienced an unprecedented
wave if RTs but still, no research has been conducted, so we try to fill the gap.
Our results demonstrate that even though RT is considered to be an alternative to the
IPO, the companies that choose the one or the other path usually have different
characteristics, with the smaller and non-profitable ones choosing the RT method.
Still, the two different methods have similar characteristics, follow similar paths and
are affected by similar events. Furthermore, in both cases the private firms come from
a wide range of industries with good growth opportunities opting for expansion. In the
RT case, the public companies because they are in distress, they get involved in a
reverse merger in order to improve their performance and continue to exist.
The empirical results of our study indicate that a Reverse Takeover process is a
process which generates statistically significant abnormal returns around the
announcement of the event. Specifically, we found abnormal returns, positive and
negative, not only the days prior to the event announcement but also, two days after
the announcement. That can be explained by the fact that some investors are
suspicious in such transactions or by the fact that there is information asymmetry not
allowing the investors and the analysts as well to be more realistic and see the
opportunities generated by a reverse takeover. In previous studies, the most common
outcome is when there are abnormal returns until the day of announcement, which
shows that the shareholders react quickly in such big events and try to recover their
losses from investments in distressed companies. The coefficients of the regression
we run showed that the bigger the size of the company, the lower the cumulative
abnormal returns surrounding the event. The profitability ratios (return on assets and
return on equity) show that there is an inverse relationship between the abnormal
returns too, meaning that when the profitability of the company is high, the abnormal
returns are lower. We were very conscious about the results because our sample was
smaller than the expected, due to data unavailability. We went deeper into analyzing
the financial performance of the new public companies after the RT and the
conclusions were interesting enough. The equality test we performed showed that
even though the size of the new entity gets bigger, this fact is not accompanied with
greater profits. That means that these companies cannot generate profit in their early

32
stages even though they have gone bigger. On the other hand, the debt that the
companies owe gets bigger and that could be a sign of growth and expansion which
accompanies the fact that the size of the frim gets bigger after the merger.
We reached a very good point in the analysis of the wealth effects in the Australian
and New Zealand region by showing that an announcement of a reverse merger
generates abnormal returns and investors seem to react sooner or later in such big
events. These abnormal returns can increase the wealth of the shareholders when their
reaction is quick relatively to the date of the announcement, which means that they
see the opportunity given to them to gain back their losses from their investment to
shell companies. We can also consider these abnormal returns as a compensation for
the risk undertaken. On the other hand we are not sure yet whether someone should
invest in such firms, even after the merger, when it is widely known that most of the
times they go public in order to take advantage of these abnormal returns. Further
investigation should be done in order to explain all the matters that surround the
interesting yet unknown case of reverse takeovers such as how to maintain a good
long term performance and how to alleviate the risk that accompanies RTs.
33
References Adjei, F., Cyree, K. B. and Walker, M. M., 2008. The determinants and survival of
reverse mergers vs IPOs. Journal of Economics and Finance, Vol. 32, pp. 176-194.
Andres, C, Betzer, A. and Weir, C., 2007. Shareholder wealth gains through better
corporate governance – The case of European LBO-transactions. Financial Markets
and Portfolio Management, Vol. 21, No. 4, pp. 403-424.
Aydoglou, M., Shekhar, C. and Torbey, V., 2007. Shell companies as IPO
alternatives: an analysis of trading activity around reverse mergers. Applied Financial
Economics, Vol. 17, No 16, pp. 1335-1347.
Beccalli, E., and Pascal Frantz., 2012. 'The Determinants of Mergers And
Acquisitions In Banking. .Journal of Financial Services Research, Vol. 43.3, pp: 265-
291.
Brau, J., Francis, B., Kohers, N., 2003. The choice of IPO versus takeover: Empirical
evidence. Journal of Business, Vol. 76(4), 583-612.
Brown K., Dittmar, A., Servaes, H., 2002. Roll-ups: Performance and incentives for
industry consolidating IPOs, American Finance Association Meeting.
Brown, P. R., Andrew Ferguson, and Peter Lam., 2005, 'Choice Between Alternative
Routes To Go Public: Backdoor Listing Versus IPO'. SSRN Electronic Journal pp:
241-270.
Carpentier, C., Cumming, D. and Suret, J.-M., 2009. The value of capital market
regulation: IPO versus Reverse Merger, s.l.: Working Paper, Laval University.
Cao, J., Douglas J. Cumming, and Meijun Qian., 2010. 'Law, Investor Protection And
Lbos'. SSRN Electronic Journal.
Carpentier, C., Douglas J. Cumming, and Jean-Marc Suret.,2009, 'The Value Of
Capital Market Regulation: Ipos Versus Reverse Mergers'. SSRN Electronic Journal.
Chu, C., G.Gotti and K.M. Schumann, 2014. 'Earnings Quality Of Foreign Vs. U.S.
Reverse Mergers: Geographical Location Or Firm-Level Incentives?'. Journal of
International Accounting Research.
Chu, C., G.Gotti, and K.M. Schumann, 2012. 'Reverse Mergers And Earnings
Quality'. SSRN Electronic Journal.
Darrough, Masako N., Rong Huang, and Sha Zhao.,2013. 'The Spillover Effect Of
Chinese Reverse Merger Frauds: Chinese Or Reverse Merger?'. SSRN Electronic
Journal
Dasilas, A., Koulakiotis, A. and Vutirakis, P., 2009. Reverse takeovers: an alternative
to IPO. International Journal of Financial Services Management, Vol 4, No 1, pp. 11-
20
Dr. Samiksha Ojha, Dr. Samiksha Ojha, 2013. 'Reverse Mergers: The Way
Forward'. IOSR Journal of Business and Management Vol. 10.3 pp: 21-29.

34
Feldman, D.N, 2007. ‘Comments on seasoning of reverse merger companies before
uplisting to national securities exchanges’. Harvard Business Law.
Floros, I. V. and Shastri, K., 2010. ‘A Comparison of Penny Stock Initial Public
Offerings and Reverse Mergers as Alternative mechanisms for Going public’.
Working Paper, Iowa State University.
Floros, I. V., and Shastri. 'An Analysis Of Alternate Paths Used By Non-US Firms To
List In US Markets: Revisiting The Bonding Hypothesis'. SSRN Electronic Journal .
Floros, I. V. and Sapp, R. T., 2009. ‘Shell games: On the Value of Shell Companies’.
Working Paper: Iowa State University
Givoly, D., C. Hayn, and B. Lourie, 2014. 'Importing Accounting Quality: The Case
of Foreign Reverse Mergers'. SSRN Electronic Journal .
Gleason, K. C., Rosenthal, L. and Wiggins, R. A., 2005. Backing into being public: an
expolatory analysis of reverse takeovers. Journal of Gorporate Finance, Vol. 12, pp.
54-79
Gleason, K. C., Jain, R. and Rosethal, L., 2005b. Alternatives for going public:
Evidence from Reverse Takeovers, Self-underwritten IPOs and Tranditional IPOs,
Working Paper, Indian School of Business.
Law, C. a. F., 2012. Changes to the Listing Rules: Tightening reverse takeover rules
and enhancing the premium listing standard [Online]
Available at: http://companyandfinanciallaw.co.uk/2012/01/26/fsa-consults-on-
changesto-the-listing-rules-tightening-reverse-takeover-rules-and-enhancing-the-
premiumlisting-standard/
Lee, Charles M. C., Kevin K. Li, and Ran Zhang, 2015, 'Shell Games: The Long-
Term Performance of Chinese Reverse-Merger Firms'. The Accounting Review. Vol.
90.4 pp: 1547-1589.
Lee, Charles M.C., Kevin K. Li, and Ran Zhang, 2012. 'Shell Games: Are Chinese
Reverse Merger Firms Inherently Toxic?' SSRN Electronic Journal.
LoSardo, Zhu, 2012. ‘A further exploration of Reverse Takeovers as an alternative to
Initial Public Offering’.
Ritter, J. R., 1987. The costs of going public. Journal of Financial Economics, Vol.
19, pp. 269-281.
Rossi, S., and P. F. Volpin, 2004. 'Cross-Country Determinants of Mergers and
Acquisitions'.Journal of Financial Economics. Vol. 74.2 pp: 277-304.
Siegel, J.I., and Yanbo Wang, 2013. 'Cross-Border Reverse Mergers: Causes And
Consequences'. SSRN Electronic Journal .
Scholes, M. and Williams, J., 1977. Estimating betas from nonsychronous data.
Journal of Financial Economics, Vol. 5, pp. 309-327.

35
Sjostrom, W. K., 2008. The truth about reverse mergers. Entrepreneurial Business
Law Journal, Vol. 2, pp. 743-759.
Song, K.“Roy”, I. Kim, and Y.K. Chang, 2014 'A Reverse Takeover As An Exit
Strategy Of Venture Capital: Korean Evidence'. Pacific-Basin Finance Journal. Vol.
29 pp: 182-198.