the water resources of the nile basinsob.nilebasin.org/pdf/chapter_2_water resources.pdf · the...
TRANSCRIPT

0
100
200
300
400
500
J F M A M J J A S O N D
Aver
age
mon
thly
rai
nfal
l
Soroti (1914–2003)
25
The Water Resources of the Nile Basin
Chapter 2

26 STATE OF THE RIVER NILE BASIN 2012
KEY MESSAGES• The Nile Basin is characterized by high climatic
diversityandvariability,alowpercentageofrainfallreachingthemainriver,andanunevendistributionof itswater resources.Potentialevaporation ratesin the Nile region are high, making the basinparticularlyvulnerabletodrought.
• WhiteNileflowsonlycontributeupto15percentof the annualNile discharge, but are fairly stablethroughout the year. The Eastern Nile regionsuppliesupto90percentofannualNileflows,butitscontributionishighlyseasonal.
• Extensive regional aquifer systems holdingsubstantialquantitiesofgroundwaterunderlietheNileregion.Someoftheaquifersholdfossilwater,but others are recharged from precipitation overthebasin,orfromirrigationareasandthebaseflowoftheNile.Groundwateristhedominantsourceofdomesticwatersupplyinruralcommunitiesacrossthebasin.
• The quality of the Nile waters has generallydeteriorated because of population growth,intensification of agriculture, and industrialdevelopment. Across the basin, environmentalsanitation is poor, resulting in bacteriologicalcontaminationandnutrientenrichmentoftheNilewaters.While thequalityof largepartsof theNilesystem – in particular in the sparsely populatedareas–remainsacceptable,localizedhighpollutionis experienced mainly around urban centres.Groundwaterinisolatedlocationsalsohasnaturallyoccurringhighlevelsofdissolvedminerals.
• The headwater regions of the Nile are subjectto widespread soil erosion. Sediment yields areparticularly high in the Eastern Nile sub-basin,whichcontributes97percentofthetotalsedimentload.MostsedimentiscapturedinreservoirsinTheSudan and Egypt, which leads to a rapid loss ofreservoirstoragecapacity.
• The finite Nile flows are now fully utilized foragricultural,domestic,industrial,andenvironmentalpurposes, while water demand continues to risesteadily due to population growth and economicdevelopment.
• Irrigated agriculture in Egypt and The Sudanrepresents the single most important consumerof thewatersof theNile, but theupper ripariansare planning investments thatwill use the river’srenewable discharge and present challengesconcerning the equitable appropriation of theNile water resources amongst the Nile ripariancountries.
• Recommended regional-level actions forconsiderationbytheNileripariancountriesincludethe restoration of degraded water catchmentsthat are critical for sustaining the flow of themajor Nile tributaries, restoring badly degradedlands that export large quantities of sedimentsand cause serious siltation in theNile tributaries,and establishing a regional hydrometric andenvironmentalmonitoringsystem.
TheRiverNile,Egypt.

Sudd
!
!
!
!
!
!
!
!
!
!
!
!
!
!!
!
TANZANIA
THE SUDAN
KENYA
DR CONGO
RWANDA
BURUNDI
EGYPT
ERITREA
UGANDA
ETHIOPIASOUTH SUDAN
Cairo
AsmaraKhartoum
Addis Ababa
El Obeid
Mombasa
Wadi Halfa
Port Sudan
Aswan
Suez
Alexandria
Nairobi
Bujumbura
Juba
Kampala
Kigali
Main Nile
Main N
ile
Blue Nile (Abay)W
hite
Nile
LakeVictoria
Re d S e a
Atbara (Tekezze)
Dinder
Rahad
Sobat
Bahr el Arab
Raga
Albe
rt N
ile
Sopo
Kuru
Jur
Num
atinna
Suo
Bahr
el Z
eraf
Bahr el JebelAswa
Migori
Pibor
Akobo
Baro
Ruwana
Moame
Bahr e
l
Ghazal
0 250 500 km
(Map prepared by the NBI)
THE NILE BASIN2012
basin boundary
The NBI is not an authorityon international boundaries.
N
Water resources
27
THE NILE BASIN
The term ‘basin’ refers to the geographical area drained by a river or lake. The Nile Basin, in the context of this report, refers not only to the physical drainage area of the Nile with its associated biophysical and ecological elements, but also to the people living within the basin and features of their social, cultural, and economic development.
This chapter focuses on the hydrological characteristics of the Nile river system, while the other chapters of the report address the environmental, social, and economic aspects of the basin. The present chapter describes qualitatively and quantitatively the basin’s water resources – which comprise rivers, lakes, wetlands, groundwater, and rainfall. It assesses the availability of the water resources in space and time, and their ability, in terms of water quantity and quality, to sustainably support the consumptive and non-consumptive demands for water across the basin. It ends with a discussion on how benefits to the Nile riparians could be optimized through cooperative management and development of the common Nile water resources on a win–win basis.
TheNile,6,695kilometresintotallength,is,bymostaccounts,thelongestriverintheworld.Itsbasincoversanareaof3.18millionsquarekilometres–some10percentoftheAfrican
continent–andissharedby11countries.
Below:TheVictoria(White)NileasitleavesLakeVictoriaatJinja.

28 STATE OF THE RIVER NILE BASIN 2012
The course of the NileThe most distant source of the Nile is the Ruvyironza River, which flows into Lake Victoria through the Ruvubu and Kagera rivers. Other rivers converging into Lake Victoria – the largest of the Nile Equatorial Lakes – include the Simiyu-Duma, Grumati-Rwana, Mara, Gucha-Migori, Sondu, Yala, Nzoia, Sio, Katonga and Ruizi.
From Jinja in Uganda, the White Nile emerges from Lake Victoria as the Victoria Nile, and travels northwards, passing through two other Equatorial Lakes – Kyoga and Albert. Through these two lakes the Nile captures runoff from two mountainous and high-rainfall areas (Mts Rwenzori and Elgon) on the southwestern and southeastern peripheries of the basin.
The river re-emerges from Lake Albert as the Albert Nile and journeys northwards to Nimule near the South Sudan–Uganda border. From this point, the river, now known as the Bahr el Jebel (meaning river of the mountains), flows over the Fula rapids and through the Sudd before meeting the Bahr el Ghazal (meaning river of the gazelles) at Lake No. The Bahr el Ghazal drains high rainfall areas of western South Sudan. From Lake No, the river turns eastwards to join with the Sobat River, which carries high, seasonally variable, flows originating in the Ethiopian Highlands. The combined Bahr el Jebel and Sobat rivers form the White Nile, which continues its northward descent and meets with the Blue Nile at Khartoum, The Sudan.
The Blue Nile (also known as the Abbai or Abay) originates in Lake Tana in Ethiopia, and is the second principal stream of the Nile. Before meeting the White Nile, the Blue Nile is joined by a number of rivers, the main ones being the Rahad and Dinder, both originating in the Ethiopian Highlands.
AsectionoftheWhiteNile,northofLakeAlbert.Nimuleisatthepointwheretherivernarrows
considerablyandturnsnorthwest,afterwhichitisknownastheBahrelJebel.
TheBlueNile(Abay),flowinginfromthebottomrightofthephotograph,andbeingjoinedby
theriversDinderandRahadbeforemeetingtheWhiteNileatthetopleftofthephotograph.

Water resources
29
From Khartoum, the combined rivers of the Nile flow northwards, and are joined by the Atbara (Tekezze), also originating in the Ethiopian Highlands. The Main Nile continues travelling northwards and flows into Lake Nasser/Nubia, a major man-made reservoir on the border between The Sudan and Egypt that provides inter-annual regulation for Egypt. The Nile eventually discharges into the Mediterranean Sea via its delta.
TheNileasitflowsthroughEgypt,providingvaluableirrigationwatertotheagriculturallandalongitsbanksandinitsdelta.
TheconfluenceoftheWhiteNileandBlueNile(Abay)
bottomright,andthestretchoftheriveruptoLakeNasser/
NubiaandtheAswanDam.

!
!
!
!
!
!
!
!
!
!
!
!
!!
!
THE SUDAN
KENYA
TANZANIA
DR CONGO
RWANDA
BURUNDI
EGYPT
ERITREA
UGANDA
ETHIOPIA
SOUTH SUDAN
Cairo
AsmaraKhartoum
Addis Ababa
El Obeid
Bur Sudan
Wadi Halfa
Aswan
Suez
Alexandria
Nairobi
Bujumbura
Juba
Kampala
Kigali
Main Nile
Main N
ile
Blue Nile (Abay)W
hite
Nile
LakeVictoria
Re d S e a
Atbara (Tekezze)
Dinder
Rahad
Sobat
Bahr el Arab
Raga
Albe
rt N
ile
Sopo
Kuru
Jur
Num
atinna
Suo
Bahr
el Z
eraf
Bahr el JebelAswa
Migori
Pibor
Akobo
Baro
Ruwana
Moame
Bahr e
l
Ghazal
TOTAL RAINFALLAverage annual millimetres 1960–90
under 300
300 – 600
600 – 900
900 – 1,200
1,800 – 2,100
over 2,100
1,200 – 1,500
1,500 – 1,800
The NBI is not an authority on international boundaries.
(Map prepared by the NBI; source of data: Climatic Research Unit)
0 250 500 km
N
30 STATE OF THE RIVER NILE BASIN 2012
RAINFALLAnnual rainfall distributionRainfall over the basin is characterized by highly uneven seasonal and spatial distribution. Most of the basin experiences only one rainy season – typically in the summer months. Only the equatorial zone has two distinct rainy periods. The reliability and volume of precipitation generally declines moving northwards, with the arid regions in Egypt and the northern region of The Sudan receiving insignificant annual rainfall. The spatial variability of rainfall is clearly illustrated by the pattern of vegetation and distribution of surface water bodies in the basin.
Large parts of the Nile watershed do not generate runoff. In fact, the main runoff-producing areas are limited to the Ethiopian Highlands and the Equatorial Lakes Plateau, with some contribution from western South Sudan. The relatively small size of the runoff-producing area is central to explaining the very low runoff coefficient of the Nile (3.9%). Total Nile discharge represents a depth of less than 30 mm if spread over the entire watershed.

FebruaryJanuary March April
JuneMay July August
OctoberSeptember November DecemberMONTHLY RAINFALLAverage millimetres per month1960–90
0 – 30
30 – 60
60 – 90
90 – 120
120 – 150
150 – 180
(Map prepared by the NBI; source of data: Climatic Research Unit)
Water resources
31
TheweatherpatternsovertheNileBasinareinfluencedbymanyfactors,keyamongwhicharethemovementof the Intertropical ConvergenceZone (ITCZ) and thephysiographicfeaturesofthebasin.
TheITCZisabeltoflowpressurecausedbysolarheatingforcingairtorisethroughconvection,whichdrawsinairfromthepolarregions.TherisingmassofconvergingairleadstocloudformationandheavyprecipitationintheregionoftheITCZ.Itslocationvariesthroughouttheyearasitfollowsthesun’szenithpoint,producingwetanddryseasonsinthetropics.AreasintheNileBasinlocatedonorneartheequatorexperiencetwopassagesoftheITCZinayear,andhaveatwin-peakedrainfalldistributionpattern,whileareastothenorthandsouth,haveasingle-peakedpattern.
A large part of the Nile Basin istraversed by northeasterly tradewinds from theEurasia landmass.These carry little moisture andgenerate little rainfall, explainingthelowprecipitationovermuchofthebasin, and theNile’s very lowspecificrunoff.
Thephysiographic featuresof thebasin–inparticularthemountainchain along the margins of thewesternarmoftheRiftValley,thebroad Equatorial Plateau, the MtElgonarea,andEthiopianHighlands–haveamarkedeffecton rainfalldistribution. The windward sideoftheraisedlandmassesreceiveshighrainfall,whiletheleewardsideistypicallydrier.
RainfallinEthiopia,SouthSudan,andTheSudanisconcentratedinthesummermonths.
WEATHER PATTERNS IN THE NILE BASIN

Khartoum
Kassala
El QaderifEl Obeid
RashadNyala
Kosti
El Renk
Malakal
Wau
Juba
KotidoGulu
KijuraEntebbe
Kisumu
KeekorokBukoba
Mwanza
Giheta
SorotiEldoret
Kigali
Wadi Halfa
Dongola
Atbara
!
!
!
!
!
! !
!
!
!
!!
!
!
!!
!
!
!
!
!
!
!
!
!
!
Blue Nile (Abay)
Whi
te N
ile
Main
Nile
LakeVictoria
Lake Tana
Lake Nasser
Lake Albert
Lake George
0
50
100
150
200
250
0
50
100
150
200
250
300
350
0
100
200
300
400
500
0
50
100
150
200
250
300
0
50
100
150
200
250
300
350
400
0
50
100
150
200
250
300
350
0
25
50
75
100
J F M A M J J A S O N D
Aver
age
mon
thly
rai
nfal
l
Wadi Halfa (1943–2000)
0
25
50
75
100
J F M A M J J A S O N D
Aver
age
mon
thly
rai
nfal
l
Dongola (1945–2000)
0
100
200
300
400
500
J F M A M J J A S O N D
Aver
age
mon
thly
rai
nfal
l
Soroti (1914–2003)
0
100
200
300
400
500
600
700
J F M A M J J A S O N D
Aver
age
mon
thly
rai
nfal
l
El Renk (1906–2000)
0
200
400
600
J F M A M J J A S O N D
Aver
age
mon
thly
rai
nfal
l
Juba (1949–2000)
0
100
200
300
400
J F M A M J J A S O N D
Aver
age
mon
thly
rai
nfal
l
Eldoret (1950–2000)
0
100
200
300
400
J F M A M J J A S O N D
Aver
age
mon
thly
rai
nfal
l
Giheta (1950–2000)
0
100
200
300
J F M A M J J A S O N D
Aver
age
mon
thly
rai
nfal
l
Keekorok (1950–2000)
0
100
200
300
400
500
600
700
800
900
J F M A M J J A S O N D
Aver
age
mon
thly
rai
nfal
l
Rashad (1916–2000)
0
100
200
300
400
500
600
700
800
J F M A M J J A S O N D
Aver
age
mon
thly
rai
nfal
l
Wau (1904–2000)
0
100
200
300
400
500
J F M A M J J A S O N D
Aver
age
mon
thly
rai
nfal
l
Gulu(1937–2003)
0
100
200
300
350
J F M A M J J A S O N D
Aver
age
mon
thly
rai
nfal
l
Mwanza (1950–2000)
100
0
200
300
400
500
J F M A M J J A S O N D
Aver
age
mon
thly
rai
nfal
l
Entebbe (1933–2003)
0
100
200
300
400
500
600
J F M A M J J A S O N D
Aver
age
mon
thly
rai
nfal
l
Bukoba (1950–2000)
0
100
200
300
400
500
600
700
J F M A M J J A S O N D
Aver
age
mon
thly
rai
nfal
l
Nyala (1920–2000)
0
100
200
300
400
500
600
700
J F M A M J J A S O N D
Aver
age
mon
thly
rai
nfal
l
Malakal (1940–2000)
0
100
200
300
400
J F M A M J J A S O N D
Aver
age
mon
thly
rai
nfal
l
Kotido (1947–2003)
0
100
200
300
400
J F M A M J J A S O N D
Aver
age
mon
thly
rai
nfal
l
Kijura (1943–2003)
0
100
200
300
400
J F M A M J J A S O N D
Aver
age
mon
thly
rai
nfal
l
Kigali (1962–2003)
0
100
200
300
400
500
J F M A M J J A S O N D
Aver
age
mon
thly
rai
nfal
l
Kisumu (1950–2000)
J F M A M J J A S O N D
Aver
age
mon
thly
rai
nfal
l
J F M A M J J A S O N
D
Aver
age
mon
thly
rai
nfal
l
J F M A M J J A S O N D
Aver
age
mon
thly
rai
nfal
l
J F M A M J J A S O N
D
Aver
age
mon
thly
rai
nfal
l
J F M A M J J A S O N D
Aver
age
mon
thly
rai
nfal
l
J F M A M J J A S O N
D
Aver
age
mon
thly
rai
nfal
l
Atbara (1908–2000) Khartoum (1901–2000)
Kassala (1907–2000) El Qaderif (1904–2000)
El Obeid (1943–2000) Kosti (1931–2000)
(Source data: FAO 2009; WRPM 2011)
MONITORING RAINFALLAverage monthly rainfall in millimetresVarying periods 1914–2003
average monthly rainfall
range to one standard deviation
highest observation recorded
lowest observation recorded
monitoring stations!
N
0 250 500 km
32 STATE OF THE RIVER NILE BASIN 2012
Seasonal rainfall distributionThe high temporal variability of rainfall in the basin is demonstrated by the monthly rain records. Broadly speaking, there are three patterns of seasonal rainfall variation:
A single rain peak June–October, with little or no rainfall in other months. Found in sub-basins of Eastern Nile and Main Nile. See histograms from Atbara to Wau.
A fairly evenly distributed rainfall, with a single peak from April–October. Found in northern Uganda and South Sudan. See histograms for Juba to Eldoret.
A twin-peaked distribution, peaking in March–May and September–November, with considerable but lower rain in other months. Found in Nile Equatorial Lakes Plateau. See histograms from Kijura to Mwanza.

Khartoum
Kassala
El QaderifEl Obeid
RashadNyala
Kosti
El Renk
Malakal
Wau
Juba
KotidoGulu
KijuraEntebbe
Kisumu
KeekorokBukoba
Mwanza
Giheta
SorotiEldoret
Kigali
Wadi Halfa
Dongola
Atbara
!
!
!
!
!
! !
!
!
!
!!
!
!
!!
!
!
!
!
!
!
!
!
!
!
Blue Nile (Abay)
Whi
te N
ile
Main
Nile
LakeVictoria
Lake Tana
Lake Nasser
Lake Albert
Lake George
0
50
100
150
200
250
0
50
100
150
200
250
300
350
0
100
200
300
400
500
0
50
100
150
200
250
300
0
50
100
150
200
250
300
350
400
0
50
100
150
200
250
300
350
0
25
50
75
100
J F M A M J J A S O N D
Aver
age
mon
thly
rai
nfal
l
Wadi Halfa (1943–2000)
0
25
50
75
100
J F M A M J J A S O N D
Aver
age
mon
thly
rai
nfal
l
Dongola (1945–2000)
0
100
200
300
400
500
J F M A M J J A S O N D
Aver
age
mon
thly
rai
nfal
l
Soroti (1914–2003)
0
100
200
300
400
500
600
700
J F M A M J J A S O N D
Aver
age
mon
thly
rai
nfal
l
El Renk (1906–2000)
0
200
400
600
J F M A M J J A S O N D
Aver
age
mon
thly
rai
nfal
l
Juba (1949–2000)
0
100
200
300
400
J F M A M J J A S O N D
Aver
age
mon
thly
rai
nfal
l
Eldoret (1950–2000)
0
100
200
300
400
J F M A M J J A S O N D
Aver
age
mon
thly
rai
nfal
l
Giheta (1950–2000)
0
100
200
300
J F M A M J J A S O N D
Aver
age
mon
thly
rai
nfal
l
Keekorok (1950–2000)
0
100
200
300
400
500
600
700
800
900
J F M A M J J A S O N DAv
erag
e m
onth
ly r
ainf
all
Rashad (1916–2000)
0
100
200
300
400
500
600
700
800
J F M A M J J A S O N D
Aver
age
mon
thly
rai
nfal
l
Wau (1904–2000)
0
100
200
300
400
500
J F M A M J J A S O N D
Aver
age
mon
thly
rai
nfal
l
Gulu(1937–2003)
0
100
200
300
350
J F M A M J J A S O N D
Aver
age
mon
thly
rai
nfal
l
Mwanza (1950–2000)
100
0
200
300
400
500
J F M A M J J A S O N D
Aver
age
mon
thly
rai
nfal
l
Entebbe (1933–2003)
0
100
200
300
400
500
600
J F M A M J J A S O N D
Aver
age
mon
thly
rai
nfal
l
Bukoba (1950–2000)
0
100
200
300
400
500
600
700
J F M A M J J A S O N D
Aver
age
mon
thly
rai
nfal
l
Nyala (1920–2000)
0
100
200
300
400
500
600
700
J F M A M J J A S O N D
Aver
age
mon
thly
rai
nfal
l
Malakal (1940–2000)
0
100
200
300
400
J F M A M J J A S O N D
Aver
age
mon
thly
rai
nfal
l
Kotido (1947–2003)
0
100
200
300
400
J F M A M J J A S O N D
Aver
age
mon
thly
rai
nfal
l
Kijura (1943–2003)
0
100
200
300
400
J F M A M J J A S O N D
Aver
age
mon
thly
rai
nfal
l
Kigali (1962–2003)
0
100
200
300
400
500
J F M A M J J A S O N D
Aver
age
mon
thly
rai
nfal
l
Kisumu (1950–2000)
J F M A M J J A S O N D
Aver
age
mon
thly
rai
nfal
l
J F M A M J J A S O N
D
Aver
age
mon
thly
rai
nfal
l
J F M A M J J A S O N D
Aver
age
mon
thly
rai
nfal
l
J F M A M J J A S O N
D
Aver
age
mon
thly
rai
nfal
l
J F M A M J J A S O N D
Aver
age
mon
thly
rai
nfal
l
J F M A M J J A S O N
D
Aver
age
mon
thly
rai
nfal
l
Atbara (1908–2000) Khartoum (1901–2000)
Kassala (1907–2000) El Qaderif (1904–2000)
El Obeid (1943–2000) Kosti (1931–2000)
(Source data: FAO 2009; WRPM 2011)
MONITORING RAINFALLAverage monthly rainfall in millimetresVarying periods 1914–2003
average monthly rainfall
range to one standard deviation
highest observation recorded
lowest observation recorded
monitoring stations!
N
0 250 500 km
Water resources
33

34 STATE OF THE RIVER NILE BASIN 2012
EVAPOTRANSPIRATIONWater loss from the Earth’s surfaceEvapotranspiration (ET), which is the sum of evaporation and plant transpiration, is an important element of the water cycle. Evaporation accounts for the movement of water from sources such as soil, canopy interception, and open water bodies, to the air, while transpiration accounts for the movement of water within a plant, and its subsequent loss to the atmosphere through plant stomata. Evapotranspiration represents a significant loss of water from drainage basins.
Another important term with regard to water loss from the earth’s surface is Potential Evapotranspiration (PET). This is a measure of the amount of water that would be evaporated and transpired if there were sufficient water available. PET is calculated indirectly from other climatic parameters and incorporates the energy available for evaporation as well as the ability of the lower atmosphere to transport evaporated moisture away from the land surface. Actual evapotranspiration (ET) is said to equal potential evapotranspiration (PET) when there is ample water. Actual evapotranspiration in the Nile Basin is generally high compared to other river/lake basins of the world.
Spatial and temporal evapotranspiration trendsPotential evapotranspiration varies considerably across geographical regions and over time. PET is higher in locations and during periods when there are higher levels of solar radiation and higher temperatures (and hence where there is greater energy for evaporation). Accordingly, PET is higher in hot deserts, low-lying lands, and areas near the equator. PET is also higher on less cloudy days and during the dry season (or summer). PET is higher on windy days because evaporated moisture can be quickly transported away from the ground or plant surface, allowing more evaporation to fill its place. Potential evapotranspiration further depends on relative humidity, the surface type (such as open water), percentage soil cover, the soil type (for bare land), and the vegetation type.
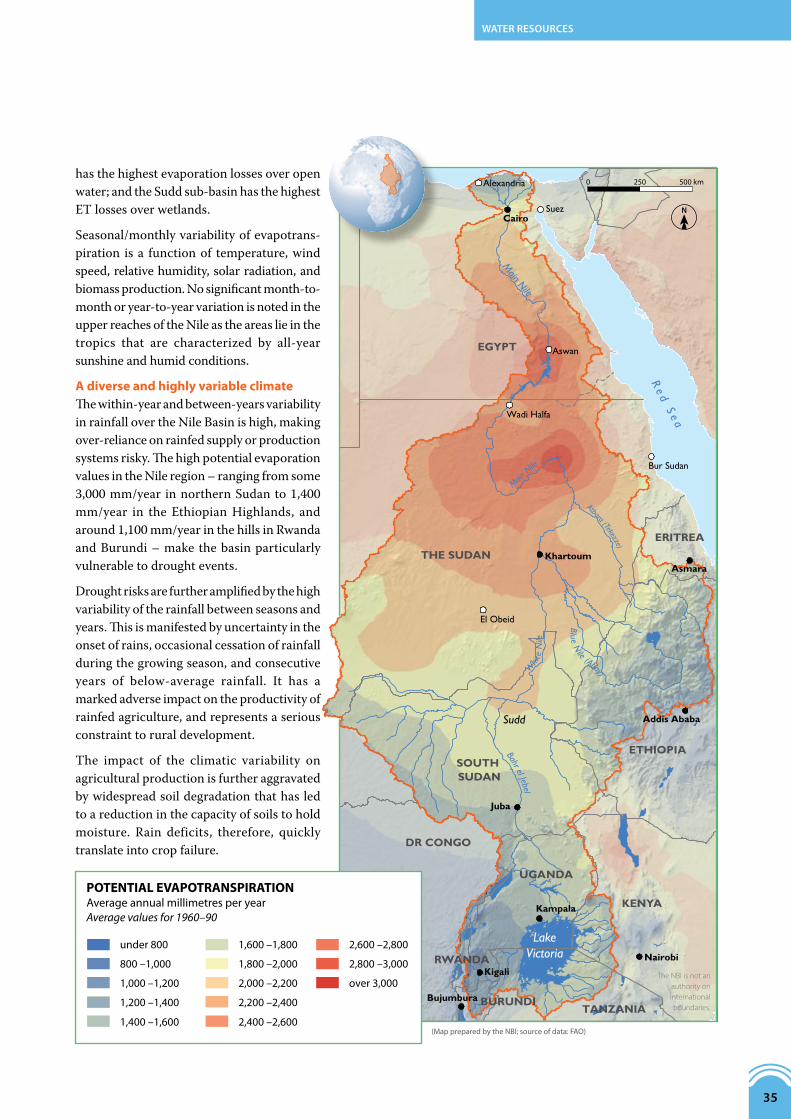
Across the Nile region, actual and potential evapotranspiration vary markedly. The arid lands in The Sudan and Egypt have higher potential evapotranspiration rates than the humid headwater regions of the Nile. However, they have much lower actual evapotranspiration rates because there is little available water and vegetation to cause evapotranspiration. Total annual evapotranspiration is highest in the Lake Victoria sub-basin, estimated at about 307 BCM, followed by the Blue Nile sub-basin, estimated at 264 BCM, then by the Sudd sub-basin estimated at 260 BCM. The Main Nile sub-basin downstream of Khartoum has the lowest evapotranspiration rates, estimated at 7 BCM per year. (See page 35 for sub-basin map.)
In terms of components of evapotranspiration, the Blue Nile (Abay) sub-basin has the highest ET losses over land; Lake Victoria sub-basin
ThelushvegetationoftheupperBlueNilebasinleadstohighevapotranspiration,althoughthe
region’spotentialevapotranspirationrateislowerthanthatofEgyptandTheSudan,where
temperaturesaremuchhigher.
!
!
!
!
!
!
!
!
!
!
!
!
!!
!
THE SUDAN
KENYA
TANZANIA
DR CONGO
RWANDA
BURUNDI
EGYPT
ERITREA
UGANDA
ETHIOPIASOUTH SUDAN
Cairo
AsmaraKhartoum
Addis Ababa
El Obeid
Bur Sudan
Wadi Halfa
Aswan
Suez
Alexandria
Nairobi
Bujumbura
Juba
Kampala
Kigali
Main Nile
Main N
ile
Blue Nile (Abay)W
hite
Nile
LakeVictoria
Re d S e a
Atbara (Tekezze)
POTENTIAL EVAPOTRANSPIRATIONAverage annual millimetres per yearAverage values for 1960–90
under 800
800 –1,000
1,000 –1,200
1,200 –1,400
1,400 –1,600
1,600 –1,800
1,800 –2,000
2,000 –2,200
2,200 –2,400
2,400 –2,600
2,600 –2,800
2,800 –3,000
over 3,000
(Map prepared by the NBI; source of data: FAO)
N
0 250 500 km
Bahr el Jebel
Sudd
The NBI is not an authority on international boundaries.
Water resources
35
has the highest evaporation losses over open water; and the Sudd sub-basin has the highest ET losses over wetlands.
Seasonal/monthly variability of evapotrans-piration is a function of temperature, wind speed, relative humidity, solar radiation, and biomass production. No significant month-to-month or year-to-year variation is noted in the upper reaches of the Nile as the areas lie in the tropics that are characterized by all-year sunshine and humid conditions.
A diverse and highly variable climate The within-year and between-years variability in rainfall over the Nile Basin is high, making over-reliance on rainfed supply or production systems risky. The high potential evaporation values in the Nile region – ranging from some 3,000 mm/year in northern Sudan to 1,400 mm/year in the Ethiopian Highlands, and around 1,100 mm/year in the hills in Rwanda and Burundi – make the basin particularly vulnerable to drought events.
Drought risks are further amplified by the high variability of the rainfall between seasons and years. This is manifested by uncertainty in the onset of rains, occasional cessation of rainfall during the growing season, and consecutive years of below-average rainfall. It has a marked adverse impact on the productivity of rainfed agriculture, and represents a serious constraint to rural development.
The impact of the climatic variability on agricultural production is further aggravated by widespread soil degradation that has led to a reduction in the capacity of soils to hold moisture. Rain deficits, therefore, quickly translate into crop failure.

36 STATE OF THE RIVER NILE BASIN 2012
SUB-SYSTEMS AND SUB-BASINSThe Nile sub-systemsThe Nile Basin comprises three broad sub-systems.
The Eastern Nile sub-system: This covers the catchments of the Blue Nile (Abay), Atbara (Tekezze), and Baro, which encompass large parts of the Ethiopian Highlands and the plains of the eastern region of The Sudan. The runoff from this region contributes between 85 and 90 per cent of the annual Nile flows, but the Blue Nile (Abay) can be seen to respond directly to the seasonal rain patterns, exhibiting clear dry and wet spells.
The Equatorial Nile sub-system: This covers the entire watershed upstream of the Sobat–White Nile confluence. It includes the Equatorial Lakes region as well as most of South Sudan. The regulating effect of the lakes, combined with extensive wetlands in the White Nile Basin, attenuate river flow. The large swamps are also responsible for high evapotranspiration losses. White Nile flows, therefore, only contribute between 10 and 15 per cent to the annual Nile discharge, but are fairly stable throughout the year.
Cattlegrazingonfloodedgrasslands.
TheSuddinflood.
TheconfluenceofthemaintributariesoftheWhiteNileinSouthSudanhasvastexpansesoftropicalfreshwaterwetlands that exert a considerable influence on thehydrologicregimeoftheNile.Thewetlands,nowknowncollectivelyastheSudd,includetheBahrelJebelswamps,theBahrelGhazalswamps, thewetlandsat theBaro–Pibor–Akoboconfluence,andtheMacharmarshes.
Sudd isanArabicword for‘barrier’or‘blockage’. In itsoriginal usage, the Sudd referred to the islands andmassivefloatingmatsofvegetationfoundontheBahrel JebelbetweenMalakal andBor,whichoccasionallycompletelysealedofftheNiletonavigation.
TheareaattheconfluenceoftheWhiteNiletributariesisextremelyflat,withanaverageslopeof10cmperkm.Furthermore,riverchannelsattheconfluenceareveryshallowandannuallyspill largevolumesofwater into
surrounding lands, leading to extensive flooding andwetlandformation.TheSuddwetlandshaveapermanentandseasonalcomponent,theextentofwhichvariesfromyeartoyearfollowinglocalandregionalclimaticvariation,andtheflowregimeoftheBahrelJebelandSobatRivers.
Evaporation from the flooded lands greatly exceedsrainfall,andthewetlandsthereforeresultinanetwaterlosstotheNilesystem.Whilethecomplexityofthechannelsandtheproblemsofmeasuringevaporationfromswampvegetationhavemeantthattheflowsinthewetlandareasarenotwellunderstood,it isestimatedthatonlyabouthalfoftheinflowtotheSuddemergesasoutflow.
Suddoutflowsshowlittleseasonalvariation,providingafairlyconstantcontributiontotheWhiteNilethroughoutthe year. Bybufferingpeakflows, the swampshave aregulatingeffectonthedownstreamriverregime.
THE SUDD AND ITS INFLUENCE ON THE NILE HYDROLOGY

0
1,000
2,000
3,000
4,000
5,000
6,000
Jan Feb Mar Apr May Jun Jul Aug Sep Oct Nov DecJ F b M A M J J l A S O t N D (Source of data: NBI WRPM Project 2012)
NILE FLOWSAverage monthly �ow,cubic metres per second
White Nile at Mogren 1962–88
Blue Nile (Abay) at Khartoum 1962–88
Main Nile at Tamaniat 1962–90
(Source of data: Blackmore and Whittington 2008)
TOTAL FLOWS OF THE NILE billion cubic metres per year
river �ow
in�ows
evaporative losses
Aswan dam
Atbara (Tekezze)
Blue Nile (Abay)
Rahad & Dinder
Sobat Baro
Pibor
L. Tana
L. VictoriaL. Kyoga
Mai
n N
ile
L. Albert
Sudd
west inflow to Bahr el Ghazal
west inflow to Bahr el Jebel
–10.5
12.0
–6.0
–94.5
13.03.8
4.8
–1.0
3.0
28.5
13.5
6.5
26.5
22.5 23.5 18.0
rainfall100
84.0
94.5
82.5
54.0
50.0
15.0
11.3
3.3
–30.9
–4.0
–2.5
n/a
N
Water resources
37
The Main Nile Zone: This encompasses the downstream river reach, starting at the Blue–White Nile confluence at Khartoum. This large area generates virtually no runoff, and in-stream evaporation results in a net loss. River flow in the lower reaches is controlled by Lake Nasser, which is subject to significant evaporation losses. Most river flow is diverted to the irrigation schemes in the north of The Sudan and in Egypt, and only drainage and re-used water is discharged into the Mediterranean Sea.

!
!
!
!
!
!
!
!
!
!
!
!
!
!!
!
TEKEZZE-ATBARA
LOWER WHITE NILE
BLUE NILE
BARA-AKABO-PIBOR
VICTORIA NILE / ALBERT NILE
LAKE VICTORIA
BAHR EL GHAZAL
SUDD
MAIN NILE
12.0
54.0
23.4
3.0
–22.8
11.3
13.5
TANZANIA
THE SUDAN
KENYADR CONGO
RWANDA
BURUNDI
EGYPT
ERITREA
UGANDA
ETHIOPIA
SOUTH SUDAN
Cairo
AsmaraKhartoum
Addis Ababa
El Obeid
Mombasa
Wadi Halfa
Port Sudan
Aswan
Suez
Alexandria
Nairobi
Bujumbura
Juba
Kampala
Kigali
Main Nile
Main N
ile
Blue Nile (Abay)W
hite
Nile
LakeVictoria
Re d S e a
Atbara (Tekezze)
Dinder
Rahad
Sobat
Bahr el Arab
Raga
Albe
rt N
ile
Sopo
Kuru
Jur
Num
atinna
Suo
Bahr
el Z
eraf
Bahr el JebelAswa
Migori
Pibor
Akobo
Baro
Ruwana
Moame
Bahr e
l
Ghazal
0 250 500 km
THE MAIN SUB-BASINS AND THEIR CONTRIBUTION TO THE NILEbillion cubic metres per year
N
The NBI is not an authority on international boundaries.
(Map prepared by the NBI; source of data: Blackmoreand Whittington 2008)
38 STATE OF THE RIVER NILE BASIN 2012
The Nile sub-basinsWithin the three broad sub-systems, nine distinct catchment areas or sub-basins can be found, namely Lake Victoria, Victoria–Albert Nile, Sudd, Bahr el Ghazal, Baro–Pibor–Sobat, Blue Nile (Abay), Atbara (Tekezze), White Nile, and Main Nile sub-basins. Each one of these has unique hydrological characteristics as summarized below.
CHARACTERISTICS OF THE NILE SUB-BASINSSub-basin Area (km2) Average
annual precipitation
(mm/yr)
Average annual
reference evapo-
transpiration (mm/yr)
Specific runoff (mm/
km2/yr)
Runoff coefficient
(%)
Specific yield
(MCM/km2/yr)
Comments
Main Nile 958,639 198 2,206 0.0 0.0% – Withnosurfacerunoffcontribution,in-streamflowlossesresultinanetlosstotheNileSystem.
Atbara (Tekezze)
232,370 733 1,778 50.4 7.3% 0.054 AllrunoffisconcentratedintheJulytoSeptemberperiod.
Blue Nile (Abay)
308,157 1,099 1,765 148.9 15.9% 0.175 SeasonalrunoffinJulytoNovember,withonlybaseflowintherestoftheyear.
White Nile 237,391 754 1,983 0.0 0.0% –
Baro-Pibor- Sobat
230,293 1,338 1,592 45.3 4.4% 0.059 Runoffisattenuatedbythelargewetlandareasinthebasin.
Bahr el Ghazal
555,428 826 1,807 0.1 2.5% 0.020 Sub-basinhasalowrunoffduetohighevapotranspirationintheBahrelGhazalwetlands.
Sudd (Bahr el Jebel)
169,665 1,067 1,694 -12.6% -0.134 Becauseofevaporationinthelargewetlandareas,thereisanetlossofwaterintheSuddsub-basin.
Victoria –Albert-Nile
243,080 1,179 1,544 37.7 1.0% 0.012 Thelowrunoffcoefficientiscausedbynetlossesduetohighevapotranspirationratesinthelargelakesandwetlandsystems.
Lake Victoria
241,520 1,368 1,486 107.5 7.1% 0.097 Overthelake,rainfallandthelakeevaporationarethelargestcomponentsofthewaterbalanceofLakeVictoria.ThelargestoragecapacityofthelakeattenuatesseasonalflowvariationsandleadstorelativelystableVictoriaNileflows.
Combined Nile System
3,176,543 1,046 1,972 26.4 3.9% 0.030
Sources: NBI-GISUnit GIS/CRUdataset1960–90
GIS/CRUdataset1960–90
Sutcliffe&Parks
ComputedfromJMPScopingStudyfigures
ComputedfromJMPScopingStudyfigures

!
!
!
!
!
!
!
!
!
!
!
!
!
!!
!
TEKEZZE-ATBARA
LOWER WHITE NILE
BLUE NILE
BARA-AKABO-PIBOR
VICTORIA NILE / ALBERT NILE
LAKE VICTORIA
BAHR EL GHAZAL
SUDD
MAIN NILE
12.0
54.0
23.4
3.0
–22.8
11.3
13.5
TANZANIA
THE SUDAN
KENYADR CONGO
RWANDA
BURUNDI
EGYPT
ERITREA
UGANDA
ETHIOPIA
SOUTH SUDAN
Cairo
AsmaraKhartoum
Addis Ababa
El Obeid
Mombasa
Wadi Halfa
Port Sudan
Aswan
Suez
Alexandria
Nairobi
Bujumbura
Juba
Kampala
Kigali
Main Nile
Main N
ile
Blue Nile (Abay)W
hite
Nile
LakeVictoria
Re d S e a
Atbara (Tekezze)
Dinder
Rahad
Sobat
Bahr el Arab
Raga
Albe
rt N
ile
Sopo
Kuru
Jur
Num
atinna
Suo
Bahr
el Z
eraf
Bahr el JebelAswa
Migori
Pibor
Akobo
Baro
Ruwana
Moame
Bahr e
l
Ghazal
0 250 500 km
THE MAIN SUB-BASINS AND THEIR CONTRIBUTION TO THE NILEbillion cubic metres per year
N
The NBI is not an authority on international boundaries.
(Map prepared by the NBI; source of data: Blackmoreand Whittington 2008)
Water resources
39

B lue Nile (Abay)
Whi
te N
ile
Main
Nile
LakeVictoria
Atbara (Tekezze)
Dinder
Rahad
Tekezze
Setit
Sobat
Bahr el Arab
Bahr el Ghazal
Raga
Sopo
Kuru
Jur
Num
atinna Suo
Bahr el Jebel
Aswa
Migori
Pibor
Akobo
Baro
Ruwana
M
oame
Tonj
i
Albe
rt N
ile
Lake Tana
Lake Nasser
Lake Albert
Lake George
Lake Edward
Lake Kyoga
MEASURING RIVER FLOWAverage monthly runo� in billion cubic metresVarying periods 1900–95
(Source)
1
2
34 5
6
7
8910
1112
13
14
15
16
1718
19
20
0
5
10
15
20
J F M A M J J A S O N D J F M A M J J A S O N D J F M A M J J A S O N D0
5
10
15
20
0
5
10
15
20
0
5
10
15
20
0
5
10
15
20
0
5
10
15
20
0
5
10
15
20
0
5
10
15
20
0
5
10
15
20
0
5
10
15
20
0
5
10
15
20
0
5
10
15
20
0
5
10
15
20
0
5
10
15
20
0
5
10
15
20
0
5
10
15
20
0
5
10
15
20
0
5
10
15
20
0
5
10
15
20
J F M A M J J A S O N D J F M A M J J A S O N D J F M A M J J A S O N D
0
5
10
15
20
J F M A M J J A S O N D J F M A M J J A S O N D J F M A M J J A S O N D
J F M A M J J A S O N D J F M A M J J A S O N D J F M A M J J A S O N D
J F M A M J J A S O N D J F M A M J J A S O N D J F M A M J J A S O N D
J F M A M J J A S O N D
J F M A M J J A S O N D
J F M A M J J A S O N D J F M A M J J A S O N D J F M A M J J A S O N D
1: Nile at Dongola (1910–95) 2: Atbara at Mouth (1903–94) 3: Nile at Tamania (1911–95)
4: Khartoum (Blue Nile) (1900–95) 5: Nile at Mogren (1911–95) 6: Dinder Mouth (1907–97)
7: Blue Nile at Diem (1912–97) 8: White Nile at Malakal (1905–95) 9: Sudd Outflow (1905–83)
11: Baro at Gambeia (1905–59) 12: Baro at Mouth (1929–63) 13: Nyamlel (1944–85)
15: Mongalia (1940–77) 16: Lake Albert outflow (1940–77) 17: Semliki Mouth (1940–77)
10: Hillet Dolieb (Sobat Mouth) 1905–83
14: Jur at Wau (1942–86)
18: Kyoga outflow (1940–77) 19: Lake Victoria outflow (1940–77) 20: Kagera (Kyaka Ferry) (1940–78)
N
(Map prepared by the NBI; source of data: Sutcli�e & Parks)
0 250 500 km
40 STATE OF THE RIVER NILE BASIN 2012
RECORDING RIVER FLOWSince the early years of the last century, records have been kept of the monthly discharge at key sections of the Nile and its main tributaries. Because these were calculated from flow data with different periods they cannot be compared directly, but they do provide a good picture of the seasonal variation, and of the relative contribution of the respective tributaries to the total Nile flow.
Hydrometric activities have declined in recent years, and data gaps now exist for important sections of the Nile system (see Chapter 8). This prevents proper water resources planning and management, and makes it difficult to validate climate models.

B lue Nile (Abay)
Whi
te N
ile
Main
Nile
LakeVictoria
Atbara (Tekezze)
Dinder
Rahad
Tekezze
Setit
Sobat
Bahr el Arab
Bahr el Ghazal
Raga
Sopo
Kuru
Jur
Num
atinna Suo
Bahr el Jebel
Aswa
Migori
Pibor
Akobo
Baro
Ruwana
M
oame
Tonj
i
Albe
rt N
ile
Lake Tana
Lake Nasser
Lake Albert
Lake George
Lake Edward
Lake Kyoga
MEASURING RIVER FLOWAverage monthly runo� in billion cubic metresVarying periods 1900–95
(Source)
1
2
34 5
6
7
8910
1112
13
14
15
16
1718
19
20
0
5
10
15
20
J F M A M J J A S O N D J F M A M J J A S O N D J F M A M J J A S O N D0
5
10
15
20
0
5
10
15
20
0
5
10
15
20
0
5
10
15
20
0
5
10
15
20
0
5
10
15
20
0
5
10
15
20
0
5
10
15
20
0
5
10
15
20
0
5
10
15
20
0
5
10
15
20
0
5
10
15
20
0
5
10
15
20
0
5
10
15
20
0
5
10
15
20
0
5
10
15
20
0
5
10
15
20
0
5
10
15
20
J F M A M J J A S O N D J F M A M J J A S O N D J F M A M J J A S O N D
0
5
10
15
20
J F M A M J J A S O N D J F M A M J J A S O N D J F M A M J J A S O N D
J F M A M J J A S O N D J F M A M J J A S O N D J F M A M J J A S O N D
J F M A M J J A S O N D J F M A M J J A S O N D J F M A M J J A S O N D
J F M A M J J A S O N D
J F M A M J J A S O N D
J F M A M J J A S O N D J F M A M J J A S O N D J F M A M J J A S O N D
1: Nile at Dongola (1910–95) 2: Atbara at Mouth (1903–94) 3: Nile at Tamania (1911–95)
4: Khartoum (Blue Nile) (1900–95) 5: Nile at Mogren (1911–95) 6: Dinder Mouth (1907–97)
7: Blue Nile at Diem (1912–97) 8: White Nile at Malakal (1905–95) 9: Sudd Outflow (1905–83)
11: Baro at Gambeia (1905–59) 12: Baro at Mouth (1929–63) 13: Nyamlel (1944–85)
15: Mongalia (1940–77) 16: Lake Albert outflow (1940–77) 17: Semliki Mouth (1940–77)
10: Hillet Dolieb (Sobat Mouth) 1905–83
14: Jur at Wau (1942–86)
18: Kyoga outflow (1940–77) 19: Lake Victoria outflow (1940–77) 20: Kagera (Kyaka Ferry) (1940–78)
N
(Map prepared by the NBI; source of data: Sutcli�e & Parks)
0 250 500 km
Water resources
41
GROUNDWATER Where groundwater occursAs well as surface waters, the Nile Basin countries have considerable groundwater resources occurring in localized and regional basins. Groundwater is an important resource, supporting the social and economic development of the Nile riparian countries and making an important contribution to water and food security in the region. The degree to which it is relied upon varies from country to country, but commonly it is the most important source of drinking water for rural communities in the basin.
Groundwater in the Nile Basin mainly occurs in four rock systems or hydrogeological environments: Precambrian crystalline/metamorphic basement rocks, volcanic rocks, unconsolidated sediments, and consolidated sedimentary rocks. Water in these four rock types occurs in confined and unconfined conditions.
Main aquifersVictoria artesian aquifer: This occupies an area underlain by Precambrian basement rocks and is distinguished by abundant precipitation, a well-developed surface drainage system, and complex geomorphology and structure produced by neotectonic movements. The aquifer is extremely abundant in surface water, which is present in numerous swamps, rivers, and lakes. It also has many mineral springs, some of which issue warm water.
Congo hydrogeological artesian aquifer: This occupies an area of more than 3.2 million square kilometres of Equatorial Africa. The geologic section of the basin consists of Archean, Proterozoic, Paleozoic, Mesozoic, and Cenozoic deposits. The characteristics of the aquifer have not been adequately studied due to the abundance of surface water.
Crystalline igneous and metamorphic rocks: Theserocks, dating from the Precambrian period, underlielargepartsofthebasinbutaremostextensiveintheNileEquatorialLakesPlateau,thesouthernandsouthwesternpartsofSouthSudan,southernpartsofTheSudan,andparts of the Ethiopian Highlands. The parent rock isessentiallyimpermeable,andproductiveaquifersoccurintheweatheredoverburden(regolith)orwherethereisextensivefracturingoftheparentrock.Generally,thelatterarethemoreproductivecrystallinebasementaquifers.
Volcanic rocks:VolcanicrocksaremainlyfoundinthehighlandsofEthiopia,wheretheyformvariablebuthighlyproductiveaquifers.Volcanicrockaquifersoccuratdeeperdepthandtypicallyhavehigheryieldsthanthecrystallinebasementaquifers.TheyarewidelyusedforurbanandruralwatersupplyintheEthiopianHighlands.
Consolidated sedimentary rocks:Thisgrouphashighlyvariable rock types that vary from low-permeabilitymudstonesandshaletomorepermeablesandstonesandlimestones.TheyoccurmostlyinTheSudanandEgypt,andformvast,regionallyextensive,productiveaquifers.TheNubiansandstoneaquifersystemisthelargestoftheconsolidatedsedimentaryrockaquifers,andoneofthelargestandmostproductiveaquifersintheworld.
Unconsolidated sedimentary rocks: These aredistributedthroughoutthebasin,occurringmainlyalongthecoursesofthemainrivers.InEthiopiatheyoccurinthe BlueNile (Abay), Atbara (Tekezze), and Baro sub-basins. InTheSudan,thereareseveralunconsolidatedalluviumkhorsandwadis,themostnotablebeingtheElGashbasin.InEgypttherearetwomainunconsolidatedaquifers,namelytheNileValleyandNileDeltaaquifers.
MAIN HYDROGEOLOGICAL ENVIRONMENTS IN THE NILE REGION

42 STATE OF THE RIVER NILE BASIN 2012
Upper Nile artesian aquifer: This lies in the extreme southern part of Bahr el Ghazal, White Nile, and Sobat plains. These plains constitute an internal recharge and accumulation area for the aquifer, while surrounding mountains (which are composed of metamorphic rocks, Precambrian granites, and Quaternary sediments), serve as an external recharge area. The northern parts of the basin are underlain by rocks of the Nubian series and have water occurring at depths of 25 to 100 metres, with sufficiently high artesian yields. In the Precambrian varieties, groundwater is encountered at depths varying from 3 to 60 metres. In spite of the limited reserves of water accumulating in the weathering crust; they are widely used for water supply. The alluvial deposits of the external recharge area of the basin contain fresh and brackish pheriatic waters occurring at depths of 6 to 10 metres.
Volcanic rock aquifers: These occur mainly in the Ethiopian Highlands and cover large parts of the Gambela plains, the Lake Tana area, the Shinile plain, the Rift Valley areas, and grabens filled with alluvial sediments at the foothill of the rift-bounding escarpments. The aquifer comprises of shallow to very shallow and loose sediments. Yields of the metamorphic rocks are variable, depending mainly on the degree of weathering.
Nubian sandstone aquifer system: This covers an area of approximately 2 million square kilometres spanning parts of The Sudan, Egypt, Libya, and Chad. The aquifer holds fossil (non-renewable) water originating from the Pleistocene period when more humid conditions prevailed in the region. It varies in thickness from 200 to 600 metres, is highly porous and has high transmissivity (up to 4,000 m3/day). Other notable consolidated sedimentary aquifers in the region include the Umm Ruwaba, Gezira, and Al Atshan aquifers in The Sudan; the Moghra Aquifer found between the Nile Delta and the Qattara Depression in the Western Desert in Egypt; and fissured and karsified carbonate aquifers in the Wadi Araba areas in the Eastern Desert in Egypt.
Nile Valley aquifer: This consists of fluvial and reworked sands, silts, and clays ranging in thickness from a few metres to over 300 metres. This high storage capacity combined with high transmissivity and active replenishment from the Nile River and irrigation canals makes the aquifer a highly valued resource.
Nile Delta aquifer: Like the Nile Valley aquifer, this consists of sand and gravel with intercalated clay lenses. The aquifer, which is up to 1,000 metres thick in some areas and has high transmissivity (up to 25,000 m3/day) is an equally valuable resource.
Groundwater rechargeThere is high variability in recharge in the groundwater systems in the Nile region, with rates ranging from a few millimetres to over 400 millimetres per year. This high variability is due to differences in the distribution and amount of rainfall across the basin, contrasting geomorphology, varying rock permeability, and uneven distribution
Wateristhemostpreciousresourceinthedrierregions.Goats,camels,andcattleallusethiscrowdedwaterpointinSouthernKordofan.

!
!
!
!
!
!
!
!
!
!
!
!
!!
!
THE SUDAN
KENYA
TANZANIA
DR CONGO
RWANDA
BURUNDI
EGYPT
ERITREA
UGANDA
ETHIOPIA
SOUTH SUDAN
Cairo
AsmaraKhartoum
Addis Ababa
El Obeid
Bur Sudan
Wadi Halfa
Aswan
Suez
Alexandria
Nairobi
Bujumbura
Juba
Kampala
Kigali
LakeVictoria
Re d S e a
Aswa
Atbara (Tekezze)
Dinder
Rahad
Sobat
Bahr el Arab
Raga
Sopo
Kuru
Jur
Num
atinna
Albe
rt N
ile
Suo
Bahr
el Z
eraf
Bahr el Jebel
Pibor
Akobo
Baro
Bahr e
l
Ghazal
Main Nile
Main N
ile
Blue Nile (Abay)W
hite
Nile
N
(Based on map by BGR / UNESCO.)
0 250 500 km
The NBI is not an authority on international boundaries.
REGIONAL GROUNDWATER AQUIFERS Structure and recharge rate, millimetres per year
very high high medium low very lowin major aquifersin areas with complex hydrogeological structurein areas with local and shallow aquifers
areas of saline groundwater (>5,000 mg/l total dissolved solids) groundwater mining
Sudd
Water resources
43
of large surface water bodies that recharge groundwater.
Recharge in the crystalline basement rock aquifers ranges from 6 mm/yr close to the shores of Lake Victoria to 200 mm/yr in the Kyoga sub-basin in central Uganda. In the Ethiopian Highlands, where there is an extremely complex hydrogeological setting, and intricate interaction between recharge and discharge occurring at local, sub-regional, and regional scales, recharge ranges from below 50 mm/yr in Precambrian basement rock aquifers to well over 300 mm/yr in the highly permeable volcanic sedimentary aquifers.
The Nubian sandstone aquifer system has fossil water and very low modern-day recharge rates, partly due to the long travel time to reach the deep aquifer. The aquifer is recharged by Nile water seepage in a few areas, by precipitation in some mountain regions, and by groundwater influx from the Blue Nile/Main Nile Rift system. Groundwater infiltration by the above mechanisms is small compared to the natural groundwater flow in the aquifer (estimated to be in the order of 109 m3 per year) that results from discharge in depressions, evaporation in areas where the groundwater table is close to the earth’s surface, and leakage into confining beds.
The Moghra aquifer in Egypt has a mixture of fossil and renewable water: recharge of the aquifer occurs by upward leakage from the underlying Nubian sandstone aquifer and some rainfall input. The unconsolidated sedimentary aquifers in the proximity of the Nile River and Delta in Egypt receive high recharge in excess of 400 mm/yr from the base of the river and irrigation seepage.

44 STATE OF THE RIVER NILE BASIN 2012
Groundwater useGroundwater is widely used across the basin for domestic water supply (for drinking and other domestic uses) for both rural and urban communities. With the exception of Egypt, groundwater from dug wells, springs, and boreholes is the main source of drinking water for rural communities in the basin. In the Nile Equatorial Lakes Plateau and the Ethiopian Highlands, about 70 per cent of the rural population is dependent on groundwater. This proportion rises to about 80 per cent in The Sudan and close to 100 per cent in South Sudan. In Egypt, groundwater accounts for only about 13 per cent of total annual water requirements. The proportion of the population dependent on groundwater for domestic use in Egypt is not so high because most houses in urban areas and new settlements are connected to conventional piped water supplies based on surface water. The population in small rural settlements in Egypt largely uses water from small waterways to meet domestic water needs.
In addition to domestic use, groundwater in the Nile region is also used for agricultural irrigation, livestock watering, and industrial processing. Groundwater use for agricultural irrigation is most widespread in the lower parts of the basin (The Sudan and Egypt), and low in the headwater regions of the basin due to sufficient rainfall and availability of large surface-water bodies. Conjunctive use of surface and groundwater is widely practised in the Nile Valley and Nile Delta, where farmers abstract water from shallow, unconsolidated aquifers during periods of peak irrigation demand and in lands located on the margins of the irrigation command areas. Groundwater use for industrial processing is most intensive in Egypt, particularly in Cairo and the Nile Delta.
GROUNDWATER POTENTIAL OF NILE BASIN COUNTRIES
Country Groundwater km3/year
Renewable groundwater
km3/year
Non-renewable groundwater
km3/year
Groundwater annual extraction km3/year
Burundi 0.40 0.18 0.22 0.03
DRCongo 51.9 46.75 5.15 0.21
Egypt 4.00 0.09 3.91 0.90
Ethiopia 7.23 5.50 1.73 0.40
Kenya 2.34 1.01 1.33 0.42
Rwanda 0.40 0.32 0.09 0.04
Sudan 6.40 1.75 4.65 0.50
Tanzania 5.23 4.00 1.23 0.38
Uganda 2.12 1.95 0.17 0.18
(Sourceofdata:Hassan,Attia&El-Attfy2004)
Water resources
45
WATER qUALITYSurface water The quality of surface waters in the Nile Basin is influenced by both natural and human factors, with human influences having far greater impact. Although the chemical quality of the water is good, its physical and bacteriological quality is generally poor.
The headwater regions of the basin are densely populated and intensively used for rainfed agriculture. During the rainy season, the combination of hilly terrain, torrential rains, human-induced land-use change, and poor agricultural practices produce widespread soil erosion, leading to the problems of colour, turbidity, and suspended solids in the headwater rivers. Concentrations of suspended solids range from 1 to 1,500 mg/L in the Equatorial Lakes region, with the heaviest silt loads being carried by the Kagera river, and the rivers in western Kenya such as the Yala and Nzoia. The Eastern Nile sub-basin rivers have much higher sediment loads, sometimes approaching 5,800 mg/L in the rainy season. The dry season in the headwater regions is associated with low-flow conditions and clearer waters.
Colour ranges from 20 to 1,250 TCU in the Equatorial Lakes region and 0 to 350 TCU in the Eastern Nile headwater rivers. The Equatorial Lakes region has areas of dense forest and large tropical swamps that add a brown hue to the Nile waters from decomposing vegetable matter. However, the specific dissolved organic carbon output of the Nile, estimated at 0.089 t/km2/yr, is the lowest of all major world rivers. This is due, in part, to the low carbon content of soils in the basin and a large area of desert within the basin with little or no biomass production.
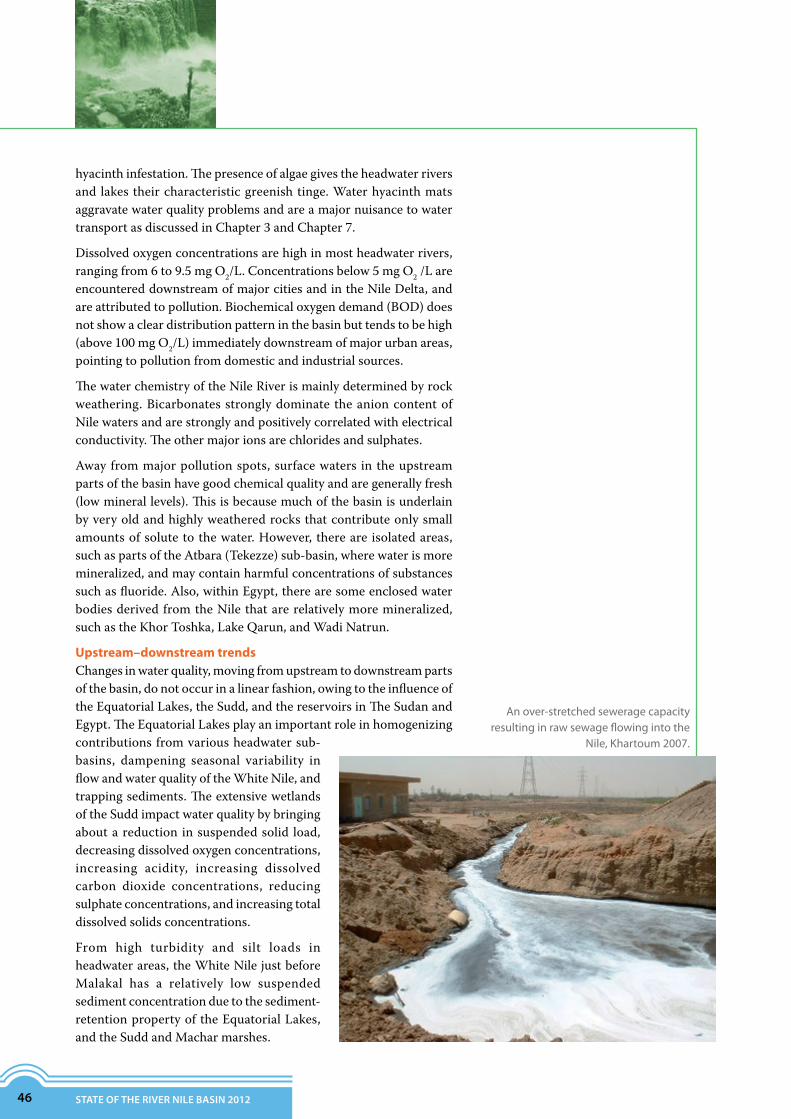
Across the basin, environmental sanitation is poor, resulting in bacteriological contamination and nutrient enrichment of the Nile waters. Because of this poor bacteriological quality, most Nile waters are not fit for consumption in the raw form. Concentrations of faecal coliform bacteria are above 50 cfu/100 mL in nearly all surface waters in the basin. During the rainy season, this value may rise to above 1,000 cfu/100 mL. Total coliform concentrations are much higher, averaging 500 cfu/100 mL in most upstream rivers, and reaching levels of 150,000 cfu/100 mL in heavily polluted sections such as the Rosetta branch of the Nile Delta.
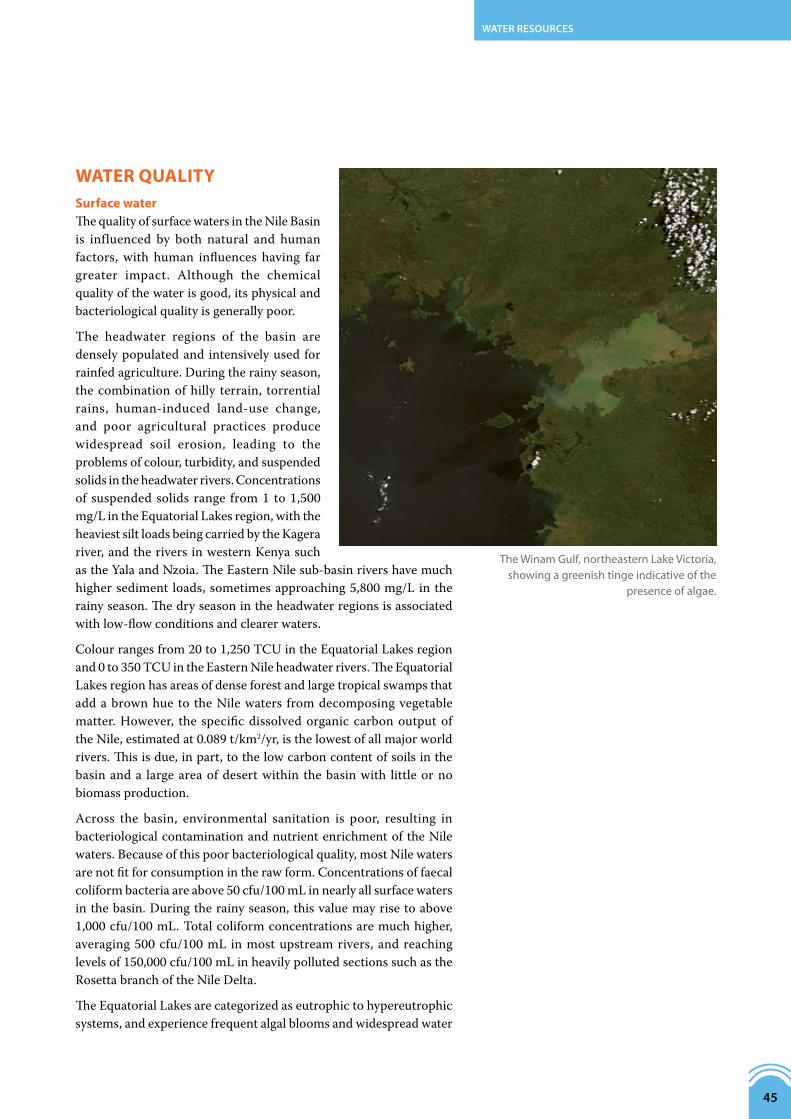
The Equatorial Lakes are categorized as eutrophic to hypereutrophic systems, and experience frequent algal blooms and widespread water
TheWinamGulf,northeasternLakeVictoria,showingagreenishtingeindicativeofthe
presenceofalgae.
46 STATE OF THE RIVER NILE BASIN 2012
hyacinth infestation. The presence of algae gives the headwater rivers and lakes their characteristic greenish tinge. Water hyacinth mats aggravate water quality problems and are a major nuisance to water transport as discussed in Chapter 3 and Chapter 7.
Dissolved oxygen concentrations are high in most headwater rivers, ranging from 6 to 9.5 mg O2/L. Concentrations below 5 mg O2 /L are encountered downstream of major cities and in the Nile Delta, and are attributed to pollution. Biochemical oxygen demand (BOD) does not show a clear distribution pattern in the basin but tends to be high (above 100 mg O2/L) immediately downstream of major urban areas, pointing to pollution from domestic and industrial sources.
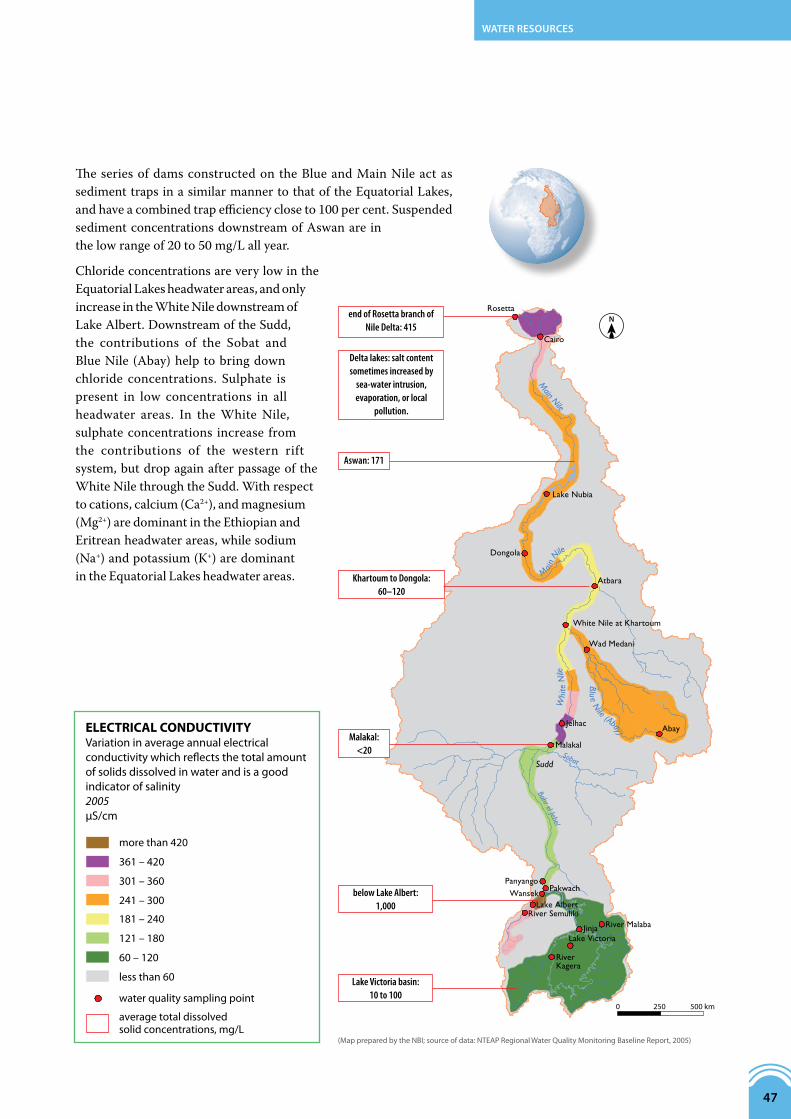
The water chemistry of the Nile River is mainly determined by rock weathering. Bicarbonates strongly dominate the anion content of Nile waters and are strongly and positively correlated with electrical conductivity. The other major ions are chlorides and sulphates.
Away from major pollution spots, surface waters in the upstream parts of the basin have good chemical quality and are generally fresh (low mineral levels). This is because much of the basin is underlain by very old and highly weathered rocks that contribute only small amounts of solute to the water. However, there are isolated areas, such as parts of the Atbara (Tekezze) sub-basin, where water is more mineralized, and may contain harmful concentrations of substances such as fluoride. Also, within Egypt, there are some enclosed water bodies derived from the Nile that are relatively more mineralized, such as the Khor Toshka, Lake Qarun, and Wadi Natrun.
Upstream–downstream trendsChanges in water quality, moving from upstream to downstream parts of the basin, do not occur in a linear fashion, owing to the influence of the Equatorial Lakes, the Sudd, and the reservoirs in The Sudan and Egypt. The Equatorial Lakes play an important role in homogenizing contributions from various headwater sub-basins, dampening seasonal variability in flow and water quality of the White Nile, and trapping sediments. The extensive wetlands of the Sudd impact water quality by bringing about a reduction in suspended solid load, decreasing dissolved oxygen concentrations, increasing acidity, increasing dissolved carbon dioxide concentrations, reducing sulphate concentrations, and increasing total dissolved solids concentrations.
From high turbidity and silt loads in headwater areas, the White Nile just before Malakal has a relatively low suspended sediment concentration due to the sediment-retention property of the Equatorial Lakes, and the Sudd and Machar marshes.
Anover-stretchedseweragecapacityresultinginrawsewageflowingintothe
Nile,Khartoum2007.
Whi
te N
ile
Main
Nile
!
!
!
!
!
!
!
!
!
!
!!!
!!
!
!
!!
Cairo
Rosetta
Lake Nubia
Dongola
Atbara
White Nile at Khartoum
Wad Medani
AbayJelhac
Malakal
Pakwach
Lake AlbertRiver Semuliki
River MalabaJinjaLake Victoria
River Kagera
PanyangoWansek
ELECTRICAL CONDUCTIVITYVariation in average annual electrical conductivity which re ects the total amount of solids dissolved in water and is a good indicator of salinity2005μS/cm
more than 420
water quality sampling point
361 – 420
301 – 360
241 – 300
181 – 240
121 – 180
60 – 120
less than 60
average total dissolved solid concentrations, mg/L
(Map prepared by the NBI; source of data: NTEAP Regional Water Quality Monitoring Baseline Report, 2005)
Lake Victoria basin:10 to 100
below Lake Albert: 1,000
Khartoum to Dongola: 60–120
Delta lakes: salt content sometimes increased by
sea-water intrusion, evaporation, or local
pollution.
end of Rosetta branch of Nile Delta: 415
Malakal: <20
Aswan: 171
!
Blue Nile (Abay)
Main Nile
N
0 250 500 km
Bahr el Jebel
SuddSobat
Water resources
47
The series of dams constructed on the Blue and Main Nile act as sediment traps in a similar manner to that of the Equatorial Lakes, and have a combined trap efficiency close to 100 per cent. Suspended sediment concentrations downstream of Aswan are in the low range of 20 to 50 mg/L all year.
Chloride concentrations are very low in the Equatorial Lakes headwater areas, and only increase in the White Nile downstream of Lake Albert. Downstream of the Sudd, the contributions of the Sobat and Blue Nile (Abay) help to bring down chloride concentrations. Sulphate is present in low concentrations in all headwater areas. In the White Nile, sulphate concentrations increase from the contributions of the western rift system, but drop again after passage of the White Nile through the Sudd. With respect to cations, calcium (Ca2+), and magnesium (Mg2+) are dominant in the Ethiopian and Eritrean headwater areas, while sodium (Na+) and potassium (K+) are dominant in the Equatorial Lakes headwater areas.
!
!
!
!
!
!
!!
!
Main Nile
Main N
ile
Blue Nile (Abay)
Whi
te N
ile
LakeVictoria
Re d S e a
THE SUDAN
KENYA
TANZANIA
DR CONGO
RWANDA
BURUNDI
EGYPT
ERITREA
UGANDA
ETHIOPIASOUTH SUDAN
Cairo
AsmaraKhartoum
Addis Ababa
Nairobi
Bujumbura
Juba
Kampala
Kigali
N
SLOPES IN THE NILE BASINDegrees
0° – 0.5°
0.5° – 1°
1° – 3°
3° – 6°
6° – 9°
9° – 12°
12° – 15°
15° – 21°
21° – 38°
(Map prepared by the NBI; source of data: SRTM DEM)
0 500 km
The NBI is not an authority on
international boundaries.
Sudd
! Aswan
Bahr el Jebel
Atbara (Tekezze)
48 STATE OF THE RIVER NILE BASIN 2012
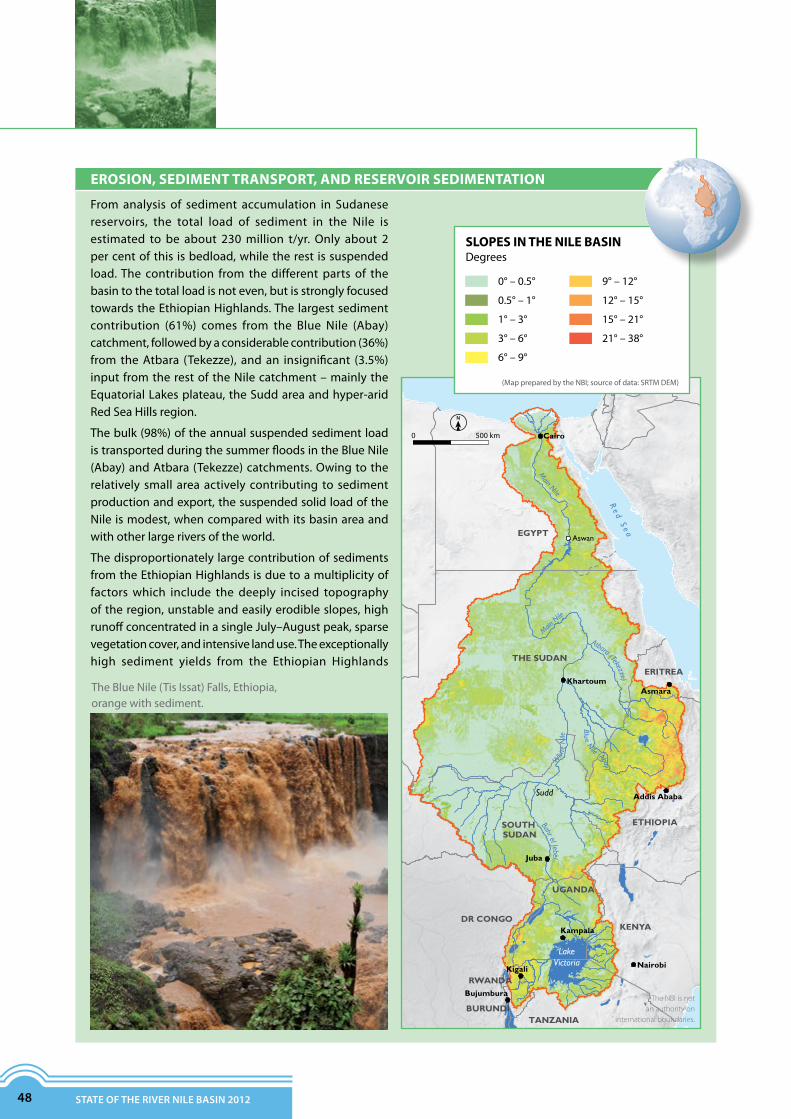
From analysis of sediment accumulation in Sudanesereservoirs, the total load of sediment in the Nile isestimated to be about 230million t/yr. Only about 2percentofthis isbedload,whiletherest issuspendedload.The contribution from thedifferentparts of thebasintothetotalloadisnoteven,butisstronglyfocusedtowardstheEthiopianHighlands.Thelargestsedimentcontribution (61%) comes from the Blue Nile (Abay)catchment,followedbyaconsiderablecontribution(36%)from theAtbara (Tekezze), andan insignificant (3.5%)inputfromtherestoftheNilecatchment–mainlytheEquatorialLakesplateau,theSuddareaandhyper-aridRedSeaHillsregion.
Thebulk(98%)oftheannualsuspendedsedimentloadistransportedduringthesummerfloodsintheBlueNile(Abay)andAtbara(Tekezze)catchments.Owingtotherelatively small areaactivelycontributing to sedimentproductionandexport,thesuspendedsolidloadoftheNileismodest,whencomparedwithitsbasinareaandwithotherlargeriversoftheworld.
ThedisproportionatelylargecontributionofsedimentsfromtheEthiopianHighlandsisduetoamultiplicityoffactorswhich include the deeply incised topographyoftheregion,unstableandeasilyerodibleslopes,highrunoffconcentratedinasingleJuly–Augustpeak,sparsevegetationcover,andintensivelanduse.Theexceptionallyhigh sediment yields from the Ethiopian Highlands
EROSION, SEDIMENT TRANSPORT, AND RESERVOIR SEDIMENTATION
TheBlueNile(TisIssat)Falls,Ethiopia,orangewithsediment.

Water resources
49
partlyreflectacceleratedsoilerosioncausedbyland-usechangesoverseveralcenturies.
ErosionandlanddegradationarealsooccurringintheEquatorial Lakes Plateau, but the specific yieldof thesub-basinislowbecauseitisunderlainbyresistant,less-erodiblerocks.TheEquatorialLakesregionalsohasamoreeffectivecoverofprotectivevegetation,flatter(plateau)topography,more evenly distributed rainfall over theyear(twinpeaksinMarch–MayandSeptember–October),andstrongerchemicalweathering.Furthermore,amajorproportionofthesedimentproducedintheWhiteNileheadwatersistrappedintheEquatorialLakes,retainedintheSuddmarshes,ordepositedalongtherivercoursedownstreamoftheSudd,wheretheNileflowssluggishlyoveralow-gradientcourse.
Forthousandsofyears,anduntiltheclosureoftheAswanHighDamin1964,thefertilevolcanicmudscarriedbythesummerfloodsoftheNilewereacriticalfeatureofthe farming system in Egypt, and brought prosperitytoancientEgyptiandynasties. SandsandmudofNileprovenancehavebeen identified in theNileconeandalongthemarginsofIsrael,whilefiner-grainedclayshavebeentracedasfarnorthasTurkey.Overthelast100years,damshavebeenbuiltinEgyptandTheSudanforfloodregulation,water supply,andhydropowergeneration.These dams have virtually halted the transport ofsediment to the sea, and caused a dramatic shift insedimentdynamicsandgeomorphologicalprocessesin
theEgyptianNile.FluvialerosionoftheriverchannelanddirectinputsofaeoliandustaretodaythemainsourcesofsuspendedsedimentsdownstreamofAswan.RatherthanaccumulatingwithintheNileDeltaandfan,hugevolumesofsedimentnowaccumulate inreservoirs,resultinginrapidlossofstoragecapacityononeside,andravagingerosionofthedeltaiccuspsontheother.
The dams constructed in the basin to deal with theproblemofseasonalandinterannualflowvariabilityintheNileincludetheAswanHighDamandMeroweDamontheMainNile,theJebelAuliaontheWhiteNile,theRoseiresDamon theBlueNile (Abay), and theKhasmelGirbaontheAtbara(Tekezze).Thesedamsprovidedessential storage to serve theever-growingandyear-round irrigation demands in Egypt and The Sudan.However,therapidsedimentationinthereservoirshasaffectedtheireffectivenessandshortenedtheirlifespan.ThestoragecapacityoftheRoseiresandKhasmelGirbareservoirs,forexample,areestimatedtohavefallenby60percentand40percentrespectivelyoverthefirst30yearsofoperation.Desiltingofthesedamsisnoteconomicallyviable,althoughraisingtheirheightmaybeashort-termoption.
Thelastingsolutiontoreservoirsedimentationwillhaveto come from introducing watershed managementmeasures in the upland parts of the basin to reducesediment production. This is already being done, asdiscussedunderChapter3.
RaisingtheheightoftheRoseiresDam.
(Source of data: AQUASTAT 2012)
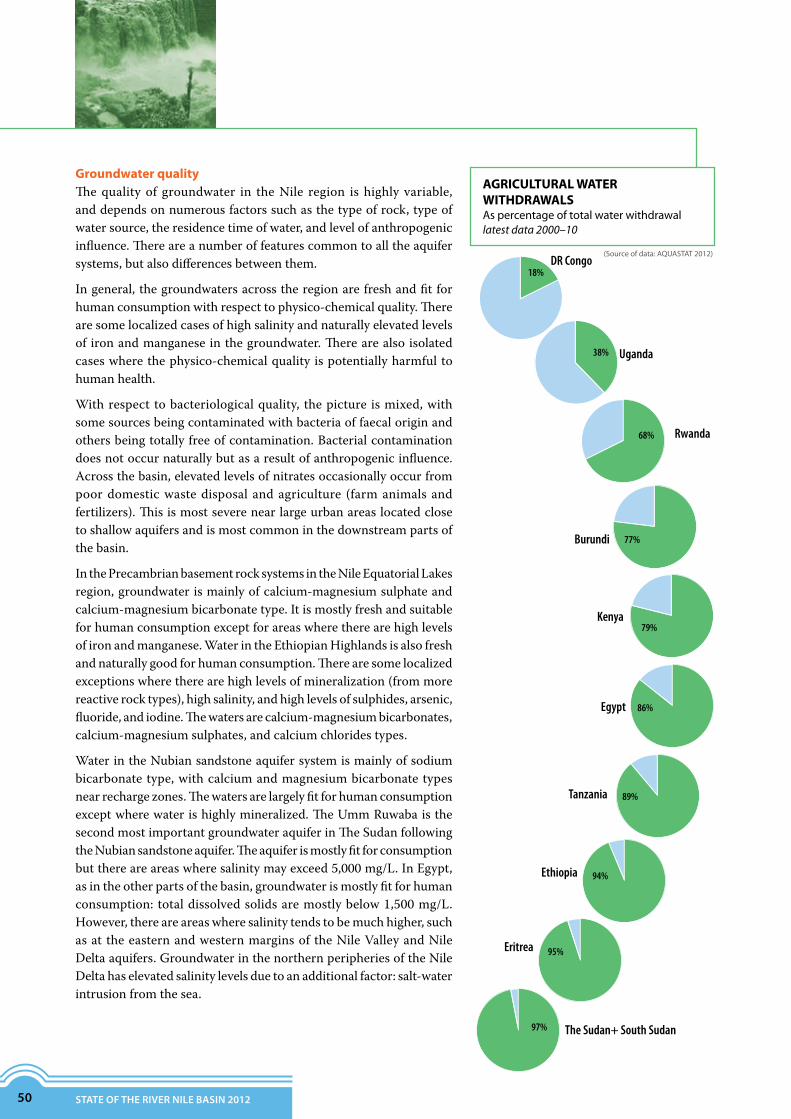
AGRICULTURAL WATER WITHDRAWALS As percentage of total water withdrawallatest data 2000–10
DR Congo18%
38%
68%
77%
79%
86%
89%
94%
95%
97%
Uganda
Rwanda
Burundi
Kenya
Egypt
Tanzania
Ethiopia
The Sudan+ South Sudan
Eritrea
50 STATE OF THE RIVER NILE BASIN 2012
Groundwater quality The quality of groundwater in the Nile region is highly variable, and depends on numerous factors such as the type of rock, type of water source, the residence time of water, and level of anthropogenic influence. There are a number of features common to all the aquifer systems, but also differences between them.
In general, the groundwaters across the region are fresh and fit for human consumption with respect to physico-chemical quality. There are some localized cases of high salinity and naturally elevated levels of iron and manganese in the groundwater. There are also isolated cases where the physico-chemical quality is potentially harmful to human health.
With respect to bacteriological quality, the picture is mixed, with some sources being contaminated with bacteria of faecal origin and others being totally free of contamination. Bacterial contamination does not occur naturally but as a result of anthropogenic influence. Across the basin, elevated levels of nitrates occasionally occur from poor domestic waste disposal and agriculture (farm animals and fertilizers). This is most severe near large urban areas located close to shallow aquifers and is most common in the downstream parts of the basin.
In the Precambrian basement rock systems in the Nile Equatorial Lakes region, groundwater is mainly of calcium-magnesium sulphate and calcium-magnesium bicarbonate type. It is mostly fresh and suitable for human consumption except for areas where there are high levels of iron and manganese. Water in the Ethiopian Highlands is also fresh and naturally good for human consumption. There are some localized exceptions where there are high levels of mineralization (from more reactive rock types), high salinity, and high levels of sulphides, arsenic, fluoride, and iodine. The waters are calcium-magnesium bicarbonates, calcium-magnesium sulphates, and calcium chlorides types.
Water in the Nubian sandstone aquifer system is mainly of sodium bicarbonate type, with calcium and magnesium bicarbonate types near recharge zones. The waters are largely fit for human consumption except where water is highly mineralized. The Umm Ruwaba is the second most important groundwater aquifer in The Sudan following the Nubian sandstone aquifer. The aquifer is mostly fit for consumption but there are areas where salinity may exceed 5,000 mg/L. In Egypt, as in the other parts of the basin, groundwater is mostly fit for human consumption: total dissolved solids are mostly below 1,500 mg/L. However, there are areas where salinity tends to be much higher, such as at the eastern and western margins of the Nile Valley and Nile Delta aquifers. Groundwater in the northern peripheries of the Nile Delta has elevated salinity levels due to an additional factor: salt-water intrusion from the sea.
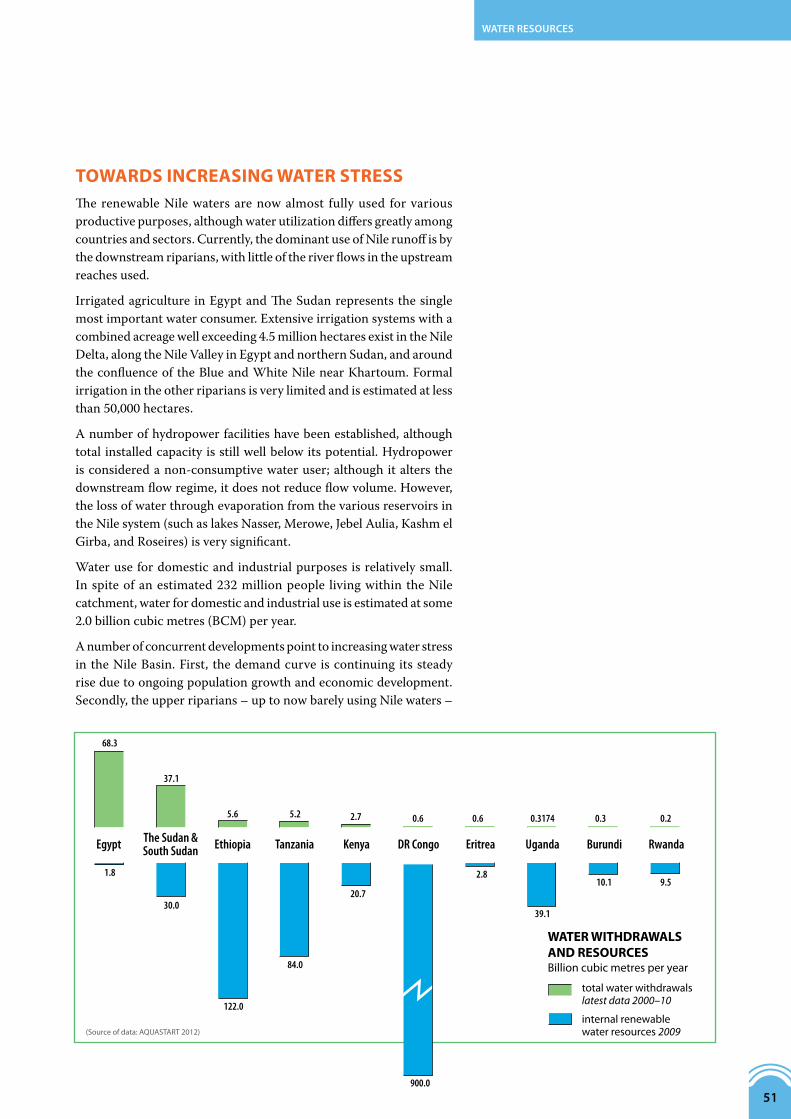
EritreaDR CongoEthiopiaThe Sudan &South Sudan BurundiUgandaKenyaTanzania RwandaEgypt
(Source of data: AQUASTART 2012)
WATER WITHDRAWALS AND RESOURCESBillion cubic metres per year
total water withdrawals latest data 2000–10
internal renewable water resources 2009
1.8
30.0
122.0
84.0
20.7
2.8
39.1
10.1 9.5
0.20.30.31740.60.62.75.25.6
900.0
37.1
68.3
Water resources
51
TOWARDS INCREASING WATER STRESSThe renewable Nile waters are now almost fully used for various productive purposes, although water utilization differs greatly among countries and sectors. Currently, the dominant use of Nile runoff is by the downstream riparians, with little of the river flows in the upstream reaches used.
Irrigated agriculture in Egypt and The Sudan represents the single most important water consumer. Extensive irrigation systems with a combined acreage well exceeding 4.5 million hectares exist in the Nile Delta, along the Nile Valley in Egypt and northern Sudan, and around the confluence of the Blue and White Nile near Khartoum. Formal irrigation in the other riparians is very limited and is estimated at less than 50,000 hectares.
A number of hydropower facilities have been established, although total installed capacity is still well below its potential. Hydropower is considered a non-consumptive water user; although it alters the downstream flow regime, it does not reduce flow volume. However, the loss of water through evaporation from the various reservoirs in the Nile system (such as lakes Nasser, Merowe, Jebel Aulia, Kashm el Girba, and Roseires) is very significant.
Water use for domestic and industrial purposes is relatively small. In spite of an estimated 232 million people living within the Nile catchment, water for domestic and industrial use is estimated at some 2.0 billion cubic metres (BCM) per year.
A number of concurrent developments point to increasing water stress in the Nile Basin. First, the demand curve is continuing its steady rise due to ongoing population growth and economic development. Secondly, the upper riparians – up to now barely using Nile waters –
52 STATE OF THE RIVER NILE BASIN 2012
are planning investments in the water sector, which will involve using some of the river’s renewable discharge, thereby reducing downstream flows. Lastly, while some potential exists to increase renewable water resources by draining wetlands, increasing abstractions upstream of the White Nile floodplains, or by reducing reservoir evaporation, the scope and feasibility of such projects is limited by the serious environmental and socio-political consequences associated with their implementation. Hence, for all practical purposes, the Nile water supply will remain more or less constant.
In view of the finite nature of the water resources in the basin, reconciling the diverging interests among the various riparian countries and stakeholders is a critical task for Nile managers.
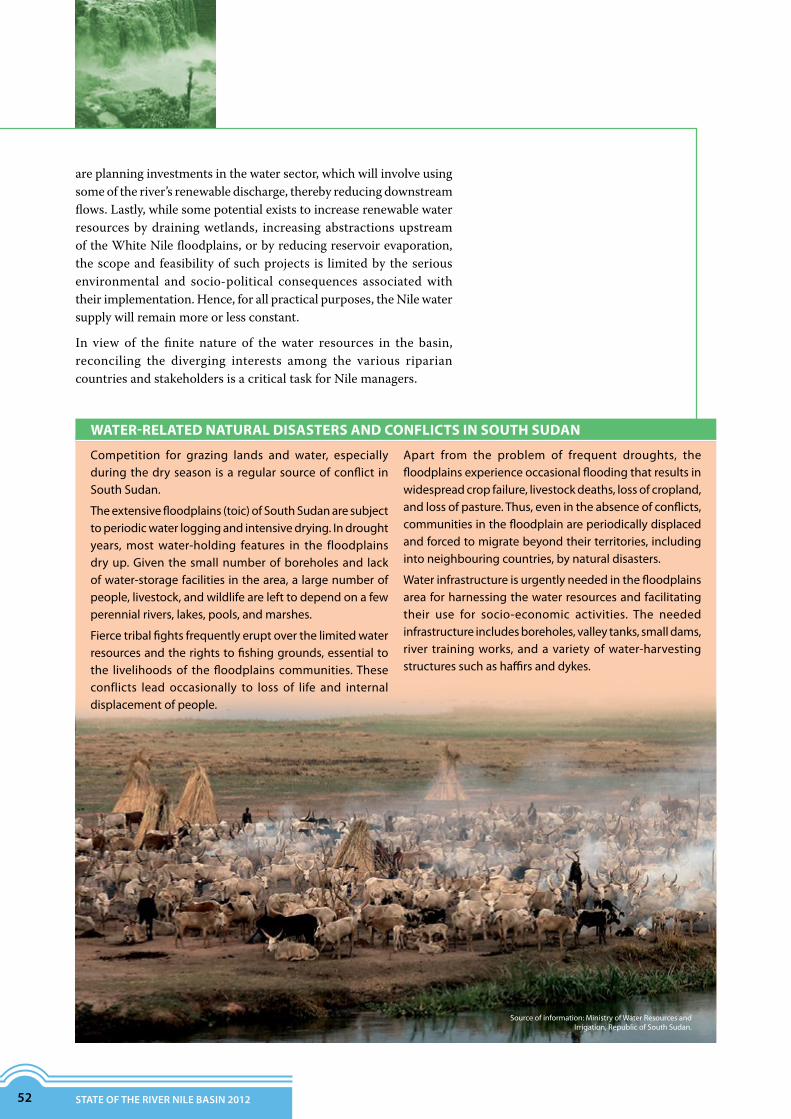
Sourceofinformation:MinistryofWaterResourcesandIrrigation,RepublicofSouthSudan.
Competition for grazing lands and water, especiallyduringthedryseason isaregularsourceofconflict inSouthSudan.
Theextensivefloodplains(toic)ofSouthSudanaresubjecttoperiodicwaterloggingandintensivedrying.Indroughtyears,mostwater-holding features in the floodplainsdryup.Giventhesmallnumberofboreholesand lackofwater-storagefacilitiesinthearea,alargenumberofpeople,livestock,andwildlifearelefttodependonafewperennialrivers,lakes,pools,andmarshes.
Fiercetribalfightsfrequentlyeruptoverthelimitedwaterresourcesandtherightstofishinggrounds,essentialtothe livelihoodsof thefloodplains communities.Theseconflicts lead occasionally to loss of life and internaldisplacementofpeople.
Apart from the problem of frequent droughts, thefloodplainsexperienceoccasionalfloodingthatresultsinwidespreadcropfailure,livestockdeaths,lossofcropland,andlossofpasture.Thus,evenintheabsenceofconflicts,communitiesinthefloodplainareperiodicallydisplacedandforcedtomigratebeyondtheirterritories,includingintoneighbouringcountries,bynaturaldisasters.
Waterinfrastructureisurgentlyneededinthefloodplainsareaforharnessingthewaterresourcesandfacilitatingtheir use for socio-economic activities. The neededinfrastructureincludesboreholes,valleytanks,smalldams,river trainingworks,andavarietyofwater-harvestingstructuressuchashaffirsanddykes.
WATER-RELATED NATURAL DISASTERS AND CONFLICTS IN SOUTH SUDAN

Water resources
53
TOWARDS IMPROVED WATER USE EFFICIENCYChallenges related to surface water managementThere are several challenges related to surface water management in the Nile Basin, the main ones being inadequate water infrastructure, weak surface-water monitoring networks, weak human capacity, and weak control of pollution activities. Egypt is an exception to the general picture painted above. Egypt has a diversity of water infrastructure, small and large, a dense and fully functional network of surface-water monitoring stations, a large force of water professionals, and a strong regulatory service. Institutional mechanisms for cooperative management of the common Nile water resources by riparian countries are still under development under the NBI.
Challenges related to groundwater managementThe cross-cutting challenge in the region with respect to groundwater management is weak institutional and human capacity. With the exception of Egypt, and to a lesser extent The Sudan, information on groundwater is scanty, and monitoring networks are hardly in place. Groundwater abstraction is not properly controlled, which in some cases leads to unsustainable exploitation of groundwater. The most serious case of unsustainable use relates to the heavy mining of the Nubian sandstone aquifer by the countries that share the resource. Much remains to be done with respect to improving the understanding of the occurrence and distribution of groundwater, including surface water–groundwater interactions.
The major aquifers of the Nile region do not follow national boundaries but there is as yet no clear mechanism for co-riparian states to cooperate in joint monitoring, development, and management of the shared aquifers.
What NBI is doingThe NBI has initiated a number of projects to strengthen regional water resources planning and management, and to increase the efficient use of the water resources in the basin.
The Water Resources Planning and Management (WRPM) project has developed the Nile Decision Support System (Nile DSS), which is a computer-based platform for planning and information management. The tool enables the riparian states to assess the trade-offs and consequences of alternative basin-wide water-resources development options. The Nile DSS further provides a framework for data and knowledge sharing amongst the Nile riparians.
The Eastern Nile Technical Regional Office (ENTRO) located in Addis Ababa is implementing the Eastern Nile Flood Preparedness and Early Warning Project. This project aims to improve the regional and national capacity in Ethiopia, South Sudan, and The Sudan to forecast floods in the Eastern Nile basin and mitigate possible flood damage. The project also serves to strengthen flood-risk management
The NBI has
initiated projects
to strengthen management
and improve efficient use
of water resources.
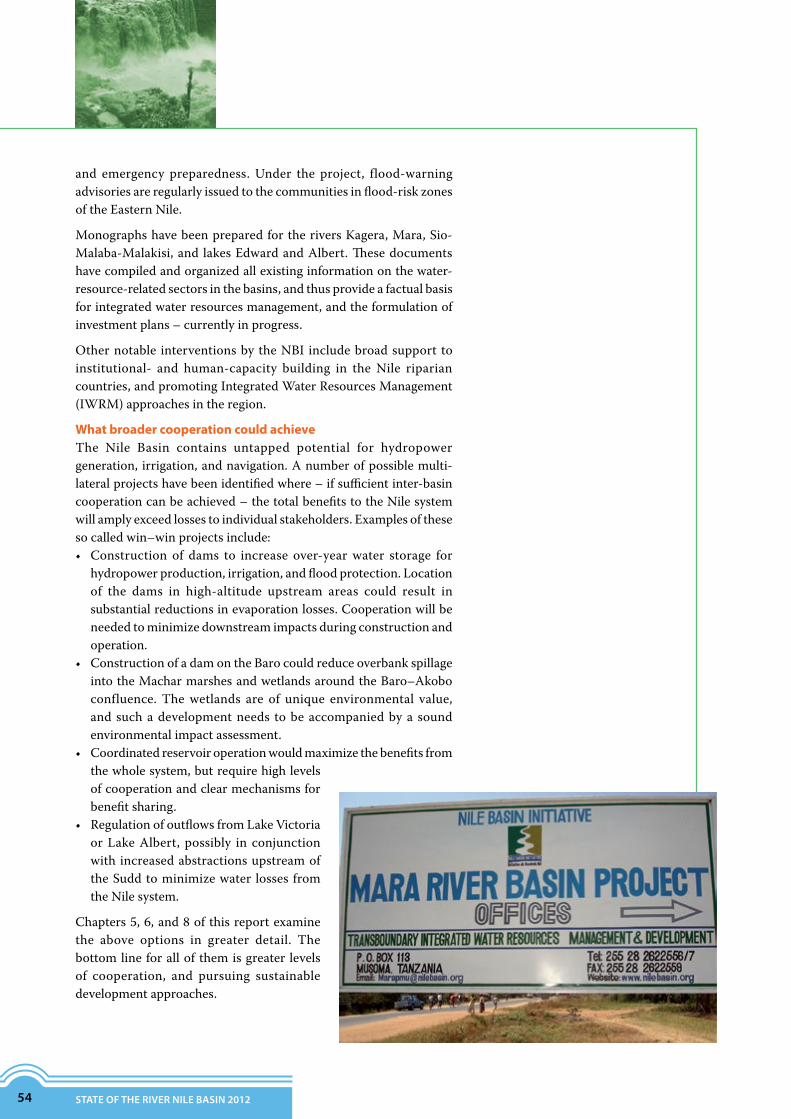
54 STATE OF THE RIVER NILE BASIN 2012
and emergency preparedness. Under the project, flood-warning advisories are regularly issued to the communities in flood-risk zones of the Eastern Nile.
Monographs have been prepared for the rivers Kagera, Mara, Sio-Malaba-Malakisi, and lakes Edward and Albert. These documents have compiled and organized all existing information on the water-resource-related sectors in the basins, and thus provide a factual basis for integrated water resources management, and the formulation of investment plans – currently in progress.
Other notable interventions by the NBI include broad support to institutional- and human-capacity building in the Nile riparian countries, and promoting Integrated Water Resources Management (IWRM) approaches in the region.
What broader cooperation could achieveThe Nile Basin contains untapped potential for hydropower generation, irrigation, and navigation. A number of possible multi-lateral projects have been identified where – if sufficient inter-basin cooperation can be achieved – the total benefits to the Nile system will amply exceed losses to individual stakeholders. Examples of these so called win–win projects include:• Construction of dams to increase over-yearwater storage for
hydropower production, irrigation, and flood protection. Location of the dams in high-altitude upstream areas could result in substantial reductions in evaporation losses. Cooperation will be needed to minimize downstream impacts during construction and operation.
• ConstructionofadamontheBarocouldreduceoverbankspillageinto the Machar marshes and wetlands around the Baro–Akobo confluence. The wetlands are of unique environmental value, and such a development needs to be accompanied by a sound environmental impact assessment.
• Coordinatedreservoiroperationwouldmaximizethebenefitsfromthe whole system, but require high levels of cooperation and clear mechanisms for benefit sharing.
• RegulationofoutflowsfromLakeVictoriaor Lake Albert, possibly in conjunction with increased abstractions upstream of the Sudd to minimize water losses from the Nile system.
Chapters 5, 6, and 8 of this report examine the above options in greater detail. The bottom line for all of them is greater levels of cooperation, and pursuing sustainable development approaches.

Water resources
55
SUMMARY AND CONCLUSIONSThe Nile has a total length of 6,695 km, making it the world’s longest river. Its drainage area, at 3.1 million square kilometres, is one of the largest on the African continent. The Nile hydrology is characterized by uneven distribution of water resources and high climatic variability in space and time.
Despite the long length of the river and its expansive basin area, the flow in the Nile is a small fraction of the flow in other large rivers of the world, such as the Congo, Amazon, and Yangtze. This is partially explained by the low runoff coefficient of the Nile (below 5%) and the fact that about two-fifths of the basin area contributes little or no runoff as it is comprised of arid and hyper-arid drylands.
The Nile countries have substantial groundwater resources that occur in extensive regional aquifer systems. The aquifers have varying properties, with some, such as the Nubian sandstone aquifer system and Nile Valley sedimentary aquifer, having high yields.
The surface resources of the Nile are now almost all used up. Withdrawal of water from surface and groundwater resources is variable, with upstream riparian countries having lower withdrawals than downstream riparians. A high proportion of annual water withdrawals go to support agricultural use in the region. Rising population, increasing demand for food, and expanding urban areas, among other factors, are expected to escalate the strain on the Nile water resources.
There is need to increase capacity building interventions across the region that target the strengthening of the human resource base and institutional framework for integrated water resources management. Increased cooperation is needed amongst Nile riparian countries to, inter alia, jointly operate water-resource monitoring networks and decision-support tools that facilitate rational management and development of the common Nile surface and groundwater resources. The Nile riparian countries also need to consider a number of possible multi-purpose projects through which they could collaboratively increase efficiency of water use, and optimize and equitably share the benefits of the cooperative development of the Nile water resources.

56 STATE OF THE RIVER NILE BASIN 2012