the war on marijuana in black and white
DESCRIPTION
The ACLU's new report on the racial disparity of the war on pot.TRANSCRIPT

| 1June 2013
BILLIONS OF DOLLARS WASTED ON RACIALLY BIASED ARRESTS
THE WAR ON MARIJUANAIN BLACK AND WHITE

The War on Marijuana in Black and White
June 2013
American Civil Liberties Union125 Broad StreetNew York, NY 10004www.aclu.org

| 1
TABLE OF CONTENTS
EXECUTIVE SUMMARY . . . . . . . . . . . . . . . . . . . . . . . . . . . . . . . . . . . . . . . . . . . . . . . . . . . . . . . . 4
ACKNOWLEDGEMENTS . . . . . . . . . . . . . . . . . . . . . . . . . . . . . . . . . . . . . . . . . . . . . . . . . . . . . . . 6
I. INTRODUCTION . . . . . . . . . . . . . . . . . . . . . . . . . . . . . . . . . . . . . . . . . . . . . . . . . . . . . . . . . . . . 7
II. FINDINGS . . . . . . . . . . . . . . . . . . . . . . . . . . . . . . . . . . . . . . . . . . . . . . . . . . . . . . . . . . . . . . . . 14
Finding #1: Marijuana Possession Arrests Increased Between 2001-2010 . . . . . . . 14
Finding #2: Racial Disparities in Marijuana Possession Arrests Exist Throughout the Country . . . . . . . . . . . . . . . . . . . . . . . . . . . . . . . . . . . . . . . . 17
Finding #3: Racial Disparities in Marijuana Possession Arrests Increased Between 2001–2010 . . . . . . . . . . . . . . . . . . . . . . . . . . . . . . . . . . . . . . . . . . . . . . . . . . 20
Finding #4: Blacks and Whites Use Marijuana at Similar Rates . . . . . . . . . . . . . . . . 21
Finding #5: States Are Wasting Money on Marijuana Possession Arrests . . . . . . . 22
PROFILE: DEMARCUS SANDERS . . . . . . . . . . . . . . . . . . . . . . . . . . . . . . . . . . . . . . . . . . . . . . 24
PROFILE: ALFREDO CARRASQUILLO . . . . . . . . . . . . . . . . . . . . . . . . . . . . . . . . . . . . . . . . . . . 27
III. METHODOLOGY . . . . . . . . . . . . . . . . . . . . . . . . . . . . . . . . . . . . . . . . . . . . . . . . . . . . . . . . . . 29
A. Data . . . . . . . . . . . . . . . . . . . . . . . . . . . . . . . . . . . . . . . . . . . . . . . . . . . . . . . . . . . . . . . . . 30
i. Sources . . . . . . . . . . . . . . . . . . . . . . . . . . . . . . . . . . . . . . . . . . . . . . . . . . . . . . . . . . . . 30
ii. The Latino Data Problem . . . . . . . . . . . . . . . . . . . . . . . . . . . . . . . . . . . . . . . . . . . . . 32
iii. Counting and Classifying Marijuana Possession Arrests . . . . . . . . . . . . . . . . . 33
B. Coverage Ratios . . . . . . . . . . . . . . . . . . . . . . . . . . . . . . . . . . . . . . . . . . . . . . . . . . . . . . . 34
IV. MARIJUANA ARRESTS HAVE RISEN SIGNIFICANTLY BETWEEN 2001 AND 2010, AND THE RACIAL DISPARITIES OF THOSE ARRESTS HAVE INCREASED . . . . . . . . . 36
A. The Rise in Marijuana Arrests Between 2001 and 2010 . . . . . . . . . . . . . . . . . . . . 36
i. National Data . . . . . . . . . . . . . . . . . . . . . . . . . . . . . . . . . . . . . . . . . . . . . . . . . . . . . . . 36
2 | The War on Marijuana in Black and White
ii. State Data . . . . . . . . . . . . . . . . . . . . . . . . . . . . . . . . . . . . . . . . . . . . . . . . . . . . . . . . . 39
iii. County Data . . . . . . . . . . . . . . . . . . . . . . . . . . . . . . . . . . . . . . . . . . . . . . . . . . . . . . . 43
B. Significant Racial Disparities Exist in Marijuana Possession Arrests Across the Country . . . . . . . . . . . . . . . . . . . . . . . . . . . . . . . . . . . . . . . . . . . . . . . . . . . . . . . . . . . 47
i. National Data . . . . . . . . . . . . . . . . . . . . . . . . . . . . . . . . . . . . . . . . . . . . . . . . . . . . . . . 47
ii. State Data . . . . . . . . . . . . . . . . . . . . . . . . . . . . . . . . . . . . . . . . . . . . . . . . . . . . . . . . . 48
iii. County Data . . . . . . . . . . . . . . . . . . . . . . . . . . . . . . . . . . . . . . . . . . . . . . . . . . . . . . . 56
C. Blacks and Whites Use Marijuana at Similar Rates . . . . . . . . . . . . . . . . . . . . . . . . 66
V. FISCAL COST ANALYSIS . . . . . . . . . . . . . . . . . . . . . . . . . . . . . . . . . . . . . . . . . . . . . . . . . . . 68
A. Estimates . . . . . . . . . . . . . . . . . . . . . . . . . . . . . . . . . . . . . . . . . . . . . . . . . . . . . . . . . . . . 68
i. High Estimate . . . . . . . . . . . . . . . . . . . . . . . . . . . . . . . . . . . . . . . . . . . . . . . . . . . . . . . 68
ii. Low Estimate . . . . . . . . . . . . . . . . . . . . . . . . . . . . . . . . . . . . . . . . . . . . . . . . . . . . . . . 71
iii. Middle Estimate . . . . . . . . . . . . . . . . . . . . . . . . . . . . . . . . . . . . . . . . . . . . . . . . . . . . 75
B. Analysis . . . . . . . . . . . . . . . . . . . . . . . . . . . . . . . . . . . . . . . . . . . . . . . . . . . . . . . . . . . . . . 78
PROFILE: NICK SMITH . . . . . . . . . . . . . . . . . . . . . . . . . . . . . . . . . . . . . . . . . . . . . . . . . . . . . . . 80
PROFILE: MARISA GARCÍA . . . . . . . . . . . . . . . . . . . . . . . . . . . . . . . . . . . . . . . . . . . . . . . . . . . 82
VI. THE RISE IN MARIJUANA POSSESSION ARRESTS: WHAT CAUSED THE EXPLOSION? 85
A. The War on Drugs and the Shift from Rehabilitation to Punishment . . . . . . . . . 85
B. Broken Windows’ Broken Model . . . . . . . . . . . . . . . . . . . . . . . . . . . . . . . . . . . . . . . . 91
C. The Incentives Behind Making Marijuana Arrests . . . . . . . . . . . . . . . . . . . . . . . . . 98
i. COMPSTAT Performance Measures: Targeting Communities, Rewarding Arrests . . . . . . . . . . . . . . . . . . . . . . . . . . . . . . . . . . . . . . . . . . . . . . . . . . 98
ii. The Inclusion of Marijuana Possession Arrests as a Performance Measure for Federal Funding . . . . . . . . . . . . . . . . . . . . . . . . . . . . . . . . . . . . . . . . . . . . . . . 100
PROFILE: SAM COURT . . . . . . . . . . . . . . . . . . . . . . . . . . . . . . . . . . . . . . . . . . . . . . . . . . . . . 105
PROFILE: RODERICK BATTLE . . . . . . . . . . . . . . . . . . . . . . . . . . . . . . . . . . . . . . . . . . . . . . . . 108

| 3
VII. RECOMMENDATIONS . . . . . . . . . . . . . . . . . . . . . . . . . . . . . . . . . . . . . . . . . . . . . . . . . . . . 110
A. Marijuana Policy . . . . . . . . . . . . . . . . . . . . . . . . . . . . . . . . . . . . . . . . . . . . . . . . . . . . . . 110
i. Legalize Marijuana Use and Possession . . . . . . . . . . . . . . . . . . . . . . . . . . . . . . . 110
ii. Depenalize Marijuana Use and Possession . . . . . . . . . . . . . . . . . . . . . . . . . . . . 112
iii. Decriminalize Marijuana Use and Possession . . . . . . . . . . . . . . . . . . . . . . . . . 113
B. Policing . . . . . . . . . . . . . . . . . . . . . . . . . . . . . . . . . . . . . . . . . . . . . . . . . . . . . . . . . . . . . . 115
i. Police Departments Should Make Marijuana Possession Arrests a Lowest Enforcement Priority . . . . . . . . . . . . . . . . . . . . . . . . . . . . . . . . . . . . . . . . . . . . . . . . 115
ii. Police Departments Should End Racial Profiling . . . . . . . . . . . . . . . . . . . . . . . . 116
iii. Police Procedures Must Be Fair and Constitutional . . . . . . . . . . . . . . . . . . . . . 118
iv. Police Should Adopt, Whether Voluntarily or as Required by State Law, Model Consent Search Policies . . . . . . . . . . . . . . . . . . . . . . . . . . . . . . . . . . . . . . 118
v. Police Departments and the Federal Government Should Eliminate Policies That Incentivize Arrests for Minor Offenses . . . . . . . . . . . . . . . . . . . . . . . . . . . . 119
a. Police Departments Should Cease Using Raw Numbers of Stops, Citations, Summons, and Arrests as a Metric to Measure Their Productivity and Effectiveness in Serving Communities and Addressing Crime . . . . . . . . . . . . . . . . . . . . . . . . . . . . . . . . . . . . . . . . . . . 119
b. The Federal Government Should Not Include Marijuana Possession Arrests in its Performance Measures for Byrne Justice Assistance Grants . . . . . . . . . . . . . . . . . . . . . . . . . . . . . . . . . . . . . . . . . . . . . . . . . . . . . 120
vi. Police Should Increase Data Collection and Transparency Regarding Stop, Frisk, Search, and Arrest Practices . . . . . . . . . . . . . . . . . . . . 121
vii. External Oversight Agencies Should Conduct Regular Audits and Reviews of Police Departments and Practices . . . . . . . . . . . . . . . . . . . . . . . . . . . . . . . . . 122
VIII. CONCLUSION . . . . . . . . . . . . . . . . . . . . . . . . . . . . . . . . . . . . . . . . . . . . . . . . . . . . . . . . . . 123
APPENDIX A . . . . . . . . . . . . . . . . . . . . . . . . . . . . . . . . . . . . . . . . . . . . . . . . . . . . . . . . . . . . . . . 124
APPENDIX B . . . . . . . . . . . . . . . . . . . . . . . . . . . . . . . . . . . . . . . . . . . . . . . . . . . . . . . . . . . . . . . 133

4 | The War on Marijuana in Black and White
EXECUTIVE SUMMARY
This report is the first to examine marijuana possession arrest rates by race for all 50 states (and the District of Columbia) and their respective counties from 2001 to 2010. The report relies on the Federal Bureau of Investigation’s Uniform Crime Reporting Program and the United States Census’ annual county population estimates to document arrest rates by race per 100,000 for marijuana possession.
The report finds that between 2001 and 2010, there were over 8 million marijuana arrests in the United States, 88% of which were for possession. Marijuana arrests have increased between 2001 and 2010 and now account for over half (52%) of all drug arrests in the United States, and marijuana possession arrests account for nearly half (46%) of all drug arrests. In 2010, there was one marijuana arrest every 37 seconds, and states spent combined over $3.6 billion enforcing marijuana possession laws.
The report also finds that, on average, a Black person is 3.73 times more likely to be arrested for marijuana possession than a white person, even though Blacks and whites use marijuana at similar rates. Such racial disparities in marijuana possession arrests exist in all regions of the country, in counties large and small, urban and rural, wealthy and poor, and with large and small Black populations. Indeed, in over 96% of counties with more than 30,000 people in which at least 2% of the residents are Black, Blacks are arrested at higher rates than whites for marijuana possession.
The report concludes that the War on Marijuana, like the larger War on Drugs of which it is a part, is a failure. It has needlessly ensnared hundreds of thousands of people in the criminal justice system, had a staggeringly disproportionate impact on African-Americans, and comes at a tremendous human and financial cost. The price paid by those arrested and convicted of marijuana possession can be significant and linger for years, if not a lifetime. Arrests and convictions for possessing marijuana can negatively impact public housing and student financial aid eligibility, employment opportunities, child custody determinations, and immigration status. Further, the War on Marijuana
Marijuana arrests have increased between 2001 and 2010 and now account for over half (52%) of all drug arrests in the United States

| 5
has been a fiscal fiasco. The taxpayers’ dollars that law enforcement agencies waste enforcing marijuana possession laws could be better spent on addressing and solving serious crimes and working collaboratively with communities to build trust and increase public health and safety. Despite the fact that aggressive enforcement of marijuana laws has been an increasing priority of police departments across the country, and that states have spent billions of dollars on such enforcement, it has failed to diminish marijuana’s use or availability.
To repair this country’s wrecked War on Marijuana, the ACLU recommends that marijuana be legalized for persons 21 or older through a system of taxation, licensing, and regulation. Legalization is the smartest and surest way to end targeted enforcement of marijuana laws in communities of color, and, moreover, would eliminate the costs of such enforcement while generating revenue for cash-strapped states. States could then reinvest the money saved and generated into public schools and public health programs, including substance abuse treatment. If legalization is not possible, the ACLU recommends depenalizing marijuana use and possession for persons 21 or older by removing all attendant civil and criminal penalties, or, if depenalization is unobtainable, decriminalizing marijuana use and possession for adults and youth by classifying such activities as civil, not criminal, offenses.
The ACLU also recommends that until legalization or depenalization is achieved, law enforcement agencies and district attorney offices should deprioritize enforcement of marijuana possession laws. In addition, police should end racial profiling and unconstitutional stop, frisk, and search practices, and no longer measure success and productivity by the number of arrests they make. Further, states and the federal government should eliminate the financial incentives and rewards that enable and encourage law enforcement to make large numbers of arrests, including for low-level offenses such as marijuana possession.
In sum, it is time to end marijuana possession arrests.
Executive Summary

6 | The War on Marijuana in Black and White
ACKNOWLEDGMENTS
The report has been a project of the American Civil Liberties Union (ACLU). The primary authors are Ezekiel Edwards, director, Criminal Law Reform Project; Will Bunting, fiscal policy analyst; and Lynda Garcia, Soros Justice Fellow.
The authors thank Vanita Gupta, deputy legal director, ACLU, and director, Center for Justice, for her strategic guidance, edits, and assistance in overseeing production of the report and Nicole Kief, advocacy and policy strategist, ACLU, for her outreach and assistance to ACLU affiliates.
The authors also thank Allen Hopper at the ACLU of Northern California, Alison Holcomb at the ACLU of Washington, and Udi Ofer of the ACLU of New Jersey for their invaluable feedback; Julie Ebenstein and Benjamin Stevenson at the ACLU of Florida, and Michael Barnfield, legal consultant to the ACLU of Florida, for their assistance in obtaining arrest data from the state of Florida; Sarah LaPlante at the New York Civil Liberties Union for her assistance in obtaining data from the Criminal Court of the City of New York; and Rosalyn Overstreet-Gonzalez at the Public Defender Service for the District of Columbia for her assistance in obtaining data from the D.C. Metropolitan Police Department.
The authors would like to extend their deep gratitude and a special thanks to Professors Jon Gettman at Shenandoah University and Harry Levine at Queens College, City University of New York. Professor Gettman, who has researched and reported extensively on data related to marijuana arrests for over 12 years, was extremely generous in providing the ACLU with his data set for marijuana possession arrests from 2001 to 2010. This data set served as the foundation for this report. Professor Levine has long been one of the leading voices on marijuana arrests and their racial disparities. Indeed, previous reports on marijuana arrests in various cities and states by Professor Levine, his colleague Loren Siegel, and Professor Gettman provided indispensable models for this report.

| 7
I. INTRODUCTION
Over the past 40 years, the United States has fought a losing domestic drug war that has cost one trillion dollars, resulted in over 40 million arrests, consumed law enforcement resources, been a key contributor to jaw-dropping rates of incarceration, damaged countless lives, and had a disproportionately devastating impact on communities of color. The ferocity with which the United States has waged this war, which has included dramatic increases in the length of prison sentences, and has resulted in a 53% increase in drug arrests, a 188% increase in the number of people arrested for marijuana offenses, and a 52% increase in the number of people in state prisons for drug offenses, between 1990 and 2010.1 Indeed, the United States now has an unprecedented and unparalleled incarceration rate: while it accounts for 5% of the world’s population, it has 25% of the world’s prison population.2
Despite costing billions of dollars,3 the War on Drugs has polluted the nation’s social and public health while failing to have any marked effect on the use or availability of drugs.4 Indeed, the United States is the
1 See ALLEN J. BECK & PAIGE M. HARRISON, U.S, DEP’T OF JUST., BUREAU OF JUST. STATISTICS, PRISONERS IN 2000 1 & 12 (Aug. 2001), available at http://bjs.gov/content/pub/pdf/p00.pdf (reporting the state prison population at 708,370 in 1990 and that 22% of that population, or155,843 people, were incarcerated for drug offenses); PAUL GUERINO, PAIGE M. HARRISON & WILLIAM J. SABOL, U.S, DEP’T OF JUST., BUREAU OF JUST. STATISTICS, PRISONERS IN 2010 2 (Dec. 2011), available at http://bjs.gov/content/pub/pdf/p10.pdf (reporting the state prison population at237,000 in 2010).2 See JENIFER WARREN, ONE IN 100: BEHIND BARS IN AMERICA 2008, PEW CTR. ON THE STATES 35, tbl. A-7 (2008), available at http://www.pewstates.org/uploadedFiles/PCS_Assets/2008/one%20in%20100.pdf; see also Adam Liptak, U.S. Prison Population Dwarfs that of Other Nations, N.Y. TIMES, April 23, 2008, available at http://www.nytimes.com/2008/04/23/world/americas/23iht-23prison.12253738.html?pagewanted=all&_r=3&.3 The incarceration of drug users comes at a heavy price—the average annual operating cost per state inmate in 2010 was $28,323,or $77.60 per day. See TRACEY KYCKELHAHN, U.S. DEP’T OF JUST., BUREAU OF JUST. STATISTICS, STATE CORRECTIONS EXPENDITURES, FY 1982-2010 4 (2012),available at http://bjs.ojp.usdoj.gov/content/pub/pdf/scefy8210.pdf; see also CHRISTIAN HENRICHSON & RUTH DELANEY, VERA INST. OF JUST., THE
PRICE OF PRISONS: WHAT INCARCERATION COSTS TAXPAYERS 10 (2012), available at http://www.vera.org/pubs/price-prisons-what-incarceration-costs-taxpayers (follow “The Price of Prisons report” hyperlink) (reporting that it costs an average of $31,286 per year to incarceratean inmate based on additional cost drivers such as underfunded contributions to retiree health care for corrections employees, states’contributions to retiree health care on behalf of their corrections departments, employee benefits, such as health insurance, andhospital and other health care for the prison population).4 A World Health Organization survey of 17 countries in 2008, including the Netherlands and other countries with less stringentdrug laws, found that the United States has the highest level of illegal drug use in the world. See Louisa Degenhardt et al., Toward a Global View of Alcohol, Tobacco, Cannabis, and Cocaine Use: Findings from the WHO World Mental Health Surveys, 5 PLOS MEDICINE 1053,1061 & 1065 (2008) [hereinafter Toward a Global View], available at http://www.plosmedicine.org/article/info:doi/10.1371/journal.pmed.0050141 (follow “download” hyperlink). Americans report the highest level of cocaine and marijuana use — Americans were4 times more likely to have tried cocaine in their lifetime than the next closest country, the Netherlands, while 42.2% of Americansadmitted to having used marijuana.
Despite costing billions, the War on Drugs has polluted the nation’s social and public health and failed to curb the use or availability of drugs.
Introduction

8 | The War on Marijuana in Black and White
world’s largest consumer of illegal drugs.5 On the 40th anniversary of the War on Drugs, former President Jimmy Carter declared it a total failure, noting that global drug use for all drugs had increased in the years since the drug war started.6
The first half of the War on Drugs focused largely on relentless enforcement of heroin and crack cocaine laws in poor communities of color.7 But with the ebb of the crack epidemic in the late 1980s, law enforcement agencies began shifting to an easy target: marijuana. As a result, over the past 20 years police departments across the country have directed greater resources toward the enforcement of marijuana laws. Indeed, even as overall drug arrests started to decline around 2006, marijuana arrests continued to rise, and now make up over half of all drug arrests in the United States. In 2010, there were more than 20,000 people incarcerated on the sole charge of marijuana possession.8
Stated simply, marijuana has become the drug of choice for state and local police departments nationwide. Between 2001 and 2010, there were 8,244,943 marijuana arrests, of which 7,295,880, or 88%, were for marijuana possession. In 2010 alone, there were 889,133 marijuana arrests — 300,000 more than arrests for all violent crimes
5 U.S. SENATE CAUCUS ON INT’L NARCOTICS CONTROL, REDUCING THE U.S. DEMAND FOR ILLEGAL DRUGS 11 (2012), available at http://www.feinstein.senate.gov/public/index.cfm/files/serve/?File_id=81b53476-64a3-4088-9bae-254a84b95ddb (citing CTR. FOR BEHAVIORAL HEALTH STATISTICS & QUALITY, SUBSTANCE ABUSE AND MENTAL HEALTH SERVICES ADMINISTRATION (SAMHSA), U.S. DEP’T OF HEALTH & HUMAN SERVICES, RESULTS FROM THE 2010 NATIONAL SURVEY ON DRUG USE AND HEALTH (NSDUH): SUMMARY OF NATIONAL FINDINGS (Sept. 2011)) (“According to the National Survey on Drug Useand Health, in 2010, about 22.6 million Americans aged 12 and older were current (in the past month) illegal drug users, representing8.9 percent of the population. This represents the largest proportion in the past decade of people aged 12 and older identified as currentillegal drug users.”).6 Jimmy Carter, Op-Ed., Call Off the Global Drug War, N.Y. TIMES, June 16, 2011, available at http://www.nytimes.com/2011/06/17/opinion/17carter.html?_r=3&. Further evidence that the War on Drugs has been a global failure is a 2012 report by the GlobalCommission on Drug Policy that found that the “global war on drugs is driving the HIV/AIDS pandemic among people who use drugsand their sexual partners.” GLOBAL COMM’N ON DRUG POL’Y, THE WAR ON DRUGS AND HIV/AIDS: HOW THE CRIMINALIZATION OF DRUG USE FUELS THE
GLOBAL PANDEMIC 2 (2012), available at http://globalcommissionondrugs.org/wp-content/themes/gcdp_v1/pdf/GCDP_HIV-AIDS_2012_REFERENCE.pdf. The Commission points to research that shows that repressive drug law enforcement practices result in driving drugusers away “from public health services and into hidden environments where HIV risk becomes markedly elevated.” Id. Furthermore,the mass incarceration of nonviolent drug offenders increases HIV risk—in the United States as many as 25% of Americans infected withHIV may pass through correctional facilities annually, and higher rates of incarceration for African Americans may be one reason formarkedly higher HIV rates among African Americans. Id.7 Blacks have borne the disproportionate brunt of the broader War on Drugs. Although Blacks comprise only 13% of the generalpopulation, 33% of all drug arrests are of Blacks, and they are more likely to be incarcerated upon conviction for drug offenses.JAMIE FELLNER ET AL., HUMAN RIGHTS WATCH, DECADES OF DISPARITY: DRUG ARRESTS AND RACE IN THE UNITED STATES 4 & 16 (2009), available at http://www.hrw.org/sites/default/files/reports/us0309web_1.pdf. Blacks’ likelihood of being arrested for drugs at ages 17, 22, and 27 areapproximately 13%, 83%, and 235% greater than that of whites. See OJMARRH MITCHELL & MICHAEL S. CAUDY, EXAMINING RACIAL DISPARITIES IN
DRUG ARRESTS, JUST. Q., 1 (2013) [hereinafter MITCHELL & CAUDY]. While some have suggested that such disparities can be explained bydifferences in drug use, drug offending, or neighborhood residence, a recent study examining these severe racial disparities in drugarrests found that the disparities cannot be accounted for by differences in such factors. Id. Specifically, the study found that 87% ofBlack’s higher probability of drug arrests is in fact not attributable to differences in drug use, nondrug offending, or neighborhoodcontext, but instead due to racial bias in law enforcement. Id. at 20. These findings are consistent with previous research finding thatracial disparities in drug arrests are only partially explained by racial differences in drug offending. See KATHERINE BECKETT, ACLU DRUG
LAW REFORM PROJECT & THE DEFENDER ASS’N, RACE AND DRUG LAW ENFORCEMENT IN SEATTLE 3-4 (2008), available at http://www.aclu.org/files/assets/race20and20drug20law20enforcement20in20seattle_20081.pdf (finding that while the majority of those who use and deliver seriousdrugs in Seattle are white, the majority of those purposefully arrested for delivering serious drugs in Seattle are Black, and that thefocus on crack cocaine is the fundamental cause of such racial disparity and is not a function of race-neutral policy).8 See NAT’L CTR. ON ADDICTION & SUBSTANCE ABUSE, BEHIND BARS II: SUBSTANCE ABUSE AND AMERICA’S PRISON POPULATION 2, 14 (2010) [hereinafterBEHIND BARS II], available at http://www.casacolumbia.org/articlefiles/575-report2010behindbars2.pdf (reporting that there were 20,291people incarcerated for marijuana possession as their only offense).
| 9
combined — or one every 37 seconds. There were 140,000 more marijuana arrests in 2010 than in 2001, and 784,021 of them, or 88%, were for possession.9
The war on marijuana has largely been a war on people of color. Despite the fact that marijuana is used at comparable rates by whites and Blacks, state and local governments have aggressively enforced marijuana laws selectively against Black people and communities.10 In 2010, the Black arrest rate for marijuana possession was 716 per 100,000, while the white arrest rate was 192 per 100,000. Stated another way,
a Black person was 3.73 times more likely to be arrested for marijuana possession than a white person — a disparity that increased 32.7% between 2001 and 2010. It is not surprising that the War on Marijuana, waged with far less fanfare than the earlier phases of the drug war, has gone largely, if not entirely, unnoticed by middle- and upper-class white communities.
In the states with the worst disparities, Blacks were on average over six times more likely to be arrested for marijuana possession than whites. In the worst offending counties across the country, Blacks were over 10, 15, even 30 times more likely to be arrested than white residents in the same county. These glaring racial disparities in marijuana arrests are not a northern or southern phenomenon, nor a rural or urban phenomenon, but rather a national one. The racial disparities are as staggering in the Midwest as in the Northeast, in large counties as in small, on city streets as on country roads, in counties with high median family incomes as in counties with low median family incomes. They exist regardless of whether Blacks make up 50% or 5% of a county’s overall population. The racial disparities in marijuana arrest rates are ubiquitous; the differences can be found only in their degrees of severity.
Thus, while the criminal justice system casts a wide net over marijuana use and possession by Blacks, it has turned a comparatively blind eye to the same conduct
9 While the broader War on Drugs also often fails to differentiate meaningfully between corner-dealer and kingpin, low-levelpossessor and major pusher, addicts who sell simply to support their habits and profit-reaping entrepreneurs, its architects at leastclaimed that it was designed originally to disable larger-scale drug distributors.10 See infra Figures 21–23. Between 2001 and 2010, of individuals surveyed by SAMHSA, each year slightly more Blacks than whitesreported using marijuana over the past year; among 18- to 25-year-olds, marijuana use was higher among whites than Blacks overthe same time period. SUBSTANCE ABUSE AND MENTAL HEALTH SERV. ADMIN., MARIJUANA USE IN LIFETIME, PAST YEAR, AND PAST MONTH AMONG PERSONS
AGED 18 TO 25, BY DEMOGRAPHIC CHARACTERISTICS: PERCENTAGES, 2009 AND 2010 tbls. 1.26A & 1.26B, available at http://www.samhsa.gov/data/nsduh/2k10NSDUH/tabs/Sect1peTabs1to46.htm.
In states with the worst disparities, Blacks were on average over six times more likely to be arrested for marijuana possession than whites.
Introduction

10 | The War on Marijuana in Black and White
occurring at the same rates in many white communities. Just as with the larger drug war, the War on Marijuana has, quite simply, served as a vehicle for police to target communities of color.
To the extent that the goal of these hundreds of thousands of arrests has been to curb the availability or consumption of marijuana, they have failed.11 In 2002, there were 14.5 million people aged 12 or older — 6.2% of the total population — who had used marijuana in the previous month; by 2011, that number had increased to 18.1 million — 7.0% of the total population.12 According to a World Health Organization survey of 17 countries, 42.2% of Americans have tried marijuana in their lifetime.13 The 2010 National Survey on Drug Use and Health reported similar numbers — 39.26% of Americans surveyed reported having used marijuana in their lifetimes — and over 17.4 million Americans had used marijuana in the past month.14 Between 2009 and 2010, 30.4% of 18- to 25-year-olds reported having used marijuana at least once in the past month.15
All wars are expensive, and this war has been no different. States spent over $3.61 billion combined enforcing marijuana possession laws in 2010. New York and California combined spent over $1 billion in total justice system expenditures just on enforcement of marijuana possession arrests. Had marijuana been regulated like alcohol, and had its
11 Indeed, one report noted that the increase in marijuana arrests during the 1990s had no measurable impact on price, access, oravailability of marijuana. See KATHERINE BECKETT & STEVE HERBERT, ACLU OF WASH., THE CONSEQUENCES AND COSTS OF MARIJUANA PROHIBITION 18-20(2008) [hereinafter BECKETT & HERBERT], available at http://www.aclu-wa.org/library_files/BeckettandHerbert.pdf. See also NAT’L DRUG
INTELLIGENCE CTR., NAT’L DRUG THREAT ASSESSMENT 2011 5, 29 (2011), available at http://www.justice.gov/archive/ndic/pubs44/44849/44849p.pdf (noting that the demand for marijuana is rising and that availability is high); id. at iv (“Despite recent increases in marijuana arrests,the price of marijuana has dropped; its average potency has increased; it has become more readily available; and marijuana use rateshave often increased during the decade of increasing arrests. It thus appears that the goals of marijuana prohibition have not beenachieved.”); see generally Craig Reinarman, Peter D.A. Cohen, & L. Kaal, The Limited Relevance of Drug Policy: Cannabis in Amsterdam and in San Francisco, 94 AM. J. OF PUB. HEALTH 836 (2004), available at http://ajph.aphapublications.org/doi/pdf/10.2105/AJPH.94.5.836(comparing the availability and use of marijuana between Amsterdam, where the government adopted de facto decriminalization in1976, and San Francisco, and finding that the criminalization of marijuana did not reduce use, nor did decriminalization of marijuanaincrease use). Marijuana use throughout the 1980s, when marijuana arrests were level, actually fell. In 1979, rates of usage began todecline sharply, falling 61%, while arrest rates declined by only 24% for the time period. From 1991 to 2003, marijuana arrest ratesincreased disproportionately by 127% as compared to the 22% increase in use. JASON ZIEDENBERG & JASON COLBURN, JUST. POL’Y INST., EFFICACY
& IMPACT: THE CRIMINAL JUSTICE RESPONSE TO MARIJUANA POLICY IN THE US 9 (2005) [hereinafter ZIEDENBERG & COLBURN], available at http://www.justicepolicy.org/research/2017.12 See Drug Facts: Nationwide Trends, NAT’L INST. ON DRUG ABUSE, (Dec. 2012), http://www.drugabuse.gov/publications/drugfacts/nationwide-trends (last visited Feb. 25, 2013).13 See Toward a Global View, supra note 4.14 U.S. DEP’T OF HEALTH & HUMAN SERV., SUBSTANCE ABUSE & MENTAL HEALTH SERV. ADMIN., RESULTS FROM THE 2010 NATIONAL SURVEY ON DRUG USE AND
HEALTH: SUMMARY OF NATIONAL FINDINGS (2011), available at http://www.samhsa.gov/data/NSDUH/2k10NSDUH/2k10Results.htm.15 U.S. DEP’T OF HEALTH & HUMAN SERV., SUBSTANCE ABUSE & MENTAL HEALTH SERV. ADMIN., STATE ESTIMATES OF SUBSTANCE USE AND MENTAL
DISORDERS FROM THE 2009-2010 NATIONAL SURVEYS ON DRUG USE AND HEALTH 2.2 (last updated 2012), available at http://www.samhsa.gov/data/NSDUH/2k10State/NSDUHsae2010/NSDUHsaeCh2-2010.htm#2.2.
The War on Marijuana has, quite simply, served as a vehicle for police to target communities of color.

| 11
use been treated as a public health issue akin to alcohol instead of as a criminal justice issue, this is money that cities, counties, and police departments could have invested in an array of other law enforcement priorities and community initiatives.
Marijuana arrests, prosecutions, and convictions have wrought havoc on both individuals and communities, not only causing direct harm but also resulting in dire collateral consequences. These include affecting eligibility for public housing and student financial aid, employment opportunities, child custody determinations, and immigration status. Marijuana convictions can also subject people to more severe charges and sentences if they are ever arrested for or convicted of another crime. In addition, the targeted enforcement of marijuana laws against people of color, and the unsettling, if not humiliating, experience such enforcement entails, creates community mistrust of the police, reduces police-community cooperation, and damages public safety.
Concentrated enforcement of marijuana laws based on a person’s race or community has not only been a central component of this country’s broader assault on drugs and drug users, it has also resulted from shifts in policing strategies, and the incentives driving such strategies. Over the past 20 years, various policing models rooted in the “broken windows” theory, such as order-maintenance and zero-tolerance policing, have resulted in law enforcement pouring resources into targeted communities to enforce aggressively a wide array of low-level offenses, infractions, and ordinances through tenacious stop, frisk, and search practices. Indeed, it seems hard to avoid the conclusion that police tactics of effectuating a high volume of arrests for minor offenses has been a major contributor to the 51% rise in marijuana arrests between 1995 and 2010. Adding further stimuli to such policing strategies are COMPSTAT — a data-driven police management and performance assessment tool — and the Byrne Justice Assistance Grant Program, a federal funding mechanism used by state and local police to enforce drug laws. These programs appear to create incentives for police departments to generate high numbers of drug arrests, including high numbers of marijuana arrests, to meet or exceed internal and external performance measures.
So we stand at a strange crossroads in America with regards to marijuana policy. On the one hand, as of November 2012, two states — Colorado and Washington — have legalized marijuana; 19 jurisdictions (18 states and the District of Columbia) allow
States spent over $3.6 billion combined enforcing marijuana possession laws in 2010.
Introduction

12 | The War on Marijuana in Black and White
marijuana for medical purposes; a majority of Americans favor both full legalization16 as well as legalizing marijuana for medicinal purposes;17 whites and Blacks use marijuana at comparable rates,18 and many residents of middle- and upper-class white communities use marijuana without legal consequence or even fear of entanglement in the criminal justice system. On the other hand, in 2010 there were over three-quarters of a million arrests for marijuana — accounting for almost half of the almost 1.7 million drug arrests nationwide — for which many people were jailed and convicted. Worse yet, Blacks were arrested for marijuana possession at almost four times the rate as whites, with disparities even more severe in several states and counties, and the country spent billions of dollars enforcing marijuana laws.
But the right road ahead for this country is clearly marked: marijuana possession arrests must end. In place of marijuana criminalization, and taking a cue from the failure of alcohol prohibition, states should legalize marijuana, by licensing and regulating marijuana production, distribution, and possession for persons 21 or older. Legalization would, first and foremost, eliminate the unfair race- and community-targeted enforcement of marijuana criminal laws; help reduce overincarceration in our jails and prisons; curtail infringement upon constitutional rights, most notably as guaranteed by the Fourth Amendment’s proscription of unreasonable searches and seizures; and allow law enforcement to focus on serious crime.19
Furthermore, at a time when states are facing budget shortfalls, legalizing marijuana makes fiscal sense. The licensing and taxation of marijuana will save states millions of dollars currently spent on enforcement of marijuana criminal laws. It will, in turn, raise millions more in revenue to reinvest in public schools and substance abuse
16 Majority Now Supports Legalizing Marijuana, Pew Research CTR for the People & the Press (Apr. 4, 2013), http://www.people-press.org/2013/04/04/majority-now-supports-legalizing-marijuana/. A 2012 Rasmussen poll of likely voters revealed that 56% favoredlegalizing and regulating marijuana in a similar manner to alcohol and tobacco regulation, while 36% opposed. 56% Favor Legalizing, Regulating Marijuana, RASMUSSEN REPORTS (May 17, 2012), http://www.rasmussenreports.com/public_content/lifestyle/general_lifestyle/may_2012/56_favor_legalizing_regulating_marijuana. Other polls have produced similar results. Record High of 50% of Americans Favor Legalizing Marijuana Use, GALLUP POLITICS (Oct. 27, 2011), http://www.gallup.com/poll/150149/record-high-americans-favor-legalizing-marijuana.aspx.17 A Gallup poll in 2010 found that 70% of Americans favored making marijuana legally available for doctors to prescribe to reducepain and suffering. Elizabeth Mendes, New High of 46% of Americans Support Legalizing Marijuana, GALLUP POLITICS (Oct. 28, 2010), http://www.gallup.com/poll/144086/New-High-Americans-Support-Legalizing-Marijuana.aspx.18 See infra Figures 21–23.19 A retired deputy chief of the Los Angeles Police Department criticized the drug war’s diversion of police resources, citing thereassignment of Los Angeles police officers to oversee the constant transfer of prisoners to county correctional facilities as well asthe fact that police laboratories were inundated with drug samples to test, which slowed the testing of rape kits and evidence relatedto other serious crimes. See Stephen Downing, Op-Ed, Drug War: What Prohibition Costs Us [Blowback], L.A. TIMES, Oct. 6, 2011, available at http://opinion.latimes.com/opinionla/2011/10/drug-war-blowback.html. Drug law enforcement “is believed to have redirectedlaw enforcement resources that have resulted in more drunk driving, and decreased investigation and enforcement of violent crimelaws.” Bryan Stevenson, Drug Policy, Criminal Justice and Mass Incarceration 4 (Global Comm’n on Drug Policies, Working Paper, 2011),available at http://www.globalcommissionondrugs.org/wp-content/themes/gcdp_v1/pdf/Global_Com_Bryan_Stevenson.pdf. In Illinois,for example, a 47% increase in drug arrests corresponded with a 22.5% decrease in drunk driving arrests. MARK MAUER & RYAN S. KING, THE SENTENCING PROJECT, A 25-YEAR QUAGMIRE: THE WAR ON DRUGS AND ITS IMPACT ON AMERICAN SOCIETY 5 (2007) [hereinafter MAUER & KING], available at http://www.sentencingproject.org/doc/publications/dp_25yearquagmire.pdf.

| 13
prevention, as well as general funds and local budgets, research, and public health, to help build stronger, safer communities.20 Indeed, Washington State’s Office of Financial Management projects that Initiative 502, which legalized the possession of marijuana for people 21 or older under tight regulations, will generate more than half a billion dollars in new revenue each year through a 25% marijuana excise tax, retail sales, and business and occupation taxes.21 The state will direct 40% of the new revenues toward the state general fund and local budgets and 60% toward education, health care, substance abuse prevention, and research.22 At the national level, a CATO Institute study estimated that federal drug expenditures on marijuana prohibition in 2008 were $3.4 billion, and that legalization would generate $8.7 billion in annual revenue.23
If legalizing marijuana through taxation, licensing, and regulation is unobtainable, states should significantly reduce marijuana arrests by removing all criminal and civil penalties for authorized marijuana use and possession for persons 21 or older. Under depenalization, there would be no arrests, prosecutions, tickets, or fines for marijuana use or possession as long as such activity complies with existing regulations governing such activities. If depenalization is unobtainable, states should decriminalize marijuana possession for personal use by reclassifying all related criminal laws as civil offenses only, with a maximum penalty of a small fine.
In addition to ending marijuana possession arrests, police departments should reform order-maintenance policing strategies that focus on low-level offenses. Instead, law enforcement should address public health questions and safety concerns in ways that minimize the involvement of the criminal justice system by moving toward non-punitive, transparent, collaborative community- and problem-oriented policing strategies. These strategies should aim to serve, protect, and respect all communities. In addition, the federal government should end inclusion of marijuana possession arrests as a performance measure of law enforcement agencies’ use of or application for federal funds, and redirect such funds currently designated to fight the War on Drugs toward drug treatment, research on treatment models and strategies, and public education.
20 For example, Colorado’s Amendment 64 directs $24 million to the state’s Building Excellent Schools Today program, which is projected to create 372 new jobs from school construction projects by 2017. See CHRISTOPHER STIFFLER, COLO. CTR. FOR LAW AND POL’Y, AMENDMENT 64 WOULD PRODUCE $60 MILLION IN NEW REVENUE AND SAVINGS FOR COLORADO 9 (2012) [hereinafter STIFFLER], available at http://www.cclponline.org/postfiles/amendment_64_analysis_final.pdf. 21 See WASHINGTON STATE OFFICE OF FIN. MGMT., FISCAL IMPACT STATEMENT (I-502) (2012), available at http://www.ofm.wa.gov/initiatives/2012/502_fiscal_impact.pdf. 22 WASH. INITIATIVE 502 (I-502) (2012), available at http://sos.wa.gov/_assets/elections/initiatives/i502.pdf. 23 JEFFREY A. MIRON & KATHERINE WALDOCK, CATO INST., THE BUDGETARY IMPACT OF ENDING DRUG PROHIBITION 1 (2010) [hereinafter MIRON & WALDOCK, BUDGETARY IMPACT], available at http://www.cato.org/sites/cato.org/files/pubs/pdf/DrugProhibitionWP.pdf. See Fiscal Cost Analysis infra pp. 68-71 (explaining the methodology used in the Miron and Waldock study).
Introduction

14 | The War on Marijuana in Black and White
FINDING
#1
II. FINDINGS
Marijuana Arrests — 88% of Which Are for Possession Offenses — Have Risen Since 2001 and Accounted for Over Half (52%) of All Drug Arrests in America in 2010
• Between 2001 and 2010, there were over 7 million arrests (7,295,880) for marijuana possession. In 2010 alone, of the 1,717,064 drug arrests in America, over three-quarters of a million — 784,021 — were for marijuana possession.
• While overall drug arrests rose steadily between 1990 and 2006, between 2006 and 2010 they had fallen by over 200,000. Marijuana possession arrests have not only been rising since 1990, when there were just over 250,000 marijuana possession arrests, but increased between 2006 and 2010. There were 100,000 more marijuana possession arrests in 2010 than in 2001, an 18% increase; 200,000 more than in 1995, a 51% increase; and over 500,000 more than in 1990, a 193% increase.
• In 2010, nearly half (46%) of all drug arrests in America were for marijuana possession, an increase from 34% in 1995. Between 2005 and 2010, the percentage of all drug arrests accounted for by marijuana possession arrests increased 21%. In Alaska, 81% of all drug arrests were for marijuana possession in 2010; in Nebraska and Montana, 73% and 70%, respectively; in Wyoming, Georgia, Iowa, Wisconsin, and Colorado, 60% or more of all drug arrests were for marijuana possession.
• Of all marijuana arrests in 2010, 784,021, or 88%, were for possession. Similarly, 88% of all marijuana arrests between 2001 and 2010 — 7,295,880 out of 8,244,943 — were for possession.
• In New York and Texas, the two states with the most marijuana arrests in 2010, 97% were for possession. In nearly half of all states, over 90% of marijuana arrests were for possession. In only seven states did possession
| 15
arrests account for less than 80% of all marijuana arrests, and in only two (Massachusetts and Minnesota) was the figure below 65%.
• The 12 states with the most marijuana possession arrests in 2010 made over half a million total arrests: New York, which alone made over 100,000 arrests, Texas, Florida, California, Illinois, Georgia, Maryland, New Jersey, Pennsylvania, North Carolina, Ohio, and Virginia. In total numbers, the states with the greatest increase in annual marijuana possession arrests between 2001 and 2010 were Texas (20,681 more arrests in 2010 than in 2001), New York (16,173), Illinois (12,406), Florida (12,796), and Georgia (9,425).
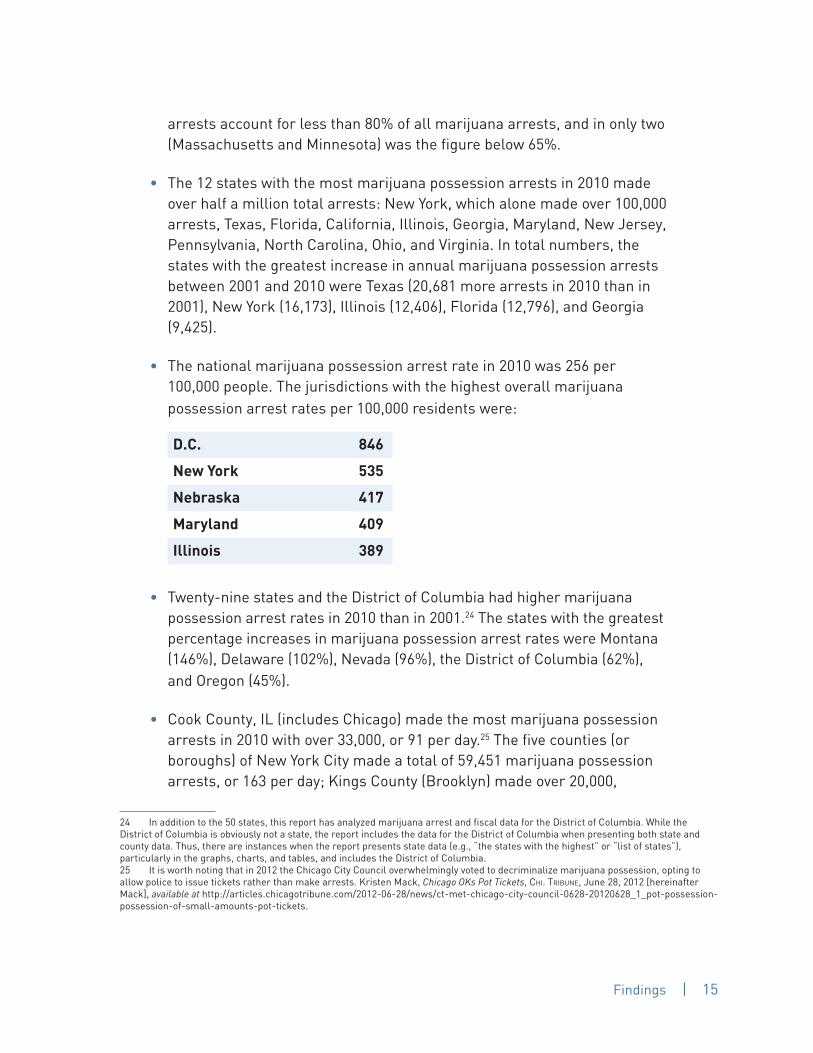
• The national marijuana possession arrest rate in 2010 was 256 per 100,000 people. The jurisdictions with the highest overall marijuana possession arrest rates per 100,000 residents were:
D.C. 846
New York 535
Nebraska 417
Maryland 409
Illinois 389
• Twenty-nine states and the District of Columbia had higher marijuana possession arrest rates in 2010 than in 2001.24 The states with the greatest percentage increases in marijuana possession arrest rates were Montana (146%), Delaware (102%), Nevada (96%), the District of Columbia (62%), and Oregon (45%).
• Cook County, IL (includes Chicago) made the most marijuana possession arrests in 2010 with over 33,000, or 91 per day.25 The five counties (or boroughs) of New York City made a total of 59,451 marijuana possession arrests, or 163 per day; Kings County (Brooklyn) made over 20,000,
24 In addition to the 50 states, this report has analyzed marijuana arrest and fiscal data for the District of Columbia. While theDistrict of Columbia is obviously not a state, the report includes the data for the District of Columbia when presenting both state andcounty data. Thus, there are instances when the report presents state data (e.g., “the states with the highest” or “list of states”),particularly in the graphs, charts, and tables, and includes the District of Columbia.25 It is worth noting that in 2012 the Chicago City Council overwhelmingly voted to decriminalize marijuana possession, opting toallow police to issue tickets rather than make arrests. Kristen Mack, Chicago OKs Pot Tickets, CHI. TRIBUNE, June 28, 2012 [hereinafterMack], available at http://articles.chicagotribune.com/2012-06-28/news/ct-met-chicago-city-council-0628-20120628_1_pot-possession-possession-of-small-amounts-pot-tickets.
Findings
16 | The War on Marijuana in Black and White
Bronx County over 16,000. Los Angeles County, CA, made over 15,600 such arrests and Harris County, TX (includes Houston), almost 12,000. There were another combined 30,000 arrests for marijuana possession in Maricopa County, AZ (includes Phoenix), Fulton County, GA (includes Atlanta), Clark County, NV (includes Las Vegas), and Baltimore City, MD; and there were 40,000 more combined in San Diego and Orange Counties, CA, Suffolk (part of Long Island) and Erie (includes Buffalo) Counties, NY, St. Louis City, MO, Philadelphia County, PA, Milwaukee County, WI, Bexar County, TX (includes San Antonio), and the District of Columbia.
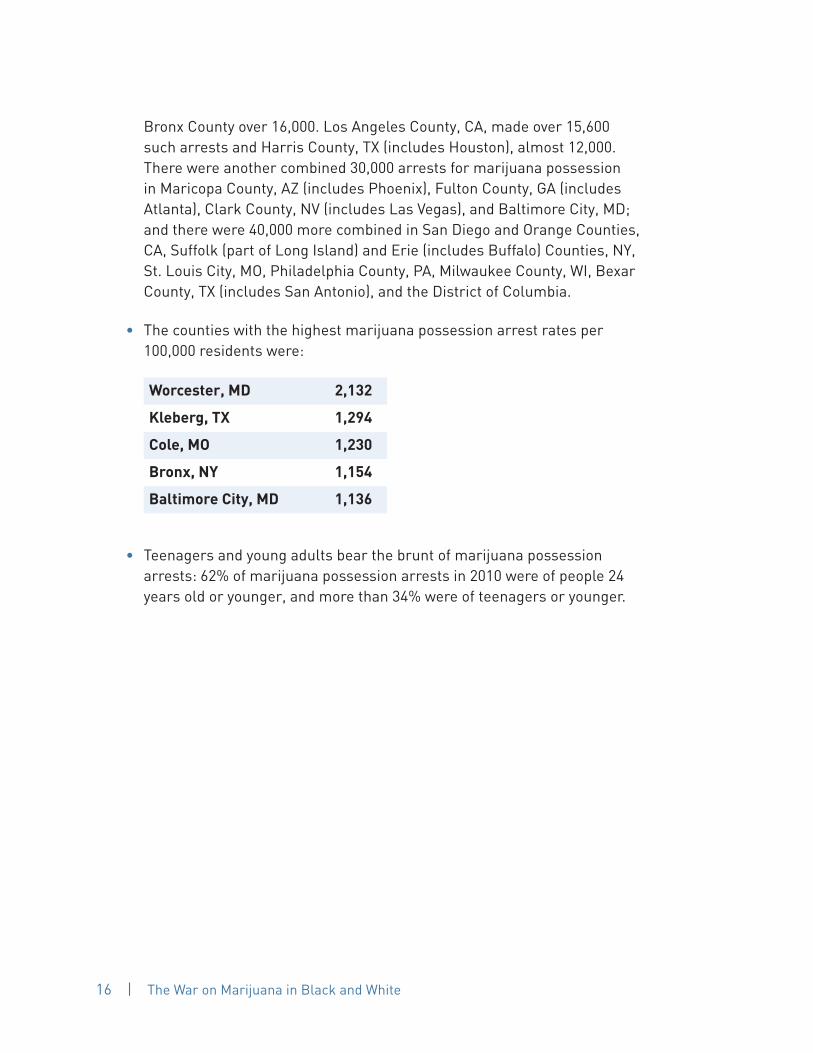
• The counties with the highest marijuana possession arrest rates per 100,000 residents were:
Worcester, MD 2,132
Kleberg, TX 1,294
Cole, MO 1,230
Bronx, NY 1,154
Baltimore City, MD 1,136
• Teenagers and young adults bear the brunt of marijuana possession arrests: 62% of marijuana possession arrests in 2010 were of people 24 years old or younger, and more than 34% were of teenagers or younger.
| 17
FINDING
#2Extreme Racial Disparities in Marijuana Possession Arrests Exist Across the Country: Blacks Are 3.73 Times More Likely Than Whites to Be Arrested for Marijuana Possession
• In 2010, nationwide the white arrest rate was 192 per 100,000 whites, and the black arrest rate was 716 per 100,000 blacks.
• Racial disparities in marijuana possession arrests are widespread and exist in every region in the country. In the Northeast and Midwest, Blacks are over four times more likely to be arrested for marijuana possession than whites. In the South, Blacks are over three times more likely, and in the West, they are twice more likely. In over one-third of the states, Blacks are more than four times likelier to be arrested for marijuana possession than whites.
• Racial disparities in marijuana possession arrests exist regardless of county household income levels, and are greater in middle income and more affluent counties. In the counties with the 15 highest median household incomes (between $85K–$115K), Blacks are two to eight times more likely to be arrested for marijuana possession than whites. In the 15 counties in the middle of the household income range (between $45K–$46K), Blacks are over three times more likely to be arrested for marijuana possession than whites. In the poorest 15 counties (median household incomes between $22K–$30K), Blacks are generally 1.5 to five times more likely to be arrested.
Racial Disparities at the State Level
• The states (plus the District of Columbia) with the largest racial disparities in marijuana possession arrest rates per 100,000 are:
Racial disparities in marijuana possession arrests exist regardless of county household income levels, though they are worse in middle income and more affluent communities.
Findings

18 | The War on Marijuana in Black and White
Black Arrest Rate
White Arrest Rate
Times More Likely Blacks Arrested
Iowa 1,454 174 8.34
D.C. 1,489 185 8.05
Minnesota 835 107 7.81
Illinois 1,526 202 7.56
Wisconsin 1,285 215 5.98
Kentucky 697 117 5.95
Pennsylvania 606 117 5.19
Even at the “lower end” of the spectrum, the disparities persist. In Oregon, for example, the state with the fifth lowest disparity, the Black arrest rate (563) is still more than double the white arrest rate (271).
The states, plus the District of Columbia, with the highest Black arrest rates per 100,000 for marijuana possession were:
Black Arrest Rate
Nebraska 1,699
Illinois 1,526
D.C. 1,489
Iowa 1,454
Wisconsin 1,285
Nevada 1,272
Wyoming 1,223
New York 1,192
• While the Black arrest rate for marijuana possession was under 300 in only two states, Hawaii (179) and Massachusetts (61)(following decriminalization), the white arrest rate was over 300 in only three states: Wyoming (376), Nebraska (365), and Alaska (318). In only 10 states was the Black arrest rate under 500, while in no state was the white arrest rate over 400.

| 19
• Of marijuana possession arrests in the District of Columbia, a staggering 91% were of Blacks. In Mississippi, 69% of all marijuana possession arrests were of Blacks. In Georgia and Louisiana, the numbers are 64% and 61%, respectively. These figures are further illuminated when taking into account the difference between Blacks’ percentage of marijuana arrests and Blacks’ percentage of state populations. In Illinois, for instance, Blacks make up 15% of the population, but account for 58% of the marijuana possession arrests. Similarly, in Alabama, 60% of the marijuana possession arrests are of Blacks, yet Blacks account for less than 25% of the population. In Kentucky and Minnesota, Blacks represent only 8% and 5% of the respective states, but 36% and 31% of the marijuana possession arrests.
Racial Disparities at the County Level
• This report examined 945 counties in the United States with at least 30,000 residents and where Blacks make up at least 2% of the population; these 945 counties represent 78% of the total United States population.26 Of these counties, in only 37 (or 3.9%) is the white arrest rate for marijuana possession higher than the Black arrest rate. In other words, in over 96% of the counties examined in this report, Blacks are more likely than whites to be arrested for marijuana possession.
• The counties with the largest racial disparities in arrest rates for marijuana possession are not necessarily in the states with the largest racial disparities in arrest rates. For instance, Missouri has the 40th largest Black-white arrest ratio (2.63) of all the states, but in St. Louis City, MO, one white person is arrested for every 18.4 Black persons arrested. Georgia has the 21st largest racial disparity (3.69), but in Gordon, GA, the ratio is one white arrest for every 14.1 Black arrests (or 136 white arrests per 100,000 as compared to 1,921 Black arrests per 100,000). Ohio is 16th on the racial disparity list (4.11), but in Allen, OH, Blacks are 13.2 times more likely to be arrested than whites. Kings County (Brooklyn), New York has the 10th largest racial disparity in marijuana possession arrests at 4.52); 161 whites per 100,000 are arrested, whereas 1,554 Blacks per 100,000 are arrested — a ratio of 9.68.
26 When reporting the national and state data regarding marijuana possession arrests, this report considers all 3,143 counties and100% of the population of the United States.
Findings

20 | The War on Marijuana in Black and White
• The counties with the highest Black arrest rates for marijuana possession are spread throughout the country, from Campbell and Kenton, KY, to Worcester, MD; from Dare, NC, to Livingston and Montgomery, IL; from Onondaga, Broome, and Chautauqua, NY, to Chambers, Kleberg, Hopkins, Cooke, and Van Zandt, TX.
• 92% of marijuana possession arrests in Baltimore City, MD, were of Blacks; 87% in Fulton, GA (includes Atlanta); 85% in Prince George’s, MD; 83% in Shelby, TN (includes Memphis); and 82% in Philadelphia, PA.
• These staggering racial disparities in marijuana possession arrests exist in many counties irrespective of the overall Black population. For example, in Lycoming and Lawrence, PA, and in Kenton County, KY, Blacks make up less than 5% of the population, but are between 10 and 11 times more likely than whites to be arrested. In Hennepin County, MN (includes Minneapolis), and Champaign and Jackson Counties, IL, Blacks are 12%, 13%, and 15% of the population, respectively, but are 9 times more likely to be arrested than whites. In Brooklyn, NY, and St. Louis City, MO, Blacks comprise 37% and 50% of the residents, respectively, and are 12 and 18 times more likely to be arrested than whites. In Chambers, AL, and St. Landry, LA, Blacks account for more than twice as many marijuana arrests (90% and 89%, respectively) than they do of the overall population (39% and 42%, respectively). In Morgan and Pike Counties, AL, Blacks make up just over 12% and 37% of the population, respectively, but account for 100% of the marijuana possession arrests.
While There Were Pronounced Racial Disparities in Marijuana Arrests Ten Years Ago, the Disparities Have Increased
• As the overall number of marijuana arrests has increased over the past decade, the white arrest rate has remained constant at around 192 per 100,000, whereas the Black arrest rate has risen from 537 per 100,000 in 2001 (and 521 per 100,000 in 2002) to 716 per 100,000 in 2010. Hence, it appears that the increase in marijuana arrest rates overall is largely a result of the increase in the arrest rates of Blacks.
FINDING
#3

| 21
FINDING
#4
• Racial disparities in marijuana possession arrests have increased in 38 of the 50 states (and in the District of Columbia) over the past decade. The states where the disparities have increased the most since 2001 are:
Black/White Arrest Ratio % Change in Disparity2001 2010
Alaska 0.3 1.6 +384%
Minnesota 2.4 7.8 +231%
Wisconsin 2.4 6.0 +153%
Michigan 1.3 3.3 +149%
Kentucky 2.4 6.0 +146%
Tennessee 1.8 4.0 +122%
Ohio 1.9 4.1 +118%
Blacks and Whites Use Marijuana at Similar Rates
• Marijuana use is roughly equal among Blacks and whites. In 2010, 14% of Blacks and 12% of whites reported using marijuana in the past year; in 2001, the figure was 10% of whites and 9% of Blacks. In every year from 2001 to 2010, more whites than Blacks between the ages of 18 and 25 reported using marijuana in the previous year. In 2010, 34% of whites and 27% of Blacks reported having last used marijuana more than one year ago — a constant trend over the past decade. In the same year, 59% of Blacks and 54% of whites reported having never used marijuana. Each year over the past decade more Blacks than whites reported that they had never used marijuana.
• The relentless criminalization of marijuana has not had a noticeable deterrent effect on usage rates, which have remained constant over time. Notably, marijuana use reached an all-time low around 1990, when there
Findings

22 | The War on Marijuana in Black and White
FINDING
#5
were far fewer arrests for marijuana possession. As law enforcement has increasingly prioritized marijuana possession arrests, usage rates have risen. Generally, from 1980 to 2000 there was no upward trend in the number of people using marijuana. Since 2000, however, marijuana use has generally increased among persons aged 18 or older and has remained approximately the same for persons aged 12 to 17.
Money Wasted on Marijuana Arrests: States Spent Over $3.6 Billion on Marijuana Possession Enforcement in 2010
• The ACLU estimates the total national expenditure of enforcing marijuana possession laws at approximately $3.613 billion. In 2010, states spent an estimated $1,747,157,206 policing marijuana possession arrests, $1,371,200,815 adjudicating marijuana possession cases, and $495,611,826 incarcerating individuals for marijuana possession.
• New York and California combined spent over $1 billion to enforce their marijuana laws in 2010.27 Add the amount of money that Texas, Illinois, Florida, New Jersey, Georgia, and Ohio spent, and the total is over $2 billion.
• Over half of the states (27) each spent over $30 million in 2010 enforcing marijuana possession laws.
• Even when discounting entirely all state fiscal spending on prison facilities, corrections expenditures associated with marijuana possession enforcement are significant — California, Florida, Illinois, New York, and Texas, for example, each spent more than an estimated $20 million of state taxpayer money in 2010 housing individuals in local jail and county
27 Note that California’s expenditures in 2011 would be lower following decriminalization of possession of 28.5 grams or less of marijuana in 2010 and the accompanying drop in marijuana arrests. See Kamala D. Harris, CAL. DEP’T OF JUST. CRIM. JUST. STATISTICS CTR., CRIME IN CALIFORNIA: 2011 2 & 26 (2012), available at http://oag.ca.gov/sites/all/files/pdfs/cjsc/publications/candd/cd11/cd11.pdf? (noting the decline in misdemeanor marijuana arrests after reclassification).

| 23
correctional facilities for possession of marijuana, with New York and California spending more than $65 million apiece.
• The states, including the District of Columbia, that had the highest per capita fiscal expenditures enforcing marijuana possession laws in 2010 were, in order: the District of Columbia, New York, Maryland, Illinois, and Wyoming, followed closely by Nevada, Delaware, New Jersey, and Connecticut.
Findings

24 | The War on Marijuana in Black and White
PROFILE
deMarcus Sanders, 26 Waterloo, IA
The first time DeMarcus Sanders was arrested for having marijuana, it cost him his job, his driver’s license, the start of a college degree, a month in jail, and thousands of dollars.
A police officer pulled Mr. Sanders over for playing his music too loud. “My music was up,” he said. “So I didn’t argue with him.”
After the police officer ran Mr. Sanders’ license, he said he smelled marijuana, and insisted on searching the car. He found a single marijuana seed on the floor, and arrested Mr. Sanders. Mr. Sanders pled guilty and was sentenced to 30 days in jail. While in jail, he was let go from his janitorial job and lost credit for the college classes he had been taking.
Even though it has been a few years since he was arrested, Mr. Sanders still owes the state $2,346 for room and board at the jail, and for fines, court costs, and other fees. “They always send you threats like ‘You’ll get more jail time if you don’t hurry up and pay this off,’” he said.
But as Mr. Sanders is all too aware, it is hard to pay off fines when you do not have a job, and it is hard to find or keep a job when you do not have a driver’s license. Getting arrested for marijuana possession in Iowa automatically triggers a six-month suspension of one’s license. And one has to pay off a certain percentage of court fees and fines before it can be reinstated.
In fact, of all the consequences of his marijuana arrest, the biggest challenge has been losing his driver’s license. Waterloo does not have
The first time DeMarcus Sanders was arrested for having marijuana, it cost him his job, his driver’s license, the start of a college degree, a month in jail, and thousands of dollars.

| 25
much public transportation, so not being able to drive makes it difficult to do many things, such as job-hunting and grocery shopping. It is also hard because Mr. Sanders has full custody of his 8-year-old son, Daivion, and it can be difficult to take him places, such as doctors’ appointments. Mr. Sanders says he was offered, but had to turn down, a job in Cedar Rapids, because it was 45 minutes away and he did not have a license.
Mr. Sanders’ last steady job was as a construction worker in Waterloo. However, the construction business in Iowa slows down significantly during the winter, so now he is making ends meet doing small jobs for his father’s yard work business and his grandfather’s funeral home. To save money, he and his son live with Mr. Sanders’ mother and brother.
Mr. Sanders feels like being an African-American in Waterloo makes him a
Profile

26 | The War on Marijuana in Black and White
target for the police. Mr. Sanders was arrested for marijuana possession again last July. Two plainclothes police officers stopped him one night for crossing the street in downtown Waterloo against the light. They said his jaywalking had nearly caused an accident. Mr. Sanders said he was in the crosswalk, and there were no cars or other pedestrians at that hour.
The police officer patted him down, then asked to search him.
“I told him, ‘No, you cannot,’” Mr. Sanders remembers. “I haven’t done anything. I’m not drunk, I’m not high. I’m not bothering anybody.”
But they handcuffed and searched him anyway, claiming that they could see something in the pocket of his jeans, and found a small bag of marijuana. The police arrested him, booked him, and gave him a citation.
Mr. Sanders fought the case, and the judge threw it out after ruling that the marijuana could not be used as evidence because the police violated Mr. Sanders’ constitutional rights when they searched him.
Mr. Sanders said he wants to be reasonable, but he is also frustrated.
“I understand cops have to do their jobs. I’m not bashing cops,” he said. “[But] you’re on me now, my name hasn’t brought up anything and you’re on me, that’s profiling. You’re racially profiling me.”

| 27
PROFILE
Alfredo Carrasquillo, 29New York, NY
Alfredo Carrasquillo’s first rule about life in the city is never stand on the corner in
a group. His second rule is never stand on the corner by yourself. “You’re a bull’s-eye if you’re standing in a group or by yourself,” he said. “You’re just making yourself a target.”
Mr. Carrasquillo grew up in the South Bronx and has been working as a community organizer in low-income neighborhoods for years. He says he has not yet taught the rules to his 11-year-old daughter, Taneshia, and his 6-year-old son, Alfredo, Jr. But he will.
To avoid getting stopped by the police, Mr. Carrasquillo does not walk through public housing complexes, even if it is the shortest route. He wears button-up shirts as often as possible. And he always carries his identification.
“I’m Black regardless,” he said. “I can’t escape it. What you try to figure out is how to minimize it. And that’s definitely what I’ve done.”
But his rules have not been enough to protect him: he has been arrested
“I’m Black regardless,” says Mr. Carrasquillo. “I can’t escape it. And let’s be honest. It’s not just about smoking. It’s also about race.”
Profile

28 | The War on Marijuana in Black and White
several times for having marijuana. Sometimes, he said, it was after the police stopped him on the street and frisked him for no reason. Other times, he was in the wrong place at the wrong time when the police were doing security checks in and around a building in public housing.
That is what happened the last time the police arrested Mr. Carrasquillo, about a year and a half ago. It was a summer evening, and he and a group of friends were in the courtyard of the housing project where one of his friends lived.
“A lot of times, that’s where we hang out, because there aren’t many places for us to go. As a big group, we can’t all go up to somebody’s house,” he said. Besides, it was hot and everybody wanted to be outside.
The police asked everyone to put their hands on their heads, and began searching them. The search, as Mr. Carrasquillo remembers it, “went from being a pat-down to going into our pockets. Whatever we had [in our pockets] they pulled out.”
Most of what the police pulled out, they gave back. Except that day, Mr. Carrasquillo had a five-dollar bag of marijuana in his pocket. “And [the police officer] was like, ‘you know what? I’m going to have to take you in for that.’”
Mr. Carrasquillo said the police arrested him and he then spent three days in jail. He was arrested on a Friday and not released until Monday. He was strip-searched at the precinct, then held at Bronx Central Booking, where, Mr. Carrasquillo says, “People are literally shoulder to shoulder. The toilet is in the cell and you have to use it in front of other people. There are rats and roaches all over, the walls are dirty, and there is food left over on the floor.” When Mr. Carrasquillo was finally brought to court, he pled guilty, and was ordered to pay $120 in court fees and stay out of trouble for one year.
Mr. Carrasquillo is angry, but also resigned. “It’s the price you pay to smoke [marijuana] and be a person of color,” he said. “Let’s be honest. It’s not just about smoking. It’s also about race.”

| 29
III. METHODOLOGY
This report relies on the Federal Bureau of Investigation’s Uniform Crime Reporting Program (“FBI/UCR Program”) and the United States Census’ annual county population estimates by age, sex, race, and ethnicity to document arrest rates per 100,000 for marijuana possession by race. This report is the first to report and examine this data for all 50 states, as well as the District of Columbia.
This report provides a purely descriptive analysis. In other words, the data is used to describe the problem of racial disparities in marijuana possession arrests, and not to formally test a specific causal hypothesis as to why such disparities exist. A more scholarly analysis would employ panel data techniques on this county-level data, controlling for a set of time-varying explanatory variables, such as total drug arrests and drug use, to test whether the coefficient on the race variable is statistically significant. Ideally, the multivariate regression analysis would also control for individual characteristics of each arrest, such as amount of marijuana possessed and the age and criminal history record of the individual arrested, as well as for various forms of within-county variation (e.g., on average, within a given county, are Blacks more likely than whites to live in high-density residential areas where the arrest rate overall is higher?). Given that the FBI/UCR Program aggregates arrest data at the level of local enforcement agency, however, individual characteristics of an arrest at a more granular level than that of the local enforcement agency will require the use of a different dataset and, short of a vast and very costly data collection effort, is likely to preclude a truly nationwide analysis along the lines of this report. Moreover, given the pervasiveness of the problem of racially disparate arrests, existing, as our data reveals, in counties of different sizes, population densities, demographics, and economic well-being, it is not immediately clear just what variable, if not race itself, could in fact be the true driving causal force behind the consistent and widespread racial disparities in marijuana possession arrest rates in the vast majority of counties in this country. This report neither attempts nor provides an empirical answer to that question, and thus presents the opportunity for future research on this fertile topic.
To calculate the white/Black arrest rate for marijuana possession in a given jurisdiction, the number of white/Black arrests for marijuana possession is divided by the white/Black population in the given jurisdiction (e.g., the state or county); the corresponding ratio is then multiplied by 100,000 to obtain the arrest rate per 100,000. In this report, the measure of racial disparity in a given jurisdiction in terms of arrests for marijuana
Methodology

30 | The War on Marijuana in Black and White
possession is calculated as the ratio of the Black arrest rate to the white arrest rate. So, for example, a racial disparity measure (or ratio) of 3 implies that the rate at which Blacks are arrested for marijuana possession is 3 times the rate at which whites are arrested for marijuana possession.
A. Datai. Sources
The marijuana possession arrest data presented in this report was obtained largely from the FBI/UCR Program. This program annually collects data from state and local law enforcement agencies. In particular, the two main FBI/UCR data sets used in the report are:
• Uniform Crime Reporting Data [United States]: Arrests by Age, Sex, and Race [Alternative Title: ASR], 2001-2010
• Uniform Crime Reporting Data [United States]: County-Level Detailed Arrest and Offense Data, 1995-2010
Both series are publicly available through the Inter-University Consortium for Political and Social Research (ICPSR) at the University of Michigan.
Annual county population estimates by age, sex, race, and ethnicity were drawn from the United States Census:
• U.S. Census Bureau, Annual County Resident Population Estimates by Age, Sex, Race, and Hispanic Origin: April 1, 2000 to July 1, 2010
Additional county-level data on median household income were also drawn from the United States Census:
• U.S. Census Bureau, American Community Survey 5-Year Estimates: 2006-2010
Data on marijuana use were obtained from the National Survey on Drug Use and Health (NSDUH):
• Substance Abuse and Mental Health Services Administration, Results from the 2010 National Survey on Drug Use and Health: Summary of National Findings, NSDUH Series H-41, HHS Publication No. (SMA) 11-4658: 2011

| 31
The NSDUH survey is the primary source of information on the use of illicit drugs, alcohol, and tobacco in the civilian, non-institutionalized population of the United States aged 12 years old or older. Approximately 67,500 persons are interviewed for the NSDUH survey each year. It is important to note that the terms “white” and “Black” in this data set do not include Latinos, unlike the FBI/UCR data sets, in which the terms “white” and “Black” do include Latino (see below for a discussion of FBI/UCR handling of Latino data). In other words, the SAMHSA data set includes a separate category for marijuana usage rates among Latinos, whereas the FBI/UCR does not include a separate category for marijuana possession arrests of Latinos.
Finally, the fiscal cost analysis utilizes the aforementioned arrest data and draws supplemental data from the Justice Expenditure and Employment Extracts, 2009:
• Bureau of Justice Statistics, Criminal Justice Expenditure and Employment Extracts (CJEE) Program, Percent Distribution of Expenditure for the Justice System by Type of Government, Fiscal Year 2009. Filename: cjee0903.csv
This expenditure data is drawn from the Census Bureau’s Annual Government Finance Survey and Annual Survey of Public Employment. This series includes national-, federal-, and state-level estimates of government expenditures and employment for the following justice categories: (1) police protection; (2) all judicial functions (including prosecution, courts, and public defense); and (3) corrections.
It should be noted that Illinois, Florida, the District of Columbia, and the five counties (or boroughs) of New York City do not report data on marijuana possession arrests by race to the FBI/UCR Program. To obtain data on marijuana possession arrests for all 102 counties in Illinois, the authors filed a Freedom of Information Act request with the Illinois Department of State Police (ISP). Every policing body in Illinois is required by statute to report crime statistics to the ISP, which acts as a central repository and custodian for crime statistics. Likewise, to obtain data on marijuana possession for all 67 counties in Florida, the authors submitted a research proposal for statistical information to the Florida Department of Law Enforcement (FDLE). The FDLE maintains arrest data for all criminal offenses in the Computerized Criminal History Central Repository for Florida. The data for the District of Columbia was acquired by filing a Freedom of information Act request with the Research and Analysis Branch of the D.C. Metropolitan Police Department (MPD), which collects, analyzes, and disseminates crime and arrest data amongst other data sources. Finally, the data for New York City was obtained by making a records request under New York state’s Freedom of Information Law with the Office of Justice Research and Performance of the New York State Division of Criminal Justice Services (DCJS) and the Criminal Court of the City of New York.
Methodology

32 | The War on Marijuana in Black and White
ii. The Latino Data Problem
This report’s sole focus on Black-white racial disparities is the result of the fact that the FBI/UCR arrest data does not identify Latinos as a distinct racial group and thus does not distinguish between white and Latino arrests. In other words, an arrest of a Latino is overwhelmingly categorized as a “white” arrest. This conflation of Latino and white arrests not only prevents calculation of Latino arrest rates based on the UCR data, but also results in an underestimation of the racial disparities between Black and white arrests, since a portion — potentially a significant portion in some places — of the “white” arrests are likely arrests of Latinos. Put another way, classifying Latinos as whites for the purposes of reporting arrest data to the FBI/UCR Program can inflate the “true” white arrest rate and, in turn, deflate the “true” racial disparity in arrest rates between whites and Blacks. Therefore, in any jurisdiction where the Latino arrest rate is greater than the white arrest rate — which we suspect is the case in many jurisdictions — the arrest rate disparities between Blacks and whites will be even more pronounced than the disparities as captured by the FBI/UCR data. So, for instance, suppose that there are an equal number of whites, Latinos, and Blacks in a jurisdiction, and that the true arrest rates for these three groups are 100, 200, and 300, respectively. If all Latinos are classified as white, then the reported “white” arrest would be calculated as 150, implying a Black/white racial disparity of 2 (= 300 (Black arrest rate)/150 (white arrest rate)) when, in fact, the true racial disparity is 3 (= 300/100). Indeed, based on the limited data we have from two states for which we have Black, white, and Latino arrest data (New York and California), it appears that Latinos are arrested at higher rates than whites, sometimes significantly so, but at lower rates than Blacks, and that there are fewer arrests of whites than suggested by the FBI/UCR data. In New York City, for example, where Latino arrest data exists, Latinos are arrested at 2.5 times the rates of whites for marijuana possession. See Appendix A, Figure A1. We are thus able to capture a more accurate Black-white arrest disparity, revealing that Blacks are arrested at 6.3 times the rate of whites (and 2.5 times the rate of Latinos). Were all Latino arrests categorized as “white” arrests in New York City, the Black-white arrest disparity, while evident, would be lower.28
Indeed, of the 10 states with the lowest disparities in Black-white arrest rates — Hawaii, Alaska, Colorado, New Mexico, Oregon, Maine, California, Texas, Arizona, and Rhode Island — seven are among the 15 states with the highest Latino populations, including the top four: New Mexico, California, Texas, and Arizona. In other words, in these states,
28 At the same time, the inclusion of Latino data will not always have as significant an impact on the reported disparities in theBlack and white arrest rates. In California, Latinos are arrested for all marijuana offenses at only a slightly greater rate than whites.See Appendix A, Figure A2. Therefore, the exclusion of Latino arrest data in California would not result in a significant underestimationof the Black-white arrest disparity.

| 33
a portion, if not a significant number, of marijuana possession arrests are of Latinos, but the FBI/UCR likely classifies them as “white” arrests, thereby reducing artificially the Black-white arrest disparities to the extent that Latinos are arrested at higher rates than whites. That is, if many of those “white” arrests are actually arrests of Latinos, and if the Latino arrest rate is greater than the white arrest rate, the actual Black-white arrest rates are much greater than the disparities contained in the present data. How much greater, unfortunately, cannot be ascertained from the present FBI/UCR data.29
Similarly, in 22 of the 25 counties where Latinos account for the highest percentage of the overall population, the Black-white disparity in marijuana possession arrests is below the national average. See Appendix A, Figure A3. This is likely because many of the “white” arrests in those counties are, in fact, of Latinos, yet because they are counted as “white” arrests, the white arrest rate is inflated artificially. If the actual number of white arrests was known, the Black-white arrest disparities in many if not all of these counties would be larger, if not also equal to or above the national average.
iii. Counting and Classifying Marijuana Possession Arrests
The FBI/UCR Program counts one arrest for each separate instance in which a person is arrested, cited, or summoned for an offense. Because a person may be arrested more than once during a year, the FBI/UCR arrest numbers used in this report do not reflect the actual number of individuals who have been arrested; rather, the arrest data shows the total number of times that persons have been arrested, as reported by law enforcement agencies to the FBI/UCR Program.
Further, when someone is arrested for multiple crimes arising from a single police enforcement action, the FBI/UCR Program calls it a “multiple-offense situation.” As a general rule, a multiple-offense situation requires classifying each of the offenses committed and determining which of them are Part I offenses as opposed to non-Part I offenses.30 The Hierarchy Rule, as described in the FBI/UCR Handbook, requires that in
29 The two states with the lowest Black-white disparity in marijuana possession arrest rates, Hawaii and Alaska, have large non-Black/non-white populations: Hawaii is almost 60% non-Black/non-white (39% Asian, 10% Native Hawaiian, 9% Latino) and Alaska is over one-quarter non-Black/non-white (15% American Indian or Alaska Native, 6% Asian, 6% Latino). In Alaska, the arrest rate for persons classified as Native American or Native Alaskan is 366 compared to 318 for whites and 510 for Blacks. Thus, in Alaska, there are still racial disparities in arrest rates for marijuana possession between whites and Blacks, but also between whites and Native Americans/Native Alaskans, although the latter disparity is not quite as large (i.e., 1.2 as compared to 1.6). Interestingly, in Hawaii, the arrest rate for persons classified as Asian, Pacific Islander, or Native Hawaiian is 117 as compared to 181 for whites and 179 for Blacks, revealing that there exists a racial disparity in arrest rates for marijuana possession not with respect to whites and Blacks, but rather with respect to the majority Asian/Pacific Islander/Native Hawaiian populations and the minority white and Black populations.30 Part I offenses include: (1) Criminal Homicide, (2) Forcible Rape, (3) Robbery, (4) Aggravated Assault, (5) Burglary, (6) Larceny-Theft (except Motor Vehicle Theft), (7) Motor Vehicle Theft, and (8) Arson. See U.S. DEP’T OF JUST., FED. BUREAU OF INVESTIGATION, UNIFORM CRIME REPORTING HANDBOOK 8 (2004), available at http://www2.fbi.gov/ucr/handbook/ucrhandbook04.pdf.
Methodology
34 | The War on Marijuana in Black and White
a multiple-offense situation — when more than one Part I offense is classified — the law enforcement agency must identify the offense involved that is highest on the hierarchy list and score that offense and not the other offense(s).31 Most relevantly for present purposes, in a multiple-offense incident involving, for example, both Part I (e.g., Robbery — Other Dangerous Weapon) and non-Part I offenses (e.g., Marijuana — Possession), only the Part I offense, Robbery — Other Dangerous Weapon, must be classified and scored. The arrest for marijuana possession would not be reported in this situation. Thus, any racial disparity observed in the FBI/UCR data with respect to marijuana possession is not a product of differential arrest rates for Part I crimes, as marijuana possession offenses are not recorded with respect to these offenses. By contrast, in a multiple-offense incident involving marijuana possession and a traffic violation — neither of which constitute a Part I offense — the enforcement action is coded as both a marijuana possession arrest and a traffic violation (i.e., the Hierarchy Rule does not apply in this situation).
B. Coverage RatiosThe FBI/UCR Arrests by Age, Sex, and Race data set indicates the coverage population for each county, which is the size of the total population covered by all of the reporting agencies in that county. The coverage population can be compared to the total census population in the county to calculate a coverage ratio.
Participation in the FBI/UCR Program varies among jurisdiction. Many counties have full participation with all local enforcement agencies in the county reporting to the FBI/UCR Program. As a result of budgetary and information constraints, however, certain agencies within some counties do not report to the FBI/UCR Program. So, for example, within a given county, if the size of the total population covered by all of the local enforcement agencies reporting to the FBI/UCR Program is 100,000 and the total population size of the county itself is also 100,000, then the coverage ratio for that county is calculated as 1.0 (= 100,000/100,000), or 100%. Similarly, if the size of the total population covered by all of the reporting local enforcement agencies within a given county is 50,000 and the total county population size is 100,000, then the coverage ratio for that county is calculated as 0.5 (= 50,000/100,000), or 50%.
If the coverage ratio in a county is equal to one (i.e., 100%), then the arrest data for that county is analyzed as reported. In large metropolitan areas, the coverage ratio tends
31 See id. at 10-12.
| 35
to be equal to one. If the coverage ratio in a county is less than one, however, then the report weighted the arrest data for that county by a factor equal to 1/(coverage ratio). So, for example, if the coverage ratio in a given county is 0.8 (or 80%), then the raw arrest numbers (e.g., total arrests, Black arrests, white arrests) are increased by a weight of 1.25 (= 1/0.8). This imputation procedure produces a national number and provides comparable data across all counties in the United States.
To test the validity of this imputation procedure, we compared the total number of arrests for marijuana possession, using the above imputation procedure, to the total number of arrests for marijuana possession as reported in the FBI/UCR County-Level Detailed Arrest and Offense data set, which employs its own imputation procedure to provide arrest data for marijuana possession for all counties in the United States, but which does not report county-level arrest numbers by race — or age and sex for that matter. The numbers are approximately equal, suggesting that the procedure described above yields reliable estimates of the total number of arrests for marijuana possession; or, at least, estimates that are generally consistent across the two main FBI/UCR data sets reporting arrest numbers for marijuana possession.
Finally, when reporting county-level results (as opposed to state-level results or results for the country as a whole), this report considers only those counties where the coverage ratio exceeds 0.5 (or 50%). Recall that the lower the coverage ratio, the greater the likelihood that the arrest estimates do not accurately reflect the arrest activities of the jurisdiction as a whole. Thus, because the possibility that arrest activities in areas of a county not covered by the FBI/UCR Program may look different from that suggested by available data for that county, a difference that generally increases as the coverage ratio decreases, this report extrapolates in the manner described above only if a majority of the county population is covered by local enforcement agencies reporting to the FBI/UCR Program. Most counties satisfy this reporting condition; in 2010, for example, the coverage ratio was greater than or equal to 0.5 (or 50%) in 3,011 out of 3,143 total counties (i.e., in approximately 96% of all counties). In fact, it is worth noting that in 89% of all counties the coverage ratio is greater than 0.9 (or 90%). Additionally, when reporting county-level results, this report usually further restricts the subset of counties considered to those in which the total census population exceeds 30,000 and the Black population percentage share of the total county population is greater than 2%. This is to ensure that the Black population within a given county is large enough to draw reliable conclusions from the county’s arrest rates. Specifically, in 2010, 945 counties in the United States had a coverage ratio greater than 0.5 (or 50%) and satisfied these two demographic criteria. These 945 counties comprise 78% of the population of the United States.
Methodology

36 | The War on Marijuana in Black and White
IV. MARIJUANA ARRESTS HAVE RISEN SIGNIFICANTLY BETWEEN 2001 AND 2010, AND THE RACIAL DISPARITIES OF THOSE ARRESTS HAVE INCREASED
A. The Rise in Marijuana Arrestsi. National Data
Marijuana arrests have risen over the past two decades. Between 2001 and 2010 alone, there were 8,244,943 marijuana arrests, more than 7 million of which (7,295,880) were for marijuana possession. There were 100,000 more marijuana possession arrests in 2010 than in 2001 (an 18% increase); 200,000 more than in 1995 (a 51% increase); and over 500,000 more than in 1990 (a 193% increase).
While the total number of drug arrests overall reached an astonishing peak of more than 1.9 million in 2006, they had fallen by over 200,000 in 2010. See Figure 1. Marijuana arrests, on the other hand, did not follow this trend. In fact, in 2006, there were over 800,000 total marijuana arrests for the first time, and in every year between 2006 and 2010 the number of marijuana arrests remained above 845,000. Similarly, the total number of marijuana possession arrests reached 700,000 in 2004 and remained above 750,000 each year between 2006 and 2010. See Figure 2.
1,400,000
1,500,000
1,600,000
1,700,000
1,800,000
1,900,000
2,000,000
�
1995 1996 1997 1998 1999 2000 2001 2002 2003 2004 2005 2006 2007 2008 2009 2010Year
Source:�FBI/Uniform�Crime�Reporting�Program�Data:�County-Level�Detailed�Arrest�and�Offense�Data,�1995-2010
Total�Number�of�Drug�Arrests�in�U.S.�(1995-2010)FIGURE�1

| 37
500,000
550,000
600,000
650,000
700,000
750,000
800,000
850,000
�
1995 1996 1997 1998 1999 2000 2001 2002 2003 2004 2005 2006 2007 2008 2009 2010Year
Source:�FBI/Uniform�Crime�Reporting�Program�Data:�County-Level�Detailed�Arrest�and�Offense�Data,�1995-2010
Number�of�Arrests�for�Marijuana�Possession�in�U.S.�(1995-2010)FIGURE�2
Consequently, of the 1,717,064 drug arrests in the United States in 2010, more than half — 889,133, or 52% — were for marijuana, and almost half — 784,021, or 46% — were for marijuana possession. See Figure 3. The percentage of all drug arrests in the United States that were for marijuana possession has increased 21% since 2005, and 34% since 1995.
34%
36%
38%
40%
42%
44%
46%
�
1995 1996 1997 1998 1999 2000 2001 2002 2003 2004 2005 2006 2007 2008 2009 2010Year
Source:�FBI/Uniform�Crime�Reporting�Program�Data:�County-Level�Detailed�Arrest�and�Offense�Data,�1995-2010
Percentage�of�All�Drug�Arrests�That�Were�for�Marijuana�Possession�(1995-2010)FIGURE�3
Marijuana Arrests

38 | The War on Marijuana in Black and White
Since 1999, 87.5% of all marijuana arrests have been for possession, while only 12.5% have been for sale or manufacture. See Figure 4.
85%
86%
87%
88%
89%
90%
�
1995 1996 1997 1998 1999 2000 2001 2002 2003 2004 2005 2006 2007 2008 2009 2010Year
Source:�FBI/Uniform�Crime�Reporting�Program�Data:�County-Level�Detailed�Arrest�and�Offense�Data,�1995-2010
Percentage�of�All�Marijuana�Arrests�That�Were�for�Possession�(1995-2010)FIGURE�4
Teenagers and young adults bear the brunt of the marijuana possession arrest policies in this country; 77% of marijuana arrests in 2010 were of people 29 or younger, 62% were of people younger than 25, and more than one-third were of teenagers and pre-teens. See Figure 5.
6%
10%
18%
28%
15%
13%
7%3%
15�or�Under16-1718-1920-2425-2930-3940-4950�or�Over
Source:�FBI/Uniform�Crime�Reporting�Program�Data:�County-LevelDetailed�Arrest�and�Offense�Data,�2010
Breakdown�of�Marijuana�Possession�Arrests�by�Age�(2010)FIGURE�5

| 39
ii. State Data
There were 784,021 arrests for marijuana possession in 2010. Half a million were made by 12 states: New York, Texas, Florida, California, Illinois, Georgia, Maryland, New Jersey, Pennsylvania, North Carolina, Ohio, and Virginia. See Appendix A, Table A1 for full state list. New York State alone made more than 100,000 arrests for marijuana possession. See Figure 6.
18,031
18,348
18,416
18,756
19,178
20,983
21,287
21,659
23,663
32,473
49,904
57,262
57,951
74,286
103,698
0 20,000 40,000 60,000 80,000 100,000 120,000
TennesseeArizonaMissouriVirginiaOhio
North�CarolinaPennsylvaniaNew�JerseyMarylandGeorgiaIllinois
CaliforniaFloridaTexas
New�York
Source:�FBI/Uniform�Crime�Reporting�Program�Data�and�U.S.�Census�Data
States�with�Highest�Numbers�of�Arrests�for�Marijuana�Possession�(2010)FIGURE�6
In nearly half of all states, over 90% of marijuana arrests were for possession. In only seven states did possession arrests account for less than 80% of all marijuana arrests, and in only two — Massachusetts and Minnesota — was the figure below 65%. See Appendix A, Table A2.
Marijuana Arrests

40 | The War on Marijuana in Black and White
In 28 states, half or more of all drug arrests were for marijuana possession in 2010. See Appendix A, Table A3. In Alaska, 81% of all drug arrests were for marijuana possession; in Nebraska and Montana, 73% and 70%, respectively; in Wyoming, Georgia, Iowa, Wisconsin, and Colorado, between 61% and 67%. See Table 1.
TABLE 1States Where Marijuana Possession Arrests Account for Highest Percentageof All Drug Arrests (2010)
Number of Arrests Marijuana Possession
State Marijuana Possession All Drug Offenses % of All Drug Arrests
Alaska 2,028 2,517 80.6%Nebraska 7,437 10,217 72.8%Montana 1,210 1,723 70.2%Wyoming 2,104 3,136 67.1%Georgia 32,473 49,876 65.1%Iowa 6,123 9,758 62.8%Wisconsin 15,950 26,206 60.9%Colorado 10,343 17,029 60.7%New York 103,698 174,493 59.4%Rhode Island 2,253 3,809 59.1%Alabama 5,235 9,077 57.7%North Dakota 1,162 2,054 56.6%Arizona 18,348 32,628 56.2%West Virginia 4,400 7,986 55.1%Oregon 9,849 18,047 54.6%
Source: FBI/Uniform Crime Reporting Program Data: County-Level Detailed Arrest and Offense Data, 2010

| 41
The national marijuana possession arrest rate in 2010 was 256 per 100,000. The jurisdictions with the highest marijuana possession arrest rates per 100,000 were the District of Columbia (846, which is 3.3 times greater than the national rate), New York (535, which is more than double the national rate), Nebraska (417), Maryland (409), and Illinois (389). See Figure 7.
295
300
304
308
308
317
338
341
359
374
389
409
417
535
846
0 200 400 600 800 1,000Arrest�Rates�per�100,000
TexasLouisianaAlaskaFloridaMissouri
MississippiGeorgiaNevada
South�CarolinaWyomingIllinois
MarylandNebraskaNew�York
D.C.
Source:�FBI/Uniform�Crime�Reporting�Program�Data�and�U.S.�Census�Data
States�with�Highest�Marijuana�Possession�Arrest�Rates�(2010)FIGURE�7
Marijuana Arrests

42 | The War on Marijuana in Black and White
Twenty nine states and the District of Columbia had higher marijuana possession arrest rates in 2010 than in 2001. See Appendix A, Table A4. The states with the greatest percentage increases in marijuana possession arrest rates were Montana (146%), Delaware (102%), Nevada (96%), the District of Columbia (62%), and Oregon (45%). See Table 2. In total numbers, the states with the greatest increase in marijuana possession arrests since 2001 were Texas (20,681), New York (16,173), Illinois (12,406), Florida (12,796), and Georgia (9,425).32
TABLE 2States with Largest Percent Increases in Marijuana Possession Arrest Rates(2001-2010)
Arrest Rates per 100,000
State Total Arrest Rate (2001) Total Arrest Rate (2010) % Change in TotalArrest Rate
Montana 52 127 145.8%Delaware 140 284 102.1%Nevada 174 341 96.0%D.C. 524 846 61.5%Oregon 177 257 44.8%Missouri 214 308 43.6%Tennessee 210 284 35.3%Virginia 177 234 31.7%Illinois 300 389 29.6%South Carolina 278 359 29.2%Maryland 328 409 24.7%West Virginia 196 241 23.3%Pennsylvania 136 167 23.0%Connecticut 201 247 22.5%Georgia 282 338 19.6%
Source: FBI/Uniform Crime Reporting Program Data: Arrests by Age, Sex, and Race and U.S. Census Data
32 The states that saw the largest decrease in marijuana arrest rates were Massachusetts (-86%), Kentucky (-61%), Alabama(-54%), New Mexico (-46%), and Washington (-29%). See Appendix A, Table A4.

| 43
iii. County Data
Cook County, IL (includes Chicago33), made the most marijuana possession arrests in 2010 with over 33,000, or 91 per day. Kings County (Brooklyn), Bronx County, and New York County (Manhattan), NY, made over 20,000,16,000, and 11,000, respectively (the five counties, or boroughs, of New York City made a total of 59,451 marijuana possession arrests in 2010, or 163 per day). Los Angeles County, CA, made over 15,600 such arrests and Harris County, TX (includes Houston), almost 12,000. See Table 3.
TABLE 3Counties with Highest Numbers of Marijuana Possession Arrests (2010)
Number of Arrests for Marijuana Possession
County-State Total Black White Black % ofArrests
Cook, IL 33,068 24,046 8,760 72.7%Kings, NY 20,413 12,544 1,443 61.5%Bronx, NY 16,001 6,943 497 43.4%Los Angeles, CA 15,643 3,978 11,549 25.4%Harris, TX 11,836 5,320 6,387 44.9%New York, NY 11,221 4,047 1,596 36.1%Queens, NY 9,456 3,449 1,135 36.5%Maricopa, AZ 9,435 1,258 7,786 13.3%Miami-Dade, FL 9,240 5,279 3,935 57.1%Bexar, TX 8,741 1,493 7,234 17.1%Fulton, GA 7,622 6,658 941 87.3%Clark, NV 7,598 2,810 4,556 37.0%Baltimore City, MD 7,047 6,461 555 91.7%San Diego, CA 6,954 1,076 5,761 15.5%Orange, CA 6,327 285 5,967 4.5%Broward, FL 6,061 3,617 2,413 59.7%Philadelphia, PA 5,598 4,590 954 82.0%D.C. 5,115 4,648 467 90.9%Erie, NY 4,991 2,425 2,516 48.6%St. Louis, MO 4,928 2,556 2,346 51.9%Milwaukee, WI 4,732 3,103 1,588 65.6%Suffolk, NY 4,520 1,260 3,237 27.9%Orange, FL 4,502 2,294 2,168 51.0%Pima, AZ 4,352 408 3,744 9.4%Dallas, TX 4,206 2,015 2,150 47.9%
Source: FBI/Uniform Crime Reporting Program Data: Arrests by Age, Sex, and Race and U.S. Census Data
33 See supra Mack, note 25 (discussing Chicago’s recent decriminalization of marijuana possession).
Marijuana Arrests

44 | The War on Marijuana in Black and White
The counties with the highest marijuana possession arrest rates per 100,000 were Worcester, MD (2,132),34 Kleberg, TX (1,294), Cole, MO (1,230), Bronx, NY (1,154), and Baltimore City, MD (1,136). See Figure 8.
757
761
776
790
797
814
823
843
846
849
1,136
1,154
1,230
1,294
2,132
0 250 500 750 1,000 1,250 1,500 1,750 2,000 2,250Arrest�Rates�per�100,000
Dare,�NCOuachita,�LAGreene,�NY
Darlington,�SCNash,�NCKings,�NYFulton,�GAUlster,�NY
D.C.Sullivan,�NY
Baltimore�City,�MDBronx,�NYCole,�MO
Kleberg,�TXWorcester,�MD
NOTE:�Population�Size�>�30,000�and�Black�Population�Percentage�Share�>�2%
Source:�FBI/Uniform�Crime�Reporting�Program�Data�and�U.S.�Census�Data
Counties�with�Highest�Marijuana�Possession�Arrest�Rates�(2010)FIGURE�8
34 One possible explanation for the conspicuously high arrest rate in Worcester County, even relative to the other counties withthe highest total marijuana possession arrest rates, is its encompassment of Ocean City. Ocean City is a beachside community witha year-round population of less than 10,000, but it is a popular tourist destination that receives hundreds of thousands of vacationersover the summer, and up to 8 million visitors annually. This constant population influx may increase the number of people who possessmarijuana in Worcester County and/or increase the police enforcement of marijuana laws during those heavy population influxes.

| 45
The counties with the largest increases in marijuana possession arrest rates between 2001 and 2010 include Miami and Manatee, FL, Vanderburgh, IN (includes Evansville), and Hancock and Kanawha (includes Charleston), WV. See Table 4.
TABLE 4Counties with Largest Percent Increases in Marijuana Possession ArrestRates (2001-2010)
Arrest Rates per 100,000
County-State Total Arrest Rate(2001)
Total Arrest Rate(2010)
% Change in TotalArrest Rate
Hancock, WV 4.7 112.9 2,319.5%Fairfax, VA 18.5 198.9 976.4%Cole, MO 160.0 1,230.0 668.7%Vanderburgh, IN 56.7 399.0 603.9%Douglas, KS 25.0 170.5 583.5%DeKalb, GA 41.2 230.3 459.5%Curry, NM 22.4 120.8 438.3%Buchanan, MO 83.2 439.7 428.4%Avoyelles, LA 44.4 232.2 422.8%Charlottesville City, VA 8.7 41.4 373.5%Kanawha, WV 91.3 398.5 336.4%Roanoke City, VA 123.5 523.5 324.0%Ouachita, LA 193.0 760.5 294.0%Dunklin, MO 63.0 243.4 286.7%St. Louis, MO 129.2 493.4 282.0%
NOTE: Population Size > 30,000 and Black Population Percentage > 2%Source: FBI/Uniform Crime Reporting Program Data: Arrests by Age, Sex, and Race and U.S. Census Data
Marijuana Arrests

46 | The War on Marijuana in Black and White
Of larger counties (counties with populations of 200,000 or greater), those with the highest percentage increases in marijuana possession arrest rates between 2001 and 2010 include DeKalb, GA (includes Decatur and part of Atlanta), St. Louis City, MO, Washoe, NV (includes Reno), Davidson, TN (includes Nashville), Erie, NY (includes Buffalo), Charleston, SC, Miami-Dade, FL, Milwaukee, WI, and Wayne, MI (includes Detroit). See Table 5.
TABLE 5Large Counties with Largest Percent Increases in Marijuana PossessionArrest Rates (2001-2010)
Arrest Rates per 100,000
County-State Total Arrest Rate(2001)
Total Arrest Rate(2010)
% Change in TotalArrest Rate
Fairfax, VA 18.5 198.9 976.4%DeKalb, GA 41.2 230.3 459.5%St. Louis, MO 129.2 493.4 282.0%Franklin, OH 65.3 247.9 279.5%Washoe, NV 60.7 226.9 274.0%Kalamazoo, MI 71.5 265.0 270.8%Davidson, TN 203.3 585.5 188.0%Erie, NY 205.3 543.2 164.6%Charleston, SC 317.5 710.8 123.9%Winnebago, IL 185.5 402.9 117.2%Miami-Dade, FL 170.2 369.2 116.9%Milwaukee, WI 233.6 498.8 113.6%Manatee, FL 193.0 401.6 108.1%Bernalillo, NM 10.7 22.2 106.8%Wayne, MI 113.5 229.2 102.0%
NOTE: Population Size > 200,000 and Black Population Percentage > 2%Source: FBI/Uniform Crime Reporting Program Data: Arrests by Age, Sex, and Race and U.S. Census Data

| 47
B. Significant Racial Disparities Exist in Marijuana Possession Arrests Across the Country i. National Data
Enormous disparities exist in states and counties nationwide between arrest rates of Blacks and whites for marijuana possession. Nationally, Blacks are 3.73 times more likely than whites to be arrested for marijuana possession. The Black arrest rate is 716 per 100,000; the white arrest rate is 192 per 100,000 (the national arrest rate is 256 per 100,000). See Figure 9.
716
192
0
100
200
300
400
500
600
700
800
900
Black�Arrest�Rate White�Arrest�RateSource:�FBI/Uniform�Crime�Reporting�Program�Data�and�U.S.�Census�Data
National�Racial�Disparity�in�Arrest�Rates�for�Marijuana�Possession�(2010)FIGURE�9
Marijuana Arrests

48 | The War on Marijuana in Black and White
While there were pronounced racial disparities in marijuana possession arrests 10 years ago, the disparities have increased 32.7% between 2001 and 2010. In fact, while the white arrest rate has remained constant at around 192 per 100,000, the Black arrest rate has gone from 537 per 100,000 in 2001 (and 521 per 100,000 in 2002) to 716 per 100,000 in 2010. Hence, it appears that the increase in marijuana possession arrest rates overall is largely a result of an increase in arrests of Blacks. See Figure 10.
0
100
200
300
400
500
600
700
800
Arrest�Rates�per�100,000
2001 2002 2003 2004 2005 2006 2007 2008 2009 2010
Source:�FBI/Uniform�Crime�Reporting�Program�Data�and�U.S.�Census�Data
Arrest�Rates�for�Marijuana�Possession�by�Race�(2001-2010)FIGURE�10
White�Arrest�Rate Black�Arrest�Rate
ii. State Data
In Iowa, Minnesota, Illinois, and the District of Columbia, Blacks are almost eight times more likely to be arrested for marijuana possession than whites. In Wisconsin, Kentucky, and Pennsylvania, a Black person is over five times more likely to be arrested than a white person for marijuana possession. In over one-third of the states, Blacks are more than four times as likely to be arrested. See Table 6.

| 49
TABLE 6States with Largest Racial Disparities in Marijuana Possession Arrest Rates(2010)
Arrest Rates per 100,000
State Total Black White Times MoreLikely Blacks
Arrested
Iowa 211 1,454 174 8.34D.C. 846 1,489 185 8.05Minnesota 144 835 107 7.81Illinois 389 1,526 202 7.56Wisconsin 281 1,285 215 5.98Kentucky 162 697 117 5.95Pennsylvania 167 606 117 5.19South Dakota 249 943 197 4.79Nebraska 417 1,699 365 4.65New York 535 1,192 263 4.52Nevada 341 1,272 284 4.47North Dakota 183 732 166 4.41Kansas 181 688 156 4.41Alabama 115 277 64 4.35Vermont 119 514 118 4.35
Source: FBI/Uniform Crime Reporting Program Data: Arrests by Age, Sex, and Race and U.S. Census Data
Comparing white and Black arrest rates directly, the data show that in Iowa the white arrest rate is 174 per 100,000, and the Black arrest rate is 1,454 per 100,000. In the District of Columbia, 185 whites per 100,000 are arrested versus 1,489 Blacks per 100,000. In Minnesota, the arrest rate is 107 for whites, 835 for Blacks; in Illinois, 202 for whites, 1,526 for Blacks; and in Kentucky, 117 whites as compared to 697 Blacks. These startling disparities continue down the list of states. Even at the “other end” of the spectrum, the disparities persist. In Oregon, for example, the state with the fifth lowest disparity, Blacks are still more than twice as likely to be arrested; the arrest rate for whites is 271, and for Blacks it is 563. See Appendix A, Table A5.35
Racial disparities in marijuana possession arrests are widespread and exist in every region in the country. In the Northeast and Midwest, Blacks are over four times more
35 See supra text accompanying note 29 (discussing Alaska and Hawaii’s Black-white arrest ratios).
Marijuana Arrests

50 | The War on Marijuana in Black and White
likely to be arrested for marijuana possession than whites. In the South, they are over three times more likely, and in the West, twice more likely.36 See Figure 11.
0
200
400
600
800
Arrest�Rates�per�100,000
Northeast Midwest South West
Source:�FBI/Uniform�Crime�Reporting�Program�Data�and�U.S.�Census�Data
Arrest�Rates�for�Marijuana�Possession�by�Race�and�Region�(2010)FIGURE�11
White�Arrest�Rate Black�Arrest�Rate
Perhaps the data that best captures the ubiquity of racial disparities in marijuana possession arrests in the United States is that in 96.1% of the 945 counties that this report examined when looking at county data only (representing 78% of the total United States population),37 Blacks are more likely than whites to be arrested for marijuana possession. Stated another way, in only 3.9% of the 945 counties with at least 30,000 residents and where Blacks make up at least 2% of the population is the white arrest rate for marijuana possession higher than the Black arrest rate.38
36 The U.S. Census Bureau defines these four geographical regions of the country according to the following groupings of states(plus the District of Columbia): Northeast: Connecticut, Maine, Massachusetts, New Hampshire, New Jersey, New York, Pennsylvania,Rhode Island, Vermont; Midwest: Illinois, Indiana, Iowa, Kansas, Michigan, Minnesota, Missouri, Nebraska, North Dakota, Ohio, SouthDakota, Wisconsin; South: Alabama, Arkansas, Delaware, the District of Columbia, Florida, Georgia, Kentucky, Louisiana, Maryland,Mississippi, North Carolina, Oklahoma, South Carolina, Tennessee, Texas, Virginia, West Virginia; and West: Alaska, Arizona, California,Colorado, Hawaii, Idaho, Montana, New Mexico, Nevada, Oregon, Utah, Washington, Wyoming.37 As previously stated, when reporting the national and state data regarding marijuana possession arrests, this report considers all3,143 counties and 100% of the population of the United States. See supra text accompanying note 26.38 Further, as discussed on pp. 31-32 of the report, given that the FBI/UCR categorizes most arrests of Latinos as “white” arrests,it may well be that the actual arrest rates of whites in some of these counties is, in fact, smaller than the Black arrest rates. Indeed, ofalmost one-quarter of the 37 counties with higher arrest rates of whites for marijuana possession, the Latino population is above thenational average. If a percentage of these counties’ “white” arrests as categorized by the FBI/UCR are, in fact, arrests of Latinos, andif the arrest rates for Latinos in these counties are higher than the arrest rates for whites, then Blacks in these counties may be morelikely to be arrested for marijuana possession than whites.

| 51
This startling statistic is illustrated in Figure 12. Not only do racial disparities in marijuana possession arrests exist in almost every county in the United States, but the racial disparity in a sizable proportion of these counties lies between two and five (in other words, Blacks are between two and five times more likely than whites to be arrested for marijuana possession in the majority of counties),39 and in a significant number of other counties, as noted elsewhere in the report, this racial disparity is even larger.
025
5075
100125150
Number�of�Counties
0 1 2 3 4 5 6 7 8 9 10Times�More�Likely�Blacks�Arrested�Than�Whites
NOTE:�Population�Size�>�30,000�and�Black�Population�Percentage�Share�>�2%
Source:�FBI/Uniform�Crime�Reporting�Program�Data�and�U.S.�Census�Data
Distribution�of�Racial�Disparity�in�Marijuana�Possession�Arrests(2010)
FIGURE�12
39 As indicated at the outset of the report, when examining the national data, which considers every county in the United States andthus 100% of the population, the total arrest rate for marijuana possession is 256, the white arrest rate is 192, and the Black arrest rateis 716. But when examining the data for the 945 counties with more than 30,000 residents and Black populations of over 2%, which cover78% of the United States’ population, the white arrest rate drops slightly to 189 while the Black arrest rate rises to 739 (the total arrestrate is 269). In other words, the racial disparities in marijuana possession arrests increases to 3.9.
Marijuana Arrests

52 | The War on Marijuana in Black and White
In 38 states and the District of Columbia, the racial disparities in marijuana possession arrests increased between 2001 and 2010. See Table 7. The jurisdictions with the greatest percentage increases in racial disparities in marijuana possession arrest rates over the past 10 years were Alaska (384%), Minnesota (231%), Wisconsin (153%), Michigan (149%), and Kentucky (146%).40
TABLE 7States with Largest Percent Increases in Racial Disparities in MarijuanaPossession Arrest Rates (2001-2010)
Racial Disparity
State Times More LikelyBlacks Arrested (2001)
Times More LikelyBlacks Arrested (2010)
% Change in RacialDisparity
Alaska 0.3 1.6 384.1%Minnesota 2.4 7.8 231.0%Wisconsin 2.4 6.0 153.0%Michigan 1.3 3.3 149.3%Kentucky 2.4 6.0 145.8%Tennessee 1.8 4.0 121.7%Ohio 1.9 4.1 118.1%D.C. 4.6 8.0 76.8%Massachusetts 2.2 3.9 75.4%Georgia 2.2 3.7 71.0%Mississippi 2.3 3.9 68.9%Alabama 2.6 4.4 67.1%South Carolina 1.8 2.8 57.4%Connecticut 2.2 3.3 53.7%Arkansas 2.0 3.1 53.5%
Source: FBI/Uniform Crime Reporting Program Data: Arrests by Age, Sex, and Race and U.S. Census Data
40 The states with the greatest decreases in racial disparities in marijuana arrest rates were Nebraska (-51%), Colorado (-38%),Montana (-34%), California (-11%), and South Dakota (-10%). See Appendix A, Table A6. Note that although Massachusetts reducedits overall marijuana possession arrests by 86% after decriminalizing adult marijuana possession of an ounce or less in 2008, theracial disparity in arrest rates still increased: it was 3.42 in 2008 (before decriminalization), went up 56.1% to 5.34 in 2009 (afterdecriminalization), and then fell to 3.87 in 2010 (though still a 13.1% increase from 2008). Overall, the disparity increased 75% between2001 and 2010.

| 53
The states that made the highest numbers of arrests of Blacks for marijuana possession in 2010 were New York (40,326), Illinois (29,083), Florida (26,711), Georgia (20,765), and Texas (19,164). See Appendix A, Table A1. The states (including the District of Columbia) with the highest Black arrest rates per 100,000 for marijuana possession are Nebraska (1,699), Illinois (1,526), the District of Columbia (1,489), Iowa (1,454), and Wisconsin (1,285). See Figure 13. When compared to the combined white arrest rate in those states (215), not to mention the marijuana possession arrest rate for whites nationally (192), or even the national marijuana possession arrest rate for Blacks (716), the Black arrest rates for marijuana possession in these states is, simply, astronomical.
866
943
1,192
1,223
1,272
1,285
1,454
1,489
1,526
1,699
0 200 400 600 800 1,000 1,200 1,400 1,600 1,800Arrest�Rates�per�100,000
Florida
South�Dakota
New�York
Wyoming
Nevada
Wisconsin
Iowa
D.C.
Illinois
Nebraska
Source:�FBI/Uniform�Crime�Reporting�Program�Data�and�U.S.�Census�Data
States�with�Highest�Black�Arrest�Rates�for�Marijuana�Possession�(2010)FIGURE�13
Of marijuana possession arrests in the District of Columbia, a staggering 91% were of Blacks. In Mississippi, 69% of marijuana possession arrests were of Blacks. In Georgia and Louisiana, 64% and 61% of marijuana possession arrests were of Blacks, respectively. See Table 8.
Marijuana Arrests

54 | The War on Marijuana in Black and White
TABLE 8Differences in Black Percentage of Population and Marijuana PossessionArrests by State (2010)
State Percentages
State Black % of Population Black % of Arrests Difference
Illinois 14.9% 58.3% 43.4%D.C. 51.6% 90.9% 39.3%Alabama 24.8% 59.7% 34.8%Mississippi 36.3% 69.4% 33.1%Georgia 30.9% 63.9% 33.1%Florida 16.4% 46.1% 29.7%Pennsylvania 11.3% 40.8% 29.6%Tennessee 16.8% 45.8% 28.9%Louisiana 32.0% 60.8% 28.8%North Carolina 22.0% 50.0% 28.0%Maryland 30.0% 57.9% 27.9%Kentucky 8.2% 35.6% 27.3%Minnesota 5.4% 31.3% 25.9%Delaware 21.9% 47.7% 25.8%Ohio 12.6% 38.1% 25.6%South Carolina 28.2% 53.3% 25.1%Virginia 19.8% 43.4% 23.7%Nevada 8.6% 32.1% 23.5%Wisconsin 6.5% 29.6% 23.1%Michigan 14.3% 36.9% 22.5%Arkansas 15.5% 37.2% 21.8%New York 17.4% 38.9% 21.4%New Jersey 14.6% 35.1% 20.5%Connecticut 11.0% 30.3% 19.3%Iowa 3.1% 21.7% 18.5%Massachusetts 7.7% 25.9% 18.2%Indiana 9.8% 27.6% 17.8%Kansas 6.2% 23.7% 17.5%Missouri 11.7% 26.7% 15.0%Nebraska 4.8% 19.7% 14.8%Texas 12.2% 25.8% 13.6%Oklahoma 7.6% 20.8% 13.2%Rhode Island 7.1% 17.5% 10.3%California 6.7% 16.3% 9.6%West Virginia 3.5% 10.8% 7.3%Washington 3.8% 10.7% 6.9%Arizona 4.4% 10.4% 6.0%South Dakota 1.5% 5.5% 4.1%Colorado 4.3% 8.3% 4.0%North Dakota 1.3% 5.2% 3.9%Vermont 1.0% 4.5% 3.5%Utah 1.2% 4.7% 3.4%Alaska 3.6% 6.1% 2.5%Oregon 1.9% 4.3% 2.3%New Mexico 2.5% 4.8% 2.3%Wyoming 0.9% 3.0% 2.1%New Hampshire 1.2% 3.3% 2.1%Maine 1.2% 2.6% 1.4%Idaho 0.7% 2.0% 1.3%Hawaii 1.6% 2.8% 1.1%Montana 0.4% 1.5% 1.1%
Source: FBI/Uniform Crime Reporting Program Data: Arrests by Age, Sex, and Race and U.S. Census Data

| 55
Indeed, examining the state-by-state differences between Black percentages of the population and Black percentages of marijuana possession arrests, in every state the Black arrest rate is disproportionate to Blacks’ percentage of the population. See Table 8. In fact, in 42 states the Black percentage of marijuana possession arrests is more than double the Black percentage of the population, while in 18 states Blacks account for more than three times the percentage of marijuana possession arrests than they do of the population. In four states, the difference is a factor of at least four.
In Illinois, for instance, Blacks are 15% of the population, but account for 58% of marijuana possession arrests. In the District of Columbia, Blacks are just over half the population, but account for more than nine out of every ten marijuana possession arrests. In Alabama, 60% of the marijuana possession arrests are of Blacks, yet Blacks account for less than 25% of the population. In Kentucky and Minnesota, Blacks represent only 8% and 5% of the respective states, but 36% and 31% of the marijuana possession arrests. Similarly, in Iowa, the percentage of Blacks arrested for marijuana possession is seven times greater than their percentage of the state population.
Marijuana Arrests

56 | The War on Marijuana in Black and White
iii. County Data
The counties that arrested the highest numbers of Blacks for marijuana possession in 2010 were Cook, IL (includes Chicago41)(24,046), Kings, NY (Brooklyn) (12,544), Bronx, NY (6,943), Fulton, GA (includes Atlanta) (6,658), and Baltimore City, MD (6,461). See Table 9.
TABLE 9Counties with Highest Numbers of Black Arrests for Marijuana Possession(2010)
Number of Arrests for Marijuana Possession
County-State Black White Total Black % ofArrests
Cook, IL 24,046 8,760 33,068 72.7%Kings, NY 12,544 1,443 20,413 61.5%Bronx, NY 6,943 497 16,001 43.4%Fulton, GA 6,658 941 7,622 87.3%Baltimore City, MD 6,461 555 7,047 91.7%Harris, TX 5,320 6,387 11,836 44.9%Miami-Dade, FL 5,279 3,935 9,240 57.1%D.C. 4,648 467 5,115 90.9%Philadelphia, PA 4,590 954 5,598 82.0%New York, NY 4,047 1,596 11,221 36.1%Los Angeles, CA 3,978 11,549 15,643 25.4%Broward, FL 3,617 2,413 6,061 59.7%Queens, NY 3,449 1,135 9,456 36.5%Shelby, TN 3,311 652 3,978 83.2%Milwaukee, WI 3,103 1,588 4,732 65.6%Clark, NV 2,810 4,556 7,598 37.0%St. Louis, MO 2,556 2,346 4,928 51.9%Wayne, MI 2,448 1,702 4,160 58.9%Erie, NY 2,425 2,516 4,991 48.6%Orange, FL 2,294 2,168 4,502 51.0%Davidson, TN 2,267 1,384 3,677 61.7%Cuyahoga, OH 2,155 756 2,916 73.9%Prince George’s, MD 2,043 334 2,396 85.3%Dallas, TX 2,015 2,150 4,206 47.9%Hillsborough, FL 2,012 2,006 4,049 49.7%
Source: FBI/Uniform Crime Reporting Program Data: Arrests by Age, Sex, and Race and U.S. Census Data
41 See supra Mack, note 25 (discussing Chicago’s recent decriminalization of marijuana).

| 57
Figure 14 shows the counties with the highest Black arrest rates for marijuana possession. These counties are spread throughout the country, from Kenton, KY, to Worcester, MD; from Dare, NC, to Livingston and Montgomery, IL; from Broome and Chautauqua, NY, to Kleberg, Hopkins, and Van Zandt, TX. In all of these counties, the Black arrest rate is over 1,000 — the national arrest rate for marijuana possession for all races is 256 — and is equal to or greater than a staggering 3,000 in Campbell, KY (adjacent to Cincinnati, OH), Chambers (approximately 30 miles east of Houston) and Cooke (approximately 50 miles north of Dallas), TX, Worcester, MD, and Onandaga, NY (includes Syracuse). In none of these counties is the white arrest rate for marijuana possession — though quite high in many of them — similar to the Black arrest rate.
0 1,000 2,000 3,000 4,000 5,000 6,000Arrest�Rate�per�100,000
Kenton,�KYBroome,�NYVan�Zandt,�TXMontgomery,�ILLafayette,�MO
Chautauqua,�NYHopkins,�TXLivingston,�ILKleberg,�TXDare,�NC
Onondaga,�NYCooke,�TX
Worcester,�MDChambers,�TXCampbell,�KY
NOTE:�Population�Size�>�30,000�and�Black�Population�Percentage�Share�>�2%
Source:�FBI/Uniform�Crime�Reporting�Program�Data�and�U.S.�Census�Data
Counties�with�Highest�Black�Arrest�Rates�for�Marijuana�Possession�(2010)FIGURE�14
White�Arrest�Rate Black�Arrest�Rate
Table 10 shows the counties with the greatest racial disparities in marijuana possession arrests.42 As the data presented reveals, the counties with the greatest racial disparities in arrest rates are not necessarily in the states that have the greatest racial disparities in arrest rates. For instance, in Missouri, Blacks are on average over 2.5 times more likely to be arrested for marijuana possession than whites, but the ratio of white to
42 It is important to note that in three counties in the United States, all in Alabama — Dallas (which has a Black arrest rate of 95 per100,000), Morgan (Black arrest rate of 55), and Pike (Black arrest rate of 115) — the number of white arrests in 2010 was zero. Giventhat this report defines racial disparity (i.e., the ratio of Black arrests rates to white arrest rates) by dividing the Black arrest rate by thewhite arrest rate, in these three counties the rate at which Blacks are arrested as compared to whites is an infinite number. Therefore,because we do not have a precise ratio to report, these three counties are not represented in Table 10. However, they should still beincluded among the counties nationwide with the largest racial disparities in arrest rates for marijuana possession.
Marijuana Arrests
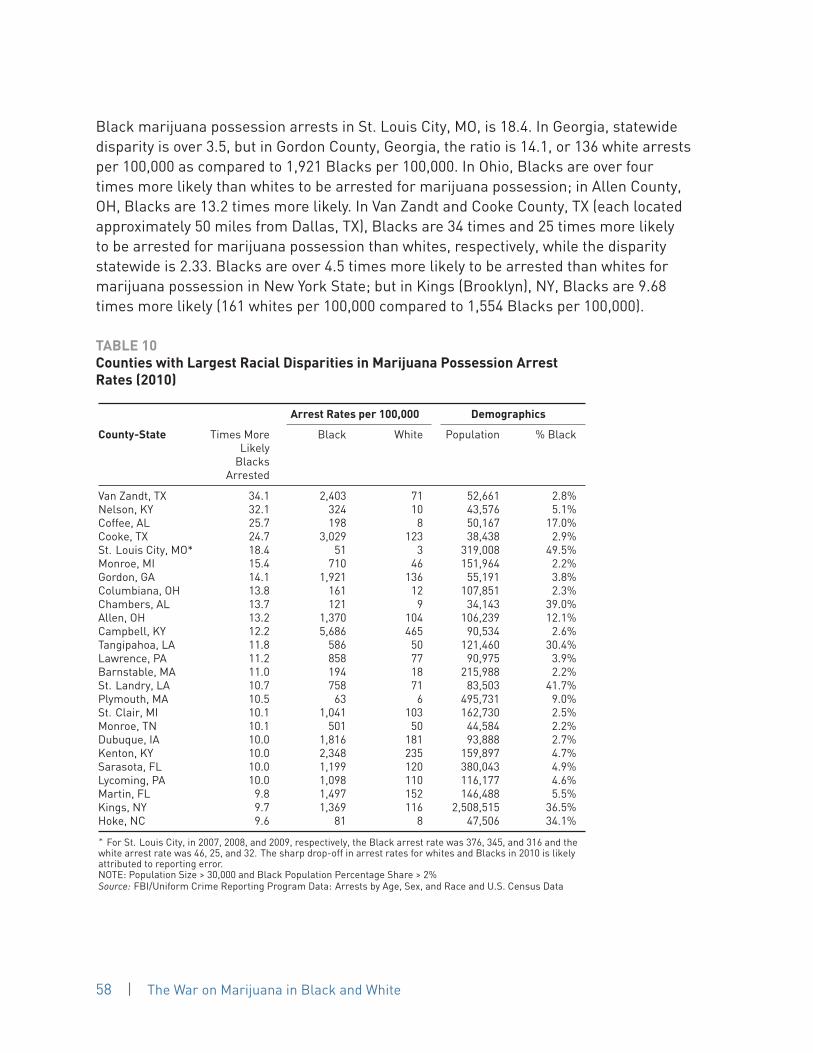
58 | The War on Marijuana in Black and White
Black marijuana possession arrests in St. Louis City, MO, is 18.4. In Georgia, statewide disparity is over 3.5, but in Gordon County, Georgia, the ratio is 14.1, or 136 white arrests per 100,000 as compared to 1,921 Blacks per 100,000. In Ohio, Blacks are over four times more likely than whites to be arrested for marijuana possession; in Allen County, OH, Blacks are 13.2 times more likely. In Van Zandt and Cooke County, TX (each located approximately 50 miles from Dallas, TX), Blacks are 34 times and 25 times more likely to be arrested for marijuana possession than whites, respectively, while the disparity statewide is 2.33. Blacks are over 4.5 times more likely to be arrested than whites for marijuana possession in New York State; but in Kings (Brooklyn), NY, Blacks are 9.68 times more likely (161 whites per 100,000 compared to 1,554 Blacks per 100,000).
TABLE 10Counties with Largest Racial Disparities in Marijuana Possession ArrestRates (2010)
Arrest Rates per 100,000 Demographics
County-State Times MoreLikelyBlacks
Arrested
Black White Population % Black
Van Zandt, TX 34.1 2,403 71 52,661 2.8%Nelson, KY 32.1 324 10 43,576 5.1%Coffee, AL 25.7 198 8 50,167 17.0%Cooke, TX 24.7 3,029 123 38,438 2.9%St. Louis City, MO* 18.4 51 3 319,008 49.5%Monroe, MI 15.4 710 46 151,964 2.2%Gordon, GA 14.1 1,921 136 55,191 3.8%Columbiana, OH 13.8 161 12 107,851 2.3%Chambers, AL 13.7 121 9 34,143 39.0%Allen, OH 13.2 1,370 104 106,239 12.1%Campbell, KY 12.2 5,686 465 90,534 2.6%Tangipahoa, LA 11.8 586 50 121,460 30.4%Lawrence, PA 11.2 858 77 90,975 3.9%Barnstable, MA 11.0 194 18 215,988 2.2%St. Landry, LA 10.7 758 71 83,503 41.7%Plymouth, MA 10.5 63 6 495,731 9.0%St. Clair, MI 10.1 1,041 103 162,730 2.5%Monroe, TN 10.1 501 50 44,584 2.2%Dubuque, IA 10.0 1,816 181 93,888 2.7%Kenton, KY 10.0 2,348 235 159,897 4.7%Sarasota, FL 10.0 1,199 120 380,043 4.9%Lycoming, PA 10.0 1,098 110 116,177 4.6%Martin, FL 9.8 1,497 152 146,488 5.5%Kings, NY 9.7 1,369 116 2,508,515 36.5%Hoke, NC 9.6 81 8 47,506 34.1%∗ For St. Louis City, in 2007, 2008, and 2009, respectively, the Black arrest rate was 376, 345, and 316 and thewhite arrest rate was 46, 25, and 32. The sharp drop-off in arrest rates for whites and Blacks in 2010 is likelyattributed to reporting error.NOTE: Population Size > 30,000 and Black Population Percentage Share > 2%Source: FBI/Uniform Crime Reporting Program Data: Arrests by Age, Sex, and Race and U.S. Census Data
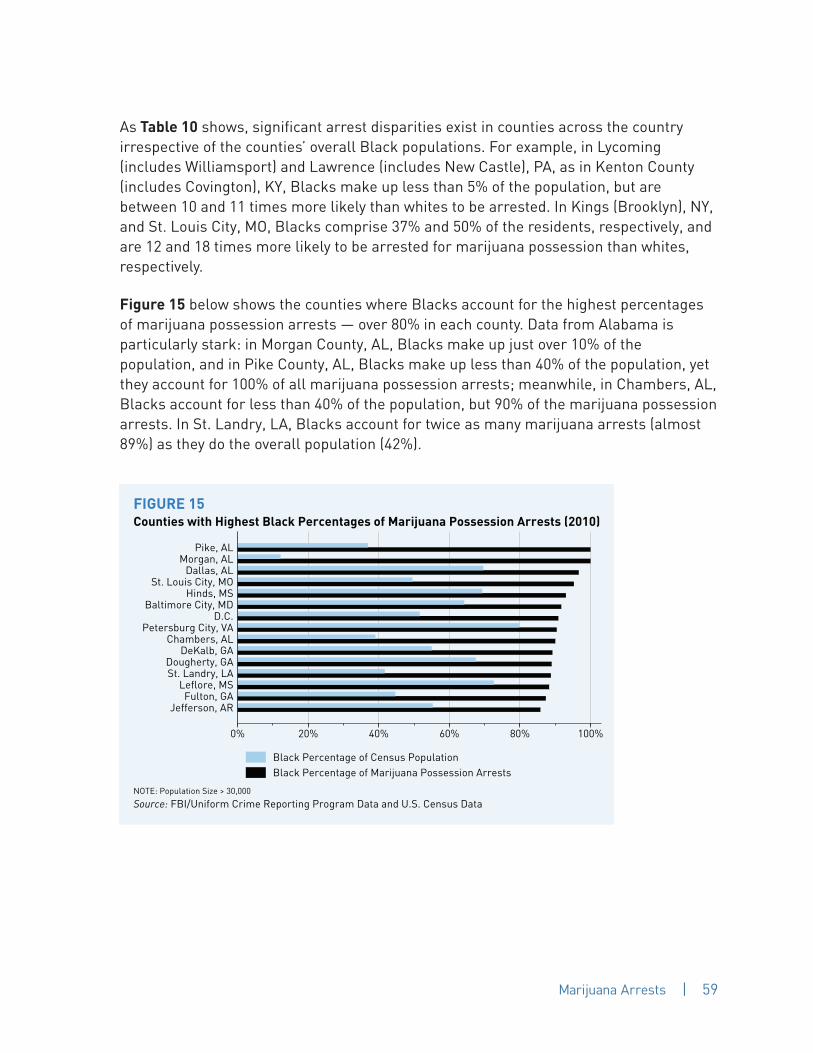
| 59
As Table 10 shows, significant arrest disparities exist in counties across the country irrespective of the counties’ overall Black populations. For example, in Lycoming (includes Williamsport) and Lawrence (includes New Castle), PA, as in Kenton County (includes Covington), KY, Blacks make up less than 5% of the population, but are between 10 and 11 times more likely than whites to be arrested. In Kings (Brooklyn), NY, and St. Louis City, MO, Blacks comprise 37% and 50% of the residents, respectively, and are 12 and 18 times more likely to be arrested for marijuana possession than whites, respectively.
Figure 15 below shows the counties where Blacks account for the highest percentages of marijuana possession arrests — over 80% in each county. Data from Alabama is particularly stark: in Morgan County, AL, Blacks make up just over 10% of the population, and in Pike County, AL, Blacks make up less than 40% of the population, yet they account for 100% of all marijuana possession arrests; meanwhile, in Chambers, AL, Blacks account for less than 40% of the population, but 90% of the marijuana possession arrests. In St. Landry, LA, Blacks account for twice as many marijuana arrests (almost 89%) as they do the overall population (42%).
0% 20% 40% 60% 80% 100%
Jefferson,�ARFulton,�GALeflore,�MS
St.�Landry,�LADougherty,�GADeKalb,�GA
Chambers,�ALPetersburg�City,�VA
D.C.Baltimore�City,�MD
Hinds,�MSSt.�Louis�City,�MO
Dallas,�ALMorgan,�ALPike,�AL
NOTE:�Population�Size�>�30,000
Source:�FBI/Uniform�Crime�Reporting�Program�Data�and�U.S.�Census�Data
Counties�with�Highest�Black�Percentages�of�Marijuana�Possession�Arrests�(2010)FIGURE�15
Black�Percentage�of�Census�PopulationBlack�Percentage�of�Marijuana�Possession�Arrests
Marijuana Arrests

60 | The War on Marijuana in Black and White
In each of the 25 most populous counties in the United States, the Black arrest rate for marijuana possession exceeds the white arrest rate, further evidence of the pervasiveness of racial disparities throughout the country. See Figure 16. The most populous counties with the greatest racial disparities in marijuana possession arrest rates are Kings County (Brooklyn), NY (where Blacks are 9.7 times more likely to be arrested than whites), New York County (Manhattan), NY (9.4 times more likely), Cook County (Chicago), IL (7.2 times more likely), Miami-Dade County, FL (5.4 times more likely), Philadelphia County, PA (5 times more likely), Queens County, NY (4.6 times more likely), Suffolk County (part of Long Island)NY (4.2 times more likely), and Clark County (includes Las Vegas), NV (4.1 times more likely). Notably, in each of these 25 counties, the percentage of marijuana arrests that are of Blacks also significantly exceeds the Black percentage of those counties’ populations.
0 250 500 750 1,000 1,250 1,500 1,750 2,000
Sacramento,�CASuffolk,�NY
Middlesex,�MAAlameda,�CA
Philadelphia,�PANew�York,�NYBexar,�TX
Broward,�FLSanta�Clara,�CA
Wayne,�MITarrant,�TXKing,�WAClark,�NV
San�Bernardino,�CARiverside,�CAQueens,�NYDallas,�TX
Miami-Dade,�FLKings,�NYOrange,�CA
San�Diego,�CAMaricopa,�AZHarris,�TXCook,�IL
Los�Angeles,�CA
Source:�FBI/Uniform�Crime�Reporting�Program�Data�and�U.S.�Census�Data
Racial�Disparities�in�Marijuana�Possession�Arrests�in�the�25�MostPopulous�Counties�in�U.S.�(2010)
FIGURE�16
White�Arrest�Rate
Black�Arrest�Rate
Figure 17 looks at the largest disparities between the white and Black arrest rates for marijuana possession in counties where the overall marijuana possession arrest rate is greater than the national average.

| 61
0 1,000 2,000 3,000 4,000 5,000 6,000
Johnson,�IALafayette,�MO
Kay,�OKD.C.
Woodbury,�IAPeoria,�ILHopkins,�TX
Kalamazoo,�MIChambers,�TXNew�York,�NYKings,�NYKenton,�KY
St.�Landry,�LACampbell,�KYAllen,�OH
NOTE:�Population�Size�>�30,000�and�Black�Population�Percentage�Share�>�2%
Source:�FBI/Uniform�Crime�Reporting�Program�Data�and�U.S.�Census�Data
Largest�Racial�Disparities�in�Counties�with�Above-Average�Marijuana�PossessionArrest�Rates�(2010)
FIGURE�17
White�Arrest�Rate Black�Arrest�Rate
Table 11 lists the counties with the largest increases in racial disparities in marijuana possession arrests from 2001 to 2010. The largest increases range from 426.2% in Kent, MI (includes Grand Rapids), to 1,230.8% in Monroe, TN.
TABLE 11Counties with Largest Percent Increases in Racial Disparities in MarijuanaPossession Arrest Rates (2001-2010)
Racial Disparity
County-State Times More LikelyBlacks Arrested
(2001)
Times More LikelyBlacks Arrested
(2010)
% Change in RacialDisparity
Monroe, TN 0.8 10.1 1,230.8%Chambers, AL 1.1 13.7 1,090.6%Lycoming, PA 0.9 10.0 1,048.0%Hoke, NC 1.0 9.6 906.4%Jefferson, AR 0.5 4.8 851.4%Madison, IN 0.4 3.5 834.1%St. Lawrence, NY 0.2 2.1 793.7%Coffee, AL 3.5 25.7 625.5%Graham, AZ 0.5 3.0 537.0%Walton, GA 0.5 3.4 528.1%McDowell, NC 0.8 4.5 464.6%Wyoming, NY 0.1 0.6 449.3%Lawrence, AL 1.3 6.8 442.6%Kalamazoo, MI 1.6 8.5 429.0%Kent, MI 1.4 7.5 426.2%
NOTE: Population Size > 30,000 and Black Population Percentage > 2%Source: FBI/Uniform Crime Reporting Program Data: Arrests by Age, Sex, and Race and U.S. Census Data
Marijuana Arrests

62 | The War on Marijuana in Black and White
Table 12 is similar to Table 11, but focuses only on larger counties (more than 200,000 people) with the largest increases in racial disparities in marijuana possession arrests since 2001. Three of the larger counties with the greatest increases are in Michigan: Kalamazoo, Kent (includes Grand Rapids), and Wayne (includes Detroit). Other counties on this list include Davidson, TN (includes Nashville), Hennepin, MN (includes Minneapolis), St. Louis City, MO, Philadelphia, PA, Bernalillo, NM (includes Albuquerque), and Milwaukee, WI.
TABLE 12Large Counties with Largest Percent Increases in Racial Disparities inMarijuana Possession Arrest Rates (2001-2010)
Racial Disparity
County-State Times More LikelyBlacks Arrested
(2001)
Times More LikelyBlacks Arrested
(2010)
% Change in RacialDisparity
Kalamazoo, MI 1.6 8.5 429.0%Kent, MI 1.4 7.5 426.2%Davidson, TN 0.8 3.8 355.6%Plymouth, MA 2.4 10.5 346.4%Hennepin, MN 2.1 9.1 328.7%Wayne, MI 0.5 1.9 271.0%St. Louis City, MO 6.1 18.4 201.2%Bernalillo, NM 1.5 3.9 162.0%Chatham, GA 1.3 3.5 157.7%Contra Costa, CA 1.1 2.8 150.2%Dakota, MN 2.3 5.6 145.9%Lorain, OH 1.8 4.4 141.8%Suffolk, MA 2.0 4.8 135.0%Philadelphia, PA 2.1 4.9 134.7%Milwaukee, WI 2.0 4.7 132.5%
NOTE: Population Size > 200,000 and Black Population Percentage > 2%Source: FBI/Uniform Crime Reporting Program Data: Arrests by Age, Sex, and Race and U.S. Census Data
Racial disparities in marijuana possession arrests exist across median household income levels. Blacks are arrested at higher rates than whites for marijuana possession in counties with the highest, middle, and lowest median household income levels (the disparity is greater in the counties with the middle and highest income levels).

| 63
In the 15 counties with the highest median household incomes in the United States, Blacks are two to eight times more likely than whites to be arrested for marijuana possession. In Arlington, VA, for example, where the median household income is $94,880, Blacks are almost eight times more likely to be arrested for marijuana possession than whites. In Delaware, OH (north of Columbus), where the median household income is just under $88,000, Blacks are arrested at almost six times the rate of whites. In Howard, Calvert, and Charles Counties in Maryland, the median household income is between $88,825 and $103,273, and the Black marijuana possession arrest rate is a stunning 837 per 100,000 (compared to the national rate of 253 per 100,000). In Fairfax and Loudoun, VA, where the median household incomes are both over $100,000, Blacks are approximately three times more likely than whites to be arrested for marijuana possession. In Nassau, NY (part of Long Island), the median household income is over $93,000 and Blacks are over 3.5 times more likely than whites to be arrested for marijuana possession. See Figure 18.
0 200 400 600 800 1000 1200 1400 1600
Charles,�MDPutnam,�NYMarin,�CACalvert,�MD
Prince�William,�VAStafford,�VA
Montgomery,�MDNassau,�NYArlington,�VAMorris,�NJ
Somerset,�NJHunterdon,�NJHoward,�MDFairfax,�VALoudoun,�VA
NOTE:�Population�Size�>�30,000�and�Black�Population�Percentage�>�2%Counties�listed�in�descending�order�by�Median�Household�Income.
Source:�FBI/Uniform�Crime�Reporting�Program�Data�and�U.S.�Census�Data
Counties�with�Highest�Median�Household�Incomes�($115,574-$88,825)FIGURE�18
Marijuana Arrests

64 | The War on Marijuana in Black and White
In the counties with the middle median household incomes, see Figure 19, where the household incomes are all in the $45,000 range, Blacks are over three times more likely to be arrested for marijuana possession than whites. In Geary, KS, and Harrison, MS (includes Gulfport and Biloxi), Blacks are almost five times more likely to be arrested. In Davidson, TN (includes Nashville), Ingham, MI (includes Lansing), and Douglas, KS (includes Lawrence), Blacks are over 3.5 times more likely to be arrested.
0 200 400 600 800 1000 1200 1400 1600
Pima,�AZFranklin,�VACarroll,�GAGeary,�KSTulsa,�OK
Davidson,�TNHarrison,�MSGuilford,�NCBoone,�MO
Brunswick,�NCIngham,�MIEctor,�TX
Douglas,�KSLiberty,�TXWayne,�PA
NOTE:�Population�Size�>�30,000�and�Black�Population�Percentage�>�2%Counties�listed�in�descending�order�by�Median�Household�Income.
Source:�FBI/Uniform�Crime�Reporting�Program�Data�and�U.S.�Census�Data
Counties�with�Middle�Median�Household�Incomes�($45,930-$45,521)FIGURE�19
White�Arrest�Rate Black�Arrest�Rate

| 65
Turning to the 15 counties with the lowest median household incomes, see Figure 20, in Scotland, NC, and Adams, MS, where the median household income is below $30,000, Blacks are almost five times more likely to be arrested for marijuana possession than whites. In Washington, LA ($27,797), and Dunklin, MO ($29,375), Blacks are four times more likely. In Dallas (includes Selma) and Pike, AL, both with median household incomes below $30,000 and white populations of 31% and 61%, respectively, the white arrest rate for marijuana possession was 0, while the Black arrest rate was 95 and 115, respectively. In Natchitoches, LA, and Oktibbeha, MS, the median household income is approximately $30,300, and the Black marijuana possession arrest rate is a staggering 1,201 per 100,000.
0 200 400 600 800 1000 1200 1400 1600
Leflore,�MSWilliamsburg,�SC
Bolivar,�MSDallas,�ALDillon,�SCAdams,�MS
Washington,�MSPike,�AL
Scotland,�NCDunklin,�MORobeson,�NC
Danville�City,�VAOktibbeha,�MS
Natchitoches,�LAWashington,�LA
NOTE:�Population�Size�>�30,000�and�Black�Population�Percentage�>�2%Counties�listed�in�descending�order�by�Median�Household�Income.
Source:�FBI/Uniform�Crime�Reporting�Program�Data�and�U.S.�Census�Data
Counties�with�Lowest�Median�Household�Incomes�($30,363-$22,020)FIGURE�20
White�Arrest�Rate Black�Arrest�Rate
Marijuana Arrests

66 | The War on Marijuana in Black and White
C. Blacks and Whites Use Marijuana at Similar RatesDespite the pronounced disparities in arrest rates of whites and Blacks for marijuana possession, rates of marijuana use and non-use between whites and Blacks are roughly equal. Therefore, the wide racial disparities in marijuana possession arrest rates cannot be explained by differences in marijuana usage rates between whites and Blacks.
Among all age groups since 2001, use by Blacks of marijuana in the past 12 months is slightly higher than use by Whites. In 2010, for instance, 14.0% of Blacks and 11.6% of whites reported using marijuana in the past year. In 2009, reported use of marijuana in the past year was 12.4% for Blacks and 11.7% for whites. In 2001, 9.8% of whites and 9.3% of Blacks reported using marijuana over the past year. See Figure 21.
0%
5%
10%
15%
20%
�
2001 2002 2003 2004 2005 2006 2007 2008 2009 2010
Source:�National�Household�Survey�on�Drug�Abuse�and�Health,�2001-2010
Marijuana�Use�by�Race:�Used�Marijuana�in�Past�12�Months�(2001-2010)FIGURE�21
Percent�White�Used Percent�Black�Used
Every year between 2001 and 2010, among 18- to 25-year-olds — a group with higher arrest rates generally than other age brackets — more whites than Blacks had used marijuana in the previous 12 months. In 2010, for instance, among 18- to 25-year-olds, 33.4% of whites and 27.6% of Blacks reported using marijuana in the past year. See Figure 22.
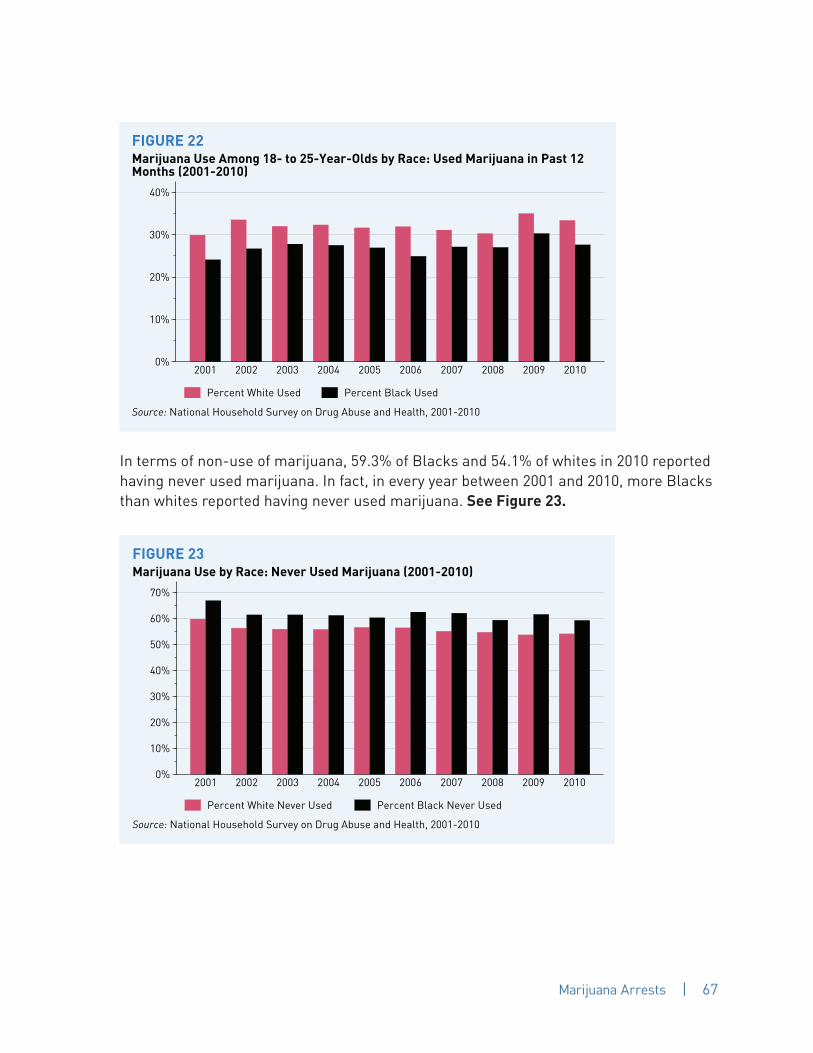
| 67
0%
10%
20%
30%
40%
�
2001 2002 2003 2004 2005 2006 2007 2008 2009 2010
Source:�National�Household�Survey�on�Drug�Abuse�and�Health,�2001-2010
Marijuana�Use�Among�18-�to�25-Year-Olds�by�Race:�Used�Marijuana�in�Past�12Months�(2001-2010)
FIGURE�22
Percent�White�Used Percent�Black�Used
In terms of non-use of marijuana, 59.3% of Blacks and 54.1% of whites in 2010 reported having never used marijuana. In fact, in every year between 2001 and 2010, more Blacks than whites reported having never used marijuana. See Figure 23.
0%
10%
20%
30%
40%
50%
60%
70%
�
2001 2002 2003 2004 2005 2006 2007 2008 2009 2010
Source:�National�Household�Survey�on�Drug�Abuse�and�Health,�2001-2010
Marijuana�Use�by�Race:�Never�Used�Marijuana�(2001-2010)FIGURE�23
Percent�White�Never�Used Percent�Black�Never�Used
Marijuana Arrests

68 | The War on Marijuana in Black and White
V. FISCAL COST ANALYSIS
This section calculates three estimates of the annual fiscal costs of marijuana possession arrests in the United States, denoted as: (1) Low Estimate, (2) Middle Estimate, and (3) High Estimate. For the reasons provided below, we believe that the Middle Estimate is the best estimate of the true annual fiscal cost of marijuana possession enforcement.43
It should be noted that the economic analyses of the fiscal cost of marijuana possession enforcement in this report are almost certainly conservative estimates, to the extent that we do not include downstream factors in our analysis (e.g., additional costs incurred beyond the justice system, such as reduction in labor force, reduction in tax revenue, educational disparities leading to under-employment in already economically depressed neighborhoods, and so forth). Rather, the report focuses only on direct enforcement costs.
A. Estimates
i . High Estimate
To calculate the High Estimate, this report largely follows the methodology employed by Professor Jeffrey A. Miron in his analysis of the fiscal impact of decriminalization.44 Professor Miron’s basic approach consists of prorating historical criminal justice system
43 As an initial matter, all three estimates represent a summation of 2010 expenditures, and are not the products of an empirical comparison of jurisdictions where marijuana possession is legal with jurisdictions where marijuana possession is illegal. See, e.g., Jerome Adda, Brendon McConnell & Imran Rasul, Crime and the Depenalization of Cannabis Possession: Evidence from a Policing Experiment 15 (Working Paper, 2011), available at http://www.ucl.ac.uk/~uctpimr/research/depenalization.pdf. Moreover, although some criminologists have suggested that reducing the number of marijuana possession arrests may not reduce total fiscal expenditures (e.g., due to the redirection of resources from marijuana possession enforcement to other lower-level offenses, such as traffic violations, trespassing, loitering, etc.), such policy choices are separate from a determination of what is presently spent by state and local governments on marijuana possession enforcement in this country. This prorating approach plays an important role in the policy discussions surrounding marijuana legalization, and this section continues that tradition. In addition, it is important to note that the estimates provided in this section consider only the budgetary or fiscal impact of enforcing criminal laws or statutes prohibiting marijuana possession, and do not in any way seek to account for the broader costs and benefits to society that would follow were state and local agencies to put these resources to other uses, nor do the estimates contemplate the positive fiscal impact of tax revenues generated by wholesale legalization or commercialization. Further, no consideration is made for the indirect effects of legalization, such as any cross-substitution effects of marijuana legalization (i.e., reduction in consumption demand for other goods such as alcohol or cigarettes, arising from changes in the availability of marijuana), primarily because such effects are extremely difficult to quantify or measure with any accuracy or precision. See, e.g., JONATHAN P. CAULKINS, ANGELA HAWKEN, BEAU KILMER & MARK A. R. KLEIMAN, MARIJUANA LEGALIZATION: WHAT EVERYONE NEEDS TO KNOW 133-34 (2012) (noting that if the cross-price elasticity between alcohol and marijuana consumption is even just slightly negative, then the costs of increased marijuana use resulting from decriminalization may be offset by the benefits flowing from a corresponding decrease in alcohol abuse and dependence, which impose far greater costs upon society).44 See MIRON & WALDOCK, BUDGETARY IMPACT, supra note 23, at 1; JEFFREY A. MIRON, MARIJUANA POLICY PROJECT, THE BUDGETARY IMPLICATIONS OF MARIJUANA PROHIBITION (2005) [hereinafter MIRON, BUDGETARY IMPLICATIONS], available at http://www.prohibitioncosts.org/mironreport/; see generally Jeffrey A. Miron & Jeffrey Zweibel, The Economic Case Against Drug Prohibition, 9 J. ECON. PERSP. 175 (1995).

| 69
expenditures, where these expenditures are broken down into three distinct components: (1) police expenditures, (2) judicial and legal services expenditures, and (3) corrections expenditures.45
To start, the fiscal cost of police expenditures on marijuana possession arrests is estimated as the total budget for policing services multiplied by the percentage share of total arrests accounted for by marijuana possession.46 An adjustment is made, however, for the fact that some marijuana possession arrests are made incidental to other enforcement actions. Specifically, as described in the Methodology section, individuals can be arrested for multiple offenses as a consequence of a single enforcement action. For example, if the police arrest an individual for a traffic violation and a small amount of marijuana is subsequently found within the vehicle, then the enforcement action is generally coded as both a marijuana possession arrest and a traffic violation, even if the police would have taken the enforcement action were marijuana possession legal. To adjust for this, following Professor Miron, this report assumes for all fiscal cost estimates that only 50% of all marijuana possession offenses are “stand-alone” offenses such that the total number of marijuana possession arrests is equal to 50% of the total number of recorded arrests for marijuana possession.47
To calculate the adjudication costs of arrests for marijuana possession, Professor Miron multiplies the total judicial and legal expenditures by the percentage of marijuana-related proceedings in state courts resulting in felony convictions, using, in particular, a national fraction of 10.9% because state-level data are not available.48 This report estimates adjudication costs slightly differently. Available state data suggest that marijuana possession’s percentage share of total state cases is approximately two times as large as the percentage share of total arrests accounted for by marijuana possession. Thus, to calculate the adjudication costs of arrests for marijuana possession, this report
45 This methodology has been used in a number of reports examining the fiscal impact of marijuana decriminalization. See e.g., JON B. GETTMAN, NAT’L ORG. FOR THE REFORM OF MARIJUANA L., CRIMES OF INDISCRETION: THE NATURE, EXTENT, AND COSTS OF MARIJUANA ARRESTS IN THE
UNITED STATES (2004), available at http://norml.org/pdf_files/NORML_Crimes_of_Indiscretion.pdf; Ryan King & Marc Mauer, The War on Marijuana: The Transformation of the War on Drugs in the 1990s, 3 HARM REDUCT. J. 6 (2006), available at http://www.ncbi.nlm.nih.gov/pmc/articles/PMC1420279/. A proportionate cost model has also been adopted by the federal Office of National Drug Control Policy on theEconomic Costs of Drug Abuse. See generally OFFICE OF NAT’L DRUG CONTROL POL’Y, THE ECONOMIC COSTS OF DRUG ABUSE IN THE UNITED STATES, 1992-2002 (2004), available at https://www.ncjrs.gov/ondcppubs/publications/pdf/economic_costs.pdf.46 There at two concerns here. First, not all arrests are equally burdensome on police (e.g., some arrests may require greaterinvestigative effort). Miron’s methodology assumes that average costs equal marginal costs, which implies that law enforcement is aconstant cost industry (i.e., that increased dollars spent on law enforcement result in approximately the same increase in the number ofarrests). Second, police do more than simply arrest individuals (i.e., there is evidence that only one-third of enforcement expenditure isproperly allocated to arrests). This concern is mitigated to some extent by the fact that the costs of other non-enforcement activities arerelatively low compared to the overall costs of enforcement.47 See MIRON, BUDGETARY IMPLICATIONS, supra note 44, at 6 (“There are few hard data on the fraction of ‘stand alone’ possession arrests,but the information in Miron (2002) and Reuter, Hirshfield and Davies (2001) suggests it is between 33% and 85%.”). In our view, the 50%figure likely underestimates the total number of arrests for marijuana possession.48 There are at least three concerns here: (1) not all convictions are equally burdensome on the judiciary (e.g., felony offensesconsume more judicial resources than misdemeanor offenses); (2) most marijuana charges are classified as misdemeanors or lower;and (3) the judiciary is responsible for more than simply adjudicating criminal cases.
Fiscal Costs Analysis

70 | The War on Marijuana in Black and White
multiplies the total judicial and legal expenditures by two times marijuana possession arrests’ percentage share of total arrests.49
Finally, to estimate the corrections costs associated with marijuana possession convictions, fiscal expenditures on local jail and county correctional facilities (but not state prison facilities) are multiplied by the ratio of stand-alone arrests for marijuana possession arrests to total arrests.50 In his analysis, Professor Miron estimates corrections costs as equal to 1% of total corrections expenditures, including state prison facilities, where 1% corresponds to the weighted average of the proportion of prisoners incarcerated on marijuana charges in five states.51 Our departure from Professor Miron’s methodology is motivated by the fact that the aim of this fiscal cost analysis is to provide an estimate of marijuana possession offenses only, and not of all marijuana offenses.
Specifically, our fiscal analysis does not consider offenses for the sale and/or manufacture of marijuana that are more likely to result in a felony charge and, in turn, to constitute the majority of the estimated 1% of the prison population serving time solely on a marijuana charge.52 To account for this difference, our fiscal analysis ignores entirely all fiscal spending on state correctional facilities and considers only fiscal expenditures on local jail and county correctional facilities and other services.53
In our view, Professor Miron’s approach yields a plausible upper bound on the annual fiscal costs of marijuana possession enforcement for the country as a whole. In
49 The factor of two is consistent with other studies that examine state-level data. See, e.g., STIFFLER, supra note 20, at 9. Notethat because under Miron’s approach only 50% of all marijuana possession arrests are considered “stand-alone,” this calculation isequivalent to simply multiplying marijuana possession’s percentage share of total arrests by total judicial and legal expenditures.50 Here, “local jail and county correctional facilities” corresponds to confinement in a local correctional facility while pending trial,awaiting sentencing, serving a sentence of less than one year, or awaiting transfer to other facilities after conviction. “Prison facilities,”by contrast, corresponds to confinement in a state correctional facility to serve a sentence of more than one year, but this varies incertain jurisdictions. Six states have unified prison systems, meaning that there is an integrated state-level prison and jail system:Alaska, Connecticut, Delaware, Hawaii, Rhode Island, and Vermont. For these six states, the local correction expenditure was calculatedas 30% of total reported corrections expenditures. The 30% number is calculated as local correction expenditure’s percentage share oftotal correction expenditure averaged over the remaining 44 states with non-unified prison systems.51 The five states are California, Georgia, Massachusetts, Michigan, and New Hampshire. See MIRON, BUDGETARY IMPLICATIONS, supra note 44, at tbl.A1.52 According to the National Center on Addiction & Substance Abuse at Columbia University, less than 1% of all individualsincarcerated in federal and state prisoners in the United States are incarcerated for marijuana possession as their sole offense. See BEHIND BARS II, supra note 8, at 2 & 14.53 Thus, our analysis will not reflect the dramatic rate at which corrections expenditures, as a percentage of overall state budgets,have been increasing nationwide since the late 1980s, often at the expense of other crucial state services, such as public educationand infrastructure. See generally PEW CTR. ON THE STATES, ONE IN 31: THE LONG REACH OF AMERICAN CORRECTIONS 11 (2009), available at http://www.pewstates.org/research/reports/one-in-31-85899371887 (reporting that overall state spending on corrections increased from$11 billion in 1988 to $52 billion in 2008); CHRISTIAN HENRICHSON & RUTH DELANEY, VERA INST. OF JUST., THE PRICE OF PRISONS: WHAT INCARCERATION
COSTS TAXPAYERS 6, 8 (2012), available at http://www.vera.org/pubs/price-prisons-what-incarceration-costs-taxpayers (highlightingthat in some states a significant proportion of incarceration costs is found in other areas of the state budget, such as the “centraladministrative funds” or “central account” and stating that the true total taxpayer cost of incarceration is more realistically equal to $77billion annually); see also INIMAI CHETTIAR, WILL BUNTING & GEOFF SCHOTTER, ACLU, AT AMERICA’S EXPENSE: THE MASS INCARCERATION OF THE ELDERLY v& vii (2012), available at http://www.aclu.org/criminal-law-reform/americas-expense-mass-incarceration-elderly (follow “At America’sExpense” hyperlink, then follow “Read or Download the Report” hyperlink) (finding that approximately 16% of the national prisonpopulation is 50 and older and that it costs $68,270 per year to house these elderly prisoners).
| 71
particular, using a modified proportionate cost methodology, the High Estimate of the annual fiscal costs of marijuana possession arrests in the United States is calculated as: $6.032 billion.
ii. Low Estimate
To calculate the Low Estimate of the annual fiscal costs of marijuana possession arrests in the United States, rather than pursue the top-down, aggregate expenditures approach developed by Professor Miron, where fiscal expenditures are prorated in proportion to the total number of arrests, the report adopts a conceptually straightforward unit cost approach in which the unit cost per marijuana possession arrest is multiplied by the total number of such arrests.54 Unfortunately, at present, the data required to calculate precisely the unit cost of a marijuana possession arrest on a state-by-state basis is not available.55
A number of researchers and policy analysts, however, have examined police and adjudication expenses in smaller, isolated jurisdictions, and while these unit cost estimates vary, with costs generally increasing over time, there is considerable agreement that the minimal unit fiscal cost of a misdemeanor arrest ranges from $1,000 to $2,000. Specifically, the present report borrows unit cost estimates from what is perhaps the most often cited and highly respected study of the fiscal costs of arrests and prosecutions, published in 2001 by the Washington State Institute for Public Policy (WSIPP).56 It is important to note, however, that the estimates derived by the WSIPP are specific to Washington state and may not translate reliably to other states. Moreover, the WSIPP estimates reflect the policing cost of a misdemeanor arrest rather than the policing cost of a marijuana possession arrest more specifically, although there is little reason to think that these two costs should differ significantly. Like the High Estimate, the Low Estimate is calculated as the sum of the following criminal justice system expenditures: (1) police expenditures, (2) judicial and legal services expenditures, and (3) corrections expenditures.
54 This alternative methodology has been used in a number of reports investigating the fiscal costs of marijuana enforcementand prohibition. See, e.g., HARRY LEVINE, JON GETTMAN & LOREN SIEGEL, MARIJUANA ARREST RESEARCH PROJECT, 240,000 MARIJUANA ARRESTS: COSTS, CONSEQUENCES, AND RACIAL DISPARITIES OF POSSESSION ARRESTS IN WASHINGTON, 1986-2010 6 (2012) [hereinafter LEVINE, GETTMAN & SIEGEL], available at http://marijuana-arrests.com/docs/240,000-Marijuana-Arrests-In-Washington.pdf; Jonathan P. Caulkins, Cost of Marijuana Prohibition on the California Criminal Justice System (RAND Drug Pol’y Res. Ctr., Working Paper, July 2010) [hereinafter Caulkins, Marijuana Prohibition], available at http://www.rand.org/content/dam/rand/pubs/working_papers/2010/RAND_WR763.pdf; see also BECKETT & HERBERT, supra note 11.55 See LEVINE, GETTMAN & SIEGEL, supra note 54.56 See STEVE AOS, POLLY PHIPPS, ROBERT BARNOSKI & ROXANNE LIEB, WASH. STATE INST. FOR PUB. POL’Y, THE COMPARATIVE COSTS AND BENEFITS OF
PROGRAMS TO REDUCE CRIME (2001) [hereinafter 2001 WSIPP REPORT], available at http://www.wsipp.wa.gov/rptfiles/costbenefit.pdf.
Fiscal Costs Analysis

72 | The War on Marijuana in Black and White
On the basis of the WSIPP 2001 Report, as well as other comparable studies and fiscal impact analyses, this report conservatively estimates the operating per unit cost of policing marijuana possession as: $750/arrest.57
Next, the average annual cost per arrest made in Washington was approximately $5,518 in 2010, and is calculated by dividing Washington’s total expenditures on policing (including capital expenditures) by the total number of arrests made in 2010.58 If the operating per unit cost of policing marijuana possession is $750/arrest in 2010, then the operating per unit cost of a marijuana possession arrest is approximately 13.6% (= 750/5,518) of the average annual cost per arrests.59 Thus, to estimate the annual operating per unit cost of policing marijuana possession in a given state in 2010, the average annual cost per arrest is first calculated. This number is then multiplied by approximately 13.6% to obtain the estimated operating per unit policing cost of a marijuana possession arrest for that state. Estimated total annual police expenditures by the state on marijuana possession arrests in 2010 are calculated by multiplying this number times the total number of marijuana possession arrests made in 2010, as reported to the FBI/UCR Program.
The annual costs of adjudicating marijuana possession arrests (i.e., judicial and legal services expenditures) are derived in a similar manner. Specifically, on the basis of the WSIPP 2001 Report, as well as other relevant studies and fiscal impact analyses, our report conservatively estimates the operating per unit cost of adjudicating a marijuana possession offense, which is assumed to include court costs, as well as the fiscal costs
57 The 2001 WSIPP Report calculated the operating per unit policing cost of a misdemeanor arrest as $764/arrest in 1995 dollars(or, equivalently, as $1,079/arrest in 2010 dollars). See 2001 WSIPP REPORT, supra note 56, at 82. By contrast, a lesser-known, morerecent 2006 study also published by the WSIPP, using a slightly different model, calculated the operating per unit policing cost of amisdemeanor arrest as $305/arrest in 1995 dollars (or, equivalently, as $351/arrest in 2010 dollars). See STEVE AOS, MARNA MILLER & ELIZABETH DRAKE, WASH. STATE INST. FOR PUB. POL’Y, EVIDENCE-BASED PUBLIC POLICY OPTIONS TO REDUCE FUTURE PRISON CONSTRUCTION, CRIMINAL JUSTICE
COSTS, AND CRIME RATES (2006), [hereafter 2006 WSIPP REPORT],available at http://www.wsipp.wa.gov/pub.asp?docid=06-10-1201. Althoughthe two studies arrive at different estimates regarding per unit policing costs, they reach similar estimates regarding total per unitcriminal justice expenditures with respect to misdemeanor arrests. See infra text accompanying note 60 (explaining that the 2006study arrived at higher estimates than the 2001 study regarding the per unit adjudication costs). This report relies more heavily on theestimates of the 2001 study due to its greater prominence in the field.58 “Capital expenditures” include construction costs; equipment, such as vehicles, furnishings, and computers; and other capitalcosts, such as the purchase of land.59 In other words, the report estimates that the marginal cost of a marijuana possession arrest is equal to 13.6% of the average costof all arrests made.

| 73
of both defense and prosecution, as: $400/disposition sought on a marijuana possession arrest.60
Next, in Washington, the average annual cost per court case was approximately $6,985 in 2010, and is calculated by dividing Washington’s total expenditures on judicial and legal services (including capital expenditures) by the total number of court cases in 2010. The operating per unit adjudication cost of a disposition sought for a marijuana possession arrest is, therefore, approximately 5.7% (= 400/6,985) of the average annual cost per court case. Thus, to estimate the annual operating per unit adjudication cost of a disposition sought on a marijuana possession arrest in a given state, the average annual cost per court case is calculated and multiplied by approximately 5.7%. Estimated annual legal and judicial expenditures by the state on marijuana possession arrests in 2010 are then calculated by multiplying this estimated operating per unit adjudication cost of a disposition sought for a marijuana possession arrest times the total number of dispositions sought on marijuana possession arrests in the state in 2010, where, based on limited available state-level data, the report assumes that, on average, dispositions are sought on 90% of all arrests for marijuana possession.61
Finally, the annual corrections costs associated with marijuana possession enforcement are estimated as (1) the number of individuals in local jail or county correctional facilities for a marijuana possession offense multiplied by the average state-level per diem costs of jail/county correctional facilities, plus (2) the number of individuals on local or community supervision for a marijuana possession offense multiplied by the average per diem cost of such supervision.62 Unfortunately, well-known data limitations complicate the derivation of the number of individuals in jail or on local supervision as a result of a
60 The 2001 WSIPP Report calculated the operating per unit adjudication cost of a misdemeanor arrest as $336/conviction in1995 dollars (or, equivalently, as $475/conviction in 2010 dollars), where, notably, the estimate does not include defense costs. See2001 WSIPP REPORT, supra note 56, at 83. The 2006 WSIPP Report calculated the operating per unit adjudication cost of misdemeanorsas $593/conviction (or, equivalently, as $603/conviction in 2010 dollars), again not including defense costs. See 2006 WSIPP REPORT,supra note 57, at 41. Other studies have derived similar estimates in slightly different contexts. Using data from several jurisdictions,Mark Cohen calculated combined police and court costs to be about $2,000 for a rape arrest, $1,100 for a robbery arrest, andapproximately $1,200 for an aggravated assault arrest, measured in 1987 dollars. See Mark A. Cohen, Nat’l Inst. of Just., Measuring the Costs and Benefits of Crime and Justice, in MEASUREMENT AND ANALYSIS OF CRIME AND JUSTICE 263, 297 (2000), available at http://www.smartpolicinginitiative.com/sites/all/files/Measuring%20the%20Costs%20and%20Benefits%20of%20Crime%20and%20Justice.pdf. Evaluating mandatory sentencing costs in California, Greenwood and others estimated $624 in police costs and $1,300 in totalcosts per arrest, measured in 1993 dollars. See PETER W. GREENWOOD ET AL., RAND CORP., THREE STRIKES AND YOU’RE OUT: ESTIMATED BENEFITS
AND COSTS OF CALIFORNIA’S NEW MANDATORY SENTENCING LAW 15, tbl.3.1 (1994), available at http://www.rand.org/content/dam/rand/pubs/monograph_reports/2006/MR509.pdf. The National Juvenile Justice Network has developed a useful toolkit to calculate the approximatecost of an arrest in a local jurisdiction. See generally JULIUS C. CHAIDEZ, NAT’L JUV. JUST. NETWORK, HOW TO CALCULATE THE COST OF A YOUTH ARREST
(2012), available at http://www.njjn.org/uploads/digital-library/NJJN-Arrest-Costing-Toolkit-FINAL-Nov12.pdf.61 See Caulkins, Marijuana Prohibition, supra note 54, at 9 (“For most but not all marijuana arrests a ‘complaint was sought’ asopposed to simply releasing the person or transferring them to another agency.”).62 “Local or community supervision” is an alternative to incarceration, defined as a court-ordered period of correctional supervisionin the community.
Fiscal Costs Analysis

74 | The War on Marijuana in Black and White
marijuana possession conviction.63 In response to these data limitations, two simplifying assumptions are made, both of which are informed by data that are available for specific local jurisdictions: (1) the average conviction rate in cases where a disposition is sought on an arrest for marijuana possession is 0.3 or 30%;64 and (2) the average time spent in local jail or county correctional facilities on a marijuana possession conviction is 5.5 days, with an additional 74.5 days spent on local or community supervision.65
Based on a review of other studies examining the fiscal impact of mass incarceration, this report estimates the average per diem cost of local or community supervision as $2/day for all 50 states, as well as the District of Columbia.66 In addition, the report calculates the average per diem jail cost on a state-by-state basis using publicly available data on the total jail population, coupled with the corrections expenditure data for jail and county correctional facilities used to calculate the High Estimate.67 Specifically, the report estimates the national average per diem jail cost as approximately $95/day.
Using these estimates, the average corrections cost of a marijuana possession conviction in the United States is calculated as $672 (= $95*5.5 + $2*74.5), where the first term corresponds to estimated average jail costs and the second term corresponds to estimated average local or community supervision costs. The estimated annual corrections cost of marijuana possession enforcement in the United States is readily obtained by multiplying the average corrections cost, $672, by the estimated total number of convictions for marijuana possession offenses, recalling that 27% (= 0.9*0.3) of all arrests for marijuana possession offenses are assumed to result in a conviction.
63 See Caulkins, Marijuana Prohibition, supra note 54, at 9-12; Peter Reuter, Paul Hirschfield & Curt Davies, Assessing the Crack-Down on Marijuana in Maryland 37 (Abell Found., Working Paper, May 2001), available at http://www.abell.org/pubsitems/hhs_assessing_crackdown_501.pdf (“It proved exceedingly difficult to obtain data on the number of admissions to jail for specific offenses.”).64 See, e.g., LAWRENCE W. BOYD, DRUG POL’Y ACTION GROUP, THE BUDGETARY IMPLICATIONS OF MARIJUANA DECRIMINALIZATION AND LEGALIZATION IN HAWAI’I 7 (2005), available at http://www.dpfhi.org/A_PDF/Budgetary_Implications_Marijuana_Decrim.pdf (“Approximately 65% [of misdemeanor drug cases] are dismissed, not prosecuted, or stricken … and a relatively small proportion, about 25%, results in conviction.”); see generally DAVID C. NIXON, DRUG POL’Y ACTION GROUP, UPDATE TO: BUDGETARY IMPLICATIONS OF MARIJUANA DECRIMINALIZATION AND LEGALIZATION IN HAWAI’I (2013), available at http://acluhawaii.files.wordpress.com/2013/01/econreptmarijuana1_2013.pdf (updating Boyd (2005) using data through 2011 and demonstrating that Hawaii’s enforcement of marijuana possession laws has jumped significantly over the past half-decade); see also SANDRA NORMAN-EADY, CONN. G. ASSEMB., OFFICE OF LEGIS. RESEARCH, MARIJUANA CRIMES AND STATISTICS tbl.3 (2008), available at http://www.cga.ct.gov/2008/rpt/2008-r-0455.htm (reporting conviction rates for possession or control of any quantity of any controlled substance, other than a narcotic substance or a hallucinogenic substance other than marijuana, or less than four ounces of marijuana (CGS § 21a-279 (c)), ranging from 33.1% to 36.4% over the period of 2002-2007).65 See, e.g., Local Government Fiscal Note 1550 HB at 4 (“According to the AOC [Administrative Office of the Courts] 2009 misdemeanor convictions table the average jail sentence for possession of marijuana for less than 40 grams was 82.7 days, with all but 4.4 days suspended.”); see also BECKETT & HERBERT, supra note 11, at 29 (“The average misdemeanant spends 5.8 days in jail at a cost of $89 per day”). The U.S. Department of Justice reports that 80% of all defendants charged with felony drug possession crime are released within one week of their booking into the jail. Moreover, as Professor Austin notes, “[w]hile the length of stay may be short, the booking process is one of the most expensive and dangerous operations in a jail.” JAMES AUSTIN, JFA INST., NAT’L ORG. FOR THE REFORM OF MARIJUANA LAWS 8-9 (2005), available at http://norml.org/pdf_files/NORML_Rethinking_Decriminalizing_Marijuana.pdf.66 See, e.g., LEGISLATIVE BUDGET BOARD, CRIMINAL JUSTICE UNIFORM COST REPORT, FISCAL YEARS 2008-2010 11 (Jan. 2011) (calculating a $2.92 per diem total cost of community supervision); see also RAM SUBRAMANIAN & REBECCA TUBLITZ, VERA INST. FOR JUST., REALIGNING JUSTICE RESOURCES: A REVIEW OF POPULATION AND SPENDING SHIFTS IN PRISON AND COMMUNITY CORRECTIONS (2012), available at http://www.vera.org/files/Full%20Report.pdf.67 See JAMES J. STEPHAN & GEORGETTE WALSH, U.S. DEP’T OF JUST., BUREAU OF JUST. STAT., CENSUS FOR JAIL FACILITIES, 2006 (2011).

| 75
The Low Estimate represents, in our view, a plausible lower bound on the annual fiscal costs of marijuana possession arrests for the country as a whole that is generally supported by other fiscal impact studies focusing solely on marijuana-related costs in smaller jurisdictions. The Low Estimate is calculated as the sum of the estimated annual fiscal expenditures on policing, adjudication, and corrections, and is equal to: $1.196 billion.
iii. Middle Estimate
The Middle Estimate is simply calculated as the average of the Low and High Estimates. The Middle Estimate represents this report’s best estimate of the true annual fiscal costs of marijuana possession enforcement in the United States, and is equal to: $3.614 billion.
The Middle Estimate is depicted graphically in Figure 24, along with the Low and High Estimates for comparison.
1,195,656,830
3,613,969,792
6,032,282,773
$1�Billion
$2�Billion
$3�Billion
$4�Billion
$5�Billion
$6�Billion
$7�Billion
Low�Estimate Middle�Estimate High�EstimateSource:�ACLU�Nationwide�Fiscal�Impact�Analysis�(2013)
Estimated�Annual�Fiscal�Costs�of�Marijuana�Possession�Enforcement�in�U.S.�(2010)FIGURE�24
Fiscal Costs Analysis

76 | The War on Marijuana in Black and White
Appendix A, Table A7 further reports the Low, Middle, and High Estimates on a state-by-state basis.68
Table 13 breaks down the Middle Estimate, which is the report’s best estimate of the true fiscal cost of marijuana possession enforcement by state in terms of (1) police expenditures, (2) judicial and legal expenditures, and (3) corrections expenditures.
Police and judicial/legal expenditures constitute the bulk of the fiscal cost of marijuana possession enforcement in each state. New York, for example, spent $574.5 million on police and judicial/legal services combined on marijuana possession arrests; California spent $425.5 million. Moreover, note that for each state, expenditures are not proportionate across the three fiscal spending categories, because the relative amount spent, in total, on each of these three categories of criminal justice expenditures varies by state; and the Middle Estimate is a function of these total expenditure amounts. The ratio of police expenditures to judicial/legal services, for example, in Hawaii, Alaska, and Kentucky is approximately equal to one. In North Carolina, Illinois, and Florida, by contrast, this same ratio is approximately equal to three (i.e., in 2010, each of these states spent approximately three times more on police than on judicial/legal services). Finally, even when ignoring entirely all fiscal spending on state prison facilities, corrections expenditures associated with marijuana possession enforcement are not trivial; California, Florida, Illinois, New York, and Texas, for example, each spent more than an estimated $20 million of state taxpayer money in 2010 housing individuals in local jails and county correctional facilities for possession of marijuana, with California spending more than $65 million and New York more than $103 million.
68 Note that our fiscal cost estimates are less variable than would be the case if conviction rates and jail sentences imposed formarijuana possession offenses (which are held constant in our fiscal analysis) were allowed to vary across all 50 states, as well asthe District of Columbia. The same holds true with respect to marijuana possession’s percentage share of all arrests (as well as itspercentage share of all court cases), variables that, as this report finds, vary across all 50 states, as well as the District of Columbia, butwhich the report holds constant for the purposes of our fiscal cost estimates.

| 77
TABLE 13Annual Fiscal Cost of Marijuana Possession Enforcement by State (2010)
Fiscal Expenditures by Category (in dollars)
State Police Judicial & Legal Corrections
Alabama 7,102,974 4,923,779 1,260,020Alaska 3,120,335 4,506,208 839,758Arizona 39,842,768 32,130,460 13,849,007Arkansas 6,900,048 4,580,166 1,714,300California 209,655,536 215,907,232 65,403,300Colorado 19,667,502 14,307,992 3,731,071Connecticut 20,631,726 24,825,234 4,369,251Delaware 6,088,890 5,565,111 1,580,180D.C. 17,931,502 6,340,831 2,255,385Florida 125,627,288 71,162,936 31,845,628Georgia 58,312,112 44,361,480 19,224,558Hawaii 2,954,338 4,629,526 565,083Idaho 5,520,933 4,861,350 1,502,169Illinois 126,770,856 72,313,504 22,347,420Indiana 19,019,174 13,862,287 5,599,443Iowa 10,476,821 9,821,206 2,547,612Kansas 10,312,387 7,521,286 2,349,114Kentucky 7,621,554 9,503,561 2,374,654Louisiana 20,820,868 18,037,214 7,592,286Maine 4,000,067 3,032,438 1,836,459Maryland 55,304,360 39,281,380 12,117,049Massachusetts 4,637,007 4,149,921 540,723Michigan 47,342,472 34,981,716 12,514,604Minnesota 21,132,200 15,231,101 5,707,988Mississippi 8,740,758 5,558,722 2,441,293Missouri 27,934,658 17,447,384 3,737,572Montana 2,742,488 2,853,947 565,431Nebraska 10,279,377 8,601,595 3,928,298Nevada 20,225,352 14,261,103 7,115,149New Hampshire 2,990,006 2,369,232 1,167,126New Jersey 59,824,356 50,239,964 17,279,192New Mexico 4,892,209 4,781,376 1,405,865New York 312,838,848 261,724,896 103,886,848North Carolina 29,278,582 17,512,486 8,143,603North Dakota 1,765,464 1,569,460 387,127Ohio 58,318,516 54,232,980 7,596,568Oklahoma 16,548,724 12,085,168 2,196,012Oregon 22,916,122 16,259,286 11,018,617Pennsylvania 42,185,656 40,449,756 18,113,114Rhode Island 6,530,830 4,199,064 1,121,471South Carolina 25,775,858 16,244,107 7,520,674South Dakota 2,603,931 2,131,037 816,961Tennessee 21,680,354 15,870,712 5,397,755Texas 126,051,984 85,102,288 40,494,536Utah 6,179,560 5,739,280 2,151,927Vermont 2,355,988 1,995,941 536,010Virginia 33,484,050 23,272,156 10,488,655Washington 14,677,699 14,653,145 5,295,467West Virginia 8,297,871 8,185,582 891,896Wisconsin 22,896,670 14,583,442 6,885,944Wyoming 4,347,580 3,438,789 1,361,657United States 1,747,157,206 1,371,200,815 495,611,826
Source: FBI/Uniform Crime Reporting Program Data, 2010, and Criminal Justice Expenditure and EmploymentExtracts Program (CJEE), 2009
Fiscal Costs Analysis
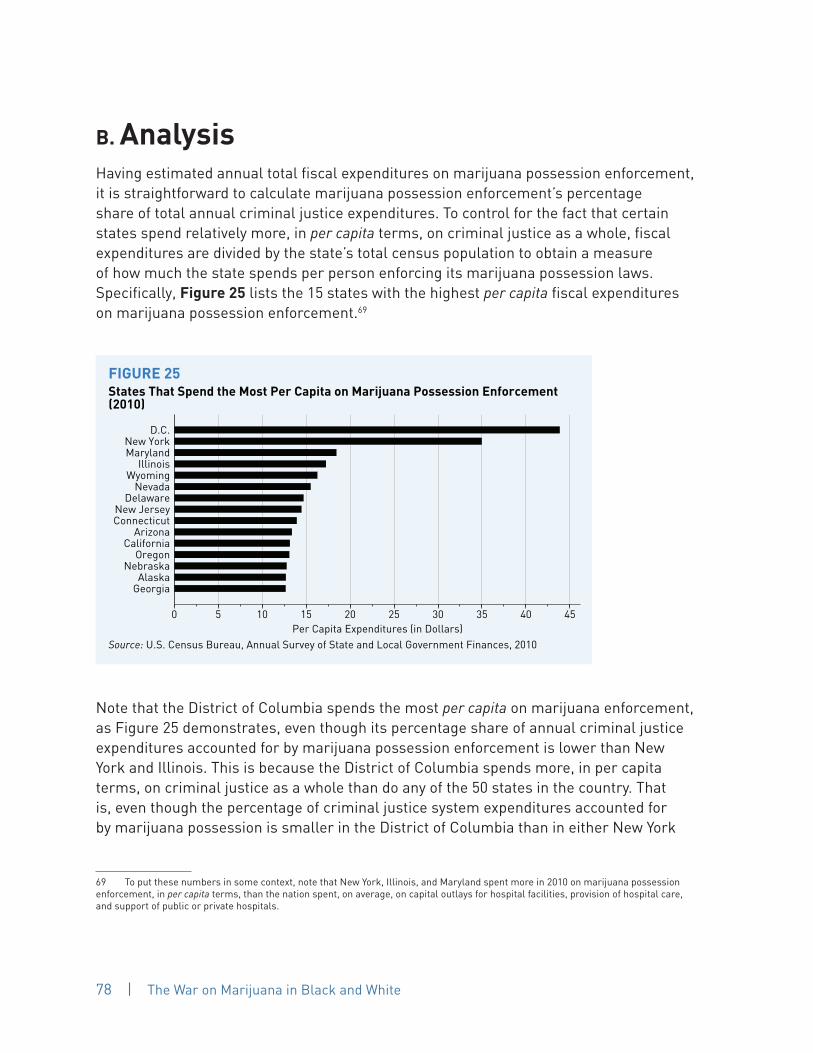
78 | The War on Marijuana in Black and White
B. AnalysisHaving estimated annual total fiscal expenditures on marijuana possession enforcement, it is straightforward to calculate marijuana possession enforcement’s percentage share of total annual criminal justice expenditures. To control for the fact that certain states spend relatively more, in per capita terms, on criminal justice as a whole, fiscal expenditures are divided by the state’s total census population to obtain a measure of how much the state spends per person enforcing its marijuana possession laws. Specifically, Figure 25 lists the 15 states with the highest per capita fiscal expenditures on marijuana possession enforcement.69
0 5 10 15 20 25 30 35 40 45Per�Capita�Expenditures�(in�Dollars)
GeorgiaAlaska
NebraskaOregon
CaliforniaArizona
ConnecticutNew�JerseyDelawareNevadaWyomingIllinois
MarylandNew�York
D.C.
Source:�U.S.�Census�Bureau,�Annual�Survey�of�State�and�Local�Government�Finances,�2010
States�That�Spend�the�Most�Per�Capita�on�Marijuana�Possession�Enforcement(2010)
FIGURE�25
Note that the District of Columbia spends the most per capita on marijuana enforcement, as Figure 25 demonstrates, even though its percentage share of annual criminal justice expenditures accounted for by marijuana possession enforcement is lower than New York and Illinois. This is because the District of Columbia spends more, in per capita terms, on criminal justice as a whole than do any of the 50 states in the country. That is, even though the percentage of criminal justice system expenditures accounted for by marijuana possession is smaller in the District of Columbia than in either New York
69 To put these numbers in some context, note that New York, Illinois, and Maryland spent more in 2010 on marijuana possessionenforcement, in per capita terms, than the nation spent, on average, on capital outlays for hospital facilities, provision of hospital care,and support of public or private hospitals.

| 79
or Illinois, because the District of Columbia spends sufficiently more per capita on its criminal justice system as a whole than does either New York or Illinois, the smaller percentage share spent on marijuana enforcement still translates into relatively larger per capita expenditures on marijuana enforcement (as compared to New York and Illinois). The same is true of California, Nevada, and Wyoming, states that all spend more than $900 per capita on criminal justice and are among those with the highest per capita fiscal expenditures on marijuana possession enforcement, but none of which are in the top 10 in terms of the percentage share of criminal justice system expenditures accounted for by marijuana possession enforcement.
Fiscal Costs Analysis

80 | The War on Marijuana in Black and White
PROFILE
nick Smith, 31Austin, TX
Every weekday morning for the last three years, Nick Smith has left his house at 7:15 a.m. He catches a bus that takes him to work downtown. The ride, which includes walks on both ends and a wait for the bus,
takes twice as long as driving. But in Texas, a conviction for marijuana possession means an automatic license suspension. Mr. Smith, who has been arrested three times for marijuana possession, could not drive for a long time.
The first time Mr. Smith was arrested (he was 18), he spent the night in jail and one year on probation. There were fines and court fees to pay. “All I had was a blunt,” he said. “All I had was five dollars worth of weed, and it cost me about two thousand dollars,” he said.

| 81
All told, Mr. Smith has spent almost three months in jail for marijuana possession. A 20-day jail stint cost him a job at a fast-food restaurant. “I come back to Austin and they told me ‘We couldn’t keep your job; we had to hire somebody else.’ And I’m like, dang, here I am back to square one, no job, no income.”
But now Mr. Smith has been working as a clerk at the Texas Workforce Commission for three years. His girlfriend, Danyell Stanley, has a full-time job at Time Warner. They have a baby daughter, Sydney; the three of them recently moved in with Mr. Smith’s mother and sister so they can save money to buy a place of their own. He is happy in his current job, but not having a license had meant that he could only apply for jobs he could get to on the bus.
It also affected where they could live, Ms. Stanley said. “When we were actively seeking our own place, one of the key things was, is it on
the bus line? Will you be able to get to work?” The farther from Mr. Smith’s job they moved, the longer his commute, and the more Ms. Stanley had to be responsible for their daughter. And until Mr. Smith got his new license, Ms. Stanley had to take Sydney to and from daycare, and anywhere else she needed to go, even though Ms. Stanley’s work hours are less flexible than Mr. Smith’s.
Moreover, Mr. Smith is a musician, and used to play regularly in clubs in Austin and around Texas. But he had to give it up because he could not drive to rehearsals or shows.
Mr. Smith recently managed to get an occupational driver’s license — it cost him $250 and a court appearance — that allows him to drive to and
Mr. Smith has spent almost three months in jail … and spent close to $10,000 on … charges for marijuana possession.
Profile
82 | The War on Marijuana in Black and White
from work, which means he can finally use his car. But none of this has been easy.
The arrests have cost them money they can ill afford. Altogether, Mr. Smith estimates that he has spent close to $10,000 on court costs, fines, and lawyers’ fees just to handle charges for possessing marijuana. That does not account for lost wages, or for time he had to appear in court or was in jail.
Even though even though it has been years since he was arrested for marijuana possession, he is still paying administrative fees to the state. That money, Mr. Smith says, he and Ms. Stanley could use for Sydney. “It’d go to [formula] and diapers and wipes.”
PROFILE
Marisa garcia, 32 los Angeles, CA
Marisa Garcia never expected her 19th birthday celebration to cost her a year of college tuition. It was January 2000, a month before she was to start her first semester of college at Cal State Fullerton.
She and two friends were on their way to pick up another friend, not far from where they lived east of Los Angeles, when Ms. Garcia’s friend stopped for gas. Ms. Garcia went inside to pay, and came out to find a police car parked behind their van.
“Eventually they started searching the car,” she remembered. “There was a little coin purse, with a small pipe with ash in it. It was put away; it wasn’t in plain view.”
When Ms. Garcia admitted it was hers, the police arrested her and wrote her a summons for possession of marijuana. “I had never been in any sort of trouble,” she said.
She decided not to tell her parents. When she showed up for her court appearance, she did not bring a lawyer.
“I just said, ‘Guilty’ [when the judge asked how she pled],” she said.

| 83
She paid about $400 in court fees, and thought she had put the ordeal behind her.
But then, two months later, she got a letter from the federal financial aid office saying she had to answer the question asking whether she had a drug conviction. A drug conviction of any kind is grounds for revoking federal financial aid. Ms. Garcia had not been trying to dodge the question the first time: her mother had filled out the application, and simply did not see it.
“And my heart kind of stopped. My mom is just like, ‘Answer no, and we’ll send it back.’ I had to tell her, ‘I don’t know that I can answer no.’”
Ms. Garcia ended up losing her financial aid for a year (a second conviction
Ms. Garcia feels that because she did not have money, she was punished twice for marijuana possession. Even after she paid her fine, she then lost her financial aid.
Profile

84 | The War on Marijuana in Black and White
can result in a longer suspension; more than three bars receipt of federal financial aid indefinitely).
She could have gotten her aid reinstated sooner if she had gone through a court-approved drug treatment program. But Ms. Garcia was only a recreational marijuana user, and, moreover, the drug treatment programs cost more than the tuition she could not afford without a loan.
“I felt like I just screwed up a huge part of my life. I was telling my mom, ‘I’ll drop out of school.’”
Her mother, Sandra Garcia, put her foot down. “You need an education to get
somewhere in life,” she said. “I wanted that for my family.”
Marisa Garcia was lucky. Her mother, who was supporting Ms. Garcia and her three brothers alone, was in the process of refinancing the family’s three-bedroom house when Marisa lost her aid. So she took out a line of equity on the house, and drew money against it to pay her daughter’s tuition.
Today, Ms. Garcia works as an office manager at a non-profit organization in Los Angeles. She also volunteers with other groups, trying to change the drug laws, so nobody else has to go through what she did.
She feels that because she did not have money, she was punished twice: even after she paid her fine, she then lost her financial aid.
“I still would have been arrested for marijuana. [But] if I was wealthier, I could go out and do whatever I wanted and just be punished once.”

| 85
VI. THE RISE IN MARIJUANA POSSESSION ARRESTS: WHAT CAUSED THE EXPLOSION?
This section addresses some of the possible key factors that have led to the significant increase in marijuana arrests over the last decade. First, it looks at this country’s marijuana policies in the context of the disastrous War on Drugs. Second, this section discusses the implementation of policing strategies in the 1990s that shifted law enforcement priorities toward low-level offenses. Lastly, the section addresses some of the law enforcement incentives behind making marijuana arrests, namely data-driven crime assessment systems that place a premium on large numbers of arrests, and the fact that arrests for marijuana possession are included in the federal government’s performance measures for law enforcement agencies participating in the Byrne Justice Assistance Grant Program.
A. The War on Drugs and the Shift from Rehabilitation to Punishment Before the War on Drugs began in the 1970s and was ramped up in the 1980s, many American policymakers viewed drug abuse as a social disease, like alcoholism, that should be dealt with by treating the underlying addiction. A reform process had been underway in the 1960s that adopted this medico-legal view of drug policy, and laws enacted during this time reflected this approach.70 When the use of narcotics began to increase during the 1960s, the government responded by passing the Narcotics Addict Rehabilitation Act (NARA) in 1966.71 As its title indicates, the Act reflected the medical view of drug addictions as a disease and provided for the diversion of drug abusers into
70 See, e.g., Civil Commitment and Treatment of Narcotic Addicts: Hearings on H.R. 9051, H.R. 9159 and H.R. 9167 and Related Bills before Subcomm. No. 2 of the Comm. on the Judiciary, 89th Cong. 234 (1965) (statement of Hon. Ogden R. Reid, Rep. of the State of N.Y.)(“The purpose of these bills … is to come up with a full-scale approach to the problem of narcotics and to distinguish between the criminal ‘pusher’ and the victimized addict who is in need of medical treatment, assistance and rehabilitation and not a postgraduate course in crime.”) Congress members called on the federal government to abandon the criminal approach toward drug use:
[D]rug addiction is a medical problem. This may not sound very revolutionary, but up to now the Congress of the United States, judging by the laws that it has passed, has viewed it as a revenue problem and a criminal problem, but not as a question involving the health of our citizens … there can be no real solution to the problem of drug abuse in this country unless Federal efforts to solve it include a medical approach.
Id. at 53 (statement of Hon. Emanuel Celler, a Rep. of the State of N.Y.).71 See ANDREW B. WHITFORD & JEFF YATES, PRESIDENTIAL RHETORIC AND THE PUBLIC AGENDA: CONSTRUCTING THE WAR ON DRUGS 39-40 (John Hopkins Univ. Press 2009).
The Rise in Marijuana Possession Arrests
86 | The War on Marijuana in Black and White
programs to treat their underlying addiction rather than prosecute them in the criminal justice system.72 Even President Richard Nixon’s administration had initially adopted the popular view at the time that drug abuse was a health problem, and called for education and scientific research to learn about the dangerousness of drugs.73
In 1970, the federal government passed the Comprehensive Drug Abuse Prevention and Control Act of 1970 (1970 Act), which contained provisions that softened the drug laws: the repeal of mandatory minimums for drug offenses,74 re-categorization of possession of a controlled substance as a misdemeanor, and probation for first-time offenders. Title II of the 1970 Act, which included the Controlled Substances Act (CSA), established five drug regulation schedules based on their medical values and potentials for addiction. Schedule I was reserved for the most serious drugs with purported high potential for abuse, lack of any accepted medical use, and absence of any accepted use or benefits in medically supervised treatment. Congress noted a lack of scientific study on marijuana and claimed that further research was necessary to determine its health effects, and thus temporarily placed marijuana in Schedule I.75
72 See 42 U.S.C. § 3401:
It is the policy of the Congress that certain persons charged with or convicted of violating Federal criminal laws, who aredetermined to be addicted to narcotic drugs, and likely to be rehabilitated through treatment, should, in lieu of prosecutionor sentencing, be civilly committed for confinement and treatment designed to effect their restoration to health, and returnto society as useful members. It is the further policy of the Congress that certain persons addicted to narcotic drugs whoare not charged with the commission of any offense should be afforded the opportunity, through civil commitment, fortreatment, in order that they may be rehabilitated and returned to society as useful members and in order that society maybe protected more effectively from crime and delinquency which result from narcotic addiction.
Id.73 See Richard Nixon: Special Message to the Congress on Control of Narcotics and Dangerous Drugs, THE AMERICAN PRESIDENCY PROJECT
(July 14, 1969), available at http://www.presidency.ucsb.edu/ws/index.php?pid=2126&st=&st1.74 Federal mandatory minimum penalties for drug offenses were first introduced by the Boggs Act of 1951. See U.S. SENTENCING
COMM’N, REPORT ON COCAINE AND FED. SENTENCING POL’Y (2007) [hereinafter REPORT ON COCAINE AND FED. SENTENCING POL’Y], available at http://www.ussc.gov/Legislative_and_Public_Affairs/Congressional_Testimony_and_Reports/Drug_Topics/199502_RtC_Cocaine_Sentencing_Policy/CHAP6.HTM. Two decades later, Congress overhauled federal drug policy, repealing the Act with the Comprehensive Drug AbusePrevention and Control Act of 1970. Congress members “expressed a general concern that ‘increasingly longer sentences that hadbeen legislated in the past had not shown the expected overall reduction in drug law violations.’” Id. (citing S. Rep. No. 613, 91st Cong.,1st Sess. (Dec. 16, 1969)). The Act of 1970 illustrates the government’s shift away from overly punitive drug laws toward a rehabilitativeapproach.75 Ironically, future research about marijuana’s medical benefits has been limited precisely because of its categorization as aSchedule I drug. Researchers must obtain a special license from the Drug Enforcement Agency (DEA) to conduct research and gainaccess to supply, which is controlled by the National Institutes of Drug Abuse (NIDA). Rep. Earl Blumenauer & Rep. Jared Polis, The Path Forward: Rethinking Federal Marijuana Policy 12 (2013), available at http://polis.house.gov/uploadedfiles/the_path_forward.pdf. Tothis day, marijuana remains a Schedule I drug, meaning that the federal government considers it as having a higher potential for abusethan cocaine, a Schedule II drug, and as high a potential for abuse as heroin and LSD. This categorization continues to be criticized ashaving no scientific basis:
Based on evidence currently available the Schedule I classification is not tenable; it is not accurate that cannabis has nomedical value, or that information on safety is lacking. It is true cannabis has some abuse potential, but its profile moreclosely resembles drugs in Schedule III (where codeine and dronabinol are listed). The continuing conflict between scientificevidence and political ideology will hopefully be reconciled in a judicious manner.
Igor Grant et al., Medical Marijuana: Clearing Away the Smoke, 6 THE OPEN NEUROLOGY J. 18, 24 (2012), available at http://www.ncbi.nlm.nih.gov/pmc/articles/PMC3358713/pdf/TONEUJ-6-18.pdf.

| 87
The 1970 Act also established the National Commission on Marijuana and Drug Abuse to assess the medical and addictive effects of marijuana. The Commission’s First Report to Congress, Marihuana: A Signal of Misunderstanding, recommended that marijuana no longer be classified as a narcotic, since that definition associated marijuana with more addictive drugs such as heroin and misled the public by exaggerating marijuana’s harms.76 The report further recommended decriminalization of marijuana in small amounts for personal use.77 A second report the following year, Drug Use in America: Problem in Perspective, reaffirmed the findings of the first report and again recommended decriminalization.78 While the reports and their recommendation to decriminalize marijuana had gained widespread support, the Nixon administration ignored the Commission’s findings.79
Despite the fact that Nixon disregarded the Commission’s reports, and even after Nixon initiated the War on Drugs by declaring drugs “public enemy number one” in 1971, his administration maintained a strong focus on rehabilitation and treatment.80 Indeed, the majority of government funding at the time was dedicated to rehabilitation programs aimed at eradicating heroin use.81 Similarly, in 1975, the Ford administration’s White Paper on Drug Abuse identified marijuana as a low-priority drug, and recommended that treatment and law enforcement efforts instead prioritize drugs that pose the greatest health risks, such as heroin and amphetamines.82 In 1976, Jimmy Carter, whose own
76 NAT’L COMM’N ON MARIHUANA AND DRUG ABUSE, MARIHUANA: A SIGNAL OF MISUNDERSTANDING 223 (1972).77 Id. at 191.78 See NAT’L COMMISSION ON MARIHUANA AND DRUG ABUSE, DRUG USE IN AMERICA: PROBLEM IN PERSPECTIVE, SECOND REPORT at 224 n.5 (1973) [hereinafter DRUG USE IN AMERICA: PROBLEM IN PERSPECTIVE]. The first report recommended that federal and state governments decriminalize marijuana possession for personal use. Id. at 458-59. 79 ERNESTO ZEDILLO & HAYNIE WHEELER, EDS., YALE CTR. FOR THE STUDY OF GLOBALIZATION, RETHINKING THE “WAR ON DRUGS” THROUGH THE US-MEXICO PRISM 10 (2012) [hereinafter ZEDILLO & WHEELER] (citing DAVID F. MUSTO, DRUGS IN AMERICA: A DOCUMENTARY HISTORY 460 (N.Y.U. Press 2002)), available at http://www.ycsg.yale.edu/center/forms/rethinking-war-on-drugs.pdf; Eric Blumenson & Eva Nilsen, No Rational Basis: The Pragmatic Case for Marijuana Law Reform, 17 VA. J. SOC. POL’Y & L. 43, 55-56 (2009) (citing RUDOLPH J. GERBER, LEGALIZING MARIJUANA, DRUG POLICY REFORM AND PROHIBITION POLITICS 25 (2004)) (“the ‘Shafer Commission’ … unequivocally recommended marijuana decriminalization … [and] urged more attention to scientific findings. … [However,] the President disowned the report out of hand, stating that although marijuana was no more dangerous than the drink then in his hand, following his commission’s view would send the wrong message.”).80 Richard Nixon: Special Message to the Congress on Drug Abuse Prevention and Control, THE AMERICAN PRESIDENCY PROJECT (June 17, 1971), available at http://www.presidency.ucsb.edu/ws/?pid=3048:
We are taking steps under the Comprehensive Drug Act to deal with the supply side of the equation and I am recommendingadditional steps to be taken now. But we must also deal with demand. We must rehabilitate the drug user if we are toeliminate drug abuse and all the antisocial activities that flow from drug abuse.
81 Id. See also Thirty Years of America’s Drug War: A Chronology, FRONTLINE PBS [hereinafter Thirty Years], available at http://www.pbs.org/wgbh/pages/frontline/shows/drugs/cron/ (last visited Feb. 13, 2013). Nixon famously declared drug abuse as “public enemy numberone” in response to an explosive report released by Congressmen Robert Steele (R-CT) and Morgan Murphy (D-IL) on the growing heroinepidemic among U.S. servicemen in Vietnam. See Drug Wars, Part I: Transcripts, PBS FRONTLINE, (PBS television broadcast Oct. 9, 2000),available at http://www.pbs.org/wgbh/pages/frontline/shows/drugs/etc/script.html (last visited Feb. 13, 2013); Richard Nixon: Remarks about an Intensified Program for Drug Abuse Prevention and Control, THE AMERICAN PRESIDENCY PROJECT (June 17, 1971), available at http://www.presidency.ucsb.edu/ws/?pid=3047.82 See DEA History 25, DRUG ENFORCEMENT ADMIN., http://www.justice.gov/dea/about/history.shtml (follow “1975-1980” hyperlink)(last visited Feb. 13, 2013); OFFICE OF THE WHITE HOUSE PRESS SEC’Y, FACT SHEET: WHITE PAPER ON DRUG ABUSE (1975), available at http://www.fordlibrarymuseum.gov/library/document/0248/whpr19751014-009.pdf.
The Rise in Marijuana Possession Arrests
88 | The War on Marijuana in Black and White
drug czar did not view marijuana as a serious public health threat, was elected president while campaigning on a platform supporting the decriminalization of marijuana.
But the focus on harm reduction and public health was cast aside in the 1980s under President Ronald Reagan, who, with the help of Congress, ratcheted up the drug war to a full-fledged assault on drug use, relying on increased arrests and incarceration as key strategic components. Initially, the United States government focused its law enforcement resources on cocaine,83 which was fueling the lucrative and expansive Columbian drug trade. The public alarm over drugs — aided mightily by sustained media frenzy — escalated in 1984 with the rise of crack cocaine. Reagan responded by signing the Anti-Drug Abuse Act of 1986, which budgeted an additional $1.7 billion to the drug war and imposed mandatory minimum sentences for drug offenses. Under the Act, judges were required to sentence individuals convicted of certain drug offenses to a minimum number of years, or more, known as mandatory minimum sentences.84 Congress decided that these mandatory minimums would be triggered not by a person’s actual role in a drug offense or operation, but by drug type and quantity instead. Causing further harm, the United States Sentencing Commission decided to link its Sentencing Guidelines to these draconian mandatory minimum sentences.85 Although these harsh sentences were intended for masterminds and managers of large drug operations, as a result of these sentencing structures, the vast majority of people who have received such severe sentences are neither kingpins nor leaders, but low-level offenders. The Act thus stripped judges of discretion to impose fair sentences tailored to the facts and circumstances of individual cases and the characteristics of individual defendants. The Act also created the infamous 100-to-1 disparity between powder and crack cocaine, which imposed the same mandatory minimum sentence upon someone possessing one one-hundredth the amount of crack cocaine as powder cocaine. So, for example,
83 See David T. Courtwright, The Controlled Substances Act: How a “Big Tent” Reform Became a Punitive Drug Law, 76 DRUG & ALCOHOL
DEPENDENCE 9, 10 (2004) (discussing how the Controlled Substances Act originally was intended to focus on cocaine and opiates, but thatCongress continuously amended the Act to give the DEA greater control over scheduling, transforming the law into the legal foundationof the drug war).84 The trend toward mandatory minimums had started the decade before with New York’s Rockefeller drug laws. In 1973, GovernorNelson Rockefeller enacted “one of the nation’s toughest sentencing schemes for drug offenders, establishing mandatory incarcerationperiods for those convicted of the unlawful possession and sale of controlled substances based on the measured weight of the druginvolved in the case.” Edward J. DiMaggio, New York’s Rockefeller Drug Laws, Then and Now, 78 N.Y. ST. B.J. 30, 30 (2006). The lawsrequired judges to sentence anyone selling two ounces or possessing four ounces of narcotics to a term of 15 years to life — about thesame sentence as for second-degree murder. Madison Gray, A Brief History of New York’s Rockefeller Drug Laws, TIME MAG., Apr. 2, 2009,available at http://www.time.com/time/nation/article/0,8599,1888864,00.html. This led to an increase in drug convictions in the state,with no marked decrease in crime. Id. By 1994 drug offenders made up 35% of New York’s prison population, an increase of 24% since1973. Id.85 Under the Comprehensive Crime Control Act of 1984, Congress had created the United States Sentencing Commission topromulgate mandatory — as opposed to advisory — sentencing guidelines for drug and gun crimes for federal courts. See U.S. SENTENCING COMM’N, FIFTEEN YEARS OF GUIDELINES SENTENCING 2 (2004), available at http://www.ussc.gov/Research/Research_Projects/Miscellaneous/15_Year_Study/chap1.pdf (“The sentencing guidelines were intended most importantly to curtail judicial …discretion, which was viewed as ‘arbitrary and capricious’ and an ineffective deterrent to crime.”). Requiring judges to follow a set ofsentencing guidelines stripped them of discretion to impose sentences tailored to the individual circumstances of a given case or thecharacteristics of the defendant. The mandatory sentences led to rapid increases in incarceration rates and expenditures on prisons.Charles Ogletree, Getting Tough on Crime: Does it Work?, 38-APR B. B.J. 9, 27 (1994).

| 89
someone convicted of possessing with intent to distribute five grams of crack cocaine received the same five-year minimum term as someone convicted of possessing with intent to distribute 500 grams of powder cocaine.86 The combination of increased drug arrests and lengthier prison sentences contributed significantly to the tenfold growth of our federal prison population since 1980; indeed, half of all federal prisoners today are incarcerated for drug offenses.87
Presidents George H. W. Bush and Bill Clinton continued to fight the drug war aggressively.88 In 1989, during President Bush’s tenure, the Office of National Drug Control Policy, created by the Anti-Drug Abuse Act of 1988 to advise the President on drug-control issues, coordinate drug-control activities and related funding across the federal government, and produce an annual National Drug Control Strategy, made clear in its first strategy report that a central component of its approach to illegal drugs was arresting more people in targeted communities:
To prevent people from using drugs, drug enforcement activities must make it increasingly difficult to engage in any drug activity with impunity. That deterrent, however, will only remain credible so long as pressure is brought to bear on the entire drug market, dealers and users alike. That’s why we need a national drug law enforcement strategy that casts a wide net and seeks to ensure that all drug use — whatever its scale — faces the risk of criminal sanction … [W]hen neighborhood police increase the number of drug arrests in an area … the drug markets that menace neighborhoods cease to flourish … . Effective street-level enforcement means dramatically increasing the number of drug offenders arrested. But unless there is a system ready to absorb them, drug control will end at the police station.89
Continuing the legacy of Presidents Reagan and Bush, during President Clinton’s presidency, drug arrests rose 46%, and more Blacks were imprisoned than ever before in American history.90
86 In 2010, Congress enacted the Fair Sentencing Act, which reduced the crack-to-powder cocaine disparity from 100-to-1 to anequally arbitrary but less drastic 18-to-1. See REPORT ON COCAINE AND FED. SENTENCING POL’Y, supra note 74.87 NANCY LAVIGNE & JULIE SAMUELS, URBAN INST., JUST. POL’Y CTR., THE GROWTH & INCREASING COST OF THE FEDERAL PRISON SYSTEM: DRIVERS AND
POTENTIAL SOLUTIONS 5 (2012), available at http://www.urban.org/UploadedPDF/412693-The-Growth-and-Increasing-Cost-of-the-Federal-Prison-System.pdf.88 Under President Reagan, federal spending on drug control reached $6.66 billion by 1989. Drug control spending exceeded $19billion under President Bush and $18 billion under President Clinton. ZIEDENBERG & COLBURN, supra note 11, at 5-6.89 OFFICE OF NAT’L DRUG CONTROL POL’Y, NAT’L DRUG CONTROL STRATEGY 17-18, 21, 24 (1989), cited in MITCHELL & CAUDY, supra note 7. A copy ofthe National Drug Control Strategy report is available at https://www.ncjrs.gov/pdffiles1/ondcp/119466.pdf.90 Every year during Clinton’s tenure, the African-American incarceration rate increased by an average rate of 100.4 per 100,000persons. LISA FELDMAN, VINCENT SCHIRALDI, & JASON ZIEDENBERG, CTR. ON JUV. & CRIM. JUST., TOO LITTLE TOO LATE: PRESIDENT CLINTON’S PRISON LEGACY
2 (2001), available at http://www.cjcj.org/files/too_little.pdf. Clinton also passed the Higher Education Act, which blocks eligibility forfederal financial aid if a student is convicted of a drug offense. See 20 U.S.C. § 1091 (r)(1).
The Rise in Marijuana Possession Arrests

90 | The War on Marijuana in Black and White
Our country’s drug war has also fueled an incredibly profitable and violent illegal drug trade in Mexico.91 Since 1969, when our government began attacking the supply side of drugs (rather than the current approach of also cracking down heavily on the demand side),92 the United States has expended significant resources on targeting the flow of drugs, including marijuana, from Mexico.93 But as the drug war has intensified, so have the profits and casualties south of our border. An inter-agency report by the Federal Bureau of Investigation in 2010 found that marijuana is the top revenue generator of the Mexican drug trade.94 A RAND study estimated that 15% to 26% of Mexican drug export revenues are attributable to marijuana.95 Further, the intense, profit-driven competition between drug cartels to supply drugs, including marijuana, to millions of American consumers has left tens of thousands of Mexicans dead. Between 2006 and 2012 alone, there were approximately 60,000 drug-related deaths in Mexico.96 The United States could curtail its role in causing such violence by ending marijuana prohibition, not to mention end its role in such violence by repealing drug prohibition altogether.
America should abandon its hyper-criminalization of people who use, possess, and sell drugs and its insistence that drug use and abuse can and should be addressed within
91 See Mexico Under Siege: The Drug War at Our Doorstep for a series of news stories covering the drug war in Mexico. L.A. TIMES, lastupdated Feb. 27, 2013, http://projects.latimes.com/mexico-drug-war/#/its-a-war (last visited Mar. 25, 2013).92 Just weeks after President Nixon gave his war on drugs speech in 1969, the United States launched Operation Intercept, amassive action involving inspection of vehicles and people crossing the Mexican border, in order to reduce drug trafficking, but itcaused so much disruption that it had to be scaled back only two weeks later. ZEDILLO & WHEELER, supra note 79, at 11. See also KateDoyle, Operation Intercept: The Perils of Unilateralism, THE NAT’L SECURITY ARCHIVE (April 13, 2003), http://www.gwu.edu/~nsarchiv/NSAEBB/NSAEBB86/#article.93 See Thirty Years, supra note 81.94 See Drug Trafficking Violence in Mexico: Implications for the United States: Testimony, FED. BUREAU OF INVESTIGATION (May 5, 2010), http://www.fbi.gov/news/testimony/drug-trafficking-violence-in-mexico-implications-for-the-united-states (last visited April 2, 2013).95 See BEAU KILMER ET AL., RAND CORP., REDUCING DRUG TRAFFICKING REVENUES AND VIOLENCE IN MEXICO: WOULD LEGALIZING MARIJUANA IN
CALIFORNIA HELP? 33 (2010) [hereinafter KILMER ET AL.], available at http://www.rand.org/content/dam/rand/pubs/occasional_papers/2010/RAND_OP325.pdf.96 Nick Miroff & William Booth, Mexico’s Drug War is at a Stalemate as Calderón’s Presidency Ends, WASH. POST, Nov. 27, 2012, available at http://articles.washingtonpost.com/2012-11-27/world/35509536_1_drug-war-drug-violence-drug-fight.
America’s hyper-criminalization of people who use, possess, and sell drugs and its insistence that the solution can be found in the criminal justice system has resulted in the abandonment of public health solutions.

| 91
the criminal justice system and instead recommit to alternative approaches to drug use centered on public health solutions.97
B. Broken Windows’ Broken Model Law enforcement agencies have increasingly shifted their focus from traditional, reactive policing strategies of responding to calls for service and investigation to preventive policing strategies concentrating on low-level, quality-of-life offenses predominantly in communities of color. Police departments have often employed aggressive stop, frisk, and search tactics that bend if not flaunt the Fourth Amendment’s proscriptions. This shift to preemtive policing has likely been a major contributor to the increase in arrests for marijuana possession across the country, particularly in communities of color.
Beginning in the 1990s, police departments began cracking down on minor offenses under the theory that such tactics would increase public safety and reduce violent crime. This preventive crime-fighting phenomenon was precipitated by a highly influential article in 1982 by criminologists James Q. Wilson and George L. Kelling published in The Atlantic Monthly, which introduced the now well-recognized “broken windows theory” of crime.98 Broken windows posits that by addressing minor indicators of neighborhood decay and disorder and cracking down on petty offenses, police will reduce serious crime attracted and fueled by such disorder. The central premise of broken windows is that the appearance of disorder begets actual disorder. Broken windows reframed visual cues traditionally associated with economic and social disadvantage as signs of crime and disorder.99 As one law professor points out, “[t]he orderliness of broken windows policing may be an illusion of disorder.”100
97 See generally NAT’L INSTITUTE ON DRUG ABUSE, U.S. DEP’T OF HEALTH & HUMAN SERVICES, PRINCIPLES OF DRUG ADDICTION TREATMENT: A RESEARCH-BASED GUIDE v-vi (rev. 2012), available at http://www.drugabuse.gov/sites/default/files/podat_1.pdf (describing drug addiction as a “braindisease” that requires medical and rehabilitative treatment). Much of the political discourse surrounding drug policy improperlyconflates drug use with drug abuse. The United Nations Office on Drugs and Crime (UNODC) currently acknowledges that there is adistinction between the two. While 5% of the world population uses drugs annually, a recent UNODC World Drug Report found thatonly 0.6% of the world population engages in “problem drug use.” UNODC, WORLD DRUG REPORT 2012 61, fig.1 (2012), available at http://www.unodc.org/documents/data-and-analysis/WDR2012/WDR_2012_web_small.pdf. An evaluation of countries that decriminalizedmarijuana (the Netherlands, the Czech Republic, and Portugal) showed that removing or reducing the criminal penalties on possessiondoes not lead to a substantial increase in use. THOMAS F. BABOR, YALE CTR. FOR THE STUDY OF GLOBALIZATION, THE PUBLIC HEALTH IMPACT OF DRUG
POLICIES 76 (2012), available at http://www.ycsg.yale.edu/center/forms/public-health-impact73-84.pdf; see also Promoting a Public Health Approach, HARM REDUCTION INT’L, http://www.ihra.net/promoting-a-public-health-approach (last visited Feb. 13, 2013).98 George L. Kelling & James Q. Wilson, Broken Windows: The Police and Neighborhood Safety, THE ATLANTIC MONTHLY, Mar. 1982,available at http://www.theatlantic.com/magazine/archive/1982/03/broken-windows/304465/.99 A study found that observed disorder predicts perceived disorder, but racial and economic context matter more. See generally Robert J. Sampson & Stephen W. Raudenbush, Seeing Disorder: Neighborhood Stigma and the Social Construction of “Broken Windows”,67 SOC’L PSYCHOL. Q. 319, 319 (2004), available at http://www.asanet.org/images/members/docs/pdf/featured/67401-sampson.pdf. Usingneighborhood surveys, census data, police records, and observational surveys of Chicago neighborhoods, the authors found that socialstructure (concentration of minorities and poverty) is a more powerful predictor of perceived disorder than observed disorder. Id.100 BERNARD E. HARCOURT, ILLUSION OF ORDER: THE FALSE PROMISE OF BROKEN WINDOWS POLICING 19 (2001) [hereinafter HARCOURT, ILLUSION OF ORDER](emphasis in original).
The Rise in Marijuana Possession Arrests

92 | The War on Marijuana in Black and White
Broken windows policing provides the theoretical framework for the implementation of order-maintenance policing strategies that focus on the enforcement of low-level and “quality-of-life” offenses. Wilson and Kelling had called for the return to the order-maintenance model of the 1960s, when police maintained peace and order within communities by focusing on both physical disorder — repairing broken windows and cleaning up abandoned lots — and social disorder through non-arrest interventions — communicating with individuals, establishing trust and
rapport, and issuing warnings. But by the 1990s, as cities across the country adopted a spate of anti-loitering and anti-gang laws and youth curfews aimed at maintaining order, police departments began implementing distorted versions of Wilson and Kelling’s model by increasing arrests for a slew of minor offenses.101 Rather than rely on articulable, reasonable suspicion of criminal activity, an individual’s mere presence in a particular area designated by authorities as “disorderly” increasingly served to justify his or her detention and search. Under the pretext of maintaining “order” and wed to the belief that racking up arrests for minor transgressions prevents more serious crime, certain police departments have embraced a “zero-tolerance,” arrest-first approach to low-level — and in some cases non-criminal — conduct, drastically increasing the
101 See, e.g., William J. Bratton, The New York City Police Department’s Civil Enforcement of Quality-of-Life Crimes, 3 J. L. & POL’Y 447,448-50 & 463-64 (1995) (article by former New York City Police Commissioner who instituted quality-of-life enforcement programexpresses unabashed support for the “broken windows” thesis and also affirms his belief in community policing); Paul Scott Abbott,Operation Clean Sweep: Depressed Community Both Applauds and Decries Cleanup By Police, SUN-SENTINEL, Mar. 8, 1996, available at http://articles.sun-sentinel.com/1996-03-08/news/9603110142_1_cleanup-effort-liberia-arrests (Broward County sheriff’s deputy cites“broken-window syndrome” in explaining the enforcement of public drinking law and similar misdemeanors); Ronald Brownstein,Taming the Mean Streets, L.A. TIMES, May 4, 1994, available at http://articles.latimes.com/1994-05-04/news/mn-53670_1_city-streets(“With this aggressive initiative to arrest a cycle of disorder in Five Oaks, Dayton [Ohio] joined a new urban policy movement thathas raised complex questions of rights, responsibilities and fairness from coast to coast.”); Edmund Mahony, Taking It to the Streets,HARTFORD COURANT, Apr. 15, 1995, at A1, available at http://articles.courant.com/1995-04-15/news/9504150144_1_red-lights-loud-music-police-chief-nicholas-pastore (describing how the police chief in Hartford, Connecticut, “has taken the broken-window theory to heart”);Albert W. Alschuler & Stephen J. Schulhofer, Antiquated Procedures or Bedrock Rights? A Response to Professors Meares and Kahan, 1998U. CHI. LEGAL F. 215, 233 (1998) (citing Michael Gillis & Fran Spielman, City’s Loitering Law Ruled Unconstitutional, CHI. SUN-TIMES, Dec. 19,1995) (Chicago’s anti-loitering ordinance was ruled unconstitutional in 1995 after it was used to arrest 41,740 people and to disperse43,457); Kimberly Garcia, Ordinance Aims to End Drug Deals, MILWAUKEE SENTINEL, Jan. 28, 1994, at 1A, available at http://news.google.com/newspapers?nid=1368&dat=19940128&id=AKxRAAAAIBAJ&sjid=_hIEAAAAIBAJ&pg=3493,6931639 (reporting the passage of drugloitering statute in Milwaukee); John Rivera, Loitering Bill with $1,000 Fine Targets Brooklyn Park Prostitution, BALTIMORE SUN, Jan. 4, 1994,available at http://articles.baltimoresun.com/1994-01-04/news/1994004069_1_arrest-prostitutes-brooklyn-park-ritchie (reporting 1994enactment of anti-loitering bill to discourage prostitution in Baltimore’s Brooklyn Park by imposing a $1,000 fine).
There are other policing models, in which arrests are last resorts, and that embrace a problem-solving approach to crime prevention that addresses underlying problems and provides support services.
| 93
number of street stops, frisks, and searches, primarily of young persons of color.102 As a result, police have dragged hundreds of thousands of individuals into the criminal justice system for minor, nonviolent offenses, including, often, marijuana possession.
Nowhere has this arrest-happy approach been more highly publicized, or more fervently embraced, than in New York City. In 1994, New York City Mayor Rudolph Giuliani and Police Commissioner William Bratton implemented an order-maintenance policing strategy emphasizing the proactive and aggressive selective enforcement of “quality-of-life” offenses.103 The NYPD’s quality-of-life initiative was accompanied by practices that included the proliferation of anti-crime units, such as the Street Crimes Unit, which was disbanded in 2002 after its members fatally shot unarmed Amadou Diallo.104 The initiative ramped up use of stop, question, frisk, and search practices, and increased arrests for minor offenses.105 Specifically, Bratton:
[R]etooled New York City’s drug enforcement effort to target more muscle toward low- and middle-level dealers, and he lifted a longstanding police policy that discouraged drug enforcement arrests by patrol officers — freeing them to seek warrants, make narcotics arrests, and go after those they suspected of drug dealing for quality-of-life violations to sweep them off the streets and into the jails.106
Under its zero-tolerance policy, the NYPD detained thousands of individuals for nonviolent offenses. In 1991, the NYPD made 44,209 stops;107 by 2010, the number of stops rose to a staggering 601,285.108 Of the 685,724 people stopped by the NYPD in 2011,
102 For instance, there were 685,724 stops made in 2011 by the New York Police Department, of which young Black and Latinomen made up 41.6% despite representing only 4.7% of the city’s population. NEW YORK CIVIL LIBERTIES UNION, STOP-AND-FRISK 2011: NYCLU BRIEFING, 2 (2012) [hereinafter NYCLU BRIEFING], available at http://www.nyclu.org/files/publications/NYCLU_2011_Stop-and-Frisk_Report.pdf. In Los Angeles, street stops doubled between 2002 and 2008 to 244,038; 30% of those stops resulted in arrests in2008. Colleen Long, Stop and Frisk: Police Stop More than 1 Million People on the Street, HUFFINGTON POST (Oct. 8, 2009, 10:13 PM), http://www.huffingtonpost.com/2009/10/08/stop-and-frisk-police-sto_n_314509.html. Statistics for stop and frisks for other large policedepartments in cities such as Boston, Chicago, and New Orleans are unavailable because the departments do not release the statisticsor claim that they do not keep the data.103 HARCOURT, ILLUSION OF ORDER, supra note 100, at 1.104 See William K. Rashbaum & Al Baker, Police Commissioner Closing Controversial Street Crime Unit, N.Y. TIMES, Apr. 10, 2002,available at http://www.nytimes.com/2002/04/10/nyregion/police-commissioner-closing-controversial-street-crime-unit.html.105 See Clifford Krauss, Efforts on Quality of life in Village a Success, the Police Say, N.Y. TIMES, June 24, 1994, available at http://www.nytimes.com/1994/06/24/nyregion/efforts-on-quality-of-life-in-village-a-success-the-police-say.html (noting increased summonsesin Greenwich Village for minor offenses such as graffiti vandalism and unlicensed vending); Bob Herbert, Op-Ed, Jim Crow Policing,N.Y. TIMES, Feb. 1, 2010, available at http://www.nytimes.com/2010/02/02/opinion/02herbert.html (describing the overuse of stops by theNYPD as tool of racial harassment). For an overview of stop, question, and frisk practices in New York City see DR. DELORES JONES-BROWN, JASPREET GILL & JENNIFER TRONE, CTR. ON RACE, CRIME, AND JUST. AT JOHN JAY COLLEGE OF CRIM. JUST., STOP, QUESTION & FRISK POLICING PRACTICES IN NEW
YORK CITY: A PRIMER (2010), available at http://www.jjay.cuny.edu/web_images/PRIMER_electronic_version.pdf.106 Judith A. Greene, Zero Tolerance: A Case Study of Police Policies and Practices in New York City, 45 CRIME & DELINQUENCY 171, 175(1999), available at http://crab.rutgers.edu/~goertzel/ZeroNYC.htm.107 U.S. COMM’N ON CIVIL RIGHTS, POLICE PRACTICES AND CIVIL RIGHTS IN NEW YORK CITY, ch.5, n.63 (Aug. 2000), available at http://www.usccr.gov/pubs/nypolice/ch5.htm.108 Stop-and-Frisk Data, NEW YORK CIVIL LIBERTIES UNION, http://www.nyclu.org/content/stop-and-frisk-data (last visited Feb. 14, 2013).
The Rise in Marijuana Possession Arrests
94 | The War on Marijuana in Black and White
605,328 — or about 88% — were innocent of any crime.109 Eighty-seven percent of the people stopped were Black or Latino,110 even though whites stopped were twice more likely to be found with a weapon.111
The increase in racially biased stops and searches was mirrored by the increase in, and racial disparities among, marijuana arrests. In 1991, the NYPD made approximately 774 marijuana arrests;112 just one year after the zero-tolerance policy took effect, the number of marijuana possession arrests increased 82% to 5,716.113 By 2010, the NYPD made over 59,000 marijuana arrests, making New York City the marijuana arrest capital of the country. The racial disparities in these arrests are as jarring as their overall number. In Kings County (Brooklyn), the white arrest rate for marijuana possession was 161 per 100,000, the Latino
arrest rate was 717 per 100,000, and the Black arrest rate was 1,554 per 100,000. In the Bronx, per 100,000, the arrest rate was 324 for whites, 892 for Latinos, and 1,640 for Blacks. In New York County (Manhattan), while the white marijuana possession arrest rate was 208, the Latino and Black arrest rates were a staggering 999 and 1,952, respectively. See Appendix Figure A1.
The NYPD attributes New York City’s dramatic drop in crime to these aggressive enforcement tactics, but this cause-and-effect claim is controversial and much disputed. When Mayor Rudolph Giuliani took office in 1994, violent crime in New York City had already dropped 12% since 1990.114 Though New York City’s crime decrease was
109 See NYCLU BRIEFING, supra note 102, at 15; see also Sean Gardiner, Stop-and-Frisks Hit Record in 2011, WALL STREET J., Feb. 14, 2012[hereinafter Gardiner, Stop-and-Frisks], available at http://online.wsj.com/article/SB10001424052970204795304577221770752633612.html.110 See Gardiner, Stop-and-Frisks, supra note 109.111 Christopher Mathias, NYPD Stop and Frisks: 15 Shocking Facts About a Controversial Program, HUFFINGTON POST (May 15, 2012, 1:54PM), http://www.huffingtonpost.com/2012/05/13/nypd-stop-and-frisks-15-shocking-facts_n_1513362.html. The higher “hit rate” forwhites could be the result of police being more likely to have reasonable suspicion that a criminal activity is afoot when stopping whitesas opposed to relying more on an individual’s race, appearance, and/or neighborhood surroundings in deciding to detain a person ofcolor.112 New York City Marijuana Possession Arrests 1978-2011, MARIJUANA ARREST PROJECT, http://www.marijuana-arrests.com/graph8.html(last visited Feb. 25, 2013).113 See Harry G. Levine, New York City’s Marijuana Arrest Crusade Continues 3 (2009), available at http://marijuana-arrests.com/docs/NYC-MARIJUANA-ARREST-CRUSADE-CONTINUES-SEPT-2009.pdf.114 The crime rate declined at a steady rate pre- and post-1994. COMPSTAT and Mayor Giuliani’s quality-of-life initiative, oftencredited with New York City’s crime drop, began around 1994. From 1990 to 1994, violent crime and property crime had already beendeclining. David F. Greenberg, Studying New York City’s Crime Decline: Methodological Issues, JUST. Q. 11 (2013) [hereinafter Greenberg].Had COMPSTAT or aggressive policing been the cause of the continued decline, the rate of decline would have sharpened after 1994.See id. at 11 & 29.
Using the number of arrests as a performance metric necessarily creates pressure, and incentives, for police to generate high numbers of arrests.
| 95
particularly pronounced, over the past 20 years rates of serious crime dropped in cities nationwide, including many that did not resort to the same wide-sweeping stop, frisk, and search police tactics. Criminologists and economists have posited many theories as to the factors that may have contributed to the decrease in crime in New York City and nationwide, including a stronger economy, an increased number of police officers on the street, gun control programs, the legalization of abortion and declining birth rates, the waning popularity of crack cocaine, and even — though perhaps most statistically compelling — the levels of exposure to atmospheric lead.115 Further, a recent study examining New York City’s crime decline found no evidence that misdemeanor arrests reduced homicide,116 robbery, or aggravated assault rates.117
Nationwide, there is no clear correlation between an increase in arrests for marijuana possession and a decrease in crime. As indicated in the FBI/UCR Program, crime rates have increased in 38% of all counties since 1995. Within these counties, marijuana possession arrests were more likely to have increased than decreased. On the other hand, crime rates have decreased in 62% of all counties since 1995, and within these
115 See, e.g., K. Babe Howell, Broken Lives from Broken Windows: The Hidden Costs of Aggressive Order-Maintenance Policing, 33 N.Y.U. REV. OF L. & SOC. CHANGE 271, 278 (2009), available at http://www.law.nyu.edu/ecm_dlv3/groups/public/@nyu_law_website__journals__review_of_law_and_social_change/documents/documents/ecm_pro_065175.pdf (noting that the drop in crime began before zero-tolerance policies or other significant order-maintenance policing was adopted in New York City, citing factors such as getting guns offthe street and increasing the number of police officers); Steven D. Levitt, Understanding Why Crime Fell in the 1990s: Four Factors that Explain the Decline and Six that Do Not, 18 J. OF ECON. PERSPECTIVES 163 (2004), available at http://pricetheory.uchicago.edu/levitt/Papers/LevittUnderstandingWhyCrime2004.pdf (attributing drop in crime to increased number of police, decreased use of crack, increasedincarceration, and legalized abortion; and discounting policing strategies such as order-maintenance because crime dropped in bothcities that adopted these strategies and cities that did not); Kevin Drum, America’s Real Crime Element: Lead, MOTHER JONES, Jan. 2013,available at http://www.motherjones.com/environment/2013/01/lead-crime-link-gasoline (attributing increases and decreases in crimerates to lead exposure); Bill Dixon, Zero Tolerance: The Hard Edge of Community Policing, 9 AFR’N. SEC. REV. no.3 (2000):
The managerial and other changes made in the NYPD by Bratton … including the recruitment of 7000 additional police officers — make it impossible to attribute any crime reduction effects … to the introduction of order maintenance policing alone. What is more, crime also fell in 17 out of 25 of the largest US cities between 1993 and 1996. Among these 17 were places such as San Diego where vastly different policies of problem-oriented “neighbourhood policing” were implemented and Oakland where no significant change in strategy occurred at all.
Bernard Harcourt and Jens Ludwig analyzed the changes in total misdemeanor arrests within New York City precincts from 1989to 1998 against changes in violent crime only, and found that “if anything, increases in misdemeanor arrests were accompanied byincreases in violent crime.” Bernard E. Harcourt & Jens Ludwig, Reefer Madness: Broken Windows Policing and Misdemeanor Marijuana Arrests in New York City, 1989-2000 173 (U. of Chi. L. & Econ., Working Paper No. 317, 2007), available at http://www.econ.brown.edu/fac/glenn_loury/louryhomepage/teaching/Ec%20222/marijuana-arrests-Ludwig.pdf.116 Since Mayor Michael Bloomberg took office, the number of shooting victims has remained constant over the past decade;according to NYPD and city statistics, 1,892 people were shot in 2002, 1,821 in 2011. Murray Weiss, Stop-and-Frisks Have Done Little to Reduce Shootings, NYPD Data Show, DNAINFO.COM (June 5, 2012, 8:25 AM), http://www.dnainfo.com/new-york/20120605/new-york-city/stop-and-frisks-have-done-little-reduce-shootings-nypd-data-shows. The NYPD also claims its zero-tolerance approach to low-leveloffenses has been effective in removing illegal guns from the street. However, of the 685,724 stops carried out by the NYPD in 2011, onlyabout one in every 3,000 (or .03%) resulted in the recovery of a gun. New NYCLU Report Finds NYPD Stop-and-Frisk Practices Ineffective; Reveals Depth of Racial Disparities, NEW YORK CIVIL LIBERTIES UNION (May 9, 2012), http://www.nyclu.org/news/new-nyclu-report-finds-nypd-stop-and-frisk-practices-ineffective-reveals-depth-of-racial-dispar. While stops have continued to increase in the past few years,the number of guns recovered through stop and frisk has decreased. See Murray Weiss, Stop-and-Frisks Fail to Pull More Guns Off the Streets, NYPD Stats Show, DNAINFO.COM (Aug. 13, 2012, 6:35 AM), http://www.dnainfo.com/new-york/20120813/new-york-city/stop-and-frisks-fail-pull-more-guns-off-street-nypd-data-shows.117 See Greenberg, supra note 114, at 1, 7 & 28. Further, the study notes that a crime drop occurred in many American cities as wellas other countries from 1988 to 2001, a global pattern that “implicates national and international trends that may have occurred morestrongly in some cities than in others.” See id. at 12.
The Rise in Marijuana Possession Arrests

96 | The War on Marijuana in Black and White
counties, marijuana possession arrest rates were somewhat more likely to have increased than decreased. See Table 14.
TABLE 14Counties Categorized by Changes in Marijuana Possession Arrest Ratesand Violent Crime Rates (1995-2010)
Marijuana Possession Arrest Rates
Violent Crime Rates Increased Since 1995 Decreased Since 1995
Increased Since 1995 549 (23.36%) 352 (14.98%)Decreased Since 1995 895 (38.09%) 554 (23.57%)
Source: FBI/Uniform Crime Reporting Program Data
More tellingly, however, this data reveals that the likelihood that violent crime increased or decreased was the same in counties where marijuana possession arrests increased as in counties where such arrests decreased. See Table 15.
TABLE 15
The Likelihood that ViolentCrimes Rates INCREASEDSince 1995
The Likelihood that ViolentCrimes Rates DECREASEDSince 1995
In Counties in whichMarijuana Possession ArrestRates Have INCREASEDSince 1995:
61.98% (= 554352+554 ) 38.02% (= 352
352+554 )
In Counties in whichMarijuana Possession ArrestRates Have DECREASEDSince 1995:
61.15% (= 895549+895 ) 38.85% (= 549
549+895 )
These results show that movements in marijuana possession arrests are uncorrelated with movements in crime rates.118
118 Indeed, a study in New York City found that the large numbers of people the NYPD arrests for misdemeanor marijuana possession—disproportionately young people of color—do not subsequently engage in violent crime. See ISSA KOHLER-HAUSSMAN & JAMIE FELLNER, HUMAN RIGHTS WATCH, A RED HERRING: MARIJUANA ARRESTEES DO NOT BECOME VIOLENT FELONS (2012), available at http://www.hrw.org/sites/default/files/reports/us_mj1112webwcover.pdf (tracking 30,000 people without prior criminal convictions who were arrested in 2003 and 2004 for marijuana possession, and finding that during the six-and-a-half to eight-and-a-half years that the research covered, 90% (26,315) had no subsequent felony convictions of any kind, and only 3.1% (or 1,022 persons out of nearly 30,000) were subsequently convicted of one violent felony offense). Indeed, marijuana prohibition likely increases gun violence. Because of the profits that a prohibited substance can yield, “[a] Black market route for drugs can become a Black market route for guns.” Emily Crockett, How Ending the War on Drugs Could Curb Gun Violence, CAMPUS PROGRESS, CTR. FOR AM. PROGRESS, Feb. 4, 2013 (quoting Trevor Burrus, research fellow with the Cato Institute), http://campusprogress.org/articles/how_ending_the_war_on_drugs_could_curb_gun_violence/ (last visited Feb. 15, 2013). A comprehensive review of all existing scientific research conducted by the International Centre for Science in Drug Policy similarly concluded that the “evidence suggests that drug related violence and high homicide rates are likely a natural consequence of drug prohibition and that increasingly sophisticated and well-resourced methods of disrupting drug distribution networks may unintentionally increase violence.” WERB ET AL., infra note 146, at 5-6.
| 97
There are other policing models — including certain forms of community- and problem-oriented policing — that use arrests as last resorts; embrace an approach to crime prevention in which law enforcement works with social services agencies and community-based organizations to address underlying problems and provide support services such as after-school programs or job training; collaborate with community members, the private sector, and public agencies to enhance public safety; and improve relations and foster trust between communities and police.119
But under the common refrain of maintaining “order” and improving “quality-of-life,” many cities nationwide have subscribed to some form of broken windows and shifted their policing priorities toward the aggressive enforcement of minor offenses. Milwaukee implemented zero-tolerance broken windows policing beginning in 1996.120 Boston announced a crackdown on misdemeanor offenses in 2006, which the Police Commissioner explained was part of the city’s longstanding belief in broken windows policing.121 In 2007, Denver Police implemented broken windows policing in the Cole-Whittier neighborhoods, which was quickly denounced by residents and community leaders as targeting the poor and people of color.122 Across the country, it would appear that these strategies have contributed to the overall rise in misdemeanor arrests, and specifically to the racial disparities in marijuana possession arrests. It is time to pick up the pieces of broken windows policing.
119 See Debra Livingston, Police Discretion and the Quality of Life in Public Places: Courts, Communities, and the New Policing, 97 COLUM. L. REV. 551, 583-84 (1997). According to the Center for Problem-Oriented Policing, problem-oriented policing focuses on “new responses that are preventive in nature, that are not dependent on the use of the criminal justice system, and that engage other public agencies, the community and the private sector when their involvement has the potential for significantly contributing to the reduction of the problem.” What is POP?, CTR. FOR PROBLEM-ORIENTED POLICING, http://www.popcenter.org/about/?p=whatiscpop (last visited Mar. 1, 2013). See generally PETER K. MANNING, DEMOCRATIC POLICING IN A CHANGING WORLD 158-162 (2010) (discussing the failures of modern policing models that shifted away from detective work and engaging with the community to solve crimes, which had traditionally been an important source of citizen contact in disadvantaged communities).120 Arthur L. Jones, 1996-2003, MILWAUKEE POLICE DEP’T, http://city.milwaukee.gov/Police/ArthurJones.htm (last visited Feb. 14, 2013). While marijuana arrests in Milwaukee decreased by 25% in 2004 and then increased by over 100% in 2005, see [italicized] FBI/Uniform Crime Reporting Program Data and U.S. Census Data (2004) & (2005), the number of homicides followed the opposite trend, reaching their lowest in years in 2004 and then rising by 40% in 2005, one of the largest increases in the country. See [italicized] Kathleen Kingsbury, Middle America’s Crime Wave, Time Mag., Dec. 3, 2006, available at http://www.time.com/time/magazine/article/0,9171,1565527,00.html.121 Daniel Brook, The Cracks in ‘Broken Windows’, BOSTON GLOBE, Feb. 19, 2006, available at http://www.boston.com/news/globe/ideas/articles/2006/02/19/the_cracks_in_broken_windows/?page=full. That year, marijuana arrests increased tenfold in Suffolk County (Boston makes up 86% of Suffolk County’s population). FBI/Uniform Crime Reporting Program Data and U.S. Census Data (2005) & (2006). The following year Boston created its Safe Streets Teams under the “community policing” philosophy to address quality-of-life issues and as a crime deterrent; marijuana arrest rates remained constant. Initiatives, CITY OF BOSTON, http://www.cityofboston.gov/police/about/initiatives.asp (last visited Feb. 14, 2013). Not surprisingly, when Massachusetts decriminalized marijuana in 2009, the entire state, including Boston, experienced a dramatic drop in marijuana arrests. See Figure 26. 122 Felisa Cardona, Denver Police Efforts Draw Protests, DENVER POST (Mar. 11, 2007, 1:00AM), http://www.denverpost.com/newsheadlines/ci-5637386.
The Rise in Marijuana Possession Arrests

98 | The War on Marijuana in Black and White
C. The Incentives Behind Making Marijuana Arrests
i. COMPSTAT Performance Measures: Targeting Communities, Rewarding Arrests
Order-maintenance policing reorients police toward the crackdown of minor offenses, but use of COMPSTAT, short for “computer statistics” or “comparative statistics,” has further incentivized some police departments to carry out this crime prevention strategy. Introduced to the NYPD in 1994 by Police Commissioner Bill Bratton and based on a simpler model used by the New York City Transit Police known as Charts of the Future, COMPSTAT is a technological and management system combining police department crime data123 and geographic information with police accountability, purportedly to enable police departments to identify and address specific crime problems quickly and efficiently.124 COMPSTAT monitors crime patterns by location, resulting in the deployment of police resources to specific areas and neighborhoods. COMPSTAT’s accountability system requires precinct commanders to answer for crime rates in their jurisdictions at twice-weekly “Crime-Control Strategy Meetings” with department heads.125 One significant data point by which a police department measures precinct performance is arrest numbers.126 Using the number of arrests as a performance metric necessarily creates pressure, and incentives, for police to generate high numbers of arrests. Higher arrest numbers are easier to obtain by focusing on nonviolent, low-level offenses, which require far less time and resources (including less experienced officers)
123 The fact that police departments rely on their own data collection and entry when they use COMPSTAT has raised questionsabout the accuracy and reliability of COMPSTAT programs. For example, four Florida police agencies discontinued their programsbecause of data inaccuracy. See Janet. E. Hartman, COMPSTAT Within a State-Wide Law Enforcement Agency: Applying New York City Police Department’s Success to The Florida Department of Environmental Protection 4-5 (2009), available at http://www.fdle.state.fl.us/Content/getdoc/8287f764-9d1a-47e3-bd38-27f424077e5b/Hartman-Janet-Research-Paper-pdf.aspx.124 See DAVID WEISBURD ET AL., POLICE FOUND. REPORTS, THE GROWTH OF COMPSTAT IN AMERICAN POLICING 2 (2004) [hereinafter WEISBURD, GROWTH
OF COMPSTAT], available at www.lapdonline.org/inside_the_lapd/pdf_view/6247; Eric Jenner, Computer-Based Crime-Fighting, From the Ground Up, N.Y. TIMES, Dec. 12, 1997, available at http://partners.nytimes.com/library/cyber/week/121297police.html (last visited Feb. 14,2013) (describing COMPSTAT’s growth from a handwritten mapping system to a computerized program).125 WEISBURD, GROWTH OF COMPSTAT, supra note 124, at 2. At such meetings crime statistics are projected on overhead screens,electronic maps are generated to show where crime is occurring, and the hour of the day and crime spike analyses are presented. Id.126 Id., supra note 124, at 3.

| 99
than the longer, intensive investigations required to make arrests for many serious offenses.127
Thus, while COMPSTAT itself does not call for the aggressive enforcement of low-level offenses,128 when used by police departments employing a form of broken windows, it can encourage the aggressive and frequent enforcement of low-level offenses and minor infractions by calling for heavy police resources in areas designated as crime hot spots. One study found that COMPSTAT departments were significantly more likely to increase arrests for targeted offenders.129 The NYPD’s use of COMPSTAT intensified New York City’s quality-of-life initiative by encouraging precinct commanders to enforce laws for minor offenses and pressuring officers to increase arrests in designated areas.130 Indeed, both immediately following and in the years after the implementation of COMPSTAT in New York City, arrests for minor offenses, including marijuana possession, have risen significantly in poor communities of color.131
127 Professor and former NYPD Captain John Eterno has been one of the most vocal critics of New York City’s use of COMPSTAT:
Eighteen years after the start of the much-vaunted COMPSTAT system of data-driven crime fighting … precinct commandersare pitted against one another and officers are challenged to match or exceed what they did the previous year, month andweek. Words like “productivity” are code for quotas. Supervisors must exceed last year’s “productivity” — regardless ofcommunity conditions, available budget and personnel, and, most important, the consequences to citizens.
John A. Eterno, Op-Ed, Policing By the Numbers, N.Y. TIMES, June 17, 2012, available at http://www.nytimes.com/2012/06/18/opinion/the-nypds-obsession-with-numbers.html.128 See WEISBURD, GROWTH OF COMPSTAT, supra note 124, at 2.129 David Weisburd et al., Reforming to Preserve: COMPSTAT & Strategic Problem Solving in American Policing, CRIMINOLOGY & PUB. POL’Y421, 443, tbl.8-C (Jan. 2002) [hereinafter Weisburd, Reforming to Preserve].130 WEISBURD, GROWTH OF COMPSTAT, supra note 124, at 2; Weisburd, Reforming to Preserve, supra note 129, at 425 (discussingthe Police Commissioner’s creation of COMPSTAT as intended to make the organization responsive to leadership). While the NYPDvehemently denies the use of arrest quotas, the Department admits that officers have “performance goals” that they are expected tomeet. Al Baker & Ray Rivera, Secret Tape Has Police Pressing Ticket Quotas, N.Y. TIMES, Sept. 9, 2010, available at http://www.nytimes.com/2010/09/10/nyregion/10quotas.html?pagewanted=all&_r=0. Police officers who have exposed the NYPD’s quota system haveexplained that terms such as “performance measures” or “productivity” are code for quotas, a system in which police are mandated toincrease arrest numbers. See id.; see also Ryan Devereaux, ‘We Were Handcuffing Kids For No Reason’: Stop-and-Frisk Goes on Trial, THE
NATION, March 28, 2013, available at http://www.thenation.com/article/173565/we-were-handcuffing-kids-no-reason-stop-and-frisk-goes-trial#:
‘There came a point in time in 2009 where they came very hard with the quotas. They call it productivity.’ [Active-duty officer Adhyl] Polanco testified. Every day, he and his fellow officers would return from patrol, report to their platoon commander, ‘and specifically tell him what we had done for that night. They will never question the quality,’ he added. ‘They will question the quantity … How we got them, they don’t really care about.’
See also Marina Carver, NYPD Officers Say They Had Stop-and-Frisk Quotas, CNN JUSTICE, March 26, 2013, available at http://www.cnn.com/2013/03/22/justice/new-york-stop-and-frisk-trial; Graham Rayman, The NYPD Tapes: Inside Bed-Stuy’s 81st Precinct, VILLAGE VOICE,May 4, 2010, available at http://www.villagevoice.com/2010-05-04/news/the-nypd-tapes-inside-bed-stuy-s-81st-precinct (exposing howpolice officers are threatened by bosses if they do not make their arrest and stop and frisk quotas, after an eight-year police veteransecretly taped his superiors). In 2006, a New York jury awarded a woman punitive damages for her arrest, finding that “the number ofarrests officers were to make violated plaintiff’s constitutional rights and contributed to her arrest.” Oren Yaniv, Court Rules that Cops Do Use Quotas; Woman Injured in 2006 Arrest Settles for $75,000, N.Y. DAILY NEWS, Feb. 19, 2011, available at http://articles.nydailynews.com/2011-02-19/news/28631245_1_arrest-numbers-quota-decision-false-arrest.131 Before 1995, the NYPD was averaging 2,300 marijuana arrests per year; since then the Department has averaged 36,000marijuana arrests per year. HARRY LEVINE & LOREN SIEGEL, DRUG POLICY ALLIANCE, $75 MILLION A YEAR: THE COST OF NEW YORK CITY’S MARIJUANA
POSSESSION ARRESTS 4 (Mar. 2011), available at http://marijuana-arrests.com/docs/75-Million-A-Year.pdf.
The Rise in Marijuana Possession Arrests

100 | The War on Marijuana in Black and White
A few years after New York’s COMPSTAT program gained wide-scale publicity between 1997 and 1998, there was a noticeable increase in the implementation of COMPSTAT or similar programs by police departments in a number of major cities.132 By 2002, at least 72 police departments in the South, West, Northeast, and North Central regions of the country visited the NYPD to learn more about COMPSTAT.133
Police departments’ use of COMPSTAT, specifically the importance placed on arrest data and measuring police effectiveness by arrest volume in targeted communities, coupled with aggressive stop-and-search operations in designated neighborhoods, has likely contributed to the significant increase in the enforcement of low-level offenses, and thus has likely been a major contributor to the skyrocketing number of marijuana arrests in communities of color.
ii. The Inclusion of Misdemeanor Drug Arrests in Byrne Justice Assistance Grant’s Performance Measures
The drug war is sustained in part by powerful private and public entities that reap handsome profits from large-scale rates of arrests and incarceration, and are thus determined to continue the War on Drugs despite its failure and terrible toll on the community.134
One financial mechanism funding the drug war and its accompanying policing strategies is a federal funding program called the Byrne Justice Assistance Grant
132 Weisburd, Reforming to Preserve, supra note 129, at 432. Law enforcement agencies that implemented COMPSTAT or similar programs include the Lee County Sheriff’s Office in Florida, the Chicago Police Department, the Los Angeles Police Department, the Newark Police Department, the San Francisco Police Department, and the New Haven Police. See EDWARD TAMAYO, LEE COUNTY SHERIFF’S OFFICE, IMPLEMENTING ACCOUNTABILITY AT THE LEE COUNTY SHERIFF’S OFFICE, available at http://www.fdle.state.fl.us/Content/getdoc/b22786b9-e80d-4386-a5a4-1d0e9acdff11/Tamayo-edward-paper-pdf.aspx; WESLEY G. SKOGAN & LYNN STEINER, THE CHI. COMMUNITY POLICING EVALUATION CONSORTIUM, CAPS AT TEN: COMMUNITY POLICING IN CHICAGO 1 (2004), available at https://portal.chicagopolice.org/i/cpd/clearpath/Caps10.pdf; George Gascon, COMPSTAT Plus, LOS ANGELES POLICE DEP’T, http://www.lapdonline.org/inside_the_lapd/content_basic_view/6364; Whet Moser, Meet Garry McCarthy Chicago’s New Top Cop, CHICAGO MAG., (May 2, 2011, 4:57PM), http://www.chicagomag.com/Chicago-Magazine/The-312/May-2011/Meet-Garry-McCarthy-Chicago-s-New-Top-Cop/; COMPSTAT Policing in San Francisco, S.F. POLICE DEP’T, http://www.sf-police.org/index.aspx?page=3254 (last visited Feb. 14, 2012); James Lu, Esserman Brings “COMPSTAT” to NHPD, YALE DAILY NEWS, Feb. 8, 2012, available at http://yaledailynews.com/blog/2012/02/08/esserman-brings-COMPSTAT-to-nhpd/. In 2000, the new Police Commissioner of Baltimore, Edward T. Norris, introduced a NYPD-style COMPSTAT to the city. JOHN A. ETERNO & ELI B. SILVERMAN, THE CRIME NUMBERS GAME: MANAGEMENT BY MANIPULATION 228 (2012). Coupled with aggressive zero-tolerance enforcement of quality-of-life offenses, the Baltimore Police Department was ultimately sued in 2006 for routine arrests without probable cause. Id. A settlement agreement was reached that included “establishing policies to handle properly Quality of Life violations, trainings, tracking compliance, and having effective oversight.” Id. Philadelphia, New Orleans, and Newark also emulated the COMPSTAT process, and every one of these cities has come under investigation or court monitoring for civil rights violations. Id. at 229.133 See WEISBURD, GROWTH OF COMPSTAT, supra note 124, at 11, fig.5; Weisburd, Reforming to Preserve, supra note 129, at 431. 134 For instance, the private prison industry has prospered immensely from the incarceration epidemic, and hence from the drug war; in 1990, there were 7,000 people incarcerated in private prisons. By 2009, the population had increased by 1,664% to 129,336, making the private prison industry a $3-billion-a-year business. DAVID SHAPIRO, ACLU, BANKING ON BONDAGE: PRIVATE PRISONS AND MASS INCARCERATION 11, 13 (2011), available at http://www.aclu.org/files/assets/bankingonbondage_20111102.pdf (providing a comprehensive overview of the growth of the private prison industry and how its business model is dependent on mass incarceration and the creation of more prison beds).

| 101
(JAG) program. Established in 1988, the Edward Byrne Memorial State and Local Law Enforcement Assistance Program provides states and local units of government with funding to improve the functioning of their criminal justice system and to enforce drug laws.135 Under what is now called the Justice Assistance Grant Program (JAG), each state is required to develop a statewide strategy for their criminal justice systems, focusing specifically on drug trafficking, violent crime, and serious offenders. There are seven general program areas for which funding can be used: 1) law enforcement; 2) prosecution and courts; 3) crime prevention and education; 4) corrections and community corrections; 5) drug treatment and enforcement; 6) planning, evaluation, and technology improvement; and 7) crime victim and witness. However, of the half a billion dollars spent every year on average in jurisdictions across the country through the Byrne JAG Program, over 50% is used to fund law enforcement activities.136
Law enforcement agencies can apply for JAG funds from two sources: either directly through the Bureau of Justice Assistance (BJA), or through each state’s administering agency, which applies for grants from the BJA and then awards subgrants to local law enforcement agencies. In so doing, law enforcement agencies must set forth their project goals, objectives, and performance measures. As one state Attorney General explained to prospective grantees, “objectives must be clearly expressed and in measurable terms. … Example: Increase the number of drug-related arrests by 10 percent . … [An example of] Performance Measures [are]: Number of drug-related arrests [for a given year].”137 Local law enforcement agencies, whether they receive direct funds or subgrants, are required to submit quantitative quarterly performance
135 The Byrne Grant programs were authorized by the Anti-Drug Abuse Act of 1988. 21 USC § 1501, P. L. No. 100-690 (1988). The original Byrne Grant programs had two components, a formula grant program (Byrne Formula Grant program) and a discretionary grant program (Byrne Discretionary Grant program). Funds awarded to states under the Byrne Formula Grant program were to be used to provide personnel, equipment, training, technical assistance, and information systems for more widespread apprehension, prosecution, adjudication, detention, and rehabilitation of offenders who violate state and local laws. Grant funds could also be used to provide assistance to victims of crime. The Local Law Enforcement Block Grant Program (LLEBG) is another formula grant program that was authorized by Congress in 1995. The LLEBG program was established under the Omnibus Consolidated Rescissions and Appropriations. P.L. 104–134, 110 Stat. 1321 (1996). The purpose of the LLEBG program was to provide units of local government with federal grant funds so they could either hire police officers or create programs that would combat crime and increase public safety. In 2005, Congress combined the Byrne Grant program with the LLEBG into the Edward Byrne Memorial Justice Assistance Grant program (JAG) to streamline the application process for the states.136 NAT’L CRIM. JUST. ASS’N, BUREAU OF JUST. ASSISTANCE, CORNERSTONE FOR JUSTICE: BYRNE JAG AND ITS IMPACT ON THE CRIMINAL JUSTICE SYSTEM 2 (2011), available at https://www.bja.gov/Publications/NCJA_JAGReport.pdf.137 Office of Att’y General of North Dakota, Edward Byrne Memorial State and Local Law Enforcement Assistance Program for Drug and Violent Crime Control Initiatives: Program Guidelines and Application Kit 14 (2004), available at www.ag.state.nd.us/bci/grants/byrne/Application.pdf. (emphasis omitted). Similarly, the application instructions for Byrne grant funding from the State of Louisiana Commission on Law Enforcement and the Administration of Criminal Justice states that “[m]easurable objectives use the words ‘to increase,’ ‘to decrease,’ or ‘to maintain.’ … These are activity statements. Once the objectives are written, ask, ‘Does the statement allow you to measure something?’ The number that will be increased, decreased or maintained directly relates to the baseline statistics.” The Commission gives the following example: “To increase the number of drug arrests from 300 to 350 within the twelve month period. Regarding “Prior Results” for continuing projects, the Commission notes: “Applications for continuation funding must describe the program’s activities and accomplishments to date. This should include a summary of the previous funding project’s activities such as, the number of arrests, drugs seized, the recidivism rate, policies and/or products developed, and data concerning the project’s progress up to the time of application in meeting its goals.” LOUISIANA COMM’N ON LAW ENFORCEMENT & THE ADMIN. OF CRIMINAL JUST., EDWARD BYRNE MEMORIAL/JUSTICE ASSISTANCE GRANT (JAG) PROGRAM, APPLICATION INSTRUCTIONS 13-14 (July 2010), available at http://www.lcle.la.gov/programs%5Cuploads%5CByrne%5CByrne_JAG_App_Instruct_rev_072010.pdf.
The Rise in Marijuana Possession Arrests
102 | The War on Marijuana in Black and White
measure reports, quarterly Federal Financial Status Reports, and quantitative and qualitative annual programmatic performance reports.138 Indeed, along with reporting the number of investigations and prosecutions, agencies receiving funds for law enforcement purposes are required to report the total number of arrests as part of their “performance measures.”139 JAG does not restrict the categories of arrests in its performance measures to felonies or serious drug cases. Rather, all drug arrests, including misdemeanors (such as for marijuana possession), must be reported to the BJA as a condition of receiving federal funds.140 Because JAG does not limit the categories of arrests in its performance measures to felony arrests, or arrests for more serious drug offenses — as one would expect given the program’s original purpose of fighting serious, violent drug crime — police agencies are able to increase their productivity numbers by including arrests for mere possession, including marijuana possession. When submitting annual reports to the BJA, law enforcement agencies may improve the likelihood of receiving federal grants by measuring performance through the enforcement of low-level offenses, and thus perhaps demonstrating the “effectiveness” of BJA-funded activity. Thus, although JAG funding was initially designed to address major drug crime, by linking police budgets to drug law enforcement and including the number of drug arrests in states’ and law enforcement agencies’ productivity assessments, the Byrne Grant system enables — and, indeed, likely incentivizes — police departments to increase arrests for low-level drug possession.
Indeed, in a civil rights lawsuit brought in the early 1990s against members of a Byrne-funded task force, the Ninth Circuit Court of Appeals provided a disturbing description of how police agencies’ dependence on federal funding drives them to generate high arrest numbers:
138 U.S. DEP’T OF JUST., EDWARD BYRNE MEMORIAL JUSTICE ASSISTANCE GRANT (JAG) PROGRAM: FY 2011 STATE SOLICITATION 7 (2011), available at https://www.bja.gov/evaluation/pm-solicitations/FY11_Byrne_State_Justice_Assistance_Grant_Program.pdf; see also Edward Byrne Memorial Justice Assistance Grant (JAG) Program, Frequently Asked Questions 12 (updated Aug. 2012), available at https://www.bja.gov/Funding/JAGFAQ.pdf.139 The Bureau of Justice Assistance (BJA) uses a variety of performance measures to evaluate the activities for which funds are being used, including arrests. See BUREAU OF JUST. ASSISTANCE, PROGRAM PERFORMANCE MEASURES FOR AMERICAN RECOVERY AND REINVESTMENT ACT (ARRA) AND JUSTICE ASSISTANCE GRANT (JAG) PROGRAMS (2010) [hereinafter BJA, PERFORMANCE MEASURES (2010)], available at https://www.bjaperformancetools.org/help/ARRAJAGandJAGCombinedIndicatorGrid.pdf (discussing the JAG performance measures, including the number of people arrested). Agencies must submit data into a Performance Measurement Tool (PMT), which requires that they “report on all performance measures that pertain to funded activity.” BUREAU OF JUST. ASSISTANCE, BUREAU OF JUSTICE ASSISTANCE PROGRAM PERFORMANCE MEASURES FOR JUSTICE ASSISTANCE GRANT (JAG) PROGRAMS 1 (Jan. 2012), available at https://www.bja.gov/Programs/JAG_Questionnaire_PA1_Law%20Enforcement.pdf. For agencies receiving grant monies for law enforcement purposes, number of arrests is one of the metrics used to measure performance. See id. at 6. Agencies are asked to report total number of arrests, how many of these arrests were misdemeanor arrests, and how many of these arrests were felony arrests. See id. at 6-7. The BJA also asks for an itemization of the amount of drugs seized, including marijuana. See id. at 7.140 See Michelle Alexander, Op-Ed, Why Police Lie Under Oath, N.Y. TIMES, Feb 2, 2013, available at http://www.nytimes.com/2013/02/03/opinion/sunday/why-police-officers-lie-under-oath.html (“Agencies receive cash rewards for arresting high numbers of people for drug offenses, no matter how minor the offenses or how weak the evidence. Law enforcement has increasingly become a numbers game”).

| 103
[The commander] ... regularly exhorted Task Force officers to keep their arrest numbers up. All the officers were aware that the federal grant that funded their unit, and on which their jobs depended, was good for only eighteen to twenty-four months. [The commander] warned that they would need statistics to show that the federal money was well spent and thus to secure another grant. On more than one occasion, he sent the Task Force out to begin a shift with comments like, “Let’s go out and kick ass,” and “[E]verybody goes to jail tonight for everything, all right?”141
As far back as 1973, the National Commission warned against perverse financial incentives embedded in the structure of early drug war funding programs:
The funding mechanism is so structured that it responds only when “bodies” can be produced or counted. Such a structure penalizes a reduction in the body count, while it rewards any increase in incidence figures and arrest statistics with more money. Those receiving funds thus have a vested interest in increasing or maintaining those figures.142
Four decades later, states remain heavily dependent on federal funding such as Byrne grants,143 and the federal government continues to evaluate the performance of law enforcement agencies receiving Byrne money in part through the number of people arrested, rather than by more appropriate and logical barometers, such as decreases in drug use, availability, addiction, overdoses, and deaths.144
Even if the decision to award, or to continue to award, the federal block grant to a local enforcement agencies is not directly or indirectly tied to reported arrest data, the mere fact of receiving money for the purpose of drug law enforcement likely incentivizes local enforcement agencies to make drug arrests, and low-level drug arrests in
141 United States v. Reese, 2 F.3d 870, 874 (9th Cir. 1993). 142 See DRUG USE IN AMERICA: PROBLEM IN PERSPECTIVE, supra note 78, at 282.143 The National Criminal Justice Association, along with dozens of other law enforcement associations, submitted a letter to Congress in 2011 explaining the critical role that JAG funding plays for local and state law enforcement:
Jobs are created and retained across America because of the investment of Byrne JAG dollars, in direct law enforcement, local government … as well as the ample multiplier effect which increase jobs and economic activity in our communities. … Because of Byrne JAG’s reach, this dynamic is at play in every pocket of our country.
Letter from the Nat’l Stakeholder Coalition on Byrne JAG Funding to the Senate Appropriations Subcomm. on Commerce, Justice, Science, and Related Agencies (Sept. 9, 2011), available at http://www.naco.org/legislation/policies/Documents/Justice%20and%20Public%20Safety/National%20Stakeholder%20Coalition%20Letter%20on%20Byrne%20JAG%20Funding%20-%209-9-11%20-%20with%20signatures.pdf.144 See generally Christopher Hallam & David R. Bewley-Taylor, Mapping the World Drug Problem: Science and Politics in the United Nations Drug Control System, 21 INT’L J. OF DRUG POL’Y 1 (2010) (discussing the current limitations in assessing the global use of drugs and the drug problem).
The Rise in Marijuana Possession Arrests

104 | The War on Marijuana in Black and White
particular, including for marijuana possession. In other words, providing state and local enforcement agencies with federal grants for drug law enforcement purposes means that some, if not all, of this money will be spent making arrests. To the extent that these arrests are for UCR Part I violent crimes, this promotes the original goals and objectives of the Byrne JAG Program. But since drug enforcement is a key priority of JAG funding, many agencies will use such funds to make arrests for low-level drug offenses, which, as this report has exhaustively documented, almost always have a racially disparate impact. In these circumstances, the results of such federal funding for law enforcement purposes are of significant concern and deserve further scrutiny.
In short, the overall financial structure of the drug war, and the Byrne JAG program in particular, may propel police departments to increase minor drug arrests using federal funds.145 Through its substantial funding of drug law enforcement and its inclusion of misdemeanor drug arrests as a performance measure for law enforcement agencies reporting requirements, the United States government has, it appears, been a driving force in the increase of such arrests, which are disproportionately of people of color. Indeed, while police agencies benefit from JAG funding that increases law enforcement budgets, individuals living in communities where police departments concentrate arrests can pay a costly price. While further study is necessary on the effect that federal funds, and the prospective and retrospective performance measures regarding the use of those funds, have on the number of low-level drug arrests generated by agencies vying for or receiving such funds, it is noteworthy that since the federal government first began distributing JAG funds in 1989, the arrest rate for marijuana possession has increased dramatically.
145 Another financial incentive of the drug war can be found in the asset seizure section of the 1984 federal ComprehensiveCrime Act, which provides police departments with another means by which they benefit financially from the War on Drugs. The lawenables police — without having to even make an arrest, let alone wait for a criminal conviction — to seize assets (usually money)from individuals that the police claim are connected to illicit (most often drug) activities, assets which are often then awarded to thepolice in part or in whole after forfeiture, thereby allowing police to increase their discretionary budgets through civil asset seizuresand forfeitures. One study found that state asset forfeiture laws permitting police to keep assets seized provide an institutionalincentive for police to commit relatively more resources to drug offenses. See Brent D. Mast, Bruce L. Benson & David W. Rasmussen,Entrepreneurial Police and Drug Enforcement Policy, 104 PUB. CHOICE 285, 301 (2000), available at http://mailer.fsu.edu/~bbenson/PC2000.pdf. The authors found that drug arrests as a portion of total arrests is about 20% higher, and drug arrest rates are 18% higher in statesthat have such laws. Id. at 303. Scholars further argue that asset forfeiture laws that permit police departments to keep seized propertyhave created a law enforcement agenda that targets assets rather than crime. See Eric Blumenson & Eva S. Nilsen, Policing for Profit: The Drug War’s Hidden Economic Agenda, 65 U. CHI. L. REV. 35 (1998). For example, the Volusia County, Florida, Sheriff’s Department’sdrug squad seized over $8 million from motorists in a 41-month period from 1989 to 1992. DAVID W. RASMUSSEN & BRUCE L. BENSON, THE
ECONOMIC ANATOMY OF A DRUG WAR: CRIMINAL JUSTICE IN THE COMMONS 136 (1994). Most of the seizures involved motorists traveling southbound,rather than northbound, suggesting that the drug squad was more interested in seizing money than drug interdiction (since drugsseized are normally destroyed and thus have no monetary value for police). Id. at 136-37. Additionally, there were no criminal chargesfiled in over 75% of the seizure cases. Id. at 137. See generally MARIAN R. WILLIAMS, JEFFERSON E. HOLCOMB, & TOMISLAV V. KOVANDZIC, INST. FOR
JUST., POLICING FOR PROFIT: THE ABUSE OF CIVIL ASSET FORFEITURE (2010), available at http://www.ij.org/policing-for-profit-the-abuse-of-civil-asset-forfeiture-4.

| 105
PROFILE
SAM CourtA Pilot Marijuana Court Program in Philadelphia That Seeks to Reduce Marijuana Penalties Fails to Solve the Underlying Problem: An Unending Influx of People Arrested for Marijuana Possession
Among the numerous consequences of arresting so many people for marijuana are states, and cities, struggles to process them through overburdened criminal justice systems. In a time when jurisdictions
across the country are trying to save money, it is an expensive endeavor. Philadelphia, which in 2010 made 5,590 arrests for marijuana possession (82% of which were of Black people) — representing 27.7% of all drug arrests that year — responded by creating the Small Amounts of Marijuana (SAM) Court, a diversion program that treats people arrested with 30 grams or less of marijuana as a summary offense rather than a misdemeanor, designed to unclog the court system and free up prosecutors to focus on serious crimes. “We were spending thousands of dollars for when someone possessed $10 or $15 worth of weed,” District Attorney Seth Williams told the Philadelphia Daily News in 2011. “It just didn’t make any sense.”
In SAM Court, a magistrate offers the choice of the program or a trial. The program consists of a two-hour class taught by a lawyer and costs $200, a price the District Attorney’s Office says covers running the class. No plea is entered, and if the defendant pays the fee and completes the class, his or her record is expunged automatically.
Three years on, the results of the program are mixed. The program did initially slow the flow of cases into criminal court, and, according to
Of course, a better and significantly more far-reaching approach would be for the police and prosecutors to stop enforcing marijuana possession laws altogether, obviating the need for SAM in the first place.
Profile
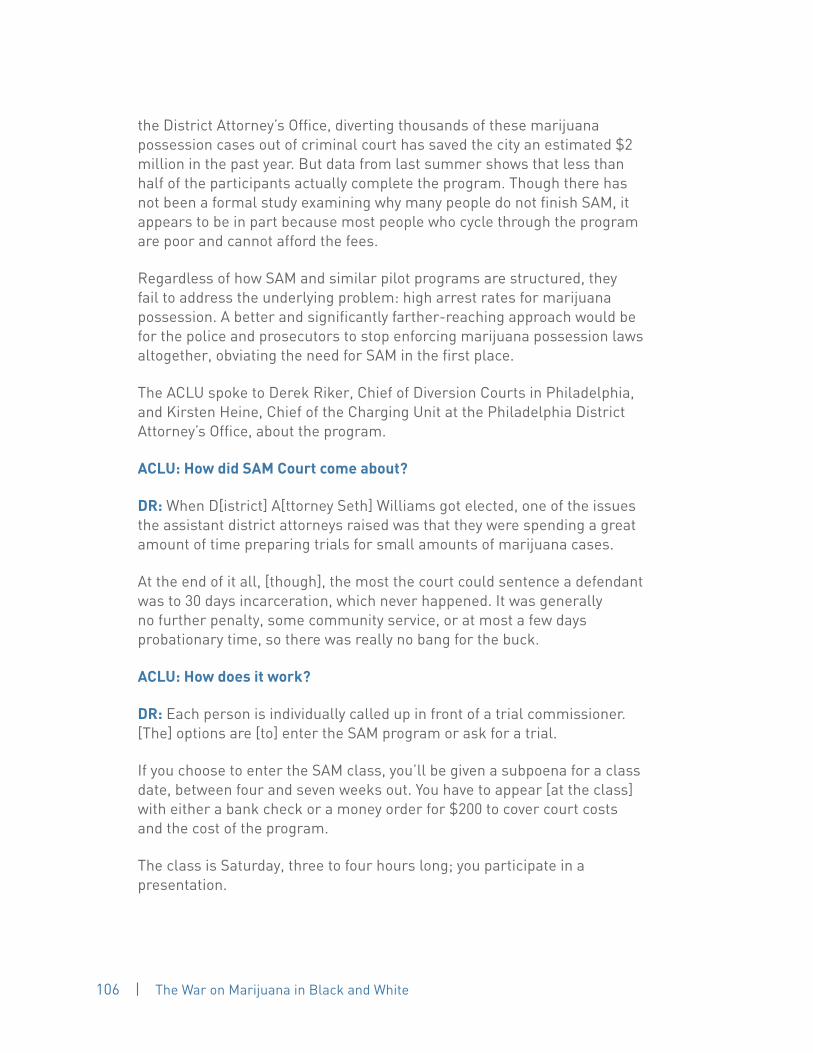
106 | The War on Marijuana in Black and White
the District Attorney’s Office, diverting thousands of these marijuana possession cases out of criminal court has saved the city an estimated $2 million in the past year. But data from last summer shows that less than half of the participants actually complete the program. Though there has not been a formal study examining why many people do not finish SAM, it appears to be in part because most people who cycle through the program are poor and cannot afford the fees.
Regardless of how SAM and similar pilot programs are structured, they fail to address the underlying problem: high arrest rates for marijuana possession. A better and significantly farther-reaching approach would be for the police and prosecutors to stop enforcing marijuana possession laws altogether, obviating the need for SAM in the first place.
The ACLU spoke to Derek Riker, Chief of Diversion Courts in Philadelphia, and Kirsten Heine, Chief of the Charging Unit at the Philadelphia District Attorney’s Office, about the program.
AClU: how did SAM Court come about?
dR: When D[istrict] A[ttorney Seth] Williams got elected, one of the issues the assistant district attorneys raised was that they were spending a great amount of time preparing trials for small amounts of marijuana cases.
At the end of it all, [though], the most the court could sentence a defendant was to 30 days incarceration, which never happened. It was generally no further penalty, some community service, or at most a few days probationary time, so there was really no bang for the buck.
AClU: how does it work?
dR: Each person is individually called up in front of a trial commissioner. [The] options are [to] enter the SAM program or ask for a trial.
If you choose to enter the SAM class, you’ll be given a subpoena for a class date, between four and seven weeks out. You have to appear [at the class] with either a bank check or a money order for $200 to cover court costs and the cost of the program.
The class is Saturday, three to four hours long; you participate in a presentation.

| 107
You’re also given a second subpoena for what’s called a status date. If [for] any reason you miss the [SAM class], you already have a preset date to return to court.
AClU: There’s no guilty plea involved?
dR: You’re not entering a plea. If you complete the class, no plea is ever entered, your case is just withdrawn, and eventually your record is expunged. No paperwork needs to be filed. No additional fee.
AClU: So it’s about getting people through the system, not decriminalizing marijuana?
kh: It’s the legislature’s choice to classify marijuana the way it has. People often say, ‘You decriminalized marijuana.’ And I say, ‘That’s not true; we haven’t decriminalized marijuana.’
The police department is going to continue arresting people. That’s something you have to talk to them about. I think they have some feelings about the impact on the community of people smoking marijuana in whatever community they’re policing. I agree with their concerns. I think the question becomes, what is the appropriate penalty for that?
We still process [defendants]. But we’ve changed the way that we deal with them in the court system.
AClU: Who ends up in SAM court? on the day I went, there were 21 African-Americans and 2 white people. Is that typical?
kh: I’ve been asked the question so many times: do you consider race in making your decisions?
I can’t speak to whom the police department arrests. When we charge people, we have no idea who they are. So I really don’t think [race] impacts what we do at all.
dR: My personal speculation as to why you’re going to end up with those kinds of results [is] because more crime in Philadelphia is in areas that are populated by more minorities. So we have more police forces dedicated to those areas, [which] just increases your chances of encounter.
Profile

108 | The War on Marijuana in Black and White
PROFILE
Roderick Battle, 29 Memphis, Tn
Right before the Memphis police arrested Roderick Battle, they told his nine-year-old daughter not to worry. They said, “Don’t worry about anything. He’s not going to go to jail. Daddy’s going to be fine.” But
when they found marijuana in the apartment where Mr. Battle was hanging out with a friend, “They ended up arresting me anyway. That hurt my daughter. It hurt her real bad,” Mr. Battle said.
As Mr. Battle tells it, he was at his friend’s house the day it happened. The friend was outside parking his car, when the police stopped him and started asking questions. Mr. Battle peered out the door to see what was going on.
The police saw him and told him not to move. But Mr. Battle, who had a bag of marijuana in his pocket, panicked, and moved away from the door.
“I came back to the door and the police were already coming in with guns out.”
The police handcuffed him. When they asked if they would find anything in the apartment, Mr. Battle was honest. “There’s marijuana. It’s mine, I can’t lie.”
As the police tell it, they were getting ready to search the apartment. They saw what they thought was a marijuana cigarette on the coffee table. They claim that Mr. Battle, who was standing nearby, said that the marijuana was his.
In any case, it is undisputed that the police arrested Mr. Battle and charged him with possession with intent to distribute, a felony. He was lucky it took only a day to get him out of jail, but his wife had to borrow money
When Mr. Battle was arrested, he said he spent the whole time worrying, “Who’s going to take care of the kids? Who’s going to be there when they get out of school?”
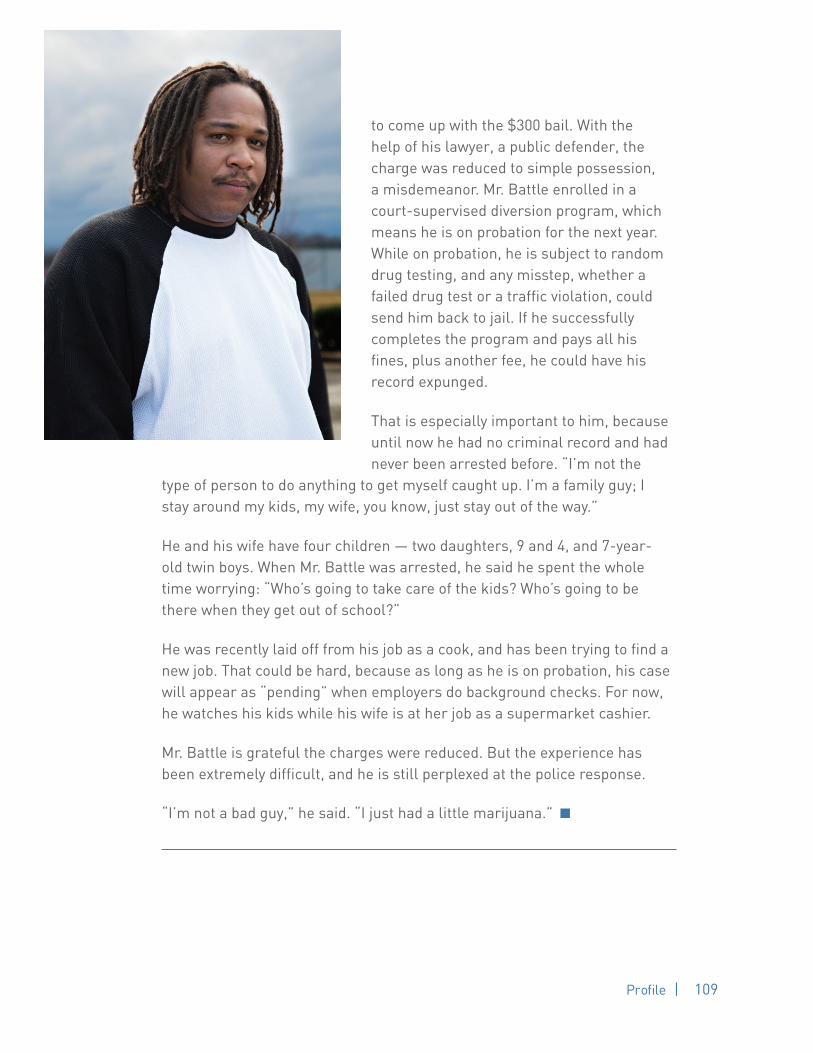
| 109
to come up with the $300 bail. With the help of his lawyer, a public defender, the charge was reduced to simple possession, a misdemeanor. Mr. Battle enrolled in a court-supervised diversion program, which means he is on probation for the next year. While on probation, he is subject to random drug testing, and any misstep, whether a failed drug test or a traffic violation, could send him back to jail. If he successfully completes the program and pays all his fines, plus another fee, he could have his record expunged.
That is especially important to him, because until now he had no criminal record and had never been arrested before. “I’m not the
type of person to do anything to get myself caught up. I’m a family guy; I stay around my kids, my wife, you know, just stay out of the way.”
He and his wife have four children — two daughters, 9 and 4, and 7-year-old twin boys. When Mr. Battle was arrested, he said he spent the whole time worrying: “Who’s going to take care of the kids? Who’s going to be there when they get out of school?”
He was recently laid off from his job as a cook, and has been trying to find a new job. That could be hard, because as long as he is on probation, his case will appear as “pending” when employers do background checks. For now, he watches his kids while his wife is at her job as a supermarket cashier.
Mr. Battle is grateful the charges were reduced. But the experience has been extremely difficult, and he is still perplexed at the police response.
“I’m not a bad guy,” he said. “I just had a little marijuana.”
Profile

110 | The War on Marijuana in Black and White
VII. RECOMMENDATIONS
A. Marijuana Policyi. Legalize Marijuana Use and Possession
The most effective way to eliminate arrests for marijuana use and possession, the racial disparities among such arrests, and the Fourth Amendment violations that often accompany such arrests, is to legalize marijuana. For instance, in Washington, Blacks were almost three times more likely to be arrested for marijuana possession as whites, and the Black/white racial disparity in marijuana possession arrests increased by 42% between 2001 and 2010. By passing Initiative 502, which legalized possession of marijuana for people 21 years or older and thus ended arrests of adults for possession, Washington has also ended such racial disparities with respect to marijuana possession arrests of people 21 years or older.
Marijuana legalization should occur through a system of taxation, licensing, and regulation under which private businesses licensed and regulated by the state can sell marijuana subject to a sales tax. Legalization through taxing and licensing would not only solve the arrests epidemic and its attendant racial disparities by removing
marijuana possession and use from the criminal justice system, it would also save cash-strapped state and local governments millions of dollars in decreased police, jail, and court costs that could be redirected to supporting public health approaches to drug addiction and confronting more serious crime. For example, in 2010, 61% of all drug arrests in Colorado were for marijuana possession, the ninth
highest percentage share in the country. Following passage of Amendment 64, which legalized marijuana possession for adults, police can reinvest those resources toward other more important public health and safety objectives. At the same time, legalization through taxation and regulation would raise new revenue that states could apportion to public schools, substance abuse prevention, including community- and school-based programs, as well as to general funds, local budgets, research and health care.
Legalization would not only solve the arrest epidemic and its attendant racial disparities, it would save cash-strapped state and local governments millions of dollars.

| 111
The legalization of marijuana will also provide more seriously ill patients with critical access to a medicine that can alleviate their pain and suffering without the harmful side effects – such as nausea or loss of appetite – of many prescription medicines. Currently there are 19 states, along with the District of Columbia, that allow marijuana for medicinal purposes.
Legalization would also reduce the demand for marijuana from Mexico, thereby removing the profit incentives of the Mexican marijuana trade and reducing its associated violence.146 Indeed, one study estimates that the marijuana legalization laws in Colorado and Washington will deprive Mexican drug cartels of $1.425 and $1.372 billion in profits, respectively.147
Therefore, states should:
• License, tax, and regulate marijuana production, distribution, and possession for persons 21 or older148
• Remove criminal and civil penalties for activities so authorized
• Tax marijuana sales
• Earmark marijuana-related revenues to public schools and substance-abuse prevention, including community- and school-based programs, as well as general funds, local budgets, research and health care
The specific contours of regulation will vary from jurisdiction to jurisdiction, depending on local laws and public opinion. For instance, in Washington, Initiative 502 prohibits home growing of marijuana except for medical marijuana patients, whereas in Colorado, home growing is permitted. Therefore, this report offers examples of regulations for potential consideration as opposed to endorsing a fixed set of rules for every jurisdiction. Initiative 502 in Washington provides one regulatory model: it ensures
146 In 2009, California recognized “the linkages between drug demand in the US and violence in Mexico, as well as the recent fiscal deficit, [prompting] the State Board of Equalization to prepare estimates of the potential revenue from a regulated marijuana market.” DAN WERB ET AL., INT’L CTR. FOR SCIENCE IN DRUG POL’Y, EFFECT OF DRUG LAW ENFORCEMENT ON DRUG-RELATED VIOLENCE: EVIDENCE FROM A SCIENTIFIC REVIEW 20 (2010) [hereinafter WERB ET AL.], available at http://www.icsdp.org/docs/ICSDP-1%20-%20FINAL.pdf. Vicente Fox, the former president of Mexico, has has also advocated for the legalization of marijuana in Mexico to end the drug violence caused by organized crime. See Rafael Romo, Former Mexican President Urges Legalizing Drugs, CNN.COM, Jul. 26, 2011, http://articles.cnn.com/2011-07-26/world/mexico.drugs_1_drug-cartels-drug-policy-drug-violence?_s=PM:WORLD (last visited Apr. 10, 2013).147 Olga Khazan, How Marijuana Legalization Will Affect Mexico’s Cartels, in Charts, WASH. POST (Nov. 9, 2012, 4;24 PM), http://www.washingtonpost.com/blogs/worldviews/wp/2012/11/09/how-marijuana-legalization-will-affect-mexicos-cartels-in-charts/ (citing the Mexican Competitiveness Institute’s 2012 study). The RAND Corporation estimates that the Mexican cartels stand to lose $1.5 billion per year if the United States were to legalize marijuana, a slightly lower yet still significant figure. See KILMER ET AL., supra note 95, at 3.148 Since legalization for persons over 21 still exposes persons under 21 to criminal sanctions, and given that 42% of people arrested for marijuana possession in 2010 were 20 and younger, when legalizing use and possession for persons 21 or older, states should decriminalize marijuana use and possession for persons under 21 by reclassifying such activity as a civil offense subject only to a fine. If decriminalization for persons under 21 is unobtainable, police departments and prosecutors should make marijuana use and possession for people under 21 a low enforcement priority.
Recommendations

112 | The War on Marijuana in Black and White
that establishments licensed to sell marijuana are located at least 1,000 feet from schools, playgrounds, and parks, and do not display marijuana in a way that is visible to the public; limits availability to stores that sell no products other than marijuana; prohibits public use and display of marijuana; prohibits sales to minors; restricts advertising generally and bans advertising in places frequented by youth;149 and establishes a standard for driving under the influence of marijuana (i.e., active THC content) that would operate like the alcohol DUI standards. State agencies can also regulate the numbers of stores per county, operating hours, security, quality control, labeling, and other health and safety issues.
Marijuana legalization through a tax and regulate system should not mandate state employees to grow, distribute, or sell marijuana, as such conduct would require state officials to violate federal law and thus likely be preempted by federal law (the Controlled Substances Act, 21 U.S.C. §801) as it now stands. But legalization laws can require state officials to perform administrative, ministerial, and regulatory duties necessary to implement and oversee state laws and regulations.
As a society, we permit the controlled use of alcohol and tobacco, substances that are dangerous to health and at times to public safety. We educate society about those dangers, and have constructed a system of laws that allow for the use and possession of these substances while seeking to protect the public from their dangers. There is no reason, particularly given the findings of this report, that such a system cannot and should not also be constructed for marijuana use and possession.
ii. Depenalize Marijuana Use and Possession
If legalizing marijuana through taxation and licensing is unobtainable, states can take significant steps toward reducing marijuana arrests and their damaging consequences
149 When drafting legalization legislation to regulate the possession and sale of marijuana, proponents should be cognizant of federal — and often similar state — laws regarding drug-free school zones, see 21 U.S.C. § 860(a), which enhance penalties for violating federal drug laws if such violations occur within 1,000 feet of a public or private elementary, vocational, or secondary school or a public or private college, junior college, or university, or a playground, or housing facility owned by a public housing authority. Jurisdictions should also be aware of local laws regulating liquor sales, advertising, and licenses, as they may provide a helpful if not necessary guide to regulating marijuana sale, advertising, and licenses.
If legalizing marijuana is unobtainable, states can significantly reduce marijuana arrests and their damaging consequences through depenalization. Decriminalization is a viable third option.

| 113
by removing all criminal and civil penalties for marijuana use and possession.150 Under depenalization, there would be no arrests, prosecutions, tickets, or fines for marijuana use or possession, as long as such use and possession complied with any existing regulations governing such activity.151
Depenalization not only removes marijuana possession and use from the grasp of the criminal justice system, it avoids the pitfalls associated with replacing criminal penalties with civil penalties (see Recommendation #3 below).
Therefore, states should:
• Amend their current criminal and civil statutes to remove all penalties for persons 21 or older for possession of marijuana for personal use (the amount could be, for example, limited to an ounce or less, but this can be determined on a state by state basis)
iii. Decriminalize Marijuana Use and Possession
If both legalizing marijuana use and possession through taxation and regulation and depenalization are unobtainable, states can take steps toward reducing marijuana arrests by decriminalizing marijuana possession for adults and youth.152 Decriminalization replaces all criminal penalties for marijuana use and possession with civil penalties. Massachusetts provides a useful case study on the impact that decriminalization can have on reducing marijuana arrests.153 In 2009, Massachusetts decriminalized adult possession of an ounce or less of marijuana for personal use, with a maximum civil penalty of a $100 fine and forfeiture of the marijuana (anyone
150 For the reasons stated in footnote 148, since depenalization for persons over 21 still exposes persons under 21 to criminalsanctions, states should decriminalize marijuana use and possession for persons under 21 by reclassifying such activity as a civiloffense subject only to a fine. If decriminalization for persons under 21 is unobtainable, police departments and prosecutors shouldmake marijuana use and possession for people under 21 a low enforcement priority.151 In Alaska, marijuana possession and use inside of the home has long been protected from penalty as a matter of privacy underthe state constitution. See Ravin v. State, 537 P.2d 494, 504 (Alaska 1975).152 Passed in 2010 and taking effect in January 2011, California’s SB 1449 reduced simple marijuana possession for adults and youthto an infraction involving a citation rather than a criminal arrest. A research brief by the Center on Juvenile and Criminal Justice foundthat the new law reduced marijuana possession arrests of youth by 61% in just one year, from 15,000 in 2010 to 5,800 in 2011, andcontributed to the 20% overall drop in arrests of youth under 18. MIKE MALES, CTR. ON JUV. & CRIM. JUST., CALIFORNIA YOUTH CRIME PLUNGES TO
ALL-TIME LOW 7 (2012), available at http://www.cjcj.org/files/CA_Youth_Crime_2011.pdf. While proponents of zero-tolerance policing mightpredict an attendant spike in youth crime, the opposite occurred. Crime among youths fell in all categories in 2011 — felony arrestsby 17%, both violent and property felonies by 16%, misdemeanor and status offenses by 21%, and homicide by 26%, indicating thatmarijuana decriminalization not only reduces arrests, but can be accompanied by a simultaneous decrease in crime. See id. at 1.153 Other jurisdictions that have recently decriminalized possession of small amounts of marijuana include Rhode Island, whichpassed legislation in 2012 that will take effect in April 2013 making possession of an ounce or less of marijuana a civil violation subjectto a fine of $150, see Mike McKinney, R.I. Gov. Chafee Signs into Law Decriminalization of Small Amounts of Marijuana, PROVIDENCE J., June13, 2012, available at http://news.providencejournal.com/breaking-news/2012/06/ri-gov-chafee-s-6.html, and Chicago, which in 2012allowed police to issue tickets instead of make arrests for possession of 15 grams or less of marijuana. See Mack, supra note 25.
Recommendations
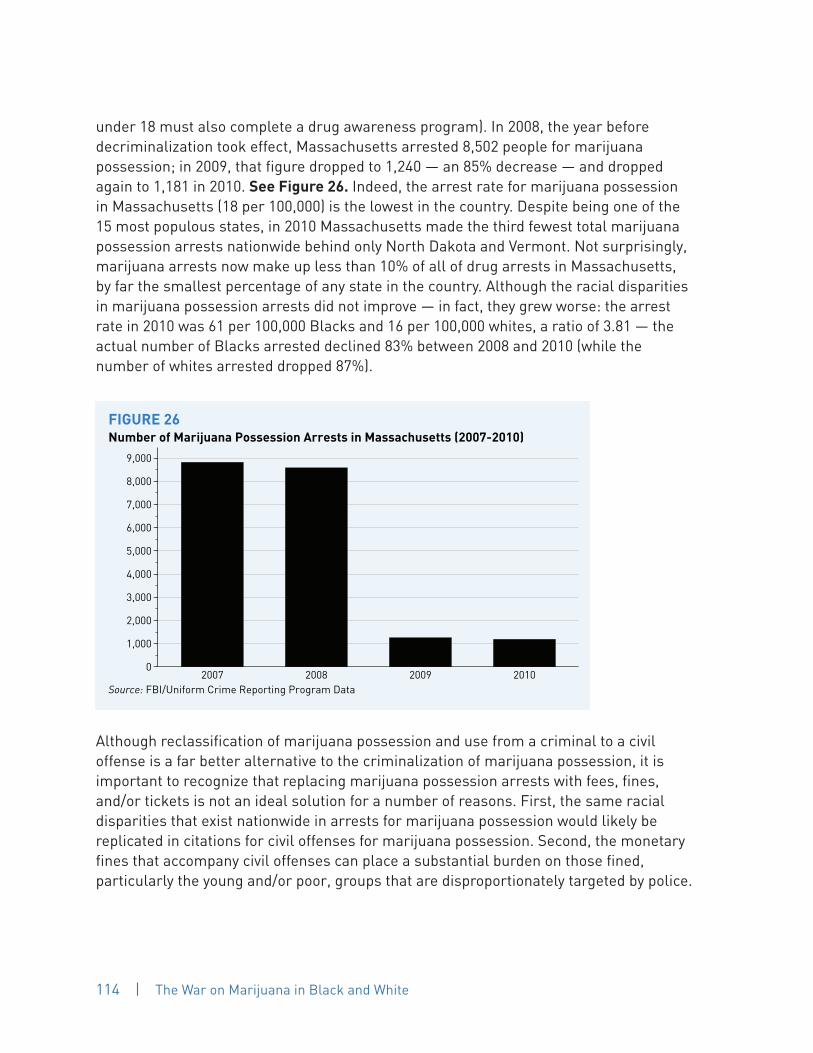
114 | The War on Marijuana in Black and White
under 18 must also complete a drug awareness program). In 2008, the year before decriminalization took effect, Massachusetts arrested 8,502 people for marijuana possession; in 2009, that figure dropped to 1,240 — an 85% decrease — and dropped again to 1,181 in 2010. See Figure 26. Indeed, the arrest rate for marijuana possession in Massachusetts (18 per 100,000) is the lowest in the country. Despite being one of the 15 most populous states, in 2010 Massachusetts made the third fewest total marijuana possession arrests nationwide behind only North Dakota and Vermont. Not surprisingly, marijuana arrests now make up less than 10% of all of drug arrests in Massachusetts, by far the smallest percentage of any state in the country. Although the racial disparities in marijuana possession arrests did not improve — in fact, they grew worse: the arrest rate in 2010 was 61 per 100,000 Blacks and 16 per 100,000 whites, a ratio of 3.81 — the actual number of Blacks arrested declined 83% between 2008 and 2010 (while the number of whites arrested dropped 87%).
0
1,000
2,000
3,000
4,000
5,000
6,000
7,000
8,000
9,000
�
2007 2008 2009 2010Source:�FBI/Uniform�Crime�Reporting�Program�Data
Number�of�Marijuana�Possession�Arrests�in�Massachusetts�(2007-2010)FIGURE�26
Although reclassification of marijuana possession and use from a criminal to a civil offense is a far better alternative to the criminalization of marijuana possession, it is important to recognize that replacing marijuana possession arrests with fees, fines, and/or tickets is not an ideal solution for a number of reasons. First, the same racial disparities that exist nationwide in arrests for marijuana possession would likely be replicated in citations for civil offenses for marijuana possession. Second, the monetary fines that accompany civil offenses can place a substantial burden on those fined, particularly the young and/or poor, groups that are disproportionately targeted by police.
| 115
Third, individuals who are unable to make payments in a timely fashion, or at all, or who do not appear in court to answer to the civil charge, are subject to arrest — often by a warrant squad — which results in individuals being brought to court, and in some cases jailed, for failing to pay the fines or to appear. In addition to placing significant personal and financial burdens on the individual, this also imposes significant costs on the state, possibly exceeding the original fine imposed. Therefore, at the very least, whenever anyone is unable to pay a fine levied for marijuana possession or use, there should be alternatives to cash payments. Further, under no circumstances should the state be permitted to detain or incarcerate anyone as a penalty for failure to pay a civil fine for possessing marijuana. Fourth, allowing cities and counties to generate revenue through civil fines provides an incentive for police to enforce such civil laws aggressively.
If legalization and depenalization are unobtainable, states should:
• Amend their current criminal statutes so that possession of an ounce or less of marijuana for personal use by adults and youth would be a civil offense only, for which the maximum penalty is a small fine, with alternative penalties available for people unable to pay
• Earmark revenues generated from marijuana-related civil penalties to public schools, substance abuse prevention, including community- and school-based programs, as well as to general funds, local budgets, research and health care
B. Policing
i. Police Departments Should Make Marijuana Possession Arrests a Lowest Enforcement Priority
Aggressive enforcement of low-level offenses such as marijuana possession unnecessarily draws hundreds of thousands of people into the criminal justice system, primarily young people of color, for nonviolent activities. Such enforcement is a waste of precious law enforcement time, money, and resources.
Indeed, in 2010, 52.8 % of violent crimes and 81.7 % of property crimes nationwide went
Recommendations

116 | The War on Marijuana in Black and White
unsolved. Among violent crimes, 35.2 % of murder offenses went unsolved, along with 59.7 % of forcible rapes, 71.8 % of robberies, and 43.6 % of aggravated assaults.154
Until marijuana possession is legalized or otherwise decriminalized, municipalities, district attorneys,155 and police departments should make the investigation, arrest, and prosecution of marijuana offenses, particularly when intended for personal use, a lowest enforcement priority. Over the past several years, certain cities, including Seattle (prior to legalization) and San Francisco, made marijuana possession a lowest enforcement priority. Such a policy allows police departments to focus resources on serious crimes while their municipalities address drug use through public health and education initiatives.156
ii. Police Departments Should End Racial Profiling
“Racial profiling” refers to the act of selecting or targeting a person(s) for law enforcement contact (including stop, frisk, search, and arrest) based on the individual’s real or perceived race, ethnicity, or national origin rather than upon reasonable suspicion that the individual has or is engaged in criminal activity. Racial profiling includes policies or practices that unjustifiably have a disparate impact on certain communities.
154 Uniform Crime Reports, Offenses Cleared, clearance fig., FED. BUREAU OF INVESTIGATION, http://www.fbi.gov/about-us/cjis/ucr/crime-in-the-u.s/2010/crime-in-the-u.s.-2010/clearances (last visited Apr. 10, 2013).155 District attorneys have discretion as to which arrests they prosecute. In 2010, the Harris County District Attorney’s Officeimplemented a policy to stop prosecuting drug paraphernalia possession cases as felonies. See Brian Rogers, Crack Policy puts Harris County DA at Odds with Police, HOUSTON CHRONICLE, Dec. 5, 2011, available at http://www.chron.com/news/houston-texas/article/District-Attorney-and-police-divided-on-crack-2346724.php. Under the old practice, officers would arrest people found with paraphernaliawith felony drug possession if there was any drug residue. The change in policy resulted in a drop of 7,800 felony drug possessioncases between 2008 and 2011. REBECCA BERNHARDT, TEX. CRIM. JUST. COAL., HARRIS COUNTY COMMUNITIES: A CALL FOR TRUE COLLABORATION, RESTORING
COMMUNITY TRUST AND IMPROVING PUBLIC SAFETY 9 (2013), available at http://www.texascjc.org/sites/default/files/uploads/Harris%20County%20Communities%20A%20Call%20for%20True%20Collaboration.pdf. Additionally, both violent and property crimes dropped during thisperiod, challenging opponents’ claim that arresting and prosecuting people for possessing drug paraphernalia prevents more seriouscrime. See id. at 9-10. Despite the precipitous drop in arrests, and the attendant decline in violent and property crimes, the newlyelected Harris County district attorney reversed the policy in January 2013. See Brian Rogers, DA Anderson Reverses Trace Case Policy,HOUSTON CHRONICLE, Jan. 24, 2013, available at http://www.chron.com/news/houston-texas/houston/article/DA-Anderson-reverses-trace-case-policy-4221910.php. Similarly, Bronx District Attorney Robert Johnson recently announced that his office would no longerprosecute people arrested for trespassing in public housing projects unless the prosecutor first interviewed the arresting officer toensure that the arrest was proper. Joseph Goldstein, Prosecutor Deals Blow to Stop-and-Frisk Tactic, N.Y. TIMES, Sept. 25, 2012, available athttp://www.nytimes.com/2012/09/26/nyregion/in-the-bronx-resistance-to-prosecuting-stop-and-frisk-arrests.html?pagewanted=all&_r=0. This change in policy came after allegations that people were being stopped and charged with trespass when they were legitimatelyon the premises. The month after the policy took effect, arrests fell 25% from the same month one year before. Such “stop-prosecution”policies — particularly if adopted by district attorneys in counties with significant racial disparities in marijuana possession arrests —can be used to end such arrests and their attendant racial disparities.156 For instance, a study found that police reallocation of resources toward drug arrests in Florida resulted in a 41% increase of IndexI crimes over the same data period. Bruce L. Benson, David W. Rasmussen & Iljoong Kim, Deterrence and Public Policy: Trade-Offs in the Allocation of Police Resources, 18 INT’L REVIEW OF L. AND ECON. 77, 78 (1998), available at http://mailer.fsu.edu/~bbenson/IRL&E1998.pdf. Byshifting “resources away from alternative uses, thereby reducing patrolling to prevent nondrug crimes and/or the ability to respond andmake arrests after such crimes have been committed[,]” serious crime increased. Id. at 97.
| 117
Racial profiling can lead to the aggressive enforcement of minor offenses in communities of color, disproportionately and needlessly entangling such communities — particularly their youth members — in the criminal justice system for nonviolent activities that are not enforced in other communities. Such targeted enforcement of petty
offenses, including marijuana possession, not only engulfs hundreds of thousands of people into the criminal justice system, it creates mistrust of the police by targeted communities, thereby reducing public safety, as these communities avoid police interaction and are less likely to report criminal activities or to cooperate with police in solving serious crimes. Even when utilizing geographic crime-mapping of serious crime, police departments should work with communities to address and prevent those crimes rather than simply target large swaths of those communities for enforcement of low-level
offenses.
Therefore, police departments should adopt model racial profiling policies that strictly prohibit law enforcement from engaging in profiling of persons — drivers, passengers, and pedestrians alike — and make clear that enforcement of state and federal laws must be carried out in a responsible and professional manner, without regard to race, ethnicity, or national origin. Police departments must ensure that all department personnel receive training about the harms of racial profiling and discrimination; investigate all complaints in a thorough and timely manner; in concert with appropriate disciplinary action, require additional diversity, sensitivity, and implicit bias training of all officers with sustained bias profiling or other discrimination complaints filed against them; and implement appropriate discipline for non-compliance with such policies, up to and including dismissal.
Targeted enforcement of marijuana possession engulfs hundreds of thousands of people into the criminal justice system and creates mistrust of the police, thereby reducing public safety.
Recommendations

118 | The War on Marijuana in Black and White
iii. Police Procedures Must Be Fair and Constitutional
Police departments must end suspicionless stops, suspicionless frisks, and searches without probable cause. Such stop, frisk, and search policies violate the Fourth Amendment’s prohibition against unreasonable searches and seizures and disproportionally impact innocent Blacks and Latinos. They are humiliating and can be traumatic. They are also ineffective and foster community resentment against the police.
Police departments must establish explicit guidelines outlining the specific, limited circumstances under which the Fourth Amendment permits a stop, frisk, and subsequent search, and train officers on the guidelines annually. No pedestrian or motorist shall be detained beyond the point when there is no reasonable suspicion of criminal activity, and no person or vehicle shall be searched in the absence of a warrant, a legally recognized exception to the warrant requirement, or the person’s informed voluntary consent.
iv. Police Should Adopt, Whether Voluntarily or as Required by State Law, Model Consent Search Policies
A law enforcement officer may only seek consent to search when he or she has articulable suspicion, i.e., when an officer possesses knowledge of sufficient articulable facts at the time of the encounter to create a reasonable belief that the person in question has committed, or is about to commit, a crime.
A police officer should conduct a consensual search only after advising a civilian of his or her right to refuse. Prior to a search, the police must articulate the following factors to, and subsequently receive consent from, the person subject to the search or the person with the apparent or actual authority to provide permission to search: (1) the person is being asked to voluntarily consent to a search; and (2) the person has the right to refuse the request to search.
After providing the advisement, a police officer may conduct the requested search only
Suspicionless stops, suspicionless frisks, and searches without probable cause violate the Fourth Amendment and disproportionately impact innocent Blacks and Latinos.

| 119
if the person subject to the search voluntarily provides verbal or written consent in a language understood and, where applicable, read by the person. If consent is obtained orally, a law enforcement agent shall make an audio recording of the person’s statement consenting to the search voluntarily.157
v. Police Departments and the Federal Government Should Eliminate Policies That Incentivize Arrests for Minor Offenses
a. Police Departments Should Cease Using Raw Numbers of Stops, Citations, Summons, and Arrests as a Metric to Measure Their Productivity and Effectiveness in Serving Communities and Addressing Crime
Evaluating law enforcement agencies based on the numbers of stops, citations, summons, and arrests does not properly measure public safety and increases pressure on police officers and departments to aggressively enforce criminal laws for nonviolent offenses. Including arrests as a measure of productivity creates an incentive for police to selectively target poor and marginalized communities for enforcement of low-level offenses, as low-level offenses are committed more frequently than serious felony crimes, the arrests are less resource- and time-intensive than investigating arrests for serious felony crimes, and such arrests can be made most easily and at the least political cost.
By relying heavily on stops, citations, summons, and arrests, COMPSTAT encourages police departments to target their resources on low-level offenders to increase their arrest statistics and thus appear highly active, while discouraging police to pursue and record serious crimes accurately for fear of impugning the police department’s crime-reducing reputation. The pressure on police officers to “make their numbers” results in a focus on aggressive stops and searches that often flaunt the suspicion-based requirements of the Fourth Amendment and lead to arrests for minor offenses, including marijuana possession. The end results are heavily policed communities that are not necessarily safer and in which many law-abiding people are subject to stops, frisks, and searches; heightened animosity between the communities and the police; a de-emphasis on procedural justice and police legitimacy;158 and pushing minor rule-breakers into the criminal justice system unnecessarily, often at an immense
157 If a policy requiring recording is unobtainable, written consent remains an option.158 See Tom R. Tyler & Jeffrey Fagan, Legitimacy and Cooperation: Why do People Help the Police Fight Crime in Their Communities?, 6Ohio St. J. of Crim. L. 231, (2008) (finding that for police to be successful addressing crime, police need cooperation from communities,which is achieved when communities perceive police actions and decisions as legitimate, and police treatment of the community as fairand respectful).
Recommendations

120 | The War on Marijuana in Black and White
(and sometimes lifelong) personal cost to individuals and their families as well as at a pecuniary cost to taxpayers.
Therefore, while the crime-mapping components of COMPSTAT can identify where serious crimes are occurring with greater frequency, thus focusing police departments’ resources on those areas to address serious crimes, it need not and indeed should not be accompanied by unconstitutional stop and search practices or a focus on generating high numbers of arrests for minor offenses in those areas. To move away from evaluating progress and productivity through arrest numbers, police departments should reduce the reliance on stops, citations, summons, and arrests and broaden their benchmarks of success, relying instead more heavily on other measurements of community safety and police-community relations.
b. The Federal Government Should Not Include Marijuana Possession Arrests in its Performance Measures for Byrne Justice Assistance Grants
Justice Assistance Grants were created with the purpose of curtailing serious, violent crime and cracking down on drug kingpins. However, because arrest statistics — which include any arrest, including any drug arrest — are included in law enforcements’ performance measures, police departments are likely encouraged to increase their arrest numbers by targeting their limited resources on low-level drug users and possessors. By including marijuana possession arrests in performance assessments of a states’ use of federal funds, the federal government is relying upon an unreliable measure of law enforcement’s effectiveness in fighting crime and reducing the traffic and availability of drugs. Indeed, such arrests reduce neither the use nor availability of marijuana.
Therefore, the Bureau of Justice Assistance should take the following steps to reform the existing JAG process:
• Cease including marijuana possession arrests as a performance measure for purposes of federal funding
• Ensure that federal funds are not provided or used by state and local law enforcement agencies to make arrests for marijuana possession
• Require law enforcement agencies receiving federal funding to enforce a ban on racial profiling and document their pedestrian and traffic stops, arrests, and searches by race, ethnicity, and gender (designating money for data collection if needed)
• Reform performance measures to include factors such as the numbers of citizen complaints, surveys measuring community satisfaction with the police, including community views on the legitimacy and fairness of police actions and decisions, and the rates of violent crime

| 121
vi. Police Should Increase Data Collection and Transparency Regarding Stop, Frisk, Search, and Arrest Practices
Police departments should promote accountability and transparency by collecting stop, frisk, search, citation, and arrest data; making the aggregate data publicly available; creating evaluation systems to analyze such data to identify and address racial disparities in enforcement practices; and developing policing strategies that reduce such racial disparities in enforcement practices.
Whether or not a citation is issued or an arrest is made, the police officer must document the following information consistent with existing or adopted local reporting protocols and technology:
• The age, gender, race, and ethnicity of the individual stopped and the date, time, and location of the stop
• The duration of and reason for the stop
• Whether a search was conducted, and if so, whether the person stopped consented to the search
• Whether and what type of contraband was recovered
• Whether and what type of citation or summons was issued or arrest made; and
• The identification of the officers involved
To guarantee statewide uniform arrest and citation documentation, state legislatures should require all police departments to electronically record information regarding stops, frisks, searches, citations, and arrests by race and locality, share the information with a central state agency, and publish the data in biannual or quarterly reports (on their website or in print available upon request). Personally identifiable information about the person stopped should not be recorded. The reports should be easily searchable. Such transparency will provide the public — community members, local and state policymakers, criminologists, lawyers, academics, the media, etc. — with a meaningful empirical basis for determining what precipitates a police action, and, in particular, for determining whether race, ethnicity, and gender have been used inappropriately, and to raise concerns where warranted. This would provide more objective and understandable information for assessing crime and the police response to crime; inform community-police discussions about the nature and appropriateness of police practices and allocation of police resources; promote more respectful and productive police-civilian encounters and build community trust in local police
Recommendations

122 | The War on Marijuana in Black and White
departments; better ensure accountability for police departments; and prompt the development of training programs that educate police officers about the conscious and subconscious uses of racial and ethnic stereotypes.
vii. External Oversight Agencies Should Conduct Regular Audits and Reviews of Police Departments and Practices
An external oversight agency, such as an Inspector General or civilian review board, should regularly analyze data regarding police departments’ stops, frisks, searches, citations, and arrests, by race and locality, to assess whether there are any unjustified racial disparities in enforcement practices. All such analyses and findings should be made available to the public.
| 123
VIII. CONCLUSION
Like America’s larger War on Drugs, America’s war on marijuana has been a failure. The aggressive enforcement of marijuana possession laws needlessly ensnares hundreds of thousands of people in the criminal justice system, crowds our jails, is carried out in a racially biased manner, wastes millions of taxpayers’ dollars and has not reduced marijuana use or availability. Marijuana possession arrests also waste precious police resources and divert law enforcement from responding to and solving serious crimes. It is time for marijuana possession arrests to end.
Conclusion

124 | The War on Marijuana in Black and White
APPEndIX A
0
500
1,000
1,500
2,000
Arrest�Rate�per�100,000
Bronx Kings New�York Queens Richmond
Source:�New�York�State�Division�of�Criminal�Justice�Services�and�U.S.�Census�Data
Arrest�Rates�for�Marijuana�Possession�in�New�York�City�by�Race/Ethnicity(2010)
FIGURE�A1
Black�Arrest�Rate Latino�Arrest�RateWhite�Arrest�Rate Asian�Arrest�Rate
0
100
200
300
400
500
Arrest�Rate�per�100,000
Felony�Arrests Misdemeanor�Arrests
Source:�Criminal�Justice�Statistics�Center,�Crime�in�California�2010�(2011)and�U.S.�Census�Data�(2010)
Arrest�Rates�for�Marijuana�Offenses�in�California�by�Race/Ethnicity(2010)
FIGURE�A2
Black�Arrest�Rate Latino�Arrest�RateWhite�Arrest�Rate Other�Arrest�Rate

| 125
Average�Disparity
0 1 2 3 4 5 6Black/White�Disparity
San�Bernardino,�CAKern,�CAMedina,�TXFresno,�CAKings,�CALea,�NM
Franklin,�WAFord,�KS
Chaves,�NMEctor,�TXBronx,�NYMadera,�CAMerced,�CAMonterey,�CA
Hale,�TXBee,�TXBexar,�TXYuma,�AZTulare,�CANueces,�TX
Miami-Dade,�FLDona�Ana,�NMKleberg,�TXImperial,�CAEl�Paso,�TX
NOTE:�Population�Size�>�30,000�and�Black�Population�Percentage�>�2%
Source:�FBI/Uniform�Crime�Reporting�Program�Data�and�U.S.�Census�Data
Black/White�Disparity�in�25�Highest�Percent�Latino�Counties�(2010)FIGURE�A3
Appendix A

126 | The War on Marijuana in Black and White
TABLE A1Number of Arrests for Marijuana Possession by State (2010)
Number of Arrests for Marijuana Possession
State Total White Black Black % ofArrests
New York 103,698 36,612 40,326 38.9%Texas 74,286 54,580 19,164 25.8%Florida 57,951 30,895 26,711 46.1%California 57,262 47,235 9,314 16.3%Illinois 49,904 20,235 29,083 58.3%Georgia 32,473 11,539 20,765 63.9%Maryland 23,663 9,775 13,710 57.9%New Jersey 21,659 13,665 7,609 35.1%Pennsylvania 21,287 12,459 8,695 40.8%North Carolina 20,983 10,192 10,500 50.0%Ohio 19,178 11,818 7,316 38.1%Virginia 18,756 10,414 8,146 43.4%Missouri 18,416 13,419 4,918 26.7%Arizona 18,348 15,390 1,906 10.4%Tennessee 18,031 9,675 8,256 45.8%Michigan 17,830 11,156 6,577 36.9%South Carolina 16,669 7,682 8,878 53.3%Wisconsin 15,950 10,785 4,720 29.6%Louisiana 13,435 5,232 8,171 60.8%Indiana 12,850 9,256 3,548 27.6%Oklahoma 10,478 7,657 2,176 20.8%Colorado 10,343 9,396 854 8.3%Oregon 9,849 9,220 420 4.3%Nevada 9,139 5,937 2,936 32.1%Connecticut 8,815 6,035 2,673 30.3%Washington 8,365 7,119 896 10.7%Mississippi 8,166 2,470 5,666 69.4%Minnesota 7,494 4,835 2,348 31.3%Nebraska 7,437 5,886 1,463 19.7%Kentucky 6,540 4,195 2,327 35.6%Arkansas 6,310 3,934 2,349 37.2%Iowa 6,123 4,702 1,327 21.7%Alabama 5,235 2,075 3,124 59.7%D.C. 5,115 467 4,648 90.9%Kansas 5,035 3,786 1,194 23.7%West Virginia 4,400 3,917 476 10.8%Utah 4,001 3,658 188 4.7%Idaho 3,468 3,338 70 2.0%New Mexico 3,041 2,701 145 4.8%Maine 2,842 2,743 75 2.6%New Hampshire 2,769 2,655 92 3.3%Delaware 2,554 1,330 1,218 47.7%Rhode Island 2,253 1,831 394 17.5%Wyoming 2,104 1,981 63 3.0%Alaska 2,028 1,482 123 6.1%South Dakota 1,743 1,232 96 5.5%Hawaii 1,448 629 40 2.8%Montana 1,210 1,055 18 1.5%Massachusetts 1,191 872 309 25.9%North Dakota 1,162 952 60 5.2%Vermont 737 700 33 4.5%United States 784,021 460,808 286,117 36.5%
Source: FBI/Uniform Crime Reporting Program Data: Arrests by Age, Sex, and Race and U.S. Census Data

| 127
TABLE A2Percentage of All Marijuana Offenses That Were for Marijuana Possession byState (2010)
Number of Arrests Marijuana Possession
State Marijuana Possession All Marijuana Offenses % of All MarijuanaArrests
Alabama 5,235 5,546 94.4%Alaska 2,028 2,219 91.4%Arizona 18,348 20,079 91.4%Arkansas 6,310 7,134 88.4%California 57,262 71,816 79.7%Colorado 10,343 11,009 94.0%Connecticut 8,815 9,669 91.2%D.C. 5,115 5,393 94.8%Delaware 2,554 3,195 79.9%Florida 57,951 62,663 92.4%Georgia 32,473 35,888 90.5%Hawaii 1,448 1,635 88.6%Idaho 3,468 3,826 90.6%Illinois 49,904 51,031 97.8%Indiana 12,850 15,174 84.7%Iowa 6,123 6,610 92.6%Kansas 5,035 7,175 70.2%Kentucky 6,540 8,546 76.5%Louisiana 13,435 15,872 84.6%Maine 2,842 3,461 82.1%Maryland 23,663 26,375 89.7%Massachusetts 1,191 2,751 43.3%Michigan 17,830 21,818 81.7%Minnesota 7,494 11,893 63.0%Mississippi 8,166 8,967 91.1%Missouri 18,416 20,325 90.6%Montana 1,210 1,281 94.5%Nebraska 7,437 7,919 93.9%Nevada 9,139 10,382 88.0%New Hampshire 2,769 3,242 85.4%New Jersey 21,659 25,607 84.6%New Mexico 3,041 3,523 86.3%New York 103,698 106,860 97.0%North Carolina 20,983 24,402 86.0%North Dakota 1,162 1,381 84.1%Ohio 19,178 20,866 91.9%Oklahoma 10,478 11,516 91.0%Oregon 9,849 10,543 93.4%Pennsylvania 21,287 27,201 78.3%Rhode Island 2,253 2,455 91.8%South Carolina 16,669 18,738 89.0%South Dakota 1,743 1,866 93.4%Tennessee 18,031 21,863 82.5%Texas 74,286 75,968 97.8%Utah 4,001 4,388 91.2%Vermont 737 813 90.6%Virginia 18,756 21,231 88.3%Washington 8,365 10,124 82.6%West Virginia 4,400 4,987 88.2%Wisconsin 15,950 18,356 86.9%Wyoming 2,104 2,254 93.3%
NOTE: All Marijuana Offenses includes the manufacture and sale of marijuana.Source: FBI/Uniform Crime Reporting Program Data: County-Level Detailed Arrest and Offense Data, 2010
Appendix A

128 | The War on Marijuana in Black and White
TABLE A3Percentage of Drug Arrests That Were for Marijuana Possession by State(2010)
Number of Arrests Marijuana Possession
State Marijuana Possession All Drug Offenses % of All Drug Arrests
Alabama 5,235 9,077 57.7%Alaska 2,028 2,517 80.6%Arizona 18,348 32,628 56.2%Arkansas 6,310 13,675 46.1%California 57,262 250,351 22.9%Colorado 10,343 17,029 60.7%Connecticut 8,815 17,692 49.8%D.C. 5,115 10,898 46.9%Delaware 2,554 5,431 47.0%Florida 57,951 141,775 40.9%Georgia 32,473 49,876 65.1%Hawaii 1,448 2,802 51.7%Idaho 3,468 6,665 52.0%Illinois 49,904 110,232 45.3%Indiana 12,850 29,214 44.0%Iowa 6,123 9,758 62.8%Kansas 5,035 11,498 43.8%Kentucky 6,540 20,560 31.8%Louisiana 13,435 36,275 37.0%Maine 2,842 5,933 47.9%Maryland 23,663 47,409 49.9%Massachusetts 1,191 12,486 9.5%Michigan 17,830 35,944 49.6%Minnesota 7,494 17,501 42.8%Mississippi 8,166 19,101 42.8%Missouri 18,416 36,559 50.4%Montana 1,210 1,723 70.2%Nebraska 7,437 10,217 72.8%Nevada 9,139 18,040 50.7%New Hampshire 2,769 5,172 53.5%New Jersey 21,659 49,926 43.4%New Mexico 3,041 9,696 31.4%New York 103,698 174,493 59.4%North Carolina 20,983 39,144 53.6%North Dakota 1,162 2,054 56.6%Ohio 19,178 39,828 48.2%Oklahoma 10,478 20,010 52.4%Oregon 9,849 18,047 54.6%Pennsylvania 21,287 57,093 37.3%Rhode Island 2,253 3,809 59.1%South Carolina 16,669 31,126 53.6%South Dakota 1,743 3,486 50.0%Tennessee 18,031 42,696 42.2%Texas 74,286 138,916 53.5%Utah 4,001 11,177 35.8%Vermont 737 1,382 53.3%Virginia 18,756 34,876 53.8%Washington 8,365 24,837 33.7%West Virginia 4,400 7,986 55.1%Wisconsin 15,950 26,206 60.9%Wyoming 2,104 3,136 67.1%United States 784,021 1,717,064 45.7%
Source: FBI/Uniform Crime Reporting Program Data: County-Level Detailed Arrest and Offense Data, 2010

| 129
TABLE A4Percent Change in Marijuana Possession Arrest Rates by State (2001-2010)
Arrest Rates per 100,000
State Total Arrest Rate(2001)
Total Arrest Rate(2010)
% Change in TotalArrest Rate
Alabama 252 115 -54.4%Alaska 329 304 -7.7%Arizona 286 286 -0.0%Arkansas 223 221 -0.9%California 143 153 7.6%Colorado 241 207 -14.2%Connecticut 201 247 22.5%D.C. 524 846 61.5%Delaware 140 284 102.1%Florida 276 308 11.4%Georgia 282 338 19.6%Hawaii 92 106 15.8%Idaho 211 222 5.2%Illinois 300 389 29.6%Indiana 232 209 -9.9%Iowa 187 211 12.9%Kansas 210 181 -13.6%Kentucky 414 162 -61.0%Louisiana 273 300 10.0%Maine 280 214 -23.4%Maryland 328 409 24.7%Massachusetts 134 18 -86.4%Michigan 164 181 9.9%Minnesota 145 144 -0.5%Mississippi 386 317 -18.1%Missouri 214 308 43.6%Montana 52 127 145.8%Nebraska 464 417 -10.1%Nevada 174 341 96.0%New Hampshire 294 210 -28.5%New Jersey 226 246 8.9%New Mexico 288 155 -46.1%New York 459 535 16.6%North Carolina 222 221 -0.3%North Dakota 175 183 4.6%Ohio 168 169 0.4%Oklahoma 303 279 -7.9%Oregon 177 257 44.8%Pennsylvania 136 167 23.0%Rhode Island 208 214 3.0%South Carolina 278 359 29.2%South Dakota 307 249 -18.9%Tennessee 210 284 35.3%Texas 252 295 17.2%Utah 198 147 -25.7%Vermont 110 119 8.5%Virginia 177 234 31.7%Washington 174 124 -28.8%West Virginia 196 241 23.3%Wisconsin 272 281 3.4%Wyoming 401 374 -6.7%
Source: FBI/Uniform Crime Reporting Program Data: Arrests by Age, Sex, and Race and U.S. Census Data
Appendix A

130 | The War on Marijuana in Black and White
TABLE A5Racial Disparity in Marijuana Possession Arrest Rates by State (2010)
Arrest Rates per 100,000
State Total Black White Times MoreLikely Blacks
Arrested
Iowa 211 1,454 174 8.34D.C. 846 1,489 185 8.05Minnesota 144 835 107 7.81Illinois 389 1,526 202 7.56Wisconsin 281 1,285 215 5.98Kentucky 162 697 117 5.95Pennsylvania 167 606 117 5.19South Dakota 249 943 197 4.79Nebraska 417 1,699 365 4.65New York 535 1,192 263 4.52Nevada 341 1,272 284 4.47North Dakota 183 732 166 4.41Kansas 181 688 156 4.41Alabama 115 277 64 4.35Vermont 119 514 118 4.35Florida 308 866 208 4.16Ohio 169 512 125 4.11Tennessee 284 771 191 4.03Massachusetts 18 61 16 3.87Mississippi 317 605 157 3.86Utah 147 557 146 3.81Georgia 338 699 189 3.69Montana 127 432 123 3.52Indiana 209 591 174 3.39North Carolina 221 503 149 3.38Connecticut 247 681 205 3.33Michigan 181 464 141 3.30West Virginia 241 745 228 3.26Wyoming 374 1,223 376 3.26Louisiana 300 569 182 3.13Arkansas 221 532 171 3.11Delaware 284 619 206 3.01Maryland 409 790 276 2.86Oklahoma 279 763 268 2.84New Jersey 246 593 209 2.84Virginia 234 514 182 2.83Idaho 222 639 227 2.81South Carolina 359 679 242 2.80Washington 124 353 128 2.75New Hampshire 210 561 213 2.64Missouri 308 701 267 2.63Rhode Island 214 524 201 2.60Arizona 286 677 283 2.39Texas 295 622 267 2.33California 153 374 171 2.19Maine 214 461 216 2.13Oregon 257 563 271 2.08New Mexico 155 300 161 1.87Colorado 207 397 213 1.87Alaska 304 510 318 1.60Hawaii 106 179 181 0.99United States 256 716 192 3.73
Source: FBI/Uniform Crime Reporting Program Data: Arrests by Age, Sex, and Race and U.S. Census Data
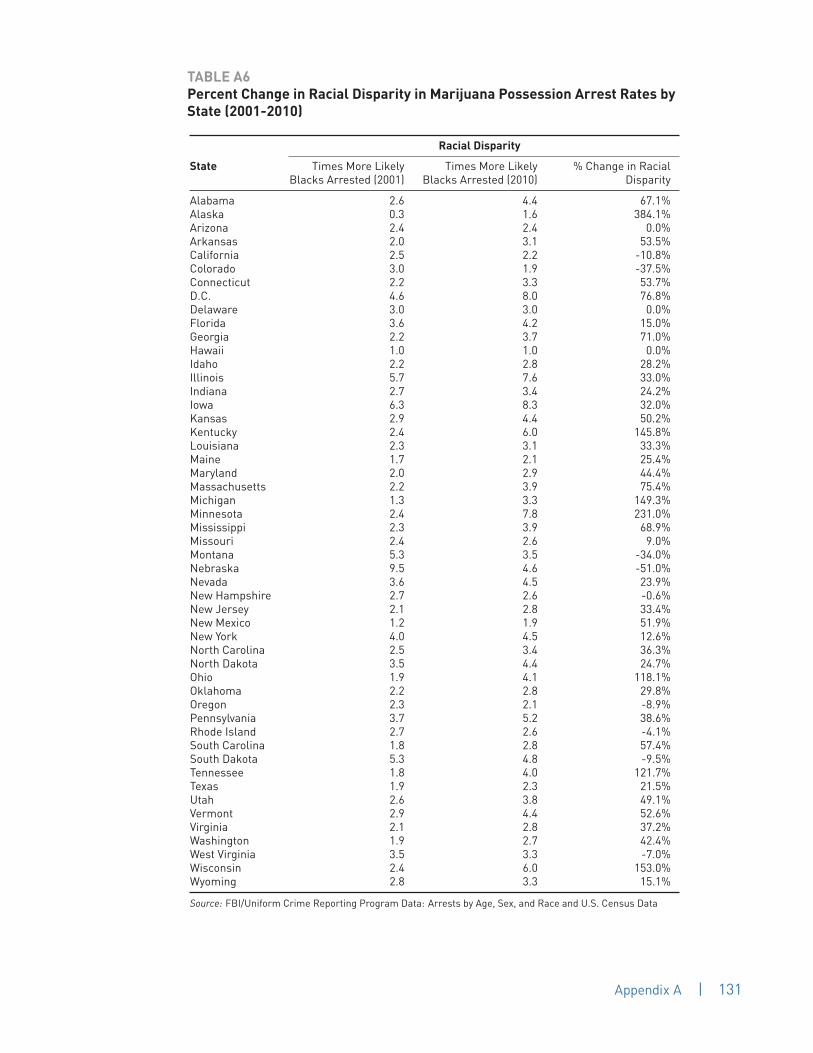
| 131
TABLE A6Percent Change in Racial Disparity in Marijuana Possession Arrest Rates byState (2001-2010)
Racial Disparity
State Times More LikelyBlacks Arrested (2001)
Times More LikelyBlacks Arrested (2010)
% Change in RacialDisparity
Alabama 2.6 4.4 67.1%Alaska 0.3 1.6 384.1%Arizona 2.4 2.4 0.0%Arkansas 2.0 3.1 53.5%California 2.5 2.2 -10.8%Colorado 3.0 1.9 -37.5%Connecticut 2.2 3.3 53.7%D.C. 4.6 8.0 76.8%Delaware 3.0 3.0 0.0%Florida 3.6 4.2 15.0%Georgia 2.2 3.7 71.0%Hawaii 1.0 1.0 0.0%Idaho 2.2 2.8 28.2%Illinois 5.7 7.6 33.0%Indiana 2.7 3.4 24.2%Iowa 6.3 8.3 32.0%Kansas 2.9 4.4 50.2%Kentucky 2.4 6.0 145.8%Louisiana 2.3 3.1 33.3%Maine 1.7 2.1 25.4%Maryland 2.0 2.9 44.4%Massachusetts 2.2 3.9 75.4%Michigan 1.3 3.3 149.3%Minnesota 2.4 7.8 231.0%Mississippi 2.3 3.9 68.9%Missouri 2.4 2.6 9.0%Montana 5.3 3.5 -34.0%Nebraska 9.5 4.6 -51.0%Nevada 3.6 4.5 23.9%New Hampshire 2.7 2.6 -0.6%New Jersey 2.1 2.8 33.4%New Mexico 1.2 1.9 51.9%New York 4.0 4.5 12.6%North Carolina 2.5 3.4 36.3%North Dakota 3.5 4.4 24.7%Ohio 1.9 4.1 118.1%Oklahoma 2.2 2.8 29.8%Oregon 2.3 2.1 -8.9%Pennsylvania 3.7 5.2 38.6%Rhode Island 2.7 2.6 -4.1%South Carolina 1.8 2.8 57.4%South Dakota 5.3 4.8 -9.5%Tennessee 1.8 4.0 121.7%Texas 1.9 2.3 21.5%Utah 2.6 3.8 49.1%Vermont 2.9 4.4 52.6%Virginia 2.1 2.8 37.2%Washington 1.9 2.7 42.4%West Virginia 3.5 3.3 -7.0%Wisconsin 2.4 6.0 153.0%Wyoming 2.8 3.3 15.1%
Source: FBI/Uniform Crime Reporting Program Data: Arrests by Age, Sex, and Race and U.S. Census Data
Appendix A
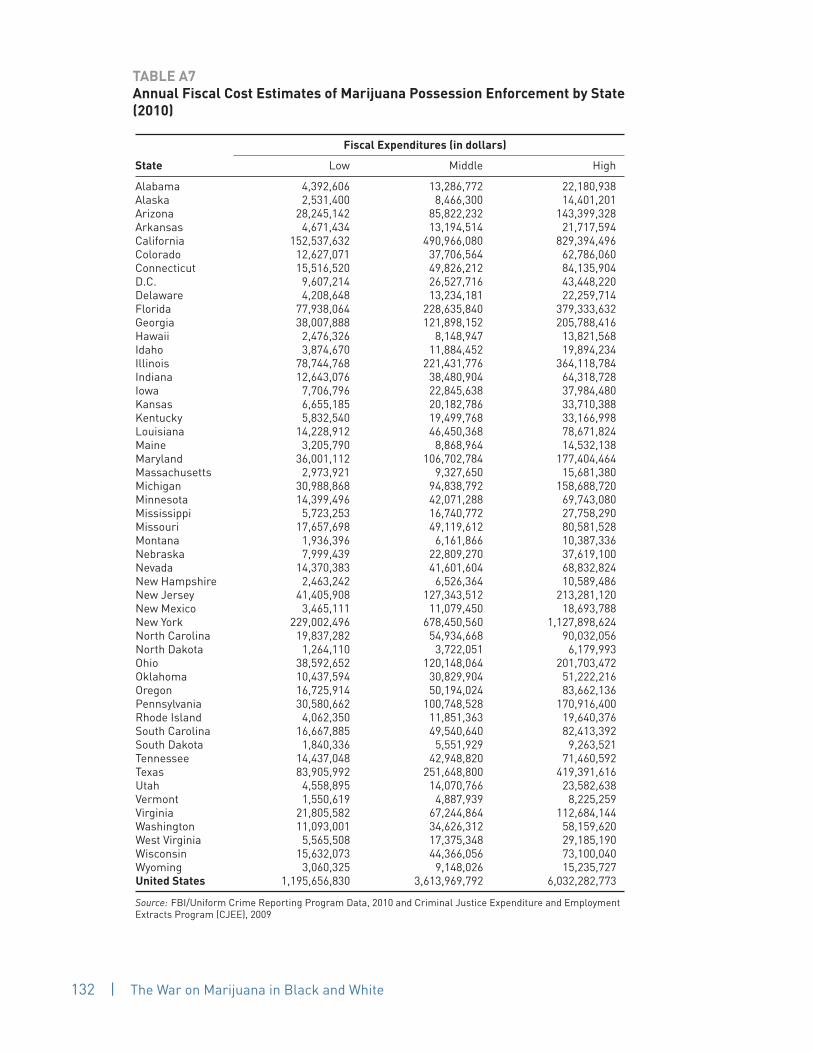
132 | The War on Marijuana in Black and White
TABLE A7Annual Fiscal Cost Estimates of Marijuana Possession Enforcement by State(2010)
Fiscal Expenditures (in dollars)
State Low Middle High
Alabama 4,392,606 13,286,772 22,180,938Alaska 2,531,400 8,466,300 14,401,201Arizona 28,245,142 85,822,232 143,399,328Arkansas 4,671,434 13,194,514 21,717,594California 152,537,632 490,966,080 829,394,496Colorado 12,627,071 37,706,564 62,786,060Connecticut 15,516,520 49,826,212 84,135,904D.C. 9,607,214 26,527,716 43,448,220Delaware 4,208,648 13,234,181 22,259,714Florida 77,938,064 228,635,840 379,333,632Georgia 38,007,888 121,898,152 205,788,416Hawaii 2,476,326 8,148,947 13,821,568Idaho 3,874,670 11,884,452 19,894,234Illinois 78,744,768 221,431,776 364,118,784Indiana 12,643,076 38,480,904 64,318,728Iowa 7,706,796 22,845,638 37,984,480Kansas 6,655,185 20,182,786 33,710,388Kentucky 5,832,540 19,499,768 33,166,998Louisiana 14,228,912 46,450,368 78,671,824Maine 3,205,790 8,868,964 14,532,138Maryland 36,001,112 106,702,784 177,404,464Massachusetts 2,973,921 9,327,650 15,681,380Michigan 30,988,868 94,838,792 158,688,720Minnesota 14,399,496 42,071,288 69,743,080Mississippi 5,723,253 16,740,772 27,758,290Missouri 17,657,698 49,119,612 80,581,528Montana 1,936,396 6,161,866 10,387,336Nebraska 7,999,439 22,809,270 37,619,100Nevada 14,370,383 41,601,604 68,832,824New Hampshire 2,463,242 6,526,364 10,589,486New Jersey 41,405,908 127,343,512 213,281,120New Mexico 3,465,111 11,079,450 18,693,788New York 229,002,496 678,450,560 1,127,898,624North Carolina 19,837,282 54,934,668 90,032,056North Dakota 1,264,110 3,722,051 6,179,993Ohio 38,592,652 120,148,064 201,703,472Oklahoma 10,437,594 30,829,904 51,222,216Oregon 16,725,914 50,194,024 83,662,136Pennsylvania 30,580,662 100,748,528 170,916,400Rhode Island 4,062,350 11,851,363 19,640,376South Carolina 16,667,885 49,540,640 82,413,392South Dakota 1,840,336 5,551,929 9,263,521Tennessee 14,437,048 42,948,820 71,460,592Texas 83,905,992 251,648,800 419,391,616Utah 4,558,895 14,070,766 23,582,638Vermont 1,550,619 4,887,939 8,225,259Virginia 21,805,582 67,244,864 112,684,144Washington 11,093,001 34,626,312 58,159,620West Virginia 5,565,508 17,375,348 29,185,190Wisconsin 15,632,073 44,366,056 73,100,040Wyoming 3,060,325 9,148,026 15,235,727United States 1,195,656,830 3,613,969,792 6,032,282,773
Source: FBI/Uniform Crime Reporting Program Data, 2010 and Criminal Justice Expenditure and EmploymentExtracts Program (CJEE), 2009

Appendix B | 133
Analysis by State
APPENDIX B

Appendix B | 135
Source: FBI / Uniform Crime Reporting Program Data and U.S. Census Data*All arrest rates are per 100,000 and based on 2010 data
Population size >30,000, Black population >2%
Includes all counties, listed in order of size
Counties with the largest disparities
Pike
Dallas
Morgan
Coffee
Chambers
115+x
95+x
55+x
25.7x
13.7x
Counties with the largest population
Shelby
Tuscaloosa
Baldwin
Lee
Morgan
3.0x
6.6x
5.1x
7.8x
55+x
Racial Disparities In Marijuana Possession Arrest Rates*
2001 2002 2003 2004 2005 2006 2007 2008 2009 2010
AR
RE
ST
RAT
ES
Times more likely Blacks arrested
White arrest rate
Black arrest rate
BLACK
277WHITE
64
Cost
Money spent enforcing marijuana possession laws in 2010 :
$13,286,772Drug Arrests by Offense in 2010
Alabama Blacks are 4.4 times more likely than whites to be arrested for marijuana possession
Arrest Rates
All counties with racial disparities above the national average (3.73)
181
470
154
466
152
465
189
538
172
598
178
679
173
668
133
604
100
558
64
277
0
200
400
600
800
Marijuana possession
57.7%
All other drug offenses
42.3%
0 100 200 300 400 500 600 700 800
550
45258
38776
730111
6522
0 100 200 300 400 500 600 700 800
0 100 200 300 400 500 600 700 800
0 100 200 300 400 500 600 700 800
1219
1988
550
950
1150
Statewide marijuana possession arrest rates 2001-2010
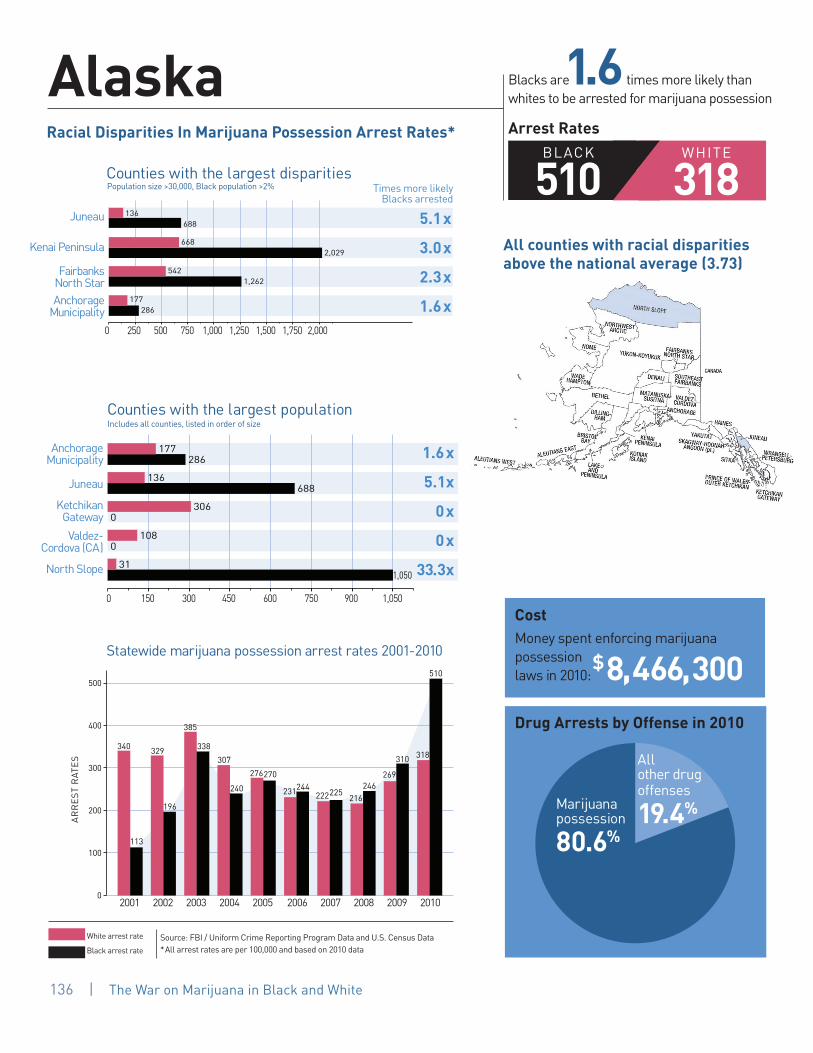
Appendix B | 137136 | The War on Marijuana in Black and White
Juneau
Kenai Peninsula
Fairbanks North StarAnchorage
Municipality
5.1x
3.0x
2.3x
1.6x
Anchorage Municipality
Juneau
Ketchikan Gateway
Valdez-Cordova (CA)
North Slope
1.6x
5.1x
0x
0x
33.3x
2001 2002 2003 2004 2005 2006 2007 2008 2009 2010
Times more likely Blacks arrested
White arrest rate
Black arrest rate
BLACK
510WHITE
318
Cost
Money spent enforcing marijuana possession laws in 2010:
$8,466,300Drug Arrests by Offense in 2010
Alaska Blacks are 1.6 times more likely than whites to be arrested for marijuana possession
Arrest Rates
All counties with racial disparities above the national average (3.73)
340
113
329
196
385
338
307
240
276270
231244222225
216246
269
310 318
510
0
100
200
300
400
500
Marijuana possession
80.6%
All other drug offenses
19.4%
286177
1,262542
2,029668
688136
1,05031
0108
0306
688136
286177
0 250 500 750 1,000 1,250 1,500 1,750 2,000
0 150 300 450 600 750 900 1,050
Population size >30,000, Black population >2%
Includes all counties, listed in order of size
Counties with the largest disparities
Counties with the largest population
Racial Disparities In Marijuana Possession Arrest Rates*
Source: FBI / Uniform Crime Reporting Program Data and U.S. Census Data*All arrest rates are per 100,000 and based on 2010 data
AR
RE
ST
RAT
ES
Statewide marijuana possession arrest rates 2001-2010
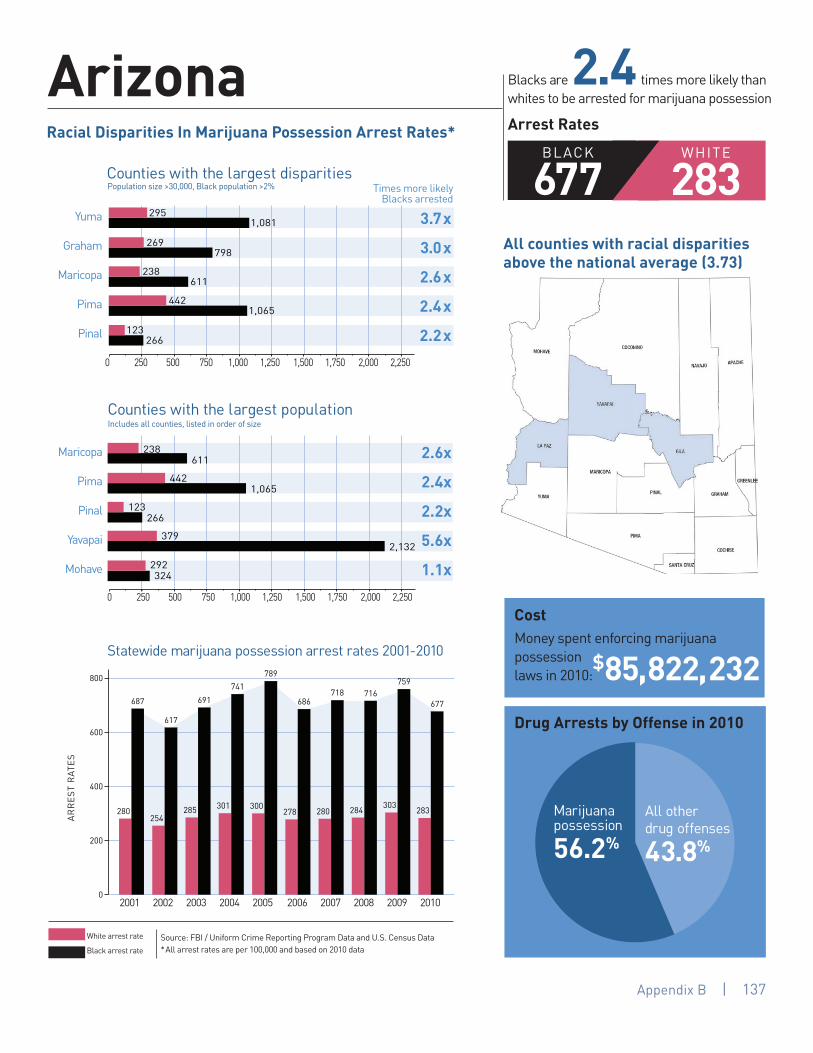
Appendix B | 137
Yuma
Graham
Maricopa
Pima
Pinal
3.7x
3.0x
2.6x
2.4x
2.2x
Maricopa
Pima
Pinal
Yavapai
Mohave
2.6x
2.4x
2.2x
5.6x
1.1x
2001 2002 2003 2004 2005 2006 2007 2008 2009 2010
Times more likely Blacks arrested
White arrest rate
Black arrest rate
BLACK
677WHITE
283
Cost
Money spent enforcing marijuana possession laws in 2010 :
$85,822,232Drug Arrests by Offense in 2010
Arizona Blacks are 2.4 times more likely than whites to be arrested for marijuana possession
Arrest Rates
280
687
254
617
285
691
301
741
300
789
278
686
280
718
284
716
303
759
283
677
0
200
400
600
800
Marijuana possession
56.2%
All other drug offenses
43.8%
266123
1,065442
611238
798269
1,081295
0 250 500 750 1,000 1,250 1,500 1,750 2,000 2,250
324292
2,132379
266123
1,065442
611238
0 250 500 750 1,000 1,250 1,500 1,750 2,000 2,250
0 250 500 750 1,000 1,250 1,500 1,750 2,000 2,250
0 250 500 750 1,000 1,250 1,500 1,750 2,000 2,250
Population size >30,000, Black population >2%
Includes all counties, listed in order of size
Counties with the largest disparities
Counties with the largest population
Racial Disparities In Marijuana Possession Arrest Rates*
Source: FBI / Uniform Crime Reporting Program Data and U.S. Census Data*All arrest rates are per 100,000 and based on 2010 data
AR
RE
ST
RAT
ES
All counties with racial disparities above the national average (3.73)
Statewide marijuana possession arrest rates 2001-2010
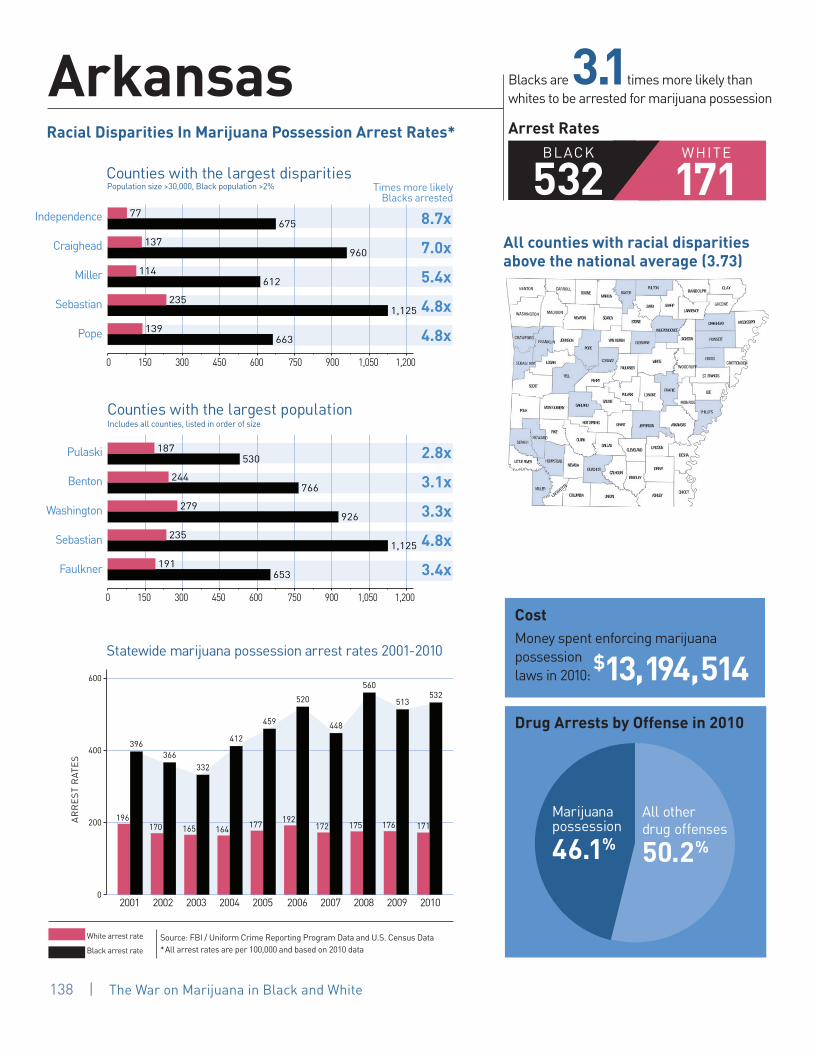
Appendix B | 139
Independence
Craighead
Miller
Sebastian
Pope
8.7x
7.0x
5.4x
4.8x
4.8x
Pulaski
Benton
Washington
Sebastian
Faulkner
2.8x
3.1x
3.3x
4.8x
3.4x
2001 2002 2003 2004 2005 2006 2007 2008 2009 2010
Times more likely Blacks arrested
White arrest rate
Black arrest rate
BLACK
532WHITE
171
Cost
Money spent enforcing marijuana possession laws in 2010 :
$13,194,514Drug Arrests by Offense in 2010
Arkansas Blacks are 3.1times more likely than whites to be arrested for marijuana possession
Arrest Rates
196
396
170
366
165
332
164
412
177
459
192
520
172
448
175
560
176
513
171
532
0
200
400
600
Marijuana possession
46.1%
All other drug offenses
50.2%
663139
1,125235
612114
960137
67577
653191
1,125235
926279
766244
530187
0 150 300 450 600 750 900 1,050 1,200
0 150 300 450 600 750 900 1,050 1,200
Population size >30,000, Black population >2%
Includes all counties, listed in order of size
Counties with the largest disparities
Counties with the largest population
Racial Disparities In Marijuana Possession Arrest Rates*
Source: FBI / Uniform Crime Reporting Program Data and U.S. Census Data*All arrest rates are per 100,000 and based on 2010 data
AR
RE
ST
RAT
ES
All counties with racial disparities above the national average (3.73)
138 | The War on Marijuana in Black and White
Statewide marijuana possession arrest rates 2001-2010

Appendix B | 139
San Francisco
Marin
Lake
Sacramento
Kern
4.3x
4.1x
3.8x
3.7x
3.4x
Los Angeles
San Diego
Orange
Riverside
San Bernardino
Santa Clara
Alameda
Sacramento
Contra Costa
Fresno
2.6x2.6x1.8x2.6x2.1x2.6x1.3x3.7x2.8x2.6x
2001 2002 2003 2004 2005 2006 2007 2008 2009 2010
Times more likely Blacks arrested
White arrest rate
Black arrest rate
BLACK
374WHITE
171
Cost
Money spent enforcing marijuana possession laws in 2010 :
$490,966,080Drug Arrests by Offense in 2010
California
400156
14853
37099
167124
579222
315153
25397
479263
621240
433164
0 100 200 300 400 500 600 700
Blacks are 2.2 times more likely than whites to be arrested for marijuana possession
Arrest Rates
All other drug offenses
7,365
77.1%
Marijuana possession
6,310
22.9%
148
365
144
336
146
343
138
356
140
356
151
405
169
456
181
474
185
448
171
374
0
100
200
300
400
500
Marijuana possession
22.9% All other drug offenses
77.1%
414121
37099
612161
507123
19244
0 100 200 300 400 500 600 700 0 100 200 300 400 500 600 700
0 100 200 300 400 500 600 700
Population size >30,000, Black population >2%
Includes all counties, listed in order of size
Counties with the largest disparities
Counties with the largest population
Source: FBI / Uniform Crime Reporting Program Data and U.S. Census Data*All arrest rates are per 100,000 and based on 2010 data
AR
RE
ST
RAT
ES
Racial Disparities In Marijuana Possession Arrest Rates*
All counties with racial disparities above the national average (3.73)
Statewide marijuana possession arrest rates 2001-2010

Appendix B | 141
Arapahoe
El Paso
Pueblo
Adams
3.2x
2.8x
1.6x
1.2x
El Paso
Denver
Arapahoe
Jefferson
Adams
2.8x
0.5x
3.2x
3.3x
1.2x
2001 2002 2003 2004 2005 2006 2007 2008 2009 2010
Times more likely Blacks arrested
White arrest rate
Black arrest rate
BLACK
397WHITE
213
Cost
Money spent enforcing marijuana possession laws in 2010 :
$37,706,564Drug Arrests by Offense in 2010
Colorado Blacks are 1.9 times more likely than whites to be arrested for marijuana possession
Arrest Rates
232
692
209
653
214
693
225
618
226
656
228
458
243
461
235
451
223
402
213
397
0
200
400
600
800
Marijuana possession
60.7%
All other drug offenses
39.3%
535435
2717
407146
611191
535435
912276
611191
71152
407146
0 100 200 300 400 500 600 700 800 900 1,000
0 100 200 300 400 500 600 700 800 900 1,000
0 100 200 300 400 500 600 700 800 900 1,000
Population size >30,000, Black population >2%
Includes all counties, listed in order of size
Counties with the largest disparities
Counties with the largest population
Racial Disparities In Marijuana Possession Arrest Rates*
Source: FBI / Uniform Crime Reporting Program Data and U.S. Census Data*All arrest rates are per 100,000 and based on 2010 data
AR
RE
ST
RAT
ES
All counties with racial disparities above the national average (3.73)
140 | The War on Marijuana in Black and White
Statewide marijuana possession arrest rates 2001-2010

Appendix B | 141
Middlesex
New London
Fairfield
New Haven
Hartford
Fairfield
Hartford
New Haven
New London
Litchfield
3.4x
3.0x
3.4x
4.7x
7.8x
6.8x
4.7x
3.4x
3.4x
3.0x
2001 2002 2003 2004 2005 2006 2007 2008 2009 2010
Times more likely Blacks arrested
White arrest rate
Black arrest rate
BLACK
681WHITE
205
Cost
Money spent enforcing marijuana possession laws in 2010 :
$49,826,212Drug Arrests by Offense in 2010
Connecticut Blacks are 3.3 times more likely than whites to be arrested for marijuana possession
Arrest Rates
186
403
157
447
156
502
169
554
162
564
166
612
165
619
189
677
195
725
205
681
0
200
400
600
800
Marijuana possession
49.8%
All other drug offenses
50.2%
943314
499148
385113
1,136243
1,608235
0 200 400 600 800 1,000 1,200 1,400 1,600
987127
1,136243
499148
943314
385113
0 200 400 600 800 1,000 1,200 1,400 1,600
0 200 400 600 800 1,000 1,200 1,400 1,600
0 200 400 600 800 1,000 1,200 1,400 1,600
Population size >30,000, Black population >2%
Includes all counties, listed in order of size
Counties with the largest disparities
Counties with the largest population
Source: FBI / Uniform Crime Reporting Program Data and U.S. Census Data*All arrest rates are per 100,000 and based on 2010 data
AR
RE
ST
RAT
ES
Racial Disparities In Marijuana Possession Arrest Rates*
All counties with racial disparities above the national average (3.73)
Statewide marijuana possession arrest rates 2001-2010

Appendix B | 143
Sussex
New Castle
Kent
2001 2002 2003 2004 2005 2006 2007 2008 2009 2010
Times more likely Blacks arrested
Cost
Money spent enforcing marijuana possession laws in 2010 :
$13,234,181Drug Arrests by Offense in 2010
Delaware Blacks are 3.0 times more likely than whites to be arrested for marijuana possession
Arrest Rates
104
307
112
342
166
492
179
430
203
570
200
605
216
656
216
635
222
638
206
619
0
200
400
600
800
Marijuana possession
47.0%
All other drug offenses
53.0%
0 100 200 300 400 500 600 700 800
BLACK
619WHITE
2063.5x
3.1x
2.6x681264
581189
714204
Racial Disparities In Marijuana Possession Arrest Rates In All Counties*
All counties with racial disparities above the national average (3.73)
Counties
AR
RE
ST
RAT
ES
White arrest rate
Black arrest rate
Source: FBI / Uniform Crime Reporting Program Data and U.S. Census Data*All arrest rates are per 100,000 and based on 2010 data
142 | The War on Marijuana in Black and White
Statewide marijuana possession arrest rates 2001-2010

Appendix B | 143
Racial Disparities In Marijuana Possession Arrest Rates*
2001 2002 2003 2004 2005 2006 2007 2008 2009 2010
District-wide marijuana possession arrest rates 2001-2010WHITE
185BLACK
1,489
Cost
Money spent enforcing marijuana possession laws in 2010 :
$26,527,716Drug Arrests by Offense in 2010
District of Columbia Blacks are 8.0 times more likely than whites to be arrested for marijuana possession
Arrest Rates
Marijuana possession
46.9%
All other drug offenses
53.1%
169
770
152
722
146
837
164
975
137
995
131
987
127
1,072
127
1,119
116
1,232
185
1,489
0
500
1000
1500
AR
RE
ST
RAT
ES
The District’s racial disparity is above the national average (3.73)
White arrest rate
Black arrest rate
Source: FBI / Uniform Crime Reporting Program Data and U.S. Census Data*All arrest rates are per 100,000 and based on 2010 data

Appendix B | 145
Sarasota
Martin
Pinellas
Alachua
Nassau
10.0x
9.8x
7.1x
6.6x
5.9x
Miami-Dade
Broward
Palm Beach
Hillsborough
Orange
Pinellas
Duval
Lee
Polk
Brevard
5.4x3.7x4.8x4.4x3.4x7.1x3.5x4.0x2.8x4.9x
2001 2002 2003 2004 2005 2006 2007 2008 2009 2010
Times more likely Blacks arrested
White arrest rate
Black arrest rate
BLACK
866WHITE
208
Cost
Money spent enforcing marijuana possession laws in 2010 :
$228,635,840Drug Arrests by Offense in 2010
Florida Blacks are 4.2 times more likely than whites to be arrested for marijuana possession
Arrest Rates
201
728
198
747
210
837
228
937
233
1,010
237
1,050
242
1,051
225
970
209
889
208
866
0
200
400
600
800
1000
Marijuana possession
40.9%
All other drug offenses
59.1%
1,197202
1,254189
1,811254
1,497152
1,199120
0 200 400 600 800 1,000 1,200 1,400 1,600 1,800
841173
1,122397
698176
555158
1,811254
919269
943213
587123
754206
1,089203
0 200 400 600 800 1,00 1,200 1,400 1,600 1,800
0 200 400 600 800 1,00 1,200 1,400 1,600 1,800
Population size >30,000, Black population >2%
Includes all counties, listed in order of size
Counties with the largest disparities
Counties with the largest population
Racial Disparities In Marijuana Possession Arrest Rates*
Source: FBI / Uniform Crime Reporting Program Data and U.S. Census Data*All arrest rates are per 100,000 and based on 2010 data
AR
RE
ST
RAT
ES
All counties with racial disparities above the national average (3.73)
144 | The War on Marijuana in Black and White
Statewide marijuana possession arrest rates 2001-2010

Appendix B | 145
Gordon
Fulton
Oconee
DeKalb
Jackson
14.1x
7.5x
7.3x
5.8x
4.4x
Fulton
Gwinnett
DeKalb
Chatham
Cherokee
7.5x
2.4x
5.8x
3.5x
2.8x
2001 2002 2003 2004 2005 2006 2007 2008 2009 2010
Statewide marijuana possession arrest rates 2001-2010
Times more likely Blacks arrested
White arrest rate
Black arrest rate
BLACK
699WHITE
189
Cost
Money spent enforcing marijuana possession laws in 2010 :
$121,898,152Drug Arrests by Offense in 2010
Georgia Blacks are 3.7 times more likely than whites to be arrested for marijuana possession
Arrest Rates
217
468
178
408
212
483
212
604
199
629
228
656
237
694
172
615
172
663
189
699
0
200
400
600
800
Marijuana possession
65.1%
All other drug offenses
34.9%
668152
37365
29641
1,610215
1,921136
0 200 400 600 800 1,000 1,200 1,400 1,600 1,800 2,000
690247
637183
37365
16467
1,610215
0 200 400 600 800 1,000 1,200 1,400 1,600 1,800 2,000
0 200 400 600 800 1,000 1,200 1,400 1,600 1,800 2,000
0 200 400 600 800 1,000 1,200 1,400 1,600 1,800 2,000
Population size >30,000, Black population >2%
Includes all counties, listed in order of size
Counties with the largest disparities
Counties with the largest population
Source: FBI / Uniform Crime Reporting Program Data and U.S. Census Data*All arrest rates are per 100,000 and based on 2010 data
AR
RE
ST
RAT
ES
Racial Disparities In Marijuana Possession Arrest Rates*
All counties with racial disparities above the national average (3.73)
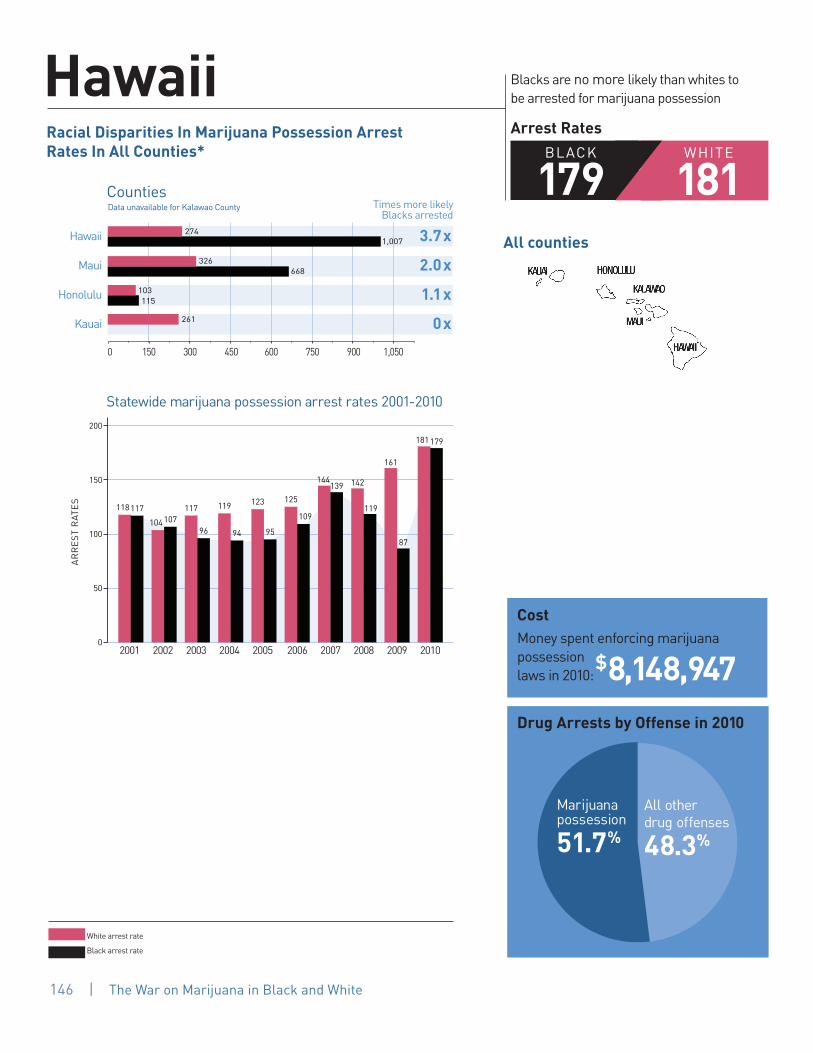
Appendix B | 147
2001 2002 2003 2004 2005 2006 2007 2008 2009 2010
Times more likely Blacks arrested
White arrest rate
Black arrest rate
BLACK
179WHITE
181
Cost
Money spent enforcing marijuana possession laws in 2010:
$8,148,947Drug Arrests by Offense in 2010
Hawaii Blacks are no more likely than whites to be arrested for marijuana possession
Arrest Rates
118117
104107117
96
119
94
123
95
125
109
144139 142
119
161
87
181179
0
50
100
150
200
Marijuana possession
51.7%
All other drug offenses
48.3%
0 150 300 450 600 750 900 1,050
Counties
All counties
AR
RE
ST
RAT
ES
Data unavailable for Kalawao County
Racial Disparities In Marijuana Possession Arrest Rates In All Counties*
146 | The War on Marijuana in Black and White
Statewide marijuana possession arrest rates 2001-2010
Hawaii
Maui
Honolulu
Kauai 261
115103
668326
1,007274 3.7x
2.0x
1.1x
0x
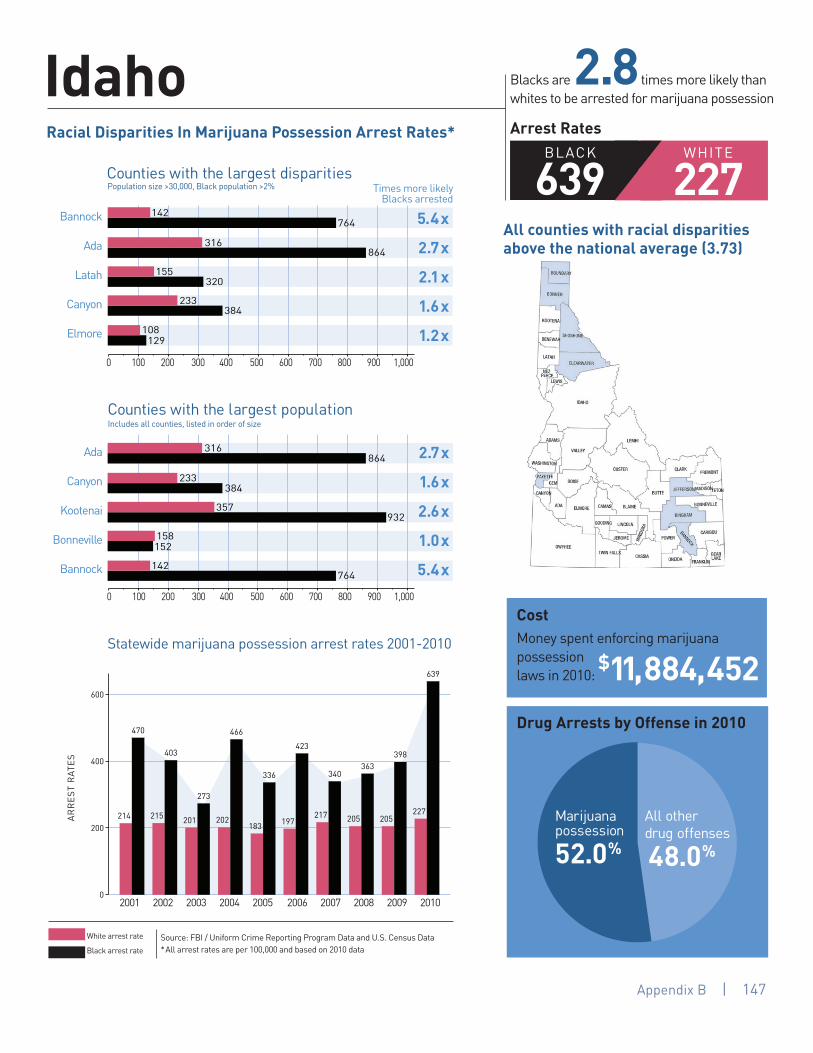
Appendix B | 147
Bannock
Ada
Latah
Canyon
Elmore
5.4x
2.7x
2.1x
1.6x
1.2x
Ada
Canyon
Kootenai
Bonneville
Bannock
2.7x
1.6x
2.6x
1.0x
5.4x
2001 2002 2003 2004 2005 2006 2007 2008 2009 2010
Statewide marijuana possession arrest rates 2001-2010
Times more likely Blacks arrested
White arrest rate
Black arrest rate
BLACK
639WHITE
227
Cost
Money spent enforcing marijuana possession laws in 2010 :
$11,884,452Drug Arrests by Offense in 2010
Idaho Blacks are 2.8 times more likely than whites to be arrested for marijuana possession
Arrest Rates
214
470
215
403
201
273
202
466
183
336
197
423
217
340
205
363
205
398
227
639
0
200
400
600
Marijuana possession
52.0%
All other drug offenses
48.0%
129108
384233
320155
864316
764142
0 100 200 300 400 500 600 700 800 900 1,000
764142
152158
932357
384233
864316
0 100 200 300 400 500 600 700 800 900 1,000
0 100 200 300 400 500 600 700 800 900 1,000
0 100 200 300 400 500 600 700 800 900 1,000
Population size >30,000, Black population >2%
Includes all counties, listed in order of size
Counties with the largest disparities
Counties with the largest population
Source: FBI / Uniform Crime Reporting Program Data and U.S. Census Data*All arrest rates are per 100,000 and based on 2010 data
AR
RE
ST
RAT
ES
Racial Disparities In Marijuana Possession Arrest Rates*
All counties with racial disparities above the national average (3.73)

Appendix B | 149
Stephenson
Jackson
Champaign
Peoria
Adams
9.4 x
9.2 x
9.0 x
8.4x
7.6x
Cook
DuPage
Lake
Will
Kane
7.2x
5.3x
5.8x
5.0x
5.7x
2001 2002 2003 2004 2005 2006 2007 2008 2009 2010
Times more likely Blacks arrested
White arrest rate
Black arrest rate
WHITE
202
Cost
Money spent enforcing marijuana possession laws in 2010 :
$221,431,776Drug Arrests by Offense in 2010
Illinois Blacks are 7.6 times more likely than whites to be arrested for marijuana possession
Arrest RatesBLACK
1,526
178
1,012
176
1,086
186
1,261
181
1,341
192
1,431
197
1,511
205
1,658
199
1,516
206
1,532
202
1,526
0
500
1000
1500
2000
Marijuana possession
45.3%
All other drug offenses
54.7%
67789
1,342160
73382
70076
1,122120
0 200 400 600 800 1,000 1,200 1,400 1,600 1,800
1,564274
43987
870149
691129
1,831256
0 200 400 600 800 1,000 1,200 1,400 1,600 1,800
0 200 400 600 800 1,000 1,200 1,400 1,600 1,800
0 200 400 600 800 1,000 1,200 1,400 1,600 1,800
Population size >30,000, Black population >2%
Includes all counties, listed in order of size
Counties with the largest disparities
Counties with the largest population
Racial Disparities In Marijuana Possession Arrest Rates*
Source: FBI / Uniform Crime Reporting Program Data and U.S. Census Data*All arrest rates are per 100,000 and based on 2010 data
AR
RE
ST
RAT
ES
All counties with racial disparities above the national average (3.73)
148 | The War on Marijuana in Black and White
Statewide marijuana possession arrest rates 2001-2010

Appendix B | 149
Elkhart
Floyd
Allen
Knox
Hamilton
7.0x
6.4x
6.4x
5.6x
5.5x
Marion
Lake
Allen
Hamilton
St. Joseph
4.7x
2.0x
6.4x
5.5x
4.2x
2001 2002 2003 2004 2005 2006 2007 2008 2009 2010
Statewide marijuana possession arrest rates 2001-2010
Times more likely Blacks arrested
White arrest rate
Black arrest rate
BLACK
591WHITE
174
Cost
Money spent enforcing marijuana possession laws in 2010 :
$38,480,904Drug Arrests by Offense in 2010
Indiana Blacks are 3.4 times more likely than whites to be arrested for marijuana possession
Arrest Rates
Marijuana possession
44.0%
All other drug offenses
56.0%
1,132205
52994
877138
1,641256
1,235177
538129
1,132205
877138
334164
46098
0 200 400 600 800 1,000 1,200 1,400 1,600
0 200 400 600 800 1,000 1,200 1,400 1,600
0 200 400 600 800 1,000 1,200 1,400 1,600
Population size >30,000, Black population >2%
Includes all counties, listed in order of size
Counties with the largest disparities
Counties with the largest population
Source: FBI / Uniform Crime Reporting Program Data and U.S. Census Data*All arrest rates are per 100,000 and based on 2010 data
AR
RE
ST
RAT
ES
Racial Disparities In Marijuana Possession Arrest Rates*
All counties with racial disparities above the national average (3.73)
557
485 493
582
660 676700
655676
591
0
200
400
600
800
204225
197 210 221 231202 186 194
174

Appendix B | 151
Dubuque
Woodbury
Johnson
Linn
Clinton
10.0x
8.1x
7.8x
7.3x
7.3x
Polk
Linn
Scott
Johnson
Black Hawk
5.0x
7.3x
6.6x
7.8x
5.9x
2001 2002 2003 2004 2005 2006 2007 2008 2009 2010
Times more likely Blacks arrested
White arrest rate
Black arrest rate
WHITE
174BLACK
1,454
Cost
Money spent enforcing marijuana possession laws in 2010 :
$22,845,638Drug Arrests by Offense in 2010
Iowa Blacks are 8.3 times more likely than whites to be arrested for marijuana possession
Arrest Rates
168
1,064
186
1,252
179
1,456
177
1,233
179
1,411
179
1,608
176
1,650
160
1,453
166
1,509
174
1,454
0
500
1000
1500
2000
Marijuana possession
62.8%
All other drug offenses
37.2%
1,148157
2,090284
1,918247
2,036251
1,816181
0 250 500 750 1,000 1,250 1,500 1,750 2,000 2,250
1,850315
1,918247
2,202336
2,090284
887179
0 250 500 750 1,000 1,250 1,500 1,750 2,000 2,250
0 250 500 750 1,000 1,250 1,500 1,750 2,000 2,250
0 250 500 750 1,000 1,250 1,500 1,750 2,000 2,250
Population size >30,000, Black population >2%
Includes all counties, listed in order of size
Counties with the largest disparities
Counties with the largest population
Racial Disparities In Marijuana Possession Arrest Rates*
Source: FBI / Uniform Crime Reporting Program Data and U.S. Census Data*All arrest rates are per 100,000 and based on 2010 data
AR
RE
ST
RAT
ES
All counties with racial disparities above the national average (3.73)
150 | The War on Marijuana in Black and White
Statewide marijuana possession arrest rates 2001-2010

Appendix B | 151
Montgomery
Saline
Crawford
Lyon
Sedgwick
6.4x
5.9x
5.8x
5.6x
5.5x
Sedgwick
Douglas
Leavenworth
Riley
Butler
5.5x
3.7x
2.0x
3.0x
3.6x
2001 2002 2003 2004 2005 2006 2007 2008 2009 2010
Statewide marijuana possession arrest rates 2001-2010
Times more likely Blacks arrested
White arrest rate
Black arrest rate
BLACK
688WHITE
156
Cost
Money spent enforcing marijuana possession laws in 2010 :
$20,182,786Drug Arrests by Offense in 2010
Kansas Blacks are 4.4 times more likely than whites to be arrested for marijuana possession
Arrest Rates
194
570
153
331
198
548
229
763
217
670
177
655
204
796
180
678
138
576
156
688
0
200
400
600
800
Marijuana possession
43.8%
All other drug offenses
56.2%
961176
655117
743128
1,268215
906142
0 150 300 450 600 750 900 1,050 1,200 1,350
365102
343116
8240
583159
961176
0 150 300 450 600 750 900 1,050 1,200 1,350
0 150 300 450 600 750 900 1,050 1,200 1,350
0 150 300 450 600 750 900 1,050 1,200 1,350
Population size >30,000, Black population >2%
Includes all counties, listed in order of size
Counties with the largest disparities
Counties with the largest population
Source: FBI / Uniform Crime Reporting Program Data and U.S. Census Data*All arrest rates are per 100,000 and based on 2010 data
AR
RE
ST
RAT
ES
Racial Disparities In Marijuana Possession Arrest Rates*
All counties with racial disparities above the national average (3.73)

Appendix B | 153
Nelson
Campbell
Kenton
Hardin
Barren
32.1x
12.2x
10.0x
5.2x
4.5x
Jefferson
Kenton
Boone
Warren
Hardin
3.5x
10.0x
3.8x
2.7x
5.2x
2001 2002 2003 2004 2005 2006 2007 2008 2009 2010
Times more likely Blacks arrested
White arrest rate
Black arrest rate
BLACK
697WHITE
117
Cost
Money spent enforcing marijuana possession laws in 2010 :
$19,499,768Drug Arrests by Offense in 2010
Kentucky Blacks are 6.0 times more likely than whites to be arrested for marijuana possession
Arrest Rates
361
874
285
789
290
798
330
1,218
117
890
416
1,916
444
1,929
284
1,385
168
1,092
117
697
0
500
1000
1500
2000
Marijuana possession
31.8%All other drug offenses
68.2%
1,086243
676130
2,348235
5,686465
32410
0 600 1,200 1,800 2,400 3,000 3,600 4,200 4,800 5,400
676130
17364
6517
2,348235
982278
0 600 1,200 1,800 2,400 3,000 3,600 4,200 4,800 5,400
0 600 1,200 1,800 2,400 3,00 3,600 4,200 4,800 5,400
0 600 1,200 1,800 2,400 3,00 3,600 4,200 4,800 5,400
Population size >30,000, Black population >2%
Includes all counties, listed in order of size
Counties with the largest disparities
Counties with the largest population
Racial Disparities In Marijuana Possession Arrest Rates*
Source: FBI / Uniform Crime Reporting Program Data and U.S. Census Data*All arrest rates are per 100,000 and based on 2010 data
AR
RE
ST
RAT
ES
All counties with racial disparities above the national average (3.73)
152 | The War on Marijuana in Black and White
Statewide marijuana possession arrest rates 2001-2010

Appendix B | 153
Tangipahoa
St. Landry
Lafourche
Vermilion
Terrebonne
11.8 x
10.7 x
6.6 x
5.1 x
4.6 x
East Baton Rouge
Jefferson
Caddo
St. Tammany
Lafayette
4.6x
3.1x
3.3x
3.2x
3.3x
2001 2002 2003 2004 2005 2006 2007 2008 2009 2010
Statewide marijuana possession arrest rates 2001-2010
Times more likely Blacks arrested
White arrest rate
Black arrest rate
BLACK
569WHITE
182
Cost
Money spent enforcing marijuana possession laws in 2010 :
$46,450,368Drug Arrests by Offense in 2010
Louisiana Blacks are 3.1 times more likely than whites to be arrested for marijuana possession
Arrest Rates
192
452
196
395
239
448
261
554
237
642
258
743
249
620
259
629
211
632
182
569
0
200
400
600
800
Marijuana possession
37.0%All other drug offenses
63.0%
28662
21542
841128
75871
58650
0 150 300 450 600 750 900 1,050
632190
1,025323
855255
472152
866190
0 150 300 450 600 750 900 1,050
0 150 300 450 600 750 900 1,050
0 150 300 450 600 750 900 1,050
Population size >30,000, Black population >2%
Includes all counties, listed in order of size Data unavailable for Orleans County (New Orleans)
Counties with the largest disparities
Counties with the largest population
Source: FBI / Uniform Crime Reporting Program Data and U.S. Census Data*All arrest rates are per 100,000 and based on 2010 data
AR
RE
ST
RAT
ES
Racial Disparities In Marijuana Possession Arrest Rates*
All counties with racial disparities above the national average (3.73)
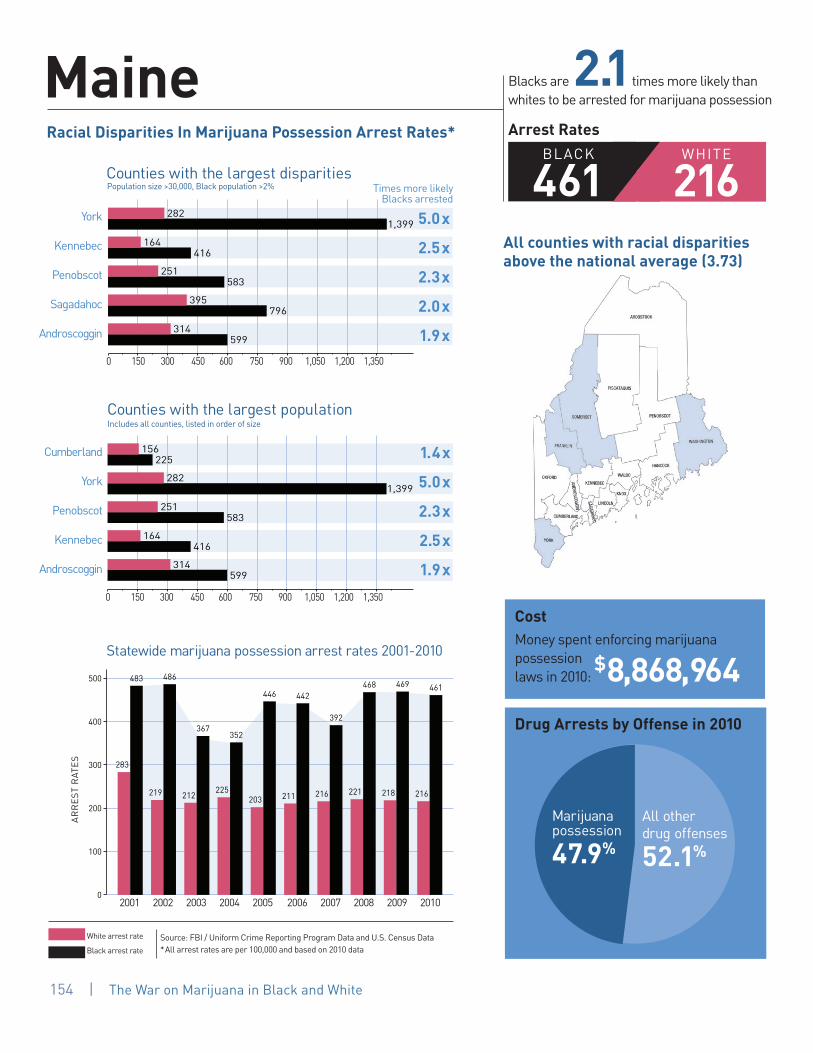
Appendix B | 155
York
Kennebec
Penobscot
Sagadahoc
Androscoggin
5.0x
2.5x
2.3x
2.0x
1.9x
Cumberland
York
Penobscot
Kennebec
Androscoggin
1.4x
5.0x
2.3x
2.5x
1.9x
2001 2002 2003 2004 2005 2006 2007 2008 2009 2010
Times more likely Blacks arrested
White arrest rate
Black arrest rate
BLACK
461WHITE
216
Cost
Money spent enforcing marijuana possession laws in 2010:
$8,868,964Drug Arrests by Offense in 2010
Maine Blacks are 2.1 times more likely than whites to be arrested for marijuana possession
Arrest Rates
283
483
219
486
212
367
225
352
203
446
211
442
216
392
221
468
218
469
216
461
0
100
200
300
400
500
Marijuana possession
47.9%
All other drug offenses
52.1%
599314
796395
583251
416164
1,399282
0 150 300 450 600 750 900 1,050 1,200 1,350
599314
416164
583251
1,399282
225156
0 150 300 450 600 750 900 1,050 1,200 1,350
0 150 300 450 600 750 900 1,050 1,200 1,350
0 150 300 450 600 750 900 1,050 1,200 1,350
Population size >30,000, Black population >2%
Includes all counties, listed in order of size
Counties with the largest disparities
Counties with the largest population
Racial Disparities In Marijuana Possession Arrest Rates*
Source: FBI / Uniform Crime Reporting Program Data and U.S. Census Data*All arrest rates are per 100,000 and based on 2010 data
AR
RE
ST
RAT
ES
All counties with racial disparities above the national average (3.73)
154 | The War on Marijuana in Black and White
Statewide marijuana possession arrest rates 2001-2010
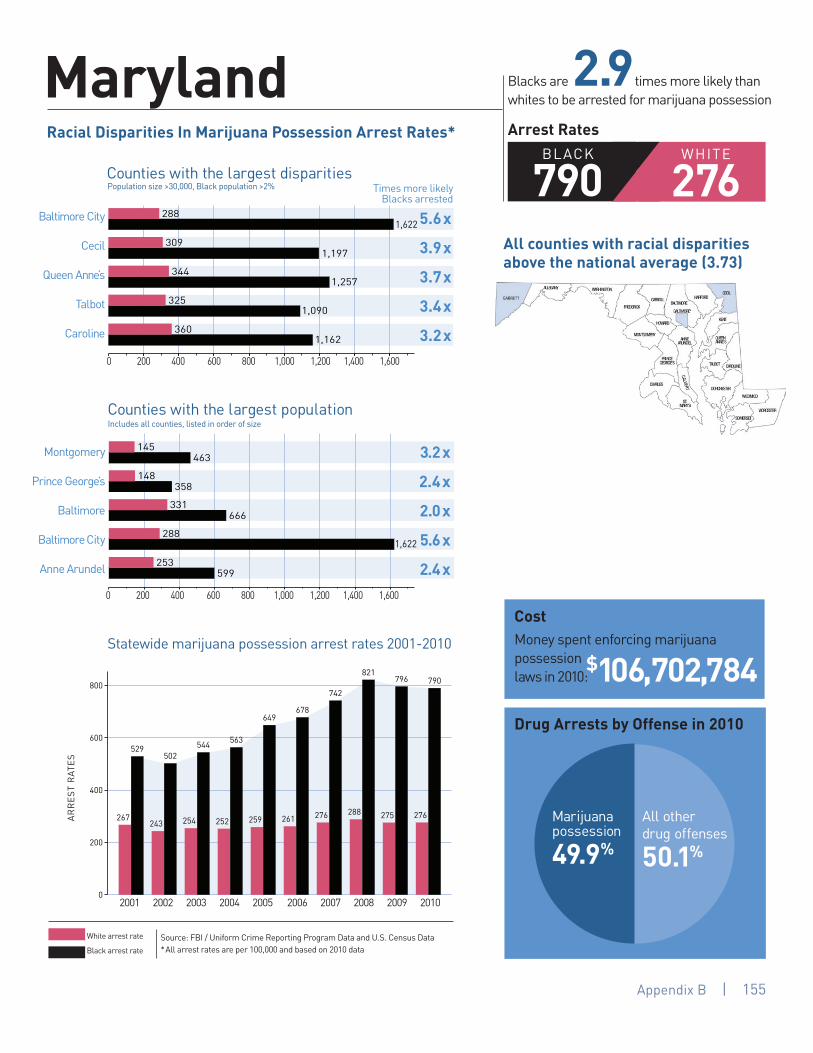
Appendix B | 155
Baltimore City
Cecil
Queen Anne’s
Talbot
Caroline
5.6x
3.9x
3.7x
3.4x
3.2x
Montgomery
Prince George’s
Baltimore
Baltimore City
Anne Arundel
3.2x
2.4x
2.0x
5.6x
2.4x
2001 2002 2003 2004 2005 2006 2007 2008 2009 2010
Statewide marijuana possession arrest rates 2001-2010
Times more likely Blacks arrested
White arrest rate
Black arrest rate
BLACK
790WHITE
276
Cost
Money spent enforcing marijuana possession laws in 2010 :
$106,702,784Drug Arrests by Offense in 2010
Maryland Blacks are 2.9 times more likely than whites to be arrested for marijuana possession
Arrest Rates
267
529
243
502
254
544
252
563
259
649
261
678
276
742
288
821
275
796
276
790
0
200
400
600
800
Marijuana possession
49.9%
All other drug offenses
50.1%
1,162360
1,090325
1,257344
1,197309
1,622288
0 200 400 600 800 1,000 1,200 1,400 1,600
599253
1,622288
666331
358148
463145
0 200 400 600 800 1,000 1,200 1,400 1,600
0 200 400 600 800 1,000 1,200 1,400 1,600
0 200 400 600 800 1,000 1,200 1,400 1,600
Population size >30,000, Black population >2%
Includes all counties, listed in order of size
Counties with the largest disparities
Counties with the largest population
Source: FBI / Uniform Crime Reporting Program Data and U.S. Census Data*All arrest rates are per 100,000 and based on 2010 data
AR
RE
ST
RAT
ES
Racial Disparities In Marijuana Possession Arrest Rates*
All counties with racial disparities above the national average (3.73)
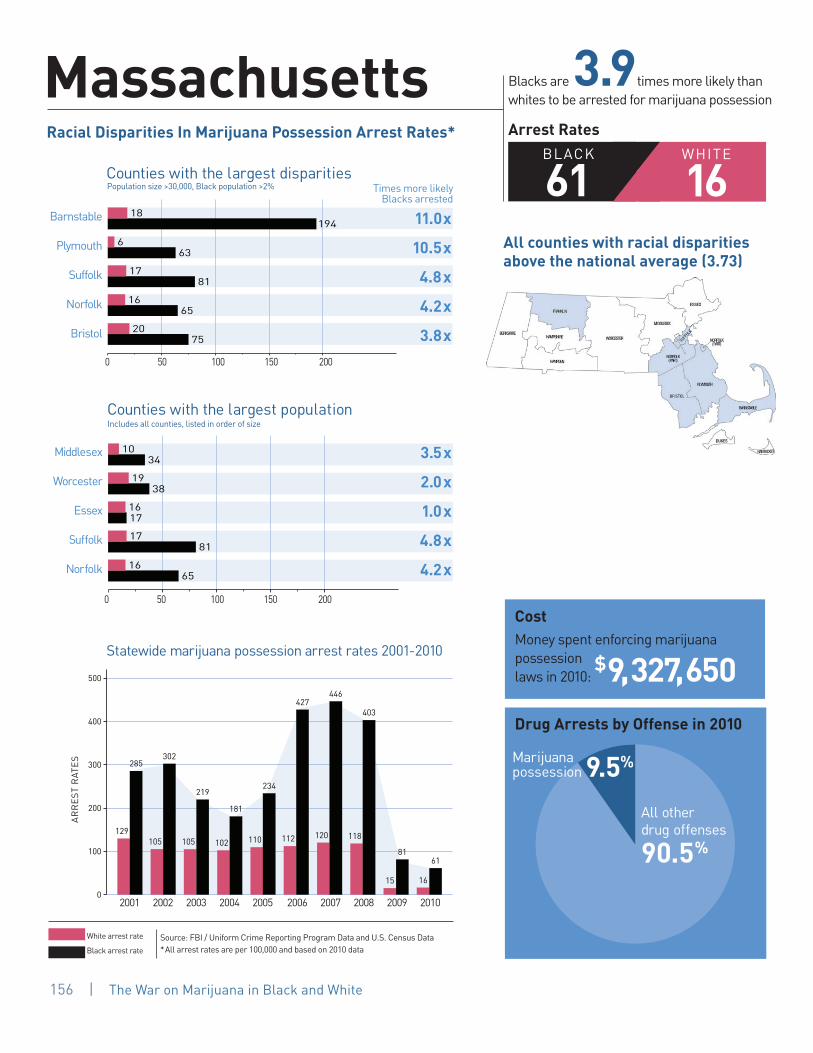
Appendix B | 157
Barnstable
Plymouth
Suffolk
Norfolk
Bristol
11.0x
10.5x
4.8x
4.2x
3.8x
Middlesex
Worcester
Essex
Suffolk
Norfolk
3.5x
2.0x
1.0x
4.8x
4.2x
2001 2002 2003 2004 2005 2006 2007 2008 2009 2010
Times more likely Blacks arrested
White arrest rate
Black arrest rate
BLACK
61WHITE
16
Cost
Money spent enforcing marijuana possession laws in 2010:
$9,327,650Drug Arrests by Offense in 2010
Massachusetts Blacks are 3.9 times more likely than whites to be arrested for marijuana possession
Arrest Rates
Marijuana possession 9.5%
All other drug offenses
90.5%
7520
6516
8117
636
19418
6516
8117
1716
3819
3410
0 50 100 150 200
0 50 100 150 200
129
285
105
302
105
219
102
181
110
234
112
427
120
446
118
403
15
81
16
61
0
100
200
300
400
500
Population size >30,000, Black population >2%
Includes all counties, listed in order of size
Counties with the largest disparities
Counties with the largest population
Racial Disparities In Marijuana Possession Arrest Rates*
Source: FBI / Uniform Crime Reporting Program Data and U.S. Census Data*All arrest rates are per 100,000 and based on 2010 data
AR
RE
ST
RAT
ES
All counties with racial disparities above the national average (3.73)
156 | The War on Marijuana in Black and White
Statewide marijuana possession arrest rates 2001-2010

Appendix B | 157
Monroe
St. Clair
Jackson
Kalamazoo
Kent
15.4x
10.1x
8.6x
8.5 x
7.5 x
Wayne
Oakland
Macomb
Kent
Genesee
1.9x
4.2x
5.0x
7.5x
3.4x
2001 2002 2003 2004 2005 2006 2007 2008 2009 2010
Statewide marijuana possession arrest rates 2001-2010
Times more likely Blacks arrested
White arrest rate
Black arrest rate
BLACK
464WHITE
141
Cost
Money spent enforcing marijuana possession laws in 2010 :
$94,838,792Drug Arrests by Offense in 2010
Michigan Blacks are 3.3 times more likely than whites to be arrested for marijuana possession
Arrest Rates
Marijuana possession
49.6%
All other drug offenses
50.4%
162
214
150
219
143
241
142
257
137
336
136
378
127
401
127
398
128
436
141
464
0
100
200
300
400
500
1,134151
1,269149
76990
1,041103
71046
0 150 300 450 600 750 900 1,050 1,200 1,350
402118
1,134151
598120
498119
330174
0 150 300 450 600 750 900 1,050 1,200 1,350
0 150 300 450 600 750 900 1,050 1,200 1,350
0 150 300 450 600 750 900 1,050 1,200 1,350
Population size >30,000, Black population >2%
Includes all counties, listed in order of size
Counties with the largest disparities
Counties with the largest population
Source: FBI / Uniform Crime Reporting Program Data and U.S. Census Data*All arrest rates are per 100,000 and based on 2010 data
AR
RE
ST
RAT
ES
Racial Disparities In Marijuana Possession Arrest Rates*
All counties with racial disparities above the national average (3.73)

Appendix B | 159
Hennepin
Ramsey
Dakota
Stearns
Blue Earth
9.1x
7.4x
5.6x
5.5x
5.2x
Hennepin
Ramsey
Dakota
Anoka
Washington
9.1x
7.4x
5.6x
3.7x
1.4x
2001 2002 2003 2004 2005 2006 2007 2008 2009 2010
Times more likely Blacks arrested
White arrest rate
Black arrest rate
BLACK
835WHITE
107
Cost
Money spent enforcing marijuana possession laws in 2010 :
$94,838,792Drug Arrests by Offense in 2010
Minnesota Blacks are 7.8 times more likely than whites to be arrested for marijuana possession
Arrest Rates
Marijuana possession
42.8%
All other drug offenses
57.2%139
329
133
365
124
377
119
690
111
929
103
950
111
1,060
109
1,067
106
933
107
835
0
200
400
600
800
1000
1,001193
880161
53094
753101
1,069118
0 150 300 450 600 750 900 1,050
195139
453124
53094
753101
1,069118
0 150 300 450 600 750 900 1,050
0 150 300 450 600 750 900 1,050
0 150 300 450 600 750 900 1,050
Population size >30,000, Black population >2%
Includes all counties, listed in order of size
Counties with the largest disparities
Counties with the largest population
Racial Disparities In Marijuana Possession Arrest Rates*
Source: FBI / Uniform Crime Reporting Program Data and U.S. Census Data*All arrest rates are per 100,000 and based on 2010 data
AR
RE
ST
RAT
ES
All counties with racial disparities above the national average (3.73)
158 | The War on Marijuana in Black and White
Statewide marijuana possession arrest rates 2001-2010
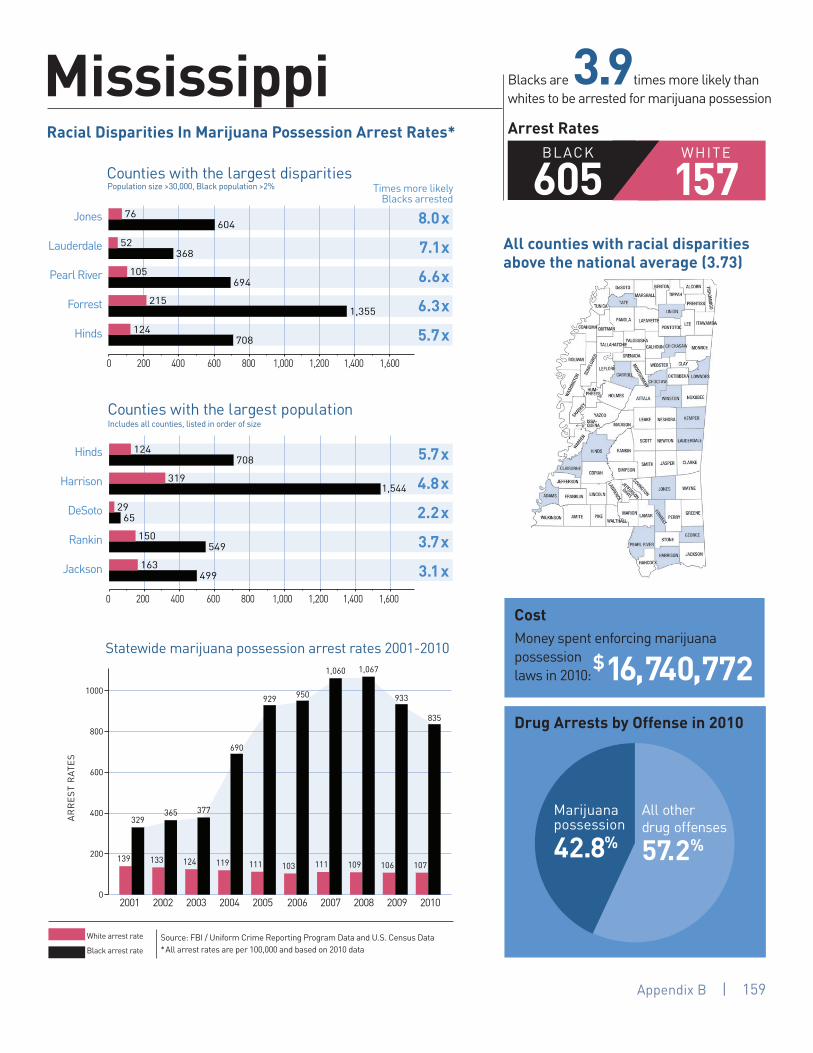
Appendix B | 159
Jones
Lauderdale
Pearl River
Forrest
Hinds
8.0x
7.1x
6.6x
6.3x
5.7x
Hinds
Harrison
DeSoto
Rankin
Jackson
5.7x
4.8x
2.2x
3.7x
3.1x
2001 2002 2003 2004 2005 2006 2007 2008 2009 2010
Statewide marijuana possession arrest rates 2001-2010
Times more likely Blacks arrested
White arrest rate
Black arrest rate
BLACK
605WHITE
157
Cost
Money spent enforcing marijuana possession laws in 2010 :
$16,740,772Drug Arrests by Offense in 2010
Mississippi Blacks are 3.9 times more likely than whites to be arrested for marijuana possession
Arrest Rates
Marijuana possession
42.8%
All other drug offenses
57.2%139
329
133
365
124
377
119
690
111
929
103
950
111
1,060
109
1,067
106
933
107
835
0
200
400
600
800
1000
708124
1,355215
694105
36852
60476
499163
549150
6529
1,544319
708124
0 200 400 600 800 1,000 1,200 1,400 1,600
0 200 400 600 800 1,000 1,200 1,400 1,600
Population size >30,000, Black population >2%
Includes all counties, listed in order of size
Counties with the largest disparities
Counties with the largest population
Source: FBI / Uniform Crime Reporting Program Data and U.S. Census Data*All arrest rates are per 100,000 and based on 2010 data
AR
RE
ST
RAT
ES
Racial Disparities In Marijuana Possession Arrest Rates*
All counties with racial disparities above the national average (3.73)
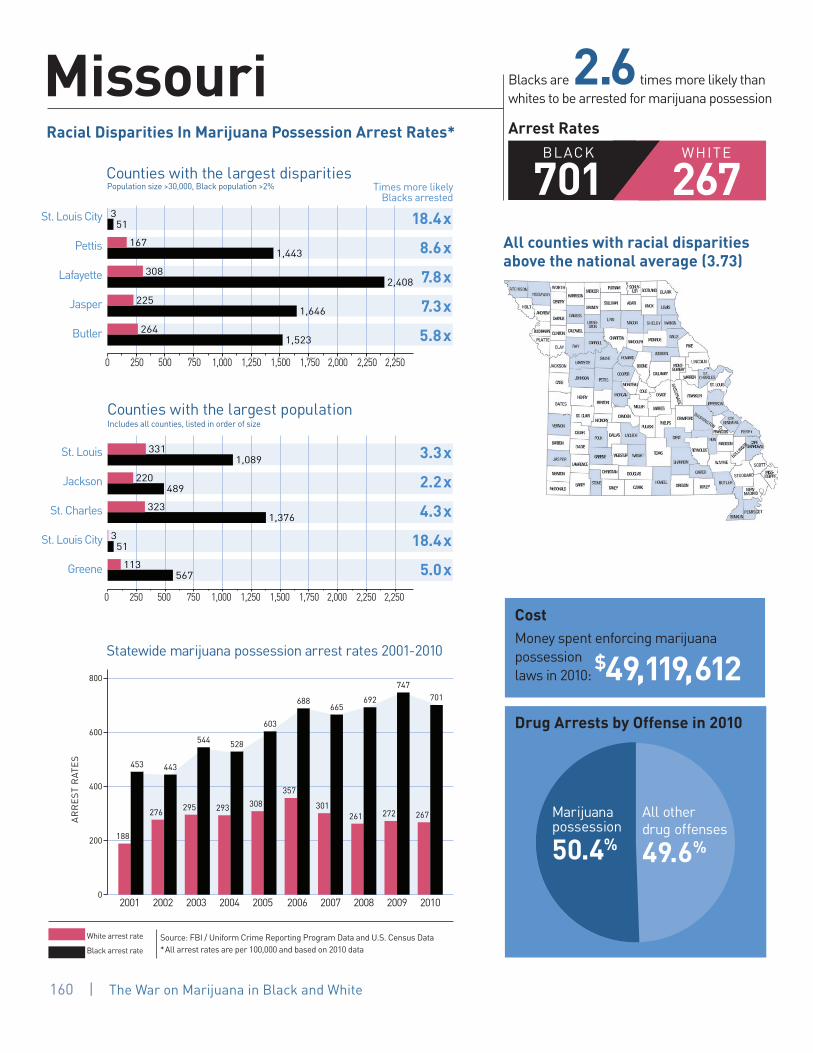
Appendix B | 161
St. Louis City
Pettis
Lafayette
Jasper
Butler
18.4x
8.6x
7.8x
7.3x
5.8x
St. Louis
Jackson
St. Charles
St. Louis City
Greene
3.3x
2.2x
4.3x
18.4x
5.0x
2001 2002 2003 2004 2005 2006 2007 2008 2009 2010
Times more likely Blacks arrested
White arrest rate
Black arrest rate
BLACK
701WHITE
267
Cost
Money spent enforcing marijuana possession laws in 2010 :
$49,119,612Drug Arrests by Offense in 2010
Missouri Blacks are 2.6 times more likely than whites to be arrested for marijuana possession
Arrest Rates
188
453
276
443
295
544
293
528
308
603
357
688
301
665
261
692
272
747
267
701
0
200
400
600
800
Marijuana possession
50.4%
All other drug offenses
49.6%
1,523264
1,646225
2,408308
1,443167
513
0 250 500 750 1,000 1,250 1,500 1,750 2,000 2,250 2,500
567113
513
1,376323
489220
1,089331
0 250 500 750 1,000 1,250 1,500 1,750 2,000 2,250 2,500
0 250 500 750 1,000 1,250 1,500 1,750 2,000 2,250 2,250
0 250 500 750 1,000 1,250 1,500 1,750 2,000 2,250 2,250
Population size >30,000, Black population >2%
Includes all counties, listed in order of size
Counties with the largest disparities
Counties with the largest population
Racial Disparities In Marijuana Possession Arrest Rates*
Source: FBI / Uniform Crime Reporting Program Data and U.S. Census Data*All arrest rates are per 100,000 and based on 2010 data
AR
RE
ST
RAT
ES
All counties with racial disparities above the national average (3.73)
160 | The War on Marijuana in Black and White
Statewide marijuana possession arrest rates 2001-2010

Appendix B | 161
Yellowstone
Missoula
Flathead
Gallatin
Cascade
Flathead
Yellowstone
Gallatin
Missoula
4.1x
1.4x
10.5x
2.3x
0x
10.5x
4.1x
2.3x
1.4x
2001 2002 2003 2004 2005 2006 2007 2008 2009 2010
Statewide marijuana possession arrest rates 2001-2010
Times more likely Blacks arrested
White arrest rate
Black arrest rate
0 150 300 450 600 750 900 1,050 1,200 1,350
BLACK
432WHITE
123
Cost
Money spent enforcing marijuana possession laws in 2010:
$6,161,866Drug Arrests by Offense in 2010
Montana Blacks are 3.5 times more likely than whites to be arrested for marijuana possession
Arrest Rates
Marijuana possession
70.2%
All other drug offenses
29.8%
0127
319138
1,375131
213152
504122
0 150 300 450 600 750 900 1,050 1,200 1,350
138319
122504
1,375131
0 150 300 450 600 750 900 1,050 1,200 1,350
51
271
76
128
59
445
20
207
135
335
143
305
137
287
126
355
116
335
123
432
0
100
200
300
400
500
Population size >20,000
Includes all counties, listed in order of size
Counties with the largest disparities
Counties with the largest population
Source: FBI / Uniform Crime Reporting Program Data and U.S. Census Data*All arrest rates are per 100,000 and based on 2010 data
AR
RE
ST
RAT
ES
213152
Racial Disparities In Marijuana Possession Arrest Rates*
All counties with racial disparities above the national average (3.73)

Appendix B | 163
Douglas
Lancaster
Sarpy
Dakota
5.4x
4.7x
3.2x
2.6x
Douglas
Lancaster
Sarpy
Hall
Buffalo
5.4x
4.7x
3.2x
1.0x
0.7x
2001 2002 2003 2004 2005 2006 2007 2008 2009 2010
Times more likely Blacks arrested
White arrest rate
Black arrest rate
WHITE
365BLACK
1,699
Cost
Money spent enforcing marijuana possession laws in 2010 :
$22,809,270Drug Arrests by Offense in 2010
Nebraska Blacks are 4.7 times more likely than whites to be arrested for marijuana possession
Arrest Rates
Marijuana possession
72.8%
All other drug offenses
27.2%
345
3,278
377
2,812
290
2,257
320
2,136
344
2,217
341
2,218
347
2,002
384
2,067
341
1,915
365
1,699
0
1000
2000
3000
4000
733284
1,476457
1,873398
1,810338
0 200 400 600 800 1,000 1,200 1,400 1,600 1,800
472647
495508
1,476457
1,873398
1,810338
0 200 400 600 800 1,000 1,200 1,400 1,600 1,800
0 200 400 600 800 1,000 1,200 1,400 1,600 1,800
0 200 400 600 800 1,000 1,200 1,400 1,600 1,800
Population size >30,000, Black population >2%
Includes all counties, listed in order of size
Counties with the largest disparities
Counties with the largest population
Racial Disparities In Marijuana Possession Arrest Rates*
Source: FBI / Uniform Crime Reporting Program Data and U.S. Census Data*All arrest rates are per 100,000 and based on 2010 data
AR
RE
ST
RAT
ES
All counties with racial disparities above the national average (3.73)
162 | The War on Marijuana in Black and White
Statewide marijuana possession arrest rates 2001-2010

Appendix B | 163
Churchill
Washoe
Clark
Nye
5.9 x
4.3 x
4.1 x
1.4 x
Clark
Washoe
Carson City
Lyon
Elko
4.1x
4.3x
1.0x
0x
1.9x
2001 2002 2003 2004 2005 2006 2007 2008 2009 2010
Statewide marijuana possession arrest rates 2001-2010
White arrest rate
Black arrest rate
WHITE
284
Cost
Money spent enforcing marijuana possession laws in 2010 :
$41,601,604Drug Arrests by Offense in 2010
Nevada Blacks are 4.5 times more likely than whites to be arrested for marijuana possession
Arrest RatesBLACK
1,272
Marijuana possession
50.7%
All other drug offenses
49.3%155
559
175
678
151
646
172
741
174
813
192
981
229
1,137
227
1,059
274
1,298
284
1,272
0
500
1000
1500
325225
1,300315
970228
1,175200
218116
058
177186
970228
1,300315
0 150 300 450 600 750 900 1,050 1,200 1,350
0 150 300 450 600 750 900 1,050 1,200 1,350
Population size >30,000, Black population >2%
Includes all counties, listed in order of size
Counties with the largest disparities
Counties with the largest population
Source: FBI / Uniform Crime Reporting Program Data and U.S. Census Data*All arrest rates are per 100,000 and based on 2010 data
AR
RE
ST
RAT
ES
Racial Disparities In Marijuana Possession Arrest Rates*
All counties with racial disparities above the national average (3.73)
Times more likely Blacks arrested

Appendix B | 165
Cheshire
Merrimack
Strafford
Rockingham
Hillsborough
9.8x
3.3x
2.9x
2.7x
2.1x
Hillsborough
Rockingham
Merrimack
Strafford
Grafton
2.1x
2.7 x
3.3 x
2.9 x
2.0 x
2001 2002 2003 2004 2005 2006 2007 2008 2009 2010
Times more likely Blacks arrested
White arrest rate
Black arrest rate
BLACK
561WHITE
213
Cost
Money spent enforcing marijuana possession laws in 2010:
$6,526,364Drug Arrests by Offense in 2010
New Hampshire Blacks are 2.6 times more likely than whites to be arrested for marijuana possession
Arrest Rates
2,269
296
787
270
677
148
486
226
503
179
321
180
487
172
395
185
565
211
534
213
561
0
200
400
600
800
Marijuana possession
53.5%
All other drug offenses
46.5%
424200
488177
529182
759229
2,269232
0 250 500 750 1,000 1,250 1,500 1,750 2,000 2,250
748377
529182
759229
488177
424200
0 200 400 600 800 1,000 1,200 1,400 1,600 1,800
0 250 500 750 1,000 1,250 1,500 1,750 2,000 2,250
0 200 400 600 800 1,000 1,200 1,400 1,600 1,800
Population size >30,000, Black population >2%
Includes all counties, listed in order of size
Counties with the largest disparities
Counties with the largest population
Racial Disparities In Marijuana Possession Arrest Rates*
Source: FBI / Uniform Crime Reporting Program Data and U.S. Census Data*All arrest rates are per 100,000 and based on 2010 data
AR
RE
ST
RAT
ES
All counties with racial disparities above the national average (3.73)
164 | The War on Marijuana in Black and White
Statewide marijuana possession arrest rates 2001-2010
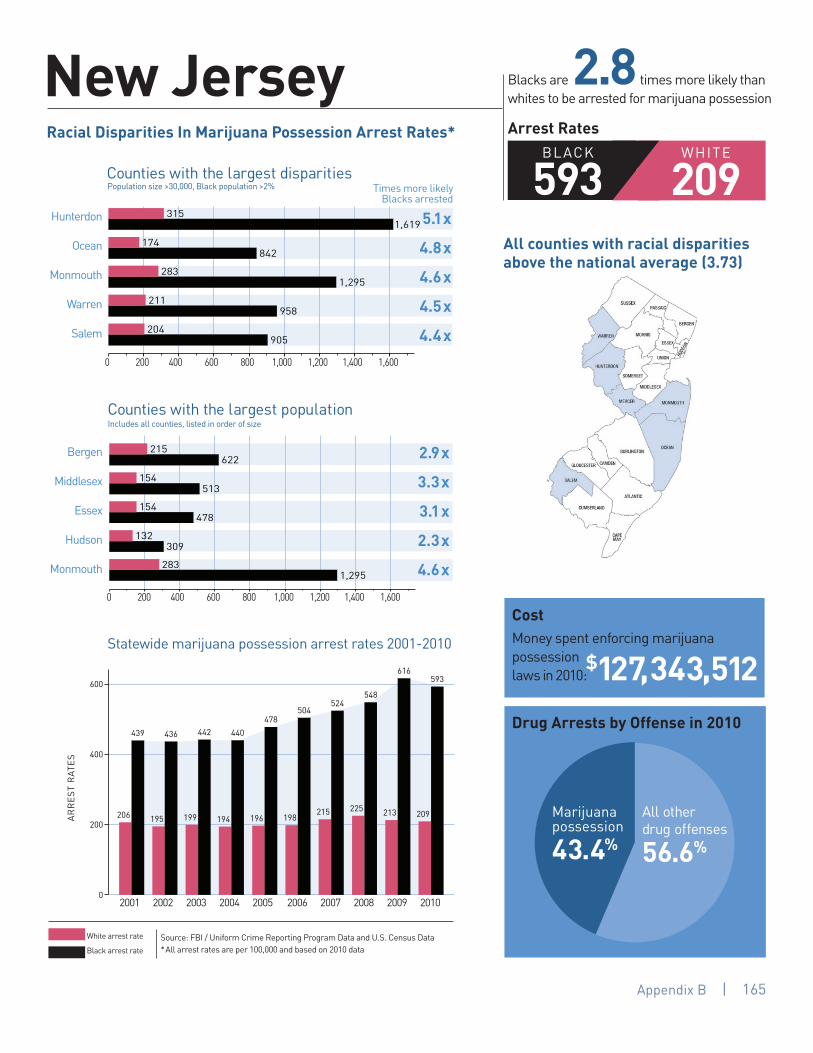
Appendix B | 165
Hunterdon
Ocean
Monmouth
Warren
Salem
5.1x
4.8x
4.6x
4.5x
4.4x
Bergen
Middlesex
Essex
Hudson
Monmouth
2.9x
3.3x
3.1x
2.3x
4.6x
2001 2002 2003 2004 2005 2006 2007 2008 2009 2010
Statewide marijuana possession arrest rates 2001-2010
Times more likely Blacks arrested
White arrest rate
Black arrest rate
BLACK
593WHITE
209
Cost
Money spent enforcing marijuana possession laws in 2010 :
$127,343,512Drug Arrests by Offense in 2010
New Jersey Blacks are 2.8 times more likely than whites to be arrested for marijuana possession
Arrest Rates
206
439
195
436
199
442
194
440
196
478
198
504
215
524
225
548
213
616
209
593
0
200
400
600
Marijuana possession
43.4%
All other drug offenses
56.6%
905204
958211
1,295283
842174
1,619315
0 200 400 600 800 1,000 1,200 1,400 1,600
1,295283
309132
478154
513154
622215
0 200 400 600 800 1,000 1,200 1,400 1,600
0 200 400 600 800 1,000 1,200 1,400 1,600
0 200 400 600 800 1,000 1,200 1,400 1,600
Population size >30,000, Black population >2%
Includes all counties, listed in order of size
Counties with the largest disparities
Counties with the largest population
Source: FBI / Uniform Crime Reporting Program Data and U.S. Census Data*All arrest rates are per 100,000 and based on 2010 data
AR
RE
ST
RAT
ES
Racial Disparities In Marijuana Possession Arrest Rates*
All counties with racial disparities above the national average (3.73)

Appendix B | 167
Bernalillo
Chaves
Lea
Otero
Dona Ana
3.9x
3.0x
2.9x
2.6x
1.7x
Bernalillo
Dona Ana
Santa Fe
Sandoval
San Juan
3.9x
1.7x
2.4x
1.4x
2.4x
2001 2002 2003 2004 2005 2006 2007 2008 2009 2010
Times more likely Blacks arrested
White arrest rate
Black arrest rate
BLACK
300WHITE
161
Cost
Money spent enforcing marijuana possession laws in 2010 :
$11,079,450Drug Arrests by Offense in 2010
New Mexico Blacks are 1.9 times more likely than whites to be arrested for marijuana possession
Arrest Rates
199
245
173
306
178
332
191
331
146
194
124
181198
297
161
258
135116
161
300
0
100
200
300
400
Marijuana possession
31.4%All other drug offenses
68.6%
733434
667255
661227
1,572531
8020
0 200 400 600 800 1,000 1,200 1,400 1,600
452189
348240
643274
733434
8020
0 200 400 600 800 1,000 1,200 1,400 1,600
0 200 400 600 800 1,000 1,200 1,400 1,600
0 200 400 600 800 1,000 1,200 1,400 1,600
Population size >30,000, Black population >2%
Includes all counties, listed in order of size
Counties with the largest disparities
Counties with the largest population
Racial Disparities In Marijuana Possession Arrest Rates*
Source: FBI / Uniform Crime Reporting Program Data and U.S. Census Data*All arrest rates are per 100,000 and based on 2010 data
AR
RE
ST
RAT
ES
All counties with racial disparities above the national average (3.73)
166 | The War on Marijuana in Black and White
Statewide marijuana possession arrest rates 2001-2010

Appendix B | 167
Kings
New York
Onondaga
Niagara
Montgomery
9.7x
9.4x
7.8x
7.6x
6.8x
KingsQueens
New YorkSuffolkBronx
NassauWestchester
ErieMonroe
Richmond
9.7x4.6x9.4x4.2x5.1x3.6x3.7x5.7x6.5x4.5x
2001 2002 2003 2004 2005 2006 2007 2008 2009 2010
Statewide marijuana possession arrest rates 2001-2010
White arrest rate
Black arrest rate
WHITE
263BLACK
1,192
Cost
Money spent enforcing marijuana possession laws in 2010 :
$678,450,560Drug Arrests by Offense in 2010
New York Blacks are 4.5 times more likely than whites to be arrested for marijuana possession
Arrest Rates
235
946
209
922
202
848
187
734
182
806
201
883
209
984
219
980
232
1,129
263
1,192
0
500
1000
1500
Marijuana possession
59.4%
All other drug offenses
40.6%
2,291336
2,114280
3,029391
1,952208
1,554161
0 350 700 1,050 1,400 1,750 2,100 2,450 2,800 3,1500 350 700 1,050 1,400 1,750 2,100 2,450 2,800 3,150
0 350 700 1,050 1,400 1,750 2,100 2,450 2,800 3,150
Population size >30,000, Black population >2%
Includes all counties, listed in order of size
Counties with the largest disparities
Counties with the largest population
Source: FBI / Uniform Crime Reporting Program Data and U.S. Census Data*All arrest rates are per 100,000 and based on 2010 data
AR
RE
ST
RAT
ES
Racial Disparities In Marijuana Possession Arrest Rates*
All counties with racial disparities above the national average (3.73)
Times more likely Blacks arrested
1,381309
1,383213
1,910337
711193
31488
1,640324
1,055251
1,952208
839182
1,554161
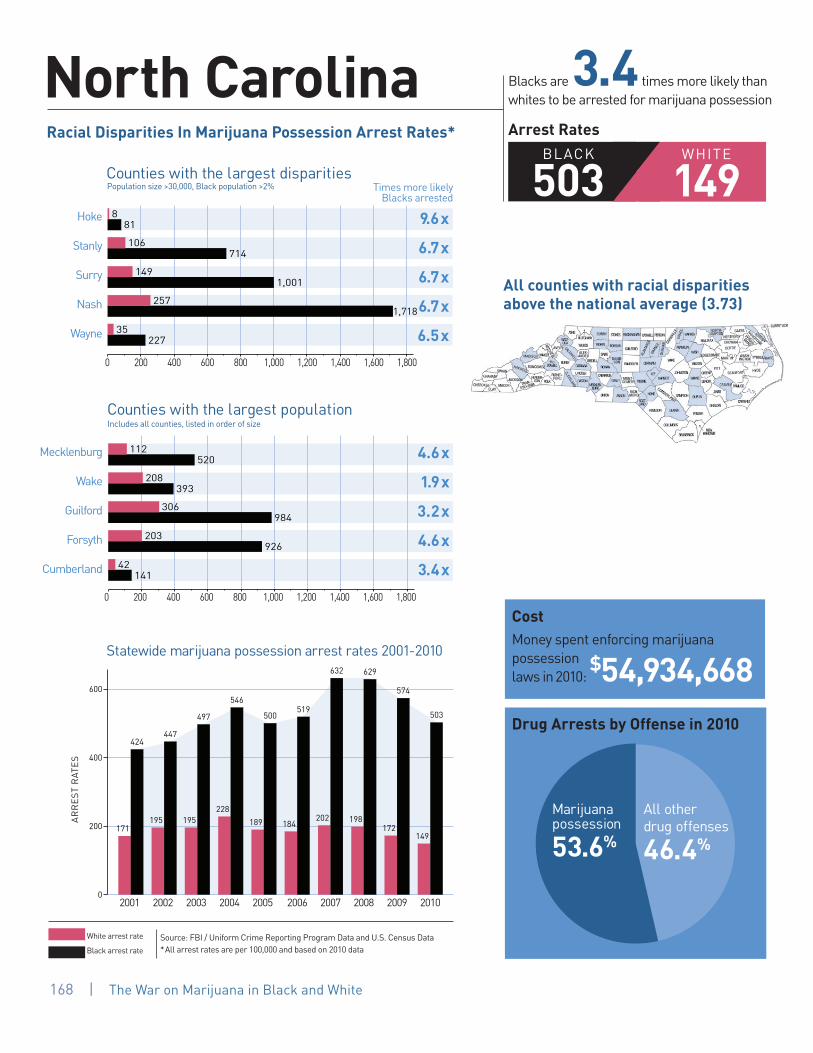
Appendix B | 169
Hoke
Stanly
Surry
Nash
Wayne
9.6x
6.7x
6.7x
6.7x
6.5x
Mecklenburg
Wake
Guilford
Forsyth
Cumberland
4.6x
1.9x
3.2x
4.6x
3.4x
2001 2002 2003 2004 2005 2006 2007 2008 2009 2010
Times more likely Blacks arrested
White arrest rate
Black arrest rate
BLACK
503WHITE
149
Cost
Money spent enforcing marijuana possession laws in 2010 :
$54,934,668Drug Arrests by Offense in 2010
North Carolina Blacks are 3.4 times more likely than whites to be arrested for marijuana possession
Arrest Rates
171
424
195
447
195
497
228
546
189
500
184
519
202
632
198
629
172
574
149
503
0
200
400
600
Marijuana possession
53.6%
All other drug offenses
46.4%
22735
1,718257
1,001149
714106
818
0 200 400 600 800 1,000 1,200 1,400 1,600 1,800
14142
926203
984306
393208
520112
0 200 400 600 800 1,000 1,200 1,400 1,600 1,800
0 200 400 600 800 1,000 1,200 1,400 1,600 1,800
0 200 400 600 800 1,000 1,200 1,400 1,600 1,800
Population size >30,000, Black population >2%
Includes all counties, listed in order of size
Counties with the largest disparities
Counties with the largest population
Racial Disparities In Marijuana Possession Arrest Rates*
Source: FBI / Uniform Crime Reporting Program Data and U.S. Census Data*All arrest rates are per 100,000 and based on 2010 data
AR
RE
ST
RAT
ES
All counties with racial disparities above the national average (3.73)
168 | The War on Marijuana in Black and White
Statewide marijuana possession arrest rates 2001-2010
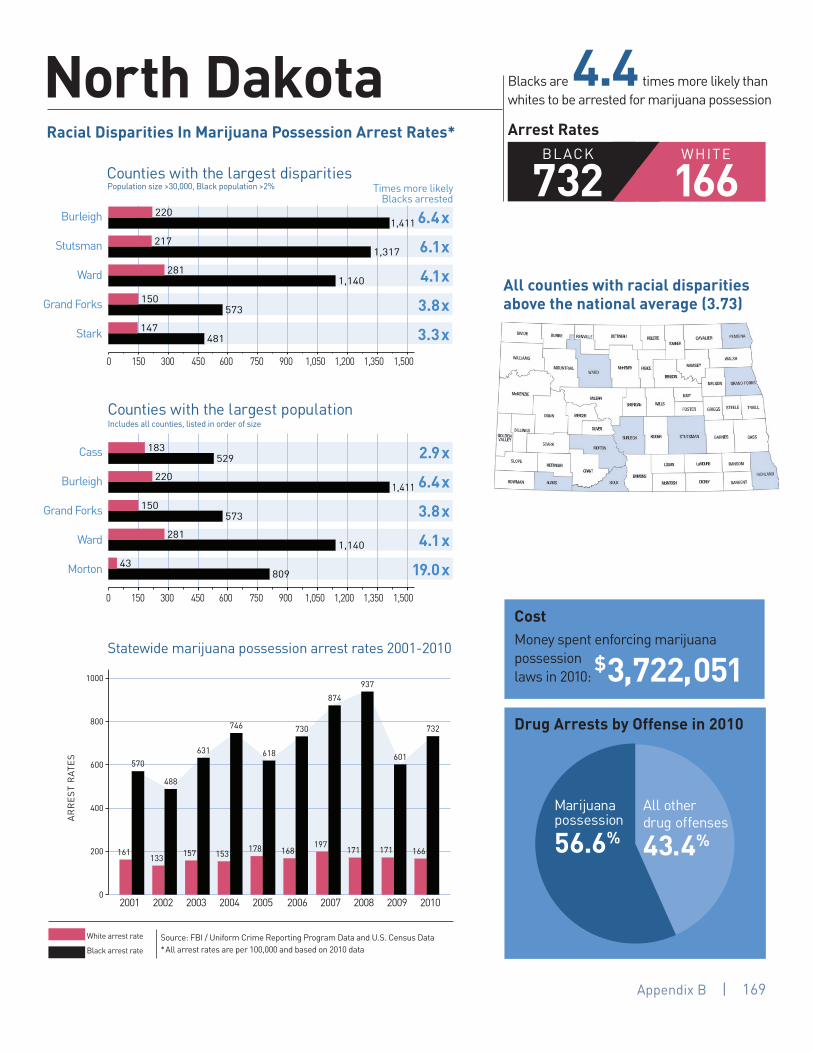
Appendix B | 169
Burleigh
Stutsman
Ward
Grand Forks
Stark
6.4x
6.1x
4.1x
3.8x
3.3x
Cass
Burleigh
Grand Forks
Ward
Morton
2.9x
6.4x
3.8x
4.1x
19.0x
2001 2002 2003 2004 2005 2006 2007 2008 2009 2010
Statewide marijuana possession arrest rates 2001-2010
Times more likely Blacks arrested
White arrest rate
Black arrest rate
BLACK
732WHITE
166
Cost
Money spent enforcing marijuana possession laws in 2010:
$3,722,051Drug Arrests by Offense in 2010
North Dakota Blacks are 4.4 times more likely than whites to be arrested for marijuana possession
Arrest Rates
161
570
133
488
157
631
153
746
178
618
168
730
197
874
171
937
171
601
166
732
0
200
400
600
800
1000
Marijuana possession
56.6%
All other drug offenses
43.4%
481147
573150
1,140281
1,317217
1,411220
80943
1,140281
573150
1,411220
529183
0 150 300 450 600 750 900 1,050 1,200 1,350 1,500
0 150 300 450 600 750 900 1,050 1,200 1,350 1,500
Population size >30,000, Black population >2%
Includes all counties, listed in order of size
Counties with the largest disparities
Counties with the largest population
Source: FBI / Uniform Crime Reporting Program Data and U.S. Census Data*All arrest rates are per 100,000 and based on 2010 data
AR
RE
ST
RAT
ES
Racial Disparities In Marijuana Possession Arrest Rates*
All counties with racial disparities above the national average (3.73)

Appendix B | 171
White arrest rate
Black arrest rate
BLACK
512WHITE
125
Cost
Money spent enforcing marijuana possession laws in 2010 :
$120,148,064Drug Arrests by Offense in 2010
Blacks are 4.1 times more likely than whites to be arrested for marijuana possession
Arrest Rates
Ohio
Columbiana
Allen
Stark
Scioto
Portage
13.8x
13.2x
7.4x
7.0x
7.0x
Cuyahoga
Franklin
Hamilton
Summit
Montgomery
6.2x
1.6x
2.5x
6.8x
1.7x
2001 2002 2003 2004 2005 2006 2007 2008 2009 2010
Times more likely Blacks arrested
155
293
121
262
156
362
150
433
157
464
146
465
152
514
138
560
134
540
125
512
0
200
400
600
824118
837113
1,370104
16112
0 150 300 450 600 750 900 1,050 1,200 1,350
13882
1,039152
689272
369234
56091
0 150 300 450 600 750 900 1,050 1,200 1,350
0 150 300 450 600 750 900 1,050 1,200 1,350
0 150 300 450 600 750 900 1,050 1,200 1,350
Marijuana possession
48.2%
All other drug offenses
51.8%
Population size >30,000, Black population >2%
Includes all counties, listed in order of size
Counties with the largest disparities
Counties with the largest population
Racial Disparities In Marijuana Possession Arrest Rates*
Source: FBI / Uniform Crime Reporting Program Data and U.S. Census Data*All arrest rates are per 100,000 and based on 2010 data
AR
RE
ST
RAT
ES
All counties with racial disparities above the national average (3.73)
18527
170 | The War on Marijuana in Black and White
Statewide marijuana possession arrest rates 2001-2010

Appendix B | 171
Kay
Creek
Pontotoc
Garfield
Stephens
8.0x
5.7x
5.3x
5.2x
4.9x
Oklahoma
Tulsa
Cleveland
Comanche
Canadian
2.7x
2.4x
3.3x
4.2x
4.4x
2001 2002 2003 2004 2005 2006 2007 2008 2009 2010
Statewide marijuana possession arrest rates 2001-2010
White arrest rate
Black arrest rate
BLACK
763WHITE
268
Cost
Money spent enforcing marijuana possession laws in 2010 :
$30,829,904Drug Arrests by Offense in 2010
Oklahoma Blacks are 2.8 times more likely than whites to be arrested for marijuana possession
Arrest Rates
299
654
288
622
321
650
310
701
291
736
294
836
304
886
286
881
291
825
268
763
0
200
400
600
800
Marijuana possession
52.4%
All other drug offenses
47.6%
663134
1,278245
2,078394
1,286225
2,205275
0 250 500 750 1,000 1,250 1,500 1,750 2,000 2,250
1,128258
983235
1,518457
480199
724270
0 250 500 750 1,000 1,250 1,500 1,750 2,000 2,250 0 250 500 750 1,000 1,250 1,500 1,750 2,000 2,250
0 250 500 750 1,000 1,250 1,500 1,750 2,000 2,250
Population size >30,000, Black population >2%
Includes all counties, listed in order of size
Counties with the largest disparities
Counties with the largest population
Source: FBI / Uniform Crime Reporting Program Data and U.S. Census Data*All arrest rates are per 100,000 and based on 2010 data
AR
RE
ST
RAT
ES
Racial Disparities In Marijuana Possession Arrest Rates*
All counties with racial disparities above the national average (3.73)
Times more likely Blacks arrested

Appendix B | 173
Lane
Multnomah
Washington
Marion
Benton
3.5x
3.3x
2.8x
2.8x
1.9x
Multnomah
Washington
Clackamas
Lane
Marion
3.3x
2.8x
2.0x
3.5x
2.8x
2001 2002 2003 2004 2005 2006 2007 2008 2009 2010
Times more likely Blacks arrested
White arrest rate
Black arrest rate
BLACK
563WHITE
271
Cost
Money spent enforcing marijuana possession laws in 2010 :
$50,194,024Drug Arrests by Offense in 2010
Oregon Blacks are 2.1 times more likely than whites to be arrested for marijuana possession
Arrest Rates
183
418
171
296
188
247
199
539
208
483
222
502
245
497
245
548
247
533
271
563
0
200
400
600
Marijuana possession
54.6%
All other drug offenses
45.4%
614329
736266
434155
396119
1,932557
0 200 400 600 800 1,000 1,200 1,400 1,600 1,800 2,000
736266
1,932557
14673
434155
396119
0 200 400 600 800 1,000 1,200 1,400 1,600 1,800 2,000
0 200 400 600 800 1,000 1,200 1,400 1,600 1,800 2,000
0 200 400 600 800 1,000 1,200 1,400 1,600 1,800 2,000
Population size >30,000, Black population >2%
Includes all counties, listed in order of size
Counties with the largest disparities
Counties with the largest population
Racial Disparities In Marijuana Possession Arrest Rates*
Source: FBI / Uniform Crime Reporting Program Data and U.S. Census Data*All arrest rates are per 100,000 and based on 2010 data
AR
RE
ST
RAT
ES
All counties with racial disparities above the national average (3.73)
172 | The War on Marijuana in Black and White
Statewide marijuana possession arrest rates 2001-2010

Appendix B | 173
Lawrence
Lycoming
Somerset
Westmoreland
Washington
11.2x
10.0x
9.4x
8.9x
8.6x
Philadelphia
Allegheny
Montgomery
Bucks
Delaware
4.9x
5.7x
4.2x
4.1x
3.3x
2001 2002 2003 2004 2005 2006 2007 2008 2009 2010
Statewide marijuana possession arrest rates 2001-2010
Times more likely Blacks arrested
White arrest rate
Black arrest rate
BLACK
606WHITE
117
Cost
Money spent enforcing marijuana possession laws in 2010 :
$100,748,528Drug Arrests by Offense in 2010
Pennsylvania Blacks are 5.2 times more likely than whites to be arrested for marijuana possession
Arrest Rates
108
404
107
408
105
392
110
471
107
483
111
541
116
606
119
673
115
603
117
606
0
200
400
600
800
Marijuana possession
37.3%All other drug offenses
62.7%
903105
53560
34537
1,098110
85877
0 150 300 450 600 750 900 1,050
434131
549135
448106
730128
672137
0 150 300 450 600 750 900 1,050 0 150 300 450 600 750 900 1,050
0 150 300 450 600 750 900 1,050
Population size >30,000, Black population >2%
Includes all counties, listed in order of size
Counties with the largest disparities
Counties with the largest population
Source: FBI / Uniform Crime Reporting Program Data and U.S. Census Data*All arrest rates are per 100,000 and based on 2010 data
AR
RE
ST
RAT
ES
Racial Disparities In Marijuana Possession Arrest Rates*
All counties with racial disparities above the national average (3.73)
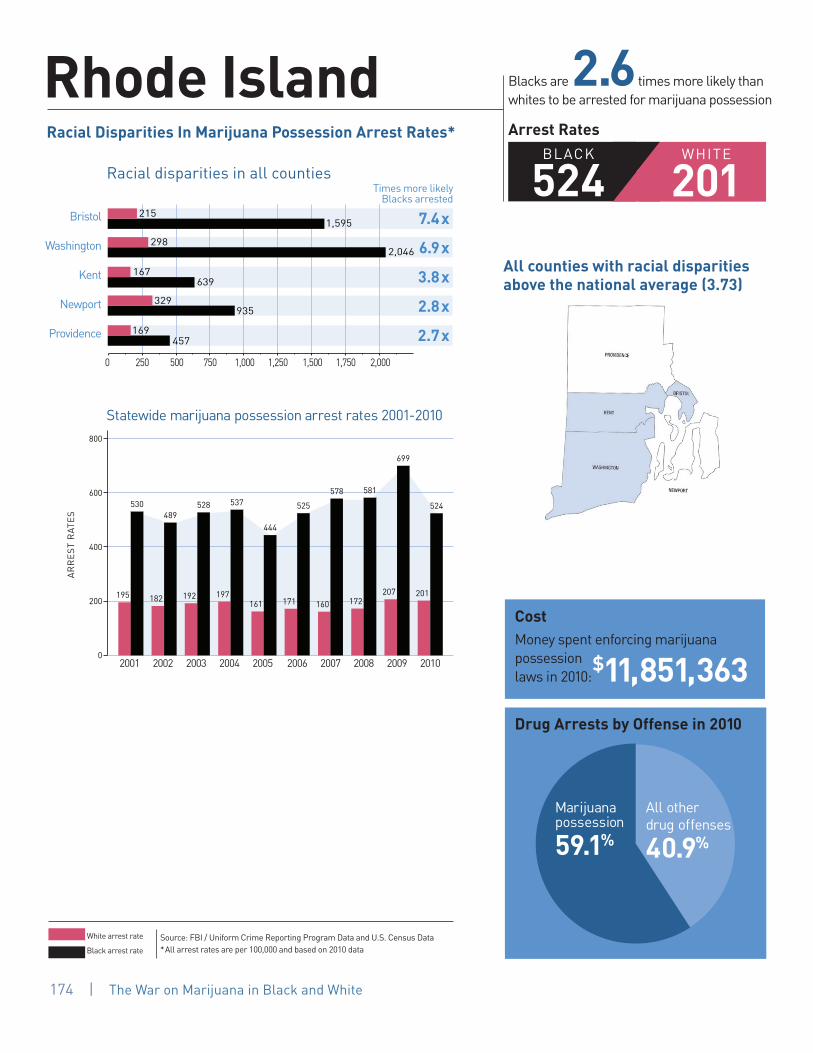
Appendix B | 175
Racial disparities in all counties
Bristol
Washington
Kent
Newport
Providence
7.4x
6.9x
3.8x
2.8x
2.7x
2001 2002 2003 2004 2005 2006 2007 2008 2009 2010
Times more likely Blacks arrested
White arrest rate
Black arrest rate
BLACK
524WHITE
201
Cost
Money spent enforcing marijuana possession laws in 2010 :
$11,851,363Drug Arrests by Offense in 2010
Rhode Island Blacks are 2.6 times more likely than whites to be arrested for marijuana possession
Arrest Rates
195
530
182
489
192
528
197
537
161
444
171
525
160
578
172
581
207
699
201
524
0
200
400
600
800
Marijuana possession
59.1%
All other drug offenses
40.9%
1,595215
935329
2,046298
639167
457169
0 250 500 750 1,000 1,250 1,500 1,750 2,000
All counties with racial disparities above the national average (3.73)
Racial Disparities In Marijuana Possession Arrest Rates*
AR
RE
ST
RAT
ES
174 | The War on Marijuana in Black and White
Statewide marijuana possession arrest rates 2001-2010
Source: FBI / Uniform Crime Reporting Program Data and U.S. Census Data*All arrest rates are per 100,000 and based on 2010 data
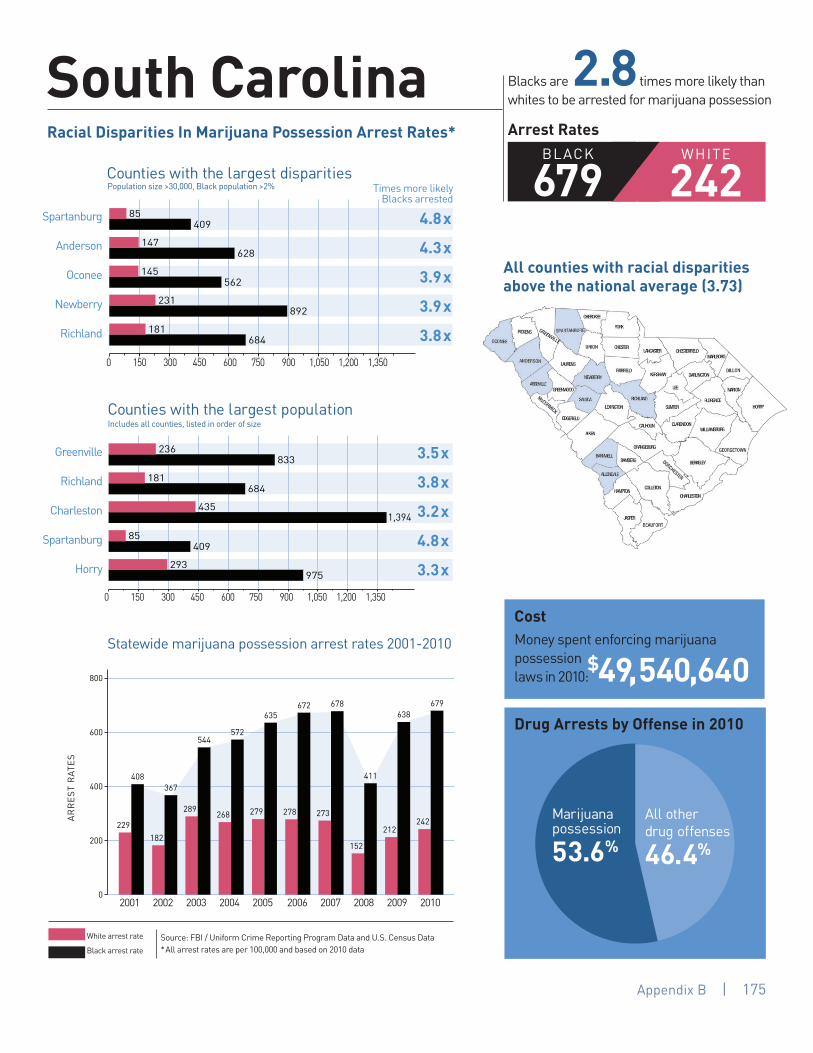
Appendix B | 175
Spartanburg
Anderson
Oconee
Newberry
Richland
4.8x
4.3x
3.9x
3.9x
3.8x
Greenville
Richland
Charleston
Spartanburg
Horry
3.5x
3.8x
3.2x
4.8x
3.3x
2001 2002 2003 2004 2005 2006 2007 2008 2009 2010
Statewide marijuana possession arrest rates 2001-2010
Times more likely Blacks arrested
White arrest rate
Black arrest rate
BLACK
679WHITE
242
Cost
Money spent enforcing marijuana possession laws in 2010 :
$49,540,640Drug Arrests by Offense in 2010
South Carolina Blacks are 2.8 times more likely than whites to be arrested for marijuana possession
Arrest Rates
229
408
182
367
289
544
268
572
279
635
278
672
273
678
152
411
212
638
242
679
0
200
400
600
800
Marijuana possession
53.6%
All other drug offenses
46.4%
684181
892231
562145
628147
40985
0 150 300 450 600 750 900 1,050 1,200 1,350
975293
40985
1,394435
684181
833236
0 150 300 450 600 750 900 1,050 1,200 1,350 0 150 300 450 600 750 900 1,050 1,200 1,350
0 150 300 450 600 750 900 1,050 1,200 1,350
Population size >30,000, Black population >2%
Includes all counties, listed in order of size
Counties with the largest disparities
Counties with the largest population
Source: FBI / Uniform Crime Reporting Program Data and U.S. Census Data*All arrest rates are per 100,000 and based on 2010 data
AR
RE
ST
RAT
ES
Racial Disparities In Marijuana Possession Arrest Rates*
All counties with racial disparities above the national average (3.73)

Appendix B | 177
Pennington
Brookings
Minnehaha
Yankton
Brown
6.1x
5.5x
3.7x
3.5x
3.5x
Minnehaha
Pennington
Brown
Brookings
Codington
3.7x
6.1x
3.5x
5.5x
6.8x
2001 2002 2003 2004 2005 2006 2007 2008 2009 2010
Times more likely Blacks arrested
White arrest rate
Black arrest rate
BLACK
943WHITE
197
Cost
Money spent enforcing marijuana possession laws in 2010:
$5,551,929Drug Arrests by Offense in 2010
South Dakota Blacks are 4.8 times more likely than whites to be arrested for marijuana possession
Arrest Rates
284
1,502
267
1,280
268
1,323
248
1,472
111
514
151
888
150
677
205
1,071
225
1,256
197
943
0
500
1000
1500
Marijuana possession
50.0%
All other drug offenses
50.0%
538155
28281
893244
1,079196
1,308214
0 250 500 750 1,000 1,250 1,500 1,750 2,000
2,040299
1,079196
538155
1,308214
893244
0 250 500 750 1,000 1,250 1,500 1,750 2,000
0 250 500 750 1,000 1,250 1,500 1,750 2,000
0 250 500 750 1,000 1,250 1,500 1,750 2,000
Population size >30,000, Black population >2%
Includes all counties, listed in order of size
Counties with the largest disparities
Counties with the largest population
Racial Disparities In Marijuana Possession Arrest Rates*
Source: FBI / Uniform Crime Reporting Program Data and U.S. Census Data*All arrest rates are per 100,000 and based on 2010 data
AR
RE
ST
RAT
ES
All counties with racial disparities above the national average (3.73)
176 | The War on Marijuana in Black and White
Statewide marijuana possession arrest rates 2001-2010

Appendix B | 177
Monroe
Obion
Knox
Anderson
Blount
10.1x
6.9x
6.2x
6.0x
5.4x
Shelby
Davidson
Knox
Hamilton
Rutherford
4.2x
3.8x
6.2x
2.7x
3.6x
2001 2002 2003 2004 2005 2006 2007 2008 2009 2010
Statewide marijuana possession arrest rates 2001-2010
Times more likely Blacks arrested
White arrest rate
Black arrest rate
BLACK
771WHITE
191
Cost
Money spent enforcing marijuana possession laws in 2010 :
$42,948,820Drug Arrests by Offense in 2010
Tennessee Blacks are 4.0 times more likely than whites to be arrested for marijuana possession
Arrest Rates
188
342
174
334
216
446
221
475
225
551
209
562
237
698
210
659
204
705
191
771
0
200
400
600
800
Marijuana possession
42.2%
All other drug offenses
57.8%
1,002186
986163
1,085176
991143
50150
0 150 300 450 600 750 900 1,050 1,200 1,350
921254
561207
1,085176
1,284334
679162
0 150 300 450 600 750 900 1,050 1,200 1,350 0 150 300 450 600 750 900 1,050 1,200 1,350
0 150 300 450 600 750 900 1,050 1,200 1,350
Population size >30,000, Black population >2%
Includes all counties, listed in order of size
Counties with the largest disparities
Counties with the largest population
Source: FBI / Uniform Crime Reporting Program Data and U.S. Census Data*All arrest rates are per 100,000 and based on 2010 data
AR
RE
ST
RAT
ES
Racial Disparities In Marijuana Possession Arrest Rates*
All counties with racial disparities above the national average (3.73)
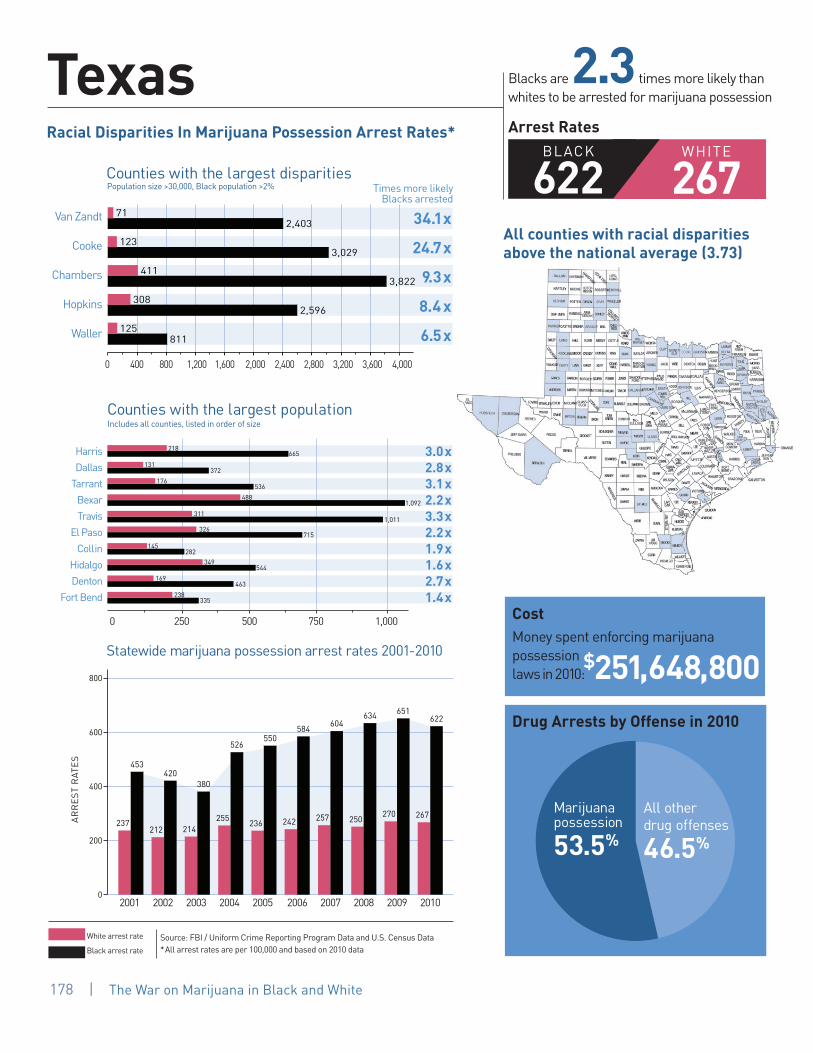
Appendix B | 179
Van Zandt
Cooke
Chambers
Hopkins
Waller
34.1x
24.7x
9.3x
8.4 x
6.5x
Harris
Dallas
Tarrant
Bexar
Travis
El Paso
Collin
Hidalgo
Denton
Fort Bend
3.0x2.8x3.1x2.2x3.3x2.2x1.9x1.6x2.7x1.4x
2001 2002 2003 2004 2005 2006 2007 2008 2009 2010
Times more likely Blacks arrested
White arrest rate
Black arrest rate
BLACK
622WHITE
267
Cost
Money spent enforcing marijuana possession laws in 2010 :
$251,648,800Drug Arrests by Offense in 2010
Texas Blacks are 2.3 times more likely than whites to be arrested for marijuana possession
Arrest Rates
237
453
212
420
214
380
255
526
236
550
242
584
257
604
250
634
270
651
267
622
0
200
400
600
800
Marijuana possession
53.5%
All other drug offenses
46.5%
811125
2,596308
3,822411
3,029123
2,40371
0 400 800 1,200 1,600 2,000 2,400 2,800 3,200 3,600 4,000
0 250 500 750 1,000
335238
463169
544349
282145
715326
1,011311
1,092488
536176
372131
665218
Population size >30,000, Black population >2%
Includes all counties, listed in order of size
Counties with the largest disparities
Counties with the largest population
Racial Disparities In Marijuana Possession Arrest Rates*
Source: FBI / Uniform Crime Reporting Program Data and U.S. Census Data*All arrest rates are per 100,000 and based on 2010 data
AR
RE
ST
RAT
ES
All counties with racial disparities above the national average (3.73)
178 | The War on Marijuana in Black and White
Statewide marijuana possession arrest rates 2001-2010

Appendix B | 179
Iron
Utah
Tooele
Weber
Washington
8.4x
7.9x
7.8x
6.1x
5.2x
Salt Lake
Utah
Davis
Weber
Washington
2.6x
7.9x
2.6x
6.1x
5.2x
2001 2002 2003 2004 2005 2006 2007 2008 2009 2010
Statewide marijuana possession arrest rates 2001-2010
Times more likely Blacks arrested
White arrest rate
Black arrest rate
BLACK
557WHITE
146
Cost
Money spent enforcing marijuana possession laws in 2010 :
$14,070,766Drug Arrests by Offense in 2010
Utah Blacks are 3.8 times more likely than whites to be arrested for marijuana possession
Arrest Rates
5,507
198
506
183
517
167
378
170
410
142
380
153
414
150
411
153
379
156
489
146
557
0
200
400
600
Marijuana possession
35.8%All other drug offenses
64.2%
41379
661108
904116
1,331168
5,507656
41379
661108
346136
1,331168
360140
0 600 1,200 1,800 2,400 3,000 3,600 4,200 4,800 5,400
0 600 1,200 1,800 2,400 3,000 3,600 4,200 4,800 5,400
Population size >30,000, Black population >2%
Includes all counties, listed in order of size
Counties with the largest disparities
Counties with the largest population
Source: FBI / Uniform Crime Reporting Program Data and U.S. Census Data*All arrest rates are per 100,000 and based on 2010 data
AR
RE
ST
RAT
ES
Racial Disparities In Marijuana Possession Arrest Rates*
All counties with racial disparities above the national average (3.73)

Appendix B | 181
Rutland
Windham
Windsor
Caledonia
Chittenden
16.8x
9.6x
6.8x
4.7x
3.8x
Chittenden
Rutland
Washington
Windsor
Franklin
3.8x
16.8x
0x
6.8x
0x
2001 2002 2003 2004 2005 2006 2007 2008 2009 2010
Times more likely Blacks arrested
White arrest rate
Black arrest rate
BLACK
514WHITE
118
Cost
Money spent enforcing marijuana possession laws in 2010:
$4,887,939Drug Arrests by Offense in 2010
Vermont Blacks are 4.4 times more likely than whites to be arrested for marijuana possession
Arrest Rates
111
316
115
302
119
574
134
724
132
437
158
718
134
568
130
491
134
529
118
514
0
200
400
600
800
Marijuana possession
53.3%
All other drug offenses
46.7%
29678
584124
928136
1,815190
1,962117
0 200 400 600 800 1,000 1,200 1,400 1,600 1,800 2,000
090
928136
099
1,962117
29678
0 200 400 600 800 1,000 1,200 1,400 1,600 1,800 2,000
0 200 400 600 800 1,000 1,200 1,400 1,600 1,800 2,000
0 200 400 600 800 1,000 1,200 1,400 1,600 1,800 2,000
Population size >30,000, Black population >2%
Includes all counties, listed in order of size
Counties with the largest disparities
Counties with the largest population
Racial Disparities In Marijuana Possession Arrest Rates*
Source: FBI / Uniform Crime Reporting Program Data and U.S. Census Data*All arrest rates are per 100,000 and based on 2010 data
AR
RE
ST
RAT
ES
All counties with racial disparities above the national average (3.73)
180 | The War on Marijuana in Black and White
Statewide marijuana possession arrest rates 2001-2010
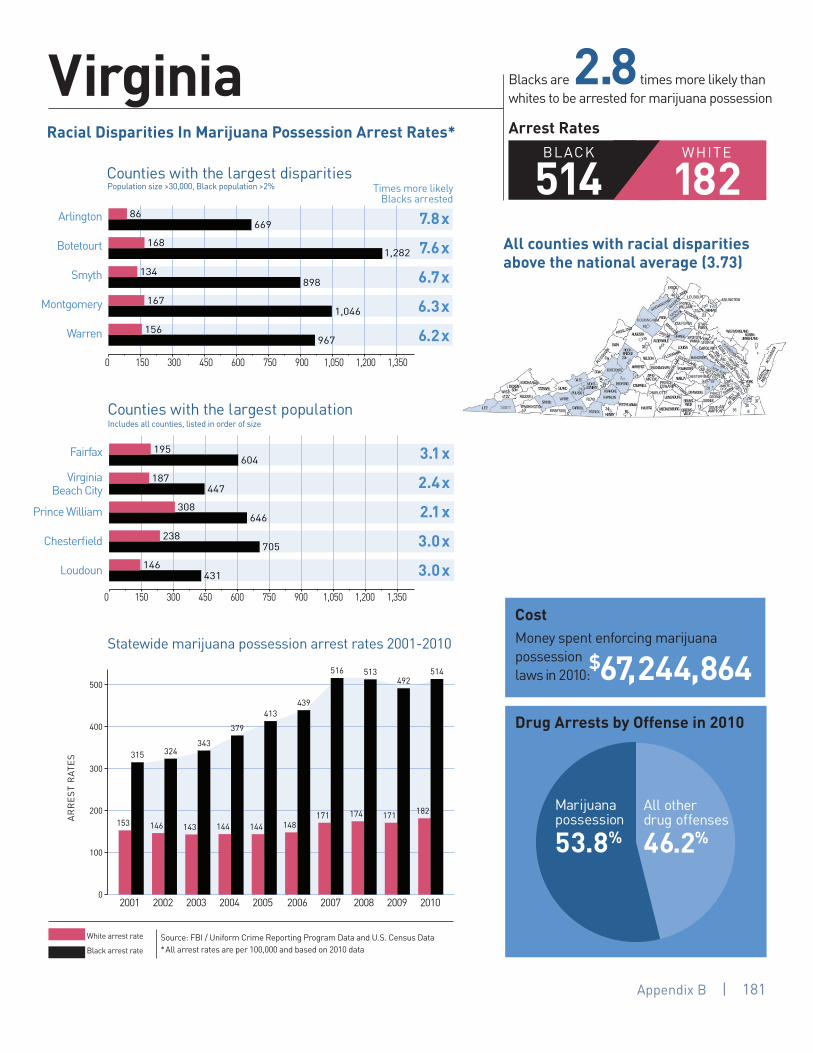
Appendix B | 181
Arlington
Botetourt
Smyth
Montgomery
Warren
7.8x
7.6x
6.7x
6.3x
6.2x
Fairfax
Virginia Beach City
Prince William
Chesterfield
Loudoun
3.1x
2.4x
2.1x
3.0x
3.0x
2001 2002 2003 2004 2005 2006 2007 2008 2009 2010
Statewide marijuana possession arrest rates 2001-2010
Times more likely Blacks arrested
White arrest rate
Black arrest rate
BLACK
514WHITE
182
Cost
Money spent enforcing marijuana possession laws in 2010 :
$67,244,864Drug Arrests by Offense in 2010
Virginia Blacks are 2.8 times more likely than whites to be arrested for marijuana possession
Arrest Rates
153
315
146
324
143
343
144
379
144
413
148
439
171
516
174
513
171
492
182
514
0
100
200
300
400
500
Marijuana possession
53.8%
All other drug offenses
46.2%
967156
1,046167
898134
1,282168
66986
0 150 300 450 600 750 900 1,050 1,200 1,350
431146
705238
646308
447187
604195
0 150 300 450 600 750 900 1,050 1,200 1,3500 150 300 450 600 750 900 1,050 1,200 1,350
0 150 300 450 600 750 900 1,050 1,200 1,350
Population size >30,000, Black population >2%
Includes all counties, listed in order of size
Counties with the largest disparities
Counties with the largest population
Source: FBI / Uniform Crime Reporting Program Data and U.S. Census Data*All arrest rates are per 100,000 and based on 2010 data
AR
RE
ST
RAT
ES
Racial Disparities In Marijuana Possession Arrest Rates*
All counties with racial disparities above the national average (3.73)

Appendix B | 183
Pierce
Kitsap
Franklin
Island
Snohomish
4.2x
4.1x
2.8x
2.6x
2.3x
King
Pierce
Snohomish
Clark
Kitsap
2.3x
4.2x
2.3x
2.0x
4.1x
2001 2002 2003 2004 2005 2006 2007 2008 2009 2010
Statewide marijuana possession arrest rates 2001-2010
Times more likely Blacks arrested
White arrest rate
Black arrest rate
BLACK
353WHITE
128
Cost
Money spent enforcing marijuana possession laws in 2010 :
$34,626,312Drug Arrests by Offense in 2010
Washington Blacks are 2.8 times more likely than whites to be arrested for marijuana possession
Arrest Rates
180
348
158
339
165
307
125
237
122
305
144
337
180
512
178
465
141
391
128
353
0
100
200
300
400
500
Marijuana possession
33.7%All other drug offenses
66.3%
251110
22384
561199
37693
650154
0 100 200 300 400 500 600 700
37693
5627
251110
650154
21796
0 100 200 300 400 500 600 700
0 100 200 300 400 500 600 700
0 100 200 300 400 500 600 700
Population size >30,000, Black population >2%
Includes all counties, listed in order of size
Counties with the largest disparities
Counties with the largest population
Racial Disparities In Marijuana Possession Arrest Rates*
Source: FBI / Uniform Crime Reporting Program Data and U.S. Census Data*All arrest rates are per 100,000 and based on 2010 data
AR
RE
ST
RAT
ES
All counties with racial disparities above the national average (3.73)
182 | The War on Marijuana in Black and White

Appendix B | 183
Cabell
Hancock
Ohio
Mercer
Monongalia
7.3x
6.8x
5.6x
5.0x
4.4x
Kanawha
Berkeley
Monongalia
Cabell
Wood
3.2x
4.2x
4.4x
7.3x
8.8x
2001 2002 2003 2004 2005 2006 2007 2008 2009 2010
Statewide marijuana possession arrest rates 2001-2010
Times more likely Blacks arrested
White arrest rate
Black arrest rate
BLACK
745WHITE
228
Cost
Money spent enforcing marijuana possession laws in 2010 :
$17,375,348Drug Arrests by Offense in 2010
West Virginia Blacks are 3.3 times more likely than whites to be arrested for marijuana possession
Arrest Rates
183
644
97
303
122
347
147
613
148
662
170
869
116
721
274
685
266
760
228
745
0
200
400
600
800
Marijuana possession
55.1%
All other drug offenses
44.9%
714164
725144
648115
689101
1,005138
0 150 300 450 600 750 900 1,050 1,200
1,027117
1,005138
714164
1,014239
1,123351
0 150 300 450 600 750 900 1,050 1,2000 150 300 450 600 750 900 1,050 1,200
0 150 300 450 600 750 900 1,050 1,200
Population size >30,000, Black population >2%
Includes all counties, listed in order of size
Counties with the largest disparities
Counties with the largest population
Source: FBI / Uniform Crime Reporting Program Data and U.S. Census Data*All arrest rates are per 100,000 and based on 2010 data
AR
RE
ST
RAT
ES
Racial Disparities In Marijuana Possession Arrest Rates*
All counties with racial disparities above the national average (3.73)

Appendix B | 185
Brown
Rock
Dane
Racine
Milwaukee
7.6x
6.6x
6.5x
4.8x
4.7x
Milwaukee
Dane
Waukesha
Brown
Racine
4.7x
6.5x
12.7x
7.6x
4.8x
2001 2002 2003 2004 2005 2006 2007 2008 2009 2010
Times more likely Blacks arrested
White arrest rate
Black arrest rate
WHITE
215BLACK
1,285
Cost
Money spent enforcing marijuana possession laws in 2010 :
$44,366,056Drug Arrests by Offense in 2010
Wisconsin Blacks are 6.0 times more likely than whites to be arrested for marijuana possession
Arrest Rates
142
727
252
597
245
472
255
537
228
679
233
970
220
1,116
214
1,104
214
1,209
215
1,285
0
500
1000
1500
Marijuana possession
60.9%
All other drug offenses
39.1%
1,201254
1,085226
1,848285
1,604244
1,310172
0 200 400 600 800 1,000 1,200 1,400 1,600 1,800
1,085226
1,310172
1,663131
1,848285
1,201254
0 200 400 600 800 1,000 1,200 1,400 1,600 1,800
0 200 400 600 800 1,000 1,200 1,400 1,600 1,800
0 200 400 600 800 1,000 1,200 1,400 1,600 1,800
Population size >30,000, Black population >2%
Includes all counties, listed in order of size
Counties with the largest disparities
Counties with the largest population
Racial Disparities In Marijuana Possession Arrest Rates*
Source: FBI / Uniform Crime Reporting Program Data and U.S. Census Data*All arrest rates are per 100,000 and based on 2010 data
AR
RE
ST
RAT
ES
All counties with racial disparities above the national average (3.73)
184 | The War on Marijuana in Black and White
Statewide marijuana possession arrest rates 2001-2010

Appendix B | 185
Natrona
Albany
Sweetwater
Laramie
3.9x
3.3x
3.0x
2.4x
Laramie
Natrona
Campbell
Sweetwater
Fremont
2.4x
3.9x
1.3x
3.0x
0x
2001 2002 2003 2004 2005 2006 2010
Statewide marijuana possession arrest rates 2001-2010
Times more likely Blacks arrested
White arrest rate
Black arrest rate
WHITE
376
Cost
Money spent enforcing marijuana possession laws in 2010:
$9,148,026Drug Arrests by Offense in 2010
Wyoming Blacks are 3.2 times more likely than whites to be arrested for marijuana possession
Arrest RatesBLACK
1,223
407
1,152
366
1,494
346
1,002
403
1,005
364
1,253
404
889
376
1,223
0
500
1000
1500
Marijuana possession
67.1%
All other drug offenses
32.9%
1,048441
1,427470
2,467752
1,913492
0 500 1,000 1,500 2,000 2,500
0132
1,427470
570454
1,913492
1,048441
0 500 1,000 1,500 2,000 2,5000 500 1,000 1,500 2,000 2,500
0 500 1,000 1,500 2,000 2,500
Population size >30,000, Black population >2%
Includes all counties, listed in order of size
Counties with the largest disparities
Counties with the largest population
Source: FBI / Uniform Crime Reporting Program Data and U.S. Census Data*All arrest rates are per 100,000 and based on 2010 data
AR
RE
ST
RAT
ES
Racial Disparities In Marijuana Possession Arrest Rates*
All counties with racial disparities above the national average (3.73)

Over the last twenty years, police have turned much of their zeal for fighting the failed War on Drugs towards the enforcement of marijuana laws in communities across the country – with disastrous consequences.
The aggressive enforcement of marijuana possession laws needlessly ensnares hundreds of thousands of people into the criminal justice system, crowds our jails, wastes billions of taxpayers’ dollars, fails to reduce marijuana use and availability, diverts precious police resources away from focusing on serious crimes, and is carried out in a racially biased manner.
It’s time to call off the failed War on Marijuana.
THE WAR ON MARIJUANAIN BLACK AND WHITE