the walt disney company reports third quarter and nine month earnings for fiscal 2014
DESCRIPTION
BURBANK, Calif.--(BUSINESS WIRE)--The Walt DisneyTRANSCRIPT

The Walt Disney Company Reports Third Quarter and NineMonth Earnings for Fiscal 2014
BURBANK, Calif.--(BUSINESS WIRE)--The Walt Disney Company (NYSE: DIS) today reported thirdquarter earnings, which are a record for any quarter. Diluted earnings per share (EPS) for the thirdquarter increased 27% to $1.28 from $1.01 in the prior-year quarter. Excluding certain itemsaffecting comparability(1), EPS for the quarter increased 24% to $1.28 from $1.03 in the prior-yearquarter. Diluted EPS for the nine months ended June 28, 2014 increased 30% to $3.40 compared to$2.61 in the prior-year period. Excluding certain items affecting comparability, EPS for the ninemonths increased 31% to $3.43.
"Our strategy of building strong brands and franchises continues to create great value across ourcompany," said Robert A. Iger, chairman and CEO of The Walt Disney Company. "This quarter wedelivered the highest EPS in the company's history, and we've now generated greater EPS in thefirst three quarters of FY 2014 than we have in any previous full fiscal year. We're extremely pleasedwith these results and we are also thrilled with the spectacular performance of Guardians of theGalaxy, which holds great promise as a new franchise for our company and once again reinforces thetremendous value of Marvel."
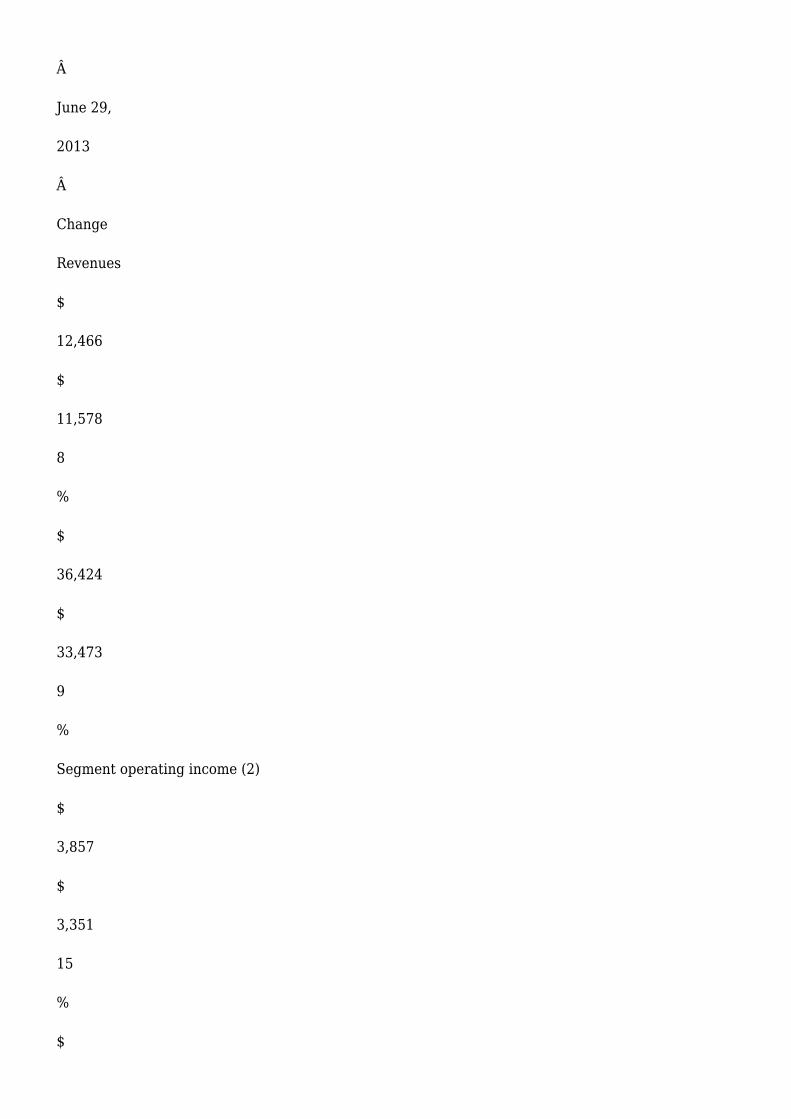
The following table summarizes the third quarter and nine-month results for fiscal 2014 and 2013 (inmillions, except per share amounts):
Â
Quarter Ended
Â
Nine Months Ended
June 28,
2014
Â
June 29,
2013
Â
Change
June 28,
2014
Â
June 29,
2013
Â
Change
Revenues
$
12,466
$
11,578
8
%
$
36,424
$
33,473
9
%
Segment operating income (2)
$
3,857
$
3,351
15
%
$

10,230
$
8,240
24
%
Net income (3)
$
2,245
$
1,847
22
%
$
6,002
$
4,742
27
%
Diluted EPS (3)
$
1.28
$
1.01
27
%
$

3.40
$
2.61
30
%
Cash provided by operations
$
2,936
$
3,413
(14
) %
$
6,675
$
6,717
(1
) %
Free cash flow (2)
$
2,047
$
2,723
(25
) %
$

4,427
$
4,908
(10
) %
Â
(1) See reconciliation of reported EPS to EPS excluding certain items affecting comparability onpage 8.
(2) Aggregate segment operating income and free cash flow are non-GAAP financial measures. Seethe discussion of non-GAAP financial measures that follows.
(3) Reflects amounts attributable to shareholders of The Walt Disney Company, i.e. after deductionof noncontrolling interests.
SEGMENT RESULTS
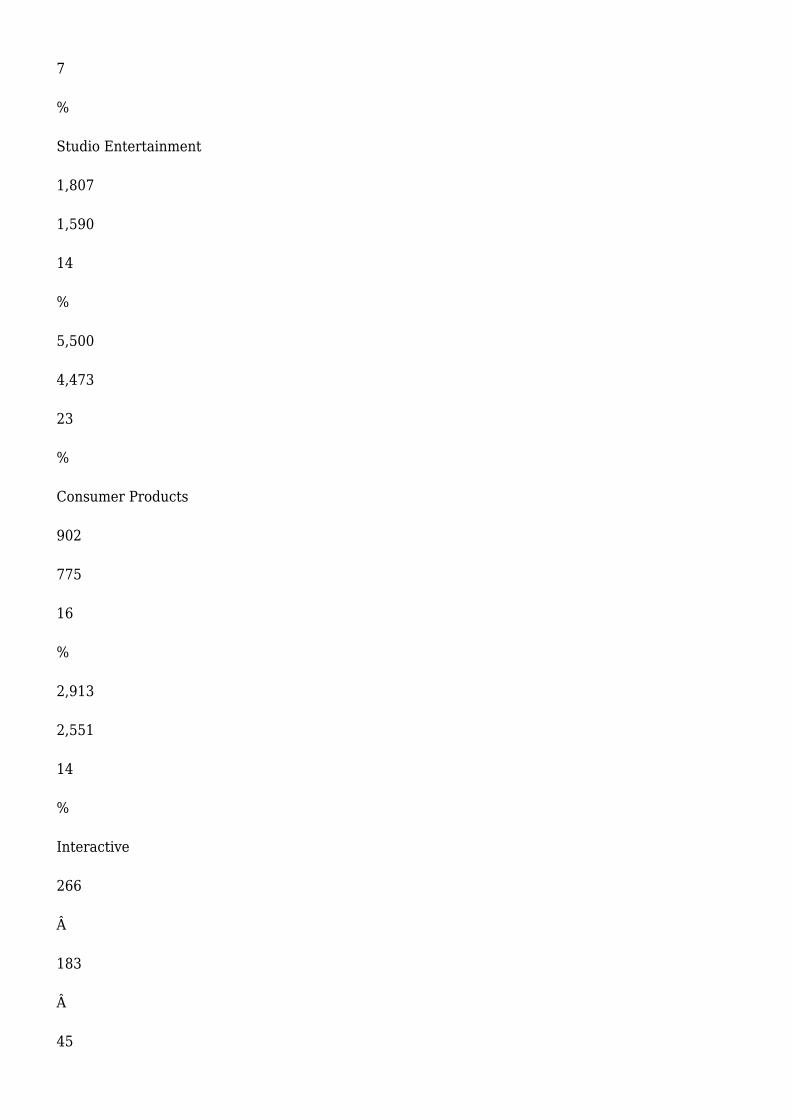
The following table summarizes the third quarter and nine-month segment operating results forfiscal 2014 and 2013 (in millions):
Â
Quarter Ended
Â
Â
Nine Months Ended
Â
June 28,
2014
Â
June 29,
2013
Change
June 28,

2014
Â
June 29,
2013
Change
Revenues:
Media Networks
$
5,511
$
5,352
3
%
$
15,935
$
15,410
3
%
Parks and Resorts
3,980
3,678
8
%
11,139
10,371
7
%
Studio Entertainment
1,807
1,590
14
%
5,500
4,473
23
%
Consumer Products
902
775
16
%
2,913
2,551
14
%
Interactive
266
Â
183
Â
45
%
937
Â
668
Â
40
%
$
12,466
Â
$
11,578
Â
8
%
$
36,424
Â
$
33,473
Â
9
%
Â
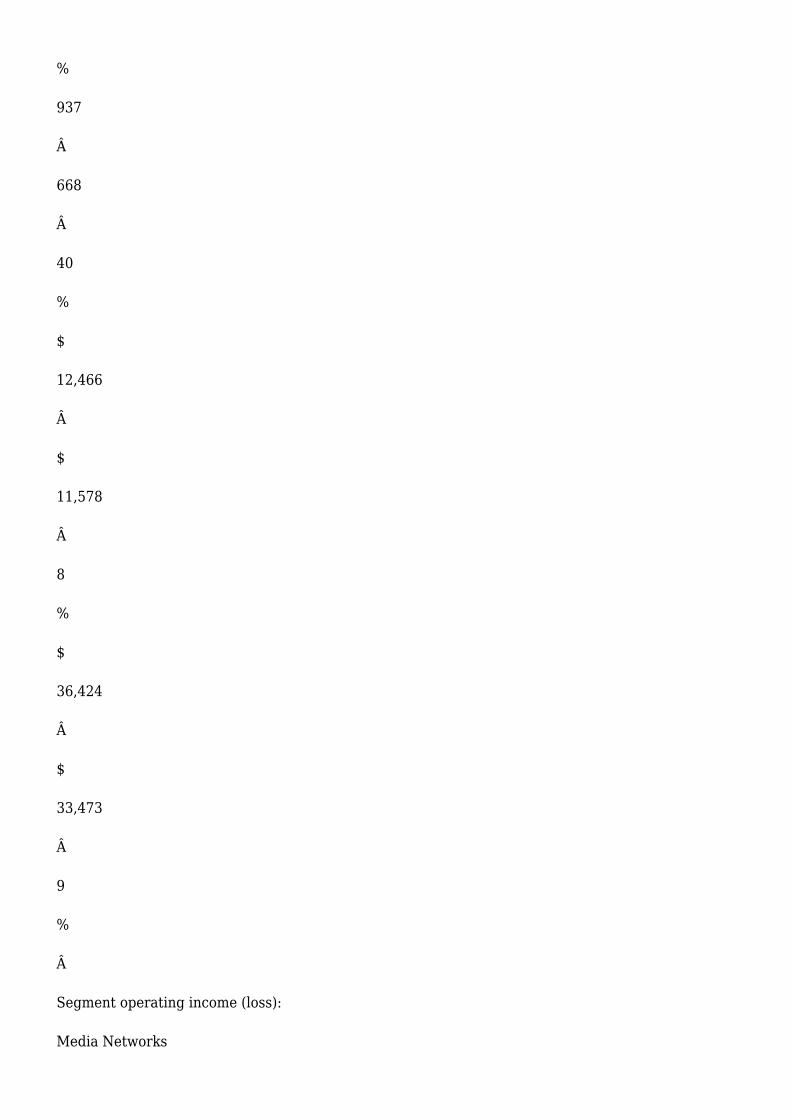
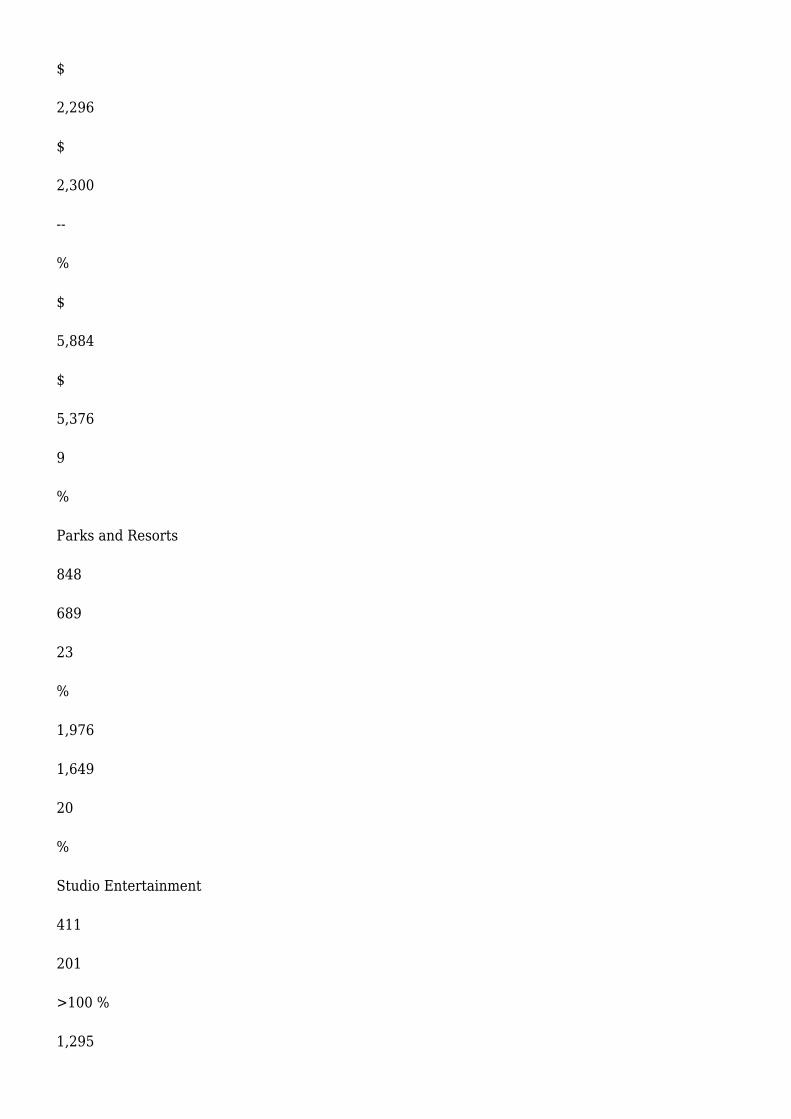
Segment operating income (loss):
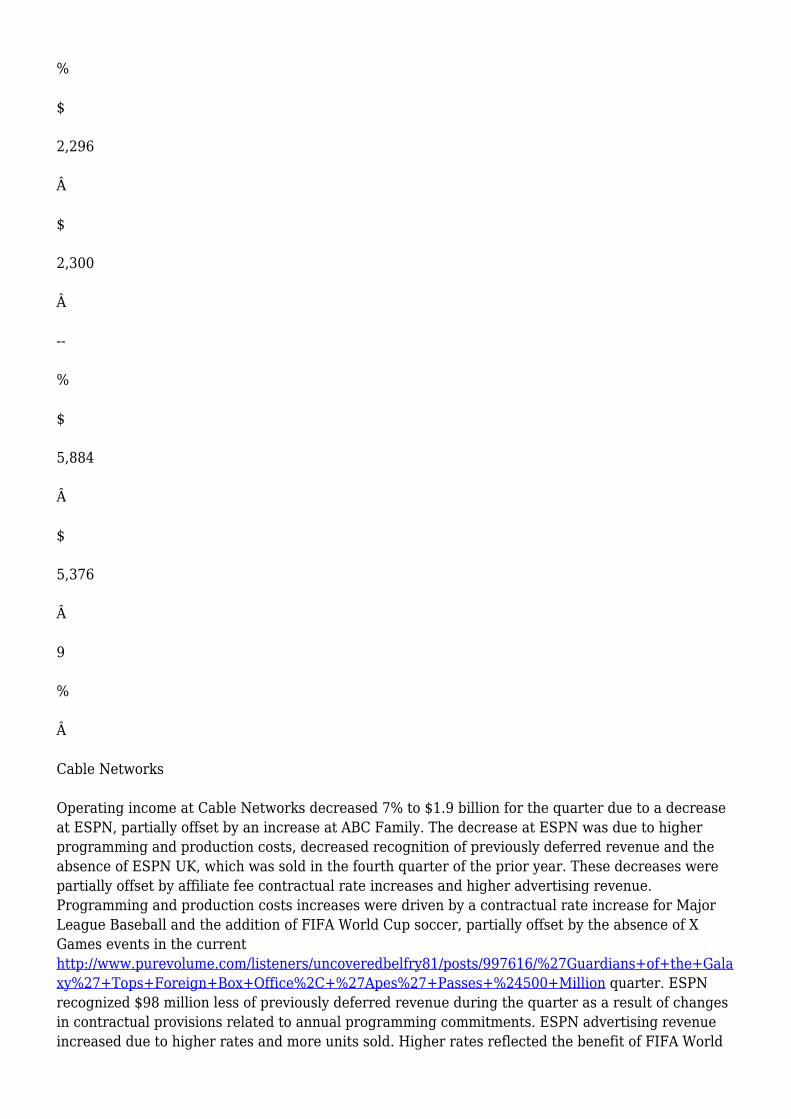
Media Networks
$
2,296
$
2,300
--
%
$
5,884
$
5,376
9
%
Parks and Resorts
848
689
23
%
1,976
1,649
20
%
Studio Entertainment
411
201
>100 %
1,295

553
>100 %
Consumer Products
273
219
25
%
977
765
28
%
Interactive
29
Â
(58
)
nm
98
Â
(103
)
nm
$
3,857
Â
$

3,351
Â
15
%
$
10,230
Â
$
8,240
Â
24
%
Â
Media Networks
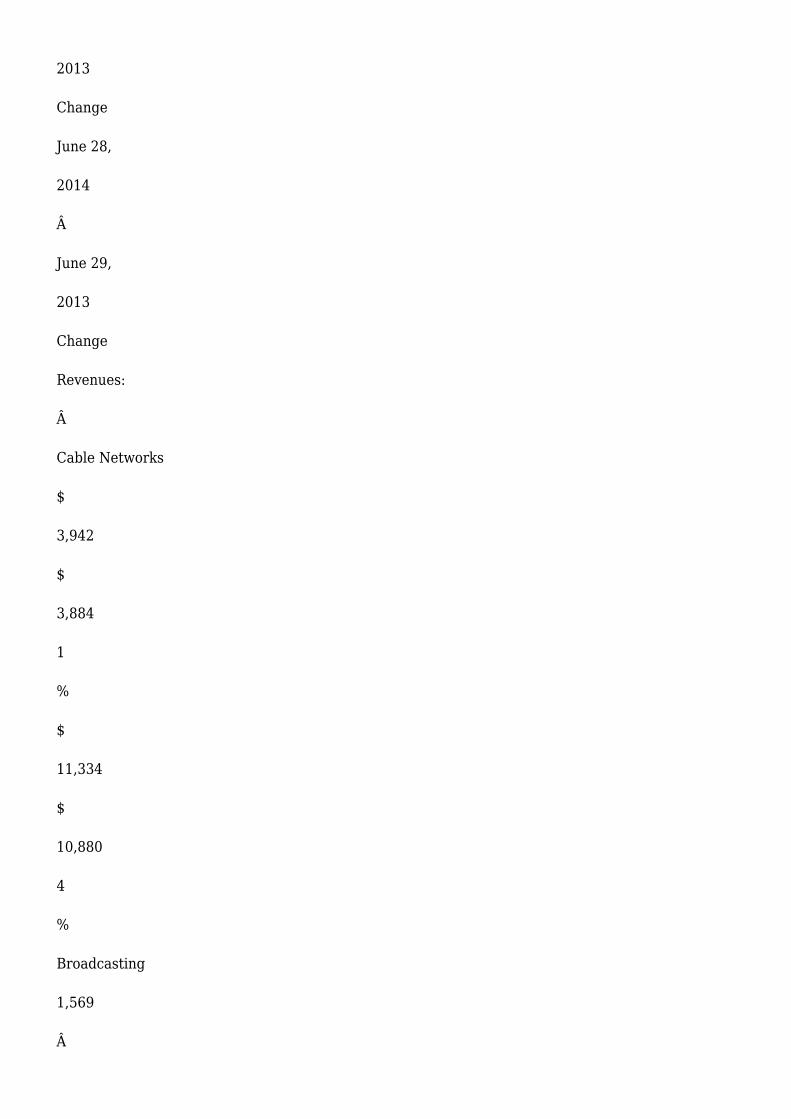
Media Networks revenues for the quarter increased 3% to $5.5 billion and segment operatingincome was relatively flat at $2.3 billion. The following table provides further detail of the MediaNetworks results (in millions):
Â
Quarter Ended
Â
Â
Nine Months Ended
Â
June 28,
2014
Â
June 29,
2013
Change
June 28,
2014
Â
June 29,
2013
Change
Revenues:
Â
Cable Networks
$
3,942
$
3,884
1
%
$
11,334
$
10,880
4
%
Broadcasting
1,569
Â

1,468
Â
7
%
4,601
Â
4,530
Â
2
%
$
5,511
Â
$
5,352
Â
3
%
$
15,935
Â
$
15,410
Â
3
%

Segment operating income:
Cable Networks
$
1,942
$
2,087
(7
) %
$
5,193
$
4,763
9
%
Broadcasting
354
Â
213
Â
66
%
691
Â
613
Â
13
%
$
2,296
Â
$
2,300
Â
--
%
$
5,884
Â
$
5,376
Â
9
%
Â
Cable Networks
Operating income at Cable Networks decreased 7% to $1.9 billion for the quarter due to a decreaseat ESPN, partially offset by an increase at ABC Family. The decrease at ESPN was due to higherprogramming and production costs, decreased recognition of previously deferred revenue and theabsence of ESPN UK, which was sold in the fourth quarter of the prior year. These decreases werepartially offset by affiliate fee contractual rate increases and higher advertising revenue.Programming and production costs increases were driven by a contractual rate increase for MajorLeague Baseball and the addition of FIFA World Cup soccer, partially offset by the absence of XGames events in the currenthttp://www.purevolume.com/listeners/uncoveredbelfry81/posts/997616/%27Guardians+of+the+Galaxy%27+Tops+Foreign+Box+Office%2C+%27Apes%27+Passes+%24500+Million quarter. ESPNrecognized $98 million less of previously deferred revenue during the quarter as a result of changesin contractual provisions related to annual programming commitments. ESPN advertising revenueincreased due to higher rates and more units sold. Higher rates reflected the benefit of FIFA World

Cup soccer in the current quarter, partially offset by two less NBA finals games this year. Theincrease at ABC Family was driven by lower programming costs, reflecting fewer hours of originalscripted programming due to the timing of premieres, and higher affiliate fees due to rate increases.
Broadcasting
Operating income at Broadcasting increased 66% to $354 million for the quarter due to an increasein affiliate fees and higher income from program sales. The increase in affiliate revenues was due tocontractual rate increases and new contractual provisions. Increased operating income fromprogram sales was driven by a lower average expense amortization rate and higher revenues led byMarvel's Agents of S.H.I.E.L.D.
Parks and Resorts
Parks and Resorts revenues for the quarter increased 8% to $4.0 billion and segment operatingincome increased 23% to $848 million. Operating income growth for the quarter was driven by anincrease at our domestic operations, partially offset by a decrease at Disneyland Paris. Parks andResorts results include a favorable impact due to a shift in the timing of the Easter holiday relativeto our fiscal periods.
Higher operating income at our domestic operations was due to increased guest spending andhigher attendance, partially offset by higher costs. Guest spending growth reflected higher averageticket prices for admissions at our theme parks and for sailings at our cruise line and increased food,beverage and merchandise spending. Higher costs were driven by MyMagic+ and labor and othercost inflation, partially offset by lower pension and postretirement medical costs.
The decrease in operating income at Disneyland Paris was due to higher operating costs, decreasedattendance and occupied room nights and lower special event revenue, partially offset by higheraverage ticket prices.
Studio Entertainment
Studio Entertainment revenues for the quarter increased 14% to $1.8 billion and segment operatingincome increased to $411 million from $201 million. Higher operating income was due to increasesin worldwide home entertainment and international theatrical distribution, partially offset by adecrease in domestic theatrical distribution.
The increase in worldwide home entertainment was driven by lower per unit costs, higher neteffective pricing and unit sales growth reflecting the success of Frozen.
Higher international theatrical distribution results reflected the performance of Frozen, CaptainAmerica 2: The Winter Soldier and Maleficent in the current quarter compared to Iron Man 3,Wreck-It-Ralph, Oz The Great and Powerful and Monsters University in the prior-year quarter.
Lower results in domestic theatrical distribution were due to the success of Iron Man 3 andMonsters University in the prior-year quarter compared to Captain America 2: The Winter Soldier,Maleficent and Million Dollar Arm in the current quarter.
Consumer Products
Consumer Products revenues for the quarter increased 16% to $902 million and segment operating

income increased 25% to $273 million. Higher operating income was due to increases at our Retailand Merchandise Licensing businesses.
At our Retail business, higher operating income for the quarter was driven by comparable storesales growth in all of our key markets.
The increase in operating income at Merchandise Licensing was due to the performance ofmerchandise based on Frozen, Disney Channel properties, Spider-Man and Planes partially offset bylower Monsters University revenue. Additionally, Merchandise Licensing results benefited fromlower acquisition accounting impacts, which reduced revenue recognition in the prior-year quarter.These increases were partially offset by higher third-party royalties.
Interactive
Interactive revenues for the quarter increased 45% to $266 million and segment operating resultsimproved from a loss of $58 million to income of $29 million. Improved results were due to stronggame sales growth, lower product development costs and higher licensing fees from our mobilephone business in Japan. The increase in game sales was driven by Disney Infinity, which wasreleased in the fourth quarter of the prior year, and the success of the Tsum Tsum and Frozen FreeFall mobile games. The decrease in product development costs was due to fewer titles indevelopment and the benefit of restructuring activities.
OTHER FINANCIAL INFORMATION
Corporate and Unallocated Shared Expenses
Corporate and unallocated shared expenses increased $22 million to $137 million primarily due tohigher incentive compensation costs, the timing of allocations to operating segments and highercharitable contributions.
Interest Income/(Expense), net
Interest income/(expense), net was as follows (in millions):
Â
Quarter Ended
Â
June 28,
2014
Â
June 29,
2013
Change

Interest expense
$
(74
)
$
(93
)
20
%
Interest and investment income
24
Â
10
Â
>100 %
Interest income/(expense), net
$
(50
)
$
(83
)
40
%
Â
The decrease in interest expense for the quarter was primarily due to lower effective interest rates,

partially offset by higher average debt balances. The increase in interest andhttp://subscriptions.marvel.com/ investment income for the quarter was primarily due to gains onsales of investments.
Income Taxes
The effective income tax rate was as follows:
Â
Quarter Ended
Â
June 28,
2014
Â
June 29,
2013
Change
Effective Income Tax Rate
34.1
%
34.2
%
0.1
Â
ppt
Â
Noncontrolling Interests
Â
Quarter Ended
Â
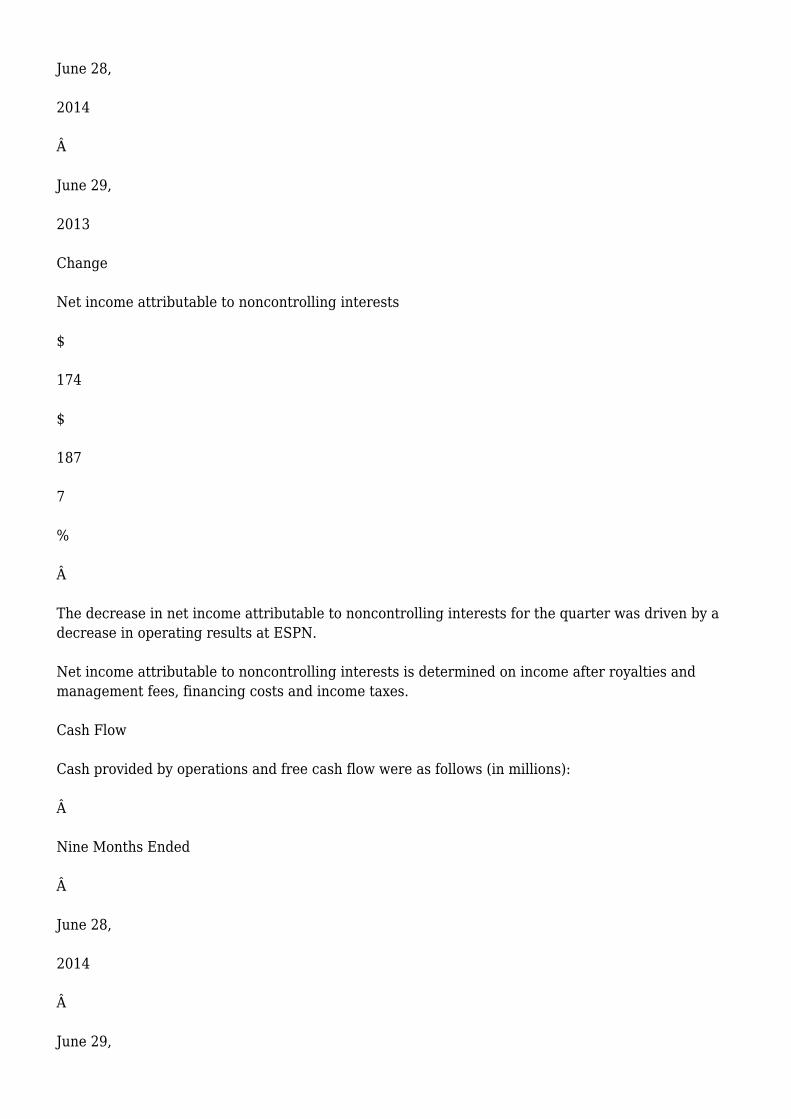
June 28,
2014
Â
June 29,
2013
Change
Net income attributable to noncontrolling interests
$
174
$
187
7
%
Â
The decrease in net income attributable to noncontrolling interests for the quarter was driven by adecrease in operating results at ESPN.
Net income attributable to noncontrolling interests is determined on income after royalties andmanagement fees, financing costs and income taxes.
Cash Flow
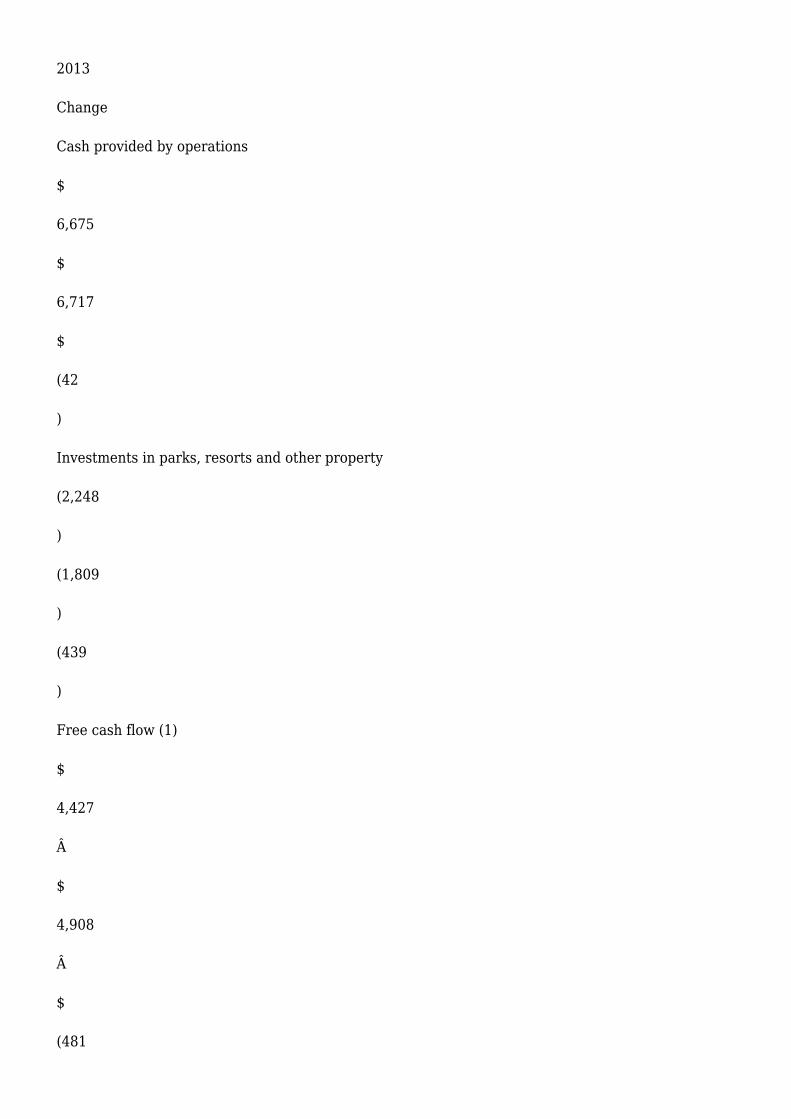
Cash provided by operations and free cash flow were as follows (in millions):
Â
Nine Months Ended
Â
June 28,
2014
Â
June 29,
2013
Change
Cash provided by operations
$
6,675
$
6,717
$
(42
)
Investments in parks, resorts and other property
(2,248
)
(1,809
)
(439
)
Free cash flow (1)
$
4,427
Â
$
4,908
Â
$
(481
)
Â
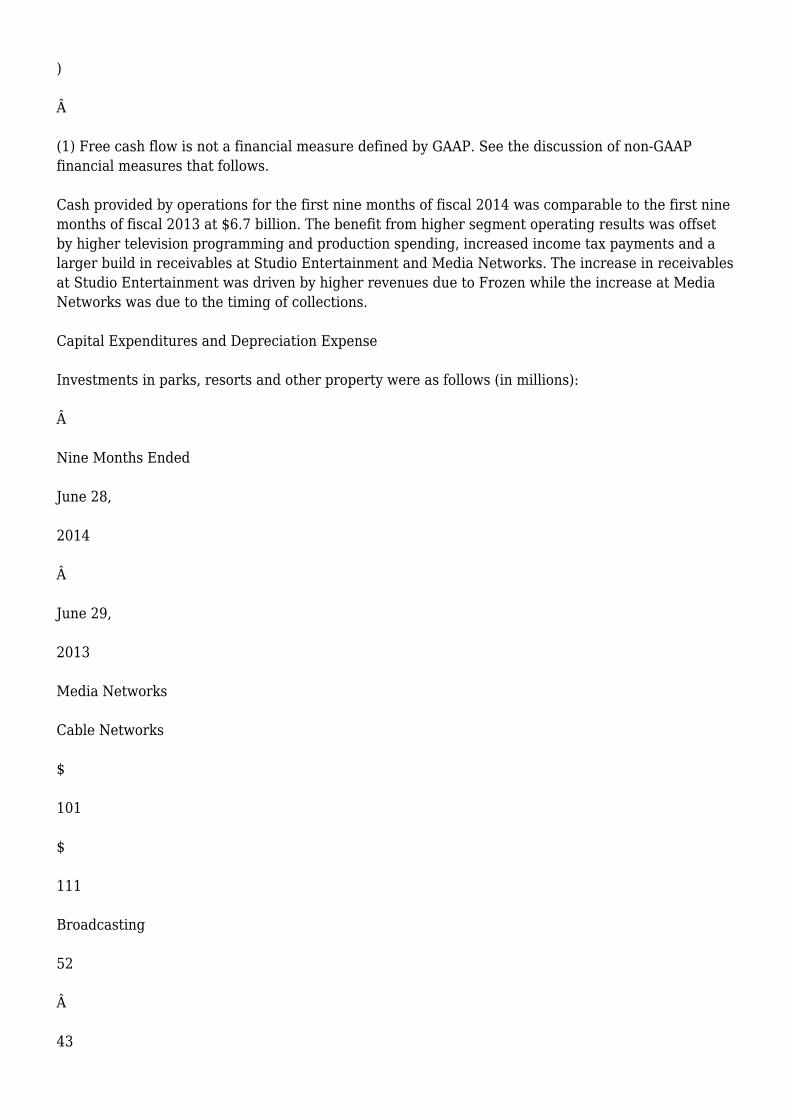
(1) Free cash flow is not a financial measure defined by GAAP. See the discussion of non-GAAPfinancial measures that follows.
Cash provided by operations for the first nine months of fiscal 2014 was comparable to the first ninemonths of fiscal 2013 at $6.7 billion. The benefit from higher segment operating results was offsetby higher television programming and production spending, increased income tax payments and alarger build in receivables at Studio Entertainment and Media Networks. The increase in receivablesat Studio Entertainment was driven by higher revenues due to Frozen while the increase at MediaNetworks was due to the timing of collections.
Capital Expenditures and Depreciation Expense
Investments in parks, resorts and other property were as follows (in millions):
Â
Nine Months Ended
June 28,
2014
Â
June 29,
2013
Media Networks
Cable Networks
$
101
$
111
Broadcasting
52
Â
43

Total Media Networks
153
Â
154
Parks and Resorts
Domestic
809
752
International
1,056
Â
623
Total Parks and Resorts
1,865
Â
1,375
Studio Entertainment
44
41
Consumer Products
23
27
Interactive
3
11
Corporate

160
Â
201
Total investments in parks, resorts and other property
$
2,248
Â
$
1,809
Â
Capital expenditures increased from $1.8 billion to $2.2 billion due to higher construction spendingfor the Shanghai Disney Resort.
Depreciation expense was as follows (in millions):
Â
Nine Months Ended
June 28,
2014
Â
June 29,
2013
Media Networks
Cable Networks
$
101
$
105

Broadcasting
70
Â
74
Total Media Networks
171
Â
179
Parks and Resorts
Domestic
832
781
International
259
Â
242
Total Parks and Resorts
1,091
Â
1,023
Studio Entertainment
37
39
Consumer Products
47
43

Interactive
7
13
Corporate
177
Â
161
Total depreciation expense
$
1,530
Â
$
1,458
Â
Non-GAAP Financial Measures
This earnings release presents EPS excluding the impact of certain items affecting comparability,free cash flow and aggregate segment operating income, all of which are important financialmeasures for the Company, but are not financial measures defined by GAAP.
These measures should be reviewed in conjunction with the relevant GAAP financial measures andare not presented as alternative measures of EPS, cash flow or net income as determined inaccordance with GAAP. EPS excluding certain items affecting comparability, free cash flow andaggregate segment operating income as we have calculated them may not be comparable tosimilarly titled measures reported by other companies.
EPS excluding certain items affecting comparability - The Company uses EPS excluding certainitems to evaluate the performance of the Company's operations exclusive of certain items affectingcomparability of results from period to period. The Company believes that information about EPSexclusive of these impacts is useful to investors, particularly where the impact of the excluded itemsis significant in relation to reported earnings, because the measure allows for comparability betweenperiods of the operating performance of the Company's business and allows investors to evaluate theimpact of these items separately from the impact of the operations of the business.
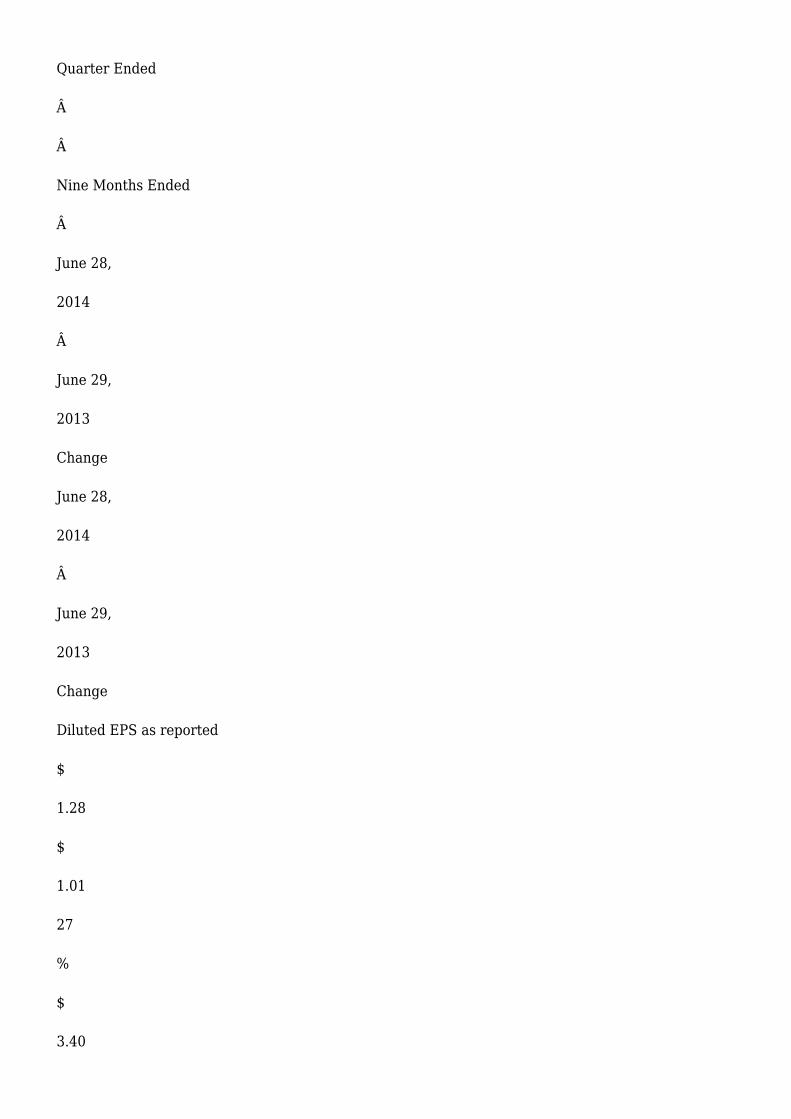
The following table reconciles reported EPS to EPS excluding certain items affecting comparability:
Â
Quarter Ended
Â
Â
Nine Months Ended
Â
June 28,
2014
Â
June 29,
2013
Change
June 28,
2014
Â
June 29,
2013
Change
Diluted EPS as reported
$
1.28
$
1.01
27
%
$
3.40
$
2.61
30
%
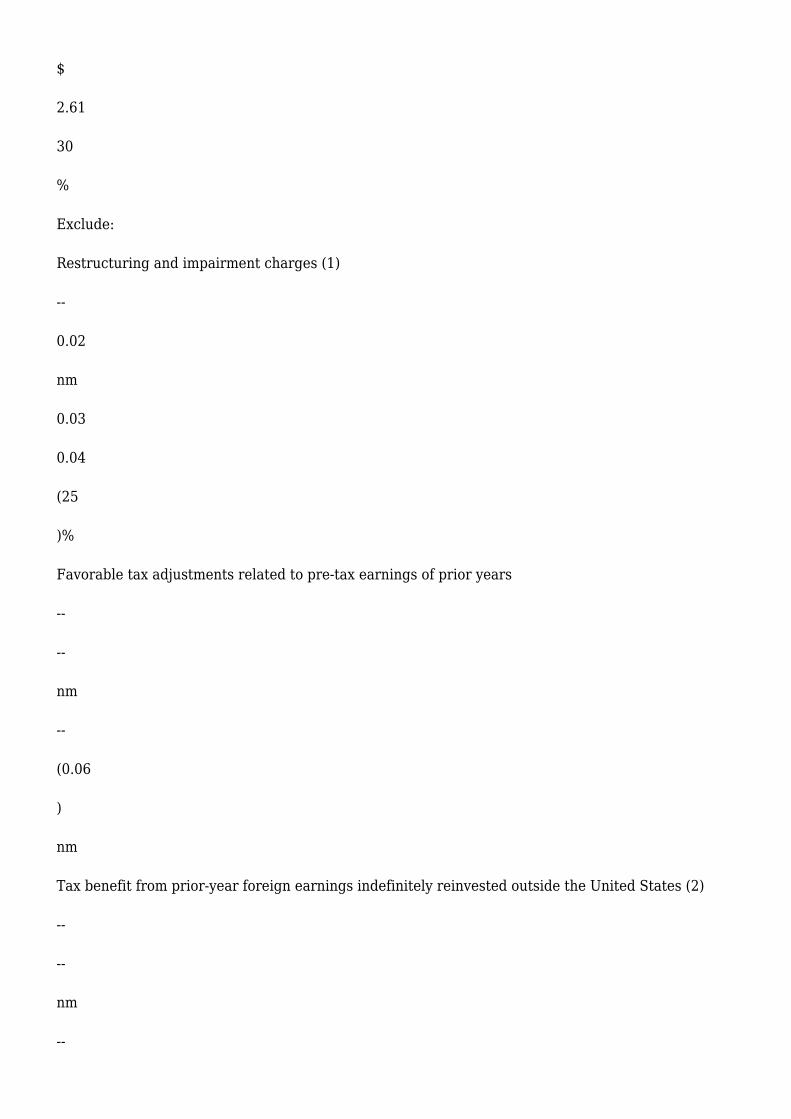
Exclude:
Restructuring and impairment charges (1)
--
0.02
nm
0.03
0.04
(25
)%
Favorable tax adjustments related to pre-tax earnings of prior years
--
--
nm
--
(0.06
)
nm
Tax benefit from prior-year foreign earnings indefinitely reinvested outside the United States (2)
--
--
nm
--

(0.04
)
nm
Hulu Equity Redemption charge (3)
--
--
nm
--
0.02
nm
Other income/(expense), net (4)
Â
Â
--
Â
nm
0.01
Â
0.04
Â
(75
)%
Diluted EPS excluding certain items affecting comparability(5)
$
1.28
Â
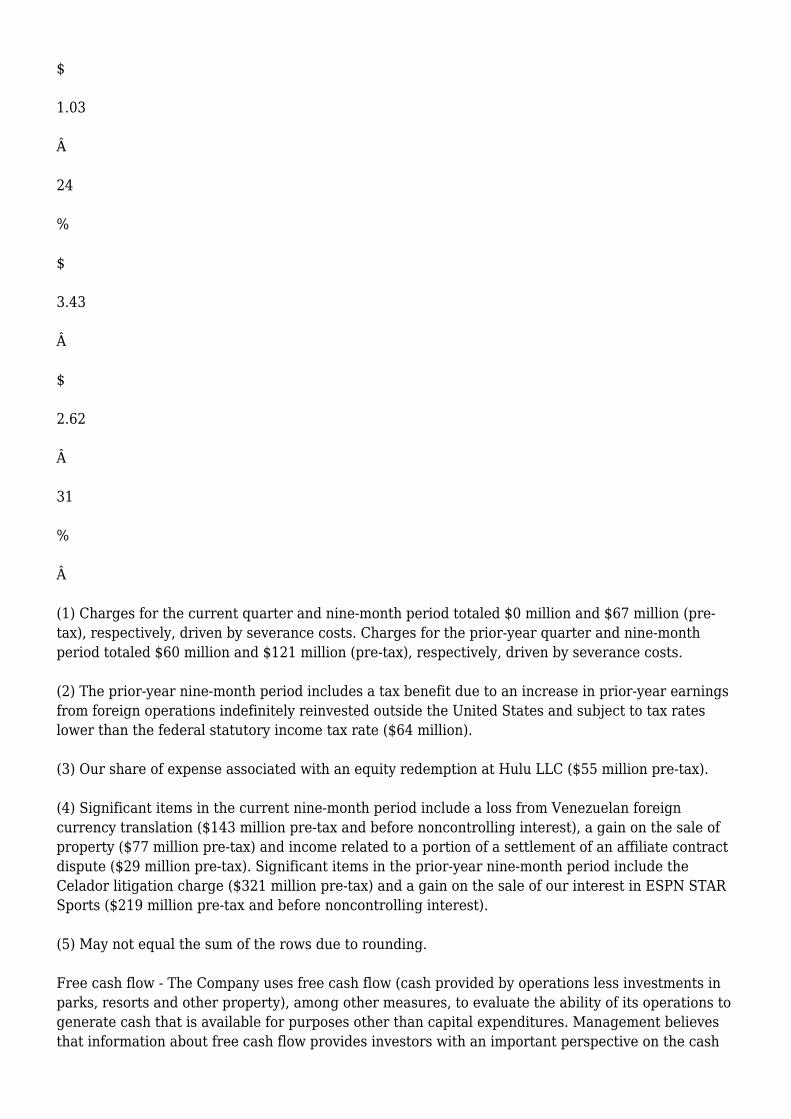
$
1.03
Â
24
%
$
3.43
Â
$
2.62
Â
31
%
Â
(1) Charges for the current quarter and nine-month period totaled $0 million and $67 million (pre-tax), respectively, driven by severance costs. Charges for the prior-year quarter and nine-monthperiod totaled $60 million and $121 million (pre-tax), respectively, driven by severance costs.
(2) The prior-year nine-month period includes a tax benefit due to an increase in prior-year earningsfrom foreign operations indefinitely reinvested outside the United States and subject to tax rateslower than the federal statutory income tax rate ($64 million).
(3) Our share of expense associated with an equity redemption at Hulu LLC ($55 million pre-tax).
(4) Significant items in the current nine-month period include a loss from Venezuelan foreigncurrency translation ($143 million pre-tax and before noncontrolling interest), a gain on the sale ofproperty ($77 million pre-tax) and income related to a portion of a settlement of an affiliate contractdispute ($29 million pre-tax). Significant items in the prior-year nine-month period include theCelador litigation charge ($321 million pre-tax) and a gain on the sale of our interest in ESPN STARSports ($219 million pre-tax and before noncontrolling interest).
(5) May not equal the sum of the rows due to rounding.
Free cash flow - The Company uses free cash flow (cash provided by operations less investments inparks, resorts and other property), among other measures, to evaluate the ability of its operations togenerate cash that is available for purposes other than capital expenditures. Management believesthat information about free cash flow provides investors with an important perspective on the cash
available to service debt, make strategic acquisitions and investments and pay dividends orrepurchase shares.
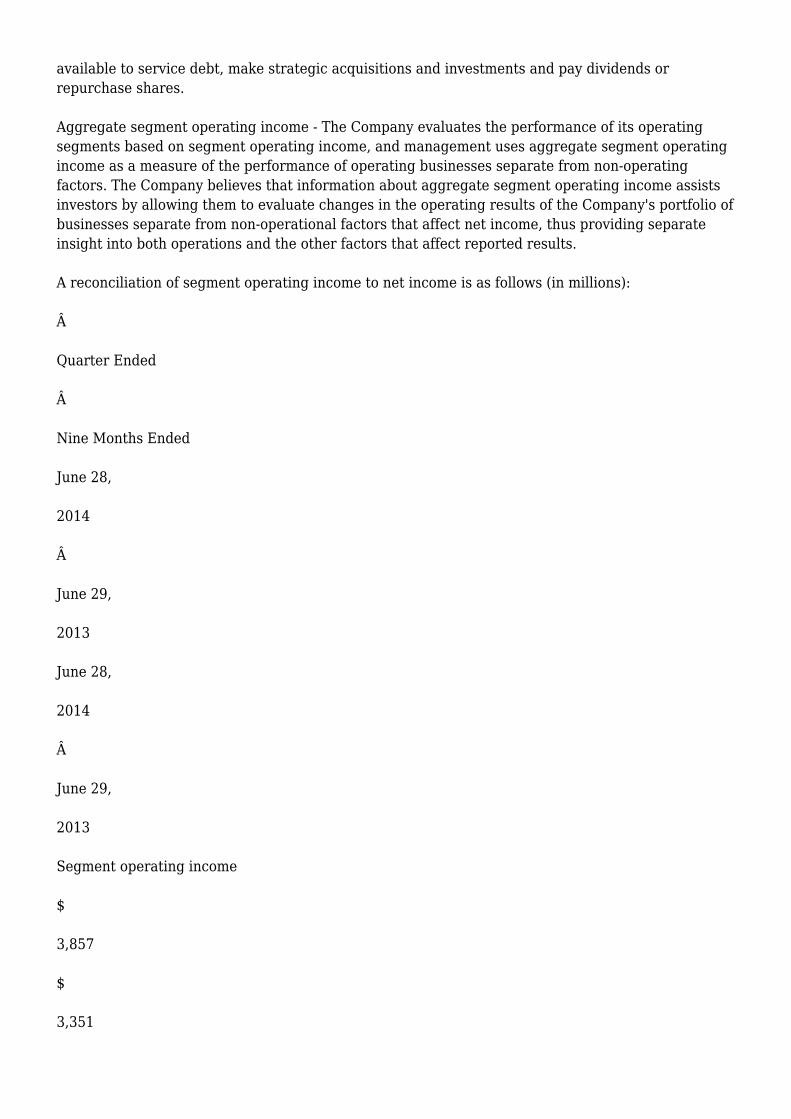
Aggregate segment operating income - The Company evaluates the performance of its operatingsegments based on segment operating income, and management uses aggregate segment operatingincome as a measure of the performance of operating businesses separate from non-operatingfactors. The Company believes that information about aggregate segment operating income assistsinvestors by allowing them to evaluate changes in the operating results of the Company's portfolio ofbusinesses separate from non-operational factors that affect net income, thus providing separateinsight into both operations and the other factors that affect reported results.
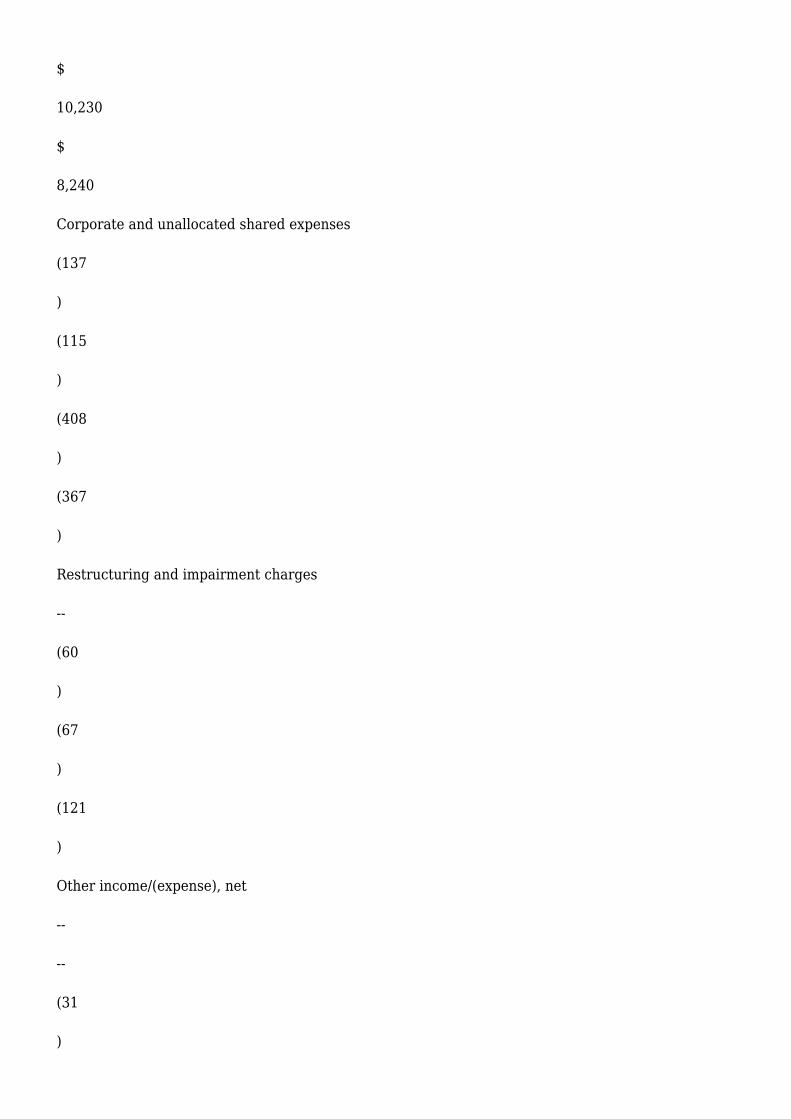
A reconciliation of segment operating income to net income is as follows (in millions):
Â
Quarter Ended
Â
Nine Months Ended
June 28,
2014
Â
June 29,
2013
June 28,
2014
Â
June 29,
2013
Segment operating income
$
3,857
$
3,351
$
10,230
$
8,240
Corporate and unallocated shared expenses
(137
)
(115
)
(408
)
(367
)
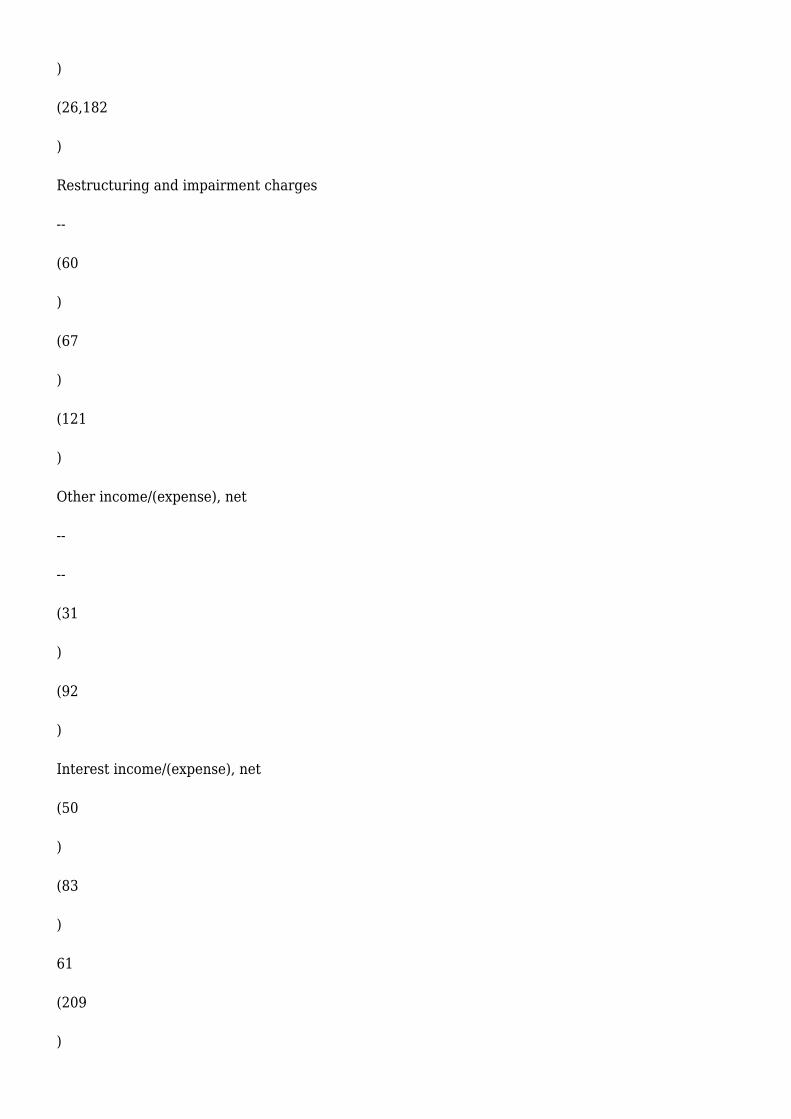
Restructuring and impairment charges
--
(60
)
(67
)
(121
)
Other income/(expense), net
--
--
(31
)

(92
)
Interest income/(expense), net
(50
)
(83
)
61
(209
)
Hulu Equity Redemption charge
--
Â
--
Â
--
Â
(55
)
Income before income taxes
3,670
3,093
9,785
7,396
Income taxes
(1,251

)
(1,059
)
(3,406
)
(2,303
)
Net income
$
2,419
Â
$
2,034
Â
$
6,379
Â
$
5,093
Â
Â
CONFERENCE CALL INFORMATION
In conjunction with this release, The Walt Disney Company will host a conference call today,August 5, 2014, at 5:00 PM EST/2:00 PM PST via a live Webcast. To access the Webcast go towww.disney.com/investors. The discussion will be available via replay through August 19, 2014 at7:00 PM EDT/4:00 PM PDT.
FORWARD-LOOKING STATEMENTS

Management believes certain statements in this earnings release may constitute "forward-lookingstatements" within the meaning of the Private Securities Litigation Reform Act of 1995. Thesestatements are made on the basis of management's views and assumptions regarding future eventsand business performance as of the time the statements are made. Management does not undertakeany obligation to update these statements.
Actual results may differ materially from those expressed or implied. Such differences may resultfrom actions taken by the Company, including restructuring or strategic initiatives (including capitalinvestments or asset acquisitions or dispositions), as well as from developments beyond theCompany's control, including:
changes in domestic and global economic conditions, competitive conditions and consumerpreferences;
adverse weather conditions or natural disasters;
health concerns;
international, political, or military developments; and
technological developments.
Such developments may affect travel and leisure businesses generally and may, among otherthings, affect:
the performance of the Company's theatrical and home entertainment releases;
the advertising market for broadcast and cable television programming;
expenses of providing medical and pension benefits;
demand for our products; and
performance of some or all company businesses either directly or through their impact on those whodistribute our products.
Additional factors are set forth in the Company's Annual Report on Form 10-K for the year endedSeptember 28, 2013 under Item 1A, "Risk Factors," and subsequent reports.
THE WALT DISNEY COMPANY
CONDENSED CONSOLIDATED STATEMENTS OF INCOME
(unaudited; in millions, except per share data)
Â
Â
Quarter Ended

Nine Months Ended
June 28,
2014
Â
June 29,
2013
June 28,
2014
Â
June 29,
2013
Revenues
$
12,466
$
11,578
$
36,424
$
33,473
Costs and expenses
(8,968
)
(8,574
)
(27,280
)
(26,182
)
Restructuring and impairment charges
--
(60
)
(67
)
(121
)
Other income/(expense), net
--
--
(31
)
(92
)
Interest income/(expense), net
(50
)
(83
)
61
(209
)

Equity in the income of investees
222
Â
232
Â
678
Â
527
Â
Income before income taxes
3,670
3,093
9,785
7,396
Income taxes
(1,251
)
(1,059
)
(3,406
)
(2,303
)
Net income
2,419
2,034

6,379
5,093
Less: Net income attributable to noncontrolling interests
(174
)
(187
)
(377
)
(351
)
Net income attributable to The Walt Disney Company (Disney)
$
2,245
Â
$
1,847
Â
$
6,002
Â
$
4,742
Â
Â
Earnings per share attributable to Disney:

Diluted
$
1.28
Â
$
1.01
Â
$
3.40
Â
$
2.61
Â
Basic
$
1.30
Â
$
1.02
Â
$
3.43
Â
$
2.64
Â

Â
Weighted average number of common and common equivalent shares outstanding:
Diluted
1,748
Â
1,821
Â
1,767
Â
1,816
Â
Basic
1,732
Â
1,802
Â
1,748
Â
1,794
Â
Â
Dividends declared per share
$
--
Â
$
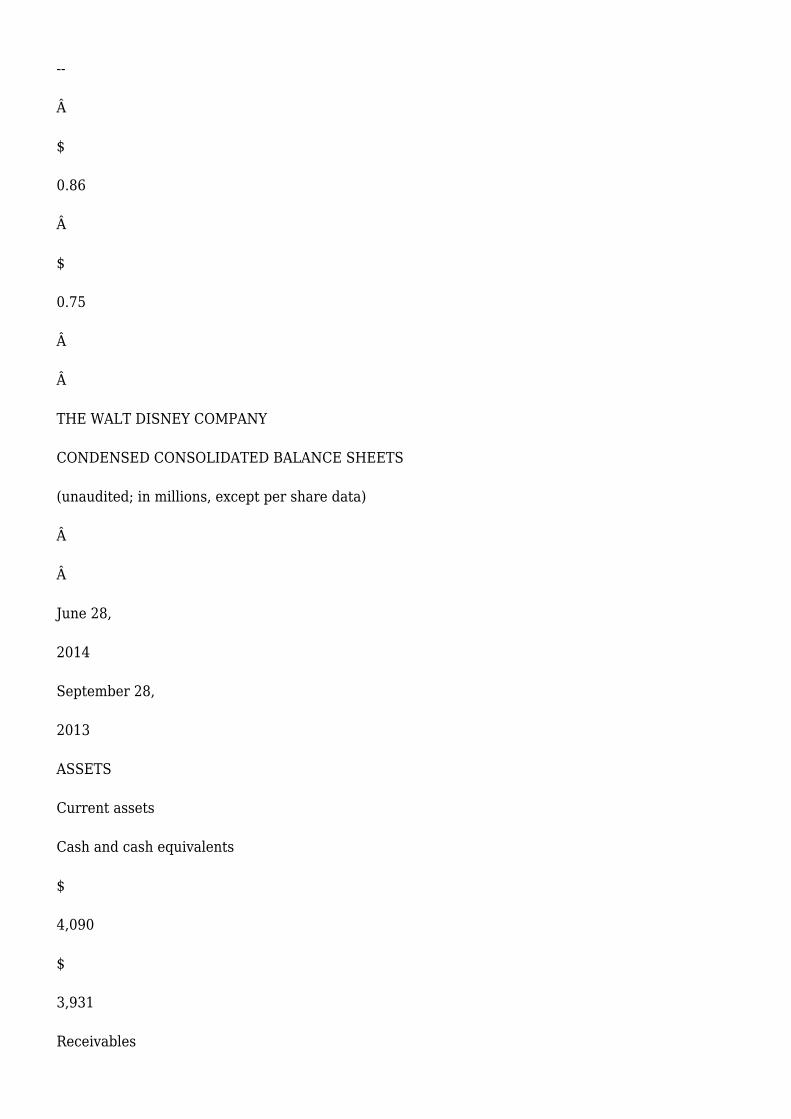
--
Â
$
0.86
Â
$
0.75
Â
Â
THE WALT DISNEY COMPANY
CONDENSED CONSOLIDATED BALANCE SHEETS
(unaudited; in millions, except per share data)
Â
Â
June 28,
2014
September 28,
2013
ASSETS
Current assets
Cash and cash equivalents
$
4,090
$
3,931
Receivables

7,543
6,967
Inventories
1,425
1,487
Television costs and advances
1,095
634
Deferred income taxes
480
485
Other current assets
572
Â
605
Â
Total current assets
15,205
14,109
Film and television costs
5,025
4,783
Investments
2,858
2,849
Parks, resorts and other property
Attractions, buildings and equipment
41,934
41,192
Accumulated depreciation
(23,615
)
(22,459
)
18,319
18,733
Projects in progress
3,441
2,476
Land
1,253
Â
1,171
Â
23,013
22,380
Intangible assets, net
7,268
7,370
Goodwill
27,924
27,324
Other assets
2,430
Â
2,426
Â
Total assets
$
83,723
Â
$
81,241
Â
Â
LIABILITIES AND EQUITY
Current liabilities
Accounts payable and other accrued liabilities
$
6,379
$
6,803
Current portion of borrowings
3,216
1,512
Unearned royalties and other advances
3,756

Â
3,389
Â
Total current liabilities
13,351
11,704
Â
Borrowings
12,920
12,776
Deferred income taxes
4,360
4,050
Other long-term liabilities
4,480
4,561
Commitments and contingencies
Equity
Preferred stock, $.01 par value
Authorized - 100 million shares, Issued - none
--
--
Common stock, $.01 par value
Authorized - 4.6 billion shares, Issued - 2.8 billion shares
34,123
33,440
Retained earnings
52,235
47,758
Accumulated other comprehensive loss
(1,169
)
(1,187
)
85,189
80,011
Treasury stock, at cost, 1.1 billion shares at June 28, 2014 and
1.0 billion shares at September 28, 2013
(39,669
)
(34,582
)
Total Disney Shareholders' equity
45,520
45,429
Noncontrolling interests
3,092
Â
2,721
Â
Total equity
48,612

Â
48,150
Â
Total liabilities and equity
$
83,723
Â
$
81,241
Â
Â
THE WALT DISNEY COMPANY
CONDENSED CONSOLIDATED STATEMENTS OF CASH FLOWS
(unaudited; in millions)
Â
Nine Months Ended
June 28,
2014
Â
June 29,
2013
OPERATING ACTIVITIES
Net income
$
6,379
$
5,093
Depreciation and amortization
1,698
1,633
Gains on sales of investments and dispositions
(285
)
(245
)
Deferred income taxes
304
163
Equity in the income of investees
(678
)
(527
)
Cash distributions received from equity investees
538
526
Net change in film and television costs and advances
(993
)
(357
)
Equity-based compensation
308
305
Other
33
249
Changes in operating assets and liabilities:
Receivables
(543
)
(3
)
Inventories
61
78
Other assets
(73
)
(3
)
Accounts payable and other accrued liabilities
(288
)
(328
)
Income taxes
214
Â
133
Â
Cash provided by operations
6,675
Â
6,717
Â
Â
INVESTING ACTIVITIES
Investments in parks, resorts and other property
(2,248
)
(1,809
)
Sales of investments/proceeds from dispositions
382
367
Acquisitions
(402
)
(2,310
)
Other
(24
)
90
Â
Cash used in investing activities
(2,292
)
(3,662
)
Â
FINANCING ACTIVITIES
Commercial paper borrowings/(repayments), net
1,253
(2,000
)
Borrowings
2,180
3,900
Reduction of borrowings
(1,549
)
(817
)
Dividends
(1,508
)
(1,324
)

Repurchases of common stock
(5,087
)
(2,694
)
Proceeds from exercise of stock options
348
518
Other
273
Â
(19
)
Cash used in financing activities
(4,090
)
(2,436
)
Â
Impact of exchange rates on cash and cash equivalents
(134
)
(74
)
Â
Increase in cash and cash equivalents

159
545
Cash and cash equivalents, beginning of period
3,931
Â
3,387
Â
Cash and cash equivalents, end of period
$
4,090
Â
$
3,932
Â
Â
Guardians of the Galaxy