the virginia energy plan
TRANSCRIPT

The Virginia Energy Plan
Commonwealth of Virginia
Governor Robert McDonnell
Issued by the Department of Mines, Minerals and Energy
July 1, 2010

VIRGINIA ENERGY PLAN – TABLE OF CONTENTS
Executive Summary ……………………………………………………………………… i
Section 1 – General Energy Information
Quick Facts ………………………………………………………………………. 1-1
State Energy Policy …………………………………………………………….. 1-2
Energy Consumption ……………………………………………………………. 1-3
Energy Balance – Imports and Exports ………………………………………. 1-4
Energy Consumption and Production Forecasts ……………………………. 1-7
Energy Infrastructure …………………………………………………………… 1-8
State Rankings ………………………………………………………………….. 1-9
Section 2 – Electricity
Virginia’s Electric Providers ……………………………………………………. 2-1
Electric Consumption …………………………………………………………… 2-2
Virginia’s Electric Regulatory Structure ………………………………………. 2-3
Reliability Requirements ……………………………………………………….. 2-4
Electric Generation ……………………………………………………………… 2-5
Electricity Imports ………………………………………………………………. 2-9
Electric Rates and Costs ………………………………………………………. 2-10
Future Electric Demand ………………………………………………………… 2-16
Integrated Resource Plans ……………………………………………………... 2-16
Transmission and Distribution of Electricity ………………………………….. 2-17
Conservation and Efficiency …………………………………………………… 2-19
Adequacy of Electric Infrastructure Siting Requirements …………………... 2-21
Future Direction …………………………………………………………………. 2-23
Section 3 – Coal
Coal Markets – Electric Generation ……………………………………………. 3-1
Coal Markets – Other Uses …………………………………………………….. 3-4
Coal Prices ………………………………………………………………………. 3-4
Future Uses of Coal ……………………………………………………………... 3-6
Coal Mining in Virginia …………………………………………………………. 3-7
Infrastructure ……………………………………………………………………. 3-10
Coal Facility Siting Requirements …………………………………………….. 3-11
Section 4 – Nuclear Power
Nuclear Power Generation in Virginia …………………………………………. 4-1
Nuclear Power Plant Designs …………………………………………………. 4-1
Spent Fuel Management ………………………………………………………. 4-2

The Nuclear Fuel Cycle ………………………………………………………… 4-2
Nuclear Fuel Costs ……………………………………………………………… 4-3
Nuclear Plant Siting and Construction ……………………………………….. 4-3
Uranium Mining …………………………………………………………………. 4-4
Nuclear Industry Workforce Development …………………………………… 4-5
Section 5 – Natural Gas
Virginia’s Natural Gas Providers ……………………………………………… 5-1
Natural Gas Consumption ……………………………………………………… 5-2
Virginia’s Natural Gas Regulatory Structure …………………………………. 5-3
Natural Gas Transmission ……………………………………………………… 5-4
Natural Gas Prices ……………………………………………………………… 5-6
Conservation and Efficiency …………………………………………………… 5-7
Natural Gas Production ………………………………………………………… 5-8
Offshore Natural Gas …………………………………………………………… 5-11
Natural Gas Storage ……………………………………………………………. 5-12
Adequacy of Supply ……………………………………………………………. 5-13
Section 6 – Renewables
Renewable Energy ……………………………………………………………… 6-1
Biomass and Waste-to-Energy ………………………………………………… 6-3
Hydroelectric Power ……………………………………………………………. 6-6
Onshore Wind …………………………………………………………………… 6-7
Offshore Wind …………………………………………………………………… 6-9
Solar Power ……………………………………………………………………... 6-12
Geothermal Power ……………………………………………………………… 6-13
Section 7 – Petroleum
Petroleum Consumption ……………………………………………………….. 7-1
Petroleum Product Pipelines and Distribution ……………………………….. 7-3
Petroleum Prices ……………………………………………………………….. 7-5
Conservation and Efficiency …………………………………………………... 7-7
Petroleum Production ………………………………………………………….. 7-7
Offshore Oil ……………………………………………………………………… 7-8
Petroleum Refining ……………………………………………………………... 7-9
Adequacy of Supply ……………………………………………………………. 7-9
Section 8 – Findings and Recommendations
Findings ………………………………………………………………………….. 8-1
Goals and Recommendations ……………………………………………….... 8-1

Appendix – Code of Virginia, Title 67, Virginia Energy Plan
Chapter 1, Energy Policy of the Commonwealth ……………………………. i
Chapter 2, Virginia Energy Plan ………………………………………………. iii

VIRGINIA ENERGY PLAN – EXECUTIVE SUMMARY
The General Assembly established a state energy policy framework in Chapter 1 of Title 67 of the Code of Virginia and directed the Department of Mines, Minerals and Energy to draft the Virginia Energy Plan. The General Assembly further directed that the Plan be updated by July 1, 2010, and every four years thereafter.
The Code set energy policy and objectives for the Commonwealth. These broadly provide that Virginia should:
Ensure availability of reliable energy supplies at reasonable costs;
Establish sufficient infrastructure to support energy needs;
Use resources efficiently and facilitate energy conservation;
Facilitate development of Virginia’s low cost resources, including clean coal and natural gas;
Facilitate development of less polluting energy sources;
Foster energy research and development; and
Address environmental protection with energy facilities.
Virginia uses a diverse mix of energy resources.
The transportation sector uses 31 percent of total energy use.
The residential sector uses 24 percent.
The commercial sector uses 23 percent.
The industrial sector uses 22 percent.
Energy use by sector varies.
Petroleum is the primary energy source for transportation, providing 97 percent of transportation energy.
Residential energy is provided primarily by electricity (53 percent), natural gas (29 percent), and petroleum (14 percent).
Commercial energy use comes primarily from electricity (65 percent) and natural gas (28 percent).
Industrial energy comes from a diverse mix including petroleum (32 percent), coal (19 percent), natural gas (18 percent), biomass (16 percent), and electricity (15 percent).
This Plan assesses Virginia’s energy situation through examining the state’s primary energy resources: electricity, coal, nuclear, natural gas, renewables, and petroleum.
Electricity:
Electricity is provided by three investor-owned utilities (84.2 percent of retail sales), 13 electric cooperatives (11.3 percent), and 16 municipal utilities (4.5 percent).
Generation and transmission of electricity is managed through the PJM Interconnection, a regional transmission operator serving Virginia, Mid-Atlantic States through New Jersey, and portions of states to the West through Illinois.
Executive Summary Page i

Rates and terms of service for investor-owned utilities and cooperatives are set through cases heard by the State Corporation Commission.
2008 electricity use was provided 66 percent from in-state generation and 34 percent from electricity imports. Coal (44 percent), nuclear (38 percent), and natural gas (13 percent) fueled the majority of in-state generation in 2008.
Virginia’s electric rates have risen over time, with a higher percentage jump in 2009. Rates vary among Virginia’s electric utilities. Average prices for electricity in 2009 were 10.61 cents/kilowatt hour (kWh) for residential consumers; 8.1 cents/kWh for commercial consumers; 6.87 cents/kWh for industrial users; and 8.42 cents/kWh for transportation consumers. Rates remain below the national average, at 90.5 percent of national rates in 2009.
Coal
Virginia coal is used primarily for electric generation and industrial steam (steam coal), and coke for steel manufacturing (metallurgical coal). Virginia is a net exporter of coal.
Coal prices have generally risen over time, with current steam coal prices averaging approximately $50/ton and metallurgical coal prices averaging about $120/ton.
Coal mining is a significant economic driver of the Southwest Virginia economy, providing approximately 4,400 mining jobs and $1.7 billion in revenue from coal sales.
Nuclear
Virginia is home to four nuclear units. Owned by Dominion, there are two units each at the North Anna and Surry Power Stations. These plants came on line between 1972 and 1980. Their operating licenses have been extended through 2032 and 2040. Dominion is considering constructing a third nuclear reactor at the North Anna Station.
Virginia is a leader in nuclear technologies, with AREVA, B&W, and Northrop Grumman Newport News providing nuclear plant design, fuel services, nuclear plant maintenance, nuclear plant component manufacturing, and nuclear shipbuilding.
Virginia is home to a commercially viable uranium deposit at Coles Hill in Pittsylvania County. There is a moratorium on mining due to questions whether the uranium can be safely mined in Virginia’s environment. The Virginia Coal and Energy Commission is studying the safety and economic impact of possible uranium mining.
Natural Gas
Natural gas is provided by ten investor-owned and three local government natural gas local distribution utilities. Large industrial and institutional consumers can also purchase their natural gas directly. Approximately 37 percent of Virginia’s households and 90,000 commercial businesses use natural gas.
Rates and terms of service for the investor-owned local distribution utilities are set through cases heard by the State Corporation Commission.
Natural gas is delivered to Virginia through pipelines carrying natural gas produced in the Gulf of Mexico region, pipelines carrying natural gas produced in the Virginia and other Appalachian natural gas fields, and through the liquefied natural gas terminal in Cove Point, Maryland.
Executive Summary Page ii

Natural Gas prices have risen over time. In 2008, residential consumers paid on average $16.20/thousand cubic feet (MCF), commercial consumers paid $12.98/MCF, industrial consumers paid $1.49/MCF, and utility consumers paid $10.87/MCF.
Virginia’s natural gas companies produced 128.5 billion cubic feet of gas in 2008 from 6,428 wells, with approximately $0.5 billion in revenue from gas sales. Wells are located in Southwest Virginia. Approximately 80 percent of production comes from natural gas found in coal seams. There is potential to produce additional natural gas from Marcellus Shale formations and, subject to federal leasing, from offshore wells.
Renewables
Renewable sources of energy provided approximately 2.8 percent of electricity generated in Virginia and approximately 6 percent of gasoline consumed in the state.
The greatest potential for renewable energy production in Virginia comes from biomass, hydro power, and wind power. Solar power can provide distributed power to end users across the Commonwealth.
Geothermal energy can provide heating and cooling through use of geothermal heat pumps. Virginia does not have high-temperature geothermal resources suitable for electric generation.
Petroleum
Petroleum products are supplied to Virginia through pipelines carrying gasoline, diesel, aviation fuel, and other products produced in Gulf of Mexico area refineries; from the Western Refining refinery in Yorktown; and from water borne supplies delivered to coastal petroleum terminals.
Western Refining has a production capacity of 70,000 barrels per day, slightly less than 15 percent of the state’s consumption.
Petroleum prices are largely set by national and international markets. Prices have been volatile over time. For example, gasoline prices have ranged from over $4.00 per gallon in September 2008, down to current prices of $2.70 per gallon.
Virginia companies produce a nominal amount of petroleum from 75 stripper wells in Lee, Wise, and Russell Counties. There is potential to produce oil, subject to federal leasing, from offshore wells.
This plan sets out three goals and includes recommended actions.
1. Make Virginia the Energy Capital of the East Coast.
Grow both traditional and alternative energy production, jobs, and investment in Virginia.
Increase the use of conservation and efficiency in Virginia’s homes and businesses and support the establishment and expansion of energy efficiency businesses.
2. Expand public education about Virginia’s energy production and consumption, its effect on our economy, and how Virginians can use energy more efficiently.
3. Maximize the investment in clean energy research and development through the work of the Universities Clean Energy Development and Economic Stimulus Foundation.
Executive Summary Page iii

SECTION 1 - GENERAL ENERGY INFORMATION
Quick Facts
Energy (electricity, heating and cooling, transportation) is supplied to Virginians 44 percent from petroleum, 20 percent from coal, 18 percent from electricity generated outside Virginia, 13 percent from nuclear-based power generation, and 5 percent from hydro, biomass, and other renewable sources.
Virginia’s net energy balance is negative, having imported 55 percent of total energy used in 2008.
Electricity generated in Virginia in 2008 came 44 percent from coal, 38 percent from nuclear, 13 percent from natural gas, 3 percent from renewables, and 2 percent from petroleum. Virginia’s utilities imported 34 percent of the state’s 2008 electricity consumption from generation facilities outside of Virginia.
The Commonwealth is the 15th largest primary energy producer of the states, including coal, natural gas, hydro, biomass, and other renewables.
o Virginia’s mining companies produce nearly 10 percent of U.S. coal east of the Mississippi River from underground and surface mines in Southwest Virginia.
o Virginia has nearly 6,500 natural gas wells that produce 43 percent of the natural gas the state consumes. Two Virginia coalbed methane fields and the Nora and Oakwood fields in Southwest Virginia are among the top 100 natural gas fields in the United States.
Virginia is home to a robust energy infrastructure including:
o 130 coal, nuclear, natural gas, hydro, oil, and biomass fueled electric power plants. o The southern end of the PJM Interconnection system with approximately 60,000 miles of
transmission lines and approximately 6,000 substations, connected to an extensive network of local distribution lines reaching customers in almost every corner of Virginia.
o Approximately 3,000 miles of natural gas transmission pipelines1, approximately 3,200 miles of natural gas gathering pipelines2, and approximately 20,000 miles of distribution pipelines.3
o Two petroleum product pipelines moving gasoline, diesel, and other fuels from the Gulf of Mexico to Virginia; piers to receive water-borne petroleum products; and four major petroleum terminal hubs.
o A petroleum refinery in Yorktown that can process 70,000 barrels per day of petroleum into gasoline, diesel fuel, and other products.4
Virginia uses energy more efficiently than the nation, ranking 31st in energy use per unit of gross domestic product (GDP).
Virginia has a voluntary goal to reduce electricity use by 2022 through conservation and efficiency, by an amount equal to 10 percent of 2006 electricity use.
Virginia’s utilities and coal and gas producers employ over 20,000 people, with an estimated $2 billion in payroll.
1 PHMSA Pipeline Safety Program, http://primis.phmsa.dot.gov/comm/reports/safety/VA_detail1.html?nocache=9885#_OuterPanel_tab_1, June 22, 2010 2 DMME, Division of Gas and Oil, June 23, 2010 3 PHMSA Pipeline Safety Program, http://primis.phmsa.dot.gov/comm/reports/safety/VA_detail1.html?nocache=9885#_OuterPanel_tab_1, June 22, 2010. 4 Western Refining, http://www.wnr.com/Refining.aspx, June 23, 2010
Section 1 – General Energy Information Page 1-1

State Energy Policy
Virginia’s General Assembly set out the following broad policies and objectives in state law:5
Ensure availability of reliable energy supplies at reasonable costs; Establish sufficient infrastructure to support energy needs; Use resources efficiently and facilitate energy conservation; Facilitate development of Virginia’s low cost resources, including clean coal and natural
gas; Facilitate development of less polluting energy sources; Foster energy research and development; and Address environmental protection with energy facilities.
Energy Consumption
Virginians use electricity, natural gas, fuel oil, and other fuels to light, heat, cool, and operate their homes, stores, and factories; and gasoline and diesel fuel to move their cars, trucks, buses, airplanes, ships, and trains.
This energy comes from multiple sources: 44 percent from petroleum, 20 percent from coal, 18 percent from electricity generated outside Virginia, 13 percent from nuclear-based power generation, and 5 percent from hydro, biomass, and other renewable sources.
Energy is used in different ways and in differing quantities by residential, commercial, industrial, and transportation customers.
o The transportation sector is the largest user of energy in Virginia. Residential, commercial, and industrial consumers use about equal amounts.
o Compared to the average state, Virginia uses more energy for transportation and commercial use and less for industrial use.
Figure 1-1: Virginia Total Energy Consumption by Sector, 20076
31%
24%
23%
22%
Transportation
Residential
Commercial
Industrial
5 Code of Virginia, Title 67, Sections 67-101 and 67-102, http://leg1.state.va.us/cgi-bin/legp504.exe?000+cod+TOC67000000001000000000000, June 29, 2010 6 EIA, State Energy Consumption Estimates, http://www.eia.doe.gov/emeu/states/sep_use/notes/use_print2007.pdf
Section 1 – General Energy Information Page 1-2

Energy use for transportation has grown at the fastest rate. Energy use in the industrial sector has grown at the slowest rate. The residential and commercial sectors grew rapidly in the 1990s but slowed through the 2000s.
Figure 1-2: Virginia’s Total Energy Consumption by Sector, 1960–20077
0100200300400500600700800900
1960
1965
1970
1975
1980
1985
1990
1995
2000
2001
2002
2003
2004
2005
2006
2007
2008
Trillion BTU
s
Residential
Commercial
Industrial
Transportation
Electricity delivers 65 percent of all energy to the commercial sector, 53 percent to the residential sector, 19 percent to the industrial sector, and less than 1 percent to the transportation sector. In contrast petroleum delivers 97 percent of energy used by the transportation sector and only 6 percent used by the commercial sector.
Figure 1-3: Virginia’s Energy Consumption by Sector, 20078
Residential Consumption
0%
29%
14%
53%
4%
Coal
Natural Gas
Petroleum
Electricity
Biomass
Commercial Consumption
1%
28%
6%65%
Coal
Natural Gas
Petroleum
Electricity
7 EIA, State Energy Consumption Estimates, http://www.eia.doe.gov/emeu/states/sep_use/notes/use_print2007.pdf 8 EIA, State Energy Consumption Estimates, http://www.eia.doe.gov/emeu/states/sep_use/notes/use_print2007.pdf
Section 1 – General Energy Information Page 1-3

Transportation Consumption
1%
97%
2%
0%
Natural Gas
Petroleum
Ethanol
Electricity
Industrial Consumption
19%
18%
32%
0%
16%
15%Coal
Natural Gas
Petroleum
Hydro‐electricity
Biomass
Electricity
Per capita energy use has increased over time, generally tracking economic activity. Energy use also has increased due to increases in energy used for transportation and as consumers use more energy-consuming devices in their homes and businesses.
Figure 1-4: Virginia’s Per Capita Energy Use, 1990–20079
The average household in 2008 spent $6,599 for electricity, other household energy, and gasoline.
Figure 1-5: Average Household Energy Expenditures10
Energy Type Annual Expenditures
Electricity $990
Gasoline $4,185
Other $1,424
Total $6,599
9 EIA, State Energy Consumption Estimates, http://www.eia.doe.gov/emeu/states/sep_use/notes/use_print2007.pdf 10 DEQ, http://www.deq.virginia.gov/export/sites/default/info/documents/climate/Virginia_Energy_Analysis_091008.pdf, June 20, 2010
Section 1 – General Energy Information Page 1-4

Energy Balance – Imports and Exports
Virginia has a net negative energy balance, importing 55 percent of the total amount of energy the state uses.11 The Commonwealth is a net exporter of coal and a net importer of all other fuels.
In 2007 Virginians spent $30.5 billion to purchase energy.12 On a net basis, this included $13.7 billion on imported fuels and electricity.
With expected growth in use, 2020 imports would cost $21.6 billion in today’s prices.
Figure 1-8: Virginia’s Net Energy Imports/(Exports), 200713 (Trillion Btus)
Table 1-1: Virginia’s Net Energy Imports/(Exports), 200714 (Trillion Btus)
Fuel Production Consumption Net Imp/(Exp)
Coal 656.3 457.9 (198.44)
Renewables 114.2 114.2 0.013
Natural Gas 116.5 332.7 216.161
Electricity 15.61 380.7 365.09
Uranium 0 286 286
Petroleum 0.1 1,016.60 1016.496
Total 1,173 2,611 1,438
Figure 1-9: Virginia’s Net Energy Imports/(Exports) by Fuel, 1992–200715
11 Unless otherwise noted, Virginia energy production and consumption data used in this section comes from: EIA, State Energy Profiles, Virginia, http://tonto.eia.doe.gov/state/state_energy_profiles.cfm?sid=VA, May 26, 2010 12 EIA, State Energy Data System Consumption, Price, and Expenditure Estimates, http://www.eia.doe.gov/emeu/states/_seds.html 13 EIA, State Energy Profiles, Virginia, http://tonto.eia.doe.gov/state/state_energy_profiles.cfm?sid=VA 14 EIA, State Energy Profiles, Virginia, http://tonto.eia.doe.gov/state/state_energy_profiles.cfm?sid=VA
Section 1 – General Energy Information Page 1-5

Reducing energy imports would allow the Commonwealth to expand its economy.
For each 1 percent that Virginia reduces its energy imports, we would keep nearly $150 million in the state’s economy.
o Reducing imports of electricity by 1 percent by adding in-state generation would increase state gross domestic product by $20 million dollars and result in increased jobs in electric generating plants and businesses supporting the plants.
o Increasing coal exports by 1 percent through increased production that would increase state gross domestic product by nearly $7 million, with the attendant jobs in coal mining and support service, railroad, and ports across the state.
Table 1-2: Impact of 1 Percent Change in Virginia’s Energy Imports/Exports
CHANGE IN NET IMPORTS
Fuel
2007 Net Imports
(Billion Btus)
1% of Net Imports
(Billion Btus) Equivalent
Amount Units
Market Value
($Million) Natural gas 190,399 1,904 1,851,420 MCF $12.8
Electricity 109,472 1,095 320,750 MWh $20.1
CHANGE IN NET EXPORTS
Fuel
2007 Net Exports
(Billion Btus)
1% of Net Exports (Billion Btus)
Equivalent Amount Units
Market Value
($Million) Coal 364,609 3,646 136,227 Tons $6.8
Thermal conversion factors: 1 cubic foot natural gas = 1,028.4 Btus; 1 kWh electricity = 3,413 Btus; 1 lb coal = 12,867.4 Btus
15 EIA, State Energy Data System. Energy Consumption Estimates by Source, Virginia, http://www.eia.doe.gov/emeu/states/hf.jsp?incfile=sep_use/total/use_tot_va.html&mstate=VIRGINIA
Section 1 – General Energy Information Page 1-6

Energy Consumption and Production Forecasts
Future energy use depends on population growth, personal income and economic activity, use of transportation, development of new products, and implementation of energy efficiency and conservation practices.
Virginia’s energy consumption is expected to grow at its historic long-term rate of about 1.5 percent per year.
Virginia will need to grow its energy supply by 14.6 percent (397.8 trillion Btus) to meet the growing energy demand through 2020.
Table 1-3: Energy Production and Consumption Forecasts for Virginia (Trillion Btus) 16
Year Consumption Growth Primary
Production Growth Gap/Imports Growth
1995 2144.3 1355.5 788.8
1996 2207.8 2.9% 1415.7 4.3% 792.1 0.4%
1997 2213.1 0.2% 1425.1 0.7% 788 -0.5%
1998 2242.6 1.3% 1374.5 -3.7% 868.1 9.2%
1999 2296.5 2.3% 1346 -2.1% 950.5 8.7%
2000 2384.7 3.7% 1353.9 0.6% 1030.8 7.8%
2001 2317.5 -2.9% 1300.1 -4.1% 1017.4 -1.3%
2002 2341.8 1.0% 1235.7 -5.2% 1106.1 8.0%
2003 2422.7 3.3% 1339.7 7.8% 1083 -2.1%
2004 2547.3 4.9% 1311.8 -2.1% 1235.5 12.3%
2005 2605.2 2.2% 1221.8 -7.4% 1383.4 10.7%
2006 2546.3 -2.3% 1279.9 4.5% 1266.4 -9.2%
2007 2610.9 2.5% 1173.1 -9.1% 1437.8 11.9%
2008 2650.68 1.5% 1147.9 -2.2% 1502.78 4.3%
2009 2690.46 1.5% 1122.7 -2.2% 1567.76 4.1%
2010 2730.24 1.5% 1122 -0.1% 1608.24 2.5%
2011 2770.02 1.4% 1122 0.0% 1648.02 2.4%
2012 2809.8 1.4% 1122 0.0% 1687.8 2.4%
2013 2849.58 1.4% 1122 0.0% 1727.58 2.3%
2014 2889.36 1.4% 1122 0.0% 1767.36 2.3%
2015 2929.14 1.4% 1122 0.0% 1807.14 2.2%
2016 2968.92 1.3% 1122 0.0% 1846.92 2.2%
2017 3008.7 1.3% 1122 0.0% 1886.7 2.1%
2018 3048.48 1.3% 1122 0.0% 1926.48 2.1%
2019 3088.26 1.3% 1122 0.0% 1966.26 2.0%
2020 3128.04 1.3% 1122 0.0% 2006.04 2.0%
16 EIA, State Energy Data System, Virginia, http://www.eia.doe.gov/emeu/states/state.html?q_state_a=va&q_state=VIRGINIA
Section 1 – General Energy Information Page 1-7

Energy Infrastructure A robust infrastructure is needed to deliver affordable, reliable energy supplies to energy users. Virginia’s energy infrastructure (see Figure 4-1) includes facilities required for:
Electricity generation, transmission, and distribution;
Natural gas production, transmission, and storage;
Petroleum production, refining, transportation, and distribution;
Coal mining, transportation, and export;
Propane production, transportation, and distribution; and
Wood/biomass production and transportation.
Figure 1-10: Virginia’s Energy Infrastructure17
17 EIA, State Energy Profile, Virginia, http://tonto.eia.doe.gov/state/state_energy_profiles.cfm?sid=VA
Section 1 – General Energy Information Page 1-8
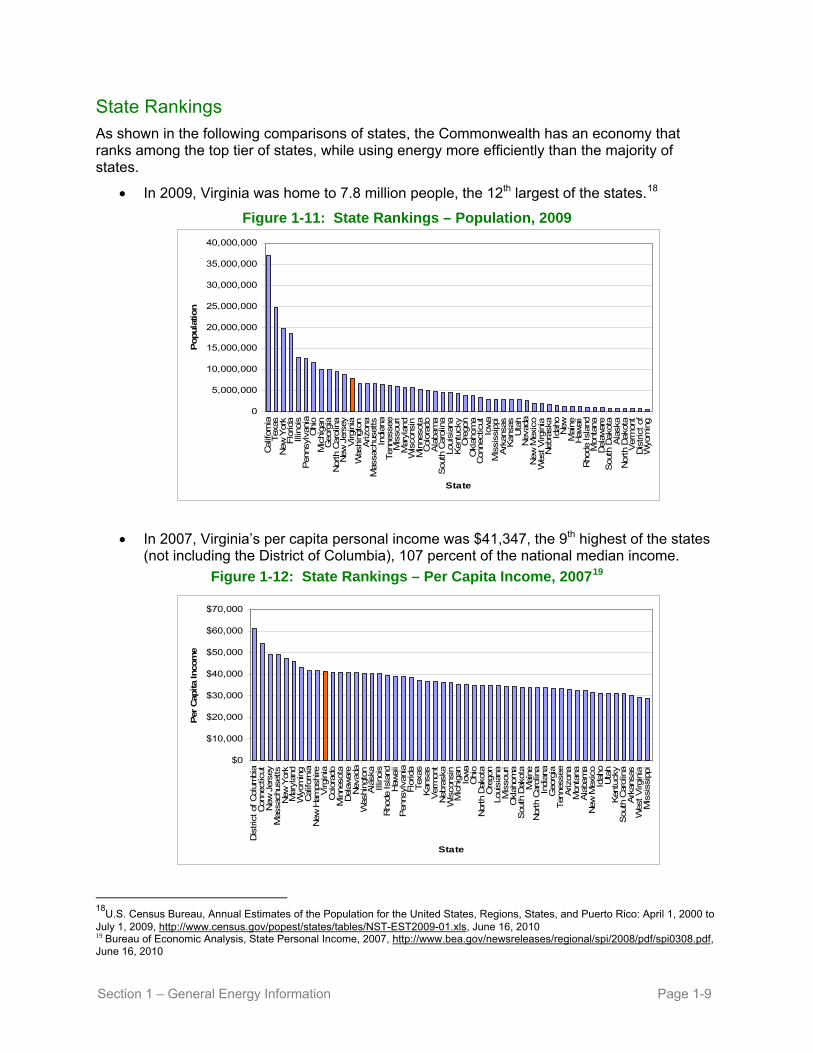
State Rankings As shown in the following comparisons of states, the Commonwealth has an economy that ranks among the top tier of states, while using energy more efficiently than the majority of states.
In 2009, Virginia was home to 7.8 million people, the 12th largest of the states.18
Figure 1-11: State Rankings – Population, 2009
0
5,000,000
10,000,000
15,000,000
20,000,000
25,000,000
30,000,000
35,000,000
40,000,000
Cal
iforn
iaTex
asN
ew Y
ork
Flo
rida
Illin
ois
Pen
nsyl
vani
aO
hio
Mic
higa
nG
eorg
iaN
orth
Car
olin
aN
ew J
erse
yV
irgin
iaW
ashi
ngto
nA
rizon
aM
assa
chus
etts
Indi
ana
Ten
ness
eeM
isso
uri
Mar
ylan
dW
isco
nsin
Min
neso
taC
olor
ado
Ala
bam
aS
outh
Car
olin
aLo
uisi
ana
Ken
tuck
yO
rego
nO
klah
oma
Con
nect
icut
Iow
aM
issi
ssip
piA
rkan
sas
Kan
sas
Uta
hN
evad
aN
ew M
exic
oW
est V
irgin
iaN
ebra
ska
Idah
oN
ewM
aine
Haw
aii
Rho
de Isl
and
Mon
tana
Del
awar
eS
outh
Dak
ota
Ala
ska
Nor
th D
akot
aV
erm
ont
Dis
tric
t of
Wyo
min
g
State
Popula
tion
In 2007, Virginia’s per capita personal income was $41,347, the 9th highest of the states (not including the District of Columbia), 107 percent of the national median income.
Figure 1-12: State Rankings – Per Capita Income, 200719
$0
$10,000
$20,000
$30,000
$40,000
$50,000
$60,000
$70,000
Dis
tric
t of
Col
umbi
aC
onne
ctic
utN
ew J
erse
yM
assa
chus
etts
New
Yor
kM
aryl
and
Wyo
min
gC
alifo
rnia
New
Ham
pshi
reV
irgin
iaC
olor
ado
Min
neso
taD
elaw
are
Nev
ada
Was
hing
ton
Ala
ska
Illin
ois
Rho
de Isl
and
Haw
aii
Pen
nsyl
vani
aFlo
rida
Tex
asK
ansa
sV
erm
ont
Neb
rask
aW
isco
nsin
Mic
higa
nIo
wa
Ohi
oN
orth
Dak
ota
Ore
gon
Loui
sian
aM
isso
uri
Okl
ahom
aS
outh
Dak
ota
Mai
neN
orth
Car
olin
aIn
dian
aG
eorg
iaTen
ness
eeA
rizon
aM
onta
naA
laba
ma
New
Mex
ico
Idah
oU
tah
Ken
tuck
yS
outh
Car
olin
aA
rkan
sas
Wes
t V
irgin
iaM
issi
ssip
pi
State
Per
Cap
ita
Inco
me
18
U.S. Census Bureau, Annual Estimates of the Population for the United States, Regions, States, and Puerto Rico: April 1, 2000 to July 1, 2009, http://www.census.gov/popest/states/tables/NST-EST2009-01.xls, June 16, 2010 19 Bureau of Economic Analysis, State Personal Income, 2007, http://www.bea.gov/newsreleases/regional/spi/2008/pdf/spi0308.pdf, June 16, 2010
Section 1 – General Energy Information Page 1-9

In 2007, Virginia’s gross domestic product (GDP) was $320 billion, 12th among the
states, 143 percent of the average state GDP.
Figure 1-13: State Rankings – Gross Domestic Product, 200720
$0
$200,000
$400,000
$600,000
$800,000
$1,000,000
$1,200,000
$1,400,000
$1,600,000
$1,800,000
Cal
iforn
iaNew
Yor
kTex
asFlo
rida
Illin
ois
Pen
nsyl
vani
aO
hio
New
Jer
sey
Geo
rgia
Mic
higa
nN
orth
Car
olin
aVirg
inia
Mas
sach
uset
tsW
ashi
ngto
nM
aryl
and
Min
neso
taAriz
ona
Indi
ana
Ten
ness
eeCol
orad
oW
isco
nsin
Mis
sour
iCon
nect
icut
Ore
gon
Loui
sian
aAla
bam
aK
entu
cky
Sou
th C
arol
ina
Iow
aO
klah
oma
Nev
ada
Kan
sas
Uta
hA
rkan
sas
Dis
tric
t of
Mis
siss
ippi
Neb
rask
aNew
Mex
ico
Del
awar
eNew
Haw
aii
Idah
oW
est Virg
inia
Mai
neRho
de Isl
and
Ala
ska
Sou
th D
akot
aM
onta
naNor
th D
akot
aVer
mon
tW
yom
ing
State
Gro
ss D
om
estic
Pro
duct
(M
illions)
In 2007, Virginia ranked 14th in total energy consumption, using 2,611 trillion Btu’s of energy, 131 percent of the average state’s energy consumption.
Figure 1-14: State Rankings - Total Energy Consumption, 200721
0.0
2,000.0
4,000.0
6,000.0
8,000.0
10,000.0
12,000.0
14,000.0
Tex
asCal
iforn
iaFlo
rida
New
Yor
kO
hio
Illin
ois
Pen
nsyl
vani
aLo
uisi
ana
Geo
rgia
Mic
higa
nIn
dian
aNew
Jer
sey
Nor
th C
arol
ina
Virg
inia
Ten
ness
eeAla
bam
aW
ashi
ngto
nKen
tuck
yM
isso
uri
Min
neso
taW
isco
nsin
Sou
th C
arol
ina
Okl
ahom
aAriz
ona
Mas
sach
uset
tsM
aryl
and
Col
orad
oM
issi
ssip
piIo
wa
Ark
ansa
sKan
sas
Ore
gon
Con
nect
icut
Wes
t Virg
inia
Uta
hNev
ada
Ala
ska
New
Mex
ico
Neb
rask
aId
aho
Wyo
min
gM
onta
naM
aine
Nor
th D
akot
aHaw
aii
New
Del
awar
eSou
th D
akot
aRho
de Isl
and
Dis
tric
t of
Ver
mon
t
State
Tota
l Ener
gy
Use
(Trillio
n B
TU)
20 http://www.bea.gov/scb/pdf/2009/06%20June/0609_gdp_state.pdf, June 16, 2010 21 EIA, Total Energy Consumption by Sector, Ranked by State, 2007, http://www.eia.doe.gov/emeu/states/sep_sum/html/pdf/rank_use.pdf
Section 1 – General Energy Information Page 1-10

In 2007, Virginia ranked 26th in energy use per capita among the states, using 339 million Btu’s per person, 100.7 percent of the national average.
Figure 1-15: State Rankings - Energy Use Per Capita, 200722
0.0
200.0
400.0
600.0
800.0
1,000.0
1,200.0
Ala
ska
Wyo
min
gLo
uisi
ana
Nor
th D
akot
aTex
asM
onta
naK
entu
cky
Wes
t V
irgin
iaA
laba
ma
Indi
ana
Okl
ahom
aM
issi
ssip
piIo
wa
Kan
sas
Ark
ansa
sN
ebra
ska
Sou
th C
arol
ina
Ten
ness
eeS
outh
Dak
ota
New
Mex
ico
Min
neso
taId
aho
Ohi
oD
elaw
are
Mai
neV
irgin
iaM
isso
uri
Wis
cons
inG
eorg
iaP
enns
ylva
nia
Was
hing
ton
Dis
tric
t of
New
Jer
sey
Illin
ois
Col
orad
oN
evad
aU
tah
Mic
higa
nN
orth
Car
olin
aO
rego
nH
awai
iM
aryl
and
Ver
mon
tFlo
rida
Con
nect
icut
Ariz
ona
New
Ham
pshi
reM
assa
chus
etts
Cal
iforn
iaN
ew Y
ork
Rho
de Isl
and
State
Tota
l C
onsu
mption p
er C
apita
In 2007, Virginia ranked 31st (tied with North Carolina) in energy use per gross domestic product, using 8,200 Btus per dollar of GDP, 92 percent of the national amount of energy per GDP.
Figure 1-16: State Rankings - Energy Use Per Gross Domestic Product (GDP), 200723
0.0
5.0
10.0
15.0
20.0
25.0
30.0
Loui
sian
aW
yom
ing
Ala
ska
Nor
th D
akot
aW
est V
irgin
iaM
issi
ssip
piM
onta
naK
entu
cky
Ala
bam
aO
klah
oma
Ark
ansa
sIn
dian
aS
outh
Car
olin
aTex
asK
ansa
sN
ew M
exic
oId
aho
Iow
aM
aine
Ten
ness
eeN
ebra
ska
Ohi
oM
isso
uri
Sou
th D
akot
aG
eorg
iaW
isco
nsin
Uta
hM
ichi
gan
Pen
nsyl
vani
aM
inne
sota
Nor
th C
arol
ina
Virg
inia
Was
hing
ton
Illin
ois
Ore
gon
Ver
mon
tA
rizon
aC
olor
ado
Flo
rida
Nev
ada
New
Jer
sey
Haw
aii
Mar
ylan
dN
ewD
elaw
are
Rho
de Isl
and
Cal
iforn
iaC
onne
ctic
utM
assa
chus
etts
New
Yor
kD
istric
t of
State
Ener
gy
Use
per
GD
P
22 http://www.eia.doe.gov/emeu/states/sep_sum/plain_html/rank_use_per_cap.html, June 16, 2010 23 http://www.eia.doe.gov/emeu/states/_seds.html, Data: http://www.eia.doe.gov/emeu/states/sep_sum/html/pdf/rank_use_gdp.pdf, June 16, 2010
Section 1 – General Energy Information Page 1-11

In 2007, Virginians used more energy for transportation than in any other sector, ranking 10th among the states in total energy used for transportation. Virginia ranks 28th in vehicle mile per capita, at 96 percent of the national average. Transportation energy use has risen at a greater rate than energy use in other sectors.
Figure 1-17: State Rankings – Energy Use for Transportation, 200724
0.0
500.0
1,000.0
1,500.0
2,000.0
2,500.0
3,000.0
3,500.0
4,000.0
Cal
iforn
iaTex
asFlo
rida
New
Yor
kIll
inoi
sO
hio
New
Jer
sey
Pen
nsyl
vani
aG
eorg
iaV
irgin
iaM
ichi
gan
Nor
th C
arol
ina
Loui
sian
aW
ashi
ngto
nTen
ness
eeIn
dian
aM
isso
uri
Ariz
ona
Min
neso
taA
laba
ma
Ken
tuck
yM
assa
chus
etts
Okl
ahom
aM
aryl
and
Sou
th C
arol
ina
Wis
cons
inC
olor
ado
Mis
siss
ippi
Ore
gon
Iow
aA
rkan
sas
Kan
sas
Uta
hC
onne
ctic
utN
evad
aA
lask
aN
ew M
exic
oH
awai
iW
est V
irgin
iaN
ebra
ska
Idah
oM
onta
naW
yom
ing
Mai
neN
ew H
amps
hire
Nor
th D
akot
aS
outh
Dak
ota
Del
awar
eR
hode
Isl
and
Ver
mon
tD
istric
t of
Col
umbi
a
State
Ener
gy
Use
for
Tra
nsp
ort
atio
n (Tri
llio
n B
TU
)
In 2007, Virginia produced more energy than most states, ranking 15th among the states.
Figure 1-18: State Rankings – In-State Energy Production25
0.00
2,000.00
4,000.00
6,000.00
8,000.00
10,000.00
12,000.00
Tex
asW
yom
ing
Loui
sian
aW
est V
irgin
iaK
entu
cky
Cal
iforn
iaP
enns
ylva
nia
New
Mex
ico
Okl
ahom
aC
olor
ado
Ala
ska
Illin
ois
Ala
bam
aM
onta
naV
irgin
iaU
tah
Was
hing
ton
Ohi
oIn
dian
aN
ew Y
ork
Kan
sas
Mic
higa
nN
orth
Dak
ota
Sou
th C
arol
ina
Ark
ansa
sG
eorg
iaA
rizon
aN
orth
Car
olin
aFlo
rida
Ten
ness
eeM
issi
ssip
piIo
wa
Ore
gon
New
Jer
sey
Neb
rask
aM
inne
sota
Wis
cons
inM
aryl
and
Con
nect
icut
Mai
neM
isso
uri
New
Sou
th D
akot
aId
aho
Mas
sach
uset
tsV
erm
ont
Nev
ada
Haw
aii
Rho
de Isl
and
Del
awar
eD
istric
t of
State
In-S
tate
Ener
gy
Pro
duct
ion (Tri
llio
n B
TU
)
24 http://www.eia.doe.gov/emeu/states/sep_sum/html/pdf/rank_use.pdf, June 16, 2010 25 http://tonto.eia.doe.gov/state/state_energy_rankings.cfm?keyid=89&orderid=1, June 16, 2010
Section 1 – General Energy Information Page 1-12

Section 2 - Electricity Page 2-1
SECTION 2 - ELECTRICITY Virginia’s Electric Providers
• Electricity is provided to retail electric customers by:
o Three investor-owned utilities providing 84.2 percent of retail sales;
o Thirteen electric cooperatives providing 11.3 percent of retail sales; and
o Eight municipal utilities providing 4.5 percent of retail sales.
• Investor-owned electric utilities include:
o Dominion Virginia Power;
o Appalachian Power (American Electric Power); and
o Old Dominion Power (Kentucky Utilities).
• The 16 municipal electric utilities, serving customers located in their localities, include:
o The Cities of Bedford, Bristol, Danville, Franklin, Harrisonburg, Manassas, Martinsville, Radford, and Salem;
o The Towns of Blackstone, Culpeper, Elkton, Front Royal, Richlands, and Wakefield; and
o Virginia Tech (serving the Town of Blacksburg).
Figure 2-1: Electric Utility Service Territories1
1 SCC, http://www.scc.virginia.gov/pue/elec/map.aspx, June 24, 2010. Shows Allegheny Power service territory which was transferred in 2010 to Rappahannock and Shenandoah Valley Electric Cooperatives.

Section 2 - Electricity Page 2-2
Electric Consumption
• Virginians consumed 110 million megawatt hours of electricity in 2008.
• Electricity use has grown by approximately 3 percent per year over the last 10 years, with about two thirds of the growth attributable to new customers and one third to growth in use per customer.
• Growth is not uniform across the state, most being in the Northern Virginia, Hampton Roads, and Richmond areas.
Table 2-1: Electricity Sales by Type of Utility2
Full Service Providers Other
Provider
Item Investor-Owned
Public Cooperative Energy Total
Number of Entities 3 16 13 1 35 Number of Retail
Customers 2,816,469 161,822 599,435 1,157 3,578,883
Retail Sales (thousand MWh) 92,727 4,960 12,404 16 110,106
Percentage of Retail Sales 84.21 4.50 11.27 0.01 100.00
Revenue from Retail Sales (million $) 6,970 418 1,418 2 8,809 Percentage of
Revenue 79.12 4.75 16.10 0.02 100.00
Average Retail Price (cents/kWh) 7.60 8.44 11.44 10.50 8.00
Table 2-2: Electricity Sales - Top Four Retailers of Electricity in Virginia3
Entity Type of Provider
All Sectors Residential Commercial Industrial Transportation
1. Dominion Investor-Owned 74,453 28,082 38,113 8,064 194
2. Appalachian Power Investor-Owned 16,350 6,638 4,161 5,551 0
3. Rappahannock Coop Cooperative 4,055 2,077 505 1,473 0 4. NOVEC Cooperative 3,230 1,888 905 438 0
Total, Top Four 99,656 39,363 44,066 16,033 194 Total State Sales 110,106 44,597 46,878 18,438 194
% Total State Sales 91 88 94 87 100 (Thousand megawatt hours)
2 Adapted from EIA, State Electricity Profile, Retail Electricity Sales Statistics, 2008 http://www.eia.doe.gov/cneaf/electricity/st_profiles/sept09va.xls, June 18, 2010. Data modified to show sales provided by cooperatives for customers formerly served by Allegheny Power. 3 Adapted from EIA, State Electricity Profile, Top Five Retailers of Electricity, with End Use Sectors, 2008, http://www.eia.doe.gov/cneaf/electricity/st_profiles/sept03va.xls, June 18, 2010. Data modified to show sales provided by cooperatives for customers formerly served by Allegheny Power.

Section 2 - Electricity Page 2-3
• Virginia’s utilities serve major military bases, one of the largest ports in the United States, and a large share of the computer infrastructure supporting the Internet and centralized computing. This results in a greater commercial load in Virginia than in many other states.
Figure 2-2: Percent of Retail Electric Sales by Customer Class, 20084
40.5%
42.6%
16.7%
0.2%
Residential
Commercial
Industrial
Transportation
Virginia’s Electric Utility Regulatory Structure
• Virginia re-regulated electricity in 2007. Electricity is provided pursuant to a modified cost of service regulated monopoly system. Utilities serve exclusive territories and have an obligation to serve. Rates and terms of service for investor-owned utilities and electric cooperatives are subject to State Corporation Commission (SCC) review.5
o Utilities are entitled to recover their reasonable and prudent operating expenses and earn up to a reasonable rate of return on the value of their capital investment in generating plants, transmission and distribution systems, and other facilities.
o Calculation of a reasonable rate of return includes a comparison to the rates of return for peer electric utilities in the Southeastern United States.
o Base rates are reviewed every two years.
o Rates of return can be increased or decreased based on a utility’s performance.
o Additions to base rates are permitted through application of rate adjustment clauses which allow the recovery of costs for:
Fuel and purchased power (fuel adjustment clause); Transmission, as approved by the Federal Energy Regulatory Commission; Environmental and reliability improvements; Energy efficiency programs;
4 EIA, Virginia Electricity Profile, Table 8, Retail Sales, Revenue, and Average Retail Price by Sector, 1990 Through 2008. http://www.eia.doe.gov/cneaf/electricity/st_profiles/sept08va.xls, May 7, 2010 5 Virginia Electric Utility Regulation Act, Chapter 23 of Title 56 of the Code of Virginia, http://leg1.state.va.us/cgi-bin/legp504.exe?000+cod+TOC56000000023000000000000, June 19, 2010

Section 2 - Electricity Page 2-4
Renewable energy needed to meet the state’s renewable portfolio standard; Cost of new generating facilities; and A financial emergency.
• Electric cooperatives are authorized to increase or decrease rates by 5 percent in a three-year period (not including fuel factor adjustments) without SCC approval.
• Investor-owned electric utilities are also required to complete a 15-year Integrated Resource Plan (IRP) that sets out how the utilities will meet their customers’ future demands for electricity and maintain adequate and reliable service. IRPs are to be updated every two years.6
• Electric utilities are required to be members of a regional transmission organization (RTO). The PJM Interconnection serves as the RTO for Virginia and areas to the north and west. PJM operates the largest centrally dispatched electric grid in the world by coordinating the movement of electricity in thirteen states.
• Rates and terms of service for municipal electric utilities are set by each City or Town Council.
Reliability Requirements
• Virginia’s utilities must meet national standards established by the North American Electricity Reliability Council (NAERC) to ensure the reliability of electric service. Virginia is included in two regions of the North American Electricity Reliability Council.
o The Southeastern Electric Reliability Council (SERC) that covers the Dominion region; and
o The Reliability First Corporation (RFC, successor to the East Central Area Reliability Council) that covers the Appalachian Power region in Virginia.
Figure 2-3: North American Electric Reliability Council (NAERC) Regions7
6 Electric Utility Integrated Resource Planning, Chapter 24 of Title 56 of the Code of Virginia, http://leg6.state.va.us/cgi-bin/legp604.exe?000+cod+TOC56000000024000000000000, June 24, 2010 7 Solcomhouse, The US Power Grid, http://www.solcomhouse.com/uspowergrid.htm, June 19, 2010

Section 2 - Electricity Page 2-5
Electric Generation • Virginia’s utilities use a mix of utility-owned in-state generation, out-of-state generation,
contractual purchases of electricity from in-state and out-of-state producers, and spot purchases of electricity from the PJM wholesale market to meet customer loads.
• Approximately one-third of Virginia’s electric supply comes from power generated out of state. Most imports come from coal-fired plants located west and north of Virginia. A small amount of imports comes from renewable projects such as wind projects in West Virginia, Illinois, and Indiana.
• Electric generation is measured two ways, net generation and generation capacity.
o Net generation is the amount of electricity generated over time. It is expressed in megawatt hours (MWh).
o Generation capacity is the amount of electricity that can be generated at any one time. It is expressed in megawatts (MW).
Net Generation
• Virginia’s electricity generation facilities produced 72,678,531 megawatt hours of electricity in 2008.
o 59,780,402 megawatt hours (82 percent) were generated in plants operated by electric utilities; and
o 12,898,129 megawatt hours (18 percent) were generated in plants operated by independent power producers and industrial combined heat and power facilities.
• Electricity is generated from diverse sources. Significant amounts of power come from coal, nuclear, and natural gas, with small amounts from renewable sources and petroleum.
Figure 2-4: In-State Net Generation by Fuel Type, 20088
8 EIA, State Electricity Profile, http://www.eia.doe.gov/cneaf/electricity/st_profiles/sept05va.xls, May 11, 2010
43.7%
38.4%
12.8%
3.4%1.6%
Coal
Nuclear
Natural Gas
Renewables
Petroleum

Section 2 - Electricity Page 2-6
Generation Capacity
• Dominion, Appalachian Power, and ODEC own power plants in Virginia with a combined peak generation capacity of 18,828 megawatts.
• Municipal utilities have very little generation capacity, purchasing almost all power through long-term, wholesale power contracts.
• Virginia’s merchant and industrial cogeneration plants produce power for the wholesale marketplace and internal industrial use. These have a generation capacity of 4,648 megawatts.
• The ten largest power plants in size make up 60 percent of the generation capacity in the state.
Figure 2-5: Virginia Electric Generating Capability (MW) by Fuel Type, 20089
6773%
6913%
2,41810%
3,16113%
3,40415% 5,773
25%
7,35131%
Natural Gas
Coal
Nuclear
Pumped Storage
Petroleum
Hydroelectric
Other Renew ables
Table 2-3: Ten Largest Plants by Generation Capacity
9 EIA, State Electricity Profiles, http://www.eia.doe.gov/cneaf/electricity/st_profiles/sept04va.xls, May 11, 2010
Plant Primary Energy
Source or Technology
Operating Company Net Summer
Capacity (MW)
1. Bath County Pumped Storage Virginia Electric & Power Co 2,923 2. North Anna Nuclear Virginia Electric & Power Co 1,807
3. Possum Point Gas Virginia Electric & Power Co 1,733 4. Chesterfield Coal Virginia Electric & Power Co 1,632
5. Surry Nuclear Virginia Electric & Power Co 1,598 6. Yorktown Coal Virginia Electric & Power Co 1,141
7. Tenaska VA Gen Sta Gas Tenaska Virginia Partners LP 935 8. Clover Coal Virginia Electric & Power Co 865
9. Doswell Energy Center Gas Doswell Ltd Partnership 820 10. Chesapeake Coal Virginia Electric & Power Co 710
TOTAL 14,164
Section 2 - Electricity Page 2-7
◦ Virginia City
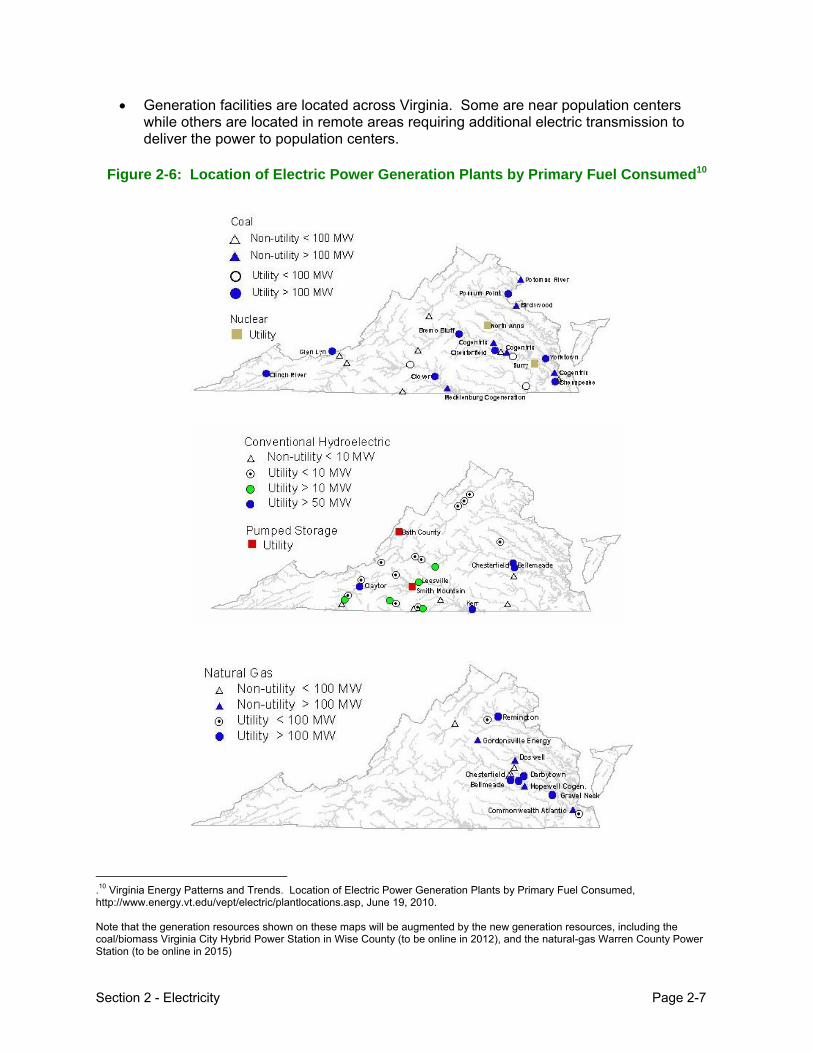
• Generation facilities are located across Virginia. Some are near population centers while others are located in remote areas requiring additional electric transmission to deliver the power to population centers.
Figure 2-6: Location of Electric Power Generation Plants by Primary Fuel Consumed10
.10 Virginia Energy Patterns and Trends. Location of Electric Power Generation Plants by Primary Fuel Consumed, http://www.energy.vt.edu/vept/electric/plantlocations.asp, June 19, 2010. Note that the generation resources shown on these maps will be augmented by the new generation resources, including the coal/biomass Virginia City Hybrid Power Station in Wise County (to be online in 2012), and the natural-gas Warren County Power Station (to be online in 2015)

Section 2 - Electricity Page 2-8
Renewable Portfolio Standard
• Virginia established a voluntary renewable portfolio standard (RPS) for investor-owned utilities to provide increasing amounts of electricity from renewable resources. Targets, measured against 2007 base load sales (total less sales attributable to nuclear generation), are:
o 4 percent by 2010; o 7 percent by 2016; o 12 percent by 2022; and o 15 percent by 2025.
• A utility is eligible to earn an enhanced rate of return of up to 50 basis points if it meets the RPS targets and is not receiving a separate performance incentive for overall utility operations.
• Utility RPS plans and cost recovery are subject to SCC approval.
Table 2-4: Generation Needed to Meet RPS Targets (MWh)11
Utility Base Line 2010 Target 2016 Target 2022 Target 2025 Target
Dominion 43,318,649 1,732,746 3,032,305 5,198,238 6,497,797
Appalachian 16,377,000 655,080 1,146,390 1,965,240 2,456,550
11 Sourced from applications for approval of Renewable Portfolio Standards filed with the State Corporation Commission in case numbers PUE-2008-00003 (Appalachian Power) and PUE-2009-00082 (Dominion Power).

Section 2 - Electricity Page 2-9
Generating Plant Loading Order
• PJM is the regional transmission organization (RTO) serving Virginia and areas to the north and west. PJM works with electric generators and utilities to operate the wholesale electric market and ensure reliable sources of electricity are available in the region.
• PJM selects which power plants are needed to meet electric loads based on plant availability and cost and capacity to deliver the electricity from the generating plant to load centers.
• Generation owners bid generation and demand side management capacity into the PJM marketplace. PJM selects the lowest cost resources first, and moves up the cost curve until the demand is satisfied.
• The cost bid for the last plant needed to meet demand sets the price for all electricity delivered during the bid period.
• This process results in the following mix of fuel types being used to supply power in the PJM system.
Table 2-8: PJM – Electric Generation by Fuel Type, CY 200912
Electricity Imports
• Virginia utilities do not own in-state generation capacity sufficient to meet the state’s peak load plus the reserve capacity required by federal regulation.
• It is sometimes less expensive to purchase electricity on the wholesale market than to generate the electricity at in-state, utility-owned facilities.
12 PJM. 2009 Year in Review

Section 2 - Electricity Page 2-10
• These factors resulted in Virginia importing 34 percent of electricity consumed in the state during 2008.
• As demand has grown faster than additions to generation, imports have increased by an average of 1.4 percent per year over the last 10 years.
• Virginia’s imports come from:
o Dominion’s 1,632 megawatts Mount Storm electric generating station in West Virginia dedicated to serving Dominion’s customers;
o American Electric Power’s generating plants dedicated to serving AEP customers;
o Kentucky Utility’s generating plants dedicated to serving KU customers; and
o Generating plants not dedicated to serve only Virginia customers, primarily located in the PJM Interconnection area that runs from Virginia north to New Jersey and west to Illinois.
Figure 2-8: Virginia’s Net Electricity Imports, 1990–200813
Electric Rates
• Virginia’s electric rates vary among the state’s electric utilities14, but on average have historically remained below the national average.
13 EIA. State Electric Profiles, Virginia, http://www.eia.doe.gov/cneaf/electricity/st_profiles/virginia.html 14 See http://dls.state.va.us/GROUPS/elecutil/12_14_09/rates.pdf for data on residential electric rates for individual Virginia electric utilities
Section 2 - Electricity Page 2-11
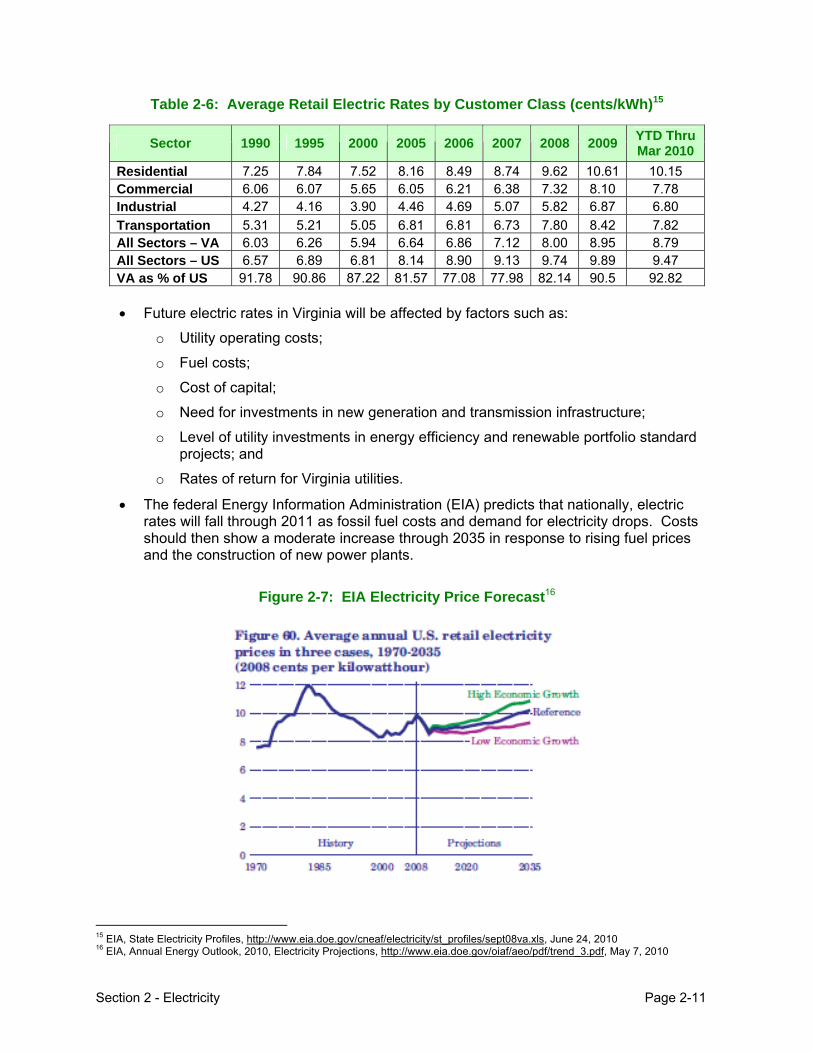
Table 2-6: Average Retail Electric Rates by Customer Class (cents/kWh)15
• Future electric rates in Virginia will be affected by factors such as:
o Utility operating costs;
o Fuel costs;
o Cost of capital;
o Need for investments in new generation and transmission infrastructure;
o Level of utility investments in energy efficiency and renewable portfolio standard projects; and
o Rates of return for Virginia utilities.
• The federal Energy Information Administration (EIA) predicts that nationally, electric rates will fall through 2011 as fossil fuel costs and demand for electricity drops. Costs should then show a moderate increase through 2035 in response to rising fuel prices and the construction of new power plants.
Figure 2-7: EIA Electricity Price Forecast16
15 EIA, State Electricity Profiles, http://www.eia.doe.gov/cneaf/electricity/st_profiles/sept08va.xls, June 24, 2010 16 EIA, Annual Energy Outlook, 2010, Electricity Projections, http://www.eia.doe.gov/oiaf/aeo/pdf/trend_3.pdf, May 7, 2010
Sector 1990 1995 2000 2005 2006 2007 2008 2009 YTD Thru Mar 2010
Residential 7.25 7.84 7.52 8.16 8.49 8.74 9.62 10.61 10.15 Commercial 6.06 6.07 5.65 6.05 6.21 6.38 7.32 8.10 7.78 Industrial 4.27 4.16 3.90 4.46 4.69 5.07 5.82 6.87 6.80
Transportation 5.31 5.21 5.05 6.81 6.81 6.73 7.80 8.42 7.82 All Sectors – VA 6.03 6.26 5.94 6.64 6.86 7.12 8.00 8.95 8.79 All Sectors – US 6.57 6.89 6.81 8.14 8.90 9.13 9.74 9.89 9.47 VA as % of US 91.78 90.86 87.22 81.57 77.08 77.98 82.14 90.5 92.82

Section 2 - Electricity Page 2-12
Factors Affecting Electric Generation Costs
• Electric generating costs vary based on the type and age of generating plants, the size of the plants, capital costs and the amount that has been depreciated, the cost of fuel and personnel, and other operational costs.
o Older plants typically have lower costs. However, these plants may be more expensive if substantial environmental controls have to be added.
o Larger plants generally offer an economy of scale due to spreading infrastructure and personnel costs over larger amounts of generation.
o Fuel costs vary by fuel type. The relative cost of fuel also varies over time. Fuel costs are typically compared on a cost per million Btu input.
o Differing types of electric generating plants require different amounts of manpower. Some plants, such as peaking natural gas plants, can operate with few, if any, workers present. Others, such as a biomass or coal plants, require larger numbers of workers to manage fuel, environmental controls, and ash.
Table 2-7: Average Wholesale Cost of Power by Power Plant Type (cents/kWh), 200817
Plant Type 2008 Costs
Operation Nuclear 0.968
Coal, and Oil 0.365 Hydroelectric 0.578
Gas Turbine and Small Scale 0.298 Maintenance
Nuclear 0.620 Coal and Oil 0.359 Hydroelectric 0.389
Gas Turbine and Small Scale 2.072 Fuel
Nuclear 0.529 Coal and Oil 2.843 Hydroelectric 0
Gas Turbine and Small Scale 6.423 Total
Nuclear 2.116 Coal and Oil 3.567 Hydroelectric 0.967
Gas Turbine and Small Scale 6.993
17 EIA. Electric Power Annual. Average Power Plant Operating Expenses for Major U.S. Investor-Owned Electric Utilities, http://www.eia.doe.gov/cneaf/electricity/epa/epat8p2.html, June 19, 2010

Section 2 - Electricity Page 2-13
Table 2-8: Average Delivered Cost of Fossil Fuel to Utility Power Plants ($/MMBtu),
200818
Electric Power Sector
Type of Fuel Total All Sectors Electric
Utilities
Independent Power
Producers
Bituminous Coal 2.50 2.49 2.50
Petroleum 10.87 12.38 9.03
Natural Gas 9.02 9.15 8.94
Wholesale Electricity Pricing
• Wholesale electric prices in the PJM system are affected by the cost and availability of generation and the availability of transmission capacity to carry power from generating plants to load centers.
• Wholesale prices are higher in areas that do not have sufficient local generation or long-distance transmission capacity to meet peak electric loads as the demand in these areas must be met by local, more costly generating plants. This method of wholesale power pricing is called Locational Marginal Pricing (LMP).
• LMP in coastal areas with more congestion, such as Virginia, generally runs higher than in areas to the west, such as Illinois or Kentucky.
• Utilities in generation and transmission constrained areas must pass higher LMP along to their customers through higher retail rates.
• Wholesale electric costs in the PJM market vary over time as the demand for power grows or shrinks, as input costs such as for fuel change, and as new generation and transmission capacity is added to the region. For example, wholesale electric costs have dropped during 2009 and 2010 as demand and fuel costs have dropped.
18 EIA. Cost and Quality of Fuels for Electric Plants 2007 - 2008 Edition, http://www.eia.doe.gov/cneaf/electricity/cq/cq_sum.html, June 19, 2010

Section 2 - Electricity Page 2-14
Table 2-9: Wholesale Electric Prices (LMP) by State ($/MWh), 2008-200919
Table 2-10: Wholesale Electric (LMP) Prices in PJM ($/MWh), 1998-200920
19 Monitoring Analytics, LLC. 2009 State of the Market Report for PJM, Table 2-57, Page 66 20 Monitoring Analytics, LLC. 2009 State of the Market Report for PJM, Table 2-55, Page 65

Section 2 - Electricity Page 2-15
Cost of New Generation
• Electric generators consider a variety of factors when deciding to build a new generating plant. These factors can be evaluated to calculate a levelized cost of power.
• Factors include:
o Fuel costs and their expected change over time;
o Risk associated with being able to successfully permit and construct each type of plant;
o Time needed to construct the plant;
o Expected life of the plant;
o Cost of capital;
o Capacity factor of the plant; and
o Other.
Table 2-11. Estimated Levelized Cost of New Generation Resources, 201621
21 DOE EIA. 2010 Annual Energy Outlook. 2016 Estimated Levelized Cost of New Generation Resources, http://www.eia.doe.gov/oiaf/aeo/pdf/2016levelized_costs_aeo2010.pdf, June 19, 2010

Section 2 - Electricity Page 2-16
Future Electric Demand
• PJM forecasts of summer peak demand and consumption predict:
o Demand in Dominion’s control area will grow on average 2.5 percent per year over the next 10 years. Consumption is forecast to grow by 2.4 percent per year.
o Demand in Appalachian Power’s control area will grow by 1.3 percent per year. Consumption is forecast to grow by 1.2 percent per year.
• Based on these growth rates, Virginia will need to add over 7,200 megawatts of capacity by 2020 to maintain the same electricity imports ratio of 38 percent as in 2008. Virginia will need to add 11,700 megawatts of capacity to meet 100 percent of projected growth.
• These growth forecasts may increase in the future as the state and national economy recovers, and as the electric market changes due to electric cars, added computing capacity, and other factors.
Table 2-12: Forecast of Peak Electric Demand in Virginia (MW)22
Year Peak In-state
Demand (MW)
Growth at 2.26%
In-state Generation
Capacity (MW) at
38.3% Import Ratio
In-state Gross
Consumption (MWh)
Growth at 2.16%
Consumption (MWh) from
In-state Generation
at 34% Imports
2008 38,052 0 23,476 110,106,000 0 72,679,0002009 38,912 860 24,009 112,484,290 2,378,290 74,239,6312010 39,791 879 24,551 114,913,950 2,429,661 75,843,2072011 40,691 899 25,106 117,396,092 2,482,141 77,481,4202012 41,610 920 25,674 119,931,847 2,535,756 79,155,0192013 42,551 940 26,254 122,522,375 2,590,528 80,864,7682014 43,512 962 26,847 125,168,858 2,646,483 82,611,4472015 44,496 983 27,454 127,872,506 2,703,647 84,395,8542016 45,501 1,006 28,074 130,634,552 2,762,046 86,218,8042017 46,530 1,028 28,709 133,456,258 2,821,706 88,081,1302018 47,581 1,052 29,358 136,338,913 2,882,655 89,983,6832019 48,657 1,075 30,021 139,283,834 2,944,921 91,927,3302020 49,756 1,100 30,700 142,292,365 3,008,531 93,912,961
Integrated Resource Plans
• Electric utilities in Virginia are required to complete an Integrated Resource Plan (IRP) to address how they will meet this growing demand over a 15-year time frame.
• Dominion’s preferred IRP includes adding 7,900 megawatts of generation capacity, nearly 950 megawatts from demand side management programs, and market purchases.23
o Projected new generation capacity would come from the Virginia City coal-biomass hybrid plant under construction and new plants including six natural gas combined cycle, four natural gas combustion turbine, the third North Anna nuclear, two biomass, and four wind facilities.
22 Calculated based on EIA Electricity Profile Supply and Disposition historical data 23 Virginia Electric and Power Company Integrated Resource Plan filed with the Virginia SCC on September 15, 2009

Section 2 - Electricity Page 2-17
• Appalachian Power’s IRP (East Zone) includes adding 4,168 megawatts of generation capacity and 1,346 megawatts from demand side management. This will be offset by planned unit retirements and retrofits lowering capacity by 5,093 megawatts for a net capacity addition of 422 megawatts.24
o Projected new generation capacity would come from completion of the Dresden plant under construction in Ohio; capacity uprates at the Cook nuclear plant in Michigan; and construction of four new fossil fuel plants, biomass co-firing and two new biomass plants, and purchases or additions of wind and solar capacity.
• The Old Dominion Electric Cooperative (which provides wholesale power to its member retail electric cooperatives) is proposing constructing a new coal-fired power plant near Cyprus Creek in Surry County. The Cyprus Creek Power Station would have a capacity between 750 and 1,500 megawatts, and be completed at the earliest by 2018.
Transmission and Distribution of Electricity
• Electricity is delivered to end users through a network of high-voltage transmission and local distribution lines.25
o Electric power is transmitted in Virginia through 230, 500, and 765-kV transmission lines constructed, owned, and operated by Dominion, Appalachian Power, Delmarva Power, and Allegheny Power.
o Transmission lines are typically located above ground. The cost of burying high-voltage transmission lines underground is many times the cost of placing the lines overhead. Underground lines also present higher maintenance challenges and costs.
o Electricity is distributed from the transmission network to end users through a network of smaller, lower-voltage lines and facilities.
o Distribution lines are typically located above ground. Distribution lines can also be placed underground, typically in new development where the incremental cost of burying the lines is lower.
• Electric cooperatives and municipal electric departments do not own any transmission lines.
• Management of and additions to the regional transmission grid are directed by the PJM Interconnection to ensure reliability of the system.
24 Appalachian Power Company’s Integrated Resource Plan filed with the Virginia SCC on September 1, 2009 25 PJM 2009 RTEP Report – Section 12.12, Virginia, http://www.pjm.com/documents/reports/~/media/documents/reports/2009-rtep/2009-section12-12-va.ashx, June 18, 2010

Section 2 - Electricity Page 2-18
Figure 2-9. Virginia’s Electric Transmission System26
• PJM creates a Regional Transmission Expansion Plan (RTEP) to identify the need for new transmission resources. The 2009 RTEP includes four high-voltage lines affecting Virginia.
o Allegheny and Dominion’s 500 kV Trans Allegheny Interstate Line (TrAIL) from the 502 Junction in western Pennsylvania to Loudoun County;
o Dominion’s 500 kV Carson to Suffolk line;
o Allegheny and Appalachian Power’s 765 kV Potomac-Appalachian Transmission Highline (PATH) from Atmos, West Virginia, to Kempstown, Maryland; and
o Pepco’s 500 kV Mid-Atlantic Power Pathway (MAPP) from Possum Point in Virginia to Indian River, Maryland.
• The Virginia SCC must determine and certify the need for and location of proposed new electric transmission lines. The SCC has approved the TrAIL and Carson-Suffolk lines.
• PJM has delayed the schedules for the PATH and MAPP lines due to the 2009-10 drops in electric demand.
26 PJM. PJM 2009 Regional Transmission Expansion Plan, Section 12.12, Virginia RTEP Overview, Map 12-53, Page 321

Section 2 - Electricity Page 2-19
Figure 2-10: PJM 2009 RTEP Approved 765 and 500 kV Facilities27
• The Federal Energy Regulatory Commission (FERC) regulates electric transmission rates. The charges are passed through to Virginia ratepayers on a dollar-for-dollar basis.
• FERC has the authority under the National Interest Electric Transmission Corridor (NIETC) legislation to designate priority electric transmission corridors in transmission constrained areas.
o Based on a U.S. Department of Energy study of transmission needs, FERC has designated two corridors in the Eastern United States with inadequate transmission, one crossing through Northern Virginia.
o If the SCC fails to act on a petition to build a new line in a designated corridor, the applicant to the line could petition FERC to take over jurisdiction for the line.
Conservation and Efficiency
• Electric efficiency actions can be used to reduce future growth in electrical demand.
• Substantial cost-effective investments in energy efficiency remain unmade as there are factors that undercut market forces. These include:
o Principal-agent barriers – the party responsible for the building improvements doesn’t pay electric bills;
27 PJM. PJM 2009 Regional Transmission Expansion Plan, Executive Summary, Map 1.2, Page 6

Section 2 - Electricity Page 2-20
o Information barriers – consumers don’t have sufficient trusted information in order to act;
o Transaction cost barriers – consumers cannot budget or borrow the up front investment needed for energy efficiency projects; and
o Externality cost barriers – benefits of energy efficiency, such as lower utility costs from reduced peak demand, accrue to other people than those making the investments.
• State government has taken a number of actions to overcome these market barriers, including:
o Adoption by the General Assembly of voluntary goals to reduce electric use by 2022, through conservation and efficiency, by an amount equal to 10 percent of 2006 use;
o An Energy Star appliance sales tax holiday over Columbus Day weekend in October;
o An income tax exemption for sales tax paid on certain energy efficiency improvements;
o $15 million in American Recovery and Reinvestment Act (ARRA) State Energy Program funding for energy efficiency rebates;
o $7.4 million in ARRA funds for Energy Star appliance and equipment rebates;
o $94 million in ARRA funds to expand the Weatherization Assistance Program, under which efficiency improvements are made to homes of families earning up to 60 percent of the state medium based on family size;
o $200 million in energy efficiency improvements made to state government facilities;
o Completion of carbon emission inventories and plans to lower carbon emissions. Energy efficiency actions are a primary strategy of these plans; and
o Authorization for local governments to provide property tax and other incentives for:
Energy Star buildings (at least 20 percent more efficient than minimum building code requirements);
Buildings with green roofs and solar energy systems; and
Property Assessed Clean Energy (PACE) or Home Performance with Energy Star programs.
• Virginia’s consumers also benefit from federal incentives and programs that encourage efficiency, such as:
o Federal energy efficiency income tax credits;
o Strengthened minimum equipment efficiency requirements; and
o Expansion of the Energy Star program.
• Conservation and efficiency can offset a portion of future electric load growth. If Virginia’s consumers can meet the state goal to reduce its electricity use by 10 percent, the forecasted peak electric generation capacity would be reduced by 3,285 megawatts.
Section 2 - Electricity Page 2-21
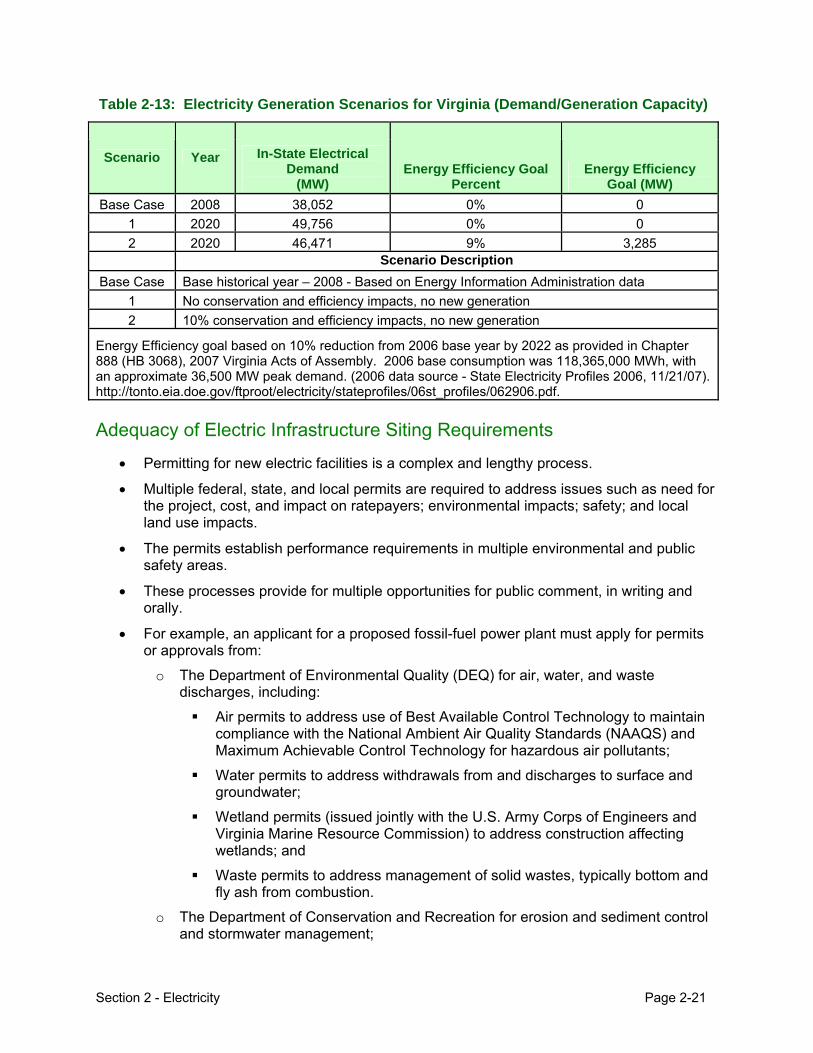
Table 2-13: Electricity Generation Scenarios for Virginia (Demand/Generation Capacity)
Scenario Year In-State Electrical Demand
(MW) Energy Efficiency Goal
Percent Energy Efficiency
Goal (MW)
Base Case 2008 38,052 0% 0
1 2020 49,756 0% 0
2 2020 46,471 9% 3,285 Scenario Description
Base Case Base historical year – 2008 - Based on Energy Information Administration data
1 No conservation and efficiency impacts, no new generation
2 10% conservation and efficiency impacts, no new generation
Energy Efficiency goal based on 10% reduction from 2006 base year by 2022 as provided in Chapter 888 (HB 3068), 2007 Virginia Acts of Assembly. 2006 base consumption was 118,365,000 MWh, with an approximate 36,500 MW peak demand. (2006 data source - State Electricity Profiles 2006, 11/21/07). http://tonto.eia.doe.gov/ftproot/electricity/stateprofiles/06st_profiles/062906.pdf.
Adequacy of Electric Infrastructure Siting Requirements
• Permitting for new electric facilities is a complex and lengthy process.
• Multiple federal, state, and local permits are required to address issues such as need for the project, cost, and impact on ratepayers; environmental impacts; safety; and local land use impacts.
• The permits establish performance requirements in multiple environmental and public safety areas.
• These processes provide for multiple opportunities for public comment, in writing and orally.
• For example, an applicant for a proposed fossil-fuel power plant must apply for permits or approvals from:
o The Department of Environmental Quality (DEQ) for air, water, and waste discharges, including:
Air permits to address use of Best Available Control Technology to maintain compliance with the National Ambient Air Quality Standards (NAAQS) and Maximum Achievable Control Technology for hazardous air pollutants;
Water permits to address withdrawals from and discharges to surface and groundwater;
Wetland permits (issued jointly with the U.S. Army Corps of Engineers and Virginia Marine Resource Commission) to address construction affecting wetlands; and
Waste permits to address management of solid wastes, typically bottom and fly ash from combustion.
o The Department of Conservation and Recreation for erosion and sediment control and stormwater management;

Section 2 - Electricity Page 2-22
o The Departments of Game and Inland Species and Agriculture and Consumer Services for threatened or endangered plant, animal, or insect species;
o The Department of Historic Resources for state and federally-protected historic or other natural or cultural resources;
o The Department of Transportation for access to public highways;
o The SCC which must issue a Certificate of Public Convenience and Necessity showing the need for the project, that the power plant is in the public interest, and that it would not have an excessive rate impact;
o Multiple federal agencies for environmental controls, such as:
The Environmental Protection Agency (EPA);
The Army Corps of Engineers;
The U.S. Fish and Wildlife Service; and
The U.S. Forest Service.
• Virginia has taken a number of actions to facilitate permitting of new electric infrastructure.
o Applicants for new electric generation or transmission projects, or natural gas transmission lines or storage facilities, may use a pre-application planning and review process with agencies within the Secretary of Natural Resources to provide a plan that will provide for an efficient and coordinated review of the proposed energy facility. The plan includes:
A list of the permits or other approvals likely to be required based on the information available;
A specific plan and preliminary schedule for the different reviews;
A plan for coordinating those reviews and the related public comment process; and
Designation of points of contact, either within each agency or for the Commonwealth as a whole, to facilitate this coordination.
o The DEQ is drafting permits by rule for renewable energy projects of 100 megawatts or less in size (such as land-base wind projects) and of 20 megawatts or less if the project results in air emissions (such as biomass projects) to provide a streamlined permitting process for smaller renewable projects.
o The SCC, in considering its Certificate of Public Convenience and Necessity for electric generating plants and associated facilities, cannot impose additional conditions with respect to environmental protection, building codes, transportation plans, and public safety when a separate permit is granted by a federal, state, or local government entity.
• A long permitting process makes it more difficult to finance the large capital investments required for generating facilities.
• To help reduce the financial risk, Virginia provides, subject to SCC approval:
o An increased rate of return for utility investments in new, clean-technology generating plants; and

Section 2 - Electricity Page 2-23
o Construction work in progress cost recovery to reduce the regulatory lag in recovering capital investments in new plants.
• EPA has taken steps under the Clean Air Act to regulate carbon emissions as a regulated emission. This will require a change in how utilities permit new fossil-fueled generation plants.
• Virginia lacks a process to permit carbon capture and storage that might be part of a new generation project. Items to be addressed before widespread carbon sequestration is possible include:
o Testing technology and permanence of sequestration in unminable coal seams;
o Addressing the rights and liabilities of owners of lands used for sequestration; and
o The potential of saline aquifers in Central and Eastern Virginia to serve as underground carbon sinks.
Future Direction
• To meet the projected growth in electric demand and the need to replace aging generation capacity, we must :
o Construct new, large centralized generation facilities and smaller-scale independent power projects;
o Expand distributed generation;
o Construct new transmission facilities; and
o Expand conservation and efficiency actions.
• EPA’s decision to regulate carbon dioxide as a pollutant, or federal carbon legislation that would supersede EPA regulation requiring more stringent emission standards, may make older fossil fuel facilities more expensive to operate. In response, utilities may retire such units and increase reliance on more expensive power purchased on the wholesale market.
• The threat of cap and trade regulation creates substantial uncertainty that may discourage investment in new fossil-fueled generation.
• The greatest potential for renewable electric generation and new jobs comes from onshore and offshore wind, waste or biomass-to-energy facilities, and solar. However, renewable projects are typically smaller and are unable to substitute for new base-load generation.
• Hydropower is limited due, to the few locations in Virginia without a major environmental impact.
• The unknown rate of penetration of electric vehicles into the marketplace may require additional generation capacity expansions.
• Smart meters have been subject to complaints by some regarding their accuracy. There may need to be a longer history of use before public acceptance improves and the savings from voltage control attributable to smart meter use has been proven.

SECTION 3 - COAL
Coal Markets – Electric Generation
In 2008, Virginia’s electric generators produced 47 percent of the electricity generated in Virginia from coal.
o Twenty-five percent of the coal used to generate this electricity came from Virginia coal mines.
o Substantial tonnage also came from Kentucky (38 percent) and West Virginia (16 percent).
o The sources of coal fluctuate as the cost and availability of coal from Virginia and competing states change.
Table 3-1: Coal Used in Virginia Power Plants (Thousand Short Tons), 1995-200853
Year Coal Use at VA Power Plants Virginia Coal Delivered to
VA Power Plants Percent from
Virginia Mines 1995 14,454 4,423 30.6 1996 14,479 6,024 41.6 1997 15,346 6,197 40.4 1998 16,818 6,868 40.8 1999 12,932 7,078 54.7 2000 12,584 7,299 58.0 2001 19,647 5,402 27.5 2002 21,632 6,150 28.4 2003 21,118 5,942 28.1 2004 15,750 5,153 32.7 2005 18,314 6,501 35.5 2006 15,442 8,963 58.0 2007 20,212 9,201 45.5
200854 15,511 3,883 25.0
53 EIA, http://www.eia.doe.gov/cneaf/electricity/cq/cq_sum_backissues.html, June 29, 2010 54 EIA, http://www.eia.doe.gov/cneaf/electricity/cq/cqaxlfile15_a.xls, June 29, 2010
Section 3 - Coal Page 3-1

Table 3-2: Source of Coal to Virginia Power Plants, 2007-2008
Destination Quantity Average Quality
Average Delivered Cost
Origin (thousand tons)
Heat Value Sulfur Sulfur Ash
(Btu per
pound)
(percent by
weight)
(pounds per
MMBtu)
(percent by
weight
(Cents per
million Btu)
(Dollars per ton)
2007 Virginia 14,746 12,531 0.94 0.75 9.93 249 62.34Colorado 12 12,379 0.5 0.4 9 289 71.43Kentucky 2,609 12,721 0.96 0.75 9.47 251 63.33Ohio 316 11,680 0.54 0.46 7.97 257 59.95Virginia 9,201 12,636 1.02 0.81 10.51 234 59West Virginia
1,327 12,665 0.81 0.64 10.33 244 59.76
Imported 1,281 11,458 0.51 0.44 6.82 264 60.57
2008 Virginia 15,511 12,492 0.92 0.74 10.01 277 69.18Alabama 11 12,675 0.64 0.5 8.6 -- --Colorado 226 12,193 0.56 0.46 9.6 264 64.26Kentucky 5,913 12,697 1.06 0.84 9.42 269 68.25Virginia 3,883 12,591 0.98 0.78 11.92 248 62.32West Virginia
2,406 12,638 0.83 0.65 10.41 282 70.21
Imported 1,643 11,368 0.47 0.42 7.06 272 61.77Unclassified 1,431 12,469 0.93 0.74 10.1 -- --
Virginia coal operators also sell coal to electric utilities in states from Florida to New Hampshire and west to Indiana. Most steam sales are made to utility customers in Virginia, Georgia, North Carolina, and West Virginia
Section 3 - Coal Page 3-2

Table 3-3: Destination States for Virginia Coal (Thousand Short Tons)
Census Division and Destination State
2007 2006 2005 2004 2003 2002 2001 2000 1995 1990
Total 20212 19387 18314 15750 21118 21632 19647 19582 14454 17366 Virginia 9201 8963 6501 5153 5942 6150 5402 7299 4423 3488 Georgia 5674 5240 5288 5122 6453 5563 7075 5798 1987 3339 Tennessee 2202 2240 3016 2882 4236 4896 2700 1880 658 1223 North Carolina 1227 1494 1978 1867 1713 363 1505 702 3282 4345 West Virginia 816 - 198 50 12 29 18 17 - - Delaware 396 385 352 21 40 22 - 41 23 227 Mississippi 282 326 374 - - 31 139 - - - Florida 135 186 75 19 95 20 38 476 703 969 New Hampshire 102 361 144 157 70 328 - - 19 - Connecticut 47 - - - 68 - - - - - New Jersey 43 - - - 1137 539 - 319 689 963 Maryland 39 17 58 33 60 206 - 7 394 21 Pennsylvania 39 9 10 21 19 - - - - - Michigan 5 9 - - 27 - 96 - 76 113 South Carolina 4 110 41 31 253 896 982 1078 1096 993 New York - 46 142 - - - - - - - Ohio - - 109 143 429 896 454 514 89 - Indiana - - 18 251 529 1172 1065 707 1014 56 Kentucky - - 8 - - - - - - 60 Massachusetts - - - - 25 - - - - 1510 Wisconsin - - - - - - 25 62 - 59 District of Columbia - - - - - - - 10 - - Alabama - - - - 9 218 148 671 - - Data are for electric generating plants with a total steam electric and combined name plate capacity of 50 megawatts or more. In some cases coal shipments include coal mined in other States but processed and loaded in Virginia, as well as coal mined in and shipped from Virginia.
Section 3 - Coal Page 3-3
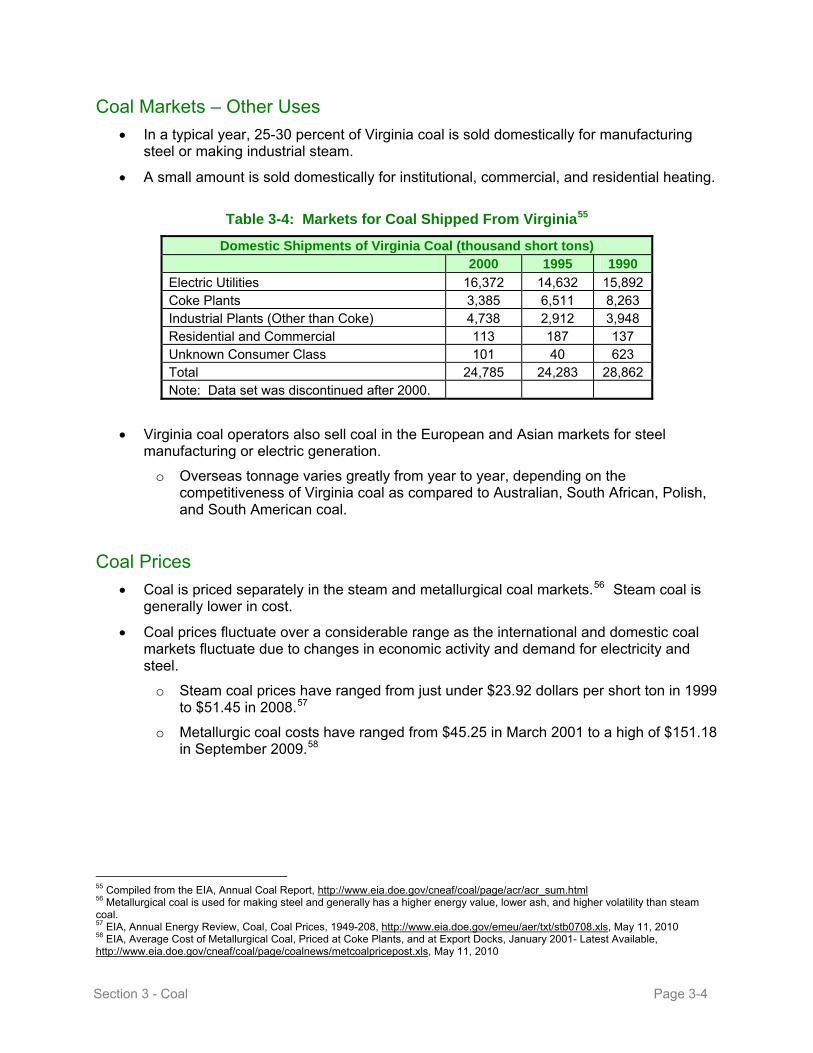
Coal Markets – Other Uses
In a typical year, 25-30 percent of Virginia coal is sold domestically for manufacturing steel or making industrial steam.
A small amount is sold domestically for institutional, commercial, and residential heating.
Table 3-4: Markets for Coal Shipped From Virginia55
Domestic Shipments of Virginia Coal (thousand short tons)
2000 1995 1990
Electric Utilities 16,372 14,632 15,892 Coke Plants 3,385 6,511 8,263 Industrial Plants (Other than Coke) 4,738 2,912 3,948 Residential and Commercial 113 187 137 Unknown Consumer Class 101 40 623 Total 24,785 24,283 28,862 Note: Data set was discontinued after 2000.
Virginia coal operators also sell coal in the European and Asian markets for steel manufacturing or electric generation.
o Overseas tonnage varies greatly from year to year, depending on the competitiveness of Virginia coal as compared to Australian, South African, Polish, and South American coal.
Coal Prices
Coal is priced separately in the steam and metallurgical coal markets.56 Steam coal is generally lower in cost.
Coal prices fluctuate over a considerable range as the international and domestic coal markets fluctuate due to changes in economic activity and demand for electricity and steel.
o Steam coal prices have ranged from just under $23.92 dollars per short ton in 1999 to $51.45 in 2008.57
o Metallurgic coal costs have ranged from $45.25 in March 2001 to a high of $151.18 in September 2009.58
55 Compiled from the EIA, Annual Coal Report, http://www.eia.doe.gov/cneaf/coal/page/acr/acr_sum.html 56 Metallurgical coal is used for making steel and generally has a higher energy value, lower ash, and higher volatility than steam coal. 57 EIA, Annual Energy Review, Coal, Coal Prices, 1949-208, http://www.eia.doe.gov/emeu/aer/txt/stb0708.xls, May 11, 2010 58 EIA, Average Cost of Metallurgical Coal, Priced at Coke Plants, and at Export Docks, January 2001- Latest Available, http://www.eia.doe.gov/cneaf/coal/page/coalnews/metcoalpricepost.xls, May 11, 2010
Section 3 - Coal Page 3-4

Table 3-5: Steam Coal Prices – Average Delivered Price ($/ton)59
Year Electric Utilities
Other Industrial
Plants 2000 $24.28 $31.46 2001 $24.68 $32.26 2002 $24.24 $35.49 2003 $25.82 $34.70 2004 $27.36 $39.30 2005 $31.22 $47.63 2006 $34.26 $51.67 2007 $36.06 $54.42 2008 $41.32 $63.44
Table 3-6: Metallurgical Coal Prices – Average Delivered Price ($/ton)60
Year Coke Plants and
Export Docks 2001 $41.84 2002 $45.51 2003 $44.49 2004 $63.40 2005 $81.82 2006 $90.76 2007 $89.21 2008 $133.28 2009 $118.36
The federal Energy Information Administration (EIA) estimates that average minemouth prices61 for Appalachian steam coal, after peaking in 2009, will decline by 0.5 percent per year through 2035. The decline will be a result of falling demand for the region’s coal and a shift to lower cost production in the northern part of the Appalachian basin.
Metallurgical coal prices are projected to remain volatile based on international demand for steel.
59 EIA, Annual Coal Reports, 2001-2008, http://www.eia.doe.gov/cneaf/coal/page/acr/acr_sum.html, June 23, 2010 60 EIA, Average Cost of Metallurgical Coal, Priced at Coke Plants and at Export Docks, January 2001- Latest Available, http://www.eia.doe.gov/cneaf/coal/page/coalnews/metcoalpricepost.xls, June 23, 2010 61 Mine mouth price is the price paid by a purchaser at the mine, without added transportation costs.
Section 3 - Coal Page 3-5

Figure 3-1: EIA Coal Price Forecast.62
Future Use of Coal
No source of electricity will be available within the next 10 years that can provide base-load power in the volume provided today by coal. Therefore, coal must continue to provide a large share of fuel for electric power generation over the term of this Plan.
Use of Virginia coal should increase as the 585 megawatt Virginia City Power Station in Wise County comes on line. This increase may be offset as Dominion converts its 250 megawatt Bremo Power Station from coal to natural gas.
Long-term use of coal in Virginia and elsewhere will be affected by the cost competitiveness of other fuel sources and whether federal legislation assigns new costs to coal use by capping or taxing carbon emissions.
Increasing regulatory costs imposed by new federal administrative action will also increase the cost of coal, and therefore the cost of coal-fired electricity.
Research and development of clean coal technologies is needed in anticipation of federal regulation of greenhouse gases.
o Virginia has been testing carbon capture and storage as part of the Southeastern Carbon Sequestration Partnership (SECARB), including characterization of unminable coal seams for carbon sequestration and testing sequestration technology in Russell County.
62 Annual Energy Outlook, Coal Forecasts, http://www.eia.doe.gov/oiaf/aeo/pdf/trend_5.pdf, May 11, 2010. The delivered price of coal ($/ton) = (Heating value of coal (Btu/lb) x Cost (¢/mmBtu)) / 50,000. Appalachian coal is equivalent to $26.00 per ton for every $1.00 per million Btus.
Section 3 - Coal Page 3-6

Figure 3-2: Location of Carbon Sequestration Test Well in Russell County, Virginia63
Coal Mining in Virginia
Coal is mined in Virginia in the Southwest Virginia Coalfield.
The last mining in the Valley Coalfield took place in the 1950s, and in the Richmond Coalfield in the 1920s.
Figure 3-3: Virginia’s Coalfields64
63 Southeast Carbon Sequestration Partnership, Central Appalachian Coal Seam Project Fact Sheet, http://www.energy.vt.edu/secarb/index.asp, June 23, 2010 64 VEPT, Existing Coal Fields, www.energy.vt.edu/vept/coal/basins.asp
Section 3 - Coal Page 3-7

Virginia mining companies produced 24.7 million tons of coal in 2008.
Production decreased an average of 2.5 percent per year over the last 10 years.
Figure 3-4: Virginia Coal Production, 1960–200865
Virginia’s coal industry directly employed 4,394 people in 2008, down from over 6,000 in 1996.
Table 3-7: Virginia Coal Mining Employment66
Year Number of Mines Number of Coal Miners
1996 325 6,089
1997 355 6,534
1998 352 5,802
1999 361 5,456
2000 341 4,926
2001 327 5,261
2002 323 4,956
2003 295 4,353
2004 292 4,501
2005 265 4,764
2006 269 4,782
2007 252 4,358
2008 261 4,394
65 VEPT, Summary of Coal Production and Employment, http://www.energy.vt.edu/vept/coal/coal_prod_eia.asp 66 VEPT, Production and Employment Data by Mine Size (Coal), www.energy.vt.edu/vept/coal/minesize.asp
Section 3 - Coal Page 3-8

Some of these reductions are the result of mine technology increasing mine productivity, while other reductions are the result of drops in tonnage mined.
Virginia produces the majority of its coal from underground mines.67.
o In 2008, 64 percent of coal mined in Virginia came from underground mines.
o The percentage of surface mined coal has increased in recent years, from 16 percent in 1990, to 25 percent in 1998, and to 36 percent in 2008.
o The percentage of coal mined from surface sites is expected to decrease over the next 10 years as the larger areas of surface reserves are mined out.
There has been a trend towards consolidation of coal ownership.
o Nationally, there are fewer small operators, with a higher percentage of mine production attributable to a few large operators.
o The top five companies produce more than 50 percent of the coal mined in the United States 2008.
Table 3-8: Top 20 Coal Producers in the United States, 200868
Rank Controlling Company Name Production
(thousand short tons) Percent of
Total Production
1 Peabody Energy Corp 200,752 17.1
2 Rio Tinto Energy America 140,818 12.0
3 Arch Coal Inc 134,017 11.4
4 Foundation Coal Corp 69,366 5.9
5 CONSOL Energy Inc 63,806 5.4
6 Massey Energy Co 40,151 3.4
7 Patriot Coal Corp 33,317 2.8
8 NACCO Industries Inc 29,554 2.5
9 Westmoreland Coal Co 29,275 2.5
10 Peter Kiewit Sons Inc 28,198 2.4
11 Alliance Resource Operating Partners LP 26,395 2.3
12 Murray Energy Corp 26,059 2.2
13 Energy Future Holdings Corp 23,307 2.0
14 Alpha Natural Resources LLC 20,879 1.8
15 Intl Coal Group Inc (ICG) 18,340 1.6
16 BHP Billiton Ltd 15,952 1.4
17 Chevron Corp 10,976 0.9
18 PacifiCorp 10,884 0.9
19 James River Coal Co 10,583 0.9
20 Level 3 Communications 10,559 0.9
67 EIA, Coal Production Reports, http://www.eia.doe.gov/fuelcoal.htm , May 10, 2010 68 EIA, Major Coal Producers, http://www.eia.doe.gov/cneaf/coal/page/acr/table10.htm , May 10, 2010
Section 3 - Coal Page 3-9

In Virginia, production is predominately (70 percent of mining operations) from small operations (36 employees on average) mining remnant or finite reserves using the room and pillar mining method.
Coal mining companies pay severance taxes of 2 percent of the value of the coal extracted to the county where the mine is located, as well as personal property and other local taxes.
o Minerals taxes account for over 40 percent of Buchanan County’s local government revenue69, with similar amounts supporting Dickenson and Wise Counties.
Infrastructure
Most Virginia coal is shipped from mines to preparation plants and rail load outs by truck, then to market and ports by rail.
Coal transportation is a revenue center for Virginia’s railroads, and thereby supports maintenance of Virginia’s rail transportation infrastructure.
Virginia coal is exported from terminals in the Port of Hampton Roads.
o The port serves as an export point for Virginia, West Virginia, and Kentucky coal.
o The markets for this coal include electric generators located close to East Coast shipping lanes and overseas electric utilities and steel manufacturers.
Figure 3-5: Map of Coal Transportation Network70
69 Testimony from Buchanan County representatives before the Senate Committee on Agriculture, Conservation and Natural Resources, February 2010, at the public hearing on Senate Bill 564. 70 VEPT, http://www.energy.vt.edu/vept/coal/virginiacoal.asp, June 28, 2010
Section 3 - Coal Page 3-10

Figure 3-6: Coal Shipments from Port of Hampton Roads, 1990–200971
Hampton Roads Coal Shipments
0
10
20
30
40
50
60
70
1991
1992
1993
1994
1995
1996
1997
1998
1999
2000
2001
2002
2003
2004
2005
2006
2007
2008
2009
Year
Millions of Short Tons
Coal Facility Siting Requirements
It has become increasing difficult to develop sites for coal mines as EPA and other federal agencies tighten regulations over surface mining.
Water quality is a critical issue related to permitting and operating coal mining. Additional controls will be needed to address water quality discharges from surface mines and as TMDLs are implemented in streams near coal mines.
As discussed in the electricity section, it will become more difficult to permit new coal-fired generation plants if plant operators must address carbon controls in permitting proceedings.
Coal ash management rules are becoming stricter.
o The EPA issued proposed rules in May 2010 to require use of liners and groundwater monitoring in coal ash fills and transition to dry ash disposal.
o Any future federal designation of coal ash as a hazardous waste would significantly increase the cost of ash disposal and could eliminate alternate uses such as concrete block and sheetrock.
71 Virginia Energy Patterns and Trends: Coal Shipments from the Port of Hampton Roads, www.energy.vt.edu/vept/coal/basins.asp and the Port of Hampton Roads.
Section 3 - Coal Page 3-11

SECTION 4 - NUCLEAR POWER
Nuclear Power Generation in Virginia
Dominion operates four nuclear units at its two Virginia nuclear power plants.
These plants provided 38.4 percent of the electricity generated in Virginia during 2008.
Two units are located at the South Anna Power Station in Louisa County and two are located at the Surry Power Station in Surry County.
o Dominion owns an 88.4 percent share of the North Anna station. The Old Dominion Electric Cooperative owns the remaining 11.6 percent share.
o Dominion owns 100 percent of the Surry Station. The Nuclear Regulatory Commission (NRC) has extended both Surry’s and North Anna’s operating licenses
Table 4-1: Virginia Nuclear Generating Units – Startup Date
Unit Name Year End of Operating
License Term
Surry Unit 1 1972 2032
Surry Unit 2 1973 2033
North Anna Unit 1 1978 2038
North Anna Unit 2 1980 2040
Dominion has made operating and capital improvements to the plants that have reduced down time for refueling and repairs and increased plant capacity.
o Operating capacity for the four reactors in Virginia in 2009 ranged from 91.6 to 99.87 percent. Historic operating capacity has been between 74 and 83 percent.
Virginia’s four reactors consume approximately 1.6 million pounds of uranium oxide, or approximately 30 metric tons of uranium fuel, on average per year to fuel its four nuclear reactors.
Nuclear Power Plant Designs
Nuclear power plant design has evolved since the first-generation prototypes were built.
o Generation III+ reactors are under construction around the world (none in the United States as of 2010). These include the AREVA US-EPR reactor design and the Mitsubishi US–APWR (Advanced Pressurized Water Reactor). Dominion has identified the Mitsubishi US-APWR as the technology of choice for its proposed third unit at the North Anna Station.72
72 Dominion, Dominion Virginia Power Selects Mitsubishi Reactor Technology for Potential North Anna Unit 3, http://dom.mediaroom.com/index.php?s=43&item=888, May 12, 2010
Section 4 – Nuclear Power Page 4-1

o New reactor designs, such as the Babcock & Wilcox (B&W) mPower reactor and pebble bed reactors, are being developed to serve the smaller reactor market. 73
Operational costs of nuclear power plants are the lowest of any type of generation except for hydroelectric, wind, and solar.
Nuclear power plant capital costs are very high. The capital cost risk may be mitigated through shared risk management among utilities, nuclear plant technology providers, and the federal government.
Spent Fuel Management
Nuclear fuel is currently stored on the North Anna and Surry sites in spent fuel pools and dry storage casks.
Dominion customers have been paying a fee of one tenth of one cent/kilowatt hour ($.001/kWh) generated by nuclear power plants into the federal Nuclear Waste Fund to finance a permanent spent nuclear fuel storage facility.
The Nuclear Waste fund had financed design and construction of the canceled Yucca Mountain nuclear waste repository in Nevada.
New plans, such as long-term storage sites or reprocessing, must be developed to address management of spent nuclear fuel.
The Nuclear Fuel Cycle
The first step in the nuclear fuel cycle is mining and milling of uranium oxide, resulting in 0.7 percent U235.
The uranium oxide is then enriched to the 4.2 to 4.7percent level and fabricated into fuel pellets.
o The United States has one enrichment plant, the USEC gaseous diffusion plant in Paducah, Kentucky. Four new nuclear fuel processing plants are under development:
Three centrifuge plants by AREVA in Idaho Falls, Idaho; URENCO in Eunice, New Mexico; and USEC in Piketon, Ohio; and
One global laser enrichment plant by GE-Hitachi in Wilmington, North Carolina.
o These plants will have sufficient capacity to supply fuel to all existing nuclear power plants in the United States74.
Processed fuel pellets are then assembled into reactor fuel rods for use in nuclear power reactors.
73 World Nuclear Organization, Small Nuclear Power Reactors, updated May 2010, http://www.world-nuclear.org/info/inf33.html, May 12, 2010 74 World Nuclear News, Areva Selects Enrichment Site, May 7, 2008, http://www.world-nuclear-news.org/NN-Areva_selects_US_enrichment_site_070508.html
Section 4 – Nuclear Power Page 4-2

Nuclear Fuel Costs
Prices of uranium oxide were consistently below $20/pound until the mid 2000s. Since then prices have jumped to nearly $140/pound in 2007 before falling to the current $40 to $50/pound range.
Figure 4-1: Uranium Oxide Costs75
Changes in spot nuclear fuel cost have a limited impact on the cost of nuclear generated electricity. Nuclear fuel is generally purchased through long-term contracts and costs are a much smaller percentage of total nuclear power cost than with fossil fuel technologies.
Nuclear Plant Siting and Construction Nuclear power plant siting is largely regulated through the licensing process of the
Nuclear Regulatory Commission (NRC).
o Licensing requirements have been streamlined since plants were licensed in the 1960s and 1970s. Nuclear utilities now can receive an early site permit followed by a combined construction-operating permit.
Dominion has received its early site permit for the proposed third North Anna unit.
As of June 2010, Dominion’s combined construction-operating permit application was pending before the NRC.
75 The UxC Consulting Company, Ux U3O8 Price – Full History, http://uxc.com/review/uxc_PriceChart.aspx?chart=spot-u3o8-full, June 29, 2010
Section 4 – Nuclear Power Page 4-3

Nuclear plant permitting and construction is expensive and time-consuming, taking 8-10 years.
Variations in technical standards and construction costs, cost of capital, and other factors contribute to the risk profile of investments in new nuclear power plant construction.
Time and budget experience with new plant construction overseas has been mixed.
Shared risk between utilities and project design and construction firms is necessary to support financing new nuclear projects.
State and federal incentives, including providing a higher rate of return under Virginia law for utility investments in new nuclear power plants and federal loan guarantees, help mitigate the financial risk.
U.S. nuclear reactor manufacturing capability is growing with the resurgence of the international nuclear power industry. New facilities include the AREVA-Northrop Grumman plant in Newport News and the Westinghouse-Shaw Group plant in Lake Charles, Louisiana.
A single international standard for nuclear power plant certification would expand the markets for the AREVA-Northrop Grumman Newport News and other U.S. manufacturers.
Uranium Mining
Wyoming, New Mexico, Arizona, Utah, Colorado, Texas, and Virginia have significant uranium reserves76.
Virginia has a uranium oxide resource in Pittsylvania County, estimated at 119 million pounds (at 0.025 percent uranium oxide cutoff) and worth around $5.4 billion at the mid-2020 price of $45/pound for uranium oxide.
This site could be mined for 60 years at a production rate of 2 million pounds per year. Production of 2 million tons per year would be equivalent to adding 50 percent to 2008 domestic uranium production.77
The Commonwealth has a moratorium on uranium mining due to questions about the safety of uranium mining in Virginia.
The Virginia Coal and Energy Commission is undertaking two studies of uranium mining:
o The Commission has contracted with the National Academy of Sciences’ National Research Council to study the safety and environmental impacts of uranium mining.
o The Commission is studying the social and community impacts of uranium mining.
76 EIA, U.S. Uranium Reserves Estimates, June 2004, http://www.eia.doe.gov/cneaf/nuclear/page/reserves/ures.html, May 16, 2010 77 EIA, Summary Production Statistics of the U.S. Uranium Industry, May 2009, http://www.eia.doe.gov/cneaf/nuclear/dupr/usummary.html, May 16, 2010
Section 4 – Nuclear Power Page 4-4

Figure 4-3: Map of Coles Hill Uranium Deposit78
Federal laws and regulations controlling U.S. uranium mining include:
o Uranium Mill Tailings Radiation Control Act of 1978;
o Safe Drinking Water Act;
o Underground Injection Control Program; and
o National Emission Standards for Hazardous Air Pollutants.
The federal government licenses uranium-processing mills and the disposal of associated mill tailings.
States, including Wyoming, Colorado, and Texas, have developed uranium mining regulatory programs.
Nuclear Industry Workforce Development
Virginia is a leader in design, construction, and maintenance of nuclear power plants through AREVA, B&W, Dominion, and Northrop Grumman.
o AREVA, B&W, and Northrop Grumman have an ongoing need for nuclear and other engineers and service technicians.
o Northrop Grumman employs thousands of workers at its Newport News shipyard constructing nuclear powered ships.
o Additional jobs will be available when the AREVA/Northrop Grumman power plant component manufacturing plant is completed.
o Dominion’s current nuclear workforce is nearing retirement age and trained technicians and engineers are needed to replace those leaving.
78 Virginia Uranium, Location, http://www.virginiauranium.com/location.php, June 29, 2010
Section 4 – Nuclear Power Page 4-5

o Dominion will also need additional nuclear plant operation, engineering, maintenance, and other workers if it adds the third unit to the North Anna power station.
The University of Virginia, Virginia Tech, Virginia Commonwealth University, and the Virginia Community College System are rebuilding their nuclear-related teaching and research capacity to serve the industry. These new training programs provide educational opportunities ranging from advanced nuclear engineering degrees to training nuclear technicians.
Section 4 – Nuclear Power Page 4-6
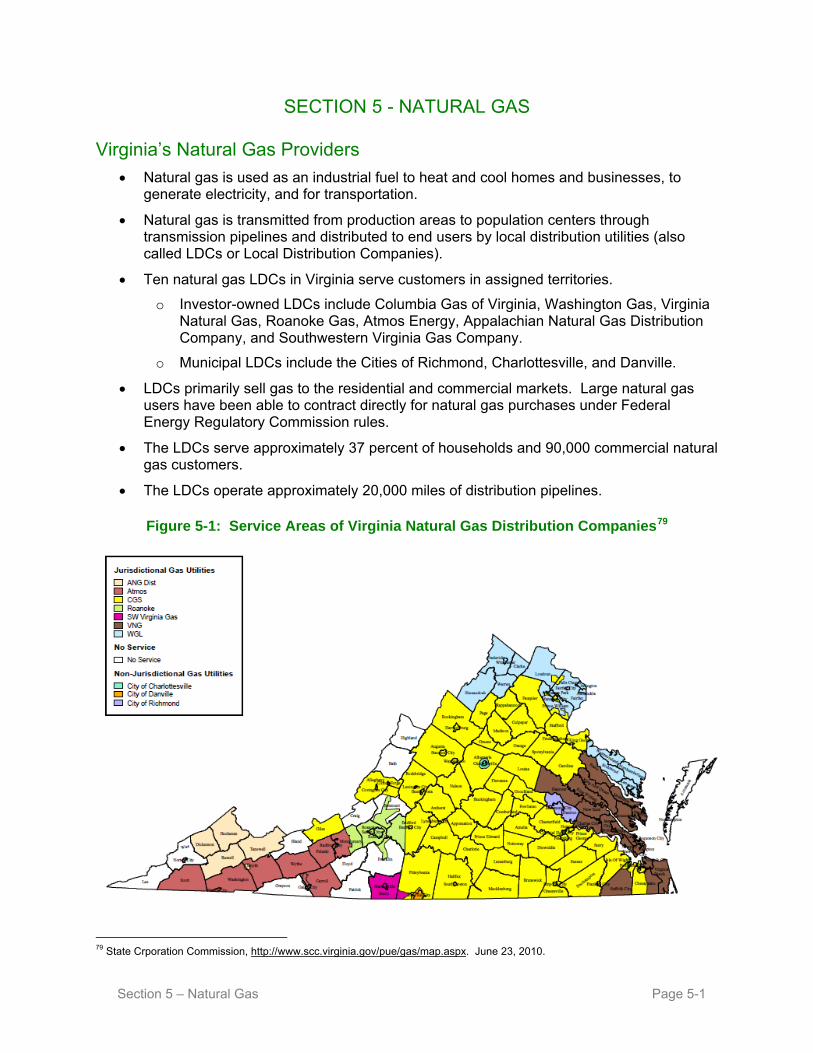
SECTION 5 - NATURAL GAS
Virginia’s Natural Gas Providers
Natural gas is used as an industrial fuel to heat and cool homes and businesses, to generate electricity, and for transportation.
Natural gas is transmitted from production areas to population centers through transmission pipelines and distributed to end users by local distribution utilities (also called LDCs or Local Distribution Companies).
Ten natural gas LDCs in Virginia serve customers in assigned territories.
o Investor-owned LDCs include Columbia Gas of Virginia, Washington Gas, Virginia Natural Gas, Roanoke Gas, Atmos Energy, Appalachian Natural Gas Distribution Company, and Southwestern Virginia Gas Company.
o Municipal LDCs include the Cities of Richmond, Charlottesville, and Danville.
LDCs primarily sell gas to the residential and commercial markets. Large natural gas users have been able to contract directly for natural gas purchases under Federal Energy Regulatory Commission rules.
The LDCs serve approximately 37 percent of households and 90,000 commercial natural gas customers.
The LDCs operate approximately 20,000 miles of distribution pipelines.
Figure 5-1: Service Areas of Virginia Natural Gas Distribution Companies79
79 State Crporation Commission, http://www.scc.virginia.gov/pue/gas/map.aspx. June 23, 2010.
Section 5 – Natural Gas Page 5-1

Natural Gas Consumption
In 2008, Virginia consumers used 286.4 billion cubic feet (BCF) of natural gas. An additional 13 billion cubic feet was consumed for lease and pipeline operations.
Natural gas use increased on average by 0.8 percent per year over the last decade. Growth was primarily attributable to new customer growth and use of natural gas for electric generation.
The growth pattern changed and demand dropped by nearly 6 ½ percent from 2007 and 2008 primarily attributable to the economic downturn and warmer than normal winter weather.
Table 5-1: Natural Gas Consumption, 1997-2008 (million cubic feet)80
Year All
Consumers Residential Commercial Industrial Vehicle Fuel Electric Power
1997 240,244 73,905 61,895 85,264 142 19,038 1998 252,233 63,186 58,283 92,801 154 37,808 1999 267,269 69,189 61,516 95,141 193 41,230 2000 258,975 79,701 66,098 76,263 212 36,700 2001 228,407 70,249 59,809 65,231 263 33,118 2002 247,351 75,476 62,699 73,973 268 34,936 2003 254,009 85,330 64,004 69,090 328 35,256 2004 268,307 82,755 64,518 72,250 368 48,784 2005 291,885 85,355 65,838 73,741 158 66,951 2006 264,786 71,693 62,352 70,420 168 60,321 2007 309,711 80,957 66,444 71,736 154 90,573 2008 286,355 79,725 67,006 62,642 177 76,983
Figure 5-1: Natural Gas Consumption
Virginia Natural Gas Consumption
0
50,000
100,000
150,000
200,000
250,000
300,000
350,000
1997
1998
1999
2000
2001
2002
2003
2004
2005
2006
2007
2008
Million C
F
All Consumers
Residential
Commercial
Industrial
Vehicle Fuel
Electric Power
80 EIA. Natural Gas Navigator. http://www.eia.doe.gov/dnav/ng/ng_cons_sum_dcu_SVA_a.htm. June 23, 2010
Section 5 – Natural Gas Page 5-2

Natural gas consumption in Virginia should grow over the next ten years.
o Dominion has included construction of six new natural gas fired generation plants through 2020 in its Integrated Resource Plan.
o Non-utility producers may also construct new natural-gas fired plants to serve Dominion and other electricity markets.
o Additional retail consumers will hook up to natural gas distribution systems as Virginia’s population grows.
o Transportation uses may increase demand for natural gas. Natural gas is an efficient fuel for fleet uses such as school bus, public transit, and local fleet services. This use may create new markets for Virginia natural gas.
Virginia’s Natural Gas Utility Regulatory Structure
Under traditional rate regulation, LDCs, in response to being given a monopoly service area, are required to offer service at just and reasonable rates and are limited to earn a maximum rate of return set through rate cases before the State Corporation Commission (SCC).
Starting in 2000, LDCs were authorized to offer all customers direct access to natural gas suppliers, called retail supply choice.
o Washington Gas and Columbia Gas offer this choice to all customers.
o In 2008, 7.9% of eligible residential customers and 22.5 percent of eligible commercial customers participated in the choice programs.81
LDCs have the opportunity to enter into performance-based ratemaking (PBR) agreements that allow higher rates of return on meeting performance standards. Columbia Gas, Virginia Natural Gas and Washington Gas have used SCC approved PBR plans.
Natural gas LDCs are authorized to undertake Conservation and Ratemaking Efficiency (CARE) programs to decouple earnings from the volume of gas sold. Rate decoupling is conditioned upon adoption of an SCC approved plan for promoting and investing in conservation and efficiency by the company’s customers.
o As of summer 2010, Virginia Natural Gas and Columbia Gas have implemented CARE plans.
Virginia enacted the Steps to Advance Virginia's Energy Plan (SAVE) program in 2010 to provide timely cost recovery for large-scale replacement of aging local distribution pipeline infrastructure.
81 EIA. Retail Unbundling Virginia. http://www.eia.doe.gov/oil_gas/natural_gas/restructure/state/va.html. May 16, 2010.
Section 5 – Natural Gas Page 5-3

Natural Gas Transmission
Natural gas consumed in Virginia come from three main sources:
o The Gulf of Mexico and other southern supply sources through the Transco natural gas transmission pipeline;
o Virginia and other Appalachian natural gas production through the Spectra pipeline system in Southwest Virginia and the Columbia Gas Transmission pipeline system through West Virginia to Northern Virginia; and
o The Cove Point Liquefied Natural Gas (LNG) import facility in Maryland through the Dominion/Virginia Natural Gas pipeline serving Eastern Virginia.
There are approximately 2,950 miles of natural gas transmission pipelines in Virginia.
Figure 5-3: Major Natural Gas Pipelines in Virginia82
82 Modified from VEPT. Major Natural Gas Pipelines. http://www.energy.vt.edu/vept/naturalgas/NG_pipelines.asp. June 23, 2010
Section 5 – Natural Gas Page 5-4

Table 5-2: Principal Natural Gas Pipeline Companies Serving the Virginia83
Pipeline Name Principal Supply Source(s)
Interstate & Importing Pipelines
Columbia Gas Transmission Co Southwest, Appalachia
Dominion Cove Point LNG LP LNG Imports, Interstate System
Dominion Transmission Corp Southwest, Appalachia
East Tennessee Natural Gas Co Interstate System
NORA Gas Transmission Co Interstate System
Transcontinental Gas Pipeline Co Southwest
Intrastate Pipelines**
Virginia Natural Gas Co Interstate System
Figure 5-4: Northeast Region Natural Gas Pipeline Network
Natural gas companies have added new pipeline capacity across the state in recent years, including:
o Virginia Natural Gas’ HRX pipeline that provided a third pipeline water crossing in Hampton Roads;
83 The pipeline table and following two pipeline figures are taken from EIA. About US Natural Gas Pipelines. http://www.eia.doe.gov/pub/oil_gas/natural_gas/analysis_publications/ngpipeline/northeast.html. June 23, 2010
Section 5 – Natural Gas Page 5-5

o Spectra’s Patriot Line from the East Tennessee Line to Southside Virginia and North Carolina; and
o Spectra’s Jewell Ridge Pipeline to deliver natural gas from Virginia’s gas production areas to the East Tennessee line and Saltville natural gas storage facility.
Spectra is adding additional pipeline capacity to the East Tennessee Pipeline to serve a new gas-fired power plant TVA is constructing near the Virginia border.
Natural Gas Prices
Virginia’s residential consumers paid on average $16.20/thousand cubic feet (MCF) in 2008. Commercial customers paid on average $12.98/MCF, industrial consumers paid on average $11.49/MCF, and utilities paid on average $10.87/MCF.
Figure 5-6: Average Natural Gas Price by Sector84
Natural gas prices in Virginia have traditionally been higher than in producing sections of the country, such as the Southeast and Rocky Mountain areas.
The higher price is largely attributable to the need to transport the natural gas long distances to Virginia.
This cost structure may change as new production comes on line from the Marcellus shale deposits in the East that have lower transportation costs.
84 VEPT. Natural Gas and Coal Bed Methane Average Price by Sector. http://www.energy.vt.edu/vept/naturalgas/price_chart.asp. June 23, 2010
Section 5 – Natural Gas Page 5-6

Table 5-3: US Regional Natural Gas Prices
Sector/Region 2007 2008 2009 2010 Residential New England 16.5 17.29 16.77 15.58 Middle Atlantic 15.01 16.2 14.92 13.8 East North Central 11.62 12.71 10.73 10.28 West North Central 12.04 12.11 10.33 9.95 South Atlantic 16.45 16.91 15.09 14.69 East South Central 14.12 14.9 13.17 12.07 West South Central 12.35 13.7 11.69 11.35 Mountain 10.93 11.24 10.35 9.59 Pacific 11.98 12.77 10.37 10.26 U.S. Average 13.08 13.89 11.97 11.42
The DOE EIA predicts natural gas prices will remain stable over the next 10 years, estimating that the average delivered price for natural gas in the United States will be $10.61/thousand cubic feet for all end users.85
Figure 5-7. EIA Natural Gas Price Projection
85 EIA, Annual Energy Outlook 2010. Natural Gas Supply, Disposition, and Prices. http://www.eia.doe.gov/oiaf/aeo/excel/aeotab_13.xls. May 16, 2010.
Section 5 – Natural Gas Page 5-7

Efficiency and Conservation
Natural gas is more efficient as a direct fuel for uses such as heating and transportation than when it is burned as a fuel to generate electricity for those uses. Providing for direct use of natural gas can improve overall energy efficiency of energy use in the Commonwealth.
Local distribution natural gas utilities must include plans to promote and invest in natural gas conservation and efficiency as part of Conservation and Ratemaking Efficiency (CARE) alternate ratemaking plans. As of summer 2010, Virginia Natural Gas and Columbia Gas have implemented CARE conservation and efficiency programs for their customers.
Other local distribution natural gas utilities have implemented conservation and efficiency programs for their customers outside of the CARE program, such as the City of Richmond’s online home energy audit and Washington Gas’ energy efficiency and safety program.
Virginia has included natural gas appliances and equipment in its energy efficiency rebate programs funded through ARRA grants. Customers are receiving rebates to replace old, less efficient appliances and equipment with more efficient, Energy Star appliances and equipment to reduce future natural gas bills.
Natural Gas Production
Virginia’s natural gas exploration and production companies produced 128.5 billion cubic feet of natural gas from 6,428 wells in 2008.
o This amount is equal to 43 percent of the natural gas consumed in Virginia in 2008.
o Approximately 80 percent of Virginia natural gas production is from coalbed methane wells. The remaining 20 percent is produced from shale formations located below the coal seams in Southwest Virginia.
Figure 5-8: Appalachian Basin Coalbed Methane Formations
Section 5 – Natural Gas Page 5-8

Figure 5-9: Appalachian Basin Natural Gas Shale Formations
Virginia natural gas production has increased by an average of 12.4 percent per year over the last 10 years. Most of the increase has been from expanded coalbed methane production in Buchanan, Wise, and Dickenson Counties.86
Virginia ranked 16th highest of the 32 states with natural gas production in 2008.
Figure 5-10: Natural Gas Production in Virginia, 1967–200887
86VEPT. Gas Production By County. http://www.energy.vt.edu/vept/naturalgas/gas_county.asp 87 VEPT. Virginia Total Historic Gas Production. http://www.energy.vt.edu/vept/naturalgas/historic_production.asp
Section 5 – Natural Gas Page 5-9

Production may increase if the Marcellus Gas formation in Virginia is able to produce marketable quantities of natural gas.
Figure 5-11: Marcellus Shale Formations
Natural gas produced in Virginia is collected in gathering pipeline systems. These systems include low pressure pipelines from wells to compression facilities where the gas is cleaned and compressed. After being compressed, the gas is fed into the interstate pipeline network where it is delivered to customers.
Natural gas produced in Virginia is sold in Tennessee, Southwestern Virginia, and Northeastern states because there is limited pipeline capacity to deliver the gas from Southwestern Virginia to the Central and Eastern Virginia markets.
The capacity to deliver Virginia natural gas to the Northern, Central, and Hampton Roads regions of Virginia increased with the connection of the Spectra Patriot Pipeline to the Transco interstate pipeline.
Natural gas producers can serve up to 35 customers and public schools in areas not located in a local natural gas distribution company service territory, allowing customers in Southwest Virginia not covered by a public utility to receive natural gas service.
Prices for Appalachian region natural gas have stayed in the high $3 to low $4/thousand cubic feet range in 2010. The Dominion South hub price was $4.42 for the week of May 15, 2010.88. Future prices will depend on factors such as demand, price of oil, and regional natural gas production levels.
As shown in Figure 5-7 above, the EIA projects natural gas wellhead prices will increase annually over the next decade, increasing from $4.06/thousand cubic feet in 2010 to $7.18 in 2020.89
88 NTI Weekly Natural Gas Price Index, Firm Physical Natural Gas Price Bulletin History, For Natural Gas Delivered at Dominion-South. http://intelligencepress.com/features/intcx/gas/intcx_gas_point.emb?pointcode=ICENEACNG. May 16, 2010 89 EIA, Annual Energy Outlook 2010. Natural Gas Supply, Disposition, and Prices. http://www.eia.doe.gov/oiaf/aeo/excel/aeotab_13.xls. May 16, 2010.
Section 5 – Natural Gas Page 5-10

Offshore Natural Gas
There is an estimated 1.66 trillion cubic feet of natural gas reserves in federal waters in the Virginia administrative boundary areas offshore Virginia.
The value of natural gas in the Virginia offshore administrative boundary areas could total more than $10 billion (1.66 trillion cubic feet at $6/thousand cubic feet).
o The value will depend on the actual amount of recoverable resources and the cost of gas.
o Offshore natural gas production would support infrastructure expansion in Hampton Roads, attracting new business and creating jobs in the supply chain and exploration and production.
Developing offshore natural gas resources is dependent on an extensive federal lease sale and permitting process.
Offshore extraction will need to be compatible with Department of Defense operations in Virginia offshore waters. Federal-state cooperation can lead to developing a compatible exploration and production plan.
The Bureau of Ocean Energy Management, Regulation and Enforcement (formally Minerals Management Service) has suspended offshore leases until the causes of the 2010 Deepwater Horizon accident and oil spill are better understood and suitable protections are put in place.
Figure 5-9: 2007-2012 Mid-Atlantic OCS Proposed Lease Area90
90Source: U.S. Department of the Interior, MMS, Proposed Final Program of the Outer Continent Oil and Gas Leasing Program, 2007–2012, April 2007, map 9, p. 68.
Section 5 – Natural Gas Page 5-11

Virginia’s coastal regions may hold producible methane hydrate resources if the technology is developed to produce the methane hydrates from geologic formations found offshore Virginia. The technology to produce these resources is not expected to be developed in the 10-year term of this Plan.
Natural Gas Storage
Virginia is home to two underground natural gas storage facilities, the Spectra salt cavern storage facility in Saltville and Early Grove underground storage field in Scott and Washington Counties.
Other underground natural gas storage services available to Virginia utilities and consumes are located in West Virginia, Pennsylvania, and Ohio. Dominion is one of the largest operators of these underground natural gas storage facilities.
Figure 5-12: Underground Natural Gas Storage Facilities
Virginia LDCs operate peaking natural gas storage facilities near their local distribution networks.
o These facilities include compressed natural gas tanks, liquefied natural gas tanks, and one underground propane storage cavern.
o Companies store gas in these facilities when demand is low and inject gas into the pipeline system during times of peak demand.
Section 5 – Natural Gas Page 5-12

Adequacy of Supply
Natural gas production in the coalfield region should rise incrementally as producers continue to drill new coalbed methane and conventional shale wells in Southwest Virginia.
Virginia’s natural gas reserves were estimated in 2008 to be 2,378 billion cubic feet.91 Given current removal rates, this reserve would support production for about 20 years.92
Additional reserves and production are available in the Marcellus Shale areas west of the Shenandoah Valley and offshore.
A growing amount of out of state supply is available from shale production areas in Pennsylvania, West Virginia, and elsewhere.
The federal Energy Information Administration predicts there should be adequate supplies from new domestic production for expanded uses of natural gas.93
Disruptions in Gulf of Mexico supply or interstate transmission pipelines will affect multiple states including Virginia. States will need to work with the federal Department of Energy to coordinate responses to supply disruptions.
91
EIA. Advance Summary: U.S. Crude Oil, Natural Gas, and Natural Gas Liquids Reserves, 2007 Annual Report. http://www.eia.doe.gov/pub/oil_gas/natural_gas/data_publications/advanced_summary/current/adsum.pdf 92
This annual natural gas removal rate is based on a three-year average rate of production for the years 2006–2008 based on VEPT numbers. 93 EIA. Annual Energy Outlook, 2010. http://www.eia.doe.gov/oiaf/aeo/pdf/0383(2010).pdf. May 16, 2010.
Section 5 – Natural Gas Page 5-13

SECTION 6 - RENEWABLES
Renewable energy is defined in the Virginia Electric Utility Regulation Act as energy derived from:
o Sunlight; o Wind; o Falling water; o Biomass, sustainable, or otherwise (the definitions of which shall be liberally
construed); o Energy from waste, including municipal solid waste; o Wave motion and tides; and o Geothermal power.
Virginia’s renewable resources include:
o Biomass and waste; o Wind, both offshore and on-shore, and hydrokinetic; o Hydroelectric, both pumped storage and run-of-river; o Low temperature geothermal; and o Solar.
Renewable energy resources often require a large up-front investment.
Some technologies are not cost-competitive against traditional fuels.
Hydro, biomass, waste-to-energy, landfill gas, and a small amount of solar provide about 2.8 percent of the electricity generated in Virginia in 2008.
Ethanol provided approximately six percent of gasoline consumption in Virginia during 2008. Biodiesel met a small percentage of the diesel fuel and heating oil markets. The market for biodiesel was challenging as costs of traditional diesel and heating oil were generally less than biodiesel.
Figure 6-1: Renewable Energy Production in Virginia, 1990–200894
94 EIA, Virginia Electricity Profile, 2008 edition, http://www.eia.doe.gov/cneaf/electricity/st_profiles/virginia.html
Section 6 – Renewables Page 6-1

A Virginia Tech Center for Coal and Energy Research study found that Virginia has significant technical potential for renewable energy development.
Table 6-1: Virginia’s Technical Renewable Energy Potential Generating Capacity95
Renewable Energy Resource
2007 Installed Capacity in Virginia
(MW)
Potential Installed New Capacity in Virginia
(MW) Capacity Factor
Land-based wind 0.07 1,793 30–45%
Offshore wind 0 28,100 35–40%
Solar PV 0.91 11,000–13,000 14%–20%
Biomass combustion 418 760 83%
MSW/landfill gas 254 30 90%
TOTAL 673 41,840–43,840
There are three markets for renewable electricity produced in Virginia.
o The primary use of renewable electricity has been for on-site use, either grid connected or off-grid. They typically use solar photovoltaic or small wind to produce the electricity.
o Virginia’s electric utilities are a second market. Larger projects, such as from biomass or wind, can sell their output to the utilities. These sales would typically be tied to a utility’s renewable portfolio standard.
o The third market is to sell power in the PJM marketplace. Renewable electricity system developers can gain access to higher-priced markets in other states through the PJM.
Renewable energy project developers can gain additional value by selling the Renewable Energy Credits (RECs). RECs are a certificate that represents the value of the renewable project to the environment.
REC markets in states with a mandatory renewable portfolio standard have a higher value than in Virginia.
Virginia provides a number of incentives to advance renewable energy technology and production. These are intended to help early adoption of the technologies and provide the jobs and environmental co-benefits from renewable energy production and use. They include:
o A renewable portfolio standard calling for 15 percent of 2007 base-line electric production from renewable sources, with utilities eligible to receive an enhanced rate-of-return for meeting the standard.
95 VCCER: A Study of Increased Renewable Energy Resources in Virginia. November 11, 2005, Updated Jan 16, 2006, http://www.energy.vt.edu/Publications/Incr_Use_Renew_Energy_VA_rev1.pdf
Section 6 – Renewables Page 6-2

o An enhanced rate of return for utility investments in renewable electric generating facilities.
o Net metering in which excess electricity from residential (up to 10 kilowatts) and small commercial (up to 500 kilowatts) projects is credited to the customer at the retail power rate (i.e. runs the meter backwards).
o A biofuels production incentive fund with a higher incentive for liquid fuels produced from non-conventional resource.
o Income tax credits for green jobs and jobs related to clean fuel vehicles and fueling systems.
o Grants for manufacturers producing solar panels in Virginia.
o Grants from the Tobacco Indemnification Commission for R&D and energy businesses development in Southside and Southwest Virginia.
o Rebates and other financial support using American Recovery and Reinvestment Act funding.
o A streamlined permitting process for renewable electric projects 100 megawatts and smaller (20 megawatts and smaller for biomass and waste to energy).
o Creation of the Virginia Coastal Energy Research Consortium (VCERC) to develop coastal energy technologies.
Twenty percent of revenue from offshore oil and gas production is to be provided to VCERC.
o The Virginia Offshore Wind Development Authority to assist development of an offshore wind industry in Virginia.
o The Universities Clean Energy Development and Economic Stimulus Foundation to support R&D of alternative fuels, clean energy production, and related technologies.
o Creation of the Virginia Wind Energy Collaborative and Onshore Wind Test Center at James Madison University.
Biomass and Waste-to-Energy
Biomass and waste products include:
o Wood and wood waste, including wood, sawdust, wood chips, and slash.
o Energy crops such as fast growing trees, corn, barley, warm season grasses, winter cover crops, and others.
o Agricultural waste such as crop residue, animal litter; and waste from food processing.
o Municipal solid waste and landfill gas generated from waste.
o Construction debris.
o Algae.
Section 6 – Renewables Page 6-3

Biomass and waste is used as a fuel to generate electricity, make steam or heat, and make liquid fuels.
Table 6-1: Biomass Generated Electricity (MWh) 2000-200796
Year Municipal
Waste
Wood and Wood Waste
Other Waste
Total Biomass
2000 461 1,677 6 2,144 2001 991 1,148 5 2,144 2002 1,106 1,408 4 2,518 2003 1,100 1,588 27 2,714 2004 1,148 1,764 42 2,954 2005 1,132 1,800 47 2,979 2006 662 1,780 17 2,458 2007 753 1,792 20 2,566
Table 6-2: Biomass and Waste-to-Energy Projects97
Project Energy Produced
Fairfax County Covanta WTE plant 124 MW of electricity
Alexandria/Arlington Covanta WTE plant 29 MW of electricity
SPSA WTE plant 60 MW plus steam
Harrisonburg WTE plant 2.5 MW plus steam
Dominion Multitrade (sawdust and wood chips) 80 MW of electricity and steam
Dominion Altivista (wood chips co-fired with coal) 2 MW electricity
21 Landfill Gas generating plants 20.6 MW electricity
Sussex County Landfill Process gas for Honeywell in Hopewell
Wood pellet manufacturing plants Wood pellets for domestic/export markets
Six industrial CHP (wood, wood waste, black liquor) 182 MW electricity and steam
Institutional boilers such as Piedmont Geriatric Hospital and Longwood University
Steam
Piedmont Bioproducts Green diesel
Five in-state biodiesel producers Biodiesel
Osage Ethanol
Five commercial biodiesel plants (soy, canola, waste greases)
Biodiesel
Farm and coop biodiesel operations (unknown number) Biodiesel; filtered vegetable oil
Louisa County pellet plant Wood pellets
96 VEPT, http://www.energy.vt.edu/vept/renewables/biomass/renew_gen.asp, June 29, 2010 97 Virginia Cooperative Extension, “Preliminary Residual Biomass Inventory for the Commonwealth of Virginia: Geographic Information System Based Multi-Feedstock Bioresidue Assessment”
Section 6 – Renewables Page 6-4

Virginia has substantial biomass resources. While the total amount available has not been inventoried, some individual biomass resource assessments have been completed.
Table 6-3: Biomass and Waste Inventories
Type of Biomass Amount of Resource
Wood 16 million acres of forestland
Forest slash 2,253,244 dry tons
Sawdust and sawmill waste 2,538,140 dry tons
Crop residues 750,137 dry tons
Animal wastes 1,045,946 dry tons
Municipal solid waste 2,016,587 tons
Landfill gas 66 landfills; 21 operational projects;
11 candidate landfills
Construction debris 593,211 tons
Food processing waste 763,022 tons
The law establishing Virginia’s Renewable Portfolio Standard (RPS) placed a 1.5 million ton per year limit on use of woody material also used for paper manufacturing under the RPS.
Multiple biomass-fired projects are under development. A sample of announced projects include:
o Biomass co-firing in the Dominion Virginia City Hybrid Generating Station;
o Fauquier County Landfill WTE project;
o Two construction debris pellet plants in the Richmond region (Cephas Industries, Environmental Solutions);
o Greensville wood pellet plant;
o Van de Hyde Dairy digester in Pittsylvania County;
o Wise County Correctional Unit waste wood burner;
o Roanoke Regional Water Treatment Plant biogass digester;
o Christiansburg Water Treatment Plant biogass digester;
o Women’s Correctional Center biomass boiler; and
o Three LFG projects (Rockingham Hospital, Toigo Greenhouse, Martinsville Landfill) using the gas for heat and hot water and generating electricity.
The Virginia Coastal Energy Research Consortium (VCERC) operates a test site growing algae to be used in producing biodiesel and other drop-in liquid fuels.
o VCERC is developing an algae-to-biodiesel reformer technology to produce biodiesel meeting ASTM commercial diesel specifications.98
98 The VCERC Algae Research Report is available at: http://www.vcerc.org/VCERC%20Final%20Report%20--%20Algal%20Biodiesel%20Studies.pdf
Section 6 – Renewables Page 6-5

The Virginia Institute for Marine Sciences is working with Statoil and other partners to develop the technology to grow algae in open water. The algae would be harvested for diesel fuel production.
The Hopewell wastewater treatment plant is developing an algae project to strip excess nutrients out of the wastewater in algae ponds. The algae will be available as a feedstock for energy production.
Hydroelectric Power
Virginia is home to 24 conventional hydropower facilities with a combined capacity of 439 megawatts, and two pumped storage facilities with a combined capacity of 2756 megawatts.
Table 6-4: Conventional Hydropower Generation
Year Owner Name County
Summer Capacity
(MW) 1927 Allegheny Energy Supply Co LLC Luray Page 1.6 1923 Allegheny Energy Supply Co LLC Newport Page 1.4 1912 Appalachian Power Co Buck Carroll 8.4 1912 Appalachian Power Co Byllesby 2 Carroll 21.6 1939 Appalachian Power Co Claytor Pulaski 74.8 1964 Appalachian Power Co Leesville Campbell 40 1954 Appalachian Power Co Niagara Roanoke 3.6 1903 Appalachian Power Co Reusens Campbell 22.5 1993 Appomattox River Associates LP Brasfield Appomattox 3
1933 & 1981 Aquenergy Systems Inc
Fries Hydroelectric Project Grayson 5.4
1987 Bedford City of Snowden Amherst 5 1938 Danville City of Pinnacles Patrick 11.1 1930 Dominion Virginia Power Cushaw Amherst 7.5 1987 Dominion Virginia Power North Anna Louisa 1
1920 Georgia Pacific Corp-Big Island Mill Georgia Pacific Big Island Bedford 0.4
1983 Holcomb Rock Company Coleman Falls Bedford 1.5 1920 Holcomb Rock Company Holcomb Rock Bedford 1.8 1924 Martinsville City of Martinsville Henry 1.3 1934 Radford City of Radford Pulaski 1
1986 Ridgewood Power Management LLC Emporia Greensville 2.4
1915 Ridgewood Power Management LLC Halifax Halifax 1.6
1990 STS HydroPower Ltd Schoolfield Dam Pittsylvania 4.5 1952 & 1953 USCE-Wilmington District John H Kerr Mecklenburg 204 1953 USCE-Wilmington District Philpott Lake Henry 14
Section 6 – Renewables Page 6-6

Table 6-5: Pumped Storage Power Plants
Plant Capacity (MW)
Dominion Bath Power Station 2100
Appalachian Power Smith Mountain Lake 656
Most sites in Virginia capable of hosting hydroelectric power generation have been developed.
There are a few low-head hydro sites with existing impoundments available for development.
o An inventory of potential sites was completed in the 1980s.
o The cost of cleaning out sediment in the impoundment and retrofitting the dams, fish ladders, and power plants have has been the primary impediment to developing these sites.
o A few impoundments are being removed to open streams to fish migration.
Onshore Wind
Onshore wind resources suitable for commercial wind power generation are found along the ridges of the Appalachian Mountains and along the coast.
The Virginia Wind Energy Collaborative provides support to individuals and localities to assess the proper locations for and uses of wind power generation. The Collaborative provides, among other products, maps showing wind speeds and wind densities at varying heights above the ground to help identify suitable locations for wind projects.
Figure 6-2: Virginia Wind Speeds – 70 meter height
Section 6 – Renewables Page 6-7

There are a number of onshore wind projects under development in Virginia, including:
o One 39 megawatt wind project is under construction in Highland County;
o Two wind developers have proposed commercial scale wind farms in Wise and Roanoke Counties; and
o Community-scale wind projects (one to five megawatts in size) have been proposed for the NASA facility on Wallops Island and on Port Isabel near Tangier Island.
Onshore wind resources suitable for farm or residential wind generation are found in many areas across Virginia. These projects typically qualify for net metering installations.
o Suitability of any site must be assessed on a case-by-case basis.
o The Virginia Wind Energy Collaborative developed the Wind Landscape Classification System for Virginia to assist landowners and local officials assess the suitability of sites for wind projects.
Wind power only provides power when wind speeds are sufficient to run the turbines.
o The percent of time a power plant runs is called its capacity factor, typically around 30 percent for Virginia onshore wind sites.
o Intermittency means that the generation resource cannot be fully counted as generation capacity and other generation capacity must be available to provide power at times the wind projects are not generating.
Wind projects have high capital costs and low marginal or operating costs. The average wholesale cost of power from a new onshore wind project in 2008 ran about five cents per kilowatt hour, including the effects of federal tax credits and production grants.99
o Virginia projects would typically be on the high side of cost estimates as they would be smaller and would have increased construction costs due to ridge location.
Figure 6-3: Capacity-Weighted Average Wind Power Prices, 1999-2008100
99 Researchers at the Lawrence Berkley Laboratory’s Energy and Environment Division, in an Alternative Windpower Ownership Structures: Financing Terms and Project Costs, estimate that a typical 50-MW wind plant would deliver power at just under 5 cents/kWh if financed by a wind developer.
100 Lawrence Berkley Laboratory, 2008 Wind Technologies Market Report, http://www1.eere.energy.gov/windandhydro/pdfs/46026.pdf, page 26, June 29, 2010
Section 6 – Renewables Page 6-8

Offshore wind projects support multiple jobs during their construction. They require few employees for operation and maintenance.
Offshore Wind
Virginia has substantial offshore wind resources, primarily in federal waters.
o The Virginia Coastal Energy Research Consortium (VCERC) has completed two years of study on offshore wind.
o They show there is over 3,000 megawatts of offshore wind capacity in waters with depth less than 30 meters. This depth allows use of conventional foundations, improving the cost effectiveness of the technology.101
Figure 6-4: Virginia Offshore Wind Potential Analysis
101 The VCERC offshore wind study is available at: http://www.vcerc.org/VCERC_Final_Report_Offshore_Wind_Studies_Full_Report_newest.pdf
Section 6 – Renewables Page 6-9

The high-voltage transmission grid is located close to the shore in Virginia Beach, offering lower cost connection of offshore wind projects to the grid.
Figure 6-5: Offshore Wind Grid Access Points102
The Port of Hampton Roads offers highly suitable port, manufacturing, and project development sites to support offshore wind development and wind turbine and supply chain manufacturing.103
Offshore wind can support new jobs in project construction and operation, and in supply chain businesses.
Offshore wind technology is estimated to cost between $125 and $225 per megawatt hour (12.5 to 22.5 cents per kilowatt hour). This would not be competitive with other power sources in today’s market.
VCERC estimates capital cost for a 588-megawatt wind project offshore Virginia to be (2008 dollars):
o Plant cost at offshore busbar: $ 1,748 million
o Transmission cost to Fentress: $ 153 million
o Total plant investment: $ 1,901 million (~ $3,230 / kW)
102 Presentation at the Virginia Manufacturing Association, 2010 Energy Summit, VIRGINIA WIND POWER OPPORTUNITIES - JOBS FOR VIRGINIA, March 2010 103 The VCERC port study is available at: http://www.vcerc.org/FINAL%20HRMARITIME.pdf
Section 6 – Renewables Page 6-10

Figure 6-6: Capital Cost Categories for Offshore Wind
Two companies have submitted unsolicited proposals to the federal Bureau of Ocean Energy Management, Regulation and Enforcement (BOE), formerly the Minerals Management Service, to lease waters off of Virginia’s coast for offshore wind development.
The BOE is the leasing agent for offshore waters suitable for offshore wind development.
o The BOE, the state government, and interested localities are developing a Request for Interest to start the leasing of offshore Virginia waters for wind development.
Offshore wind projects will need to be developed in areas not in conflict with Navy and other Department of Defense shipping, fishery, and other uses of the offshore areas.
Virginia Governor McDonnell has joined the U.S. Secretary of the Interior and governors from nine other states to form the Offshore Atlantic Wind Energy Consortium to cooperate on developing offshore wind resources along the Atlantic coast.
Regional electric transmission issues affecting wind are addressed through the PJM Interconnection.
o PJM has begun an effort to assess the effect of state renewable portfolio standards and plans for offshore and onshore wind development. PJM plans to include these factors in its 2011 Regional Transmission Expansion Plan (RTEP).
The Federal Energy Regulatory Commission (FERC) policies and cost-allocation structures that socialize costs by providing all end-users to pay for transmission system upgrades may subsidize transmission of Midwestern wind to the East Coast and undermine the economics of offshore wind and other Virginia-based renewable electricity resources.
Section 6 – Renewables Page 6-11

Solar Power
Solar-power can be used to generate electricity through photovoltaic cells or concentrating thermal plants, or to produce hot water for domestic or commercial use.
Virginia has ample solar intensity to support photovoltaic and thermal uses. Virginia is not suited for concentrating thermal systems.
Figure 6-7: Solar Resource Map
Solar system owners can take advantage of Virginia’s net metering laws to sell excess power generation back to the owner’s electric utility.
Solar systems can be cost effective when the installation avoids installation of electric line extensions.
Solar is an intermittent power source, only generating power when the sun shines.
o Battery technologies provide the potential to solve the intermittency problem with solar. Additional research and development leading to scale-manufacturing is needed to bring battery costs down.
Solar thermal systems are cost effective for hot water and swimming pool heating.
o Solar hot water systems typically have a five to eight year simple payback when compared to electric hot water heating.104
o Newer technologies, such as evacuated tube collectors, have the potential to improve the cost effectiveness of solar thermal systems.
104 House Energy, Solar Energy Systems Costs and Payback, http://www.house-energy.com/Solar/Costs-Payback-Solar.htm; and the Florida Solar Energy Center, Solar Hot Water simple calculator, http://www.fsec.ucf.edu/en/consumer/solar_hot_water/homes/calculator/SHW-calculator_simple.xls, June 13, 2010
Section 6 – Renewables Page 6-12

Geothermal Energy
Geothermal energy can provide heating and cooling through use of geothermal heat pumps.
York County Schools have geothermal systems operating wells in nine school facilities. Energy costs for a typical York County geothermal school were reduced by approximately $60,000 per year.
Figure 6-3: Geothermal Heat Pump and Traditional Heating and Cooling Energy Costs105
There are limited low-temperature geothermal resources in Bath County that are suitable for water and space heating.
Hot-rock geothermal resources are found near the Virginia Atlantic coastline. Due to the depth of these rocks, they are not economical with current technology.
105 York County Schools, Green YCSD Geothermal Heating and Cooling, http://yorkcountyschools.org/greenYCSD/geothermal.aspx
Section 6 – Renewables Page 6-13

SECTION 7 - PETROLEUM Petroleum Consumption
Petroleum is used primarily to fuel transportation (65 percent) and as heating oil (20 percent). Smaller amounts are used for aviation (8 percent) and off-road use (5 percent). Use of propane accounts for the remaining two percent.
Figure 7-1: Petroleum Consumption, 2008106
92,929,86953%
20,878, 69812%
9,474,3575%
14,946,7508%
34,001,48819%
1,179,2981% 2,858,298
2%
Gasoline On-road Diesel
Off-road Diesel
Aviation Kerosene & Heating Residual
Propane
Petroleum use grew on average one percent per year from 1989 through 1998. Use has
been stabile since 1999 as vehicle miles traveled stabilized and the oldest, low-mileage vehicles aged out of the fleet.
Virginians used approximately 219.8 million gallons of propane in 2008. 107
o This was 2.21 percent of the propane used nationwide.
o The 2000 U.S. Census reports that 5.1 percent of households in Virginia use propane or bottled gas for space heating.
106 U.S. Energy Information Administration, http://tonto.eia.doe.gov/dnav/pet/PET_CONS_PRIM_DCU_SVA_A.htm 107 Source: American Petroleum Institute
Section 7 – Petroleum Page 7-1

Figure 7-2: Propane Consumption, 2008108
48.6%
20.6%
5.2%
5.3%
18.0%
2.3%
Residential
Commercial
Cylinder
Internal Combustion
Industrial
Farm
Petroleum consumption is affected by the distance people drive and use of alternate forms of transportation.
o Virginia has 160,097 lane miles of Interstate, state primary, state secondary, and local roads, 109 providing an extensive, state-maintained road system reaching all communities across the state.
o Virginia’s mass transit network primarily serves the eastern part of the state. Virginia’s mass transit resources include:
Amtrak routes on the I-95 corridor and I-64 to Newport News, from Washington DC through Charlottesville, Lynchburg, and Danville to the Gulf Coast; and through Charlottesville, Staunton, and Clifton Forge to the Midwest;110
Virginia Rail Express, from Fredericksburg and Manassas to Washington DC;
Metro (subway) in the Washington DC area;
Intracity buses in urban areas and van service in many rural areas; and
Intercity bus service serving much of the state.
o New light rail lines are under construction in Norfolk and under development in Northern Virginia.
108 National Propane Gas Association, http://www.npga.org/files/public/Economic_Study_Propane_Value_Final.pdf 109 http://www.fhwa.dot.gov/policyinformation/statistics/2008/hm60.cfm 110 For Virginia Amtrak routes, see http://amtrakvirginia.com/
Section 7 – Petroleum Page 7-2
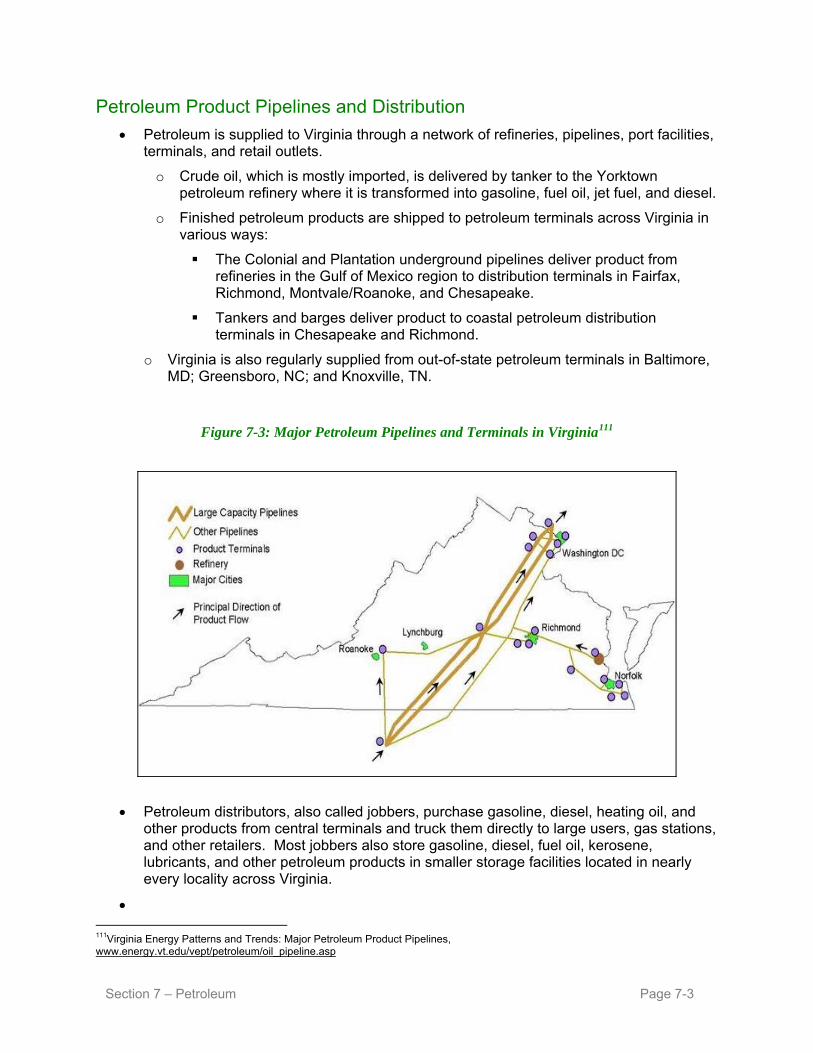
Petroleum Product Pipelines and Distribution
Petroleum is supplied to Virginia through a network of refineries, pipelines, port facilities, terminals, and retail outlets.
o Crude oil, which is mostly imported, is delivered by tanker to the Yorktown petroleum refinery where it is transformed into gasoline, fuel oil, jet fuel, and diesel.
o Finished petroleum products are shipped to petroleum terminals across Virginia in various ways:
The Colonial and Plantation underground pipelines deliver product from refineries in the Gulf of Mexico region to distribution terminals in Fairfax, Richmond, Montvale/Roanoke, and Chesapeake.
Tankers and barges deliver product to coastal petroleum distribution terminals in Chesapeake and Richmond.
o Virginia is also regularly supplied from out-of-state petroleum terminals in Baltimore, MD; Greensboro, NC; and Knoxville, TN.
Figure 7-3: Major Petroleum Pipelines and Terminals in Virginia111
Petroleum distributors, also called jobbers, purchase gasoline, diesel, heating oil, and other products from central terminals and truck them directly to large users, gas stations, and other retailers. Most jobbers also store gasoline, diesel, fuel oil, kerosene, lubricants, and other petroleum products in smaller storage facilities located in nearly every locality across Virginia.
111Virginia Energy Patterns and Trends: Major Petroleum Product Pipelines, www.energy.vt.edu/vept/petroleum/oil_pipeline.asp
Section 7 – Petroleum Page 7-3

The petroleum product supply chain has a limited ability to respond to delivery disruptions such as from storms, pipeline problems, or panic buying runs. On average, there is a larger volume of empty capacity in vehicle gas tanks than there is in the entire fuel delivery system.
The majority of Virginia’s propane gas is supplied by the interstate propane pipeline terminating in Apex, North Carolina, and the water-based terminal in Chesapeake.
Propane is trucked from the North Carolina and Chesapeake terminals to bulk plants, and then distributed to end users.
Figure 7-4: Propane Pipelines and Major Terminals112
Legend
Major LPG Pipeline
Major Product Import Terminal
112 Harry Hunter Hanger, Jr., Atlantic Energy Import Terminal, Presentation to the Pennsylvania Public Utility Commission Winter Meeting, November 9, 2006
Section 7 – Petroleum Page 7-4

Petroleum Prices
Petroleum price and availability are affected more by national and international policies and events than from in-state factors. These include:
o Political instability in oil producing countries;
o Drops in productivity in some oil producing regions;
o Effects of weather such as Gulf of Mexico hurricanes; and
o Growth in demand in international markets such as China, India, Central America, and the Middle East.
Gasoline prices have been volatile over time, increasing to $4.04 in June 2008 and dropping to $2.51/gallon 15 months later in September 2009.113
Gasoline prices trended higher from year to year until 2009 when they declined.
Table 7-1: Gasoline Prices, 1993-2009114
Year Average Retail Gasoline – Price
per Gallon (Including Federal and State Gasoline Taxes)
1993 1.033 1994 1.035 1995 1.136 1996 1.231 1997 1.211 1998 1.028 1999 1.115 2000 1.467 2001 1.373 2002 1.330 2003 1.534 2004 1.853 2005 2.306 2006 2.588 2007 2.794 2008 3.297 2009 2.366
The Energy Information Administration (EIA) predicts that petroleum prices will rise over the next ten years,115 with annual refined petroleum prices (nominal dollars) to increase from $2.69/gallon (including taxes) in 2010 to $4.12/gallon by 2020.
113 EIA, Petroleum Navigator, http://www.eia.gov/dnav/pet/hist/LeafHandler.ashx?n=pet&s=mg_tt_1c&f=m, June 29, 2010 114 EIA, Petroleum Navigator, http://www.eia.gov/dnav/pet/hist/LeafHandler.ashx?n=PET&s=MG_TT_1C&f=A, June 29, 2010 115 EIA, Gasoline Prices by Formulation, Virginia, Sales to End Users, Average Through Retail Outlets, http://www.eia.doe.gov/dnav/pet/hist/LeafHandler.ashx?n=pet&s=d100613512&f=m, June 1, 2010
Section 7 – Petroleum Page 7-5

Figure 7-5: U.S. Gasoline and Crude Oil Prices 2006 to 2012 ($/gal) 116
U.S. Gasoline and Crude Oil Prices
Forecast
1.00
1.50
2.00
2.50
3.00
3.50
4.00
4.50
Jan 2006 Jan 2007 Jan 2008 Jan 2009 Jan 2010 Jan 2011
0.00
0.50
1.00
1.50
2.00
2.50
3.00
3.50
Source: Short-Term Energy Outlook, June 2010
Note: Crude oil price is refiner average acquisition cost. Retail gasoline price includes State and Federal taxes.
Retail regular gasoline
Note: The different axis scales imply a "normal" $1.00/gallon markup of retail gasoline over the average cost of crude oil.
dollars per gallon dollars per gallon
Crude oil
Petroleum product prices are also affected by changes in delivered input costs.
o Crude oil prices were about $68/barrel in 2007, accounting for 58 percent of the $2.80/gallon regular grade gasoline price; $100/barrel in 2008, accounting for 69 percent of the $3.25/gallon price; and $62/barrel in 2009, accounting for 61 percent of the $2.34/gallon price.117
116 EIA, 2010 Annual Energy Review, Petroleum Product Prices, http://www.eia.doe.gov/oiaf/aeo/excel/aeotab_12.xls, June 1, 2010 117 EIA, A Primer on Gasoline Prices, http://www.eia.doe.gov/bookshelf/brochures/gasolinepricesprimer/index.html, June 1, 2010
Section 7 – Petroleum Page 7-6

Propane prices (residential) have been less volatile than petroleum prices, ranging from $3.09/gallon in October 2008 to $2.27 in October 2009. Annual prices are projected to increase from $2.12/gallon in 2010 and up to $3.17 in 2020.
Table 7-2: East Coast Propane Residential Price118
Year Residential Price 2000 $1.43 2001 $1.51 2002 $1.33 2003 $1.60 2004 $1.82 2005 $2.09 2006 $2.28 2007 $2.54 2008 $2.93 2009 $2.68
Conservation
Use of petroleum can be reduced through:
o Driving more efficiently;
o Driving less – lowering Vehicle Miles Traveled (VMT) through increased use of mass transit and transit-oriented development; and
o Weatherizing facilities to more efficiently use fuel oil for heating.
Petroleum Production
Virginia’s oil and gas operators produced 15,712 barrels of oil in 2008 from 75 stripper oil wells located in Lee, Wise, and Russell Counties, equivalent to less than one percent of the state’s annual consumption. This production is typically shipped to refineries in Kentucky for processing.
Figure 7-6: Petroleum Production in Virginia, 1960–2008119
Section 7 – Petroleum Page 7-7
118 EIA, East Coast (PADD1) Propane Residential Price, http://tonto.eia.doe.gov/dnav/pet/hist_xls/MPRREP14m.xls, June 23, 2010 119 VEPT, Historical Petroleum Production, http://www.energy.vt.edu/vept/petroleum/Historical_Production.asp
Section 7 – Petroleum Page 7-7

Offshore Oil
There is an estimated 165 million barrels of petroleum reserves in federal waters in the Virginia administrative boundary area offshore Virginia.
The value of crude oil in the Virginia offshore administrative areas could total to more than $13 billion (165 million barrels at $80/barrel).
o The ultimate value will depend on the actual amount of recoverable resources and the cost of oil.
Offshore oil production would support infrastructure expansion in Hampton Roads, attracting new business and creating jobs in the supply chain and for exploration and production.
Developing offshore oil resources is dependent on an extensive federal lease sale and permitting process.
Offshore extraction will need to be compatible with Department of Defense operations in Virginia offshore waters. Federal-state cooperation can lead to developing a compatible exploration and production plan.
The Bureau of Ocean Energy Management, Regulation and Enforcement (formerly Minerals Management Service) has suspended offshore leases until the causes of the 2010 Deepwater Horizon accident and oil spill are better understood and suitable protections are put in place.
Figure 7-7: 2007-2012 Mid-Atlantic OCS Proposed Lease Area120
120Source: U.S. Department of the Interior, MMS, Proposed Final Program of the Outer Continent Oil and Gas Leasing Program, 2007–2012, April 2007, map 9, p. 68
Section 7 – Petroleum Page 7-8

Petroleum Refining
The state is home to one oil refinery in Yorktown.
o Production capacity is 70,000 barrels of petroleum products per day, or 25 million barrels per year, less than 15 percent of the state’s use.121
o It is ranked 90th in size out of the 143 U.S. refineries.
o Crude feedstock comes from Canada, the North Sea, South America, and the Far East, delivered by barge and tanker to the dock on the York River.
o Products include gasoline, diesel, propane, butane, heavy fuel oils, and petroleum coke.
The market for gasoline and diesel has been challenging for refiners in 2009 and 2010.
o Demand has dropped with the drop in economic activity.
o Capacity additions are underway, primarily at Port Arthur, Texas, and Daryville, Louisiana, totaling 500,000 barrels per day.
Adequacy of Supply
There is sufficient capacity to supply petroleum products to users in Virginia under normal situations through the pipeline, tank farm, and distribution system.
Disruptions in Gulf of Mexico supply or petroleum product pipelines will disrupt supply in multiple states, including Virginia.
Virginia is updating its Energy Assurance Plan to enhance the Commonwealth’s ability to respond to a supply disruption. This includes cooperation with petroleum distribution and pipeline companies, other states, and the federal government
121 About Western Refining/Refining, http://www.wnr.com/Refining.aspx, June 24, 2010
Section 7 – Petroleum Page 7-9

SECTION 8 – FINDINGS, GOALS, AND RECOMMENDATIONS
Findings In completing the 2010 Virginia Energy Plan, we find:
Growing Virginia’s economy and supporting the quality of life of our citizens requires a diverse portfolio of energy supplies. We must continue to rely on traditional energy sources such as coal, natural gas, nuclear, and petroleum, while at the same time making alternate sources such as biomass, wind, hydro, and solar a larger part of our energy mix.
Virginia has ample in-state energy resources. Virginia’s energy businesses can generate new jobs and investment developing these resources.
Virginia’s consumers have the opportunity to use energy resources more efficiently. Expanding conservation and efficiency will support new jobs for Virginians, reduce waste of our natural resources, and keep our financial resources inside the state’s economy.
Developing new and emerging energy technologies will require public universities and private businesses to partner in energy research and development, manage shared intellectual property, and expand the energy business sector in the Commonwealth.
Virginia’s energy environment is complex and dynamic. Therefore, the Department of Mines, Minerals and Energy will review and revise this plan periodically over the next four years in order to stay on target making Virginia the Energy Capital of the East Coast.
Goals and Recommendations 2. Make Virginia the Energy Capital of the East Coast.
Grow both traditional and alternative energy production, jobs, and investment in Virginia.
Increase the use of conservation and efficiency in Virginia’s homes and businesses, and support the establishment and expansion of energy efficiency businesses.
Goal 1 Recommendations:
Grow in-state production of energy, with resulting jobs and investment, by 20 percent over the next 10 years.
o Begin offshore natural gas and oil development, and expand onshore oil and gas development in Virginia, through an open regulatory process that facilitates safe and environmentally sound energy production and eases market entry for new and expanding oil and gas businesses.
o Develop the environmental response infrastructure to support offshore oil and gas production so the systems are in place when development is allowed in the future.
o Expand development of renewable resources, particularly using biomass, waste, and wind resources, to generate electricity and produce liquid fuels. Particular emphasis should be placed on activities that provide secondary benefits such as water quality improvements.
Section 8 - Recommendations Page 8-1

Provide green job tax credits and other financial support to companies providing new jobs and investments in clean energy production. Support should be based on a positive return on investment to the Commonwealth and its localities for their support.
Revise the solar photovoltaic manufacturing incentive grant fund to broadly cover renewable energy manufacturing businesses.
Provide an efficient permitting process for biomass, wind, and other alternate energy resources to facilitate timely project development consistent with good environmental protection.
Support the private sector’s efforts to grow Virginia’s offshore wind development and supply chain industries. This should include:
Supporting work of the Virginia Coastal Energy Research Consortium (VCERC) and the Virginia Offshore Wind Development Authority; and
Working with the Bureau of Ocean Energy Management, Regulation and Enforcement (former Minerals Management Service) to streamline the federal offshore wind leasing process.
Support production of biomass and algae-based drop-in fuels to support military and private uses for transportation and heating.
o Support development of new electric generating resources to meet growing electric demand, including the third nuclear reactor at the North Anna Power Station and new base-load, intermediate load, and peaking generation from conventional resources.
o Support the development of the new generation of nuclear power plants, such as the AREVA Generation III+ boiling water reactor (BWR) and the B&W mPower reactor, and the manufacturing of plant components.
o Facilitate partnerships between Virginia’s electric utilities and private generation developers where private developers can deliver power more cost competitively for ratepayers.
o Facilitate development of private power projects to serve out-of-state markets.
o Balance the need for low-cost power to support Virginia manufacturing, commerce, and citizens’ quality of life with the need to provide long-term, stable, clean energy supplies.
o Support expansion of distributed generation options at industrial, commercial, and residential sites.
o Assist Virginia’s coal and natural gas industries comply with state and federal requirements for safety, environmental management, and reclamation. This will lead to strong mining companies working to support the economic and environmental health of the communities in which they work.
o Complete the study of the efficacy of uranium mining in Virginia in order to decide whether the existing moratorium should be continued or removed in the Commonwealth.
Expand jobs and investment in energy efficiency services.
Section 8 - Recommendations Page 8-2

o Facilitate development of local and utility energy efficiency programs that overcome market inefficiencies and market failures that reduce investment below optimal levels.
o Support energy efficiency as a way to help low-income, elderly, and fixed-income families address their energy needs.
Provide necessary systems to support delivery of energy resources under emergency conditions, addressing civilian and military needs.
3. Expand public education about Virginia’s energy production and consumption, its effect on our economy, and how Virginians can use energy more efficiently.
Goal 2 Recommendations:
Implement State Corporation Commission’s Virginia Energy Sense consumer energy education program.
Coordinate energy efficiency public information efforts among utility, federal, state, and local sources to provide clear and easily understandable messages to consumers.
Expand energy-related education in all phases of Virginians lives through:
o Expanding community college jobs training in areas such as energy auditing and efficiency, utility and related trade activities, and renewable system operation and maintenance; and
o Expand university programs in areas such as nuclear power, energy engineering, and environmental management.
4. Maximize the investment in clean energy research and development through the work of the Universities Clean Energy Development and Economic Stimulus Foundation.
Goal 3 Recommendations:
Coordinate energy R&D actions among universities and private companies to maximize value of state resources.
o Working with the Lieutenant Governor, serving as the Chief Job Creation Officer, and Cabinet offices, coordinate resources available through the Tobacco Commission, Virginia Economic Development Partnership, Departments of Mines, Minerals and Energy, Agriculture and Consumer Services, and Business Assistance to optimize growth of energy jobs across Virginia.
o Implement Virginia Universities Clean Energy Development and Economic Stimulus Foundation.
o Establish the Virginia Energy Initiative to bring together research capabilities of our major research universities under one canopy to help focus efforts on developing energy technologies for the 21st century.
o Promote development of offshore oil and gas development as a source of VCERC research and development funding.
o Support R&D for clean coal technologies and carbon sequestration.
o Work with the Virginia Tobacco Commission, private sector energy leaders, community colleges, and our major research universities to establish Southside and Southwest Virginia as the nation’s hub for traditional and alternative energy research and development.
Section 8 - Recommendations Page 8-3
APPENDIX – CODE OF VIRGINIA, TITLE 67, VIRGINIA ENERGY PLAN
Chapter 1 - Energy Policy of the Commonwealth
§ 67-100. Legislative findings.
The General Assembly hereby finds that:
1. Energy is essential to the health, safety, and welfare of the people of this Commonwealth and to the Commonwealth's economy;
2. The state government should facilitate the availability and delivery of reliable and adequate supplies of energy to industrial, commercial, and residential users at reasonable costs such that these users and the Commonwealth's economy are able to be productive; and
3. The Commonwealth would benefit from articulating clear objectives pertaining to energy issues, adopting an energy policy that advances these objectives, and establishing a procedure for measuring the implementation of these policies.
§ 67-101. Energy objectives.
The Commonwealth recognizes each of the following objectives pertaining to energy issues will advance the health, welfare, and safety of the residents of the Commonwealth:
1. Ensuring the availability of reliable energy at costs that are reasonable and in quantities that will support the Commonwealth's economy;
2. Managing the rate of consumption of existing energy resources in relation to economic growth;
3. Establishing sufficient supply and delivery infrastructure to maintain reliable energy availability in the event of a disruption occurring to a portion of the Commonwealth's energy matrix;
4. Using energy resources more efficiently;
5. Facilitating conservation;
6. Optimizing intrastate and interstate use of energy supply and delivery to maximize energy availability, reliability, and price opportunities to the benefit of all user classes and the Commonwealth's economy as stated in subdivision 2 of § 67-100;
7. Increasing Virginia's reliance on sources of energy that, compared to traditional energy resources, are less polluting of the Commonwealth's air and waters;
8. Researching the efficacy, cost, and benefits of reducing, avoiding, or sequestering the emissions of greenhouse gases produced in connection with the generation of energy;
Appendix Page i

9. Removing impediments to the use of abundant low-cost energy resources located within and outside the Commonwealth and ensuring the economic viability of the producers, especially those in the Commonwealth, of such resources;
10. Developing energy resources and facilities in a manner that does not impose a disproportionate adverse impact on economically disadvantaged or minority communities;
11. Recognizing the need to foster those economically developable alternative sources of energy that can be provided at market prices as vital components of a diversified portfolio of energy resources; and
12. Increasing Virginia's reliance on and production of sustainably produced biofuels made from traditional agricultural crops and other feedstocks, such as winter cover crops, warm season grasses, fast-growing trees, algae or other suitable feedstocks grown in the Commonwealth that will create jobs and income, produce clean-burning fuels that will help to improve air quality, and provide the new markets for Virginia's silvicultural and agricultural products needed to preserve farm employment, conserve farmland and forestland, and increase implementation of silvicultural and agricultural best management practices to protect water quality.
Nothing in this section shall be deemed to abrogate or modify in any way the provisions of the Virginia Electric Utility Regulation Act (§ 56-576 et seq.).
§ 67-102. Commonwealth Energy Policy.
A. To achieve the objectives enumerated in § 67-101, it shall be the policy of the Commonwealth to:
1. Support research and development of, and promote the use of, renewable energy sources;
2. Ensure that the combination of energy supplies and energy-saving systems are sufficient to support the demands of economic growth;
3. Promote research and development of clean coal technologies, including but not limited to integrated gasification combined cycle systems;
4. Promote cost-effective conservation of energy and fuel supplies;
5. Ensure the availability of affordable natural gas throughout the Commonwealth by expanding Virginia's natural gas distribution and transmission pipeline infrastructure; developing coalbed methane gas resources and methane hydrate resources; encouraging the productive use of landfill gas; and siting one or more liquefied natural gas terminals;
6. Promote the generation of electricity through technologies that do not contribute to greenhouse gases and global warming;
7. Facilitate the development of new, and the expansion of existing, petroleum refining facilities within the Commonwealth;
Appendix Page ii

8. Promote the use of motor vehicles that utilize alternate fuels and are highly energy efficient;
9. Support efforts to reduce the demand for imported petroleum by developing alternative technologies, including but not limited to the production of synthetic and hydrogen-based fuels, and the infrastructure required for the widespread implementation of such technologies;
10. Promote the sustainable production and use of biofuels produced from silvicultural and agricultural crops grown in the Commonwealth, and support the delivery infrastructure needed for statewide distribution to consumers;
11. Ensure that development of new, or expansion of existing, energy resources or facilities does not have a disproportionate adverse impact on economically disadvantaged or minority communities; and
12. Ensure that energy generation and delivery systems that may be approved for development in the Commonwealth, including liquefied natural gas and related delivery and storage systems, should be located so as to minimize impacts to pristine natural areas and other significant onshore natural resources, and as near to compatible development as possible.
B. The elements of the policy set forth in subsection A shall be referred to collectively in this title as the Commonwealth Energy Policy.
C. All agencies and political subdivisions of the Commonwealth, in taking discretionary action with regard to energy issues, shall recognize the elements of the Commonwealth Energy Policy and where appropriate, shall act in a manner consistent therewith.
D. The Commonwealth Energy Policy is intended to provide guidance to the agencies and political subdivisions of the Commonwealth in taking discretionary action with regard to energy issues, and shall not be construed to amend, repeal, or override any contrary provision of applicable law. The failure or refusal of any person to recognize the elements of the Commonwealth Energy Policy, to act in a manner consistent with the Commonwealth Energy Policy, or to take any other action whatsoever, shall not create any right, action, or cause of action or provide standing for any person to challenge the action of the Commonwealth or any of its agencies or political subdivisions.
Chapter 2 - Virginia Energy Plan
§ 67-200. Definitions.
As used in this title:
"Division" means the Division of Energy of the Department of Mines, Minerals and Energy.
"Plan" means the Virginia Energy Plan prepared pursuant to this chapter, including any updates thereto.
Appendix Page iii

§ 67-201. Development of the Virginia Energy Plan.
A. The Division, in consultation with the State Corporation Commission, the Department of Environmental Quality, and the Center for Coal and Energy Research, shall prepare a comprehensive Virginia Energy Plan covering a 10-year period. The Plan shall propose actions, consistent with the objectives enumerated in § 67-101, that will implement the Commonwealth Energy Policy set forth in § 67-102.
B. In addition, the Plan shall include:
1. Projections of energy consumption in the Commonwealth, including but not limited to the use of fuel sources and costs of electricity, natural gas, gasoline, coal, renewable resources, and other forms of energy resources used in the Commonwealth;
2. An analysis of the adequacy of electricity generation, transmission, and distribution resources in the Commonwealth for the natural gas and electric industries, and how regional generation, transmission, and distribution resources affect the Commonwealth;
3. An analysis of siting requirements for electric generation resources and natural gas and electric transmission and distribution resources;
4. An analysis of fuel diversity for electricity generation, recognizing the importance of flexibility in meeting future capacity needs;
5. An analysis of the efficient use of energy resources and conservation initiatives;
6. An analysis of how these Virginia-specific issues relate to regional initiatives to assure the adequacy of fuel production, generation, transmission, and distribution assets;
7. An analysis of siting of energy resource development, refining or transmission facilities to identify any disproportionate adverse impact of such activities on economically disadvantaged or minority communities; and
8. Recommendations, based on the analyses completed under subdivisions 1 through 7, for legislative, regulatory, and other public and private actions to implement the elements of the Commonwealth Energy Policy.
C. In preparing the Plan, the Division and other agencies involved in the planning process shall utilize state geographic information systems, to the extent deemed practicable, to assess how recommendations in the plan may affect pristine natural areas and other significant onshore natural resources.
D. In preparing the Plan, the Division and other agencies involved in the planning process shall develop a system for ascribing numerical scores to parcels of real property based on the extent to which the parcels are suitable for the siting of a wind energy facility or solar energy facility. For wind energy facilities, the scoring system shall address the wind velocity, sustained velocity, turbulence, proximity to electric power transmission systems, potential impacts to natural and historic resources and to economically disadvantaged or minority communities, and compatibility with the local land use plan. For solar energy facilities, the scoring system shall address the parcel's proximity to electric power transmission lines, potential impacts of such a facility to natural and historic resources and to economically disadvantaged or minority
Appendix Page iv

communities, and compatibility with the local land use plan. The system developed pursuant to this section shall allow the suitability of the parcel for the siting of a wind energy facility or solar energy facility to be compared to the suitability of other parcels so scored, and shall be based on a scale that allows the suitability of the parcel for the siting of a such an energy facility to be measured against the hypothetical score of an ideal location for such a facility.
E. After July 1, 2007, upon receipt by the Division of a recommendation from the Department of General Services, a local governing body, or the parcel's owner that a parcel of real property is a potentially suitable location for a wind energy facility or solar energy facility, the Division shall analyze the suitability of the parcel for the location of such a facility. In conducting its analysis, the Division shall ascribe a numerical score to the parcel using the scoring system developed pursuant to subsection D.
§ 67-202. Schedule.
A. The Division shall complete the Plan by July 1, 2007.
B. Prior to completion of the Plan and updates thereof, the Division shall present drafts to, and consult with, the Coal and Energy Commission and the Commission on Electric Utility Regulation.
C. The Plan shall be updated by the Division and submitted as provided in § 67-203 by July 1, 2010, and every four years thereafter. Updated reports shall reassess goals for energy conservation based on progress to date in meeting the goals in the previous plan and lessons learned from attempts to meet such goals.
§ 67-202.1. Annual reporting by investor-owned public utilities.
Each investor-owned public utility providing electric service in the Commonwealth shall prepare an annual report disclosing its efforts to conserve energy, including but not limited to (i) its implementation of customer demand-side management programs and (ii) efforts by the utility to improve efficiency and conserve energy in its internal operations pursuant to § 56-235.1. The utility shall submit each annual report to the Division of Energy of the Department of Mines, Minerals and Energy by November 1 of each year, and the Division shall compile the reports of the utilities and submit the compilation to the Governor and the General Assembly as provided in the procedures of the Division of Legislative Automated Systems for the processing of legislative documents.
§ 67-203. Submission of Plan.
Upon completion, the Division shall submit the Plan, including periodic updates thereto, to the Governor, the Commissioners of the State Corporation Commission, and the General Assembly. The Plan shall be submitted as provided in the procedures of the Division of Legislative Automated Systems for the processing of legislative documents. The Plan's executive summary shall be posted on the General Assembly's website.
Appendix Page v