the vietnam provincial competitiveness index 2009 · founded in 1963, the vietnam chamber of...
TRANSCRIPT
VNCI Policy Paper # 14
THE VIETNAM PROVINCIALCOMPETITIVENESS INDEX 2009
MEASURING ECONOMIC GOVERNANCE
FOR PRIVATE SECTOR DEVELOPMENT

Founded in 1963, the Vietnam Chamber of Commerce and Industry (VCCI) is a national organization that
assembles and represents the business community, employers, and business associations of all economic sectors
in Vietnam. The mission of VCCI is to protect and assist business enterprises, to contribute to the socio-economic
development of the country, and to promote economic, commercial, and technological cooperation between
Vietnam and other countries in the world.
VCCI’s two main functions are: (i) representing the Vietnamese business community through the promotion and
protection of the lawful, legitimate interests of Vietnamese enterprises and employers in domestic and international
relations; and (ii) promoting the development of business enterprises, facilitating cooperation among business
entities, and offering assistance in trade and investment, economic and technical cooperation as well as other
business activities of enterprises in Vietnam and abroad.
VNCI is a USAID-funded project that provides technical assistance to improve the business enabling environment
in top priority areas for government and business leaders. VNCI’s programs include: (i) policy advocacy using the
PCI data and other policy activities that assist the government and business sector to improve decision-making
and policy-making to achieve optimal economic performance and promote participation and transparency; (ii)
regulatory reform responding to the Prime Minister-led Decision 30 Master Plan to Simplify Administrative
Procedures, supporting the Office of the Government to design and implement reform strategies to clean up the
existing stock of regulations, apply regulatory quality control, and develop an effective regulatory framework and
policy coordination; (iii) infrastructure financing through revenue-backed bonds that leverage financial markets to
support the financing of a wide range of infrastructure projects through an effective and transparent financing
tool which takes the burden off the Government budget; and (iv) provincial reform activities that respond to
specific requests from reform-minded provinces that aspire to improve economic governance.
Visit www.pcivietnam.org or www.pci.com.vn to download this report and the PCI data

THE VIETNAM PROVINCIALCOMPETITIVENESS INDEX 2009MEASURING ECONOMIC GOVERNANCE
FOR PRIVATE SECTOR DEVELOPMENT

Primary Author and Lead Researcher:
Dr. Edmund Malesky
Research Team:
Tran Huu Huynh
Dau Anh Tuan
Le Thanh Ha
Le Thu Hien
Nguyen Ngoc Lan

FOREWORDThe Provincial Competitiveness Index (PCI) 2009 report represents the views of 9,890 Vietnameseenterprises and provides a rigorous analysis of economic governance and the regulatory environment inVietnam. Our objective since the first PCI report in 2005 has been to overcome the enormous problemsfacing enterprises in fully understanding the government’s regulations and requirements and, moreimportantly, to identify areas for improvement that will increase investment, jobs, enterprise performance,and economic growth. By the latest count, the People’s Committees of more than 40 provinces have usedthe PCI to conduct diagnostics, formulate action plans and decisions to improve performance, adopt bestpractices of high-performing provinces, and monitor progress in key areas. The consistency achieved byprovinces such as Binh Duong and Da Nang in maintaining excellent overall governance, and by Lao Cai andBen Tre in excelling in specific areas such as transparency and reducing informal charges during the last fiveyears of PCI surveys highlights the importance of leadership in making a dedicated commitment toimproving economic governance and business environment. This year’s report also emphasizes the increasingimportance that economic governance plays in investors’ decision making.
The PCI 2009 survey provides valuable information about the impact of policy reform initiatives at the centraland local levels, of which the Prime Minister’s Master Plan to Simplify Administration Procedures in StateManagement (known as Project 30) is the breakthrough regulatory reform effort in Vietnam. Its purpose is tosimplify a minimum of 30 percent of all administrative procedures at central, provincial, district, and communelevels to meet international business standards. Forty-two percent of our nationally weighted sample ofbusinesses are familiar with Project 30, which bodes well for widespread use of the first-ever Project 30 NationalDatabase of Administrative Procedures, a searchable, online database of more than 5,700 procedures and 9,500legal documents. The PCI metrics will identify problematic areas to complement Project 30’s regulatorystreamlining of the irrelevant and harmful procedures and serve as a tool to monitor progress.
PCI also supports the decentralization process by informing policy makers about gaps in policyimplementation between the national and local level and provincial leaders about how they can enhancetheir capacity and performance, and deliver better services. Many provinces, for example, have improvedtransparency in access to legal documents and information in compliance with the country’s World TradeOrganization and Bilateral Trade Agreement with the United States commitments. However, this year, firmsreport that access to planning documents, such as provincial budgets, socioeconomic plans, infrastructureplans, and land-use and zoning maps, has declined to 2006 levels. This dangerous finding deserves theimmediate attention of policy makers.
The tremendous progress, in terms of economic growth and poverty alleviation, that Vietnam has made overthe past two decades has been remarkable. But Vietnam faces an important crossroads in its economicdevelopment. To make the best possible decisions so that the country can maintain the positive momentumof its past performance requires that policy makers and investors have the best available information. Ourgoal is to provide that information through our PCI research project, a new series of policy papers on criticalissues, datasets, and policy advice for the challenges ahead.
James Packard Winkler, Ph.D
DirectorVietnam Competitiveness Initiative
Vu Tien Loc, Ph.D
ChairmanVietnam Chamber of Commerce & Industry
iTHE VIETNAM PROVINCIAL COMPETITIVENESS INDEX 2009

ii THE VIETNAM PROVINCIAL COMPETITIVENESS INDEX 2009

ACKNOWLEDGEMENTS
This report is dedicated to the memory of Susan Adams, a dear friend and mentor to all of us.
The Provincial Competitiveness Index (PCI) 2009 is the result of a major, ongoing collaborative effortbetween the Vietnam Chamber of Commerce and Industry (VCCI) and the U.S. Agency for InternationalDevelopment’s Vietnam Competitiveness Initiative (USAID/VNCI), managed by DAI.
Edmund Malesky of the University of California–San Diego led the development of the PCI’s researchmethodology and authored the presentation of its analytical findings.
Professor Malesky was supported by a PCI research team that included Tran Huu Huynh, Deputy SecretaryGeneral and Director of the Legal Department at VCCI; Dau Anh Tuan and Le Thanh Ha of VCCI; Le ThuHien and Nguyen Ngoc Lan of USAID/VNCI; and Natasha Hanshaw of the University of California–SanDiego. The translation and administration team included Nguyen Le Ha of VCCI; Tran Minh Thu, Nguyen ThiThu Hang, Do Hai Ha, Trinh Thi Hong Hanh, Trinh Thi Hang and Le Thanh Giang of USAID/VNCI. The PCIwas developed under the overall leadership of Vu Tien Loc, Chairman of VCCI, James Packard Winkler,USAID/VNCI Project Director, and benefited from valuable support and inputs provided by Do Hoang Anh,USAID/VNCI Deputy Project Director; Geoffrey Parrish and David Brunell, Directors of Economic Growthfor USAID.
Jim Anderson, Ulrich Ernst, Le Dang Doang, and Do Hong Hanh reviewed the manuscript and providedexpert commentary.
Suggested citation when referencing report or data: Malesky, Edmund. 2009. “The Vietnam ProvincialCompetitiveness Index: Measuring Economic Governance for Private Sector Development. 2009 Final Report.”Vietnam Competitiveness Initiative Policy Paper #14. Vietnam Chamber of Commerce and Industry (VCCI)and United States Agency for International Development’s Vietnam Competitiveness Inititative (VNCI):Ha Noi, Vietnam.
THE VIETNAM PROVINCIAL COMPETITIVENESS INDEX 2009 iii
Development Alternatives, Inc. (DAI) is a global consulting firm providing socialand economic development solutions to governments, communities andcompanies with projects in developing and transitioning countries. Founded in1970 and headquartered in the Washington, DC area, DAI now includescompanies in Brazil, South Africa, Palestine, the United Kingdom, Jordan, Mexicoand Pakistan. DAI’s global team of 2,000 development professionals works in 75countries. Clients include global development agencies, international lendinginstitutions, global corporations and host country governments.

The PCI research team extends special thanks to the members of our expert advisory panel, who providedvaluable insights on methodology and indicator selection.
Mme. Pham Chi Lan Senior Economist
Mr. Vu Quoc Tuan President, Association of Vietnamese Trade Villages
Mr. Nguyen Dinh Cung Vice President, Central Institute for Economic Management
Mme. Vu Xuan Nguyet Hang Vice President, Central Institute for Economic Management
Mr. Nguyen Minh Man Director of State Administration and Civil Service Department, Office of theGovernment
Mr. Lê Dang Doanh Senior Economist
Mr. Cao Sy Kiêm President, Association of Vietnamese Small and Medium-Sized Enterprises
Mr. Nguyen Van Thoi National Assembly Member and Director of the Thai Ngueyen Joint-StockExport Company
Mr. Vu Thành Tu Anh Director of Research, Harvard Fulbright Economics Teaching Program, Ho ChiMinh City
Mr. Võ Hung Dung Director, VCCI Can Tho
Mr. Nguyen Ngoc Phi Chairman, People’s Committee of Vinh Phuc
Mr. Nguyen Van Tu Vice Director of Planning and Investment Department, Hanoi
Mr. Pham Phuong Bac Vice Director of Planning and Investment Department, Bac Ninh
Mr. Trinh Van Anh Planning and Investment Departement, Dong Nai
Mr. Nguyen Thai Son Senior Expert of the Government and Member of the Committee forImplementation of the Enterprise Law and Investment Law
Mr. Cao Ba Khoat Economist, Director of K & Associates Consulting
Mr. Lê Minh Thong K & Associates Consulting
Mr. Phan Duc Hieu Vice Director, Competitiveness and Business Environment Department,Central Institute for Economic Management
Mr. Vu Quoc Huy Economist, National Economic University
Mme. Pham Thi Thu Hang Director, Center for Supporting Small and Medium Size Enterprises, VCCI
Mr. Pham Duy Nghia Legal Department, National University of Hanoi
Mr. Le Duy Binh Director, Economica
Mr. Nguyen Van Lan Economist, Mekong Private Sector Development Facility
Mr. Vu Xuan Tien Director, VFAM Consulting
Mr. Tran Phuong Senior Vice President, Head of Corporate Planning, Bank for Investment andDevelopment of Vietnam
Mr. Tran Tho Dat Vice Rector, National Economic University
Mr. Nguyen Van Thang National Economic University
Mr. Doan Hong Quang Senior Economist, World Bank
THE VIETNAM PROVINCIAL COMPETITIVENESS INDEX 2009iv
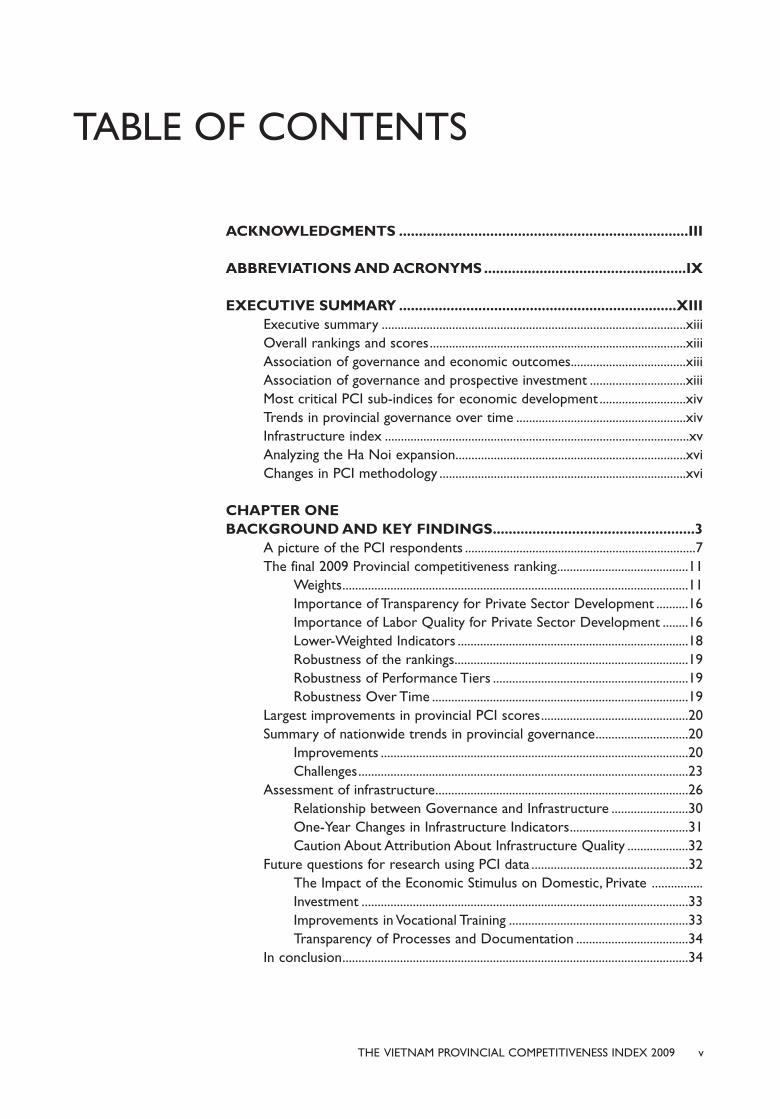
TABLE OF CONTENTS
ACKNOWLEDGMENTS .........................................................................III
ABBREVIATIONS AND ACRONYMS ...................................................IX
EXECUTIVE SUMMARY ......................................................................XIIIExecutive summary ...............................................................................................xiiiOverall rankings and scores................................................................................xiiiAssociation of governance and economic outcomes....................................xiiiAssociation of governance and prospective investment ..............................xiiiMost critical PCI sub-indices for economic development ...........................xivTrends in provincial governance over time .....................................................xivInfrastructure index ...............................................................................................xvAnalyzing the Ha Noi expansion........................................................................xviChanges in PCI methodology .............................................................................xvi
CHAPTER ONEBACKGROUND AND KEY FINDINGS...................................................3
A picture of the PCI respondents ........................................................................7The final 2009 Provincial competitiveness ranking.........................................11
Weights............................................................................................................11Importance of Transparency for Private Sector Development ..........16Importance of Labor Quality for Private Sector Development ........16Lower-Weighted Indicators ........................................................................18Robustness of the rankings.........................................................................19Robustness of Performance Tiers .............................................................19Robustness Over Time ................................................................................19
Largest improvements in provincial PCI scores..............................................20Summary of nationwide trends in provincial governance.............................20
Improvements ................................................................................................20Challenges.......................................................................................................23
Assessment of infrastructure...............................................................................26Relationship between Governance and Infrastructure ........................30One-Year Changes in Infrastructure Indicators.....................................31Caution About Attribution About Infrastructure Quality ...................32
Future questions for research using PCI data .................................................32The Impact of the Economic Stimulus on Domestic, Private ................Investment ......................................................................................................33Improvements in Vocational Training ........................................................33Transparency of Processes and Documentation ...................................34
In conclusion............................................................................................................34
THE VIETNAM PROVINCIAL COMPETITIVENESS INDEX 2009 v

CHAPTER TWO GOVERNANCE IMPACT OF HANOI’S GEOGRAPHIC EXPANSION.39
Background ..............................................................................................................39Analysis ...............................................................................................................41Matching analysis for Me Linh and Vinh Phuc ..................................................42The economic impact of exogenous governance change.............................49Conclusion ...............................................................................................................50
CHAPTER THREECHANGES IN THE PCI METHODOLOGY ...............................................................53
Dropping the SOE bias sub-index ......................................................................57Changing indicators within sub-indices .............................................................60
Entry Costs ....................................................................................................60Land Access and Security of Tenure .........................................................63Transparency ..................................................................................................66Time Costs of Regulatory Compliance ...................................................70Informal Charges...........................................................................................72Proactivity .......................................................................................................74Business Support Services ..........................................................................77Labor Policy....................................................................................................83Legal Institutions ...........................................................................................87
Changing the weighting strategy.........................................................................90
CHAPTER FOURAPPENDICES ...............................................................................................................93
Multiple Regression Analysis of Governance and Key Private SectorOutcome Variables .................................................................................................94 Multiple Regression Analysis of Governance and Provincial GDP Growth .....95DATASETS USED IN ANALYSIS.........................................................................96
THE VIETNAM PROVINCIAL COMPETITIVENESS INDEX 2009vi

TABLES
Table 1.1: Who Answers the PCI Survey? .................................................................................7
Table 1.2: PCI Sample versus Nationally Representative Sample ...............................10
Table 1.3: Sub-Index Weighting .......................................................................................................14
Table 1.4: Indicators Used in Infrastructure Index...............................................................28
Table 2.1: Re-calculated PCI for the Areas Comprising the new Hanoi ................41
Table 2.2: Propensity Score Matching Exercise for Location in Me Linh Province.....43
Table 2.3: Stratification Matching on PCI Firm Sample of Me Linh and Vinh Phuc ....45
Table 2.4: How Is the Business Environment in Me Linh (Part of New Hanoi)
Different from Vinh Phuc?............................................................................................46
Table 3.1: Scores and Correlation of PCI Sub-Indices Over Time (2006–2009) ........54
Table 3.2: Comparison of Entry Costs Sub-Index (2005–2009) ................................60
Table 3.3: Comparison of Land Access and Tenure Security Sub-Index
(2005–2009)........................................................................................................................63
Table 3.4: Comparison of Transparency Sub-Index (2005–2009) ..............................67
Table 3.5: Comparison of Time Costs of Regulatory Compliance (2005–2009) .......70
Table 3.6: Comparison of Informal Charges (2005–2009).............................................73
Table 3.7: Comparison of Proactivity (2005–2009)............................................................75
Table 3.8: Comparison of Business Support Services (2006–2009) ........................78
Table 3.9: Comparison of Labor Policy (2006–2009) .......................................................83
Table 3.10: Comparison of Legal Institutions (2006–2009)..............................................87
Table 3.11: Explanation of Approach to Sub-Index Weighting........................................91
TABLES AND FIGURES
THE VIETNAM PROVINCIAL COMPETITIVENESS INDEX 2009 vii
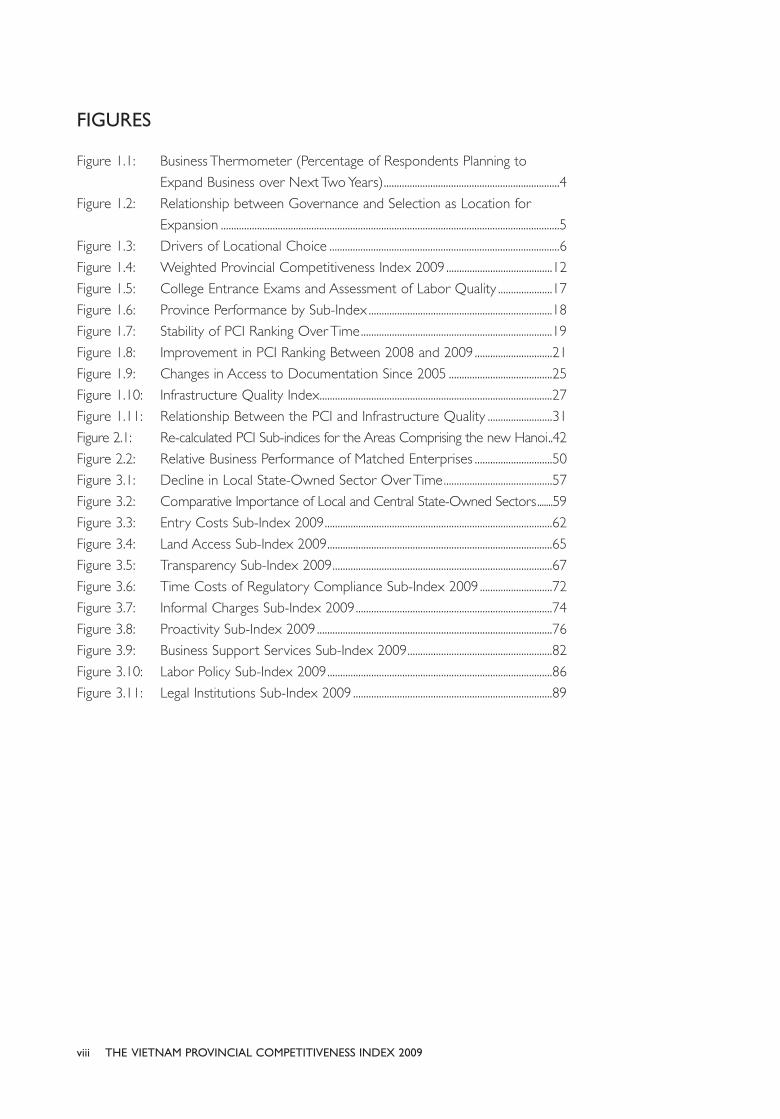
FIGURES
Figure 1.1: Business Thermometer (Percentage of Respondents Planning to
Expand Business over Next Two Years)....................................................................4
Figure 1.2: Relationship between Governance and Selection as Location for
Expansion ...................................................................................................................................5
Figure 1.3: Drivers of Locational Choice .........................................................................................6
Figure 1.4: Weighted Provincial Competitiveness Index 2009 .........................................12
Figure 1.5: College Entrance Exams and Assessment of Labor Quality .....................17
Figure 1.6: Province Performance by Sub-Index .......................................................................18
Figure 1.7: Stability of PCI Ranking Over Time..........................................................................19
Figure 1.8: Improvement in PCI Ranking Between 2008 and 2009..............................21
Figure 1.9: Changes in Access to Documentation Since 2005 ........................................25
Figure 1.10: Infrastructure Quality Index..........................................................................................27
Figure 1.11: Relationship Between the PCI and Infrastructure Quality .........................31
Figure 2.1: Re-calculated PCI Sub-indices for the Areas Comprising the new Hanoi..42
Figure 2.2: Relative Business Performance of Matched Enterprises ..............................50
Figure 3.1: Decline in Local State-Owned Sector Over Time..........................................57
Figure 3.2: Comparative Importance of Local and Central State-Owned Sectors.......59
Figure 3.3: Entry Costs Sub-Index 2009........................................................................................62
Figure 3.4: Land Access Sub-Index 2009.......................................................................................65
Figure 3.5: Transparency Sub-Index 2009.....................................................................................67
Figure 3.6: Time Costs of Regulatory Compliance Sub-Index 2009 ............................72
Figure 3.7: Informal Charges Sub-Index 2009............................................................................74
Figure 3.8: Proactivity Sub-Index 2009...........................................................................................76
Figure 3.9: Business Support Services Sub-Index 2009........................................................82
Figure 3.10: Labor Policy Sub-Index 2009.......................................................................................86
Figure 3.11: Legal Institutions Sub-Index 2009 .............................................................................89
THE VIETNAM PROVINCIAL COMPETITIVENESS INDEX 2009viii
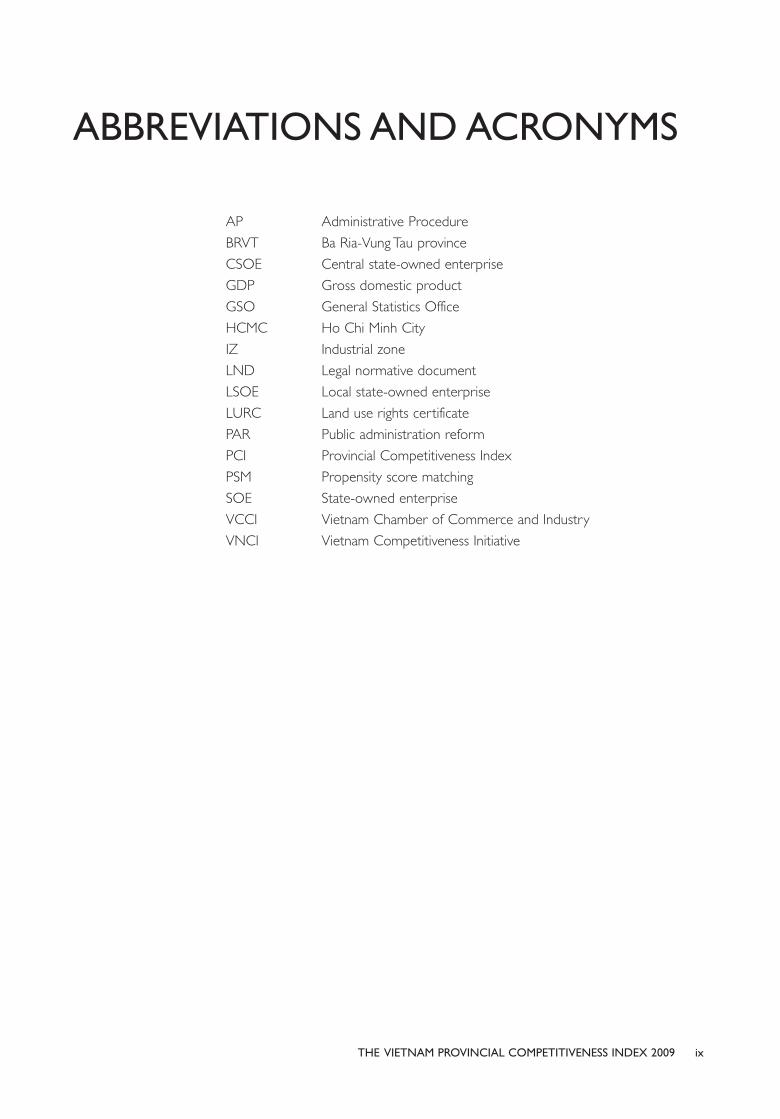
ABBREVIATIONS AND ACRONYMS
AP Administrative Procedure
BRVT Ba Ria-Vung Tau province
CSOE Central state-owned enterprise
GDP Gross domestic product
GSO General Statistics Office
HCMC Ho Chi Minh City
IZ Industrial zone
LND Legal normative document
LSOE Local state-owned enterprise
LURC Land use rights certificate
PAR Public administration reform
PCI Provincial Competitiveness Index
PSM Propensity score matching
SOE State-owned enterprise
VCCI Vietnam Chamber of Commerce and Industry
VNCI Vietnam Competitiveness Initiative
THE VIETNAM PROVINCIAL COMPETITIVENESS INDEX 2009 ix

EXECUTIVE SUMMARY

The Provincial Competitiveness Index (PCI) wasdeveloped in 2005 by the Vietnamese Chamber ofCommerce and Industry and the U.S. Agency forInternational Development-funded VietnamCompetitiveness Initiative. Since that time, the PCIhas come to be seen as a critical tool for measuringand assessing the standards of economicgovernance in Vietnam’s 63 provinces from theperspective of private sector businesses.
The year 2009, which marks the fifth iteration ofthe PCI analysis, is especially important because ittakes place during a period of declining privatesector optimism. Only 65 percent of privateoperations in Vietnam intend to expand theirbusinesses over the next two years, compared with78 percent in 2008 and 77 percent in 2007. Smallfirms have been more severely traumatized by thecurrent global economic crisis than others; only 47percent claim they plan to expand.
It is in these periods of declining businessconfidence that economic governance becomesmost important to entrepreneurial decision making.Business owners are concerned about theirprospects for the future because they are uncertainboth about economic events outside of the controlof Vietnamese policy makers and about the policydecisions of Vietnamese officials themselves. In suchan environment, clear, transparent, and fair regulatoryrules and policies become paramount for assuagingfirms’ fears and helping them make accuratepredictions about future business prospects.
Thus, the 2009 PCI can be a helpful signpost tohelp provincial policy makers address weaknesses,and thereby help private entrepreneurs overcomethe current economic hardships.
Overall rankings and scoresJust as in 2008, Da Nang is the number one rankedprovince in the country, followed closely by Binh
Duong. Once again, the two provinces arestatistically indistinguishable. Lao Cai, Dong Thap,Vinh Long and Vinh Phuc round out the tier ofexcellent performers. Cao Bang, Dak Nong, and BacKan—at the bottom of the rankings—still requirethe most improvement in provincial governance.
Association of governance andeconomic outcomesOnce again, governance scores are highly correlatedwith the size of the private sector, individualenterprise performance, and overall provincialeconomic growth1. To determine this, we regressedthese outcome variables on the unweighted PCI,controlling for measures of infrastructure (roadquality and telecommunications), structuralendowments (population size, density, and distancefrom major markets), and regional fixed effect(dichotomous variables for each region, which allowus to hold constant regionally specific history andsociocultural factors).
In each regression, the unweighted PCI score provesstatistically significant and substantively large. Inshort, better governed provinces have larger andmore successful private sectors, as well as higherlevels of economic welfare.
Association of governance andprospective investmentThis year, our analysis of the importance of economicgovernance added an additional feature. We askedbusinesses to record to which provinces, outside oftheir home province, they would likely expand ifgiven the opportunity. The variable gave us a measureof prospective investment potential for the next twoyears. Once again, governance was highly important
xiiiTHE VIETNAM PROVINCIAL COMPETITIVENESS INDEX 2009
EXECUTIVE SUMMARY
1. See Chapter Four for tables of regression results.
THE VIETNAM PROVINCIAL COMPETITIVENESS INDEX 2009xiv
maintain equipment or manage complex businessand financial processes. Firms are finding it very hardto upgrade technology and expand operationswhen they are handicapped by an insufficient talentpool. General education, vocational education, andlabor exchange bureaus in many provinces havelagged behind the business needs of many firms.Other provinces have made significant investmentsin improving their labor pool. Correspondingly, aone point improvement in the Labor sub-index isassociated with an estimated 30 percentimprovement in enterprises per capita, a 47 percentenhancement in investment per capita, and astatistically insignificant but sizable 58 million VNDincrease in profitability.
Two indicators receive quite low weights of 5percent (Land Access and Legal Institutions), but notbecause they are unimportant; rather, they aregenerally problematic across the entire country. Veryfew provinces excel on these dimensions, leading tolow variance across the country and, consequently, alow correlation with private sector outcomes. Theweights on the issues hint that moving forward onboth these dimensions requires national-level policyreform in addition to provincial initiatives, whichhave been insufficient.
Trends in provincial governanceover timeThis year’s report tracks changes in provincialgovernance over time by using changes in themedian provincial score for each indicator. Sustainedincrease in the median province’s score is evidenceof improvement in the indicator throughout thecountry as a whole. Measures of Entry Costs, Accessand Security of Land, Time Costs, Labor Quality, andConfidence in Legal Institutions show signs ofdefinitive improvement over the past year. Policymakers should be proud of these accomplishments.Worrisome declines, however, are evident in termsof Transparency, Informal Charges, and the Proactivityof local leaders.
For the median province, Time Costs of RegulatoryCompliance improved the most, after several years
in the selections, even after controlling forinfrastructure and structural endowments.
For each one point improvement in the unweightedPCI score of a province, three more investors werelikely to choose it as an investment location. This is asizable effect. By way of comparison, a 10percentage point improvement in the amount ofasphalted road would yield about the same numberof selections by potential investors.
Most critical PCI sub-indices foreconomic developmentRegression analysis on private sector developmentoutcomes (number of enterprises, size ofinvestment, and profitability) revealed that two mostimportant sub-indices for generating private sectorgrowth are Transparency and Labor Quality.Consequently, these two sub-indices receive thehighest weight—20 percent—in the PCI index.
There are important reasons why transparency ofbusiness information has critical implications for thesuccess of entrepreneurs. When entrepreneurs haveadequate information about a province’s initiativesregarding regulatory changes, infrastructure roll-outs,or land use planning, they can forecast theirinvestment prospects deep into the future. Themore comfortable they feel about long-termbusiness prospects, the more willing they will be torisk their hard-earned capital today. Whenentrepreneurs are worried about sudden changes inregulation, infrastructure, or land, they will hold backfrom large-scale projects, investing incrementally asthey test the water. Regression analysis confirmsthese hypotheses: a one point improvement intransparency is associated with a 13 percentimprovement in enterprises per capita, a 17 percentimprovement in investment per capita, and a 62million VND increase in firm profitability.2
Labor quality is also very important. A key businesscomplaint in multiple surveys is that there is notenough skilled and semi-skilled labor to handle and
2. See Chapter Four for full regression results.
THE VIETNAM PROVINCIAL COMPETITIVENESS INDEX 2009 xv
and Decree 136/2005/ND-CP, which mandated thatprovinces publish all legal normative documentspassed at the provincial level in a provincial gazette(Công Báo).
Because these achievements have impaired theflexibility of individual policy makers, some officialshave found a loophole in the issuance of officialletters, which do not require public distribution.During 2005–2008, Vietnam issued 9,470 officialletters containing legal norms, which is more thanthree times higher than the number issued in theprevious 18 years (1987–2004). As Phan VinhQuang and John Bentley have argued, the use ofnon-transparent official letters has created a legaljungle of complex and contradictory rules that onlyofficials and connected entrepreneurs have theability to safely navigate. Further research isnecessary, but the more planning decisions that arearticulated through officials letters, the moreimportant political relationships become and themore insiders benefit at the expense of economicproductivity.
Infrastructure indexThis year continues our supplemental InfrastructureIndex begun in 2008. Problems with Vietnam’sinfrastructure are harming its competitive advantageinternationally. Although infrastructure quality cannotbe attributed directly to provincial officials, increasedfiscal decentralization has, in theory, increased theopportunities for provinces to raise their ownresources for infrastructure improvements.
The Infrastructure Index ranks provinces along fourdimensions: 1) industrial zone quality and capacity;2) road quality and transportation costs; 3)telecommunications and energy costs and stability;and 4) information and communications technology.Binh Duong, Dong Nai, Ho Chi Minh City, BinhDinh, Da Nang and Hanoi emerge as having thebest overall infrastructure in the country; the ruralNorthwestern Uplands score the worst.
Firm perceptions of infrastructure quality haveimproved substantially since the 2008 financial crisis.
of stagnation. The total amount of time thatmanagers spend on bureaucratic procedures hasdeclined from 22 percent to 15 percent, while thenumber of hours for the tax inspection declinedfrom 8 to 5 hours. In addition, 47 percent ofrespondents report that the government-requiredpaperwork has declined in the past two years, and44 percent of firms acknowledge that civil servantshave become more effective at dealing withbureaucratic procedures. These numbers indicate thatsome headway is finally being made on the goals ofpublic administration reform. But there is still roomfor improvement. Only 30 percent of respondentsnoted a decline in the time necessary to receiverequired stamps and signatures from provincialbureaucrats and only 24 percent observed areduction in official fees for these services.
Transparency, an area of tremendous achievement inthe country in the past years, shows remarkabledecline in 2009. Access to provincial planningdocuments and the percentage of firms that believerelationships are necessary to receive businessdocumentation (61.3 percent) are back to 2006levels after consistent improvement over time.Similarly, the percentage of firms claiming thatimplementation of central laws is predictable (8.4percent) and the share of businesses negotiatingwith the local tax authority (41 percent) are backto 2007 levels.3
Interestingly, transparency of legal documents hasimproved over the same period, leading to afascinating puzzle. Why have planning documentsbecome more difficult to obtain while legalnormal documents (laws, decrees, implementingordinances, and provincial decisions) have becomeeasier to access?
We theorize that the dichotomy results from thefact that commitments made under the WorldTrade Organization and the Bilateral TradeAgreement with the United States have compelledpolicy makers to improve access to legislationthrough such advances as the Law on Laws (2008)
3. These worrisome results are supported by our analysis of a separatepanel dataset of 2,500 firms answering in multiple years.
Hard data measures of infrastructure demonstrateslightly slower improvement, indicating that firms areresponding positively to these initial forays intoinfrastructure improvements.
Analyzing the Ha Noi expansionThe annexation of Ha Tay province, Me Linh districtof Vinh Phuc, and the Luong Son of Hoa Binh bythe Hanoi city government created an interestingopportunity to observe how an exogenous changein borders affects the quality of governance, as wellas business performance and prospects.
Treating the new parts of Hanoi as separateprovinces finds that Hanoi would actually rankslightly behind Me Linh and Ha Tay. In other words,the addition of these provinces actually raised Hanoi’sfinal PCI scores slightly, although the changes areminor. For firms in Ha Tay and Luong Son, the mergerinto Hanoi did not lead to worse governance.Businesses in these provinces may have been affectedby the shock of transition and the difficulties oflearning the locations of new agencies. Nevertheless,we can expect that their business prospects will notbe greatly altered in the long term.
For businesses located in Me Linh district, however,there is more reason for concern. Comparingsimilar groups of firms in Me Linh and Vinh Phucsuggests that firms in Me Linh are significantly morenegative about a range of governance indicatorsthan their counterparts in Vinh Phuc. If governancematters for economic performance, and wecertainly believe it does, there is reason to worrythat the merge may have negative long-termimplications for Me Linh businesses and the welfareof citizens in that district.
Changes in PCI methodologyOne challenge that the PCI faces is the difficulty ofkeeping pace with the dynamism of the Vietnameseeconomy and changes in the country’s regulatoryenvironment. To ensure that the PCI is relevant tocurrent needs of Vietnamese policy makers, the
2009 PCI has been altered slightly. Indicators andsub-indices whose utility had become obviated bychanges in the Vietnamese economy were dropped,appropriate new indicators were added, andweighting of sub-indices was re-calibrated to reflectthe changing importance of different aspects ofgovernance.
These changes are documented in Chapter Threeof this report. By far this most important changewas the decision to drop the index measuring biastoward local state-owned enterprises (LSOEs).Massive equitization of LSOEs means that, in mostprovinces, biased incentives toward LSOEs nolonger pose an obstacle to private sectorperformance. While we recognize that there are stillsignificant issues with centrally managed enterprises(CSOEs), particularly in terms of access to bankcapital and land, these are central-level policydiscussions that cannot be appropriately measuredby surveys of businesses located in Vietnameseprovinces. Analysis of biases toward CSOEs requiresan empirical approach beyond the scope of the PCI.
The methodological changes had very little impacton the overall ranking of provinces. There is a strongstatistical correlation (0.84) between the 2009 and2008 rankings. This is roughly the same as previousyears, indicating that the ranking of governance isquite stable, but provinces do have opportunities tomake improvements that can raise their scores.
As an additional test, we also re-created the 2009index without dropping the state-owned enterprisebias index. The correlation between the final PCIand the index containing the state-ownedenterprise bias is 0.93, indicating that the changesdid not have a strong impact on firm rankings.
18 THE VIETNAM PROVINCIAL COMPETITIVENESS INDEX 2009

CHAPTER ONE
BACKGROUND ANDKEY FINDINGS

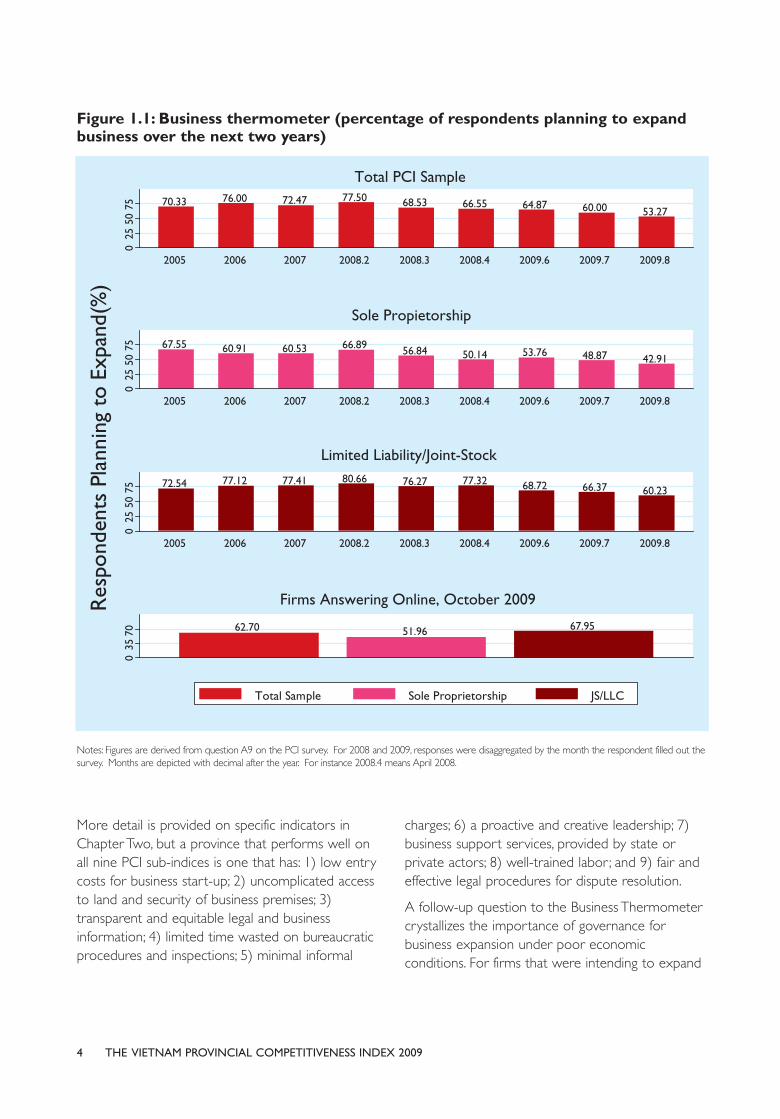
Each year, the Provincial Competitiveness Index(PCI) research team asks respondents about theirbusiness plans for the next two years. The questionis such an excellent gauge of future growth andeconomic development in Vietnam that we havedubbed it the “Business Thermometer.” This year,Business Thermometer answers carry an ominousmessage. Despite macroeconomic figures indicatingthat Vietnam has escaped the worst of the 2009global financial crisis, the optimism thatcharacterized entrepreneurs a few years ago hasdeclined over time. Far fewer businesses plan toexpand their operations over the next two years.
Figure 1.1 depicts the trends in the businessthermometer. Responses for 2008 and 2009 aresub-divided by the date that the entrepreneur filledout the survey, so that we can track the nuancedchanges in business responses as Vietnam’seconomic stimulus was implemented. Results for2009 indicate that business confidence actuallydeclined over the summer.4 In addition, results aresub-divided by the legal form of enterprises.Declines for sole proprietorships are greater for thelarger and more sophisticated legal forms, but adeclining trend is clear for all types of companies.Should this current prediction prove accurate, itcould have long-term negative implications forVietnam’s economy because less business expansionimplies less job creation and less taxable revenue.
It is in these periods of declining business optimismthat economic governance becomes mostimportant for the decisions of entrepreneurs.Business owners are concerned about theirprospects for the future because they are uncertainboth about economic events outside of the controlof Vietnamese policy makers and about the policydecisions of Vietnamese officials themselves. In suchan environment, clear, transparent, and fairregulatory rules and policies become paramount.The 2009 PCI is a useful tool for assessing how thequality of governance is affecting firm decisions.
At its root, the PCI is the voice of 9,890 domesticprivate firms, collected in a survey of the opinionsof private entrepreneurs regarding economicgovernance in their provinces. After someadjustments on the basis of published data toaddress perception biases, the survey responses areaggregated into provincial-level scores. The finaloutcome is a composite index ranking Vietnam’s 63provinces according to their performance on nineaspects of governance that are critical for privatesector development.5 As a result, the PCI providesthe most objective metric available for gauging theimpact of economic and administrative reforms atprovincial and national levels.
3THE VIETNAM PROVINCIAL COMPETITIVENESS INDEX 2009
BACKGROUND ANDKEY FINDINGS
4. There is a small uptick in October 2009, but we should be cautiousabout interpreting too much from this information. The Octoberrespondents are composed of a small group of firms who respondedto the survey using our online platform. They tend to be bigger andmore sophisticated and are predominantly in Hanoi and Ho ChiMinh City. Thus, it is not clear whether opinions are improving or thisgroup is systematically different from earlier respondents.
5. Previous iterations of the PCI had 10 sub-indices, but the sub-indexmeasuring bias toward local state-owned enterprises was droppedthis year. See Chapter Three for more details.
4 THE VIETNAM PROVINCIAL COMPETITIVENESS INDEX 2009
Figure 1.1: Business thermometer (percentage of respondents planning to expandbusiness over the next two years)
Notes: Figures are derived from question A9 on the PCI survey. For 2008 and 2009, responses were disaggregated by the month the respondent filled out thesurvey. Months are depicted with decimal after the year. For instance 2008.4 means April 2008.
More detail is provided on specific indicators inChapter Two, but a province that performs well onall nine PCI sub-indices is one that has: 1) low entrycosts for business start-up; 2) uncomplicated accessto land and security of business premises; 3)transparent and equitable legal and businessinformation; 4) limited time wasted on bureaucraticprocedures and inspections; 5) minimal informal
charges; 6) a proactive and creative leadership; 7)business support services, provided by state orprivate actors; 8) well-trained labor; and 9) fair andeffective legal procedures for dispute resolution.
A follow-up question to the Business Thermometercrystallizes the importance of governance forbusiness expansion under poor economicconditions. For firms that were intending to expand

5THE VIETNAM PROVINCIAL COMPETITIVENESS INDEX 2009
Figure 1.2: Relationship between governance and selection as location
Notes: Vertical axis displays the natural log of the number of times entrepreneurs from other provinces selected province as possible location for expansion. lnindicates natural log of variable taken. The natural log of number of selections is taken to address outliers and allow for easier graphical depiction.
their businesses, we further queried whichprovinces, outside of their own, they envisioned asthe most attractive places for business expansion.Figure 1.2 depicts the results of this query. Thenumber of times a province was selected as aninvestment location is shown on the vertical axis,while the 2009 PCI score is shown on thehorizontal axis.6 A large number of firms selectedthe urban centers of Hanoi (352), Ho Chi Minh
City (HCMC) (493), and Da Nang (221), which,because of their large, middle-class populations,offer attractive markets for domestic sales. Settingaside these choices, however, we can see that thenumber of times a particular province was selectedis strongly associated with provincial economicgovernance, as measured by the PCI. For instance,Binh Duong received 335 selections, Vinh Phucreceived 98, and the correlation between these twovariables is statistically significant 0.40. In theseuncertain times, it appears that ambitious investorsare using governance as a focal point for theirbusiness decisions.
6. The natural log of number of selections is taken to address outliersand allow for easier graphical depiction.

One might imagine that governance is just a proxyfor other attractive factors for investors, such asinfrastructure or population size. Figure 1.3 tacklesthis issue by presenting the results of regressionanalysis of number of selections as investmentlocation on provincial PCI scores, controlling for arange of other factors. The marginal effect of eachvariable is depicted with a diamond between rangebars illustrating 90 percent confidence intervalsaround the estimate. Variables where range barscross over zero are considered not statisticallysignificant because we cannot be certain that inrepeated iterations of the survey the variable willcontinue to have a positive relationship withlocational choices.
The analysis reveals that four variables aresignificantly associated with the selection of aprovince for new investment: 1) governance, as
measured by the PCI; 2) wealth, measured by GDP;3) surface area, indicating that geographicallydispersed provinces tend to attract investors,perhaps because of easier access to land orresources; and 4) road quality measured by thepercentage of asphalted roads. Distance from themajor cities of Hanoi and HCMC is negative, butjust shy of statistical significance -the farther aprovince is from these locations, the less likely it isto be chosen as an investment location.
We can interpret the substantive implication of the reddiamonds directly off the figure. For each one pointimprovement in the unweighted PCI score of aprovince, three more investors were likely to choose itas an investment location. This is a sizable effect. By wayof comparison, a 10 percentage point improvement inthe amount of asphalted road would yield about thesame number of selections by potential investors.
THE VIETNAM PROVINCIAL COMPETITIVENESS INDEX 20096
Figure 1.3: Drivers of locational choice
Notes: Results of multiple regression analyzing number of companies wishing to expand to new province. Results are from a negative binomialregression with robust standard errors. Dependent variable is the number of times a province was selected as the site of future investment.Non-displayed controls include dummy variable for city and geographic region. The Pseudo R-Squared for the regression is 0.799 and the LogLikelihood is -276.76 and significant at the .001 level.

THE VIETNAM PROVINCIAL COMPETITIVENESS INDEX 2009 7
In years past, the PCI report has demonstrated aretrospective correlation between governance andinvestment-PCI scores were strongly correlatedwith previous investment in the province.7 Thisyear’s result is more important for policy makersbecause it is prospective-PCI scores are correlatedwith future investment.
The bottom line is that in difficult economic times,good economic governance is critical for raising theconfidence of investors. Entrepreneurs will votewith their feet, choosing the locations where publictransparency allows for better forecasting ofbusiness prospects and where equitable and fairprocedures lower undue risk. The PCI provides animportant measure of these factors.
A picture of the PCI respondentsThe claim that the PCI represents the collective voiceof the private sector is an ambitious one. Who arethese entrepreneurs who are selected to speak for theentire business community? After all, any bias in theselection of operations affects the value of theinformation that can be gleaned from the survey.
By delineating the PCI sample according to keyfactors, Table 1.1 shows that firms answering the PCIsurvey look much like the business community as awhole, representing all sizes and flavors ofentrepreneurial activity in Vietnam. This, of course, isby design. Respondents are randomly selected from alist of registered private firms that is supplied by theNational Tax Authority, stratified by business age,sector, and legal form. The process ensures a highlyrepresentative sample.8
7. This finding remains true. Multiple regressions of enterprises percapita, investment per capita, average profitability and GDP on thePCI scores, controlling for infrastructure and endowments, revealsthat governance is still strongly correlated with business performanceand welfare in 2009. See Chapter Four for regression results.
8. Results are based on a stratified random sample and mail-out surveyin each province, yielding a national response rate of 25 percent,about the same as in 2008. Response rates are similar throughout thecountry, so non-response bias is likely systematic across jurisdictions.Last year, we followed up with non-responders in our survey, findingthat 21 percent of our mail-out went to firms that were no longer inexistence or had moved their operations, or where the Tax Authorityhad incorrect contact information. Taking these into account, our trueresponse rate is 31.7 percent.
Table 1.1: Who answers the PCI survey? Composition of the 9,890 total respondents
Provincial SampleCharacteristic National Sample
Legal Form
Sole Proprietorship
Limited Liability
Joint Stock
Joint Stock with Shared Listed on Stock Exchange
Partnership and Other
Sector with Majority Output
Manufacturing/Construction
Service/Commerce
PCI
35.5%
45.3%
18.6%
0.2%
0.4%
PCI
32.7%
56.9%
Median Tax Authority
27.2%
46.0%
10.6%
NA
0
Median Tax Authority
42.0%
52.6%
Weighted PCI
19.5%
57.1%
22.9%
0.2%
0.3%
Weighted PCI
29.6%
64.9%
Total Tax Authority
22.1%
57.5%
20.4%
NA
0
Total Tax Authority
34.5%
62.2%

8 THE VIETNAM PROVINCIAL COMPETITIVENESS INDEX 2009
Provincial SampleCharacteristic National Sample
Agriculture/Aquaculture
Natural Resources
Age of Firm
Registered Before Enterprise Law
Registered After Enterprise Law
Size of Operations (Employees)
Under 5
5–9
10–49
50–200
Over 200
Size of Operations (Total Assets, Billions of VND)
Under 0.5
From 0.5 to under 1
From 1 to under 5
From 5 to under 10
From 10 to under 50
Over 50
History of Company
Greenfield Private Company
Began Operation as Household Enterprise
Former Local State-Owned Enterprise (SOE)
Former Central SOE
7.6%
2.8%
PCI
14.2%
85.8%
PCI
15.0%
21.6%
41.8%
15.9%
5.7%
PCI
12.2%
17.1%
43.1%
14.2%
10.3%
3.3%
2.4%
2.3%
Median Tax Authority
4.2%
95.8%
Median GSO
13.60%
35.72%
36.65%
10.21%
3.8%
Median GSO
15.5%
18.2%
42.7%
7.8%
7.6%
8.2%
4.6%
0.9%
Weighted PCI
13.3%
86.7%
Weighted PCI
14.2%
22.5%
41.6%
16.0%
5.7%
Weighted PCI
12.3%
16.4%
42.3%
14.2%
10.2%
4.5%
1.9%
1.4%
Total Tax Authority
5.96%
94.04%
GSO Census
13.5%
46.8%
30.4%
7.3%
2.1%
GSO Census
12.1%
16.6%
48.8%
9.5%
8.8%
4.2%
PCI
29.4%
63.5%
5.8%
1.3%
Weighted PCI
33.5%
60.3%
4.5%
1.6%

9THE VIETNAM PROVINCIAL COMPETITIVENESS INDEX 2009
Provincial SampleCharacteristic National Sample
Owner Background
University Degree
MBA
Leader of State Agency
Military Officer
Former Manager of SOE
Former SOE Employee (Never Manager)
Primary Customers
Vietnamese Individuals and Companies
State-Owned Companies
State Agencies
Export Directly or Indirectly
Foreign Individuals or Companies in Vietnam
PCI
42.1%
1.5%
5.1%
7.0%
14.9%
19.6%
PCI
58.3%
14.9%
16.8%
7.0%
3.1%
Weighted PCI
58.4%
4.0%
4.6%
6.5%
14.2%
15.8%
Weighted PCI
58.1%
15.0%
11.4%
8.6%
6.9%
Notes: PCI is the PCI survey sample, stratified at the provincial level. Median Tax Authority provides the values in the median province. Total TaxAuthority shows the national-level aggregate scores. GSO Census is the 2008 Enterprise Census of the General Statistical Office(http://www.gso.gov.vn/default_en.aspx?tabid=479&idmid=4&ItemID=7184).
Thirty-five percent of respondent firms are soleproprietorships, 45 percent are limited liabilitycompanies, and 18 percent are registered as joint-stock companies. By design, these proportionsreflect the average provincial patterns. Thus, oursample is perfectly adjusted to each province.
Because the PCI sampling strategy is intended tomirror provinces, it requires that we sample a largerportion of businesses in small provinces than wouldbe necessary if we were taking a nationallyrepresentative sample. As a result, larger cities suchas Hanoi and HCMC represent a smaller share ofthe PCI sample than they do national-level privatesector activity. This can be misleading for the
diagnosis of national-level trends, because larger andeconomically important provinces are under-represented among PCI respondents. For example,according to the GSO Enterprise Census, the fivenational-level cities plus Binh Duong, Dong Nai, andBa Ria-Vung Tau (BRVT) account for 59 percent oftotal private operations in the country, but only 22percent of the business operation in the PCI sample.Table 1.2. shows the mismatch between the goals ofprovincially representative samples in the PCI andnational representation for these eight importantprovinces. As a result, trying to infer national-levelpolicy decisions from unweighted PCI descriptivestatistics would be biased toward smaller provinces.

To capture national-level trends, it is necessary toadjust answers slightly, so provinces with largepopulations of private sector operations are notunder-represented. To do this, we re-weightanswers by the proportion of total businessescontained in a single province. After thisadjustment, firms located in more populous areasreceive a slightly higher weight, so their locationsreceive the equivalent weight to the one theywould have in a nationally representative sample.These nationally weighted responses are shown incolumn 3 of Table 1.2.
Nineteen of the joint-stock companies in thesample are traded on either the Hanoi or Saigonstock exchanges. These enterprises included in thesurvey account for about 7 percent of all listedfirms and include some of the most importantoperations in the country.
Over half of the respondents are engaged in theservice or commerce sectors, and about 32percent are involved in manufacturing or
construction. By way of comparison, according tothe Tax Authority data, 62 percent of registeredfirms are involved in service and commerce and35 percent in manufacturing and constructionnationally. Eighty-six percent of PCI respondentsregistered after the 2000 Enterprise Law; 14percent precede that law and, therefore, registeredunder older, less efficient procedures.
Forty-three percent of firms have between 1 billionVND ($56,000) and 5 billion VND ($282,500) intotal assets. Twenty-nine percent of firms have lessthan 1 billion VND in assets and 27 percent haveover 5 billion VND. Three percent of firms haveover 50 billion VND ($2.8 million) in assets. This isnot a dramatic share of large firms, but it doesmirror national-level data. Over 41 percent of firmshave between 10 and 50 employees. Six percent ofrespondents have more than 200 employees and50 companies have more than 1,000.
Sixty-three percent of PCI respondents beganoperations as household firms before they decided
10 THE VIETNAM PROVINCIAL COMPETITIVENESS INDEX 2009
ProvincePCI Sample National Representation
HCMC
Ha Noi
Hai Phong
Da Nang
Dong Nai
Binh Duong
Can Tho
BRVT
8 Provinces
National
Number
435
508
207
263
253
204
144
165
2,179
9,890
Proportion
4.4%
5.1%
2.1%
2.7%
2.6%
2.1%
1.5%
1.7%
22.0%
100.0%
Number
43,116
25,628
4,193
3,899
3,418
3,311
2,016
1,457
78,852
147,314
Proportion
29.3%
17.4%
2.8%
2.6%
2.3%
2.2%
1.4%
0.9%
59.0%
100.0%
Table 1.2: PCI Sample versus National Representative Sample
Notes: Data taken from 2008 GSO Enterprise Census.

to formalize their activities by registering atprovincial Departments of Planning andInvestment. This is a critical statistic because itdemonstrates that some provincial businessenvironments are conducive to formalization.9 Atotal of 693 (7 percent) enterprises resulted fromequitizations (the Vietnamese form of privatization)of local or central SOEs. An additional 14.9percent of companies have owners who formerlymanaged SOEs, and 19.6 percent have ownerswho worked in some capacity for an SOE. Finally,about 30 percent of firms are greenfield entities,meaning that their owners established andregistered the firms at roughly the same time.
With respect to nationally representative data,most companies concentrate their business activityon the domestic market, selling either toVietnamese individuals and private companies (58percent) or to SOEs or state agencies (26percent). About 9 percent are actively engaged inexporting, either directly or indirectly throughtrading companies. This is a relatively small numbergiven the importance of exports for theVietnamese economy. Nevertheless, it reflects thefact that exports tend to be dominated by largebusinesses (especially foreign and statecompanies), and that enormous export potentialamong smaller private entities remains untapped.
An additional 7 percent of companies sell primarilyto foreign companies or individuals based inVietnam. It is remarkable that sales to SOEs andstate agencies are roughly four times those to theforeign sector : the tremendous growth of foreigndirect investment in Vietnam has not createdsubstantial opportunities for private producers.10
Finally, and quite importantly for the purposes ofthe PCI, all of Vietnam’s 63 provinces arerepresented in the Index. The average number ofresponses per province was 157, with only oneprovince (Lai Chau) having fewer than 75respondents. Nevertheless, the 63 firms that didanswer in Lai Chau account for about one-third ofall operations in the rural, Northwestern locality.
The final 2009 Provincialcompetitiveness rankingWeights
The weighted 2009 PCI ranking is shown in Figure1.4. Each province is ranked on a 100-point scale.As in 2008, Da Nang (75.96) remains slightlyahead of the perennially excellent Binh Duong(74.01). Also reaching the excellent tier this yearare Lao Cai (70.47), Dong Thap (68.54), Vinh Long(67.24), and Vinh Phuc (66.65).
11THE VIETNAM PROVINCIAL COMPETITIVENESS INDEX 2009
9. For a more detailed discussion of the formalization in Vietnam, seeMalesky, Edmund, and Markus Taussig. 2009. “Out of the Gray: TheImpact of Institutions on Business Formalization.” Journal of EastAsian Studies. 9.2: 249–79.
10. For a deeper analysis of the domestic opportunities and spillovercreated by the foreign sector, see Nguyen, N.A., T. Nguyen, D.T. Le,Q.N. Pham, D.C. Nguyen, and D.N. Nguyen. 2008. “Foreign DirectInvestment in Vietnam: Is There Any Evidence of Spillover Effects.”DEPOCEN Working Paper, Hanoi, Vietnam.

12 THE VIETNAM PROVINCIAL COMPETITIVENESS INDEX 2009
Figure 1.4: Weighted Provincial Competitiveness Index 2009
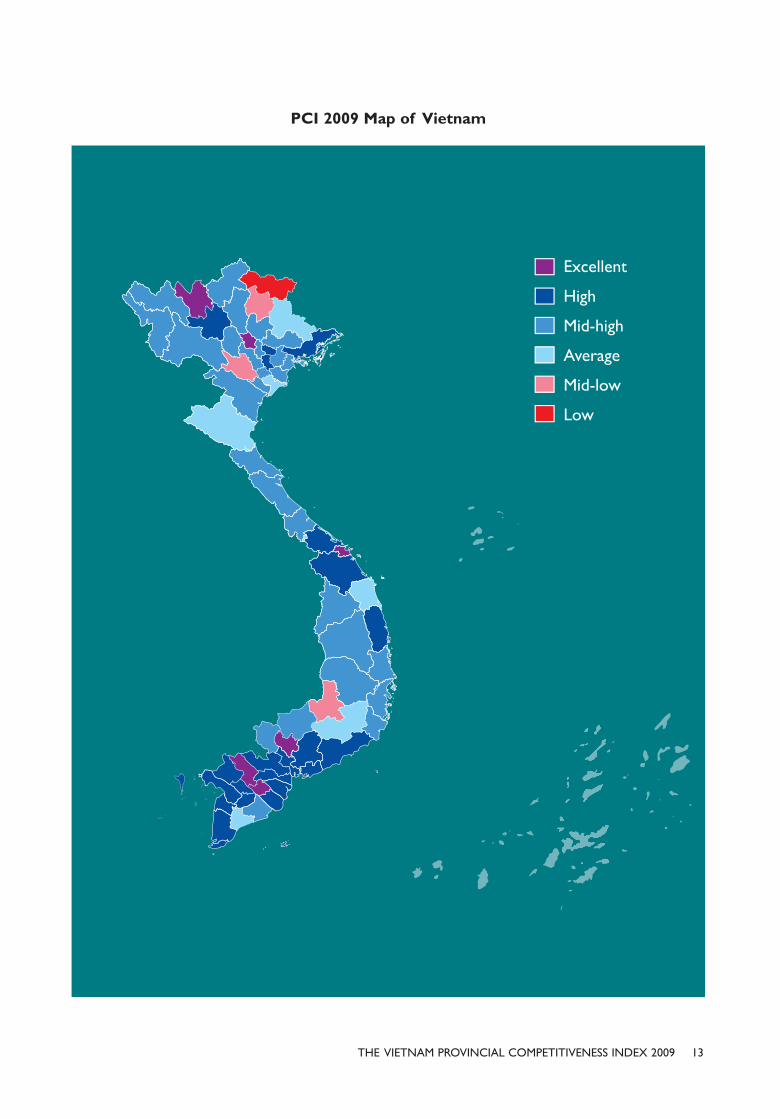
13THE VIETNAM PROVINCIAL COMPETITIVENESS INDEX 2009
PCI 2009 Map of Vietnam

14 THE VIETNAM PROVINCIAL COMPETITIVENESS INDEX 2009
The ranking represents the weighted sum of thescores of the nine sub-indices, based on the weightsshown in Table 1.3. These weights were re-calibratedin 2009 to ensure that the PCI reflects the changesin the Vietnamese economy and regulatoryenvironment. Weights were calculated using a three-step statistical procedure that is discussed in thefinal section of Chapter Three. The ultimate goal ofweighting is to ensure that PCI scores are calibratedto private sector performance and, therefore, thatthe PCI relates the most relevant information toprovincial officials regarding the impact of their
policies on private sector activity. Sub-indices thatwere shown to have the largest association withprivate sector growth, investment, and profitabilityreceived the highest weight class of 20 percent.Correspondingly, those that are not stronglycorrelated with private sector developmentoutcomes received the lowest weight class of 5percent. Medium weight classes of 10 and 15 percentwere reserved for average correlations across thethree outcome variables or a large substantive effecton one outcome (e.g., profitability), but a minimalrelationship with the other two.
Sub-Index Enterprises perCapita (ln)
Investment perCapita (ln)
Profit perEnterprise
Weights
Entry Costs
Land Access and Security
of Tenure
Transparency and Access
to Information
Time Costs of Regulatory
Compliance
Informal Charges
Proactivity of Provincial
Leadership
Business Support Services
Labor and Training
Legal Institutions
(1)
0.186*
(0.104)
-0.001
(0.091)
0.134***
(0.045)
0.089
(0.068)
0.044
(0.089)
0.014
(0.045)
0.215**
(0.092)
0.297***
(0.086)
-0.041
(0.072)
(2)
0.282**
(0.132)
0.058
(0.147)
0.167*
(0.086)
0.199***
(0.068)
0.212*
(0.126)
0.137**
(0.059)
0.251**
(0.112)
0.468***
(0.115)
0.122
(0.098)
(3)
12.585
(36.023)
31.242
(48.948)
62.440***
(20.663)
55.032**
(27.379)
90.308*
(51.523)
54.368***
(19.770)
-58.121
(42.919)
58.876
(47.141)
87.193**
(43.391)
(4)
9.61%
2.37%
19.77%
14.12%
9.00%
12.36%
6.71%
20.03%
6.04%
100%
(5)
10%
5%
20%
15%
10%
10%
5%
20%
5%
100%
1
2
3
4
5
6
7
8
9
Table 1.3: Sub-Index Weighting
True Weight Rounded
Total
Notes: Columns 1, 2, and 3 report the coefficients and standard errors (in parentheses) of the regressions of the three outcome variables (Enterprises perCapita, Investment per Capita, and Profit per Enterprise) on each sub-index, controlling for structural factors (population density, surface area, distancefrom Hanoi or HCMC in kilometers), infrastructure (measured by the percentage of paved road in the province), and dummy variables for the sevenregions of Vietnam (known as regional fixed effects). Column 4 reflects the true weight that would be assigned to this variable given the cumulativevariance it explains in the three outcome variables. Column 5 reports rounded weights that will be used for the next five years.

Because weights are calibrated to reflect theimportance of sub-indices for private sectordevelopment, they reveal important information. Most
importantly, we learn that the single biggest factors inimproving PCI scores and thereby economicdevelopment are Transparency and Labor Quality.
15THE VIETNAM PROVINCIAL COMPETITIVENESS INDEX 2009
The Sub-Indices of the PCI
As in early reports, the PCI 2009 uses a range of indicators that are grouped into nine compositesub-indices:
1. Entry Costs: A measure of 1) the time it takes a firm to register and acquire land; 2) the timeto receive all the necessary licenses needed to start a business; 3) the number of licensesrequired to operate a business; and 4) the perceived degree of difficulty to obtain alllicenses/permits.
2. Land Access and Security of Tenure: A measure combining two dimensions of the landproblems confronting entrepreneurs: how easy it is to access land and the security of tenureonce land is acquired.
3. Transparency and Access to Information: A measure of whether firms have access to theproper planning and legal documents necessary to run their businesses, whether thosedocuments are equitably available, whether new policies and laws are communicated to firmsand predictably implemented, and the business utility of the provincial webpage.
4. Time Costs of Regulatory Compliance: A measure of how much time firms waste onbureaucratic compliance, as well as how often and for how long firms must shut theiroperations down for inspections by local regulatory agencies. This year, the index alsoincludes a battery of indicators measuring progress on public administration reform (PAR).
5. Informal Charges: A measure of how much firms pay in informal charges, how much of anobstacle those extra fees pose for business operations, whether payment of those extra feesresults in expected results or “services,” and whether provincial officials use compliance withlocal regulations to extract rents.
6. Proactivity of Provincial Leadership: A measure of the overall attitude of provincial officials aswell as their creativity and cleverness in implementing central policy, designing their owninitiatives for private sector development, and working within sometimes unclear nationalregulatory frameworks to assist and interpret in favor of local private firms.
7. Business Support Services: A measure of the availability of business services, such as privatesector trade promotion, provision of regulatory information to firms, business partnermatchmaking, and technological services for firms; the number of private providers of theseservices; and the quality of these services.
8. Labor and Training: A measure of the efforts by provincial authorities to promotevocational training and skills development for local industries and to assist in theplacement of local labor.
9. Legal Institutions: A measure of the private sector’s confidence in provincial legal institutions;whether firms regard provincial legal institutions as an effective vehicle for dispute resolutionor as an avenue for lodging appeals against corrupt official behavior.

16 THE VIETNAM PROVINCIAL COMPETITIVENESS INDEX 2009
Importance of transparency forprivate sector developmentThis is the fifth year that transparency has receivedthe highest weight in the PCI, despite alterations inmethodology and economic crises in 2008 and2009. There are important reasons whytransparency of business information has criticalimplications for the success of entrepreneurs. Whenentrepreneurs have adequate information about aprovince’s initiatives regarding regulatory changes,infrastructure roll-outs, or land-use planning, theycan forecast their investment prospects deep intothe future. The more comfortable they feel aboutlong-term business prospects, the more willing theywill be to risk their hard-earned capital today. Whenentrepreneurs are worried about sudden changes inregulation, infrastructure, or land, they will hold backfrom large-scale projects, investing incrementally asthey test the waters.
Transparency also allows entrepreneurs to shieldthemselves against potential abuses by unscrupulousofficials, if they exist. The more information thatbusinesses have about the law, the less likely theywill fall prey to officials using compliance regulationsas means of attracting rents. Businesses can learnabout these regulations ahead of time and makenecessary adjustments. Far too often in Vietnam,businesses are blind-sided when they learn that theyare in violation of government regulations that theyhad never heard about. When they are presentedwith this information by government inspectors,they find that they must pay expensive fines, engagein time-consuming adjustments, or resolve theproblem through more surreptitious meansinvolving informal payments. If the business manageris able to access the regulations ahead of time,these episodes could be avoided.
Similarly, more information about infrastructure willensure that capable firms can turn premier businessland into productive business operations. Currently,the most valuable land, such as premises adjacent tonew roads or near industrial zones, often ends up inthe hands of those with better access toinformation about new land conversions or roadimprovements. Individuals with insider informationare not necessarily those who could make the bestuse of those assets. As a result, key business
locations in many Vietnamese provinces areinefficiently deployed. Transparency and a fairauction of these valuable assets would lead to farmore productive investments, benefitting businessoperators and the welfare of province. Readingdirectly off the regression coefficients, we can seethat a one point improvement in transparencyyields a 13 percent improvement in enterprisesper capita, a 17 percent improvement ininvestment per capita, and a 62 million VNDincrease in firm profitability. 11
Importance of labor quality forprivate sector developmentLabor quality is also very important. A key businesscomplaint in multiple surveys is that there is notenough semi-skilled and skilled labor to handle andmaintain equipment or manage complex businessand financial processes. Firms are finding it difficultto upgrade technology and expand operationswhen they are handicapped by an insufficient talentpool. General education, vocational education, andlabor exchange bureaus in provinces have laggedbehind the business needs of many firms.
As we discuss in Chapter Three, this year’s PCIoffers a more thorough metric of labor quality thattakes into account the participation of privatetraining providers. Figure 1.5 shows that ourmeasure of labor quality is strongly associated withother measures of general education. Provinces thatreceived the highest average scores on collegeadmission exams in 2009 are the same ones whererespondents are most satisfied with the labor talentpool. This finding may indicate that generaleducation is a critical way to improve labor quality.Although a small portion of secondary educationrecipients may migrate to urban centers for college,investment in high-quality teachers and training willhave long-term implications for the skill-sets ofindividuals remain in the province as well.12 Of thefour different types of college entrance exams, TypeB shows the strongest correlation (0.59) with Labor
11. See Chapter Four for full regression results.12. Thanh, Nguyen Duc. 2005. Heterogeneous Talent and Optimal
Emigration: A Contribution to the New Economics of Brain Drain.Presented at the Vietnam Economic Research Conference, Hanoi:April 29.

17THE VIETNAM PROVINCIAL COMPETITIVENESS INDEX 2009
Quality.13 Not surprisingly, this is the test geared forstudents who want to study business and evaluatestraining in math, chemistry, and biology.Correlations are statistically significant but lower forthe Type A test for science education (0.49), Type Cfor social science education (0.28), and Type D forthe humanities (0.34).
These skill-sets will pay dividends in terms of private
sector performance. We find that this new measure
is strongly associated with private sector
development outcomes. Other provinces have
made significant investments in improving their labor
pool. Correspondingly, a one point improvement in
the Labor sub-index is correlated with a 30 percent
improvement in enterprises per capita, a 47 percent
enhancement in investment per capita, and a
statistically insignificant but sizable 58 million VND
increase in profitability.
13. Entrance exams are divided into four categories according to thefields of study the student plans to pursue and the universityoffering that subject. The categories of exams and the subjectstested follow: Type A: tests knowledge of math, physics andchemistry (for students of engineering, computer science, physics,etc.); Type B: tests knowledge of math, chemistry and biology (forstudents of natural sciences and business); Type C: testsknowledge of literature, history and biology (for students of socialsciences and humanities) ; Type D: tests knowledge of literature,math and foreign language (for students of foreign languages,either in education or translation/interpretation tracks). See Kelly,Kristy. 2009. “The Higher Education System in Vietnam.” WorldEducation News and Reviews <http://www.wes.org/ewenr/00May/feature.htm> for more detail.
Figure 1.5: College entrance exams and assessment of labor quality

18 THE VIETNAM PROVINCIAL COMPETITIVENESS INDEX 2009
Lower-weighted indicatorsTwo indicators receive quite low weights (LandAccess and Legal Institutions), but not because theyare unimportant; rather, they are generallyproblematic across the entire country. Very fewprovinces excel on these dimensions, leading to lowvariance across the country and, consequently, a low
correlation with private sector outcomes. Theweights on the issues hint that moving forward onboth of these dimensions will require national-levelpolicy reform in addition to provincial initiatives,which have been insufficient. Figure 1.6 shows theperformance of each Vietnamese province vis-a-visthe nine sub-indices.
Figure 1.6: Province Performance By Sub-Index
Robustness of the rankingsRobustness of performance tiers
Once again, to facilitate comparisons with previousyears, we pegged the six performance tiers(Excellent, High, Mid-High, Average, Mid-Low, andLow) to the break-points in the rankings. These tiersare robust to different weighting and indexconstruction approaches and, therefore, are morevaluable for benchmarking relative performance.Individual rankings within tiers can change quite a bit,depending on small changes in index construction.
Robustness over timeThe change in the ranking methodology cited abovehad a systematic impact across the country. No
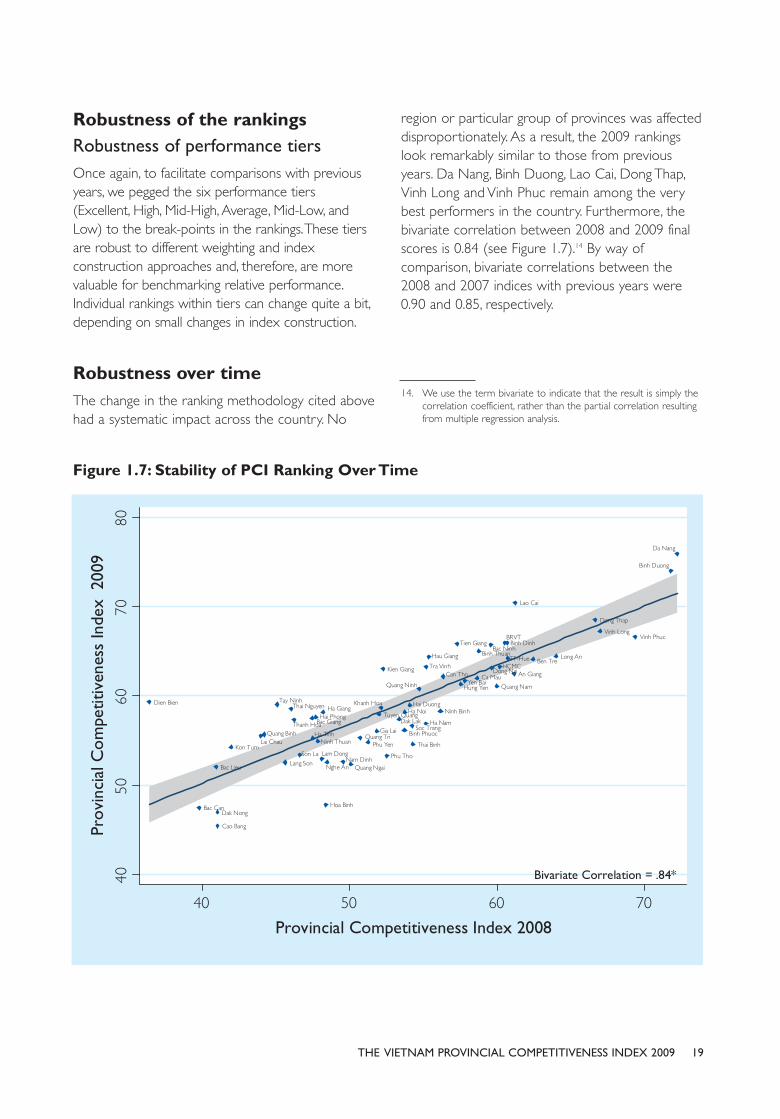
region or particular group of provinces was affecteddisproportionately. As a result, the 2009 rankingslook remarkably similar to those from previousyears. Da Nang, Binh Duong, Lao Cai, Dong Thap,Vinh Long and Vinh Phuc remain among the verybest performers in the country. Furthermore, thebivariate correlation between 2008 and 2009 finalscores is 0.84 (see Figure 1.7).14 By way ofcomparison, bivariate correlations between the2008 and 2007 indices with previous years were0.90 and 0.85, respectively.
19THE VIETNAM PROVINCIAL COMPETITIVENESS INDEX 2009
14. We use the term bivariate to indicate that the result is simply thecorrelation coefficient, rather than the partial correlation resultingfrom multiple regression analysis.
Figure 1.7: Stability of PCI Ranking Over Time
The figure shows that governance dependssignificantly on historical governance. Governancepractices cannot change overnight. It takes time toplan and implement new initiatives, and there is evena longer lag between implementation and firmsexperiencing their effects.
This consistency in the provincial rankings implies thatthe PCI can consistently identify top performers,while allowing room for other provinces to improveand receive higher scores in subsequent years. Suchstability is confirmation that the PCI approach offers aconsistent and accurate measure of provincialeconomic governance over time.
Largest improvements inprovincial PCI scores“Stability,” however, should not be confused with“static”. Over the past two years, a number ofprovinces have gradually climbed up the PCI ladder.Figure 1.8 shows the average annual change in PCIscores since 2006.
Ca Mau, Dien Bien and Long An deserve specialrecognition for having made the greatest averageannual leaps in the PCI rankings. Interestingly, theseprovinces raised their scores in very different arenas.Dien Bien made substantial improvements in reducinginformal costs, increasing the proactivity of leadership,and enhancing the quality of the labor force. Ca Maufound ways to reduce entry costs and informalcharges. Long An’s leaps were propelled by increasesin transparency, exemplified by a computer monitoroutside Long An’s Department of Natural Resourcesand the Environment where individuals can accessland-use plans, legal documents, and applicationmaterials.
Summary of nationwide trends inprovincial governanceAlthough the re-calibration of the PCI makes itdifficult to compare the weighted PCI ranking overtime, we can get a sense of trends in governancefrom observing the changes in individual indicatorsover time. Changes in scores for the median provinceprovide a useful measure of trends in national-levelperformance. Increases in the median provincetherefore indicate improvements in the indicatorthroughout the country as a whole. In general,measures of Entry Costs, Access and Security ofLand, Time Costs, Labor Quality, and Confidence inLegal Institutions show signs of definitiveimprovement over the past year. Policy makersshould be proud of these accomplishments. On theother hand, worrisome declines are evident in termsof Transparency, Informal Charges, and the Proactivityof local leaders.
Tables tracking changes in the median provinceover time for each indicator are reported inChapter Three.
ImprovementsEntry Costs: Once again, Vietnam continues to reducethe barriers to starting a business. One-stop shopsare now widespread throughout the country andburdensome regulations, such as the need for abusiness chop, have been eased. As a result, days forbusiness registration in the median province aredown to 10 from 12.25. Correspondingly, thenumber of firms waiting over a month to be fullylegal has declined from 21 percent to 19 percent.The percentage of firms waiting over three months isnow less than 5 percent.
THE VIETNAM PROVINCIAL COMPETITIVENESS INDEX 200920
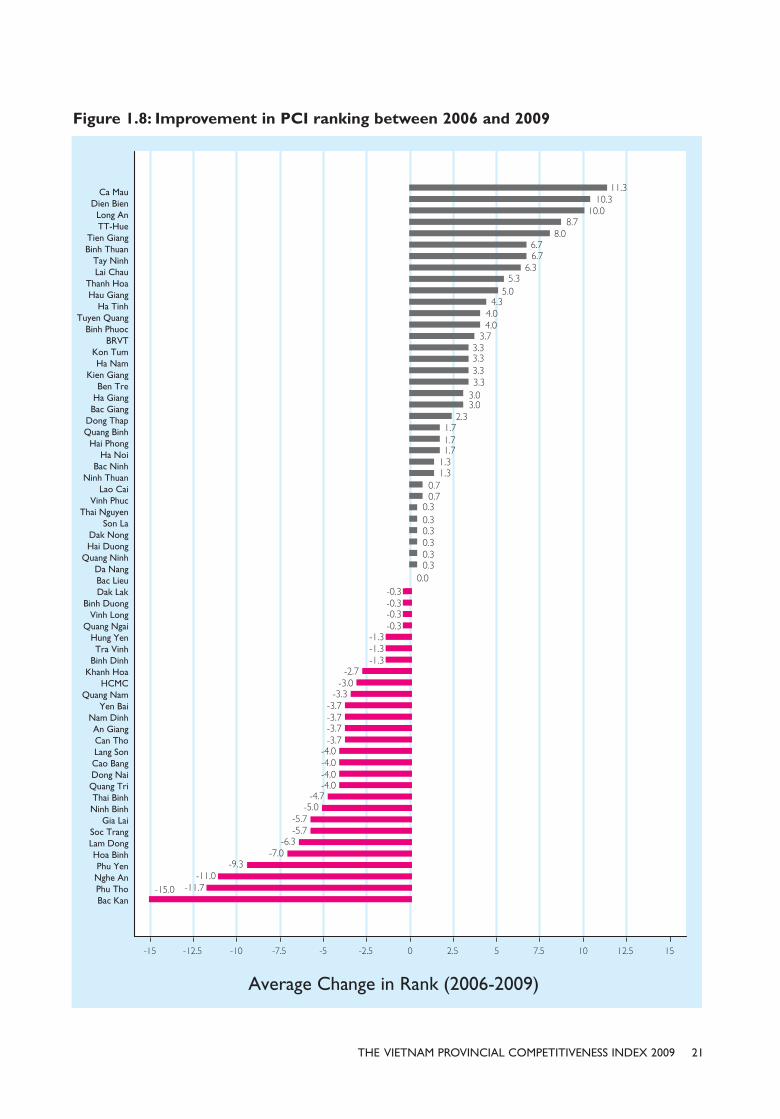
THE VIETNAM PROVINCIAL COMPETITIVENESS INDEX 2009 21
Figure 1.8: Improvement in PCI ranking between 2006 and 2009
THE VIETNAM PROVINCIAL COMPETITIVENESS INDEX 2009
Access and Security of Land: This indicator hasimproved marginally. Worries about expropriationhave subsided, improving from 2.0 to 2.55 on a five-point scale. Moreover, 40 percent of businesses (upfrom 38 percent in 2008) believe that they receivefair compensation if their land is expropriated. Oneworrying trend is that the number of firmsoperating on purchased or household land with aformal land use right certificate (LURC) has actuallydeclined by 8 percentage points. Our research hasindicated that the new requirement of unifying twocertifications of land-use rights and house ownershipunder the recent omnibus law amendment might bereason for the decline. The regulation came into effecton August 1, 2009, yet implementing documentswere not made available, causing thousands of landapplications to be put on hold in all provinces.15 Toease the complication for provincial land bureaucrats,a month later, the Prime Minister issued a decision toallow the use of old LURCs. This interruptioncoincided with the PCI survey going out and, thus,could be captured in our firm responses.
Time Costs of Regulatory Compliance: This indicatorshows signs of improvement, after several years ofstagnation. The total amount of time that managersspend on bureaucratic procedures has declinedfrom 22 percent to 15 percent, while the number ofhours for the median tax inspection declined from 8to 5 hours. In addition, 47 percent of respondents inthe median province claim that the government-required paperwork has declined in the past twoyears, and 44 percent of firms acknowledge that civilservants have become more effective at dealingwith bureaucratic procedures.
One motivation for improvement on this index maybe the extensive standardization efforts that tookplace as a result of the government’s Master Plan forAdministration Procedure Simplification (known asProject 30) to create a database of all administrative
procedures (APs), standardize them, and trim awaydamaging, contradictory, or irrelevant documents.Although the database was launched after the PCIsurvey was administered, extensive provincial-levelstandardization efforts took place in order tocomply with the collection of APs. Separateprocedures created by the thousands of communesand hundreds of districts were standardized so thateach of the 63 provinces now has only a single APfor each issue area that applies to every geographicjurisdiction within the province. Anecdotally, this hasled to a reduction in bureaucratic complexity forprivate entrepreneurs. Khanh Hoa province, forinstance, apparently reduced the total number ofbinding APs by 30 percent simply throughjurisdictional standardization.16
These numbers indicate that some headway is finallybeing made on Project 30 and PAR goals, but there isstill room for improvement. Only 30 percent ofrespondents noted a decline in the time necessary toreceive required stamps and signatures fromprovincial bureaucrats and only 24 percent observeda reduction in official fees for these services.
Labor Quality: Firms’ assessments of labor quality andeducational training in the country were at historiclows last year. Scores have improved this year, butmuch work remains to be done. Forty-five percentof respondents rank general educational as good orvery good, compared with 35 percent in 2008.Similarly, assessments of vocational training as goodhave increased from 20 percent in 2008 to 28percent this year. Given the importance of laborquality in firm investment decisions, thesedevelopments bode well for the future but the lowabsolute scores are worrisome.
Le Duy Binh, in a forthcoming PCI Policy ResearchPaper, chronicles several troublesome indicators.17
22
15. For more information, see http://tintuc.xalo.vn/001103972509/cap_giay_chung_nhan_nha_dat_tiep_tuc_tam_ngung_nbsp.html,http://mobi.tuoitre.com.vn/Tianyon/Index.aspx?ArticleID=332323& ChannelID=204
16. See Kïët quaã triïín khai cuãa TCTCT
< http://www.thutuchanhchinh.vn/index.php/introduction?id=5>for the explanation of standardization by the Project 30 task force.
17. Le Duy Binh. Forthcoming. “Formulation and implementation oflabor and human resources development policies for enterprisesat provincial level. Best Practices in Da Nang, Binh Duong, and VinhPhuc.” PCI Policy Research Paper 1. Ha Noi: VietnamCompetitiveness Initiative.

According to a recent Jetro Study, 70.4 percent ofJapanese companies faced difficulty in recruitingengineers in Vietnam in 2007; 63 percent hadproblems recruiting middle-level managementpersonnel (the ratio for all Association of SoutheastAsian Nations countries is 39.1 percent).18
According to aggregate statistics from job servicecenters across the country, 100,000 positions wereadvertised in 2009. However, the number ofpersons who asked for assistance from the centersaccounted for only 17 percent of total employerdemand. More worryingly still, only 6 percent of thejob seekers met the qualifications and criteria setforth by recruiters.19
The need to renovate the education system,especially tertiary education and development ofhigh-quality human resources for enterprises, hasrecently become a “burning“ issue, discussed atvarying levels of government and at citizen forums.Notable economists who visited Vietnam, such asProfessor Paul Krugman and Professor MichaelPorter, list it as a strategic priority. Vocationaltraining is also critical, but challenging to improve.We detail best practices for vocational training toenhance labor upgrading in a forthcoming policypaper (See below for more details).
Legal Institutions: Confidence in legal institutionsshows mixed results. The percentage of claims atProvincial People’s Courts filed by private entitieshas increased from 65 percent to 72 percent of allcases. On the other hand, firms’ confidence that theycan use the legal system to appeal corrupt behavior(27 percent in 2008 and 25 percent in 2009) orprotect their property rights (67 percent and 62percent) declined slightly. These declines, however,are both close to the survey margin of error andshould therefore be treated with caution. In thepost-World Trade Organization businessenvironment, legal institutions assume greater and
greater importance. Ambitious managers must dobusiness with partners outside of their socialnetwork, obviating traditional social enforcement ofcontracts. Belief that the legal system will treat onefairly facilitates contracting across borders,expanding the realm of opportunities and leading togreater investment.
ChallengesTransparency: An area of tremendous achievementin the country over the past years, transparency hasdeteriorated in 2009.20 As mentioned above,transparency is critically important to the ability ofbusinesses to adequately assess risk, so this finding isa major concern.
Access to provincial planning documents and thepercentage of firms that believe relationships arenecessary to receive business documentation (61.26percent) are back to 2006 levels after consistentimprovement over time. Similarly, the percentage offirms claiming that implementation of central laws ispredictable (8.4 percent) and the share ofbusinesses negotiating with the local tax authority(41 percent) are back to 2007 levels. Theseworrisome results are supported by analysis of aseparate panel dataset of firms answering in multipleyears. The cause of the decline, however, is unclear.
It is worth noting, however, that one area oftransparency improvement is access to legaldocumentation (laws, decrees, and implementingdocuments), where firms now report the highestlevels of access in the history of the PCI. Certainly,improvement on this score has benefitted from thepromulgation of the Law on Laws (2008) andDecree 136/2005/ND-CP that mandated thatprovinces publish all legal normative documents(LNDs) passed at the provincial level in a provincialgazette (Công Báo). Better access to LNDs may
THE VIETNAM PROVINCIAL COMPETITIVENESS INDEX 2009 23
18. Survey on business environment presented by JETRO at theVietnam Business Forum in Ha Noi in June 2008.
19. “Demand and Supply of Labor: Status and Solution”, MOLISA,December 2009.
20. See, for instance, Joint-Donor Report. 2009. Vietnam DevelopmentReport 2010: Modern Institutions. Ha Noi, December 3–4: 62
also result from commitments made under theWorld Trade Organization and U.S. Bilateral TradeAgreement to create a transparent, predictable, andequitable legal system where rules are “no moreburdensome than necessary to serve a legitimateregulatory interest.” A final factor may have beenthe provincial preparations for the launch of theonline database of administrative proceduresunder the Prime Minister’s Project 30 discussedabove. Provincial leaders may have been spurredto action by the launch of the Project 30 programby the beginning of the inventory analysis, whichbegan on April 9, 2009, and the first official launchof a ministerial database on July 6, 2009.21
Figure 1.9 explores the divergent trends of planningand legal documents over time. The first paneldepicts access to the five most important LNDs forprivate businesses (laws, implementing documents,provincial decisions, applications for businessregistration and land, and notification aboutchanges in tax law). The second panel illustratesaccess to five key planning documents for
domestic businesses (provincial budgets,socioeconomic plans like the provincial 10-YearMaster Plan, plans for the roll-out of newinfrastructure, land-use and zoning plans, andprovincial incentive policies). The X-axis recordsthe average level of access recorded by firms on afive-point scale, ranging from impossible to veryeasy. The Y-axis simply depicts the year of the PCIsurvey, going back to the first iteration in 2005.
The trend is unmistakable: access to planningdocuments has declined or stagnated over time,while access to legal documents has shown a steadyincrease since 2006. In general, provincial budgetsand land-use plans are considered to be the mostdifficult to access, while infrastructure andsocioeconomic plans show sharp declines in accesssince 2008. Among the legal documents, provincialdecisions are the only item demonstrating a slightdownward slide in the past year. This slide, however,is minor compared to the downward trajectory insome planning documents.
Why has access to legal documents improved, whileplanning documents are more difficult to obtain?Further, why do firms believe that the need forrelationships has increased? These are importantmysteries that we will explore in more depth in astand-alone research paper later this quarter as partof the new PCI policy research series (see belowfor more details on this and other projects).
THE VIETNAM PROVINCIAL COMPETITIVENESS INDEX 200924
21. Though the national database was not launched until October 26,2010, after respondents had filled out the PCI questionnaire, manyprovinces had already published their administrative procedureseither on their own websites or in hard copy well before thatdate. In fact, 41 percent of PCI respondents said that they knewabout Project 30 in a question on the survey, indicating a notablelevel of awareness before the final launch.
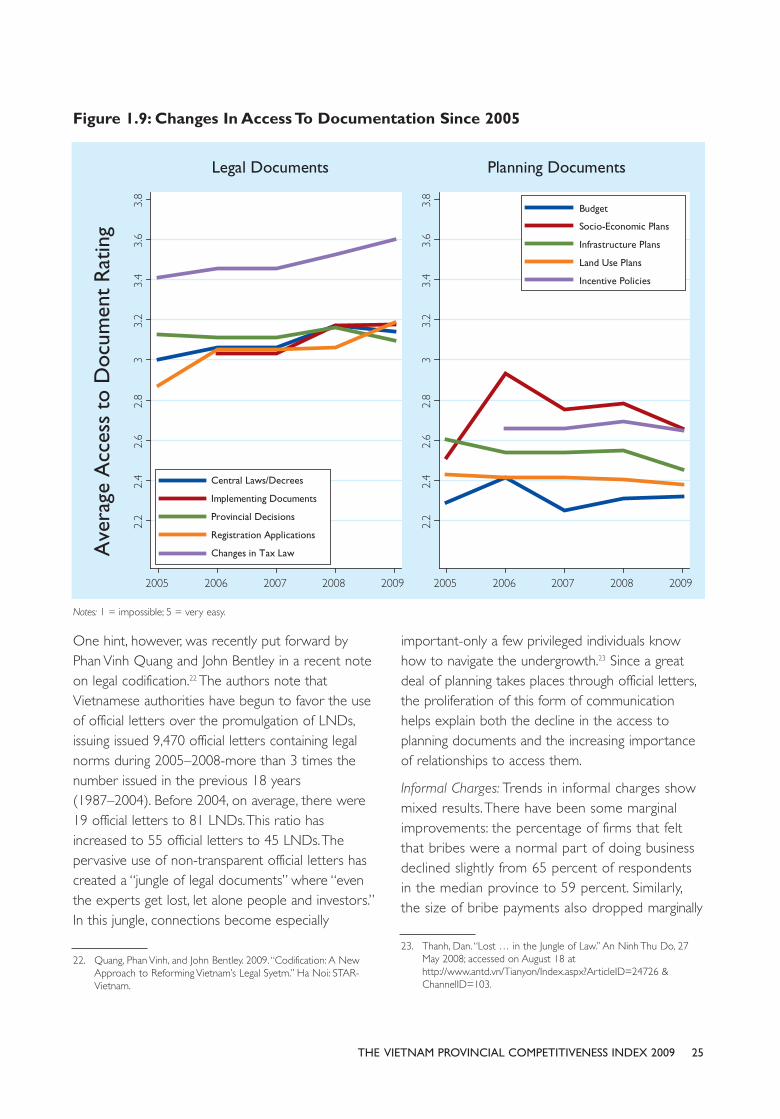
One hint, however, was recently put forward byPhan Vinh Quang and John Bentley in a recent noteon legal codification.22 The authors note thatVietnamese authorities have begun to favor the useof official letters over the promulgation of LNDs,issuing issued 9,470 official letters containing legalnorms during 2005–2008-more than 3 times thenumber issued in the previous 18 years(1987–2004). Before 2004, on average, there were19 official letters to 81 LNDs. This ratio hasincreased to 55 official letters to 45 LNDs. Thepervasive use of non-transparent official letters hascreated a “jungle of legal documents” where “eventhe experts get lost, let alone people and investors.”In this jungle, connections become especially
important-only a few privileged individuals knowhow to navigate the undergrowth.23 Since a greatdeal of planning takes places through official letters,the proliferation of this form of communicationhelps explain both the decline in the access toplanning documents and the increasing importanceof relationships to access them.
Informal Charges: Trends in informal charges showmixed results. There have been some marginalimprovements: the percentage of firms that feltthat bribes were a normal part of doing businessdeclined slightly from 65 percent of respondentsin the median province to 59 percent. Similarly,the size of bribe payments also dropped marginally
Figure 1.9: Changes In Access To Documentation Since 2005
THE VIETNAM PROVINCIAL COMPETITIVENESS INDEX 2009 25
Notes: 1 = impossible; 5 = very easy.
22. Quang, Phan Vinh, and John Bentley. 2009. “Codification: A NewApproach to Reforming Vietnam’s Legal Syetm.” Ha Noi: STAR-Vietnam.
23. Thanh, Dan. “Lost … in the Jungle of Law.” An Ninh Thu Do, 27May 2008; accessed on August 18 athttp://www.antd.vn/Tianyon/Index.aspx?ArticleID=24726 &ChannelID=103.

- 9 percent of respondents in the median provincespend over 10 percent of their revenue on informalcharges—down from 10 percent last year.
On the other hand, there are some veryproblematic patterns evident in other realms ofinformal charges. Fifty-two percent of respondentsin the median province believe that localgovernment officials use compliance with localregulation to extract rents, up from 37 percent in2008 and 2007. This finding unfortunately dovetailswith our findings about declining transparencyabove. The less transparent local regulations are, themore loopholes are available for opportunisticbehavior by a few unscrupulous officials.
In addition, 53 percent of firms believe thatcommissions are required for bidding ongovernment procurement contracts, which is atroublesome sign of macro-level corruption. Theseresults appear to indicate a transition in theVietnamese business environment. Pettycorruption—small bribes to facilitate transactions atlower levels of the bureaucratic chain—has becomeless frequent and more predictable in terms of size.On the other hand, macro corruption hasworsened. Small firms feel disadvantaged in theircompetition for government procurement. If thistrend increases, it could lead to decliningproductivity as inefficient (but high-payingcontractors) are the most likely to receive contractsfor important infrastructure development projectsand technological upgrading.
Proactivity: Firm perceptions of proactivity have alsodeclined back to 2007 levels. Only 43 percent ofrespondents believe that provincial officials have apositive attitude toward private entrepreneurs,down 10 percentage points from the 2008 level.Firms are also less likely to believe their provincialofficials demonstrate creativity about solvingproblems faced by firms within the parameters ofnational law. This finding is puzzling; one would haveexpected more dynamic behavior from local officialsas decentralization and PAR progressed and theirauthority increased, not less.
Assessment of infrastructureThis year, the research team continued our trackingon the quality of infrastructure at the provinciallevel as business owners and policy makerscontinue to cite it as one of the most criticalbarriers to investment and growth in the country.The PCI Infrastructure Index is divided into foursub-indices:
• Industrial zones and small and medium-sizedenterprise concentrations: measuring thecapacity and quality of local industrial zones;
• Road and transport: gauging the coverage ofroads in Vietnam and the indirect and directcosts of transport that result from them;
• Utilities: measuring the costs and reliability oftelecommunications and energy delivery inthe province; and
• Information and communications technology:Measuring access to and usage of informationand communications technology. 24
As in the PCI, each Infrastructure Index sub-index isa combination of hard data from published sourcesand perceptions data gleaned from the 9,890 PCIrespondents. Figure 1.10 details the final scores onthe Infrastructure Index. Table 1.4 provides sourceof data and summary statistics on the indicatorsused in each sub-index.
Binh Duong, Dong Nai, and HCMC—the threepowerhouse industrial provinces of the NorthSoutheast, which alone account for a quarter of thenon-oil GDP in the country—receive the threehighest scores. Binh Dinh, Ha Noi, and Hai Phonground out the top performers. Unsurprisingly, thelowest infrastructure scores are in the rural,Northern Uplands of the country, including Bac Kan,Lai Chau, Cao Bang, and Lang Son.
26 THE VIETNAM PROVINCIAL COMPETITIVENESS INDEX 2009
24. This year’s report drops major infrastructure (ports and airports)from the index because their quality is difficult to assess from thesmall portion of firms in the PCI survey that export. Moreover,assessment and planning for these large-scale investments shouldbe at the central level.

27THE VIETNAM PROVINCIAL COMPETITIVENESS INDEX 2009
Figure 1.10: Infrastructure Quality Index

28 THE VIETNAM PROVINCIAL COMPETITIVENESS INDEX 2009
Table 1.4: Indicators Used in Infrastructure Index
Industrial ZoneQuality andCoverage
Number of industrial zones(IZs) and concentrations inprovince.
Ministry of Planningand Investment
(MPI) (August 2007)
Percentage of total IZsurface area that currentlyhas occupants.
MPI (August 2007)
Firm rating of provincial IZquality. (% very good or good)
PCI SurveyQuestion E1.5
Min
Median
Max
Correlation
Min
Median
Max
Correlation
Min
Median
Max
Correlation
Min
Median
Max
Correlation
Min
Median
Max
Correlation
Min
Median
Max
Correlation
Min
Median
Max
Correlation
Min
Median
Max
Correlation
0
1
23
0.95*
0.00
30.84
93.55
0.97*
0.00%
24.07%
79.17%
0.75*
7.95%
28.80%
80.82%
0.84*
4.82
51.44
100.00
0.75*
3.00
69.65
100.00
NA
0
3
10
DROPPED
0.0
22.2
166.2
DROPPED
0
1
23
NA
0.00
30.13
93.55
NA
3.07
23.87
72.89
NA
0.00%
5.45%
38.90%
NA
1.98
51.28
100.00
3
7
19
NA
14.6
31.9
83.1
NA
Road Qualityand Transport
Costs
Assessment of road quality.(% good or very good)NEW INDICATOR
PCI Survey Question E1.1
Percentage of roads inprovince (national,provincial, or district) thatare paved with asphalt.
GSO
Percentage of provinciallymanaged roads that arepaved with asphalt.
GSO
Number of days annuallythat roads are impassabledue to rainfall.*
PCI SurveyQuestion E2
Monetary loss annually fromspoiled and damagedproducts in the past year(millions of VND).*
PCI SurveyQuestion E43
Sub-Index Indicator Source Measures 2008 2009

29THE VIETNAM PROVINCIAL COMPETITIVENESS INDEX 2009
Utilities (Energy and
Telecommuni-cations)
Transport costs of a 40-footcontainer from provincialcapital to nearest major ports(Hai Phong, HCMC, Da Nang)in millions of VND.*
Average estimates bythree local transport
companies
Hours oftelecommunications outagesper month.*
PCI Survey Question E6
Assessment oftelecommunications quality.(% good or very good)
PCI Survey Question E1.2
Min
Median
Max
Correlation
Min
Median
Max
Correlation
Min
Median
Max
Correlation
Min
Median
Max
Correlation
Min
Median
Max
Correlation
Min
Median
Max
Correlation
Min
Median
Max
Correlation
DROPPED
0
3
8
0.25
35.59
67.50
84.93
70.3*
0.4
1.9
20.8
0.12*
142.24
796.24
1231.13
0.44*
46.00
50.00
58.00
−0.36
45.78
50.00
58.38
NA
2.1
6.5
16.0
NA
7
13
50
NA
8.57
25.00
53.65
NA
0.7
1.3
5.8
NA
595.51
776.17
1068.09
NA
27.00
44.00
101.00
NA
NA
Telephones (land andcellular) per 1,000 citizens.
Ministry of Post andTelecommunications
Average cost per kilowatt ofenergy in province (VND).
Electricity Vietnam
Hours of electricity outagesin the last month.*
PCI Survey Question E4
Firms informed in advanceabout power cuts (% oftime).* NEW INDICATOR
PCI Survey Question E5
Sub-Index Indicator Source Measures 2008 2009
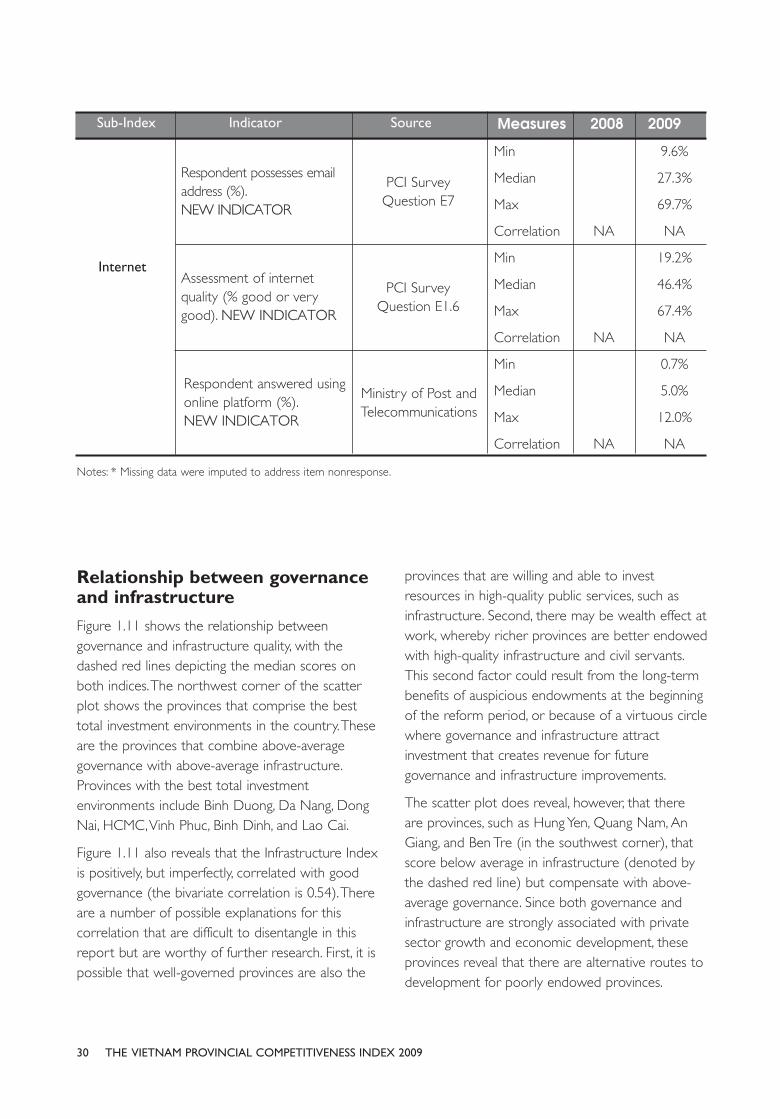
30 THE VIETNAM PROVINCIAL COMPETITIVENESS INDEX 2009
Internet
Respondent possesses emailaddress (%). NEW INDICATOR
PCI Survey Question E7
Assessment of internetquality (% good or verygood). NEW INDICATOR
PCI Survey Question E1.6
Respondent answered usingonline platform (%). NEW INDICATOR
Ministry of Post andTelecommunications
Min
Median
Max
Correlation
Min
Median
Max
Correlation
Min
Median
Max
Correlation
9.6%
27.3%
69.7%
NA
19.2%
46.4%
67.4%
NA
0.7%
5.0%
12.0%
NA
NA
NA
NA
Sub-Index Indicator Source Measures 2008 2009
Notes: * Missing data were imputed to address item nonresponse.
Relationship between governanceand infrastructureFigure 1.11 shows the relationship betweengovernance and infrastructure quality, with thedashed red lines depicting the median scores onboth indices. The northwest corner of the scatterplot shows the provinces that comprise the besttotal investment environments in the country. Theseare the provinces that combine above-averagegovernance with above-average infrastructure.Provinces with the best total investmentenvironments include Binh Duong, Da Nang, DongNai, HCMC, Vinh Phuc, Binh Dinh, and Lao Cai.
Figure 1.11 also reveals that the Infrastructure Indexis positively, but imperfectly, correlated with goodgovernance (the bivariate correlation is 0.54). Thereare a number of possible explanations for thiscorrelation that are difficult to disentangle in thisreport but are worthy of further research. First, it ispossible that well-governed provinces are also the
provinces that are willing and able to investresources in high-quality public services, such asinfrastructure. Second, there may be wealth effect atwork, whereby richer provinces are better endowedwith high-quality infrastructure and civil servants.This second factor could result from the long-termbenefits of auspicious endowments at the beginningof the reform period, or because of a virtuous circlewhere governance and infrastructure attractinvestment that creates revenue for futuregovernance and infrastructure improvements.
The scatter plot does reveal, however, that thereare provinces, such as Hung Yen, Quang Nam, AnGiang, and Ben Tre (in the southwest corner), thatscore below average in infrastructure (denoted bythe dashed red line) but compensate with above-average governance. Since both governance andinfrastructure are strongly associated with privatesector growth and economic development, theseprovinces reveal that there are alternative routes todevelopment for poorly endowed provinces.
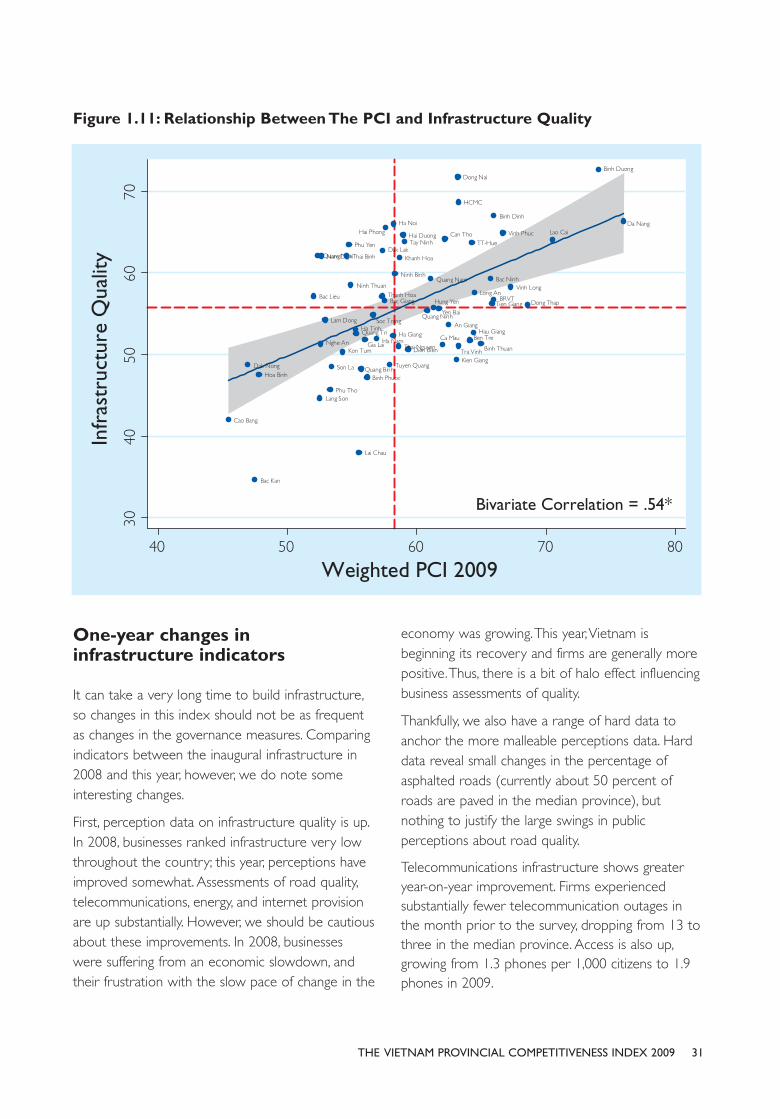
31THE VIETNAM PROVINCIAL COMPETITIVENESS INDEX 2009
Figure 1.11: Relationship Between The PCI and Infrastructure Quality
One-year changes ininfrastructure indicators
It can take a very long time to build infrastructure,so changes in this index should not be as frequentas changes in the governance measures. Comparingindicators between the inaugural infrastructure in2008 and this year, however, we do note someinteresting changes.
First, perception data on infrastructure quality is up.In 2008, businesses ranked infrastructure very lowthroughout the country; this year, perceptions haveimproved somewhat. Assessments of road quality,telecommunications, energy, and internet provisionare up substantially. However, we should be cautiousabout these improvements. In 2008, businesseswere suffering from an economic slowdown, andtheir frustration with the slow pace of change in the
economy was growing. This year, Vietnam isbeginning its recovery and firms are generally morepositive. Thus, there is a bit of halo effect influencingbusiness assessments of quality.
Thankfully, we also have a range of hard data toanchor the more malleable perceptions data. Harddata reveal small changes in the percentage ofasphalted roads (currently about 50 percent ofroads are paved in the median province), butnothing to justify the large swings in publicperceptions about road quality.
Telecommunications infrastructure shows greateryear-on-year improvement. Firms experiencedsubstantially fewer telecommunication outages inthe month prior to the survey, dropping from 13 tothree in the median province. Access is also up,growing from 1.3 phones per 1,000 citizens to 1.9phones in 2009.

32 THE VIETNAM PROVINCIAL COMPETITIVENESS INDEX 2009
Access to and stability of energy account for thegreatest worries for current businesses. Averageenergy costs have risen somewhat in the medianprovince to about 770 VND/kilowatt, while servicedelivery has declined. In the month prior to the PCIsurvey, the median province suffered 50 power cutsas opposed to 44 in the previous year ; theseoutages were highly unpredictable and firmsreceived notice only 50 percent of the time.
Caution about attribution aboutinfrastructure qualityThe Infrastructure Index, unlike the PCI, is not adefinitive evaluation of the quality of localleadership. Many of the indicators measured are outof the control of provincial authorities.
Much of the current infrastructure was completedlong before the tenure of today’s current provincialleaders: some was built in the early central planningyears after independence and unification and someeven dates back to the 19th century underEmperor Minh Mang. Provincial officials cannot beheld responsible for the infrastructure stock theyinherited from a bygone era.
In addition, firms in distant areas have highertransport costs that are inherently difficult toovercome. The mountainous regions offer aharsher and more expensive terrain for buildingmajor thoroughfares than provinces in the RedRiver Delta. Many Mekong Delta provinces usewaterways as their primary means of transport,but because many of these waterways are quitesmall, transport companies cannot realizeeconomies of scale from packing products in largecontainers. Often, products must be reloaded afterpassage on the Mekong River before being sent onto the nearest port.
Many infrastructure decisions are made by centralgovernment planners. Provinces can supplementinfrastructure spending out of their own budgets,but poorer provinces do not have this option andmust depend on central transfers. Winning some
national infrastructure monies is occasionallydependent on who has better access to centralofficials or is able to plead the case for centralsupplements more persuasively. It makes little senseto reward or punish provincial officials based on thesuccess of their lobbying efforts.
Finally, linkages of infrastructure across provincialborders affect firm perceptions in ways that aredifficult to disentangle using provincial-level surveydata. It would be unfair to rank province A below itsneighbor, province B, simply because centralauthorities selected B as the sight of the nationalhighway. Alternatively, a province that has done agood job of marshalling local resources for newroads and maintenance may be downgraded byfirms that are forced to ship products outside thoseprovincial borders over the roads of neighbors thatmay not have been so diligent about infrastructuredevelopment and upkeep. Consequently, theInfrastructure Index is simply an assessment of totalinfrastructure quality. We make no assumptionsabout credit or culpability and present it simply as atool to inform the investment decisions of localentrepreneurs and the policy priorities of centraland local officials.
Future questions for researchusing PCI dataEach year, the creation of the PCI highlights anumber of research questions that are beyond thescope of the PCI endeavor-creating an objectiveranking of provincial economic governance - but areanswerable using the wealth of information availablein PCI data.25 Such questions require separateresearch and analysis of their own and deservemore careful treatment than the space limitationsof the PCI report allow. In 2009, three suchquestions arose. These will be addressed in a seriesof follow-on VNCI Policy Reports released inwinter and fall of 2009.
25. Such data include 1) the 2009 survey of 9,890 domestic privatebusinesses; 2) panel data of 2,500 respondents, who haveanswered the survey every year going back to 2006; 3) time-seriesdata on provincial aggregate governance from 2005 onward. Thesedata have never been fully exploited by researchers.

33THE VIETNAM PROVINCIAL COMPETITIVENESS INDEX 2009
26. Vietnam Financial Review. 2009. “Economic Stimulus Package:Stimulating Enough for SMEs.” December 2; accessed December27 at http://www.vfr.vn/focus/economic-stimulus-package-stimulating-enough-for-smes.html.
The impact of the economic stimulus ondomestic, private investment
In the midst of the global financial crisis, theVietnamese Government put forward an ambitiouseconomic stimulus, which included publicexpenditure programs, tax incentives, and a uniquegovernment interest rate of 4 percent designed toencourage small businesses to take advantage ofcheap credit on short to medium-term loans to buymachinery and equipment and thereby furtherstimulate domestic demand. Estimates of the totalsize of the stimulus are as large as US$8 billion(about 9 percent of GDP at official exchange rates)and opinions about its success vary dramatically,especially with regard to the subsidized loan programthat cost about 2.5 trillion VND ($1.3 billion). Someanalysts have given the government credit for a rapidand wise response that averted economic disaster,while others have charged that the money primarilyended up fuelling the stock market and real estatebubble and did little to achieve its ultimate goal ofstimulating productive new investments.26
The 2009 PCI is ideally positioned to analyze thisquestion. We have already shown that confidence inthe Vietnamese economy according to the BusinessThermometer is down this year across the country,but that there is tremendous local variation inresponses across provinces and individualrespondents. In addition, 3,225 of the 9,890 PCIrespondents received the special government 4percent rate of interest, allowing us to adjudicateclearly the impact of this specific stimulus program.
Though findings remain tentative, contingent onfuture analysis, preliminary evidence seemsencouraging. First, reception of a stimulus loanappears to be associated with business expansion.Stimulus recipients were more likely to hire newemployees over the past year, more likely topurchase additional land for their business premises,and much more likely to have plans to expand their
businesses over the next two years.
In addition, contrary to conventional wisdom,preliminary analysis appears to reveal that thestimulus was fairly evenly received across differentparts of the country and not concentrated only inVietnam’s major economic centers. In fact, rural andsmaller firms were slightly more likely to receive theloan than larger, more sophisticated operations(including equitized SOEs).
More work is needed to confirm these findings.Most importantly, to understand the impact of thesubsidized loan program, we must first understandwho received it and why. Any bias in access to theloan will affect our ability to estimate itseffectiveness. For instance, if the primary recipientswere businesses that would have expanded even inabsence of the loan, the net effect of the stimulus isactually somewhat less than simple correlations mayreveal. Once we address these selection effects, wewill be able to offer the first micro-analysis of thegovernment stimulus package.
Improvements in vocational training
We have shown above that the quality of laborsignificantly affects the business prospects ofdomestic investors. A shallow talent pool limitsplans for technological upgrading or businessexpansion requiring sophisticated financial orstrategic management skills. What can provincialleaders do to improve the educational skill-sets oftheir populations in order to meet the needs oflocal companies? Vocational training is a usefulstrategy, but it can easily be done badly. In thesecond policy research paper, Le Duy Binh and theresearch team study vocational training in three ofthe top-ranked provinces for labor quality (DaNang, Vinh Phuc, and Binh Duong), identifying bestpractices for erecting schools, devising curriculums,and incorporating private sector participation.
The selection of the three provinces is particularlypropitious because, although they all excel in labortraining, they face different sets of labor challengesin addition to the general problems facedthroughout the country. Da Nang is an urban centerthat attracts migrant labor, but also has a relativelylarge and sophisticated service sector with specific

requirements for its labor force. Binh Duong faces adifferent problem as a manufacturing center for thecountry. Its challenges include a shortage ofunskilled laborers, a strained social security systemdue to large number of immigrant laborers, andrelatively frequent labor disputes and strikes. TheVinh Phuc leadership is primarily concerned withaddressing labor dislocation for farmers who havelost their land due to re-zoning and industrialization.
The study identifies a number of important policiespracticed by these provinces that could beimplemented generally across the country. Keyamong them are 1) the attraction of privateinvestment into vocational training programs; 2)encouragement of talented trainers and teachersto work for vocational training institutions; 3)demand-based vocational training and humanresource development to ensure that schoolsmeet the needs of students and potentialemployers; and 4) the establishment of vocationalinstitutions as part of the industrial zonedevelopment, such as the Vietnam-SingaporeVocational College in Binh Duong.
In addition, the report identified special practices bythese provinces to meet their unique challenges.These include 1) the development of clear policiesfor job change and job creation in land clearanceand re-zoning that are responsive to the demandsof people who have been displayed; 2) well-implemented surveys on the needs for vocationaltraining and job change to ensure evidence-baseddecision making; 3) formulation of specific projectsin support of job change and job creation instrategic economic sectors; 4) provision of freetraining for laborers who must change their jobs asa result of technical obsolescence and economictransition; and 5) diversification of vocationaltraining and priorities to help create jobs for over-age laborers.
Transparency of processes anddocumentation
The third policy paper furthers our analysis ofaccess to business documentation. What factorsaccount for the declining business perceptions ofaccess to planning documents and the increasingbelief that relationships are necessary for access?These findings fly in the face of a great deal of work
to enhance transparency over the past few years.We provided one tentative hypothesis that part ofthe diminished transparency results from theproliferation of official letters over LND.Nevertheless, more testing is necessary to confirmthis conclusion.
Once we discover the root of the problem,however, more work is needed to understand whatcan be done about it. Examining the wide variationin transparency across provinces should be helpfulin pinning down the answer. Each year, a fewprovinces, such as Lao Cai, Binh Duong, Da Nang,and Binh Dinh, consistently rank atop thetransparency rankings. Other provinces, such asLong An, have recently completed local policyimprovements that raised their transparency scoresmarkedly. In the third PCI policy paper, we tacklethe question of transparency in Vietnam, exploringthe best practices of the high transparencyachievers and demonstrating how these approachescan be easily adapted to other parts of the country.
In conclusionThe PCI is a composite index ranking Vietnam’s 63provinces according to their performance on nineaspects of governance that are critical for privatesector development. The index is based on theperceptions of 9,890 respondents, but smalladjustments are made using publicly available datato address perception biases. As a result, the PCIprovides the most objective metric available forgauging the impact of economic and administrativereforms at provincial and national levels.
Key findings from this year’s report are:
• Da Nang and Binh Duong continue todemonstrate the highest levels of goodeconomic governance in the country.
• PCI rankings are highly correlated not onlywith retrospective investment in province, butalso with prospects for future investmentbased on where PCI respondents intend toexpand.
• Transparency and Labor Quality are thegovernance factors with the greatest
34 THE VIETNAM PROVINCIAL COMPETITIVENESS INDEX 2009
35THE VIETNAM PROVINCIAL COMPETITIVENESS INDEX 2009
influence on private sector performance andeconomic welfare.
• Entry Costs, Access and Security of Land,Time Costs, Labor Quality, and Confidence inLegal Institutions show signs of definitiveimprovement over the past year. Policymakers should be proud of theseaccomplishments.
• Worrisome declines are evident in terms ofTransparency, Informal Charges, and theProactivity of local leaders. Unless importantchanges are made, private sector
performance could be negatively affected.
• Some small improvements in infrastructurequality are evident. These small changes inactual infrastructure quality, however, had ahuge impact on private sector perceptions.
• Infrastructure and governance are positivelycorrelated, indicating a potential causalrelationship. Nevertheless, further analysisreveals that some provinces have been ableto compensate for the negative influence ofpoor infrastructure on investment byconcentrating on governance improvements.
CHAPTER TWO
GOVERNANCE IMPACT OF HA NOI’S GEOGRAPHIC
EXPANSION
This year, policy developments in Vietnam threw a
fascinating wrench in the PCI analysis.27 The
annexation of Ha Tay province and two surrounding
districts in other provinces created an interesting
opportunity to observe how an exogenous change
in the quality of governance affects business
performance and prospects. In this chapter, we take
advantage of this unique natural experiment,
demonstrating how the merger significantly altered
governance in the affected locations.
Anticipating our findings, treating the new parts of
Ha Noi as separate provinces reveals that Ha Noi
would rank slightly behind Me Linh and Ha Tay. In
other words, the addition of these provinces actually
raised Ha Noi’s final PCI scores slightly, although the
changes are minor. For firms in Ha Tay and Luong
Son, the merger into Ha Noi did not lead to worse
governance. Businesses in these provinces may have
been affected by the shock of transition and the
difficulties of learning the locations of new agencies.
Nevertheless, we can expect that their business
prospects will not be greatly altered in the long term.
For businesses located in Me Linh district, however,
there is more reason for concern. Comparing
similar groups of firms in Me Linh and Vinh Phuc
suggests that firms in Me Linh are significantly more
negative about a range of governance indicators
than their counterparts in Vinh Phuc. If governance
matters for economic performance, and we
certainly believe it does, there is reason to worry
that the merger may have negative long-term
implications for Me Linh businesses and the welfare
of citizens in that district. At present, however, the
changes in governance do not appear to have
damaged business performance. Time will reveal
whether this is a temporary phenomenon or not.
BackgroundOn May 29, 2008, the National Assembly decided
by a vote of 92 percent to allow Ha Noi to annex
the entire province of Ha Tay, as well as the Me Linh
district of Vinh Phuc province and the Luong Son
district of Hoa Binh province. The stated goal of the
measure was to facilitate the creation of an
international-caliber city in the capital. By expanding
the borders of Ha Noi, the initiative’s designers
hoped to ease the policy-making apparatus for
infrastructure development and land planning by
reducing the number of bureaucratic layers involved
in the approval process.
It was also argued that urban sprawl between HaNoi and its surrounding areas had effectivelyreduced the significance of borders between theareas anyway. A substantial number of Ha Tayresidents (especially those in the neighboring HaDong district) commuted to Ha Noi for work on aregular basis, while many Ha Noi residents ownedland and operated businesses on the other side ofthe border. Eradicating a border that existed onlyon paper would reduce bureaucratic hassles forthese individuals in terms of dealing with two
39THE VIETNAM PROVINCIAL COMPETITIVENESS INDEX 2009
GOVERNANCE IMPACT OF HA NOI’S GEOGRAPHICEXPANSION
27. Nam, Minh. “Nhaâ sûã hoåc Dûúng Trung Quöëc: Àïì aán múã röång Haâ
Nöåi khöng mang tñnh khoa hoåc.” CAND Online.
http://www.cand.com.vn/vi-VN/thoisu/2008/5/90725.cand.

provincial administrations for residency permits,business registration, and land acquisition.
The decision was quite controversial. Beyond thestated goals, some analysts argued that the mergerwas designed to benefit vested interests close to HaNoi policy makers rather than the citizens of theannexed locations. These critics cite evidence ofspeculation in land prior to the merger in thetargeted districts, as well as damaging over-staffing ofkey provincial offices at the onset of the transition,as evidence that more pernicious goals were arework in the merger plans.
For the PCI endeavor, the merger created bothmethodological challenges and interesting researchopportunities. Methodologically, the annexationessentially means that Ha Noi, Vinh Phuc, and HoaBinh are no longer the same geographic units thatwere previously measured. This complicated analysisof changes in PCI scores over time. Did a province’sscores rise or fall because of changes in governance,or simply because it inherited a large group of newbusiness operations as a result of changing borders?In a related vein, it is conceivable that Ha Noi’sgovernance scores will suffer as businesses adjusttheir practices to the new regime. Businesses haveto learn new locations of local agencies and adjustto new personalities in key offices associated withgovernment-business interface as civil servants inthose offices are transitioning to their own new setof responsibilities.
Alternatively, annexation by Ha Noi may represent areal and important change in governance qualitythat will affect firm operations in important ways.Glancing at the 2008 PCI scores, we can see thatthe four impacted provinces received vastly differentfinal rankings. Vinh Phuc province ranked thirdoverall and was the sole Northern province in theexclusive group of excellent performers.28 Ha Noi
and Hoa Binh both ranked among the averageprovinces, with Ha Noi receiving a moderatelyhigher ranking than the rural and mountainous HoaBinh. Ha Tay, on the other hand, was ranked amongthe lowest quartile of performers. Although it hadshown a significant trajectory of improvement overtime (see the 2007 PCI report), it had a long wayto go to catch up with the governanceimprovements achieved by its Red River Deltaneighbors. Thus, for businesses operating in Me Linh,annexation to Ha Noi represents a significantdowngrade in the quality of governance. We canexpect that entrepreneurs may respond negativelyto the transition. By contrast, the Ha Noi mergershould serve as a net benefit for businesses inLuong Son and especially Ha Tay. These hypothesesare testable using the PCI dataset.
However, Vinh Phuc and Hoa Binh might be
negatively affected by the merger. Both provinces
lost one of their most economically advanced and
largest revenue-producing districts. Me Linh district
was the most auspiciously endowed location in Vinh
Phuc province, just off the road linking Ha Noi and
Noi Bai airport. As a result, its Quang Minh
industrial zone was filled with 138 small and
medium-sized private Vietnamese establishments
and 22 foreign-invested projects. Before the merger,
Vinh Phuc officials worried that the merger would
cost them significant revenue that they could use
for development and social welfare spending in the
province.29 Hoa Binh province was even more
worried. The four communes of Luong Son
province that Ha Noi annexed represented the
most important economic producing areas in the
province, including a number of scenic areas that
Hoa Binh was developing into golf courses and
ecotourism destinations.
40 THE VIETNAM PROVINCIAL COMPETITIVENESS INDEX 2009
28. In 2004, one entrepreneur commented on the differencesbetween operating in Vinh Phuc and Ha Noi, claiming how happyhe was to find a province with reasonable bureaucratic proceduresand fees. Pham Ngoc Phuong. 2004. . "Ûúác gò cuäng nhû thïë naây!"
[Dreaming that Everywhere Was Like This], Tuöíi Treã (Youth)Online, August 13.
29. Meát Vuöng 2008 “Ha Noi Expansion: Officials of Related ProvincesSay.…” http://en.metvuong.com/group_news.php?news_id=605.

AnalysisOur first step in analyzing the impact of the merger
was to re-calculate separate PCI scores for each of
the new pieces of Ha Noi. Essentially, we treated Ha
Tay and Me Linh as if they were separate provinces
and re-calculated their scores. This allows us to
determine what portion of the current Ha Noi PCI
score is accounted for by the districts of the old Ha
Noi and what portion results from the merger.
There are two limitations to this approach. First,
there were two few respondents from Luong Son
to create a valid PCI score. Second, this re-analysis
of the PCI had to be created primarily from survey
responses and could only include a limited set of
hard data. Many of our indicators for LURCs, labor
quality, and legal institutions are only recorded at
the provincial level and do not provide separate
district-level disaggregations. Any approach used to
impute missing hard data for Ha Tay and Me Linh
could have potentially biased scores.
Figure 2.1 records the results of this analysis,
portraying the different units of Ha Noi
alongside the remaining portions of Vinh Phuc
and Hoa Binh provinces. The three different
components of Ha Noi rank similarly across
almost all of the sub-indices.
The original Ha Noi ranks marginally better in two
areas (Entry Costs and Business Support Services),
while Me Linh significantly outperforms its peers on
the Informal Charges sub-index. Otherwise,
however, the different units of the expanded Ha
Noi are statistically indistinguishable.
In fact, as Table 2.1 shows, if we were to recreate
the entire weighted PCI, treating the new parts of
Ha Noi as separate provinces, Ha Noi would
actually rank slightly behind the other two. In other
words, the addition of these provinces actually
raised Ha Noi’s overall PCI scores slightly. These
changes are minor. For firms in Ha Tay and Luong
Son, the bottom line is that merger into Ha Noi did
not lead to demonstrably worse governance.
Businesses in these provinces may have been
affected by the shock of transition and the
difficulties of learning the locations of new agencies.
Nevertheless, we can expect that, in the long term,
their business prospects will not be greatly altered.
The second thing to notice about Figure 2.1 is the
stellar performance of Vinh Phuc relative to the
other areas and its former district of Me Linh. Vinh
Phuc received the top score on seven of the nine
sub-indices, and finished second in Entry Costs.
Thus, it demonstrates tentatively that the Ha Noi
merger led to worsened governance for the
businesses of Me Linh district.
41THE VIETNAM PROVINCIAL COMPETITIVENESS INDEX 2009
Province PCI 2009
Vinh Phuc
Me Linh
Ha Tay
Ha Noi
Hoa Binh
65.97
58.51
56.83
54.54
47.82
Table 2.1: Re-calculated PCI for the Areas Comprising The New Hanoi

Analysis of the PCI panel set of firms respondingevery year confirms these findings. Sixty of the 163firms in Ha Tay and nine of the 50 respondents inMe Linh responded to the PCI survey in 2008. Theirassessments mirror these results. Firms in Me Linhrecorded substantially worse assessments ofgovernance, while firms in Ha Tay score Ha Noi asonly marginally worse than their previous province.
Matching analysis for Me Linh andVinh PhucThe above analysis presents only a broad picture ofthe governance impact of the merger. Theannexation of Me Linh did not randomly samplefirms from Vinh Phuc to be included in Ha Noi; itgrabbed a small portion of the provinces thatparticular firms had chosen due to its industrialzones and proximity to the airport, majorthoroughfares, and the Ha Noi city center. As a
result, the firms located in Me Linh were potentiallydifferent from those in the rest of Vinh Phuc interms of their size, sector, customer base, and legalform. In assessing the impact of the merger, it isimportant to ensure that the specific type of firm inMe Linh is not driving the assessment ofgovernance in the province.
We resolve this problem through a process knownas propensity score matching (PSM). In short, PSMis a process that uses observable characteristics ofparticular observations (in this case businesses) todetermine that probability of selection into atreatment group (in this case location in Me Linhand consequently annexation into Ha Noi).30 Usingthese probabilities, we return to our control group(provinces located in the rest of Vinh Phuc) and
42 THE VIETNAM PROVINCIAL COMPETITIVENESS INDEX 2009
Figure 2.1: Re-calculated PCI Sub-indices for the Areas Comprising the new Ha Noi
Notes: In this exercise, Me Linh and Ha Tay were treated as separate provinces to re-create the PCI. Unfortunately, hard data for many indicatorswere not available at the district level, so the measures rely primarily on perception data.
30. Propensity scores were calculated using Daniel E. Ho, Kosuke Imai,Gary King, Elizabeth A. Stuart. 2009. “MatchIt: NonparametricPreprocessing for Parametric Causal Inference.” Journal ofStatistical Software, Forthcoming. http://www.jstatsoft.org/.

identify a matching group of firms that are like thetreatment group in every observable way, exceptfor the fact that they are not located in Me Linh.PSM provides confidence that we are isolating theimpact of the incorporation of Me Linh into Ha Noifrom the characteristics of the firms themselves,which may also influence assessments ofgovernance.
In our sample, we have 50 respondents from MeLinh and 158 from Vinh Phuc province.31 The goal ofthe matching operation will be to trim back the
respondents of Vinh Phuc to a control group of 50that resembles as closely as possible thecharacteristics of Me Linh province. The first step isto regress a dichotomous province for location inMe Linh on a set of firm and owner characteristicsusing a modified form logistic regression. The resultsof this operation are shown in Table 2.2. The tablereveals that businesses in Me Linh are notstatistically different in the employment size of theenterprise or the sector in which they operate, butthey do tend to be significantly younger (each yearof establishment age is associated with a 1 percentdecline in the probability a firm is located in MeLinh), 30 percent more likely to be registered asjoint-stock companies, and 42 percent more likelyto be an equitized local SOE.
43THE VIETNAM PROVINCIAL COMPETITIVENESS INDEX 2009
31. Of the 50 firms in Me Linh, nine are in the PCI panel dataset,meaning they answered the survey in 2007 and 2008. Ideally, thechanges in these panel firms’ responses would be the best test, butthere are simply too few to allow for valid analysis.
Independent Variable Marginal Probability of Location in Me Linh
Limited Liability Company
Joint-Stock Company
Services/Commerce
Agriculture/Forestry/Aquaculture
Natural Resources
Size
Year of Establishment
Equitized Local SOE
0.0532
(0.0884)
0.303***
(0.109)
-0.0452
(0.0661)
-0.0609
(0.132)
-0.235
(0.297)
0.0124
(0.0286)
0.0105*
(0.00559)
0.424**
(0.165)
Table 2.2: Propensity Score Matching Exercise for Location in Me Linh Province

Using the propensity scores generated by thisoperation, we identify 50 firms in Vinh Phuc thathave similar characteristics to those exemplified byoperations in Me Linh. The results of this approachare shown in Table 2.3. Note that the 50 firmsselected in each province now share similar
distribution on age, size of enterprise, sector, legalform, and customer base. Because they are sosimilar, we can now safely assume that thedifferences that we uncover in estimations ofgovernance result from the treatment—annexationinto Ha Noi.
44 THE VIETNAM PROVINCIAL COMPETITIVENESS INDEX 2009
Independent Variable Marginal Probability of Location in Me Linh
Equitized Central SOE
Partially State-Owned Enterprise
Formerly Household Business
Listed Enterprise
Owner Used to Be an SOE Manager
Constant
Observations
Pseudo R-Squared
Log Likelihood
ll
Root Mean Squared Error
0.564
(0.438)
-0.264
(0.200)
0.0250
(0.0683)
0
(0)
-0.233**
(0.106)
-21.89*
(11.18)
190
0.148
¬108.5*
-93.34
0.411
Notes: Coefficients represent marginal probabilities of location in Me Linh province as opposed to Vinh Phuc. Table reports marginal probabilitieswith robust standard errors in parentheses. *** p<0.01, ** p<0.05, * p<0.1
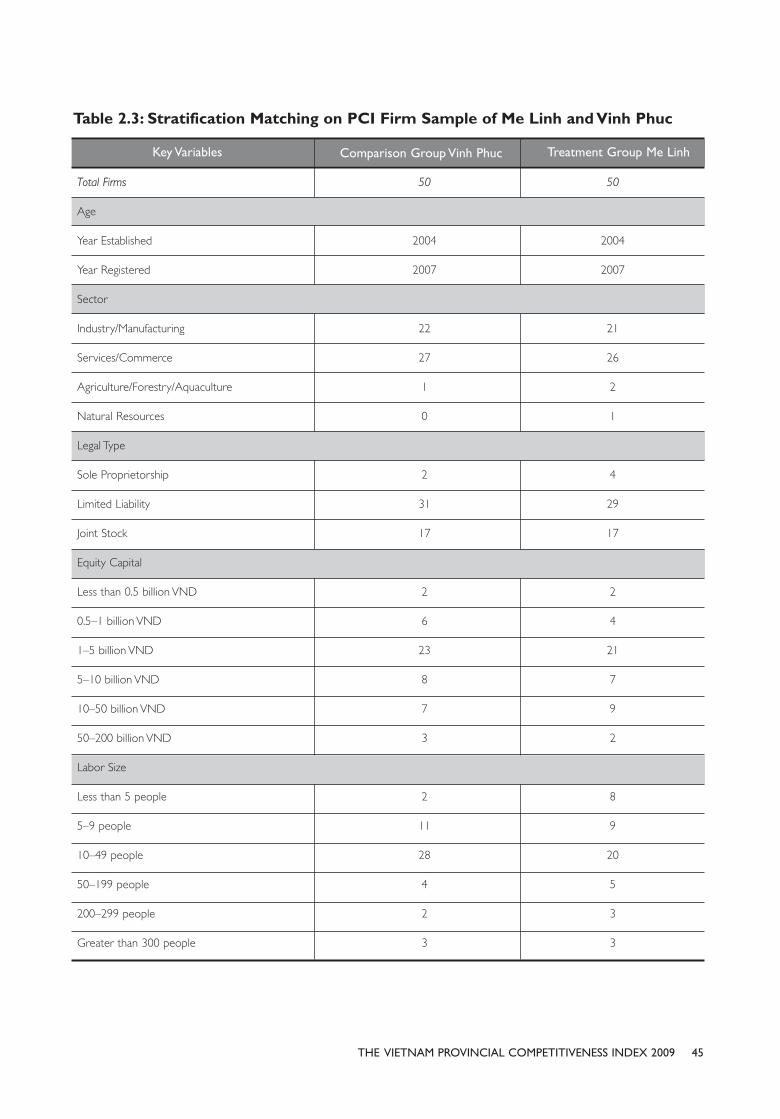
45THE VIETNAM PROVINCIAL COMPETITIVENESS INDEX 2009
Key Variables Treatment Group Me LinhComparison Group Vinh Phuc
Table 2.3: Stratification Matching on PCI Firm Sample of Me Linh and Vinh Phuc
Total Firms
Age
Year Established
Year Registered
Sector
Industry/Manufacturing
Services/Commerce
Agriculture/Forestry/Aquaculture
Natural Resources
Legal Type
Sole Proprietorship
Limited Liability
Joint Stock
Equity Capital
Less than 0.5 billion VND
0.5–1 billion VND
1–5 billion VND
5–10 billion VND
10–50 billion VND
50–200 billion VND
Labor Size
Less than 5 people
5–9 people
10–49 people
50–199 people
200–299 people
Greater than 300 people
50
2004
2007
22
27
1
0
2
31
17
2
6
23
8
7
3
2
11
28
4
2
3
50
2004
2007
21
26
2
1
4
29
17
2
4
21
7
9
2
8
9
20
5
3
3
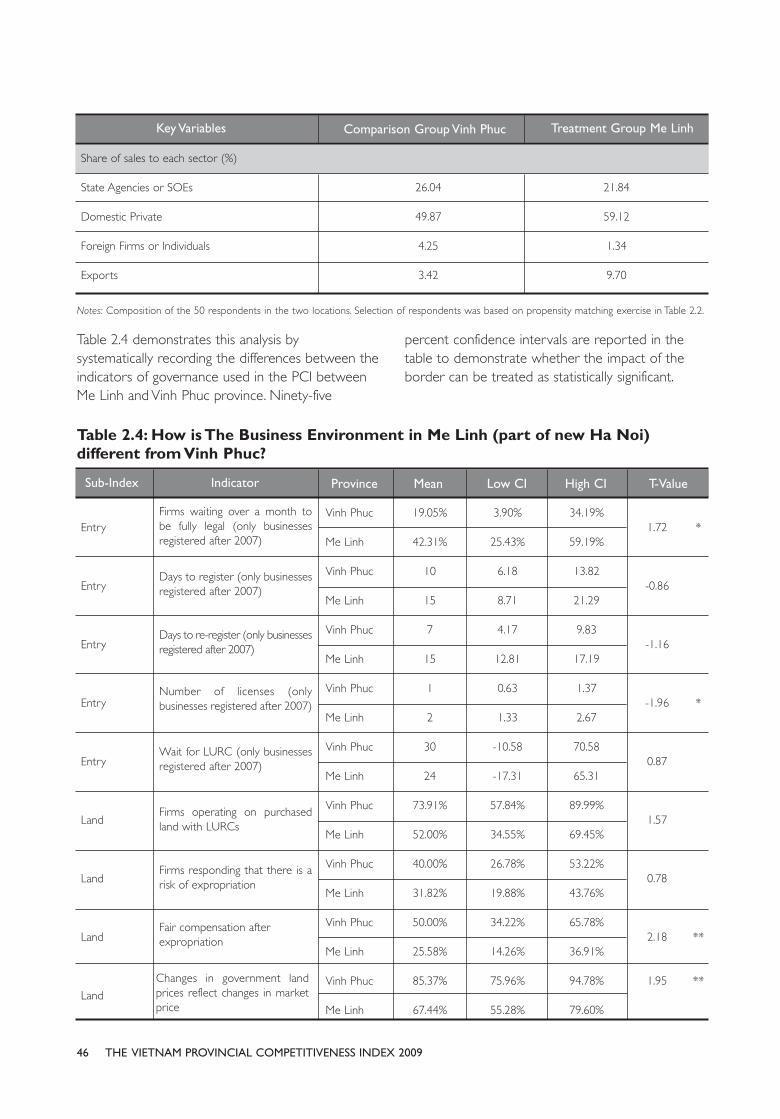
Table 2.4 demonstrates this analysis bysystematically recording the differences between theindicators of governance used in the PCI betweenMe Linh and Vinh Phuc province. Ninety-five
percent confidence intervals are reported in thetable to demonstrate whether the impact of theborder can be treated as statistically significant.
46 THE VIETNAM PROVINCIAL COMPETITIVENESS INDEX 2009
Key Variables Treatment Group Me LinhComparison Group Vinh Phuc
Share of sales to each sector (%)
State Agencies or SOEs
Domestic Private
Foreign Firms or Individuals
Exports
26.04
49.87
4.25
3.42
21.84
59.12
1.34
9.70
Sub-Index Indicator Province Mean Low CI High CI T-Value
Entry
Entry
Entry
Entry
Entry
Land
Land
Land
Land
Firms waiting over a month tobe fully legal (only businessesregistered after 2007)
Days to register (only businessesregistered after 2007)
Days to re-register (only businessesregistered after 2007)
Number of licenses (onlybusinesses registered after 2007)
Wait for LURC (only businessesregistered after 2007)
Firms operating on purchasedland with LURCs
Firms responding that there is arisk of expropriation
Fair compensation afterexpropriation
Vinh Phuc
Me Linh
Vinh Phuc
Me Linh
Vinh Phuc
Me Linh
Vinh Phuc
Me Linh
Vinh Phuc
Me Linh
Vinh Phuc
Me Linh
Vinh Phuc
Me Linh
Vinh Phuc
Me Linh
Vinh Phuc
Me Linh
19.05%
42.31%
10
15
7
15
1
2
30
24
73.91%
52.00%
40.00%
31.82%
50.00%
25.58%
85.37%
67.44%
3.90%
25.43%
6.18
8.71
4.17
12.81
0.63
1.33
-10.58
-17.31
57.84%
34.55%
26.78%
19.88%
34.22%
14.26%
75.96%
55.28%
34.19%
59.19%
13.82
21.29
9.83
17.19
1.37
2.67
70.58
65.31
89.99%
69.45%
53.22%
43.76%
65.78%
36.91%
94.78%
79.60%
1.72
-0.86
-1.16
-1.96
0.87
1.57
0.78
2.18
1.95
*
*
**
**Changes in government landprices reflect changes in marketprice
Notes: Composition of the 50 respondents in the two locations. Selection of respondents was based on propensity matching exercise in Table 2.2.
Table 2.4: How is The Business Environment in Me Linh (part of new Ha Noi)different from Vinh Phuc?
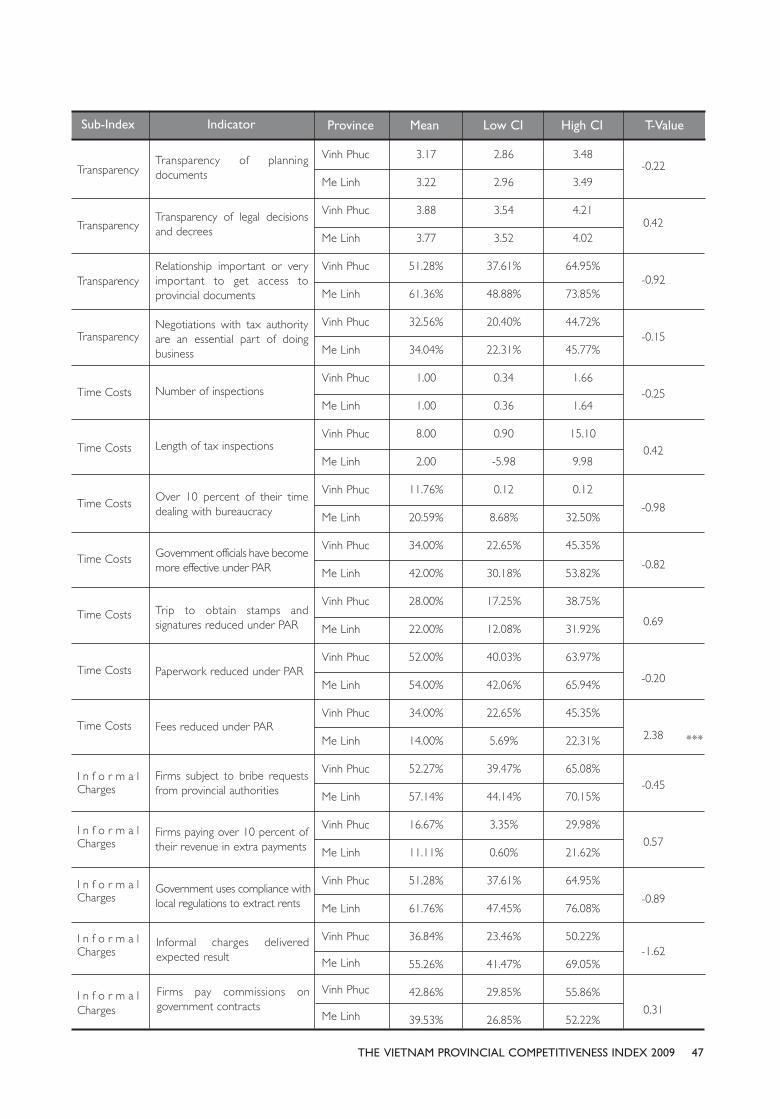
Sub-Index Indicator Province Mean Low CI High CI T-Value
Transparency
Transparency
Transparency
Transparency
Time Costs
Time Costs
Time Costs
Time Costs
Time Costs
Time Costs
Time Costs
I n f o r m a lCharges
I n f o r m a lCharges
I n f o r m a lCharges
I n f o r m a lCharges
I n f o r m a lCharges
Transparency of planningdocuments
Transparency of legal decisionsand decrees
Relationship important or veryimportant to get access toprovincial documents
Negotiations with tax authorityare an essential part of doingbusiness
Number of inspections
Length of tax inspections
Over 10 percent of their timedealing with bureaucracy
Government officials have becomemore effective under PAR
Trip to obtain stamps andsignatures reduced under PAR
Paperwork reduced under PAR
Fees reduced under PAR
Firms subject to bribe requestsfrom provincial authorities
Firms paying over 10 percent oftheir revenue in extra payments
Government uses compliance withlocal regulations to extract rents
Vinh Phuc
Me Linh
Vinh Phuc
Me Linh
Vinh Phuc
Me Linh
Vinh Phuc
Me Linh
Vinh Phuc
Me Linh
Vinh Phuc
Me Linh
Vinh Phuc
Me Linh
Vinh Phuc
Me Linh
Vinh Phuc
Me Linh
Vinh Phuc
Me Linh
Vinh Phuc
Me Linh
Vinh Phuc
Me Linh
Vinh Phuc
Me Linh
Vinh Phuc
Me Linh
Vinh Phuc
Me Linh
Vinh Phuc
Me Linh
3.17
3.22
3.88
3.77
51.28%
61.36%
32.56%
34.04%
1.00
1.00
8.00
2.00
11.76%
20.59%
34.00%
42.00%
28.00%
22.00%
52.00%
54.00%
34.00%
14.00%
52.27%
57.14%
16.67%
11.11%
51.28%
61.76%
36.84%
55.26%
42.86%
39.53%
2.86
2.96
3.54
3.52
37.61%
48.88%
20.40%
22.31%
0.34
0.36
0.90
-5.98
0.12
8.68%
22.65%
30.18%
17.25%
12.08%
40.03%
42.06%
22.65%
5.69%
39.47%
44.14%
3.35%
0.60%
37.61%
47.45%
23.46%
41.47%
29.85%
26.85%
3.48
3.49
4.21
4.02
64.95%
73.85%
44.72%
45.77%
1.66
1.64
15.10
9.98
0.12
32.50%
45.35%
53.82%
38.75%
31.92%
63.97%
65.94%
45.35%
22.31%
65.08%
70.15%
29.98%
21.62%
64.95%
76.08%
50.22%
69.05%
55.86%
52.22%
-0.22
0.42
-0.92
-0.15
-0.25
0.42
-0.98
-0.82
0.69
-0.20
2.38
-0.45
0.57
-0.89
-1.62
0.31
***
Informal charges deliveredexpected result
47THE VIETNAM PROVINCIAL COMPETITIVENESS INDEX 2009
Firms pay commissions ongovernment contracts
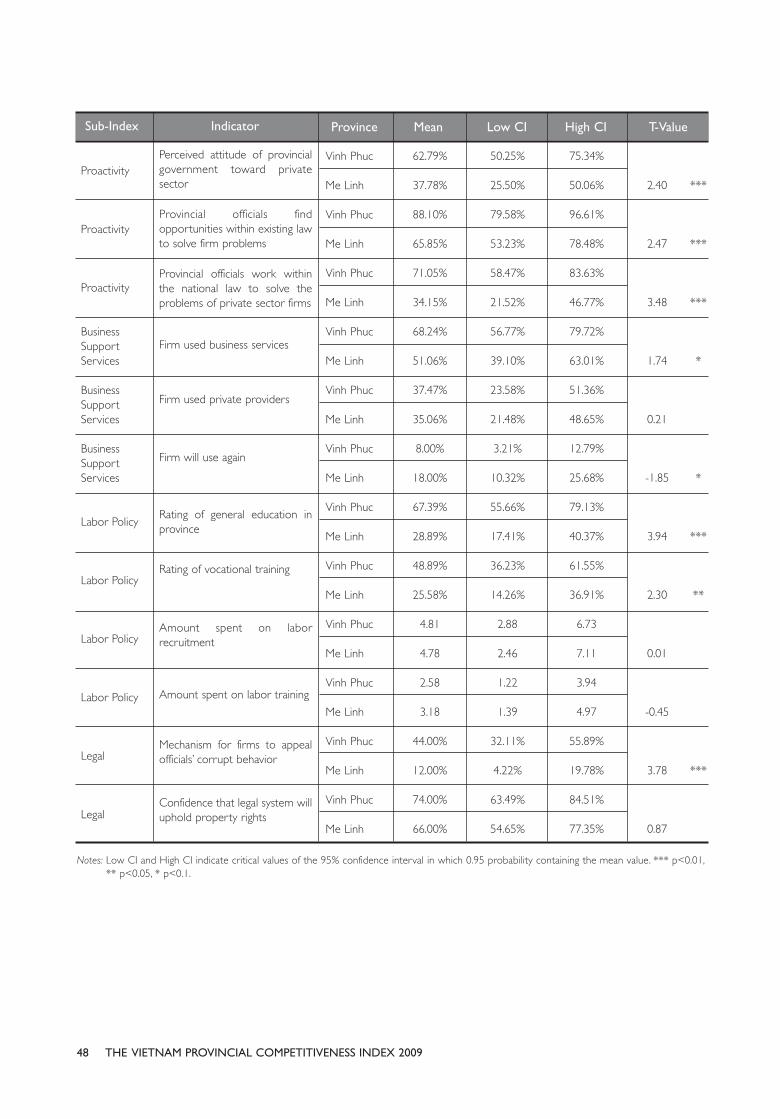
48 THE VIETNAM PROVINCIAL COMPETITIVENESS INDEX 2009
Sub-Index Indicator Province Mean Low CI High CI T-Value
Proactivity
Proactivity
Proactivity
BusinessSupportServices
BusinessSupportServices
BusinessSupportServices
Labor Policy
Labor Policy
Labor Policy
Labor Policy
Legal
Legal
Perceived attitude of provincialgovernment toward privatesector
Provincial officials findopportunities within existing lawto solve firm problems
Provincial officials work withinthe national law to solve theproblems of private sector firms
Firm used business services
Firm used private providers
Firm will use again
Rating of general education inprovince
Rating of vocational training
Amount spent on laborrecruitment
Amount spent on labor training
Mechanism for firms to appealofficials’ corrupt behavior
Confidence that legal system willuphold property rights
Vinh Phuc
Me Linh
Vinh Phuc
Me Linh
Vinh Phuc
Me Linh
Vinh Phuc
Me Linh
Vinh Phuc
Me Linh
Vinh Phuc
Me Linh
Vinh Phuc
Me Linh
Vinh Phuc
Me Linh
Vinh Phuc
Me Linh
Vinh Phuc
Me Linh
Vinh Phuc
Me Linh
Vinh Phuc
Me Linh
62.79%
37.78%
88.10%
65.85%
71.05%
34.15%
68.24%
51.06%
37.47%
35.06%
8.00%
18.00%
67.39%
28.89%
48.89%
25.58%
4.81
4.78
2.58
3.18
44.00%
12.00%
74.00%
66.00%
50.25%
25.50%
79.58%
53.23%
58.47%
21.52%
56.77%
39.10%
23.58%
21.48%
3.21%
10.32%
55.66%
17.41%
36.23%
14.26%
2.88
2.46
1.22
1.39
32.11%
4.22%
63.49%
54.65%
75.34%
50.06%
96.61%
78.48%
83.63%
46.77%
79.72%
63.01%
51.36%
48.65%
12.79%
25.68%
79.13%
40.37%
61.55%
36.91%
6.73
7.11
3.94
4.97
55.89%
19.78%
84.51%
77.35%
2.40
2.47
3.48
1.74
0.21
-1.85
3.94
2.30
0.01
-0.45
3.78
0.87
***
***
***
*
*
***
**
***
Notes: Low CI and High CI indicate critical values of the 95% confidence interval in which 0.95 probability containing the mean value. *** p<0.01,** p<0.05, * p<0.1.

The table reveals that the merger into Me Linhsignificantly affected the quality of governanceexperienced by private businesses in:
• Entry Costs: Firms that registered after theannexation in Me Linh experienced longerwaiting periods and required a greateramount of business documentation. Forty-two percent of businesses in Me Linh waitedover one month to be fully legal, as opposedto 20 percent in Vinh Phuc.
• Land Policy: Firms in Me Linh considered landexpropriation to be a greater risk and weremore concerned that official governmentprices did not reflect changes in the market.
• Time Costs: Businesses in Vinh Phuc weremore likely to respond that official fees forbasic bureaucratic activities have beenreduced (34 percent to 14 percent).
• Proactivity: The differences in proactivity werethe starkest of all indicators. Businesses inVinh Phuc were far more likely to believetheir provincial officials had a positive attitudetoward the private sector (63 percent to 38percent) and were more likely to findcreative ways to assist their business activities(71 percent to 34 percent).
• Labor Policy: Firms in Vinh Phuc providedgreater general assessments of general (67percent to 28 percent) and vocationaleducation (49 percent to 26 percent) intheir province.
• Legal Institutions: Forty-four percent of firmsin Vinh Phuc believed there was a mechanismto appeal the corrupt behavior of officials,while only 12 percent of Me Linh firms wereaware of such a process.
• Business Support Services: This sub-indexprovided the one positive aspect of the HaNoi merger. While firms in Vinh Phuc weremore likely than those in Me Linh to usebusiness support services, firms in Me Linhwere significantly more likely to continueusage, demonstrating that they had morefaith in their quality.
These differences are quite dramatic and occurredimmediately after the merger. The PCI survey wasadministered only a year after the merger wascompleted. Nevertheless, because these analysescompare matched groups of firms, we can feel quiteconfident about the results. The bottom line is thatthe merger into Ha Noi had a significantly negativeeffect on the quality of governance experienced bybusiness operations in Me Linh. These results hint atserious concerns to which government officialsshould pay attention.
The economic impact ofexogenous governance changeSo governance differs dramatically between thetwo provinces, but does it matter? To test thisquestion, we once again use our matched sampleof 50 firms in Vietnamese provinces. We study thedifferences between the provinces on fourdependent variables of interest: 1) the percentageof firms that were profitable in 2009; 2) thepercentage of firms that increased investment intheir business in 2009; 3) the net number ofemployees hired or fired by businesses in 2009;and 4) the percentage of businesses that plan toincrease operations over the next two years.
Figure 2.2 displays the average results among the 50firms in each province along with the 95 percentconfidence intervals around those averages. Theresults show that firms in Vinh Phuc were marginallymore profitable, while firms in Me Linh increasedemployment by a larger margin. Nevertheless, theconfidence intervals indicate that these differencesare statistically indistinguishable. In short, there is nodifference in performance among operations in thetwo locations.
Thus, while the merger dramatically increasedgovernance between the two locations, it has yet toaffect individual business performance. A number ofexplanations are possible for this fascinating result.
First, it may simply be too early to judge businessperformance. The merger took place only a yearbefore the survey, and firms have yet to adjust to
49THE VIETNAM PROVINCIAL COMPETITIVENESS INDEX 2009

50 THE VIETNAM PROVINCIAL COMPETITIVENESS INDEX 2009
the new environment. If this is the case, it will beimportant to watch developments in the twolocations over the next few years. Believing, as wedo, that governance has an important influence, ourprediction is that business performance should alsostart to diverge over time, but is simply lagging theinitial shock to governance quality.
A second hypothesis is that the negative impact ofgovernance on firms in Me Linh was mediated bythe increasing opportunities brought by inclusion inthe capital. Although the infrastructure and location
ConclusionThe full economic impact of the Ha Noi expansionhas yet to be determined. At this time, firmperformance has not been dramatically affected bythe changes. On the other hand, there is reason forconcern. Firms in Me Linh are significantly more
negative about governance than their counterpartsin Vinh Phuc. If governance matters for economicperformance, and we certainly have shown that itdoes in annual PCI analyses, there is reason toworry that the merger may have negative long-termimplications for Me Linh businesses.
of the businesses remain the same, the firms nowhave easier access to the vast potential of the HaNoi market. They no longer need to pay the extracosts of shipping products across provincial borders.In addition, firms may be anticipating improvementsin infrastructure as Ha Noi follows through on itsmandate to develop an international capital.Because they sit on the main airport road andacross from a massive trade center, businesses inMe Linh may believe that they will be the primarybeneficiaries of such expenditures.
Figure 2.2: Relative Business Performance of Matched Enterprises
Notes: Bars represent 95% confidence intervals; Symbols represent mean scores for each location.

CHAPTER THREE
CHANGES IN THE PCIMETHODOLOGY

53THE VIETNAM PROVINCIAL COMPETITIVENESS INDEX 2009
CHANGES IN THE PCIMETHODOLOGYSince the original PCI report in 2005, we haverepeatedly emphasized that the indicators, sub-indices, and weighting of the index would eventuallyneed to change to reflect reforms and newchallenges in the Vietnamese economy. Unlike well-known indices of economic governance-such as theGlobal Competitiveness Index or TransparencyInternational’s Corruption Perceptions Index-thatoperate at some level of abstraction, the PCI wasdesigned with the explicit intention of providingactionable policy advice to provincial officials; ittherefore provides very detailed and explicitmeasures. From the outset, we expected that arecalibration would be necessary every five years tocatch the index up with changes in the Vietnameseeconomy. We fulfill that commitment in this year’siteration of the report.
Recalibrating the index also gave us the opportunityto improve the tool based on advice from ourstakeholders. Each year, the PCI research team visitsdozens of provinces to present tailored PCI resultsto provincial leaders and engage in dialogue aboutthe reform challenges faced by officials on thefrontline of policy implementation. Theseconversations have offered insights into theshortcomings of particular PCI indicators. We havealso benefitted from the diligent advice of ouradvisory board of top Vietnamese researchers,policy advocates, and business leaders, who critiquethe index and offer insights based on their expertiseand experiences. While the advice we garnered
from these sessions was invaluable, our focus onproviding comparable measures over time limitedour ability to fully implement their suggestions. Wecould tweak the measures at the margins, butfundamental alterations in methodology threatenedover-time comparisons.
Because this is the fifth iteration of the PCI since itsdebut in 2005, we decided it was time toimplement these broad changes. Changes fell intothree broad categories. First and most importantly,we dropped a sub-index, the measure of biastoward the local state-owned sector. Second, wealtered the mix of indicators within individual sub-indices—dropping obviated measures, adding newindicators, and, in a very few cases, changing codingin indicators to enhance the comprehension ofpolicy makers. Third, we recalibrated the sub-indexweights so that the final ranking accounted for thenew indicators but also changes in the challengesfaced by Vietnamese private entrepreneurs.
The first thing to note is that even after thesechanges, sub-indices in 2009 are still stronglycorrelated with sub-indices from previous years(see Table 3.1). Thus, while we have refined ourmeasurement, we can be confident that we are stilltapping into the same underlying governanceconcepts that we studied in previous years.Provinces that excelled in transparency in previousyears once again rank highly on that aspect ofgovernance today.

54 THE VIETNAM PROVINCIAL COMPETITIVENESS INDEX 2009
Fina
l Wei
ghte
dPr
ovin
cial
Com
petit
ive-
ness
Inde
x
Unw
eigh
ted
Tota
l Ind
ex
Entr
y C
osts
Land
Acc
ess
and
Secu
rity
of
Tenu
re
Min
Med
ian
Max
Cor
rela
tion
w/
Prev
ious
Year
Min
Med
ian
Max
Cor
rela
tion
w/
Prev
ious
Yea
r
Min
Med
ian
Max
Cor
rela
tion
w/
Prev
ious
Yea
r
Min
Med
ian
Max
Cor
rela
tion
w/
Prev
ious
Yea
r
36.0
7
52.4
1
77.6
1
NA
42.5
1
55.2
3
74.8
7
NA
4.96 7.4
9.17 NA
3.84 6
7.98 NA
Lai C
hau
Lam
Don
g/Th
ai N
guye
n
Binh
Duo
ng
Lai C
hau
Hoa
Bin
h/La
m D
ong
Binh
Duo
ng
Binh
Phu
oc
Ha T
inh/
BRVT
Da
Nan
g
Lai C
hau
Qua
ng N
gai/B
ac K
an
Soc T
rang
37.9
6
55.5
6
77.2
0.85
*
43.9
3
58.4
9
76.0
2
0.82
*
6.23
7.87
9.49
0.33
*
4.32
6.27
7.71
0.68
*
Dak
Non
g
Bac
Gian
g/Ph
u Th
o
Binh
Duo
ng
Dak
Non
g
Thai
Binh
/Ha
Gian
g
Binh
Duo
ng
Hau
Gian
g
Hai
Duo
ng/L
am D
ong
Qua
ng T
ri
Ha
Noi
Lao
Cai/
Thai
Ngu
yen
Long
An
36.3
9
53.1
7
72.1
8
0.90
*
45.2
9
58.1
7
72.8
7
0.88
*
6.31
8.25
9.36
0.25
*
4.73
6.68
8.05
0.73
*
Die
n Bi
en
Dak
Lak
/Bin
h Ph
uoc
Da
Nan
g
Die
n Bi
en
Phu
Tho/
Kien
Gian
g
Binh
Duo
ng
Bac
Gian
g
Nam
Din
h/Kh
anh
Hoa
Da
Nan
g
Ha
Noi
Than
h H
oa/H
oa B
inh
Don
g Tha
p
45.4
3
58.3
1
75.9
5
0.84
*
41.6
4
52.9
6
65.9
3
0.83
*
6.53
8.35
9.52
0.19
4.28
6.45
8.84
0.55
*
Cao
Ban
g
Nin
h Bi
nh
Da
Nan
g
Cao
Ban
g
Than
h H
oa
Da
Nan
g
Hoa
Bin
h
Ha
Noi
Da
Nan
g
Bac
Kan
Bac
Nin
h
Tien
Gian
g
Inde
xM
easu
re20
0620
0720
0820
09
Scor
ePr
ovin
ceSc
ore
Prov
ince
Scor
ePr
ovin
ceSc
ore
Prov
ince
Tabl
e 3.
1: S
core
s an
d C
orre
latio
n of
PC
I Sub
-Indi
ces
Ove
r Tim
e (2
006–
2009
)

55THE VIETNAM PROVINCIAL COMPETITIVENESS INDEX 2009
Tran
spar
ency
Tim
e C
osts
of
Reg
ulat
ory
Com
plia
nce
Info
rmal
Cha
rges
Proa
ctiv
ity
Min
Med
ian
Max
Cor
rela
tion
w/
Prev
ious
Year
Min
Med
ian
Max
Cor
rela
tion
w/
Prev
ious
Yea
r
Min
Med
ian
Max
Cor
rela
tion
w/
Prev
ious
Yea
r
Min
Med
ian
Max
Cor
rela
tion
w/
Prev
ious
Yea
r
2.15
5.43 8.5
NA
2.64
4.42
7.12 NA
5.05
6.33
8.35
1.54
4.83 10 NA
Dak
Non
g
TT-H
ue/B
RVT
Binh
Duo
ng
Phu
Yen
Qua
ng N
gai/K
ien
Gian
g
Binh
Duo
ng
Ha T
inh
Bac
Kan/
Bac
Lieu
Ben
Tre
Qua
ng N
gai
Tuye
n Q
uang
/Tha
i Bin
h
Binh
Duo
ng
2.24
5.83
8.56
0.6*
2.99
6.21
8.18
0.36
*
5.35
6.58
7.71
0.33
*
2.3
4.95 9.2
0.79
*
Dak
Non
g
Ha T
inh/
Phu
Tho
Lao
Cai
Lai C
hau
Vinh
Lon
g/Ph
u Th
o
Ha T
ay
Ha
Noi
An
Gian
g/H
a G
iang
Hun
g Yen
Cao
Ban
g
Phu
Tho/
Thai
Binh
Binh
Duo
ng
2.99
6.32
7.92
0.74
*
2.85
5.38
6.52
0.62
*
5.7
6.65 8.3
0.50
*
2.32
5.56
8.45
0.78
*
Dak
Non
g
Hai
Phon
g/D
ak L
ak
Da
Nan
g
Die
n Bi
en
Tuye
n Q
uang
/TT-
Hue
Binh
Phu
oc
Bac
Kan
Nin
h Th
uan/
An
Gian
g
Hun
g Yen
Bac
Kan
Lai C
hau/
Phu
Tho
Binh
Duo
ng
2.92
5.29
8.85
0.48
*
3.68
6.49
8.93
0.48
*
4.63
6.02
8.15
0.44
*
1.87
4.91
9.39
0.74
*
Dak
Non
g
Kon
Tum
Lao
Cai
Kon
Tum
An
Gian
g
Nin
h Bi
nh
Ngh
e A
n
Kon
Tum
Ben
Tre
Cao
Ban
g
Don
g N
ai
Binh
Duo
ng
Inde
xM
easu
re20
0620
0720
0820
09
Scor
ePr
ovin
ceSc
ore
Prov
ince
Scor
ePr
ovin
ceSc
ore
Prov
ince

56 THE VIETNAM PROVINCIAL COMPETITIVENESS INDEX 2009
Busi
ness
Sup
ort
Serv
ices
(Pri
vate
Sec
tor
Dev
elop
men
tPo
licie
s)
Labo
r Po
licie
s
Lega
l Ins
titut
ions
Infr
astr
uctu
re(n
o po
rts
orai
rpor
ts)
Min
Med
ian
Max
Cor
rela
tion
w/
Prev
ious
Year
Min
Med
ian
Max
Cor
rela
tion
w/
Prev
ious
Yea
r
Min
Med
ian
Max
Cor
rela
tion
w/
Prev
ious
Yea
r
Min
Med
ian
Max
Cor
rela
tion
w/
Prev
ious
Yea
r
2.4
4.88
9.62 NA
1.99 5.1
9.6
NA
2.13
3.63
6.55
Dak
Non
g
Ha
Gian
g/Ki
en G
iang
Da
Nan
g
Lai C
hau
Lang
Son
/Qua
ng N
am
Da
Nan
g
Qua
ng N
gai
Son
La/N
inh
Binh
Bac
Gian
g
2.26
4.71
8.73
0.79
*
1.92
5.02
8.34
0.81
*
2.24
4.33
6.56
0.37
*
Bac
Lieu
Ben
Tre/
Tuye
n Q
uang
HC
MC
Lai C
hau
Qua
ng N
am/Q
uang
Nga
i
Da
Nan
g
Ha T
inh
Phu
Tho/
Vinh
Phu
c
Bac
Kan
1.4
3.35
6.35
0.86
*
1.84
4.25 8.4
0.85
*
2.5
4.66 6.7
0.33
*
2.92 5.5
7.75 NA
Bac
Lieu
Nam
Din
h/Tu
yen
Qua
ng
HC
MC
Die
n Bi
en
Thai
Binh
/Bac
Kan
Da
Nan
g
Cao
Ban
g
Son
La/H
ai D
uong
Gia
Lai
Son
La
Lam
Don
g
Binh
Duo
ng
2.84
5.20
8.55
0.17
2.82
4.83
7.69
0.65
*
3.51
5.35
7.34
0.45
*
3.35
4.95
8.26
0.74
*
Tra V
inh
Lam
Don
g
HC
MC
Lai C
hau
Dak
Non
g
Da
Nan
g
Bac
Kan
Long
An
BRVT
Bac
Kan
Don
g Tha
p
Binh
Duo
ng
Inde
xM
easu
re20
0620
0720
0820
09
Scor
ePr
ovin
ceSc
ore
Prov
ince
Scor
ePr
ovin
ceSc
ore
Prov
ince
Not
es: *
Sig
nific
ant
at 5
% le
vel;
NA
= n
ot a
pplic
able
. All
valu
es a
re a
t th
e pr
ovin
cial
leve
l. D
ata
incl
ude
only
firm
s re
gist
ered
with
in t
wo
cale
ndar
yea
rs p
rece
ding
the
sur
vey.
2005
dat
a on
lyin
clud
e 42
pro
vinc
es a
nd d
o no
t in
clud
e th
e fu
ll se
t of
indi
cato
rs u
sed
in s
ubse
quen
t ye
ars,
refle
ctin
g ch
ange
s in
sur
vey
ques
tions
and
ord
erin
g in
200
6.
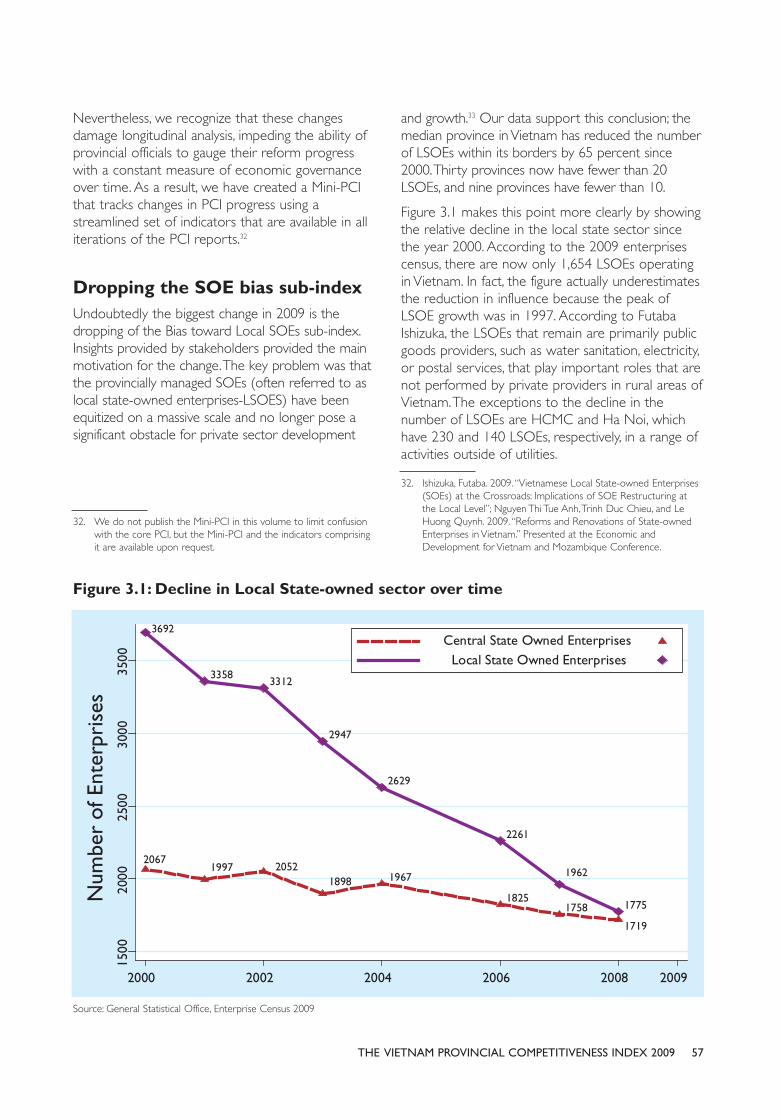
Nevertheless, we recognize that these changesdamage longitudinal analysis, impeding the ability ofprovincial officials to gauge their reform progresswith a constant measure of economic governanceover time. As a result, we have created a Mini-PCIthat tracks changes in PCI progress using astreamlined set of indicators that are available in alliterations of the PCI reports.32
Dropping the SOE bias sub-indexUndoubtedly the biggest change in 2009 is thedropping of the Bias toward Local SOEs sub-index.Insights provided by stakeholders provided the mainmotivation for the change. The key problem was thatthe provincially managed SOEs (often referred to aslocal state-owned enterprises-LSOES) have beenequitized on a massive scale and no longer pose asignificant obstacle for private sector development
and growth.33 Our data support this conclusion; themedian province in Vietnam has reduced the numberof LSOEs within its borders by 65 percent since2000. Thirty provinces now have fewer than 20LSOEs, and nine provinces have fewer than 10.
Figure 3.1 makes this point more clearly by showingthe relative decline in the local state sector sincethe year 2000. According to the 2009 enterprisescensus, there are now only 1,654 LSOEs operatingin Vietnam. In fact, the figure actually underestimatesthe reduction in influence because the peak ofLSOE growth was in 1997. According to FutabaIshizuka, the LSOEs that remain are primarily publicgoods providers, such as water sanitation, electricity,or postal services, that play important roles that arenot performed by private providers in rural areas ofVietnam. The exceptions to the decline in thenumber of LSOEs are HCMC and Ha Noi, whichhave 230 and 140 LSOEs, respectively, in a range ofactivities outside of utilities.
57THE VIETNAM PROVINCIAL COMPETITIVENESS INDEX 2009
32. We do not publish the Mini-PCI in this volume to limit confusionwith the core PCI, but the Mini-PCI and the indicators comprisingit are available upon request.
32. Ishizuka, Futaba. 2009. “Vietnamese Local State-owned Enterprises(SOEs) at the Crossroads: Implications of SOE Restructuring atthe Local Level”; Nguyen Thi Tue Anh, Trinh Duc Chieu, and LeHuong Quynh. 2009. “Reforms and Renovations of State-ownedEnterprises in Vietnam.” Presented at the Economic andDevelopment for Vietnam and Mozambique Conference.
Figure 3.1: Decline in Local State-owned sector over time
Source: General Statistical Office, Enterprise Census 2009
Before the most recent equitization campaign, whenLSOEs were highly active in provinces, the bias theyreceived was obvious and tangible to small-scaleprivate entrepreneurs. Often, LSOEs competeddirectly against private companies in both themanufacturing and service sectors. Most of thetime, the competition took place outside of thecore competency of the LSOE. For instance, aprovincially managed state mining company mayhave used its monopoly position to cross-subsidizeother business ventures in hotels, supermarkets, orsmall-scale manufacturing where the private sectorwas most active. This competition was heavily tiltedin favor of LSOEs because of their favored access toland, credit, labor, and implicit credit guarantees. As aresult, the private sector was crowded out of keyeconomic sectors by state companies operatingwith soft budget constraints. In other cases, privatefirms were not competing directly against LSOEs ina particular product line, but instead felt that theywere disadvantaged in terms of competition forcritical factors of production (land, labor, capital).
When the PCI survey asked respondents about biastoward the state sector, these were the types ofincidents they recalled. We could feel certain thattheir responses were highly accurate because theyexperienced the biases directly and could recounthow such biases injured their own businesses. As theeconomic activities of LSOEs have declined, firmshave much less experiential basis for their answers.
This is not to say that Vietnam in general, andspecific Vietnamese provinces in particular, do notface problems with biases toward the state sector.The real problem, however, lies with branches ofcentrally managed state-owned enterprises(CSOEs), particularly the large state conglomerates(Tap Doan) such as Petro Vietnam or Vinashin.34
Figure 3.2 explores this phenomenon by mappingout the relative share of total business employment,assets and revenue accounted for by LSOEs and
CSOEs over time in the GSO’s Enterprise Census.The local state sector now accounts for about 6percent of total revenue produced, 6 percent oftotal fixed assets, and 5 percent of employmentamong business operations in Vietnamese provinces.By contrast, CSOEs have always been moreimportant economically and continue to account for17 percent of employment among all firms, 25percent of revenue, and over 40 percent of totalfixed assets. Moreover, CSOEs remain advantaged interms of their access to state financing, accountingfor 46 percent of all liabilities held by enterprises inthe census. According to the census data, theseliabilities were even higher in 2007, which somehave noted as a potential factor in Vietnam’sfinancial crisis in the spring of 2008.
Thus, it is clear that the CSOEs do play a prominentrole in the economy and appear to receive benefitsunavailable to other business types. In fact, this isprobably the most important political-economicissue facing Vietnam today. CSOEs are enormouslypowerful economically; they contribute greatly toemployment, investment, and national welfare; andyet their presence potentially distorts theVietnamese economy.
The key question for the PCI research team waswhether a firm-level survey is the appropriate tool foranalyzing this problem. First, many of the decisionsabout the future investment locations for CSOEs, theland and the special investment incentives they receive,and the non-economic social goals of a CSOE projecttake place among central SOE managers and,sometimes, high-ranking policy makers. In many cases,provincial officials are not involved in these discussionsdirectly. Although there have been cases of provincialofficials lobbying for greater state investment, it is notclear that private firms have very much informationabout these interactions. Their answers on surveys arehighly speculative, based on hearsay and rumor, but inmost cases they do not have direct experientialobservations of the biases. Second, private companiesrarely compete directly against the CSOEs, which areoften ensconced in protected monopolies.Competition for land, labor, and capital is more likely,but, once again, it is not clear that private firmsunderstand the full-scope of the biases, especially whenCSOEs are able to access credit from state bankslocated outside the province.
58 THE VIETNAM PROVINCIAL COMPETITIVENESS INDEX 2009
34. Pincus, Jonathan, and Vu Thanh Tu Anh. 2008. “Vietnam Feels the
Heat.” Far Eastern Economic Review 171.4: 28–34; UÃy Ban
Thûoâng Vuå Quöëc Höåi (Standing Committee of the National
Assembly). 2009. “Baáo Caáo Toám Tùæt Kïët Quaã Giaám Saát Viïåc Thûåc
Hiïån Chñnh Saách, Phaáp Luêåt Vïì Quaãn Lyá, Sûã Duång Vöën, Taâi Saãn
Nhaâ Nûúãc Taåi Caác Têåp Àoaân, Töíng Cöng Ty Nhaâ Nûúác”
[Summary Report on Surveillance of the Performance of State
Assets and Capital in the Management of Conglomerates and
General State Corporations], November 14.

Analysis of the results of the PCI survey each yearshows that private sector assessments of SOE biaswere becoming noisier over time. Within-provincevariation was growing dramatically as opinions ofbias differed wildly within the same investmentlocations. This high variance around averageprovincial scores can be problematic for an indexingapproach such as the PCI, because it becomesdifficult to observe statistically significant differencesamong provinces.
Therefore, we decided that although bias to CSOEsis still an important issue for policy makers, the PCIis not the proper tool for measuring it. We decidedto drop the sub-index measuring bias toward thestate sector. As with infrastructure and otherstructural endowments, it is important that theindex focus on factors that provincial officials havethe ability to influence
We experimented with replacements, such as anindex measuring balance in the competitive playingfield. After all, private firms are just as likely to
complain about provincial officials biasing land,capital, and procurement in favor of foreign firms,equitized firms with deep relationships in theprovincial government, or simply large privatecompanies that are considered to be localchampions. The problem was that this index unfairlypunished firms with large foreign sectors and largeprivate companies. In many small, rural provinces,such as Dien Bien and Lai Chau, perceived bias tothe foreign sector is very low. But this lack of bias isan artifact of the lack of foreign direct investment inthese provinces; it says little about fairness. In theperceptions data, firms honestly report that theyexperience no bias, because they do not see anyevidence of it. Sixty-five percent of businesses in LaiChau report that there is no bias toward foreigncompanies, compared to 38 percent in Hai Duongand 33 percent in Hung Yen, both of which havesizable foreign invested sectors.
In the end, we decided that a PCI with only ninesub-indices was superior to 10, when the tenthindex offered potentially misleading policy advice.
59THE VIETNAM PROVINCIAL COMPETITIVENESS INDEX 2009
Figure 3.2: Comparative Importance of Local and Central State owned sectors
Source: Enterprise Census 2008.
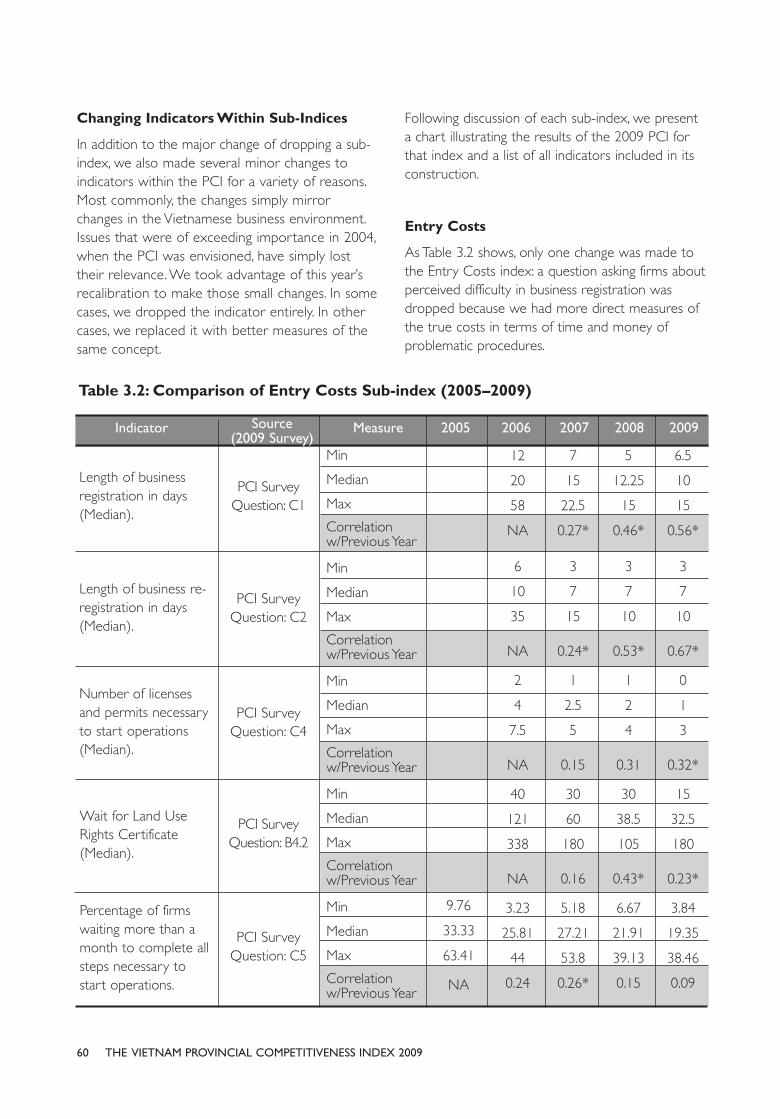
60 THE VIETNAM PROVINCIAL COMPETITIVENESS INDEX 2009
Changing Indicators Within Sub-Indices
In addition to the major change of dropping a sub-index, we also made several minor changes toindicators within the PCI for a variety of reasons.Most commonly, the changes simply mirrorchanges in the Vietnamese business environment.Issues that were of exceeding importance in 2004,when the PCI was envisioned, have simply losttheir relevance. We took advantage of this year’srecalibration to make those small changes. In somecases, we dropped the indicator entirely. In othercases, we replaced it with better measures of thesame concept.
Following discussion of each sub-index, we presenta chart illustrating the results of the 2009 PCI forthat index and a list of all indicators included in itsconstruction.
Entry Costs
As Table 3.2 shows, only one change was made tothe Entry Costs index: a question asking firms aboutperceived difficulty in business registration wasdropped because we had more direct measures ofthe true costs in terms of time and money ofproblematic procedures.
PCI SurveyQuestion: C1
PCI SurveyQuestion: C2
PCI SurveyQuestion: C4
PCI SurveyQuestion: C5
Min
Median
Max
Correlationw/Previous Year
Min
Median
Max
Correlationw/Previous Year
Min
Median
Max
Correlationw/Previous Year
Min
Median
Max
Correlationw/Previous Year
Min
Median
Max
Correlationw/Previous Year
12
20
58
NA
6
10
35
NA
2
4
7.5
NA
40
121
338
NA
3.23
25.81
44
0.24
9.76
33.33
63.41
NA
7
15
22.5
0.27*
3
7
15
0.24*
1
2.5
5
0.15
30
60
180
0.16
5.18
27.21
53.8
0.26*
5
12.25
15
0.46*
3
7
10
0.53*
1
2
4
0.31
30
38.5
105
0.43*
6.67
21.91
39.13
0.15
6.5
10
15
0.56*
3
7
10
0.67*
0
1
3
0.32*
15
32.5
180
0.23*
3.84
19.35
38.46
0.09
Indicator Source (2009 Survey)
Measure 20062005 2007 2008 2009
Length of businessregistration in days(Median).
Length of business re-registration in days(Median).
Number of licensesand permits necessaryto start operations(Median).
Percentage of firmswaiting more than amonth to complete allsteps necessary tostart operations.
PCI SurveyQuestion: B4.2
Wait for Land UseRights Certificate(Median).
Table 3.2: Comparison of Entry Costs Sub-index (2005–2009)
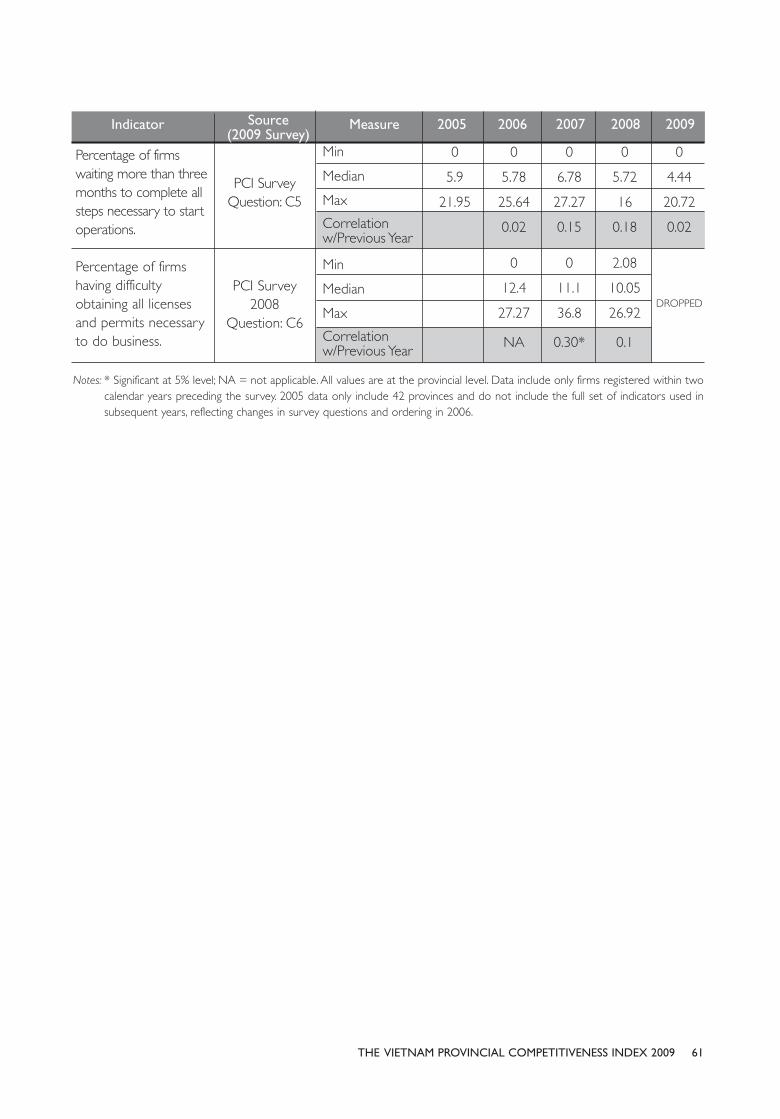
61THE VIETNAM PROVINCIAL COMPETITIVENESS INDEX 2009
PCI SurveyQuestion: C5
PCI Survey2008
Question: C6
Min
Median
Max
Correlationw/Previous Year
Min
Median
Max
Correlationw/Previous Year
0
5.78
25.64
0.02
0
12.4
27.27
NA
0
5.9
21.95
0
6.78
27.27
0.15
0
11.1
36.8
0.30*
0
5.72
16
0.18
2.08
10.05
26.92
0.1
0
4.44
20.72
0.02
DROPPED
Indicator Source (2009 Survey)
Measure 20062005 2007 2008 2009
Percentage of firmswaiting more than threemonths to complete allsteps necessary to startoperations.
Percentage of firmshaving difficultyobtaining all licensesand permits necessaryto do business.
Notes: * Significant at 5% level; NA = not applicable. All values are at the provincial level. Data include only firms registered within twocalendar years preceding the survey. 2005 data only include 42 provinces and do not include the full set of indicators used insubsequent years, reflecting changes in survey questions and ordering in 2006.

62 THE VIETNAM PROVINCIAL COMPETITIVENESS INDEX 2009
Figure 3.3: Entry Costs Sub-index 2009
Notes: Original Indicators are those used in the original 2005 survey; New Indicators are those first used in 2006. Both dimensions account for50% of the final index.

63THE VIETNAM PROVINCIAL COMPETITIVENESS INDEX 2009
Land access and security of tenure
The Land sub-index was updated to reflect the
current issues with business premises in the
Vietnamese economy. Issues with security of leasing
contracts are still important, but do not fairly
reflect provincial governance anymore. Provincial
agencies and LSOEs are much less likely to be
involved in leasing space to private businesses. If
disputes over land rental do arise, the involved
parties are most likely to be private individuals. In
some cases, one of the disputants may be a
government official, but s/he is renting land in a
private capacity and not as part of an official
responsibility. Although dispute adjudication over
business contracts is still a major issue, especially
when one of the parties is a government official,
these problems should more properly be
considered under the Legal Institutions sub-index.
We also substituted some more general measures
of land access for a series of specific questions
about the current problems faced by businesses
with regard to business premises. These questions
reflect issues that were not considered important
five years ago. The new questions asked firms to
reflect on a battery of potential land problems in
their province, asking if they had experienced any of
them in their attempts to acquire or expand
business premises. These problems included 1)
unreasonable land-use planning, 2) lack of clean land
reserve, 3) high prices of land, 4) slow land
clearance, and 5) complicated land acquisition
procedures. We took share of firms that
experienced no problems at all as a new indicator.
In addition, we created an indicator gauging whether
government prices for land compensation
accurately reflected changes in the market prices. A
number of firms mentioned that they had suffered
damage when they received compensation for land
that was far below what they could have received
for the property on the private market. Others
mentioned that they slowed business expansion as
they waited for government prices to catch up with
the market. Overall, the general impression of survey
respondents was more positive than the above
anecdotes revealed. Seventy percent of respondents in
the median province believe that government prices
accurately reflect market prices in their locations.
Businesses in Cao Bang (53 percent), Can Tho (56
percent), and Khanh Hoa (58 percent) were more
concerned than other provinces.
PCI SurveyQuestion: B4
Ministry ofNatural
Resources andthe
EnvironmentDatasets†
Min
Median
Max
Correlationw/Previous Year
Min
Median
Max
Correlationw/Previous Year
23.29
55.28
77.78
11.3
69.2
96.5
51.35
75.57
92.45
0.76*
13.28
63.13
97.46
0.85*
38.36
81.16
94.74
0.70*
19.52
77.56
98.75
0.78*
46.82
73.68
94.51
0.77*
23.52
77.89
98.56
0.87*
Indicator Source (2009 Survey)
Measure 20062005 2007 2008 2009
Percentage of firms inpossession of a LURC.
Total land in provincewith official LURCs.
Table 3.3: Comparison of Land Access and Tenure Security Sub-index (2005–2009)
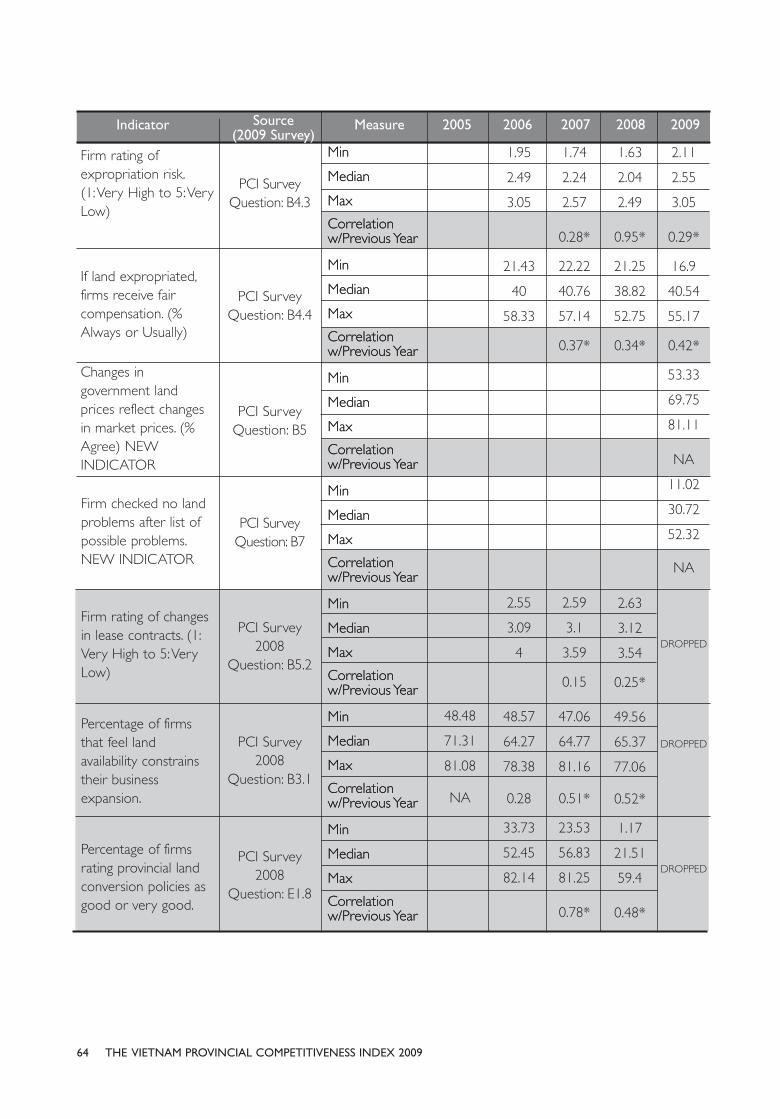
64 THE VIETNAM PROVINCIAL COMPETITIVENESS INDEX 2009
PCI SurveyQuestion: B4.3
PCI SurveyQuestion: B4.4
PCI SurveyQuestion: B5
PCI Survey2008
Question: B5.2
PCI Survey2008
Question: B3.1
PCI Survey2008
Question: E1.8
Min
Median
Max
Correlationw/Previous Year
Min
Median
Max
Correlationw/Previous Year
Min
Median
Max
Correlationw/Previous Year
Min
Median
Max
Correlationw/Previous Year
Min
Median
Max
Correlationw/Previous Year
Min
Median
Max
Correlationw/Previous Year
Min
Median
Max
Correlationw/Previous Year
Min
Median
Max
Correlationw/Previous Year
Min
Median
Max
Correlationw/Previous Year
Min
Median
Max
Correlationw/Previous Year
Min
Median
Max
Correlationw/Previous Year
Min
Median
Max
Correlationw/Previous Year
Min
Median
Max
Correlationw/Previous Year
Min
Median
Max
Correlationw/Previous Year
1.95
2.49
3.05
21.43
40
58.33
2.55
3.09
4
48.57
64.27
78.38
0.28
33.73
52.45
82.14
48.48
71.31
81.08
NA
1.74
2.24
2.57
0.28*
22.22
40.76
57.14
0.37*
2.59
3.1
3.59
0.15
47.06
64.77
81.16
0.51*
23.53
56.83
81.25
0.78*
1.63
2.04
2.49
0.95*
21.25
38.82
52.75
0.34*
2.63
3.12
3.54
0.25*
49.56
65.37
77.06
0.52*
1.17
21.51
59.4
0.48*
2.11
2.55
3.05
0.29*
16.9
40.54
55.17
0.42*
53.33
69.75
81.11
NA
11.02
30.72
52.32
NA
DROPPED
DROPPED
DROPPED
Indicator Source (2009 Survey)
Measure 20062005 2007 2008 2009
Firm rating ofexpropriation risk. (1: Very High to 5: VeryLow)
If land expropriated,firms receive faircompensation. (%Always or Usually)
Changes ingovernment landprices reflect changesin market prices. (%Agree) NEWINDICATOR
Firm rating of changesin lease contracts. (1:Very High to 5: VeryLow)
Percentage of firmsthat feel landavailability constrainstheir businessexpansion.
Percentage of firmsrating provincial landconversion policies asgood or very good.
PCI SurveyQuestion: B7
Firm checked no landproblems after list ofpossible problems.NEW INDICATOR

65THE VIETNAM PROVINCIAL COMPETITIVENESS INDEX 2009
PCI Survey2008 Question:
B5.3
Min
Median
Max
Correlationw/Previous Year
0
44.44
69.7
17.65
40
60.71
0.24
20.69
39.09
60
0.27*
DROPPED
Indicator Source (2009 Survey)
Measure 20062005 2007 2008 2009
If changes in leasescontracts, is there a fairprocess for disputingthem (% Always orUsually).
Notes: * Significant at 5% level; NA = not applicable. All values are at the provincial level. 2005 data only include 42 provinces and do not include the fullset of indicators used in subsequent years, reflecting changes in survey questions and ordering in 2006. † The Ministry of Natural Resources and theEnvironment changed the calculation of LURCs between 2003 and 2007 in the five national-level cities, leading to major reductions. To address this, theold calculation was applied to cities.
Figure 3.4: Land Access Sub-index 2009
Notes: Access to Land is a measure of how long and how costly it is to obtain business premises. Security Tenure is a measure of the risk ofexpropriation or loss of business property. Both dimensions account for 50% of the final index.

66 THE VIETNAM PROVINCIAL COMPETITIVENESS INDEX 2009
Transparency
Three indicators were dropped from theTransparency sub-index as no longer relevant. Thequestion asking whether provincial officials discussedchanges in laws or local regulations with privatebusinesses was dropped because there appeared tobe a bias toward large firms in some provincesdeveloping. This indicated that the question may notbe capturing general participation, but insteadmeasuring relationships between importantbusinesses and provincial officials. These relationshipscan be positive, but they may also lead to favoritismand potential for abuse of power. Because thequestion could not disentangle positive fromnegative participation in the legal process, wedropped it as an indicator. We did, however, keepthe question in the PCI survey so that researcherscould further look at the measure. Measurement ofthe information service provided by provincialagencies was moved to the Business SupportServices sub-index where it was a better fit
A new indicator was added to better measure theincreasing importance of business associations inadvocating on behalf of the private sector in someprovinces. This asked whether business associationswere important actors in government debates overlocal initiatives. Binh Duong (57 percent) and VinhPhuc (53 percent) topped the list, while the
mountainous provinces of Phu Tho (21 percent)and Lang Son (18 percent) exhibited little influenceof associations.
Finally, a small change was made in the way accessto planning and legal documents was calculated. Inthe past, we used factor analysis to reduce the longlist of 13 documents into baskets of documents thatcould more easily be analyzed. This method ofstreamlining data has a long history in surveyanalysis and is very useful for identifying patterns indata documentation. The problem from theperspective of policy makers was that the “factorscores” that resulted from the procedure were hardto interpret and, therefore, not actionable. Althoughwe still use factor analysis to identify groups ofhighly correlated documents, and once againlearned that access generally falls into two distinctgroups (planning documents and LNDs), instead ofusing the factor scores directly we went back andtook the average access (across a six-point likertscale) for each of the different documents sets. Theprovinces with greatest access to documentation inboth groups were the same regardless of theprocedure. Lao Cai, for instance, records averageaccess to planning and legal documents of 3.96 and4.54, respectively. As a result, we felt comfortablereporting the average score, which provincialofficials may find easier to work with.
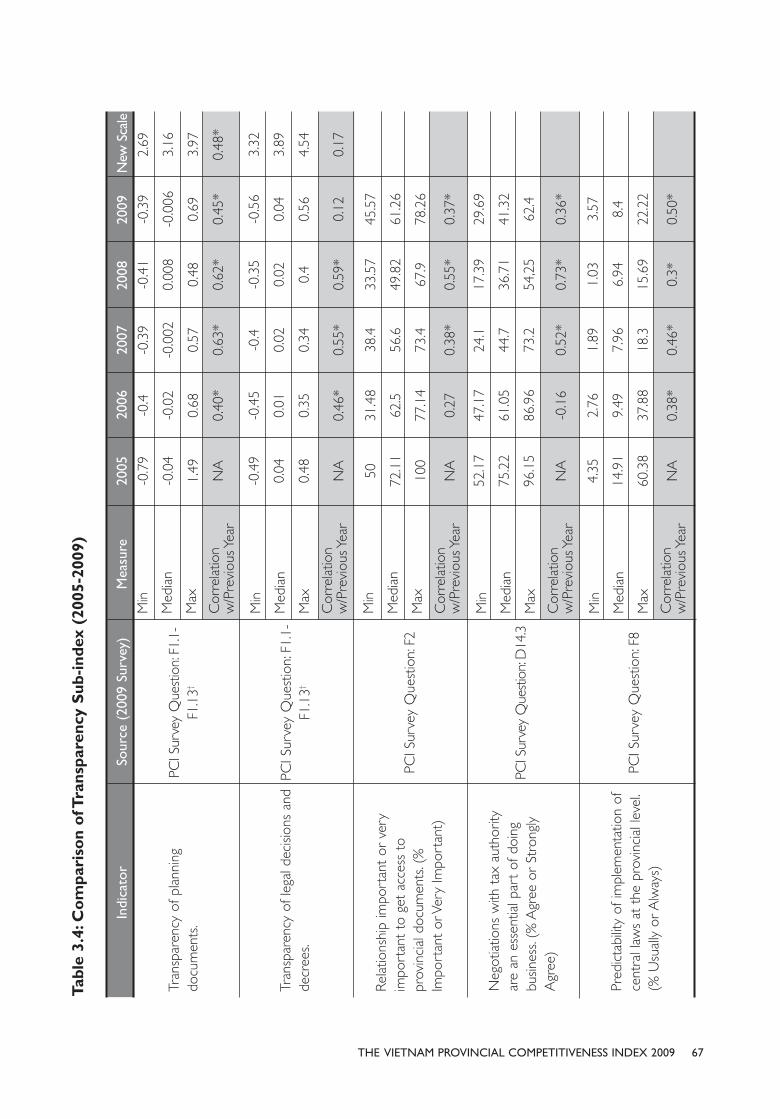
67THE VIETNAM PROVINCIAL COMPETITIVENESS INDEX 2009
PCI S
urve
y Q
uest
ion:
F1.1
-F1
.13†
PCI S
urve
y Q
uest
ion:
F1.
1-F1
.13†
PCI S
urve
y Q
uest
ion:
F2
PCI S
urve
y Q
uest
ion:
F8
Min
Med
ian
Max
Cor
rela
tion
w/P
revi
ous Y
ear
Min
Med
ian
Max
Cor
rela
tion
w/P
revi
ous Y
ear
Min
Med
ian
Max
Cor
rela
tion
w/P
revi
ous Y
ear
Min
Med
ian
Max
Cor
rela
tion
w/P
revi
ous Y
ear
Min
Med
ian
Max
Cor
rela
tion
w/P
revi
ous Y
ear
-0.4
-0.0
2
0.68
0.40
*
-0.4
5
0.01
0.35
0.46
*
31.4
8
62.5
77.1
4
0.27
47.1
7
61.0
5
86.9
6
-0.1
6
2.76
9.49
37.8
8
0.38
*
-0.7
9
-0.0
4
1.49 NA
-0.4
9
0.04
0.48 NA 50
72.1
1
100
NA
52.1
7
75.2
2
96.1
5
NA
4.35
14.9
1
60.3
8
NA
-0.3
9
-0.0
02
0.57
0.63
*
-0.4
0.02
0.34
0.55
*
38.4
56.6
73.4
0.38
*
24.1
44.7
73.2
0.52
*
1.89
7.96
18.3
0.46
*
-0.4
1
0.00
8
0.48
0.62
*
-0.3
5
0.02 0.4
0.59
*
33.5
7
49.8
2
67.9
0.55
*
17.3
9
36.7
1
54,2
5
0.73
*
1.03
6.94
15.6
9
0.3*
-0.3
9
-0.0
06
0.69
0.45
*
-0.5
6
0.04
0.56
0.12
45.5
7
61.2
6
78.2
6
0.37
*
29.6
9
41.3
2
62.4
0.36
*
3.57 8.4
22.2
2
0.50
*
2.69
3.16
3.97
0.48
*
3.32
3.89
4.54
0.17
Indi
cato
rSo
urce
(20
09 S
urve
y)M
easu
re20
0620
0520
0720
0820
09N
ew S
cale
Tran
spar
ency
of p
lann
ing
docu
men
ts.
Tran
spar
ency
of l
egal
dec
ision
s an
dde
cree
s.
Rela
tions
hip
impo
rtan
t or
ver
yim
port
ant
to g
et a
cces
s to
prov
inci
al d
ocum
ents
. (%
Impo
rtan
t or
Ver
y Im
port
ant)
Pred
icta
bilit
y of
impl
emen
tatio
n of
cent
ral l
aws
at t
he p
rovi
ncia
l lev
el.
(% U
sual
ly o
r A
lway
s)
PCI S
urve
y Q
uest
ion:
D14
.3
Neg
otia
tions
with
tax
aut
horit
yar
e an
ess
entia
l par
t of
doi
ngbu
sines
s. (%
Agr
ee o
r St
rong
lyA
gree
)
Tabl
e 3.
4: C
ompa
riso
n of
Tra
nspa
renc
y Su
b-in
dex
(200
5-20
09)
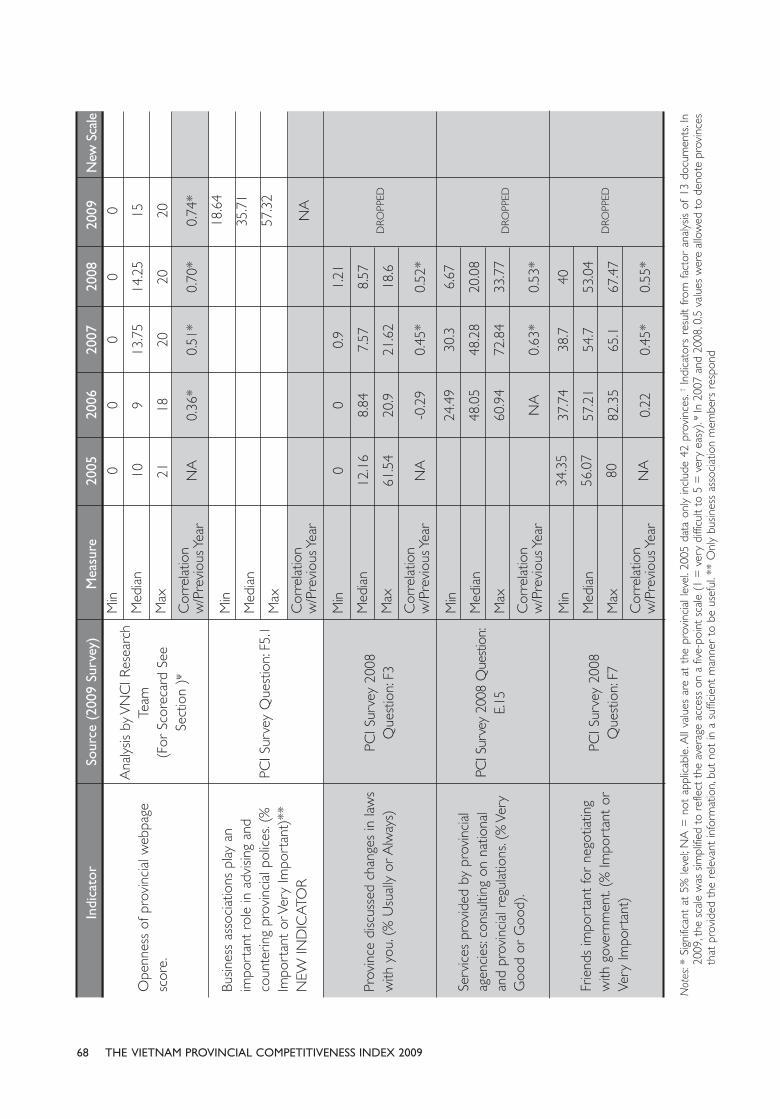
68 THE VIETNAM PROVINCIAL COMPETITIVENESS INDEX 2009
Ana
lysis
by
VN
CI R
esea
rch
Team
(For
Sco
reca
rd S
eeSe
ctio
n )ψ
PCI S
urve
y Q
uest
ion:
F5.
1
PCI S
urve
y 20
08Q
uest
ion:
F3
PCI S
urve
y 20
08Q
uest
ion:
F7
Min
Med
ian
Max
Cor
rela
tion
w/P
revi
ous Y
ear
Min
Med
ian
Max
Cor
rela
tion
w/P
revi
ous Y
ear
Min
Med
ian
Max
Cor
rela
tion
w/P
revi
ous Y
ear
Min
Med
ian
Max
Cor
rela
tion
w/P
revi
ous Y
ear
Min
Med
ian
Max
Cor
rela
tion
w/P
revi
ous Y
ear
0 9 18 0.36
*
0
8.84
20.9
-0.2
9
24.4
9
48.0
5
60.9
4
NA
37.7
4
57.2
1
82.3
5
0.22
0 10 21 NA 0
12.1
6
61.5
4
NA
34.3
5
56.0
7
80 NA
0
13.7
5
20 0.51
*
0.9
7.57
21.6
2
0.45
*
30.3
48.2
8
72.8
4
0.63
*
38.7
54.7
65.1
0.45
*
0
14.2
5
20 0.70
*
1.21
8.57
18.6
0.52
*
6.67
20.0
8
33.7
7
0.53
*
40
53.0
4
67.4
7
0.55
*
0 15 20 0.74
*
18.6
4
35.7
1
57.3
2
NA
DRO
PPED
DRO
PPED
DRO
PPED
Indi
cato
rSo
urce
(20
09 S
urve
y)M
easu
re20
0620
0520
0720
0820
09N
ew S
cale
Ope
nnes
s of
pro
vinc
ial w
ebpa
gesc
ore.
Busin
ess
asso
ciat
ions
pla
y an
impo
rtan
t ro
le in
adv
ising
and
coun
terin
g pr
ovin
cial
pol
ices
. (%
Impo
rtan
t or
Ver
y Im
port
ant)
**N
EW IN
DIC
ATO
R
Prov
ince
disc
usse
d ch
ange
s in
law
sw
ith y
ou. (
% U
sual
ly o
r A
lway
s)
Frie
nds
impo
rtan
t fo
r ne
gotia
ting
with
gov
ernm
ent.
(% Im
port
ant
orVe
ry Im
port
ant)
PCI S
urve
y 20
08 Q
uest
ion:
E.15
Serv
ices
pro
vide
d by
pro
vinc
ial
agen
cies
: con
sulti
ng o
n na
tiona
lan
d pr
ovin
cial
reg
ulat
ions
. (%
Ver
yG
ood
or G
ood)
.
Not
es: *
Sig
nific
ant
at 5
% le
vel;
NA
= n
ot a
pplic
able
. All
valu
es a
re a
t th
e pr
ovin
cial
leve
l. 20
05 d
ata
only
incl
ude
42 p
rovi
nces
. †In
dica
tors
res
ult
from
fac
tor
anal
ysis
of 1
3 do
cum
ents
. In
2009
, the
sca
le w
as s
impl
ified
to
refle
ct t
he a
vera
ge a
cces
s on
a fi
ve-p
oint
sca
le (
1 =
ver
y di
fficu
lt to
5 =
ver
y ea
sy). ψ
In 2
007
and
2008
, 0.5
val
ues
wer
e al
low
ed t
o de
note
pro
vinc
esth
at p
rovi
ded
the
rele
vant
info
rmat
ion,
but
not
in a
suf
ficie
nt m
anne
r to
be
usef
ul. *
* O
nly
busin
ess
asso
ciat
ion
mem
bers
res
pond
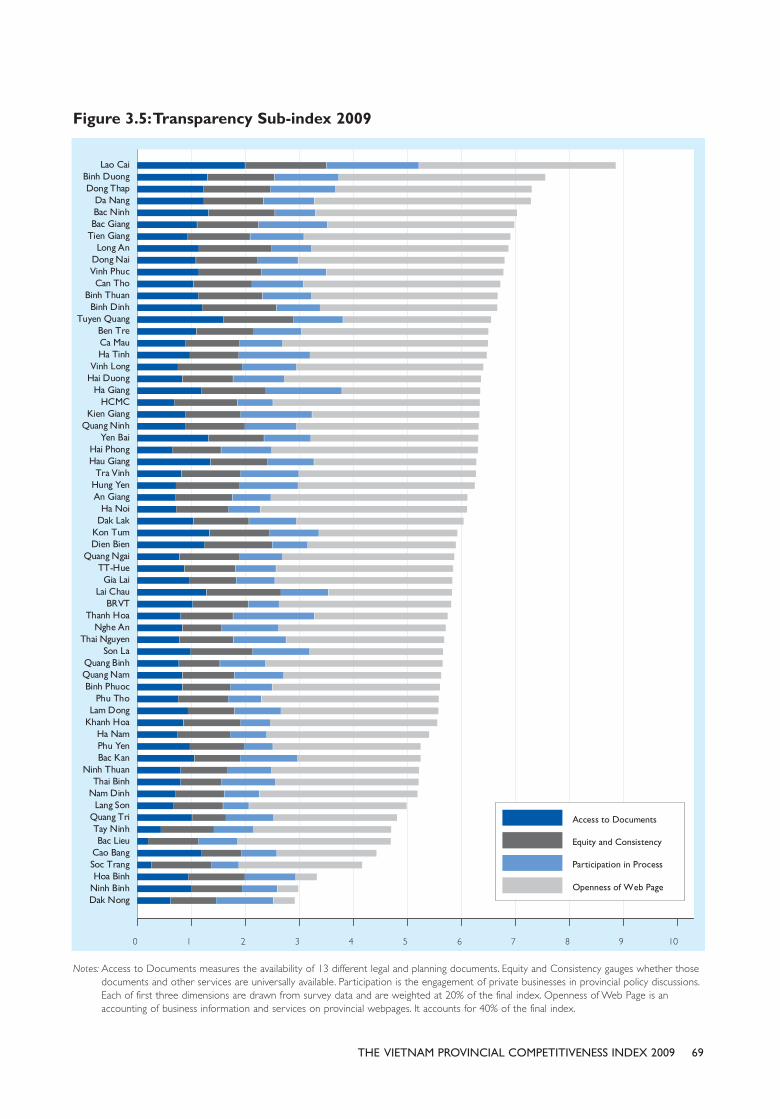
69THE VIETNAM PROVINCIAL COMPETITIVENESS INDEX 2009
Figure 3.5: Transparency Sub-index 2009
Notes: Access to Documents measures the availability of 13 different legal and planning documents. Equity and Consistency gauges whether thosedocuments and other services are universally available. Participation is the engagement of private businesses in provincial policy discussions.Each of first three dimensions are drawn from survey data and are weighted at 20% of the final index. Openness of Web Page is anaccounting of business information and services on provincial webpages. It accounts for 40% of the final index.

70 THE VIETNAM PROVINCIAL COMPETITIVENESS INDEX 2009
Time Costs of Regulatory Compliance
The most important change to Time Costs was abattery of questions measuring progress onachieving commitments under PAR. The surveyasks firms to comment on whether provincialofficials have successfully implemented changes infour areas over the past two years. We chosethese changes to reflect the current goalsarticulated by the Ministry of Home Affairs forPublic Administration Reform.35
The new indicators are 1) effectiveness of localbureaucrats in processing business-relateddocumentation; 2) reduction in waiting periods forstamps and signatures; 3) reduction in overallbureaucratic paperwork; and 4) cutbacks in formalfees for the processing of local administrativeprocedures. Although firms were somewhatpositive about observing improved effectivenessof bureaucrats (44 percent responded yes in themedian province) and reduction in paperwork (47percent responded yes in the median province),they were more negative about waiting periodsand formal fees (only 30 percent and 24 percent,respectively, responded that they had observedsuch changes in the median province).
35. For an excellent overview of PAR goals and accomplishments inVietnam, see Acuna-Alfaro, Jairo. 2009. “Addressing Governance andPublic Administration Reforms Effectively in Vietnam.” In ReformingPublic Administration in Vietnam: Current Situation and Recommendations,ed. Acuna-Alfaro. Ha Noi: National Political Publishing, p. 13-21.
PCI SurveyQuestion: D6
PCI SurveyQuestion: D1
Min
Median
Max
Correlationw/Previous Year
Min
Median
Max
Correlationw/Previous Year
Min
Median
Max
Correlationw/Previous Year
Min
Median
Max
Correlationw/Previous Year
6.52
21.24
39.39
0.44*
0
1
2
0.35*
1
8
40
0.62*
3.64
13.67
30.43
NA
1
1
3
NA
1
7.5
24
NA
10.94
21.87
43.75
0.62*
1
1
2
0.30*
2
8
40
0.86*
13.83
22.99
42.55
0.67*
1
1
2
0.46*
1
8
32
0.88*
7.27
15.38
30.36
0.44*
1
1
2
0.34*
1
5
40
0.75*
28.68
44.09
55.26
NA
Indicator Source (2009 Survey)
Measure 20062005 2007 2008 2009
Percentage of firmsspending over 10 percentof their time dealing withbureaucracy orbureaucratic regulations.
Median number ofinspections. (allagencies)
PCI SurveyQuestion: D4
Median tax inspectionhours.
PCI SurveyQuestion: D9.1
Government officialshave become moreeffective. (% Yes) NEWINDICATOR
Table 3.5: Comparison of Time Costs of Regulatory Compliance (2005–2009)

71THE VIETNAM PROVINCIAL COMPETITIVENESS INDEX 2009
PCI SurveyQuestion: D9.2
PCI SurveyQuestion: D9.3
PCI SurveyQuestion: D9.4
PCI SurveyQuestion: G2
Min
Median
Max
Correlationw/Previous Year
Min
Median
Max
Correlationw/Previous Year
Min
Median
Max
Correlationw/Previous Year
Min
Median
Max
Correlationw/Previous Year
Min
Median
Max
Correlationw/Previous Year
28.07
45.52
73.91
0.26
23.94
41.72
60.87
0.18
12.5
42.12
70
NA
18.18
40
78.57
NA
11.9
24.36
36.92
0.30*
13.75
22.86
35.04
0.21
11.54
24.51
37.59
0.51*
12.78
23.85
34.86
0.31*
17.69
30.23
45.95
NA
24.2
47.89
63.16
11.38
24.18
34.04
NA
DROPPED
DROPPED
Indicator Source (2009 Survey)
Measure 20062005 2007 2008 2009
Trips to obtain stampsand signaturesreduced. (% Yes) NEWINDICATOR
Paperwork reduced.(% Yes) NEWINDICATOR
Fees reduced. (% Yes)NEW INDICATOR
Days spent onbureaucracy reducedin past two years. (%)
PCI SurveyQuestion: D2
Inspections havedecreased in past twoyears. (%)
Notes: * Significant at 5% level; NA = not applicable. All values are at the provincial level. 2005 data only include 42 provinces.

72 THE VIETNAM PROVINCIAL COMPETITIVENESS INDEX 2009
Figure 3.6: Time Costs of Regulatory Compliance Sub-Index 2009
Notes: Regulatory Compliance is a measure of the wait and costliness of bureaucratic procedures.
Informal chargesOne new indicator was added to the informal chargesindex to gauge whether firms bidding for governmentcontracts were subject to commission requests on aportion of the contract. This type of macro-corruption—kick-backs—is extremely important foreconomic development. It is costly to firms and oftenleads to less-than-optimum providers of governmentservices. Some officials have been known to favorbidders who offer larger commissions, as opposed tothe most cost-effective or highest-quality provider.
When commissions drive the selection of producers,society as a whole loses by paying too much for sub-standard services. Because of macro-corruption’s criticalimportance in the Vietnamese economy today, the PCIresearch team believed that it should be consideredalong with petty or micro-corruption (informal chargesin interactions with local provincial agencies) in theInformal Charges sub-index.
In addition, an indicator measuring firm rating ofcorruption as an obstacle to development wasdropped because it was duplicative.
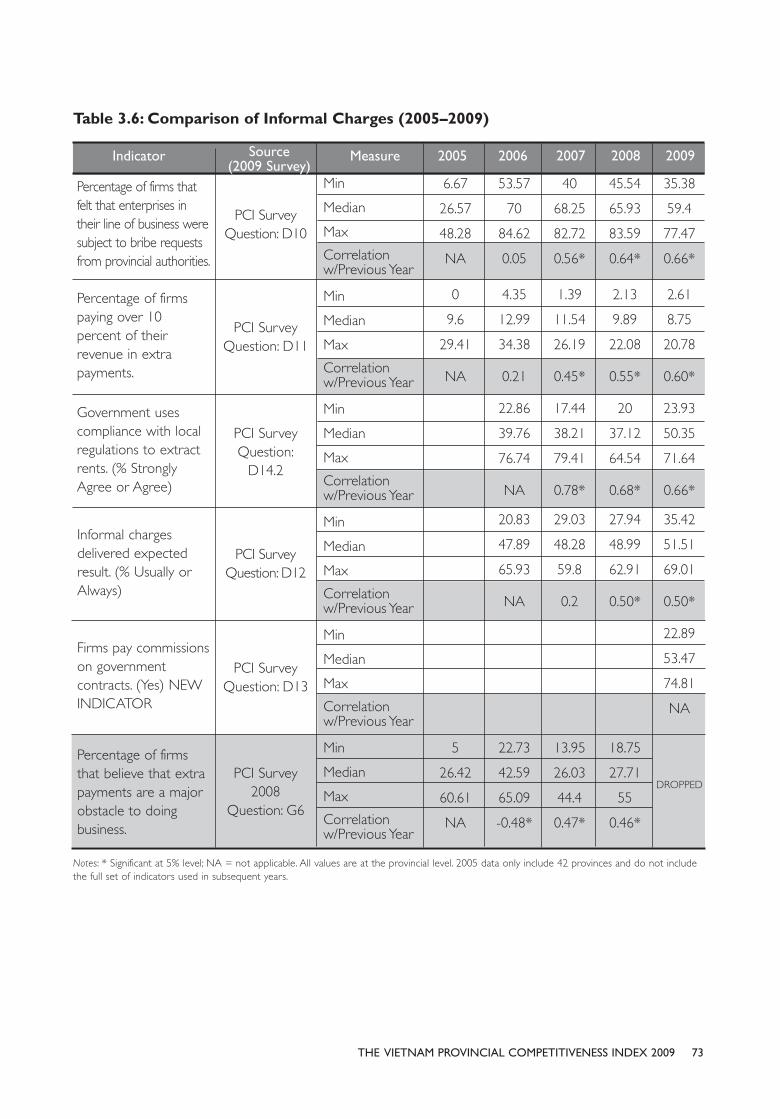
73THE VIETNAM PROVINCIAL COMPETITIVENESS INDEX 2009
Table 3.6: Comparison of Informal Charges (2005–2009)
Notes: * Significant at 5% level; NA = not applicable. All values are at the provincial level. 2005 data only include 42 provinces and do not includethe full set of indicators used in subsequent years.
PCI SurveyQuestion: D10
PCI SurveyQuestion: D11
PCI SurveyQuestion:
D14.2
PCI SurveyQuestion: D13
PCI Survey2008
Question: G6
Min
Median
Max
Correlationw/Previous Year
Min
Median
Max
Correlationw/Previous Year
Min
Median
Max
Correlationw/Previous Year
Min
Median
Max
Correlationw/Previous Year
Min
Median
Max
Correlationw/Previous Year
Min
Median
Max
Correlationw/Previous Year
53.57
70
84.62
0.05
4.35
12.99
34.38
0.21
22.86
39.76
76.74
NA
20.83
47.89
65.93
NA
22.73
42.59
65.09
-0.48*
6.67
26.57
48.28
NA
0
9.6
29.41
NA
5
26.42
60.61
NA
40
68.25
82.72
0.56*
1.39
11.54
26.19
0.45*
17.44
38.21
79.41
0.78*
29.03
48.28
59.8
0.2
13.95
26.03
44.4
0.47*
45.54
65.93
83.59
0.64*
2.13
9.89
22.08
0.55*
20
37.12
64.54
0.68*
27.94
48.99
62.91
0.50*
18.75
27.71
55
0.46*
35.38
59.4
77.47
0.66*
2.61
8.75
20.78
0.60*
23.93
50.35
71.64
0.66*
35.42
51.51
69.01
0.50*
22.89
53.47
74.81
NA
DROPPED
Indicator Source (2009 Survey)
Measure 20062005 2007 2008 2009
Percentage of firms thatfelt that enterprises intheir line of business weresubject to bribe requestsfrom provincial authorities.
Percentage of firmspaying over 10percent of theirrevenue in extrapayments.
Government usescompliance with localregulations to extractrents. (% StronglyAgree or Agree)
Firms pay commissionson governmentcontracts. (Yes) NEWINDICATOR
Percentage of firmsthat believe that extrapayments are a majorobstacle to doingbusiness.
PCI SurveyQuestion: D12
Informal chargesdelivered expectedresult. (% Usually orAlways)

74 THE VIETNAM PROVINCIAL COMPETITIVENESS INDEX 2009
Figure 3.7: Informal Charges Sub-Index 2009
Notes: Informal Charges measure the amount of extra fees, fines, and other payments outside of regulations when doing business.
Proactivity
Only minor changes were made to the Proactivitysub-index. An indicator of general attitude of theprovincial government toward the private sector
was shifted over from the old SOE Bias sub-indexbecause of its strong theoretical and empiricalcorrelation with other proactivity measures.

75THE VIETNAM PROVINCIAL COMPETITIVENESS INDEX 2009
PCI S
urve
y Q
uest
ion:
H7.
2
PCI S
urve
y Q
uest
ion:
H7.
3
PCI S
urve
y Q
uest
ion:
H1
PCI S
urve
y Q
uest
ion:
H7.
8
Min
Med
ian
Max
Cor
rela
tion
w/P
revi
ous Y
ear
Min
Med
ian
Max
Cor
rela
tion
w/P
revi
ous Y
ear
Min
Med
ian
Max
Cor
rela
tion
w/P
revi
ous Y
ear
Min
Med
ian
Max
Cor
rela
tion
w/P
revi
ous Y
ear
Min
Med
ian
Max
Cor
rela
tion
w/P
revi
ous Y
ear
51.6
1
74.4
4
93.4
8
0.60
*
40
61.8
8
88.6
4
0.69
*
30.2
1
48.2
8
71.5
6
0.63
*
16.0
4
29.0
7
61.5
4
0.40
*
14.6
3
32.8
8
48.8
4
0.59
*
43.7
5
76.9
3
94.2
9
NA
31.2
5
63.2
7
85.7
1
NA
20.5
9
47.8
3
78.2
6
NA
4.76
31.3
5
60 NA
7.89
33.3
3
60.4
2
NA
53.6
8
71.7
4
92.4
7
0.68
*
40.2
2
58.1
2
87.9
1
0.76
*
24.5
44.9
7
67.3
7
0.67
*
16.6
7
30.9
5
56.6
3
0.47
*
12.2
33.3
3
58.3
3
0.55
*
57.3
5
77.2
8
91.4
1
0.68
*
40.9
61.5
85.0
5
0.75
*
32.7
1
53.4
72.2
2
0.53
*
10.8
4
20.9
9
55.1
7
0.63
*
17.9
5
32.9
9
66.2
5
0.53
*
54.6
7
72.6
5
91.7
2
0.70
*
23.9
4
42.4
6
72.5
9
0.75
*
28.4
2
43.7
5
71.9
6
0.56
*
DRO
PPED
DRO
PPED
Indi
cato
rSo
urce
(20
09 S
urve
y)M
easu
re20
0620
0520
0720
0820
09
Prov
incia
l offic
ials
are
know
ledg
eabl
een
ough
abo
ut p
rese
nt n
atio
nal l
awto
find
opp
ortu
nitie
s w
ithin
exi
stin
glaw
to s
olve
firm
pro
blem
s. (%
Stro
ngly
Agr
ee o
r Agr
ee)
Prov
inci
al o
ffici
als
are
crea
tive
and
clev
er a
bout
wor
king
with
in t
hena
tiona
l law
to
solv
e th
e pr
oble
ms
of p
rivat
e se
ctor
firm
s. (%
Str
ongl
yA
gree
or
Agr
ee).
Perc
eive
d at
titud
e of
pro
vinc
ial
gove
rnm
ent
tow
ard
priv
ate
sect
or.
(% V
ery
Posit
ive
or P
ositi
ve).
Ther
e ar
e no
goo
d in
itiat
ives
at
the
prov
inci
al le
vel;
all i
mpo
rtan
tpo
licy
com
es fr
om t
he c
entr
algo
vern
men
t. (%
Str
ongl
y A
gree
or
Agr
ee).
PCI S
urve
y Q
uest
ion:
H7.
5
All
good
initi
ativ
es c
ome
from
the
prov
inci
al g
over
nmen
t, bu
t th
ece
nter
frus
trat
es t
hem
. (%
Str
ongl
yA
gree
or
Agr
ee).
Tabl
e 3.
7: C
ompa
riso
n of
Pro
activ
ity (
2005
–200
9)
Not
es: *
Sig
nific
ant
at 5
% le
vel;
NA
= n
ot a
pplic
able
. All
valu
es a
re a
t th
e pr
ovin
cial
leve
l. 20
05 d
ata
only
incl
ude
42 p
rovi
nces
.
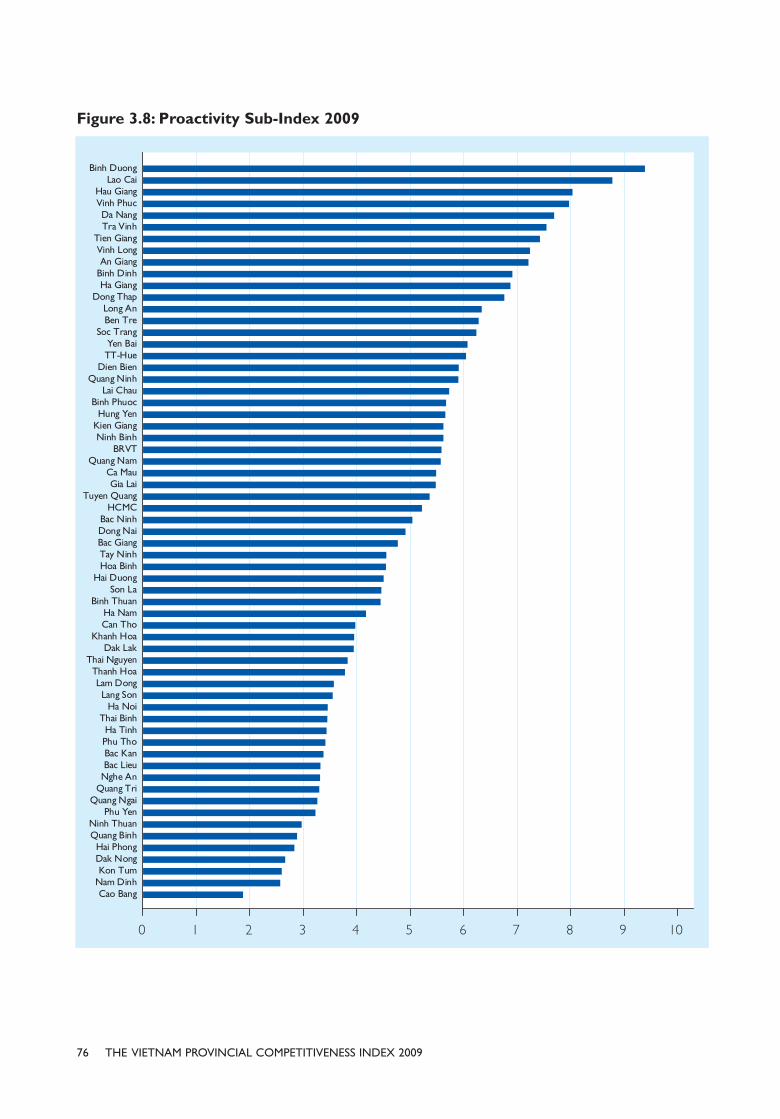
76 THE VIETNAM PROVINCIAL COMPETITIVENESS INDEX 2009
Figure 3.8: Proactivity Sub-Index 2009
77THE VIETNAM PROVINCIAL COMPETITIVENESS INDEX 2009
Business Support Services
Our conversations with provincial leaders,entrepreneurs, heads of business associations, andresearchers led us to believe that this sub-indexrequired the most drastic alterations.
Although all experts agree that business supportservices are critical for the success of businessoperations, our index inadvertently gave anadvantage to support services that were providedby provincial authorities as opposed to those thatwere supplied by private and nongovernment actors.When the PCI was first conceptualized at thebeginning of the decade, this decision made sense.Private providers of business services, such asconsultancies, accounting firms, strategic advisors, andlawyers, were only in their infancy, operating primarilyin the country’s two biggest cities. There was littleevidence that businesses in provinces outside of HaNoi and HCMC had access to business services. Thepaucity represented a market failure that we deemedcould be filled by provincial agencies. 36
There was always some risk to the incentivecreated by this index, but the current businessclimate is dramatically different now. Nearly 4,000private business service providers, includingconsulting firms, accountants, and law firms, operatethroughout the country. They are still predominantlyconcentrated in large cities, but nearly everyprovince now has some local operations andproviders from Ha Noi and HCMC offer servicesacross provincial borders.
Because of the vast array of opportunities foraccess to private service, it no longer makes senseto focus on government provision of services. Infact, such a focus may even be damaging, asgovernment services may crowd out theopportunities for private vendors. Private providerscan simply not compete against free servicesoffered by local agencies. A number of very
successful provinces, such as Binh Duong, no longerprovide state-funded services but have insteadfocused on creating a hospitable environment forprivate service providers to operate. In pastiterations of the PCI, this very positive developmentwas not appropriately rewarded. Active privatesector participation in business services and robustcompetition among these providers will lead tohigher-quality products that will be sustainable overthe long term.
A second issue with our previous assessment ofbusiness services was a minor methodologicalrefinement. Our primary indicators in this sub-indexwere derived from a question asking businessmanagers to rank the quality of various businessservices in their province on a five-point likert scale.At the time, we chose not to discriminatebetween businesses that had used the servicesand those that had not. Our reasoning behind thischoice was that perceptions of service quality mayhave actually contributed to a firm’s decision notto use the local services.
Thus, our measures of business services were notactually capturing perceptions of particular service,but instead capturing a general feeling about overallencouragement of the private sector in theprovince. This is a very interesting aspect ofgovernance and is certainly important for businesssuccess, but does not provide the type of actionablepolicy information that provincial leaders need.
This year we replaced the general perceptionsquestions with a series of three questions for fiveseparate business services: 1) business informationsearch services; 2) consulting on regulatoryinformation; 3) business match-making; 4) tradepromotion; and 5) technology information andtraining. The three questions were:
• In the last year, did you use a particularbusiness service?
• If so, was the provider a public agency or aprivate operator?
• Do you intend to use this service again inthe future?
35. Nguyen Van Lan and Nguyen Phuong Quynh Trang. 2004.Management Consulting: An Emerging Business Service for the PrivateSector in Vietnam. Private Sector Development Papers No. 15. Ha Noi:International Financial Corporation.
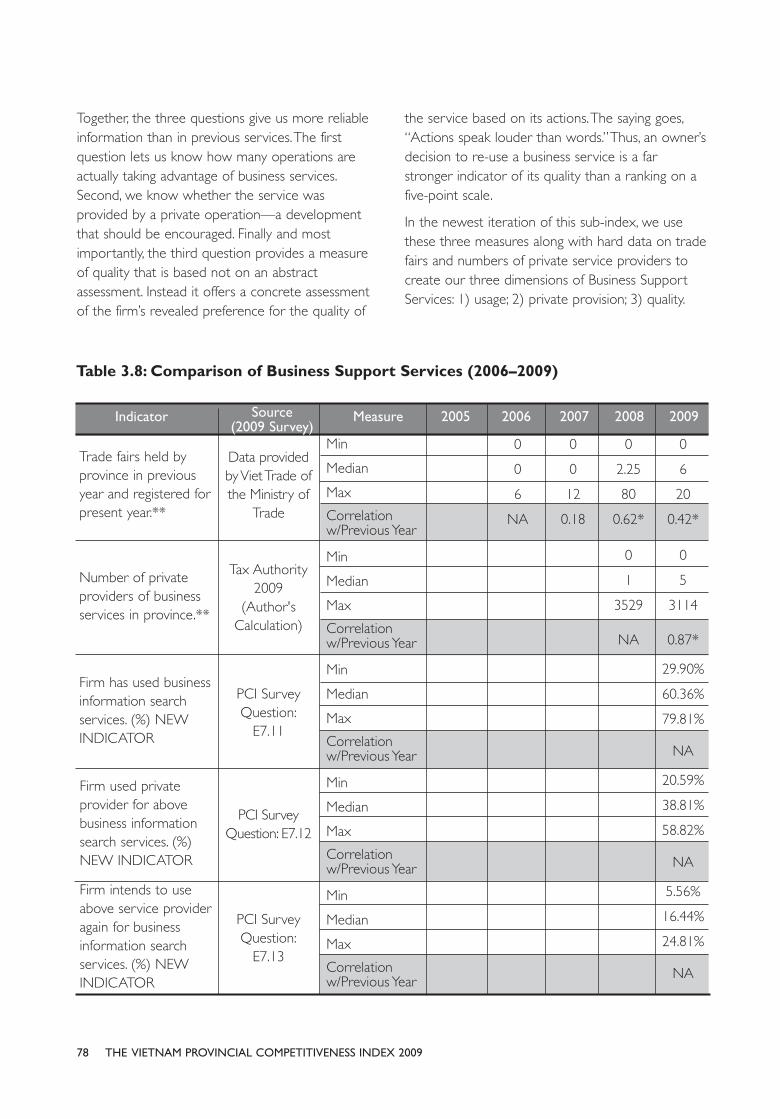
78 THE VIETNAM PROVINCIAL COMPETITIVENESS INDEX 2009
Together, the three questions give us more reliableinformation than in previous services. The firstquestion lets us know how many operations areactually taking advantage of business services.Second, we know whether the service wasprovided by a private operation—a developmentthat should be encouraged. Finally and mostimportantly, the third question provides a measureof quality that is based not on an abstractassessment. Instead it offers a concrete assessmentof the firm’s revealed preference for the quality of
the service based on its actions. The saying goes,“Actions speak louder than words.” Thus, an owner’sdecision to re-use a business service is a farstronger indicator of its quality than a ranking on afive-point scale.
In the newest iteration of this sub-index, we usethese three measures along with hard data on tradefairs and numbers of private service providers tocreate our three dimensions of Business SupportServices: 1) usage; 2) private provision; 3) quality.
Data providedby Viet Trade ofthe Ministry of
Trade
Tax Authority2009
(Author'sCalculation)
PCI SurveyQuestion:
E7.11
PCI SurveyQuestion:
E7.13
Min
Median
Max
Correlationw/Previous Year
Min
Median
Max
Correlationw/Previous Year
Min
Median
Max
Correlationw/Previous Year
Min
Median
Max
Correlationw/Previous Year
Min
Median
Max
Correlationw/Previous Year
0
0
6
NA
0
0
12
0.18
0
2.25
80
0.62*
0
1
3529
NA
0
6
20
0.42*
0
5
3114
0.87*
29.90%
60.36%
79.81%
NA
20.59%
38.81%
58.82%
NA
5.56%
16.44%
24.81%
NA
Indicator Source (2009 Survey)
Measure 20062005 2007 2008 2009
Trade fairs held byprovince in previousyear and registered forpresent year.**
Number of privateproviders of businessservices in province.**
Firm has used businessinformation searchservices. (%) NEWINDICATOR
Firm intends to useabove service provideragain for businessinformation searchservices. (%) NEWINDICATOR
PCI SurveyQuestion: E7.12
Firm used privateprovider for abovebusiness informationsearch services. (%)NEW INDICATOR
Table 3.8: Comparison of Business Support Services (2006–2009)
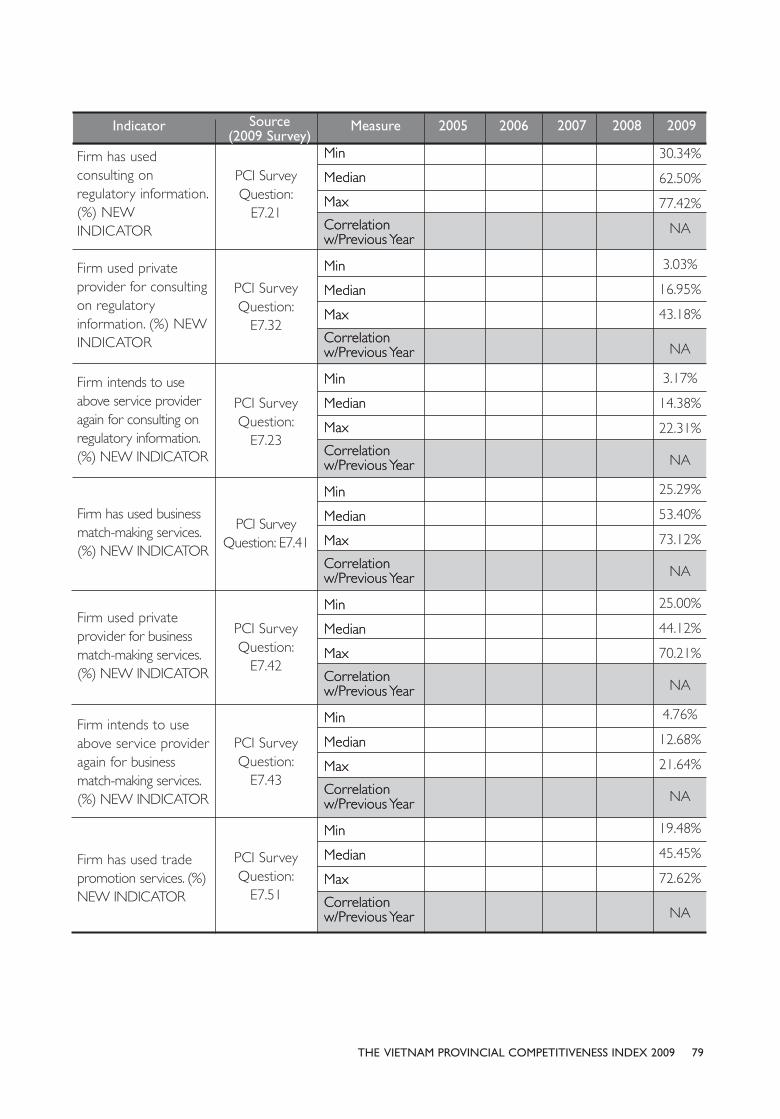
79THE VIETNAM PROVINCIAL COMPETITIVENESS INDEX 2009
PCI SurveyQuestion:
E7.21
PCI SurveyQuestion:
E7.32
PCI SurveyQuestion:
E7.23
PCI SurveyQuestion:
E7.42
PCI SurveyQuestion:
E7.43
PCI SurveyQuestion:
E7.51
Min
Median
Max
Correlationw/Previous Year
Min
Median
Max
Correlationw/Previous Year
Min
Median
Max
Correlationw/Previous Year
Min
Median
Max
Correlationw/Previous Year
Min
Median
Max
Correlationw/Previous Year
Min
Median
Max
Correlationw/Previous Year
Min
Median
Max
Correlationw/Previous Year
Min
Median
Max
Correlationw/Previous Year
Min
Median
Max
Correlationw/Previous Year
Min
Median
Max
Correlationw/Previous Year
Min
Median
Max
Correlationw/Previous Year
Min
Median
Max
Correlationw/Previous Year
Min
Median
Max
Correlationw/Previous Year
Min
Median
Max
Correlationw/Previous Year
30.34%
62.50%
77.42%
NA
3.03%
16.95%
43.18%
NA
3.17%
14.38%
22.31%
NA
25.29%
53.40%
73.12%
NA
25.00%
44.12%
70.21%
NA
4.76%
12.68%
21.64%
NA
19.48%
45.45%
72.62%
NA
Indicator Source (2009 Survey)
Measure 20062005 2007 2008 2009
Firm has usedconsulting onregulatory information.(%) NEWINDICATOR
Firm used privateprovider for consultingon regulatoryinformation. (%) NEWINDICATOR
Firm intends to useabove service provideragain for consulting onregulatory information.(%) NEW INDICATOR
Firm used privateprovider for businessmatch-making services.(%) NEW INDICATOR
Firm intends to useabove service provideragain for businessmatch-making services.(%) NEW INDICATOR
Firm has used tradepromotion services. (%)NEW INDICATOR
PCI SurveyQuestion: E7.41
Firm has used businessmatch-making services.(%) NEW INDICATOR

80 THE VIETNAM PROVINCIAL COMPETITIVENESS INDEX 2009
PCI SurveyQuestion:
E7.52
PCI SurveyQuestion:
E7.53
PCI SurveyQuestion:
E7.61
PCI SurveyQuestion:
E7.63
PCI SurveyQuestion: E1.4
PCI SurveyQuestion:
E1.10
Min
Median
Max
Correlationw/Previous Year
Min
Median
Max
Correlationw/Previous Year
Min
Median
Max
Correlationw/Previous Year
Min
Median
Max
Correlationw/Previous Year
Min
Median
Max
Correlationw/Previous Year
Min
Median
Max
Correlationw/Previous Year
Min
Median
Max
Correlationw/Previous Year
Min
Median
Max
Correlationw/Previous Year
Min
Median
Max
Correlationw/Previous Year
Min
Median
Max
Correlationw/Previous Year
Min
Median
Max
Correlationw/Previous Year
Min
Median
Max
Correlationw/Previous Year
Min
Median
Max
Correlationw/Previous Year
Min
Median
Max
Correlationw/Previous Year
30.43
49.72
64.89
0.17
24.49
48.05
60.94
0.18
0
21.99
41.54
0
13.36
26.19
23.52
44.19
66.93
0.18
15
31.52
62.96
0.46*
8.16
20
34.86
0.67*
1.4
11.59
30
0.69*
4.44%
18.00%
38.42%
NA
1.59%
7.89%
17.46%
NA
25.33%
50.00%
73.49%
NA
17.65%
38.60%
65.85%
NA
3.17%
10.71%
17.46%
NA
DROPPED
DROPPED
Indicator Source (2009 Survey)
Measure 20062005 2007 2008 2009
Firm used privateprovider for tradepromotion services. (%)NEW INDICATOR
Firm intends to useabove service provideragain for tradepromotion services. (%)NEW INDICATOR
Firm has usedtechnology-relatedservices. (%) NEW INDICATOR
Firm intends to useabove service provideragain for technologyrelated services. (%)NEW INDICATOR
Services provided byprovincial agencies:provision of marketinformation. (% VeryGood or Good)
Services provided byprovincial agencies:match-making forbusiness partners. (%Very Good or Good).
PCI SurveyQuestion: E7.62
Firm used privateprovider fortechnology-relatedservices. (%) NEWINDICATOR
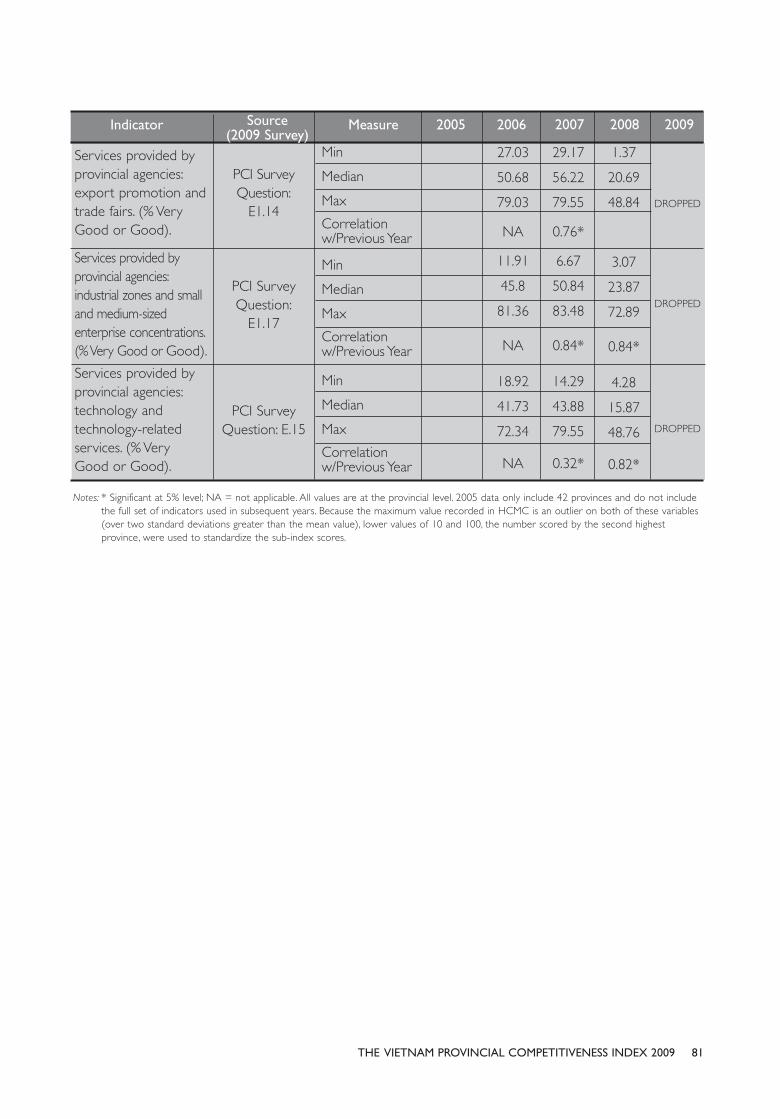
81THE VIETNAM PROVINCIAL COMPETITIVENESS INDEX 2009
PCI SurveyQuestion:
E1.14
PCI SurveyQuestion:
E1.17
Min
Median
Max
Correlationw/Previous Year
Min
Median
Max
Correlationw/Previous Year
Min
Median
Max
Correlationw/Previous Year
27.03
50.68
79.03
NA
11.91
45.8
81.36
NA
18.92
41.73
72.34
NA
29.17
56.22
79.55
0.76*
6.67
50.84
83.48
0.84*
14.29
43.88
79.55
0.32*
1.37
20.69
48.84
3.07
23.87
72.89
0.84*
4.28
15.87
48.76
0.82*
DROPPED
DROPPED
DROPPED
Indicator Source (2009 Survey)
Measure 20062005 2007 2008 2009
Services provided byprovincial agencies:export promotion andtrade fairs. (% VeryGood or Good).
Services provided byprovincial agencies:industrial zones and smalland medium-sizedenterprise concentrations.(% Very Good or Good).
PCI SurveyQuestion: E.15
Services provided byprovincial agencies:technology andtechnology-relatedservices. (% VeryGood or Good).
Notes: * Significant at 5% level; NA = not applicable. All values are at the provincial level. 2005 data only include 42 provinces and do not includethe full set of indicators used in subsequent years. Because the maximum value recorded in HCMC is an outlier on both of these variables(over two standard deviations greater than the mean value), lower values of 10 and 100, the number scored by the second highestprovince, were used to standardize the sub-index scores.
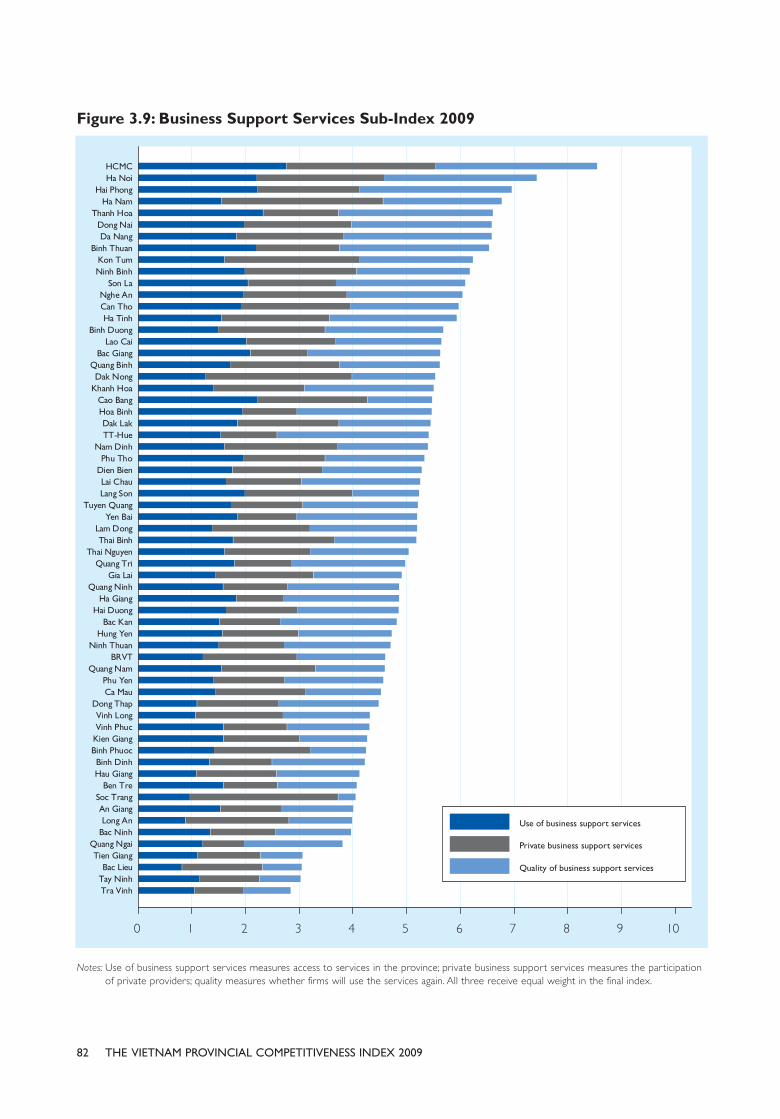
82 THE VIETNAM PROVINCIAL COMPETITIVENESS INDEX 2009
Figure 3.9: Business Support Services Sub-Index 2009
Notes: Use of business support services measures access to services in the province; private business support services measures the participationof private providers; quality measures whether firms will use the services again. All three receive equal weight in the final index.

83THE VIETNAM PROVINCIAL COMPETITIVENESS INDEX 2009
Labor Policy
Labor policy also underwent a number ofalterations this year. As with Business SupportServices, we replaced general perceptions of laborexchange services with our three-question series onusage, private provision, and quality (intention to re-use).
We also added a measure of the costs thatindividual businesses spend on labor training as apercentage of annual revenue. This provides ameasure of the direct costs imposed on localoperators by having to supplement training ofworkers due to an insufficient general skill-base.Different sectors, levels of sophistication, size,competition for labor, and average provincial wagesalso drive labor training costs, so we regressed thetraining costs reported by firms on these on thesevariables and saved the regression’s residual. Theresidual represents the cost of labor training notexplained by these baseline determinants.
More importantly, however, we drastically improvedour use of hard data in this index. Over the years,many provinces have complained that simplycounting the number of vocational training schoolsin a province was misleading, privileging the quantityof training buildings over the actual quality oftraining provided. Other provinces (particularlyHCMC and Dong Nai) argued that only countingvocational training schools under-estimated the
value of education provided by their universities andcolleges, which also offered training in a range ofapplications that were useful to businesses,particularly in the skill-sets that were most valuedby entrepreneurs (engineering, finance, andmanagement).
This year, thanks to a range of new data available oneducational quality in Vietnam, we have drasticallysupplemented our measures. First, we added anindicator of the scope of labor training facilities inthe province. This included the total number ofpost-secondary educational establishments(university, college, vocation) per capita and ameasure of the percentage of districts in theprovince with local vocal training facilities for theirconstituencies. Second, we assessed overall laborquality with two variables drawn directly fromrecent labor force services: 1) the percentage ofsecondary school graduates, and 2) the ratio ofvocational training school graduates to laborers withno formal education after primary school. HCMCand Danang topped this second list with ratios of0.29 and 0.17 respectively. Finally, we anchored thesurvey information on private provision ofvocational training with a hard data measure ofprivate providers in the province drawn from theGeneral Department of Vocational Training. BRVT(71 percent) and Dong Nai (66 percent) toppedthis final list. Many provinces, however, did not havea single private vocational school.
PCI SurveyQuestion: E1.7
PCI SurveyQuestion: E1.8
Min
Median
Max
Correlationw/Previous Year
Min
Median
Max
Correlationw/Previous Year
51.51
73.29
87.34
0.21
24
55.9
79.49
0.66*
7.43
19.16
35.52
NA
31.25
55.43
73.17
NA
17.71
35.20
58.90
0.61*
6.25
19.81
46.28
0.78*
22.08
45.45
68.93
0.76*
10.25
27.11
48.51
0.57*
Indicator Source (2009 Survey)
Measure 20072006 2008 2009
Services provided byprovincial agencies:general education. (%Very Good or Good)
Services provided byprovincial agencies:labor vocationaltraining. (% Very Goodor Good)
Table 3.9: Comparison of Labor Policy (2006–2009)
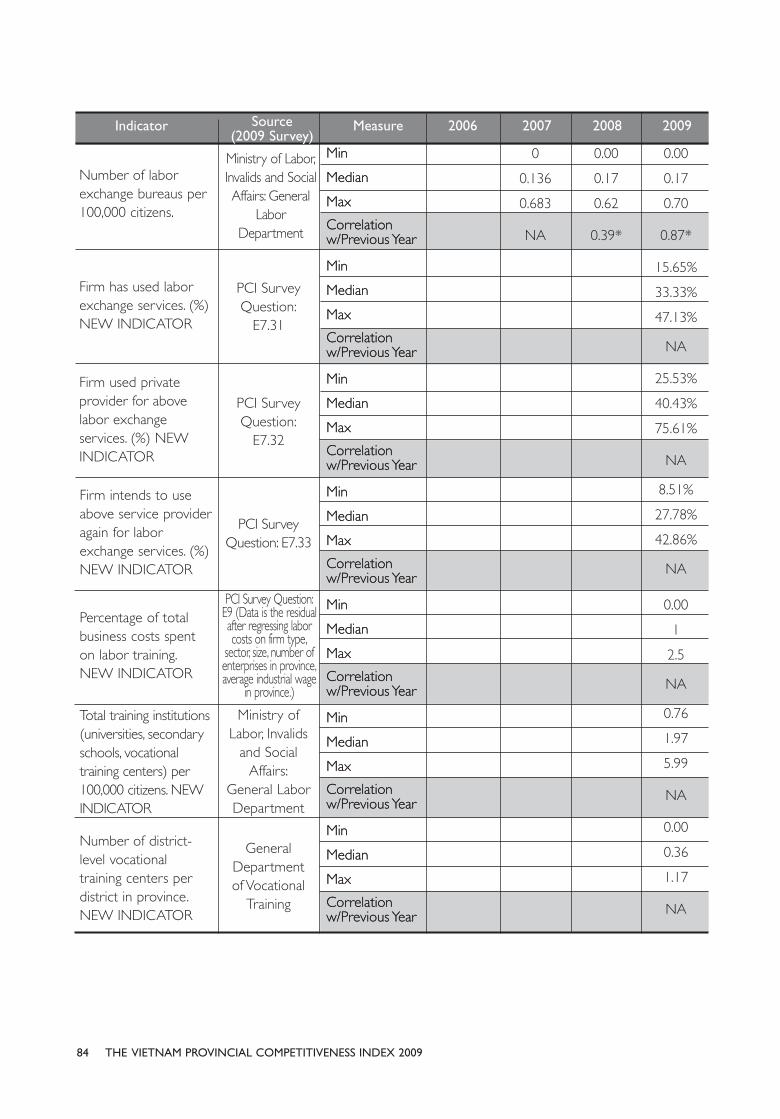
84 THE VIETNAM PROVINCIAL COMPETITIVENESS INDEX 2009
Ministry of Labor,Invalids and SocialAffairs: General
LaborDepartment
PCI SurveyQuestion:
E7.31
PCI SurveyQuestion:
E7.32
PCI Survey Question:E9 (Data is the residualafter regressing laborcosts on firm type,
sector, size, number ofenterprises in province,average industrial wage
in province.)
Ministry ofLabor, Invalids
and SocialAffairs:
General LaborDepartment
GeneralDepartmentof Vocational
Training
Min
Median
Max
Correlationw/Previous Year
Min
Median
Max
Correlationw/Previous Year
Min
Median
Max
Correlationw/Previous Year
Min
Median
Max
Correlationw/Previous Year
Min
Median
Max
Correlationw/Previous Year
Min
Median
Max
Correlationw/Previous Year
Min
Median
Max
Correlationw/Previous Year
Min
Median
Max
Correlationw/Previous Year
Min
Median
Max
Correlationw/Previous Year
Min
Median
Max
Correlationw/Previous Year
Min
Median
Max
Correlationw/Previous Year
Min
Median
Max
Correlationw/Previous Year
Min
Median
Max
Correlationw/Previous Year
Min
Median
Max
Correlationw/Previous Year
0
0.136
0.683
NA
0.00
0.17
0.62
0.39*
0.00
0.17
0.70
0.87*
15.65%
33.33%
47.13%
NA
25.53%
40.43%
75.61%
NA
8.51%
27.78%
42.86%
NA
0.00
1
2.5
NA
0.76
1.97
5.99
NA
0.00
0.36
1.17
NA
Indicator Source (2009 Survey)
Measure 2006 2007 2008 2009
Number of laborexchange bureaus per100,000 citizens.
Firm has used laborexchange services. (%)NEW INDICATOR
Firm used privateprovider for abovelabor exchangeservices. (%) NEWINDICATOR
Percentage of totalbusiness costs spenton labor training.NEW INDICATOR
Total training institutions(universities, secondaryschools, vocationaltraining centers) per100,000 citizens. NEWINDICATOR
Number of district-level vocationaltraining centers perdistrict in province.NEW INDICATOR
PCI SurveyQuestion: E7.33
Firm intends to useabove service provideragain for laborexchange services. (%)NEW INDICATOR

85THE VIETNAM PROVINCIAL COMPETITIVENESS INDEX 2009
GeneralDepartment of
VocationalTraining
Ministry ofLabor, Invalids
and SocialAffairs:
General LaborDepartment
GeneralStatistical
Office
PCI SurveyQuestion:
E1.13
Min
Median
Max
Correlationw/Previous Year
Min
Median
Max
Correlationw/Previous Year
Min
Median
Max
Correlationw/Previous Year
Min
Median
Max
Correlationw/Previous Year
Min
Median
Max
Correlationw/Previous Year
0.103
0.705
2.09
NA
16.67
48.62
74.68
NA
0.14
0.81
2.19
0.92*
21.88
49.43
78.05
0.76*
0.09
0.79
2.05
0.87*
4.84
16.56
41.79
0.78*
0.00%
16.67%
62.50%
NA
1.42%
5.45%
29.02%
NA
4.4%
10.3%
30.2%
NA
DROPPED
DROPPED
Indicator Source (2009 Survey)
Measure 2006 2007 2008 2009
Percentage of vocationaltraining institutes inprovince that are run byprivate entities. NEWINDICATOR
Vocational trainingschoolgraduates/untrainedlaborers. NEWINDICATOR
Secondary schoolgraduates. (% ofworkforce) NEWINDICATOR
Services provided byprovincial agencies:labor exchangeservices. (% VeryGood or Good)
GeneralDepartment of
VocationalTraining
Number of locallymanaged vocationalschools per 100,000citizens.
Notes: * Significant at 5% level; NA = not applicable. All values are at the provincial level. Labor sub-index did not exist in 2005.

86 THE VIETNAM PROVINCIAL COMPETITIVENESS INDEX 2009
Figure 3.10: Labor Policy Sub-Index 2009
Recruitment of labor measures the difficulties and costs of finding new employees; labor training gauges the quality of labor training facilities in theprovince (both general and vocational); labor quality measures the quality of individual employees. All three receive equal weight in the final index.
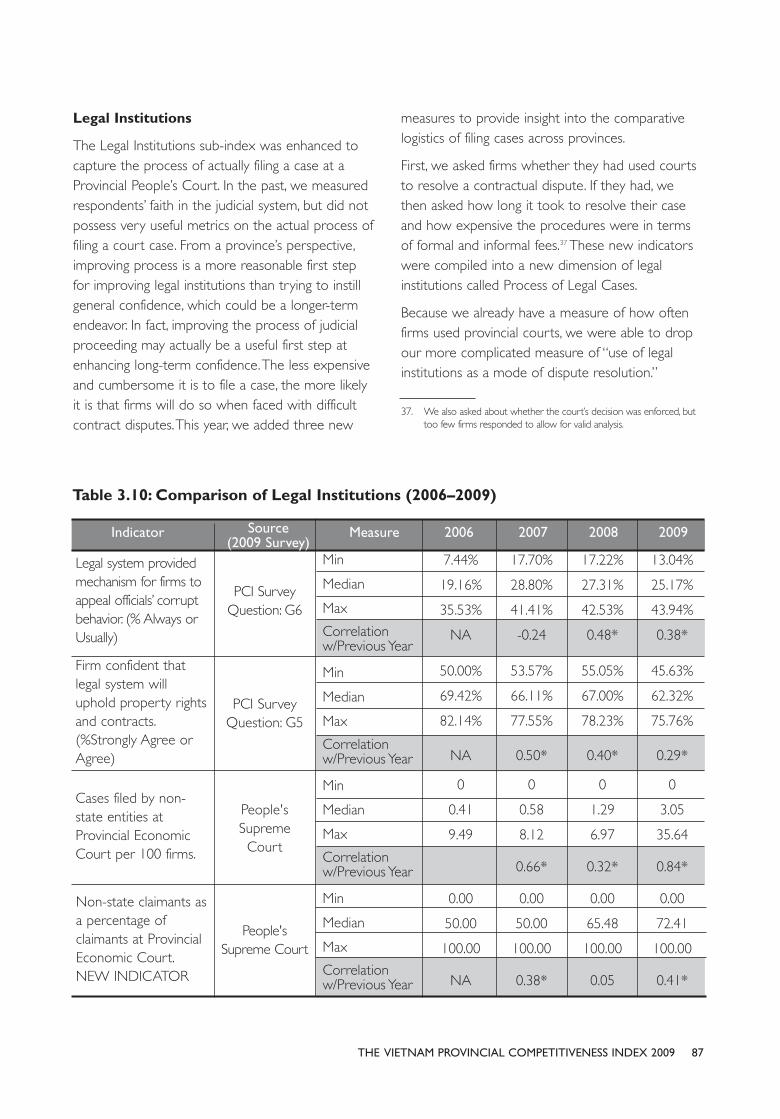
87THE VIETNAM PROVINCIAL COMPETITIVENESS INDEX 2009
Legal Institutions
The Legal Institutions sub-index was enhanced tocapture the process of actually filing a case at aProvincial People’s Court. In the past, we measuredrespondents’ faith in the judicial system, but did notpossess very useful metrics on the actual process offiling a court case. From a province’s perspective,improving process is a more reasonable first stepfor improving legal institutions than trying to instillgeneral confidence, which could be a longer-termendeavor. In fact, improving the process of judicialproceeding may actually be a useful first step atenhancing long-term confidence. The less expensiveand cumbersome it is to file a case, the more likelyit is that firms will do so when faced with difficultcontract disputes. This year, we added three new
measures to provide insight into the comparativelogistics of filing cases across provinces.
First, we asked firms whether they had used courtsto resolve a contractual dispute. If they had, wethen asked how long it took to resolve their caseand how expensive the procedures were in termsof formal and informal fees.37 These new indicatorswere compiled into a new dimension of legalinstitutions called Process of Legal Cases.
Because we already have a measure of how oftenfirms used provincial courts, we were able to dropour more complicated measure of “use of legalinstitutions as a mode of dispute resolution.”
37. We also asked about whether the court’s decision was enforced, buttoo few firms responded to allow for valid analysis.
PCI SurveyQuestion: G6
PCI SurveyQuestion: G5
People'sSupremeCourt
Min
Median
Max
Correlationw/Previous Year
Min
Median
Max
Correlationw/Previous Year
Min
Median
Max
Correlationw/Previous Year
Min
Median
Max
Correlationw/Previous Year
7.44%
19.16%
35.53%
NA
50.00%
69.42%
82.14%
NA
0
0.41
9.49
0.00
50.00
100.00
NA
17.70%
28.80%
41.41%
-0.24
53.57%
66.11%
77.55%
0.50*
0
0.58
8.12
0.66*
0.00
50.00
100.00
0.38*
17.22%
27.31%
42.53%
0.48*
55.05%
67.00%
78.23%
0.40*
0
1.29
6.97
0.32*
0.00
65.48
100.00
0.05
13.04%
25.17%
43.94%
0.38*
45.63%
62.32%
75.76%
0.29*
0
3.05
35.64
0.84*
0.00
72.41
100.00
0.41*
Indicator Source (2009 Survey)
Measure 2006 2007 2008 2009
Legal system providedmechanism for firms toappeal officials’ corruptbehavior. (% Always orUsually)
Firm confident thatlegal system willuphold property rightsand contracts.(%Strongly Agree orAgree)
Cases filed by non-state entities atProvincial EconomicCourt per 100 firms.
People'sSupreme Court
Non-state claimants asa percentage ofclaimants at ProvincialEconomic Court.NEW INDICATOR
Table 3.10: Comparison of Legal Institutions (2006–2009)

88 THE VIETNAM PROVINCIAL COMPETITIVENESS INDEX 2009
GeneralDepartment of
VocationalTraining
Ministry ofLabor, Invalids
and SocialAffairs:
General LaborDepartment
GeneralStatistical
Office
Min
Median
Max
Correlationw/Previous Year
Min
Median
Max
Correlationw/Previous Year
Min
Median
Max
Correlationw/Previous Year
Min
Median
Max
Correlationw/Previous Year
47.51
94.82
208.87
30.58
64.4
138.89
0.56*
13.33
46.13
82.88
0.38*
4.76%
23.33%
44.83%
NA
1.00
6.00
19.71
NA
3.09
12.21
60.00
NA
DROPPED
Indicator Source (2009 Survey)
Measure 2006 2007 2008 2009
Business used courts orother legal institutionsto resolve disputes. (%)NEW INDICATOR
Median days to resolvecourt cases. NEWINDICATOR
Median formal andinformal costs as apercentage of case.NEW INDICATOR
PCI Survey 2008:Questions F10:
[6*F10.1(if Court)+ 4*F10.2(if Court)+ 2*F10.3(if Court)
+ 3*F10.1(ifProvincial
Gov.)+2*F10.2(ifProvincial
Gov.)+1*F10.3(ifProvincial Gov.)]
Use of legalinstitutions as primarymodes of disputeresolution.
Notes: * Significant at 5% level; NA = not applicable. All values are at the provincial level. Legal sub-index did not exist in 2005.

89THE VIETNAM PROVINCIAL COMPETITIVENESS INDEX 2009
Figure 3.11: Legal Institutions Sub-Index 2009
Notes: Confidence in legal institutions measures firm perceptions of the level of protection afforded by provincial courts; process of legal casesprobes the costs and waiting periods of actually filing a case; hard data measures the actual use of provincial courts by private businesses.

90 THE VIETNAM PROVINCIAL COMPETITIVENESS INDEX 2009
Changing the Weighting StrategyAlthough we were satisfied from a technicalstandpoint with the use of factor analysis to derivethe weights, a number of readers found the strategyopaque. Factor scores, unlike regression coefficients,cannot be directly interpreted and understood inunits of the outcome variables that provincial officialscare about.
This year we moved to a weighting strategy that isvery similar in its motivation but uses an approachthat is more intuitive. Once again, we selected threeoutcome variables that are critically important formonitoring private sector development (privateenterprises per 1,000 citizens, investment per capita,and profit per enterprise). We regressed these oneach sub-index, controlling for structural factors(population density, surface area, distance from HaNoi or HCMC in kilometers), infrastructure(measured by the percentage of paved road in theprovince), and dummy (dichotomous) variables forthe seven regions of Vietnam.
Using regional dummy variables enables us to holdcultural, socioeconomic, and structural factors thatare region-specific constant, so we can focus just onthe differences in governance among provinces. Inessence, we are able to remove the variance inprivate sector outcomes accounted for by the uniquedifficulties faced by provinces in Northwest Vietnamand Mekong Delta, as well as the special advantagesof provinces in the North Southeast. This allows us toisolate the size of the relationship we care aboutmost—the direct association between each sub-index of governance quality and our outcomevariables. The t-values from these regressions (seeTable 1.3) were taken for each sub-index (Columns1, 3, 5). Using the size of the t-value is an intuitivesubstitute for the factor scores because it includesthe size of the substantive effect (measured by theregression coefficient) but standardized by thevariance around that point prediction (as measuredby the standard error). As a result, sub-indices thatreceive higher weights are those that have large andstatistically significant correlations with the threeoutcome variables.
For instance, all else equal, a one-unit improvement intransparency is associated with a 13 percentimprovement in the number of enterprises per10,000 citizens, a 17 percent improvement ininvestment per capita, and a 62 million VND increase
in profit per enterprise. All of these point predictionsare statistically significant at the 0.1 level or above,indicating that the correlations are not spurious andthat we can be fairly confident that if we were torepeat the PCI exercise again, we would receive verysimilar results. By contrast, the substantive impact inthe improvement of land is not statistically differentfrom zero, indicating that access to land, whileimportant for national development, is not asignificant determinant of the differential variance inbusiness performance among provinces. It isimportant to note that a one-unit change in eachsub-index is directly comparable, because all sub-indices are scaled from 1 to 10 and, therefore, a one-unit shift represents a 10 percent improvement inthe score.
Using t-values in this manner eliminates one possibleconcern. It is possible that a particular sub-index mayhave a large coefficient that is not statisticallysignificant because the standard error around theprediction is quite large. Large standard errors resultfrom a variety of factors, including measurementerror, outliers, and omitted variable bias. When acoefficient is big, but a standard error is also large, it isimportant to be careful about inferring too muchfrom that regression result. The relationship maysimply be accidental; repeated samples of businessesin Vietnam would reveal vastly different substantiveeffects. By using the t-value, we take the size of thecoefficient net of the standard error and, therefore,eliminate the possibility that accidental correlationsdrive our weightings.
Table 3.11 demonstrates how we took the individualt-values for each sub-index, summed them up, andcalculated the share of statistically significant variancein a particular outcome variables accounted for by aone-unit change in each sub-index. Becausetransparency and labor have the largest coefficients inthe regressions for enterprises per capita, theyaccount for the largest share. Columns 2, 4, and 6show that different sub-indices are relatively more orless important for each outcome variable. Finally, wecalculated the average share of t-values for eachregression (Column 7). This number is rounded toserve as the weight in the final PCI.38
38. Before employing the new method, we replicated all findings withthe old weighting method. After we were convinced that theapproach did not significantly alter the final index, we decided tomake the change.

91THE VIETNAM PROVINCIAL COMPETITIVENESS INDEX 2009
Tabl
e 3.
11: E
xpan
atio
n of
App
roac
h to
Sub
-Inde
x Wei
ghtin
g
1En
try
2La
nd
3Tr
ansp
aren
cy
4Ti
me
5In
form
al C
harg
es
7Pr
oact
ivity
8BS
S
9La
bor
10Le
gal
Res
pons
e D
ate
14.7
9%
-0.0
8%
24.7
8%
10.6
9%
4.02
%
2.59
%
19.2
1%
28.6
1%
-4.6
1%
100%
Shar
e
(2)
1.80
-0.0
1
3.01
1.30
0.49
0.31
2.33
3.48
-0.5
6
12.1
5
T-Va
lue
(1)
Ent
erpr
ises
per
Cap
ita
Inve
stm
ent
per
Cap
ita
Pro
fit p
er E
nter
pris
eF
inal
Wei
ght
Shar
e
(4)
T-Va
lue
(3)
Shar
e
(6)
Ave
rage
Sha
re
(7)
T-Va
lue
(5)
2.13
0.39
1.94
2.94
1.68
2.34
2.25
4.07
1.24
18.9
9
0.35
0.64
3.02
2.01
1.75
2.75
-1.3
5
1.25
2.01
12.4
3
2.81
%
5.14
%
24.3
2%
16.1
8%
14.1
1%
22.1
3%
-10.
90%
10.0
5%
16.1
7%
100%
9.61
%
2.37
%
19.7
7%
14.1
2%
9.00
%
12.3
6%
6.71
%
20.0
3%
6.04
%
100%
11.2
4%
2.06
%
10.2
2%
15.4
9%
8.86
%
12.3
5%
11.8
2%
21.4
2%
6.54
%
100%
To c
alcu
late
wei
ghts
eac
h ou
tcom
e va
riabl
e w
as r
egre
ssed
on
each
sub
-inde
x, c
ontr
ollin
g fo
r st
ruct
ural
fact
ors
(pop
ulat
ion
dens
ity, s
urfa
ce a
rea,
dist
ance
from
Han
oi o
r H
o C
hi M
inh
CIty
in k
ilom
eter
s), i
nfra
stru
ctur
e (m
easu
red
by t
he p
erce
ntag
e of
pav
ed r
oad
in t
he p
rovi
nce)
, and
dum
my
varia
bles
for
the
7 re
gion
s of
Vie
tnam
(kn
own
as r
egio
nal f
ixed
effe
cts)
. The
t-v
alue
sfro
m t
hese
reg
ress
ions
, whi
ch a
re c
alcu
late
d by
div
idin
g th
e co
effic
ient
by
the
stan
dard
err
or (
see
Tabl
e 1.
2), w
ere
take
n fo
r ea
ch s
ub-in
dex
(Col
umns
1, 3
, 5)
. T
his
tabl
e de
mon
stra
tes
how
the
sum
of
t-va
lues
fro
m e
ach
sub-
inde
x w
ere
take
n (b
otto
m r
ow o
f C
olum
ns 1
, 3, a
nd 5
).
Nex
t, w
e ca
lcul
ated
the
rel
ativ
e sh
are
each
sub
-inde
x ac
coun
ted
for
in t
he s
um o
f t-
valu
es(C
olum
s 2,
4, 6
). F
inal
ly, w
e ca
lcul
ated
the
ave
rage
sha
re o
f t-v
alue
s fo
r ea
ch r
egre
ssio
n (C
olum
n 7)
. Thi
s nu
mbe
r be
cam
e th
e tr
ue w
eigh
t fo
r th
e fin
al P
CI.

CHAPTER FOUR
APPENDICES

94 THE VIETNAM PROVINCIAL COMPETITIVENESS INDEX 2009
Mul
tiple
Reg
ress
ion
Ana
lysi
s of
Gov
erna
nce
and
Key
Priv
ate
Sect
or O
utco
me
Vari
able
s
0.05
6***
(0.0
16)
NO
4.07
6***
(0.8
76)
63
0.09
5
0.86
8
0.04
1***
(0.0
14)
0.00
1***
(0.0
00)
0.00
0**
(0.0
00)
-0.0
00
(0.0
00)
0.31
2
(0.3
19)
-0.0
51
(0.2
29)
NO
3.70
8***
(0.8
21)
63
0.59
1
0.60
9
0.04
0**
(0.0
16)
0.00
1***
(0.0
00)
0.00
0***
(0.0
00)
-0.0
00
(0.0
00)
0.23
0
(0.3
31)
-0.0
34
(0.2
07)
0.01
3
(0.0
09)
NO
2.73
6***
(0.8
64)
63
0.60
0
0.60
8
0.02
8**
(0.0
11)
0.00
1***
(0.0
00)
0.00
0***
(0.0
00)
-0.0
02**
*
(0.0
00)
0.33
9
(0.3
86)
0.10
3
(0.1
96)
YES
4.15
6***
(0.6
65)
63
0.77
0
0.48
3
0.05
5***
(0.0
19)
NO
4.82
7***
(0.9
57)
63
0.11
0
0.79
1
0.04
5**
(0.0
20)
0.00
1***
(0.0
00)
0.00
0**
(0.0
00)
-0.0
00
(0.0
00)
0.41
1
(0.4
21)
0.35
6**
(0.1
59)
NO
4.31
2***
(1.0
67)
63
0.49
3
0.62
3
0.04
5**
(0.0
21)
0.00
1***
(0.0
00)
0.00
0**
(0.0
00)
-0.0
00
(0.0
00)
0.42
5
(0.4
66)
0.35
3**
(0.1
53)
-0.0
02
(0.0
15)
NO
4.48
0***
(1.0
24)
63
0.49
3
0.62
9
0.06
6***
(0.0
17)
0.00
1***
(0.0
00)
0.00
0
(0.0
00)
-0.0
00
(0.0
01)
-0.2
65
(0.4
17)
0.41
9***
(0.1
48)
YES
4.05
2***
(0.9
78)
63
0.65
8
0.54
1
19.5
04**
*
(5.4
76)
NO
-818
.370
***
(278
.913
)
63
0.18
2
209.
0
19.3
74**
*
(5.4
34)
0.13
4*
(0.0
69)
0.00
7
(0.0
10)
-0.1
09
(0.1
20)
-125
.482
(101
.669
)
-7.0
06
(63.
349)
NO
-815
.805
**
(310
.377
)
63
0.27
0
206.
0
19.9
14**
*
(5.1
87)
0.16
1**
(0.0
72)
0.00
6
(0.0
10)
-0.1
25
(0.1
20)
-96.
367
(108
.180
)
-13.
030
(70.
357)
-4.5
70
(3.1
57)
NO
-472
.705
(321
.144
)
63
0.28
7
205.
4
17.9
00**
*
(6.6
06)
0.08
6
(0.0
52)
0.00
7
(0.0
09)
-0.0
50
(0.1
50)
-204
.003
(140
.800
)
-14.
416
(63.
244)
YES
-582
.660
*
(337
.867
)
63
0.35
5
204.
9
Inde
pend
ent
Vari
able
s/D
epen
dent
Vari
able
s
Ente
rpri
ses
per
1,00
0 C
itize
ns 2
008
(ln)
OLS (1)
OLS (2)
Rob
ust
(3)
IV-2
SLS
(4)
OLS (5)
OLS (6)
Rob
ust
(7)
IV-2
SLS
(8)
OLS (9)
OLS
(10)
Rob
ust
(11)
IV-2
SLS
(12)
Inve
stm
ent
per
Cap
ita 2
008
(ln)
Prof
it pe
r En
terp
rise
200
8
Unw
eigh
ted
Prov
inci
alC
ompe
titiv
enes
s In
dex
2009
Popu
latio
n D
ensit
y (1
,000
s)
Surfa
ce A
rea
of P
rovi
nce
(squ
are
kilo
met
er)
Dist
ance
from
H
anoi
or
HC
MC
(km
)
% A
spha
lted
Road
s
Tele
phon
es p
er 1
,000
Citi
zens
(20
08)
% S
econ
dary
Sch
ool
Gra
duat
es
Regio
nal F
ixed
Effe
cts
Con
stan
t
Obs
erva
tions
R-sq
uare
d
Root
Mea
n Sq
uare
Err
or
Not
es: O
LS R
egre
ssio
n; R
obus
t st
anda
rd e
rror
s in
par
enth
eses
. ***
p<
0.01
, **
p<0.
05, *
p<
0.1;
ln in
dica
tes
natu
ral l
og t
aken
. Dum
my
deno
tes
dich
otom
ous
depe
nden
t va
riabl
es.
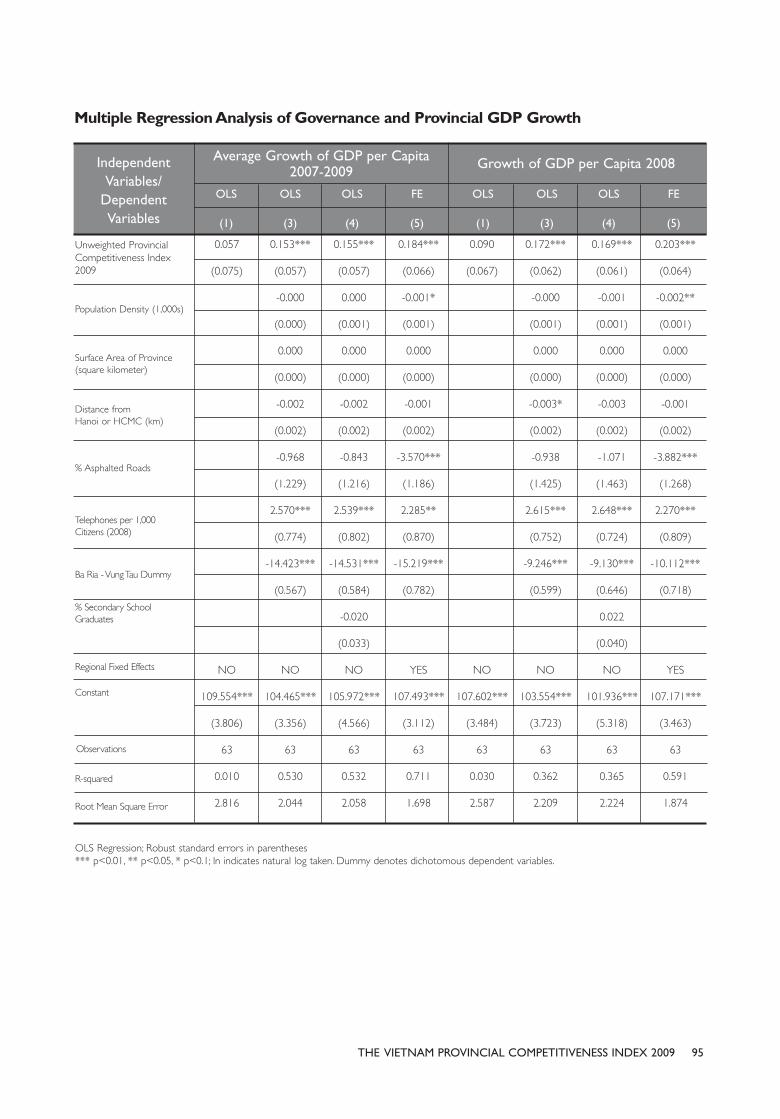
95THE VIETNAM PROVINCIAL COMPETITIVENESS INDEX 2009
Multiple Regression Analysis of Governance and Provincial GDP Growth
0.057
(0.075)
NO
109.554***
(3.806)
63
0.010
2.816
0.153***
(0.057)
-0.000
(0.000)
0.000
(0.000)
-0.002
(0.002)
-0.968
(1.229)
2.570***
(0.774)
-14.423***
(0.567)
NO
104.465***
(3.356)
63
0.530
2.044
0.155***
(0.057)
0.000
(0.001)
0.000
(0.000)
-0.002
(0.002)
-0.843
(1.216)
2.539***
(0.802)
-14.531***
(0.584)
-0.020
(0.033)
NO
105.972***
(4.566)
63
0.532
2.058
0.184***
(0.066)
-0.001*
(0.001)
0.000
(0.000)
-0.001
(0.002)
-3.570***
(1.186)
2.285**
(0.870)
-15.219***
(0.782)
YES
107.493***
(3.112)
63
0.711
1.698
0.090
(0.067)
NO
107.602***
(3.484)
63
0.030
2.587
0.172***
(0.062)
-0.000
(0.001)
0.000
(0.000)
-0.003*
(0.002)
-0.938
(1.425)
2.615***
(0.752)
-9.246***
(0.599)
NO
103.554***
(3.723)
63
0.362
2.209
0.169***
(0.061)
-0.001
(0.001)
0.000
(0.000)
-0.003
(0.002)
-1.071
(1.463)
2.648***
(0.724)
-9.130***
(0.646)
0.022
(0.040)
NO
101.936***
(5.318)
63
0.365
2.224
0.203***
(0.064)
-0.002**
(0.001)
0.000
(0.000)
-0.001
(0.002)
-3.882***
(1.268)
2.270***
(0.809)
-10.112***
(0.718)
YES
107.171***
(3.463)
63
0.591
1.874
IndependentVariables/
DependentVariables
Average Growth of GDP per Capita2007-2009
OLS
(1)
OLS
(3)
OLS
(4)
FE
(5)
OLS
(1)
OLS
(3)
OLS
(4)
FE
(5)
Growth of GDP per Capita 2008
Unweighted ProvincialCompetitiveness Index2009
Population Density (1,000s)
Surface Area of Province(square kilometer)
Distance from Hanoi or HCMC (km)
% Asphalted Roads
Telephones per 1,000Citizens (2008)
Ba Ria - Vung Tau Dummy
% Secondary SchoolGraduates
Regional Fixed Effects
Constant
R-squared
Root Mean Square Error
Observations
OLS Regression; Robust standard errors in parentheses*** p<0.01, ** p<0.05, * p<0.1; ln indicates natural log taken. Dummy denotes dichotomous dependent variables.

96 THE VIETNAM PROVINCIAL COMPETITIVENESS INDEX 2009
DATASETS USED IN ANALYSIS
Association for Small and Medium Size Enterprise Development (ASMED) for Circular 05 DraftingCommittee: 2008. Report on Implementation of the One Stop Shop for Business Registration, TaxRegistration, and Stamps and Licenses for business establishment in accordance with the Enterprise Law. HaNoi, Viet Nam.
General Department of Vocational Training. 2005-2007. Central and Local Vocational Training Centers. Hanoi,Vietnam.
General Statistical Office (GSO). 1995-2007. Statistical Handbook. Hanoi: Statistical Publishing House.
GSO. 1995-2005. The Real Situation of Enterprises Through the Results of Surveys Conducted in 2001, 2002,2003, 2004, 2005, and 2006. Hanoi: Statistics Publishing House.
Labor Exchange Bureau. 2008. Number of Labor Exchange Centers in Provinces. Hanoi, Vietnam.
Ministry of Labor, Invalids, and Social Affairs (MOLISA). 2007. Statistical Yearbook of Invalids and Social Affairs.Hanoi: Labor-Social Publishing House. http://www.molisa.gov.vn/
Ministry of Planning and Investment (MPI). 1995-2008. Registered Firms and Capital. Hanoi, Vietnam.
Ministry of Finance (MOF). 2008. Land Prices in Provincial Capitals. Hanoi, Vietnam.
Ministry of Natural Resources and the Environment (MONRE). 2008. Total Available Land and Land withLand Use Rights Certificate. Hanoi, Vietnam.
Ministry of Trade (MOT). 2006. Trade Fairs in 2007 and Planned for 2008. Hanoi, Vietnam.
People’s Supreme Court (PSC). 2005, 2006& 2007. Cases Held in Provincial Economic Courts. Hanoi,Vietnam.
“The Vietnam Provincial Competitiveness Index: Measuring Economic Governance for Private SectorDevelopment.” US AID’s Vietnam Competitiveness Inititative, Hanoi.
2007 Final Report, Vietnam Competitiveness Initiative Policy Paper #12
2006 Final Report, Vietnam Competitiveness Initiative Policy Paper #11
2005 Final Report, Vietnam Competitiveness Initiative Policy Paper #4

Publishing licence No: 14-QÀLK/LÀ and ÀK KHXB: 15-02/LÀ issued on 08 January 2010
Designed by: Golden Sky Co., Ltd. Tel/Fax: 84-43-8634030 Email: [email protected]

USAID/VNCIUnit 02, 15th floor, Prime Centre Building
53 Quang Trung street, Hanoi, Vietnam
Tel: (84-4) 3943-8163
Fax: (84-4) 3943-8160
www.vnci.org
VCCIInternational Trade Centre
9 Dao Duy Anh, Hanoi, Vietnam
Tel: (84-4) 3574-2022
Fax: (84-4) 3574-2020
www.vcci.com.vn
U.S Agency for International DevelopmentUSAID/Vietnam
Tung Shing Square Tower Building,
15th Floor, 2 Ngo Quyen Street
Hanoi, Vietnam
Tel : (84-4) 3935-1260
Fax : (84-4) 3935-1176
www.usaid.gov