the vanishing budget surplus: interpreting cbo's new ... · the vanishing budget surplus:...
TRANSCRIPT

1
The Vanishing Budget Surplus:Interpreting CBO's New Projections and Fiscal Prospects
William G. Gale and Peter R. Orszag1
Brookings InstitutionAugust 29, 2002
I. Introduction
The official federal budget outlook has deteriorated dramatically since January 2001.
The same period has also witnessed increasing recognition that the official budget projections
provide a faulty measure of the nation’s underlying fiscal situation. Recent corporate scandals
have heightened concern that misleading accounting data can substantially misrepresent an
entity's financial health; although federal budget figures are clearly not intentionally fraudulent,
as appears to have been the case in some corporate settings, the basic concern about the accuracy
of budget figures is relevant to the federal government. With these issues in mind, this paper
examines the current budget outlook, the sources of changes in the outlook since January 2001,
and adjustments to the official data that more accurately reflect the government's financial status.
We report three sets of conclusions:
• First, the Congressional Budget Office (CBO 2002b) now projects a 10-year baseline
surplus of $1 trillion. These projections also show that outside the Social Security Trust
Funds, the budget has a deficit of $1.5 trillion over the next 10 years; omitting the
Medicare Hospital Insurance Trust Fund as well, the deficit amounts to $1.9 trillion.
These figures represent astonishingly large declines from the forecasts made just 20
months ago. The projected outcome for the fixed time period of 2002 to 2010
deteriorated on a unified budget basis from a surplus of $4.7 trillion in January 2001 to
essentially zero ($13 billion) in August 2002. The projected outcome for 2002 alone
changed by $470 billion, from a surplus of $313 billion in January 2001 to a deficit of
1 Gale is the Arjay and Frances Fearing Miller Chair and Deputy Director in the Economic Studies Program. Orszagis the Joseph A. Pechman Senior Fellow in the Economic Studies Program. The authors are responsible for anyerrors and omissions. The opinions expressed should not be attributed to the trustees, officers, or staff of theBrookings Institution. The authors thank Manijeh Azmoodeh and David Gunter for research assistance.
2
$157 billion in August 2002.
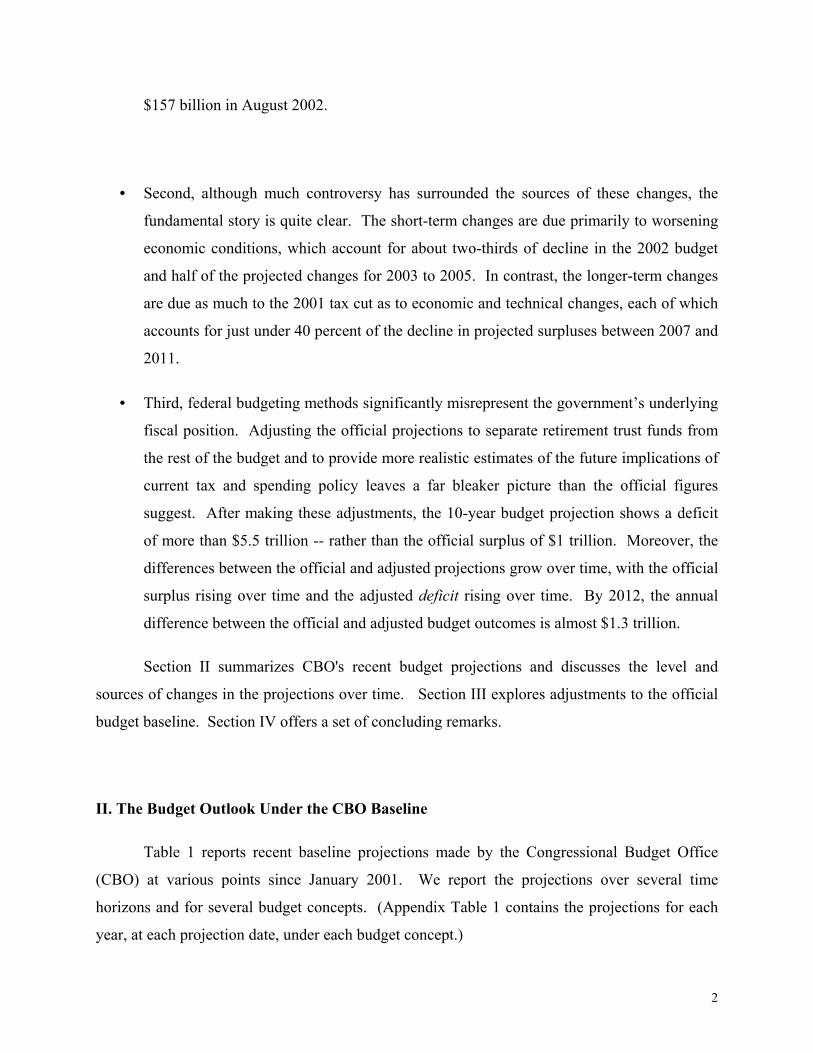
• Second, although much controversy has surrounded the sources of these changes, the
fundamental story is quite clear. The short-term changes are due primarily to worsening
economic conditions, which account for about two-thirds of decline in the 2002 budget
and half of the projected changes for 2003 to 2005. In contrast, the longer-term changes
are due as much to the 2001 tax cut as to economic and technical changes, each of which
accounts for just under 40 percent of the decline in projected surpluses between 2007 and
2011.
• Third, federal budgeting methods significantly misrepresent the government’s underlying
fiscal position. Adjusting the official projections to separate retirement trust funds from
the rest of the budget and to provide more realistic estimates of the future implications of
current tax and spending policy leaves a far bleaker picture than the official figures
suggest. After making these adjustments, the 10-year budget projection shows a deficit
of more than $5.5 trillion -- rather than the official surplus of $1 trillion. Moreover, the
differences between the official and adjusted projections grow over time, with the official
surplus rising over time and the adjusted deficit rising over time. By 2012, the annual
difference between the official and adjusted budget outcomes is almost $1.3 trillion.
Section II summarizes CBO's recent budget projections and discusses the level and
sources of changes in the projections over time. Section III explores adjustments to the official
budget baseline. Section IV offers a set of concluding remarks.
II. The Budget Outlook Under the CBO Baseline
Table 1 reports recent baseline projections made by the Congressional Budget Office
(CBO) at various points since January 2001. We report the projections over several time
horizons and for several budget concepts. (Appendix Table 1 contains the projections for each
year, at each projection date, under each budget concept.)

3
Although all of the projections since January 2001 include all of the years from 2002 to
2011, the most useful fixed period for consistent analysis is the nine-year period from 2002 to
2010. (The reason that this period is the most useful for examining the official projections is that
under current law, the 2001 tax cut expires at the end of 2010. This sunset ostensibly causes a
substantial increase in projected tax revenues in 2011, but that increase is extremely unlikely to
occur precisely as currently legislated.) Between January 2001 and August 2002, the projected
unified surplus for 2002 to 2010 fell by 99.7 percent, from $4.7 trillion to $13 billion. Most of
the decline is concentrated in the non-Social Security, non-Medicare part of the budget, where a
projected surplus of $2.2 trillion in January 2001 switched to a projected deficit of $2.3 trillion
by August 2002. The decline is fairly uniform across the decade -- the projected unified surplus
for 2002 to 2006 fell by $2.4 trillion, while the projection for 2007 to 2010 fell by about $2.3
trillion -- even though the relative importance of the factors explaining the decline change
markedly across the decade.
Figure 1 shows the unified budget projections on an annual basis. In January 2001, the
projections showed surpluses in excess of $300 billion annually in 2002 and 2003, with rising
surpluses through the rest of the decade. By January 2002, the surpluses projected for 2002 and
2003 had disappeared, and those projected for subsequent years declined by roughly $300
billion. The official August 2002 CBO projections now suggest that the unified budget will be in
deficit until 2006. Concerns about eliminating the public debt too quickly – which had played a
prominent role in justifying last year’s tax cut – seem quaint just a year-and-a-half later (Gale
and Potter 2002). All of the surpluses in Figure 1 rise after 2010 because of the scheduled
expiration of the 2001 tax cut.
Figure 2 shows that the non-Social Security budget was projected in January 2001 to run
surpluses between $124 billion and $558 billion annually through 2011. By August 2002, these
projections had turned to deficits in every year through 2010. Figure 3 shows that the August
2002 baseline budget outside of Social Security and Medicare is projected to be in deficit
through 2011, returning to surplus only in 2012 and only because of the assumption that the tax
cut will be terminated.
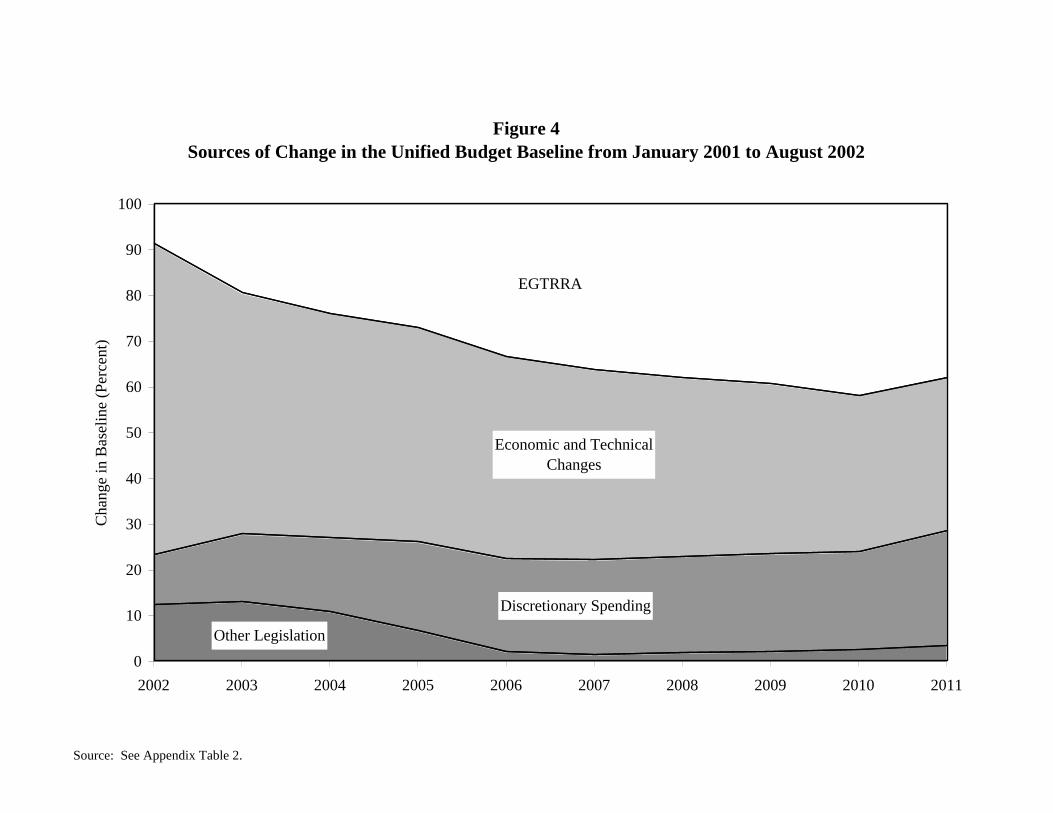
Table 2 examines the sources of the decline in projected unified budget outcomes. Of the

4
$5.3 trillion decline in the cumulative 2002-11 projected surplus, about $1.65 trillion is due to
last year's tax cut, the Economic Growth and Tax Relief Reconciliation Act of 2001 (EGTRRA),
including the additional interest on induced increases in federal debt.2 About $2.3 trillion arises
from economic and technical changes, while $1.3 trillion is attributable to increased spending,
primarily defense and homeland security outlays in the aftermath of the terrorist attacks.
Figure 4 and Appendix Table 2 show similar figures on annual basis. The decline in the
budget surplus over the next few years is due predominantly to economic and technical changes,
which in turn are due chiefly to the economic slowdown. In later years, however, these changes
decline in importance as EGTRRA phases in more completely. Thus, in the second half of the
decade, last year’s tax cut accounts for 39 percent of the decline in surplus since January 2001,
slightly more than the economic and technical changes. In 2010, just before it sunsets, the tax
cut accounts for 42 percent of the decline in the surplus, compared to just 34 percent for
economic and technical changes.
III. Adjustments to the Budget Outlook
The CBO baseline is intended to serve as a “neutral benchmark....constructed according
to rules [that are] set forth in law and long-standing practices and are designed to project federal
revenues and spending under the assumptions that current laws and policies remain unchanged”
(CBO 2002a, p. xiii). These rules and practices, however, are not necessarily the most useful or
appropriate choices if one wishes to gauge the government’s underlying fiscal condition or to
estimate the funds that might reasonably be considered available to finance tax cuts or new
spending initiatives.3 We focus on two issues: the treatment of retirement trust funds and
assumptions about how spending and tax policy will evolve.
The baseline generally uses cash-flow accounting to measure the costs of programs. This
2 This figure includes only the revenue losses, outlay increases and debt services costs that occur within the 2002 to2011 time period. It omits the direct revenue losses due to the tax cuts that occurred in 2001, but includes theinterest costs on those tax cuts in subsequent years.
3 To be perfectly clear, these rules are imposed on CBO by Congress. Thus, criticism of the rules in no way impliescriticism of the CBO, but rather of the circumstances under which the agency is required to operate. Indeed, CBOhas been in the forefront of pointing out the incongruities and uncertainties inherent in current budget practices.

5
is inconsistent with the accounting treatment of private pensions and can provide a distorted view
of a program’s viability, particularly during a demographic transition to an increased dependency
ratio. For example, trust funds for Social Security and Medicare’s Hospital Insurance program
will run substantial cash-flow surpluses over the next decade, but substantial deficits over longer
horizons.4 Likewise, trust funds holding pension reserves for federal military and civilian
employees are projected to run significant cash-flow surpluses over the next 10 years (Appendix
Table 3).
A more useful accounting approach would reflect both the accruing contributions and the
ultimate liabilities of retirement programs. This is possible in a cash-flow framework only if the
time horizon is extended beyond 10 years and the flows of different years are combined (see
Auerbach, Gale and Orszag 2002 for one such calculation). But since the ten-year horizon has
been standard practice for the last several years, it is also worthwhile to consider less extensive
retirement trust fund adjustments that are possible within that window. Given that the ten-year
window precludes adding future liabilities to the budget, it is less misleading to exclude the
retirement programs altogether than to include only the accruing contributions. For Social
Security, this logic is already codified in its off-budget status. But the logic applies with equal
force to the other retirement programs and we employ this adjustment below.5
The second problem with the baseline involves the manner in which it projects revenues
and outlays. A variety of statutory requirements, which may be at variance with reasonable
expectations, define “current policy.” On the spending side, the main issue involves
discretionary spending. Because discretionary outlays require appropriations every year,
judgments may reasonably differ about the extent to which current spending choices determine
future spending. As required by law, the CBO projections assume that real discretionary
spending authority will remain constant over the budget period at the level prevailing in the first 4 See Table 1 above, Board of Trustees, Federal Old Age and Survivors Insurance and Disability Insurance TrustFunds (2002), and Board of Trustees, Federal Hospital Insurance Trust Fund (2002).
5 This economic logic may help explain the significant, bipartisan political support for the notion that retirementtrust funds ought to be kept separate from the rest of the budget. Both Houses of Congress voted overwhelmingly in2000 to support measures that protected the Medicare Hospital Insurance trust fund from being used to finance otherprograms or tax cuts (Mohr 2001). A recent legislative proposal would provide similar protection to militarypensions (U. S. House of Representatives 2001). Almost all states already separate pension reserves from theiroperating budgets.

6
year. This assumption implies that discretionary spending will fall by about 20 percent relative
to GDP and by about 9 percent in real per capita terms by 2012. In a growing economy with
expanding defense needs and other concerns, such an assumption seems to be a particularly
unrealistic projection. It would be somewhat more reasonable for real discretionary spending to
grow with the population, to maintain current services on a per-person basis.6 An alternative--
and in light of recent expenditure growth, perhaps even more realistic--baseline would let
discretionary spending grow with GDP.7 In this paper, we follow the latter assumption, but the
results would not change significantly if we assumed that real discretionary spending per capita
were held constant.
On the revenue side, two broad issues merit consideration. The first concerns expiring
provisions. Although temporary spending programs are assumed to be permanent in budgetary
projections, statutory rules require that all temporary tax provisions (other than excise taxes
dedicated to trust funds) be treated as if they expire as scheduled. There are now three broad sets
of expiring tax provisions in the tax code: the “sunset” provisions in EGTRRA; the 2002
economic stimulus package; and an array of “garden variety” provisions.
Under current law, all of the provisions of EGTRRA that had not already phased out by
the end of 2010 “sunset” at that time, and the tax code reverts to what it would have been had the
tax bill never existed. For example, at the beginning of 2010, EGTRRA repeals the estate tax.
At the end of 2010, the estate tax is re-established as if EGTRRA had never existed. The sunset
provisions complicate analysis of “current policy” toward taxation. Although CBO is required to
follow current law, virtually no one believes the tax provisions will sunset completely as
stipulated by EGTRRA. The Administration has indicated the expectation and desire that the tax
cuts be made permanent.8 But exactly when or which parts of the bill might be extended is
unclear. We assume that under “current policy,” the sunset provisions will be removed, and 6 Indeed, as a Presidential candidate, George W. Bush made the same point, arguing that an “honest comparison” ofspending growth should take inflation and population growth into account (Slater 1999, Calmes 1999).
7 In recent years, CBO has presented sensitivity analysis with a variety of alternative discretionary spending paths.
8 President Bush called for making the tax cuts permanent in his January 2002 State of the Union address (Bush2002). But even before the tax cut was signed, Treasury Secretary Paul O’Neill indicated that “All these things aregoing to become permanent. They’ll all be fixed.” (USA Today 2001). Lindsey (2002) refers to the tax cuts as“permanent.”

7
analyze the tax cut as if it were permanent.9
Likewise, we assume that the "garden variety" expiring provisions will be extended.10 In
the past, these provisions have been temporarily extended each time the expiration dates
approached. Indeed, CBO (2002a, p. 63) calls the extensions a “matter of course.”
The appropriate treatment of the stimulus package is less clear. A stimulus is presumably
designed to be a temporary policy, which suggests that allowing it to expire would be most
appropriate. On the other hand, the package expires a few months before the 2004 election,
which will create political pressure to extend it, and the proponents of the bill wanted a
permanent tax cut in the first place. For simplicity and consistency with the other expiring
provisions, we treat the stimulus package as a permanent tax cut. Altering this assumption
would not materially affect our conclusions.
The second tax issue relates to the alternative minimum tax (AMT). Designed in the late
1960s and then strengthened in 1986 to curb aggressive tax avoidance, the AMT operates
parallel to the regular income tax system, using alternative measures of income and deductions
and flatter rates. Taxpayers pay the AMT when their AMT liability exceeds their regular income
tax liability. In other cases, taxpayers pay regular income tax, but have their use of credits
limited due to the AMT. We refer to both groups as “on the AMT.”
The AMT is complex and has become poorly targeted: most taxpayers who face
the AMT do so because of the value of their personal exemptions or deductions for state and
local taxes, not because of aggressive tax sheltering. In 2002, about 2.6 million taxpayers—or
about 2.7 percent of those with positive tax liability—faced the AMT. But under current law, 36
million taxpayers -- including 33 percent of all filers and 79 percent of filers with adjusted gross
incomes between $75,000 and $100,000 -- will face the AMT in 2010 (Burman et al 2002). The
main reasons for the projected increase are that the AMT is not indexed for inflation and last
year's tax cut will steadily reduce regular income tax liabilities. Both factors raise AMT liability
9 Kiefer et al (2002) make a similar assumption. CBO (2001) makes the same assumption when it analyzes theeconomic effects of the tax cut, even though it cannot make that assumption when analyzing the budget projectionsthemselves.
10 These include, for example, the research and experimentation tax credit, which is due to expire on June 30, 2004,the Work Opportunity Tax Credit, the Welfare-to-Work Tax Credit, and a variety of other items.

8
relative to regular income tax liability and so push more taxpayers onto the AMT over time. No
one seriously expects the Administration and Congress to allow current law to prevail with
respect to the AMT. We therefore define “current policy” towards the AMT as holding constant
at 3 percent the share of taxpayers facing the AMT. We regard this as a reasonable benchmark,
even if it will be politically difficult to implement given its budgetary cost, because it maintains
the share of taxpayers on the AMT at its level in 2002. We estimate the cost of the implied AMT
adjustments in Appendix Table 4.11
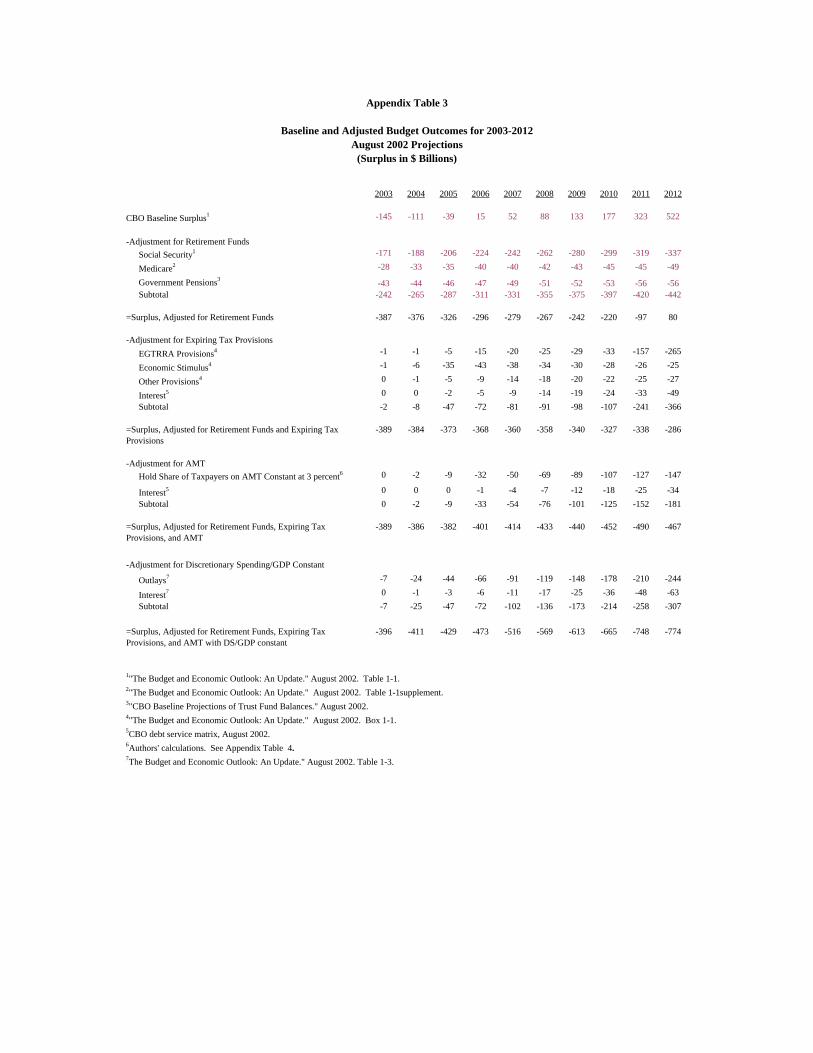
Table 3 shows the sizable effects of adjusting the surplus for retirement trust funds and
current policy assumptions. Removing the accumulations in retirement trust funds changes the
August 2002 projection for the budget between 2002 and 2011 from a surplus of $1.0 trillion to a
deficit of $2.4 trillion. Adjusting the revenue baseline to extend the expiring provisions and hold
the share of AMT taxpayers at 3 percent increases the deficit by another $1.85 trillion to $4.25
trillion. If discretionary spending grows with the economy, the deficit rises to almost $5.6
trillion.
The cost of keeping the number of AMT taxpayers at 3 percent is particularly
noteworthy: it has grown substantially in recent years and expands rapidly over the decade. The
total cost is $732 billion between 2003 and 2012, including $630 billion in lost revenue (Table
3), plus another $102 billion in interest payments.
Figure 5 shows the budget adjustments on an annual basis. Under the official forecasts,
the unified budget is in deficit through 2006 and then achieves surpluses through 2012. Our
adjustments alter both the level and trend. Removing the retirement trust funds reduces the
surplus by an amount that rises steadily from about $240 billion in 2002 to about $440 billion in
2012. Adjusting the revenue figures as described above essentially makes the projection turn
down over time (and in particular, it eliminates the jump in revenues in 2011 and 2012
associated with the expiration of the tax cut under current law), with adjusted deficits that range
from about $390 billion in 2002 to $460 billion in 2011. Allowing real discretionary spending to
11 To estimate the cost of reducing the AMT so as to keep the share of AMT taxpayers at 3 percent, we interpolatebased on results in Burman et al (2002). Burman et al report the cost of repealing the AMT (R1), the cost ofindexing the AMT (R2), and the percent of taxpayers on the AMT under indexing (x). Using these figures, therevenue cost of reducing the number of AMT taxpayers to y percent can be interpolated as R3 = R2 + (R1-R2) (x-3)/x. We add debt service costs to each of the revenue figures, using CBO’s debt service matrix.

9
increase in line with GDP not only expands the projected deficits, but causes them to grow larger
over the decade, reaching $774 billion by 2012.
After making all these adjustments, the contrast between the official and adjusted figures
is striking – and increases over time. In the year 2012 alone, the difference is about $1.3 trillion
(assuming discretionary spending grows with GDP). Perhaps more importantly, the trends are
quite different: the CBO baseline suggests that the underlying fiscal status of the government
will improve over the coming decade, whereas the adjusted baseline suggests precisely the
opposite.
Figure 6 reports the same adjustments, except that it does not remove the retirement trust
funds from the analysis. Thus, Figure 6 reports the unified budget surplus under different
assumptions about current policy toward tax and spending. As shown, just extending the
expiring provisions and holding the share of taxpayers at 3 percent is sufficient to keep the
unified budget (which, of course, includes Social Security trust funds) in deficit for every year in
the forecast period. Adjustments for discretionary spending imply that the deficit will increase,
rising from about $150 in 2003 to about $330 billion in 2012.
IV. Conclusions
The official baseline budget surpluses have deteriorated rapidly over the past 20 months.
The budget through 2010 essentially projects a cumulative unified surplus of zero. Worse still,
that cumulative sum consists of relatively certain deficits occurring in the near term and
relatively uncertain surpluses occurring further in the future. Declining economic conditions
account for the largest share of the immediate downturn, but toward the end of the decade, the
2001 tax cut has the biggest impact on the change in the surplus projections.
The official baseline seems to be a particularly biased measure of fiscal status under
current conditions because of the sunsets embodied in EGTRRA and the stimulus package; the
looming AMT explosion; uncertainty about the course of defense, homeland security, and other
discretionary spending; and the large role played by retirement trust funds in the budget.
Plausible adjustments for these factors suggest that, as bad as the official projections have

10
become, the underlying reality is significantly worse.
These facts imply that the nation is facing a growing and complicated mix of economic,
fiscal, and political problems that will not go away unless policy makers act responsibly and
promptly. The budget is in free fall. The budget process has collapsed. The economy could
potentially benefit from a short-term fiscal stimulus (i.e., increased budget deficits now), and
would also benefit from long-term fiscal discipline (i.e, a return to surpluses in the medium- and
long-term). Yet such a combination is virtually impossible to imagine as long as the parties are
stuck in a political stalemate.
One way out of the stalemate may be a budget summit between the leaders of the two
parties. A summit could produce a credible, bi-partisan plan that jointly addresses the difficult
trade-offs inherent in restoring fiscal discipline. The plan would need a scheduled transition
from short-term stimulus to long-term discipline, balanced adjustments to spending and taxes,
and a workable and plausible set of budget rules. The 1990 budget summit addressed similar
issues and helped set the stage for fiscal recovery and economic growth over the next decade.
If any additional motivation were required, policy makers can look to 2008, when the
leading edge of the baby boomer generation will reach age 62. The pressure that the boomers
will put on Social Security, Medicare, and the overall federal budget will make today’s budget
problems -- serious as they are -- look like child’s play.

11
References
Auerbach, Alan J., William G. Gale and Peter R. Orszag. "The Budget Outlook and Options forFiscal Policy." Tax Notes. June 10, 2002. 1639-62.
Board of Trustees, Federal Hospital Insurance Trust Fund. The 2001 Annual Report of the Boardof Trustees of the Federal Hospital Insurance Trust Fund. 2001.
Board of Trustees, Federal Old Age and Survivors Insurance and Disability Insurance TrustFunds. The 2001 Annual Report of the Board of Trustees of the Federal Old-Age and SurvivorsInsurance and Disability Insurance Trust Funds. 2001.
Burman, Leonard E., William G. Gale, Jeffrey Rohaly, and Benjamin H. Harris. “The IndividualAMT: Problems and Potential Solutions.” Urban-Brookings Tax Policy Center Discussion PaperNo. 5, September 2002. Forthcoming, National Tax Journal.
Bush, George W. “The President’s State of the Union Address.” January 29, 2002.
Calmes, Jackie. “In Debate on Spending, Forbes vs. Bush Resemble Bush vs. Richards, andBoth Sides May Be Right.” New York Times November 5, 1999: A20.
Congressional Budget Office. The Budget and Economic Outlook: An Update. August 2001.
Congressional Budget Office. The Budget and Economic Outlook: Fiscal Years 2003-2012.January 2002a.
Congressional Budget Office. The Budget and Economic Outlook: An Update. August 2002b.
Gale, William G. and Samara R. Potter. “An Economic Evaluation of the Economic Growth andTax Relief Reconciliation Act of 2001.” National Tax Journal 55 No. 1 (March 2002).
Kiefer, Donald, Robert Carroll, Janet Holtzblatt, Allen Lerman, Janet McCubbin, DavidRichardson, and Jerry Tempalski. “The Economic Growth and Tax Relief Reconciliation Act of2001: Overview and Assessment of Effects on Taxpayers.” National Tax Journal 55 No. 1:(March 2002).
Lindsey, Lawrence B. “Why We Must Keep the Tax Cut.” Washington Post (January 18,2002): A25.
Mohr, Patti. “House Passes Social Security and Medicare Lockbox Legislation.” Tax NotesFebruary 19, 2001. 981-83.
Slater, Wayne. “Bush Defends Fiscal Record, Scolds Forbes: His Ads on SpendingChallenged.” Dallas Morning News (October 28, 1999): 14A.
“Tax-Cut Gimmicks Portend Return to Deficit Spending.” USA Today (June 6, 2001): 14A.
U.S. House of Representatives. 107th Congress, 1st Session, H. RES. 23. January 30, 2001.

2003-2012 2002-2011 2002-2010 2002-2006Unified Budget
August 20022 1015 336 13 -437
January 20023 2263 1601 1162 250
August 20014 3396 2768 1082
January 20015 5610 4721 2007
Non-Social Security Budget
August 20022 -1513 -2015 -2019 -1386
January 20023 -242 -745 -877 -725
August 20014 844 561 46
January 20015 3119 2561 986
Non-Social Security, Non-Medicare Budget
August 20022 -1914 -2396 -2355 -1551
January 20023 -632 -1127 -1222 -912
August 20014 438 186 -162
January 20015 2727 2203 786
5Congressional Budget Office. "The Budget and Economic Outlook: Fiscal Years 2002-2011." January 2001. Tables 1-1 and 1-7.
Table 1
Changing Budget Projections
(Surplus in $ Billions)1
4Congressional Budget Office. "The Budget and Economic Outlook: An Update." August 2001. Tables 1-1 and 1-9.
2Congressional Budget Office. "The Budget and Economic Outlook: An Update." August 2002. Table 1-1 and Table 1-1 supplement.
1Due to rounding, annual data from Appendix Table 1 may not sum to the CBO totals listed in Table 1.
3Congressional Budget Office. "The Budget and Economic Outlook: Fiscal Years 2003-2012." January 2002. Tables 1-1 and 1-6.

EGTRRA -1655 31 -554 23 -1101 39
Discretionary Spending -1018 19 -399 16 -620 22
Other Legislation -279 5 -217 9 -62 2
Economic and Technical Changes -2321 44 -1274 52 -1047 37
Total -5274 100 -2444 100 -2829 100
2002-2011 2002-2006 2007-2011
Table 2
Sources of Change in Budget ProjectionsJanuary 2001-August 2002
Source: "Changes in CBO Baseline Projections of the Surplus Since January 2001." CBO, August 2002, and Appendix Table 2.
$ Billions
Percent of Change
$ Billions
Percent of Change
$ Billions
Percent of Change

2003-07 2003-12
-229 1015
Social Security1 -1031 -2527
Medicare2 -176 -399
Government Pensions3 -229 -497
Subtotal -1436 -3423
-1665 -2408
EGTRRA Provisions4 -42 -553
Economic Stimulus4 -123 -264
Other Provisions4 -29 -140
Interest5 -16 -154
Subtotal -210 -1111
-1875 -3519
Hold Share of Taxpayers on AMT Constant at 3 percent6 -92 -630
Interest5 -6 -102
Subtotal -97 -732
-1973 -4251
Outlays7 -233 -1131
Interest7 -21 -210
Subtotal -254 -1341
-2227 -5592
6Authors' calculations. See Appendix Table 4.7The Budget and Economic Outlook: An Update." August 2002. Table 1-3.
Table 3
Baseline and Adjusted Budget Outcomes for 2003-2012August 2002 Projections
(Surplus in $ billions)
CBO Baseline Surplus1
-Adjustment for Retirement Funds
=Surplus, Adjusted for Retirement Funds
2"The Budget and Economic Outlook: An Update." August 2002. Table 1-1 supplement.3"CBO Baseline Projections of Trust Fund Balances." August 2002. 4"The Budget and Economic Outlook: An Update." August 2002. Box 1-1.5CBO debt service matrix, August 2002.
-Adjustment for Discretionary Spending/GDP Constant
=Surplus, Adjusted for Retirement Funds, Expiring Tax Provisions, and AMT with DS/GDP constant
1"The Budget and Economic Outlook: An Update." August 2002. Table 1-1.
-Adjustment for Expiring Tax Provisions
=Surplus, Adjusted for Retirement Funds and Expiring Tax Provisions
-Adjustment for AMT
=Surplus, Adjusted for Retirement Funds, Expiring Tax Provisions, and AMT

2001 2002 2003 2004 2005 2006 2007 2008 2009 2010 2011 2012Unified Budget
August 20022 127 -157 -145 -111 -39 15 52 88 133 177 323 522
January 20023 127 -21 -14 54 103 128 166 202 250 294 439 641
August 20014 153 176 172 201 244 289 340 389 450 507 628
January 20015 281 313 359 397 433 505 573 635 710 796 889
Non-Social Security Budget
August 20022 -36 -317 -316 -299 -245 -209 -190 -174 -147 -122 4 185
January 20023 -36 -184 -193 -141 -108 -99 -76 -56 -24 4 132 319
August 20014 -10 0 -18 -3 20 47 78 106 147 184 283
January 20015 124 141 171 195 212 267 316 359 416 484 558
Non-Social Security, Non-Medicare Budget
August 20022 -65 -346 -344 -332 -280 -249 -230 -216 -191 -167 -41 136
January 20023 -65 -217 -229 -179 -146 -141 -117 -96 -63 -34 95 278
August 20014 -39 -38 -59 -45 -22 2 35 63 105 145 252
January 20015 95 105 132 154 172 223 275 318 377 447 524
Appendix Table 1
Changing Budget Projections
(Surplus in $ Billions)1
5Congressional Budget Office. "The Budget and Economic Outlook: Fiscal Years 2002-2011." January 2001. Tables 1-1 and 1-7.
4Congressional Budget Office. "The Budget and Economic Outlook: An Update." August 2001. Tables 1-1 and 1-9.
1Due to rounding, annual data from Appendix Table 1 may not sum to the CBO totals listed in Table 1.2Congressional Budget Office. "The Budget and Economic Outlook: An Update." August 2002. Table 1-1 and Table 1-1 supplement.3Congressional Budget Office. "The Budget and Economic Outlook: Fiscal Years 2003-2012." January 2002. Tables 1-1 and 1-6.

Legislative ChangesTotal -150.0 31.9 -238.6 47.3 -258.7 50.9 -250.5 53.0 -272.7 55.7 -303.9 58.4 -333.1 60.9 -362.5 62.8 -407.3 65.8 -375.8 66.4
EGTRRARevenues -31.3 -84.0 -100.7 -100.3 -125.6 -142.1 -150.7 -158.2 -175.9 -117.3Outlays -6.2 -6.6 -7.0 -7.1 -9.6 -9.5 -9.4 -9.7 -11.1 -12.2Debt Service -3.8 -8.5 -14.4 -20.7 -28.5 -37.8 -48.4 -60.0 -73.1 -85.7Subtotal -41.4 8.8 -99.1 19.7 -122.1 24.0 -128.1 27.1 -163.7 33.4 -189.5 36.4 -208.5 38.1 -227.8 39.5 -260.1 42.0 -215.2 38.0
Discretionary Spending -50.2 -72.0 -74.5 -78.6 -81.5 -84.1 -85.8 -87.1 -88.9 -91.3Debt service -0.3 -2.6 -7.7 -13.0 -18.2 -23.7 -29.7 -36.1 -42.9 -50.1Subtotal -50.5 10.8 -74.6 14.8 -82.2 16.2 -91.6 19.4 -99.7 20.3 -107.8 20.7 -115.5 21.1 -123.2 21.3 -131.8 21.3 -141.4 25.0
Other Legislation -57.2 -61.3 -46.7 -20.3 2.2 5.3 3.5 1.6 -1.6 -4.5Debt Service -0.9 -3.6 -7.7 -10.5 -11.6 -12.0 -12.6 -13.1 -13.8 -14.7Subtotal -58.1 12.4 -64.9 12.9 -54.4 10.7 -30.8 6.5 -9.4 1.9 -6.7 1.3 -9.1 1.7 -11.5 2.0 -15.4 2.5 -19.2 3.4
-319.9 68.1 -265.7 52.7 -249.4 49.1 -221.8 47.0 -217.1 44.3 -216.7 41.6 -213.7 39.1 -214.8 37.2 -211.7 34.2 -189.9 33.6
Total Change -469.9 100.0 -504.3 100.0 -508.1 100.0 -472.3 100.0 -489.9 100.0 -520.6 100.0 -546.8 100.0 -577.3 100.0 -619.0 100.0 -565.7 100.0
Appendix Table 2
$ Billions
2003 2010$
BillionsPercent of Change
2011$
BillionsPercent of Change
2009$
BillionsPercent of Change
Source: "Changes in CBO Baseline Projections of the Surplus Since January 2001." CBO, August 2002, and Appendix Table 2.
2007$
BillionsPercent of Change
2008$
BillionsPercent of Change
$ Billions
Percent of Change
2006$
BillionsPercent of Change
Sources of Change in Budget Projections, January 2001-August 2002
Economic and Technical Changes
2002$
BillionsPercent of Change
Percent of Change
2004$
BillionsPercent of Change
2005
2003 2004 2005 2006 2007 2008 2009 2010 2011 2012
-145 -111 -39 15 52 88 133 177 323 522
Social Security1 -171 -188 -206 -224 -242 -262 -280 -299 -319 -337
Medicare2 -28 -33 -35 -40 -40 -42 -43 -45 -45 -49
Government Pensions3 -43 -44 -46 -47 -49 -51 -52 -53 -56 -56Subtotal -242 -265 -287 -311 -331 -355 -375 -397 -420 -442
-387 -376 -326 -296 -279 -267 -242 -220 -97 80
EGTRRA Provisions4 -1 -1 -5 -15 -20 -25 -29 -33 -157 -265
Economic Stimulus4 -1 -6 -35 -43 -38 -34 -30 -28 -26 -25
Other Provisions4 0 -1 -5 -9 -14 -18 -20 -22 -25 -27
Interest5 0 0 -2 -5 -9 -14 -19 -24 -33 -49
Subtotal -2 -8 -47 -72 -81 -91 -98 -107 -241 -366
-389 -384 -373 -368 -360 -358 -340 -327 -338 -286
Hold Share of Taxpayers on AMT Constant at 3 percent6 0 -2 -9 -32 -50 -69 -89 -107 -127 -147
Interest5 0 0 0 -1 -4 -7 -12 -18 -25 -34
Subtotal 0 -2 -9 -33 -54 -76 -101 -125 -152 -181
-389 -386 -382 -401 -414 -433 -440 -452 -490 -467
Outlays7 -7 -24 -44 -66 -91 -119 -148 -178 -210 -244
Interest7 0 -1 -3 -6 -11 -17 -25 -36 -48 -63
Subtotal -7 -25 -47 -72 -102 -136 -173 -214 -258 -307
-396 -411 -429 -473 -516 -569 -613 -665 -748 -774
6Authors' calculations. See Appendix Table 4.7The Budget and Economic Outlook: An Update." August 2002. Table 1-3.
Baseline and Adjusted Budget Outcomes for 2003-2012August 2002 Projections
(Surplus in $ Billions)
=Surplus, Adjusted for Retirement Funds
-Adjustment for Expiring Tax Provisions
=Surplus, Adjusted for Retirement Funds and Expiring Tax Provisions
-Adjustment for Discretionary Spending/GDP Constant
Appendix Table 3
CBO Baseline Surplus1
-Adjustment for Retirement Funds
-Adjustment for AMT
=Surplus, Adjusted for Retirement Funds, Expiring Tax Provisions, and AMT
=Surplus, Adjusted for Retirement Funds, Expiring Tax Provisions, and AMT with DS/GDP constant
1"The Budget and Economic Outlook: An Update." August 2002. Table 1-1.2"The Budget and Economic Outlook: An Update." August 2002. Table 1-1supplement.
4"The Budget and Economic Outlook: An Update." August 2002. Box 1-1.5CBO debt service matrix, August 2002.
3"CBO Baseline Projections of Trust Fund Balances." August 2002.

Line Definition 2003 2004 2005 2006 2007 2008 2009 2010 2011 2012
Post-EGTRRA law with sunset repealed
1 Percent of taxpayers on AMT 3.0 5.5 13.7 19.9 24.1 28.4 30.9 33.0 35.1 36.9
2 Revenue cost of abolishing the AMT
5.8 16.9 27.0 46.1 66.1 84.5 107.2 127.3 149.8 171.7
3 Percent of taxpayers on AMT under indexing
2.0 3.0 3.0 5.0 6.0 7.0 7.0 7.0 7.0 7.0
4 Revenue cost of indexing 0.3 1.7 8.5 21.9 34.2 47.6 64.0 79.4 96.0 114.6
5 Revenue cost of reducing the share of AMT taxpayers to 3 percent
0.0 1.7 8.5 31.6 50.2 68.7 88.7 106.8 126.7 147.2
6 Interest cost of line 5 0.0 0.0 0.3 1.4 3.7 7.2 11.9 17.9 25.2 34.0
7 Total costs of reducing the share of AMT taxpayers to 3 percent
0.0 1.7 8.8 33.0 53.9 75.9 100.6 124.6 151.9 181.3
Sources, by line:1
2 Ibid.3 Ibid.4 Ibid.5 Line(4) + [Line(2)-Line(4)]*[(Line(3)-3.0)/Line(3)]6 CBO debt service matrix, August 2002.7 Line(5) + Line(6)
Burman, Leonard E., William G. Gale, Jeffrey Rohaly, and Benjamin H. Harris. 2002. Table 3. “The Individual AMT: Problems and Potential Solutions.” Urban-Brookings Tax Policy Center Discussion Paper No. 5, August.
Appendix Table 4
Costs of AMT Reform

Source: See Appendix Table 1.
Figure 1Changing Unified Budget Projections
-400
-200
0
200
400
600
800
1000
2001 2002 2003 2004 2005 2006 2007 2008 2009 2010 2011 2012
Year
Surp
lus
or D
efic
it ($
bill
ions
)
January 2001
August 2001
January 2002
August 2002

Source: See Appendix Table 1.
Figure 2Changing Non-Social Security Budget Projections
-400
-200
0
200
400
600
800
1000
2001 2002 2003 2004 2005 2006 2007 2008 2009 2010 2011 2012
Year
Surp
lus
or D
efic
it ($
bill
ions
)
January 2001
January 2002
August 2001
August 2002

Source: See Appendix Table 1.
Figure 3Changing Non-Social Security, Non-Medicare Budget Projections
-400
-200
0
200
400
600
800
1000
2001 2002 2003 2004 2005 2006 2007 2008 2009 2010 2011 2012
Year
Surp
lus
or D
efic
it ($
bill
ions
)
January 2001
January 2002
August 2001
August 2002
Source: See Appendix Table 2.
Figure 4Sources of Change in the Unified Budget Baseline from January 2001 to August 2002
Other Legislation
Discretionary Spending
Economic and Technical Changes
EGTRRA
0
10
20
30
40
50
60
70
80
90
100
2002 2003 2004 2005 2006 2007 2008 2009 2010 2011
Cha
nge
in B
asel
ine
(Per
cent
)

Figure 5Baseline and Adjusted Budget Outcomes, 2003-2012
-1,000
-800
-600
-400
-200
0
200
400
600
2003 2004 2005 2006 2007 2008 2009 2010 2011 2012
Year
Surp
lus
or D
efic
it ($
bill
ions
)
Unified Baseline (August 2002)
Exclude Retirement Funds
Extend Expiring Tax Provisions
Keep 3 Percent of Taxpayers on AMT
Hold DS/GDP Constant

Figure 6The Baseline Budget Under Alternative Assumptions, 2003-2012
-1,000
-800
-600
-400
-200
0
200
400
600
2003 2004 2005 2006 2007 2008 2009 2010 2011 2012
Year
Surp
lus
or D
efic
it ($
bill
ions
)
Unified Baseline (August 2002)
Extend Expiring Tax Provisions
Keep 3 Percent of Taxpayers on AMT
Hold DS/GDP Constant