the value of plantation forests for plant, invertebrate ... · pdf fileoriginal paper the...
TRANSCRIPT

ORI GIN AL PA PER
The value of plantation forests for plant, invertebrateand bird diversity and the potential for cross-taxonsurrogacy
Sandra Irwin • Scott M. Pedley • Linda Coote • Anke C. Dietzsch •
Mark W. Wilson • Anne Oxbrough • Oisın Sweeney • Karen M. Moore •
Rebecca Martin • Daniel L. Kelly • Fraser J. G. Mitchell •
Thomas C. Kelly • John O’Halloran
Received: 22 August 2013 / Revised: 11 December 2013 / Accepted: 13 January 2014 /Published online: 29 January 2014� Springer Science+Business Media Dordrecht 2014
Abstract As the area of plantation forest expands worldwide and natural, unmanaged
forests decline there is much interest in the potential for planted forests to provide habitat
for biodiversity. In regions where little semi-natural woodland remains, the biodiversity
supported by forest plantations, typically non-native conifers, may be particularly impor-
tant. Few studies provide detailed comparisons between the species diversity of native
woodlands which are being depleted and non-native plantation forests, which are now
expanding, based on data collected from multiple taxa in the same study sites. Here we
compare the species diversity and community composition of plants, invertebrates and
birds in Sitka spruce- (Picea sitchensis-) dominated and Norway spruce- (Picea abies-)
dominated plantations, which have expanded significantly in recent decades in the study
area in Ireland, with that of oak- and ash-dominated semi-natural woodlands in the same
area. The results show that species richness in spruce plantations can be as high as semi-
natural woodlands, but that the two forest types support different assemblages of species.
In areas where non-native conifer plantations are the principle forest type, their role in the
provision of habitat for biodiversity conservation should not be overlooked. Appropriate
management should target the introduction of semi-natural woodland characteristics, and
on the extension of existing semi-natural woodlands to maintain and enhance forest species
diversity. Our data show that although some relatively easily surveyed groups, such as
vascular plants and birds, were congruent with many of the other taxa when looking across
all study sites, the similarities in response were not strong enough to warrant use of these
Communicated by B.D. Hoffmann.
S. Irwin (&) � S. M. Pedley � M. W. Wilson � O. Sweeney � R. Martin � T. C. Kelly � J. O’HalloranSchool of Biological, Earth & Environmental Sciences, University College Cork, Cork, Irelande-mail: [email protected]
L. Coote � A. C. Dietzsch � K. M. Moore � D. L. Kelly � F. J. G. MitchellDepartment of Botany, School of Natural Sciences, Trinity College Dublin, Dublin, Ireland
A. OxbroughDepartment of Biology, Edge Hill University, St Helens Road, Ormskirk, Lancashire L39 4QP, UK
123
Biodivers Conserv (2014) 23:697–714DOI 10.1007/s10531-014-0627-4

taxa as surrogates of the others. In order to capture a wide range of biotic variation,
assessments of forest biodiversity should either encompass several taxonomic groups, or
rely on the use of indicators of diversity that are not species based.
Keywords Beetles � Birds � Biodiversity � Forest � Management � Spiders �Vegetation
Introduction
While global natural forest area continues to decline by circa 13 million hectares per
annum, the area of plantation forest is increasing by approximately 5 million hectares per
annum (FAO 2010), and plantation forests are now the dominant forest type in many
countries (European Commission 2011). They make up an estimated 264 million hectares
(7 %) of the global forest area and are forecast to further increase to approximately 345
million hectares by 2030 (Carle and Holmgren 2008). Although deforestation removes
native species of tree from an area, many plantation forests, which are now increasing, use
non-native tree species, particularly conifer species (FAO 2012), whose value for biodi-
versity conservation is not fully understood (Oxbrough et al. 2013).
The biodiversity of these plantation forests can be influenced by management practices
at both local and landscape scales (Kuuluvainen 2009; Klenner et al. 2009; Fabbio et al.
2003; Brukas et al. 2013). The prevalent model of forest management in the twentieth
century focused almost entirely on wood production, but pressures from international
agreements and societal demands are acting to make modern forest management more
multifunctional. The potential for these plantation forests to provide habitat for plant and
animal species is a key component of sustainable forest management (SFM) (MCPFE
2011; Lindenmayer et al. 2000). SFM one of the foremost tools for achieving compatibility
between forest industries and the provision of ecosystem services, including the conser-
vation of forest biodiversity (Paritsis and Aizen 2008; Hartmann et al. 2010). The objec-
tives of SFM in a landscape can only be realised when its objectives are based on an
understanding of the ecology of existing woodlands. This relies on a detailed knowledge of
their flora and fauna, and the factors influencing species diversity in forests.
While natural forests represent some of the most biologically diverse ecosystems in the
world, including more than half of all terrestrial species (MEA 2005; FAO 2012), the
highly managed nature of plantation forests means they may support less native biodi-
versity than naturally occurring forests (Hunter 1999; Lindenmayer and Hobbs 2004;
Stephens and Wagner 2007; Paritsis and Aizen 2008). However, in countries where the
extent of naturally occurring forests is limited, plantation forests may provide habitat for
forest associated species and enhance overall landscape biodiversity, (Stephens and
Wagner 2007; Brockerhoff et al. 2008; Pawson et al. 2008; Sweeney et al. 2010; Coote
et al. 2012). Several studies have also suggested that plantation forests have the potential to
benefit native diversity even where the planted tree species are non-native conifer species
(Bremer and Farley 2010; O’Hanlon and Harrrington 2012; Humphrey 2005). Although the
island of Ireland was once extensively forested, today forest cover accounts for less than
11 % of its surface area. Eighty-seven per cent of this forest cover is comprised of plan-
tations, the majority of which (97 %) are dominated by non-native conifer tree species
(MCPFE et al. 2007). The remainder of Ireland’s forest cover comprises semi-natural
woodlands of native broadleaved tree species (Forest Service 2007). This means that
698 Biodivers Conserv (2014) 23:697–714
123

plantation forests in Ireland are particularly important to forest biodiversity compared with
regions where forest cover is dominated by semi-natural woodland (Bremer and Farley
2010; Berndt et al. 2008). Although Ireland’s native woodlands are limited in their spatial
extent, the value of their biodiversity is disproportionately high, providing a reference
point against which more recently established forests can be compared.
Assessments of species diversity are commonly used to gauge the environmental impact
of different forest management practices. In such cases, information about unsurveyed taxa
may be inferred from known relationships with either environmental variables or other
taxonomic groups (surrogate taxa) (Wolters et al. 2006; Gardner 2010; Lewandowski et al.
2010). This approach is most beneficial when the diversity of one or more relatively
cryptic, inaccessible or hard-to-identify groups can be effectively estimated using data
from a more easily surveyed group (Gioria et al. 2010; Rodrigues and Brooks 2007).
Previous studies of the usefulness of surrogacy have differing conclusions, with some
considering surrogate taxa to be a useful tool (Gioria et al. 2010; Rodrigues and Brooks
2007), and others cautioning that relationships between taxa are often too weak or too
variable to be useful in this way (Carmel and Stoller-Cavari 2006; Andelman and Fagan
2000; Wolters et al. 2006).
The response of species diversity to commercial plantation forests varies across taxo-
nomic groups, and much of the evidence for this variation comes from meta-analyses of
independent studies which consider individual taxa separately (Paillet et al. 2010; Paritsis
and Aizen 2008). Very few studies have used empirical data to investigate the importance
of plantation forests for more than one taxon simultaneously. We conducted a survey of
species diversity in multiple taxonomic groups (plants, invertebrates and birds) across the
island of Ireland where commercial plantations are the dominant forest type. The objective
of this study was to compare the species diversity of semi-natural woodlands, which are
being widely deforested, with that of plantation forests, which are now expanding globally.
We also investigated associations between species richness of the different taxonomic
groups in order to assess the predictive ability of each group as a biodiversity surrogate for
other groups. The aims of this study were to assess the potential of plantation forests to
provide habitat for plant, invertebrate and bird species in an area where little native
woodland remains, to identify ways of improving plantation forest management for bio-
diversity, and to test the validity of using cross-taxon surrogacy in the species diversity
assessment of plantation forests and native woodland.
Methods
Study sites
Twenty closed-canopy spruce- (Picea-) dominated plantation forest and 20 semi-natural
woodlands were selected for study. All study sites were larger than 4 ha. These included
ten Sitka spruce- (Picea sitchensis-) dominated plantation forests in their second rotation
(hereafter referred to as Sitka spruce plantations), ten Norway spruce- (Picea abies-)
dominated plantation forests (hereafter referred to as Norway spruce plantations), ten oak-
(Quercus petraea-) dominated semi-natural woodlands (hereafter referred to as oak
woodlands) and ten ash- (Fraxinus excelsior-) dominated semi-natural woodlands (here-
after referred to as ash woodlands). Sites were widely distributed across the island of
Ireland (Fig. 1).
Biodivers Conserv (2014) 23:697–714 699
123

Ten semi-natural woodlands were dominated by oak with birch and/or holly in the
understory and other ten semi-natural woodland study sites were dominated by ash with
oak and/or hazel in the understory. Oak and ash woodlands in the Republic of Ireland were
selected on the basis of their presence on 1st edition (c.1840s) Ordnance Survey maps,
while those in Northern Ireland were selected from a database of ancient and long-
established woodland (The Woodland Trust 2007). However, due to a lack of suitable sites,
we included two woodlands that were not present on the 1st edition maps or in the
database. Following analysis we found that these woodlands did not differ significantly
from the others and so results are presented for all woodlands. During the study, the native
woodlands were all subject to little or no management.
Data collection
Surveys of ground vegetation (bryophytes and vascular plants), invertebrates (canopy
spiders and beetles and active ground-dwelling spiders and Carabid beetles) and birds were
conducted at the study sites during the summers of 2007 and 2008. Standard survey
methodologies for recording species were used for plants (Kent 2012), ground-dwelling
invertebrates (Curtis 1980), canopy invertebrates (Erwin 1991) and birds (Bibby et al.
2000).
Fig. 1 Map of Ireland showing plantation and semi-natural forest study sites. Filled circle sitka spruce-dominated plantations, open circle Norway spruce-dominated plantations, filled square oak-dominatedsemi-natural woodlands and open square ash-dominated semi-natural woodlands
700 Biodivers Conserv (2014) 23:697–714
123

At each study site three 10 m 9 10 m plots were selected for survey of ground vege-
tation. Plots were located at least 50 m from the edge and at least 50 m apart. Within each
plot, the percentage cover of each terrestrial plant species was estimated to the nearest 5 %.
Below 5 % two different cover-abundance units were distinguished: 3 % (indicating cover
of 1–5 %) and 0.5 % (indicating cover\1 %). For bryophytes only those species forming
patches more than 10 cm2 were recorded. Species not forming patches of this size but
which occurred frequently were also recorded. Nomenclature follows Stace (2010) for
vascular plants and Paton (1999) for liverworts.
Pitfall traps were used to collect ground-dwelling spiders and Carabid beetles at all
study sites. Although this method is widely used and is an efficient method, it should be
noted that pitfall catches are a function of the activity, density and behaviour of each
species rather than a measure of absolute abundance.
Up to three sampling plots were located at each study site within 10 m of the ground
vegetation survey plots. Each sampling plot comprised five pitfall traps spaced (pooled for
analyses) approximately 2 m apart and consisted of a plastic cup, 7 cm in diameter and 9 cm
in depth. A bulb corer of similar dimensions to the cup was used to make a hole in the ground
in which to sink the cup so that it was flush with the soil surface and soil disturbance around
the trap was minimized. Two drainage holes were cut horizontally, 1 cm from the top of the
cup, and traps were filled with ethylene glycol to a depth of 1 cm to act as a killing and
preserving agent. There was considerable animal disturbance ([80 % trap loss) at two of the
Sitka spruce study sites sampled during 2007 and so these sites were re-sampled during the
same period in 2008. To reduce the impact of animal disturbance during the 2008 sampling
period a combination of protective wire mesh boxes (mesh size was approximately 3 cm to
allow ground-dwelling invertebrates to pass through) and wire mesh lids held 5 cm above the
ground by plastic pegs and attached to electric fence units were used. We tested for an effect
of these protective devices and for an effect of sampling year by conducting additional pitfall
trapping. No effect of either protective devices or sampling year was found. All traps were set
in mid-May of 2007 or 2008 and left in situ for nine weeks during which time the contents of
all traps were collected approximately every three weeks. Catches were pooled across the
nine weeks for analyses. Spiders and Carabid beetles were sorted from the pitfall samples and
adults were identified to species level using Roberts (1993) and Luff (2007).
Spiders and beetles were sampled from forest canopies at 24 of the study sites (6 of each
site type) using a canopy fogging technique that targeted one tree, located at least 50 m
from the edge, at each study site. Canopy fogging is frequently used by researchers
working on canopy invertebrates, as it provides access to invertebrate populations in forest
canopies while minimising access-related disturbance. It is, however, limited by weather
conditions and may overlook attached or sessile animals and does not sample groups that
live within the tree itself (Stork and Hammond 1997). Using a petrol-driven fogging
machine (SwingFog SN50-PE, SwingTec Ltd., Germany) a natural pyrethroid (Pybuthrin
33, Spray-Chem Ltd., Dublin) was dispersed in ultra-low volume droplets into the tree
canopy for between 6 and 9 min. This insecticide is non-persistent in the environment, has
no phytotoxic effects (at the levels used), and is not harmful to mammals or birds (Straw
et al. 1996). Fallen invertebrates were then collected using an arrangement of 16 plastic
sheets with a combined area of 24 m2 suspended 1 m from the ground under the fogged
canopy. Plastic sheets were arranged around the target tree on the eight cardinal and
ordinal compass bearings. These sheets were left in place for 3 h after fogging and the
catches from all sheets at each site were pooled. Samples were collected in situ using soft
paintbrushes to brush invertebrates into bottles containing 70 % alcohol before the insects
could recover from the effects of the insecticide.
Biodivers Conserv (2014) 23:697–714 701
123

Birds were surveyed at all study sites during the breeding season using point counts
(Bibby et al. 2000). Six (or, where forests were too small at one Norway spruce site and
one ash woodland, 4 and 5 respectively) points were randomly placed a minimum of 100 m
apart in edge and interior forest habitat. Point counts of birds were conducted on days
without strong wind (less than Beaufort scale 4) or persistent rain and lasted for 10 min,
during which time all birds seen and heard within 50 m of the observer were recorded and
their distances from the observer noted. Each site was surveyed twice with one of the visits
carried out between 800 and 1,100 h, and the other between 1,400 and 1,700 h and species
richness was calculated as the cumulative number of species recorded over the two visits.
Data analysis
Abundance measures for the community analysis comprised species cover of plants and
relative abundance [individual species abundance (number of individuals collected from a
particular species) divided by total site abundance (combined abundance of all species
collected at each site)] of invertebrate groups. Distance (DISTANCE 6.0 Release 2) soft-
ware was used to derive bird densities from field observations. Both the identity of a species
and the habitat in which it is observed may affect the detectability of birds and so each
species was assigned to one of four detection groups, depending on the habitat type, method
of detection, the distribution of detections in five 10 m distance bands and knowledge of the
species’ ecology. Akaike’s information criteria (AIC) was used to select between four
models for fitting of the detection function: Uniform ? Cosine, Uniform ? Polynomial,
Half normal ? Hermite and Hazard-rate ? Cosine (Buckland et al. 2001). For each site, the
bird population densities of all species for both the early and late counts were calculated,
and the density of a species taken as the maximum of these two values. Species richness was
adjusted to the lowest sampling effort for ground invertebrates and birds (2 sample plots and
4 point counts respectively) using species accumulation curves and to the lowest total
number of individuals caught (n = 15) for canopy invertebrates using individual based
rarefaction curves to account for possible differences in vertical canopy structure. Analyses
were carried out in R using the vegan package (Oksanen et al. 2010).
Species richness of all species and of forest-associated species (FAS) was calculated for
each of the groups sampled in each forest type. For forest-associated species richness we
identified ground vegetation species typical of woodland/forests, forest-associated ground-
dwelling spider and Carabid beetle species, canopy-dwelling spider and beetle conifer,
broadleaved and deadwood specialist species and bird species with strong associations with
all forest habitats in Ireland, or specialising in one type of forest habitat (e.g. coniferous or
broadleaved) to the exclusion of the other.
Species richness was compared among forest types using generalised linear models
(GLMs) using the statistical software package R (R Development Core Team 2012). The
appropriate error term (normal, Poisson, negative binomial) for each analysis was selected
by comparing Akaike’s Information Criterion (AIC) and examining the ratio of deviance/
residual degrees of freedom. Tukey pairwise comparisons were used to examine differ-
ences among forest types. Spatial autocorrelation of GLM residuals was examined by
Moran’s I in the ape package v.3.0–6 (Paradis et al. 2004) in R. In all instances Moran’s I
was not significant (P [ 0.05).
Species richness and forest-associated species richness values for each group were
correlated with values for every other group separately. Since some of the datasets did not
conform to parametric assumptions, non-parametric Spearman’s rank correlations were
used throughout. Significance values were not adjusted with e.g. the Bonferroni method
702 Biodivers Conserv (2014) 23:697–714
123
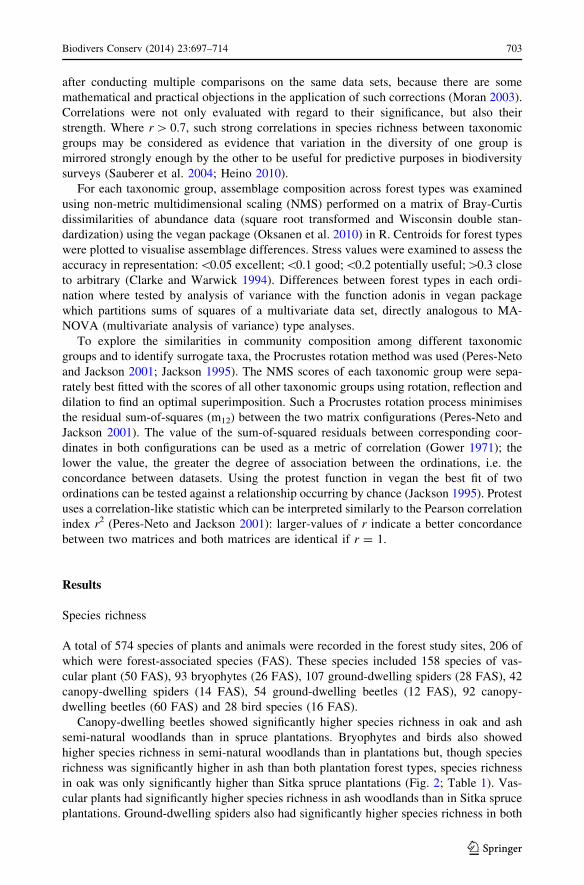
after conducting multiple comparisons on the same data sets, because there are some
mathematical and practical objections in the application of such corrections (Moran 2003).
Correlations were not only evaluated with regard to their significance, but also their
strength. Where r [ 0.7, such strong correlations in species richness between taxonomic
groups may be considered as evidence that variation in the diversity of one group is
mirrored strongly enough by the other to be useful for predictive purposes in biodiversity
surveys (Sauberer et al. 2004; Heino 2010).
For each taxonomic group, assemblage composition across forest types was examined
using non-metric multidimensional scaling (NMS) performed on a matrix of Bray-Curtis
dissimilarities of abundance data (square root transformed and Wisconsin double stan-
dardization) using the vegan package (Oksanen et al. 2010) in R. Centroids for forest types
were plotted to visualise assemblage differences. Stress values were examined to assess the
accuracy in representation:\0.05 excellent;\0.1 good;\0.2 potentially useful;[0.3 close
to arbitrary (Clarke and Warwick 1994). Differences between forest types in each ordi-
nation where tested by analysis of variance with the function adonis in vegan package
which partitions sums of squares of a multivariate data set, directly analogous to MA-
NOVA (multivariate analysis of variance) type analyses.
To explore the similarities in community composition among different taxonomic
groups and to identify surrogate taxa, the Procrustes rotation method was used (Peres-Neto
and Jackson 2001; Jackson 1995). The NMS scores of each taxonomic group were sepa-
rately best fitted with the scores of all other taxonomic groups using rotation, reflection and
dilation to find an optimal superimposition. Such a Procrustes rotation process minimises
the residual sum-of-squares (m12) between the two matrix configurations (Peres-Neto and
Jackson 2001). The value of the sum-of-squared residuals between corresponding coor-
dinates in both configurations can be used as a metric of correlation (Gower 1971); the
lower the value, the greater the degree of association between the ordinations, i.e. the
concordance between datasets. Using the protest function in vegan the best fit of two
ordinations can be tested against a relationship occurring by chance (Jackson 1995). Protest
uses a correlation-like statistic which can be interpreted similarly to the Pearson correlation
index r2 (Peres-Neto and Jackson 2001): larger-values of r indicate a better concordance
between two matrices and both matrices are identical if r = 1.
Results
Species richness
A total of 574 species of plants and animals were recorded in the forest study sites, 206 of
which were forest-associated species (FAS). These species included 158 species of vas-
cular plant (50 FAS), 93 bryophytes (26 FAS), 107 ground-dwelling spiders (28 FAS), 42
canopy-dwelling spiders (14 FAS), 54 ground-dwelling beetles (12 FAS), 92 canopy-
dwelling beetles (60 FAS) and 28 bird species (16 FAS).
Canopy-dwelling beetles showed significantly higher species richness in oak and ash
semi-natural woodlands than in spruce plantations. Bryophytes and birds also showed
higher species richness in semi-natural woodlands than in plantations but, though species
richness was significantly higher in ash than both plantation forest types, species richness
in oak was only significantly higher than Sitka spruce plantations (Fig. 2; Table 1). Vas-
cular plants had significantly higher species richness in ash woodlands than in Sitka spruce
plantations. Ground-dwelling spiders also had significantly higher species richness in both
Biodivers Conserv (2014) 23:697–714 703
123
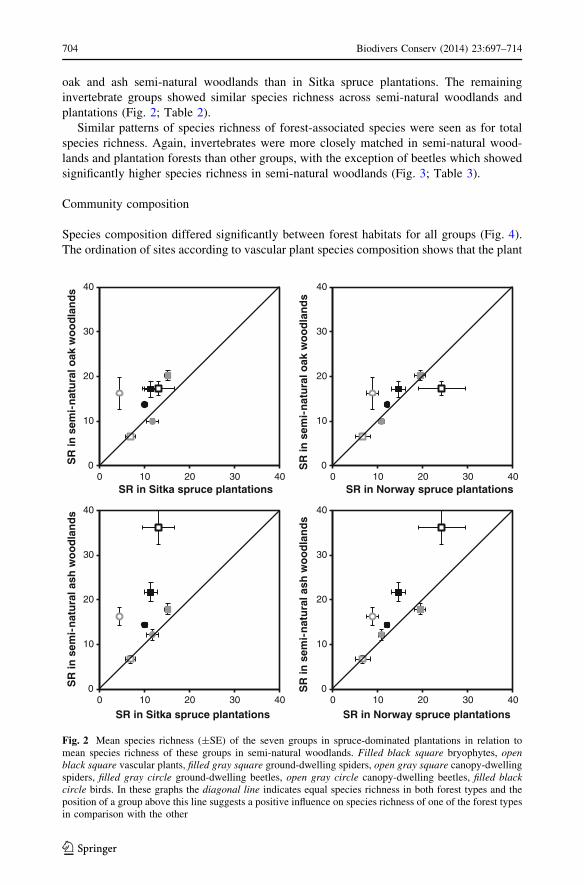
oak and ash semi-natural woodlands than in Sitka spruce plantations. The remaining
invertebrate groups showed similar species richness across semi-natural woodlands and
plantations (Fig. 2; Table 2).
Similar patterns of species richness of forest-associated species were seen as for total
species richness. Again, invertebrates were more closely matched in semi-natural wood-
lands and plantation forests than other groups, with the exception of beetles which showed
significantly higher species richness in semi-natural woodlands (Fig. 3; Table 3).
Community composition
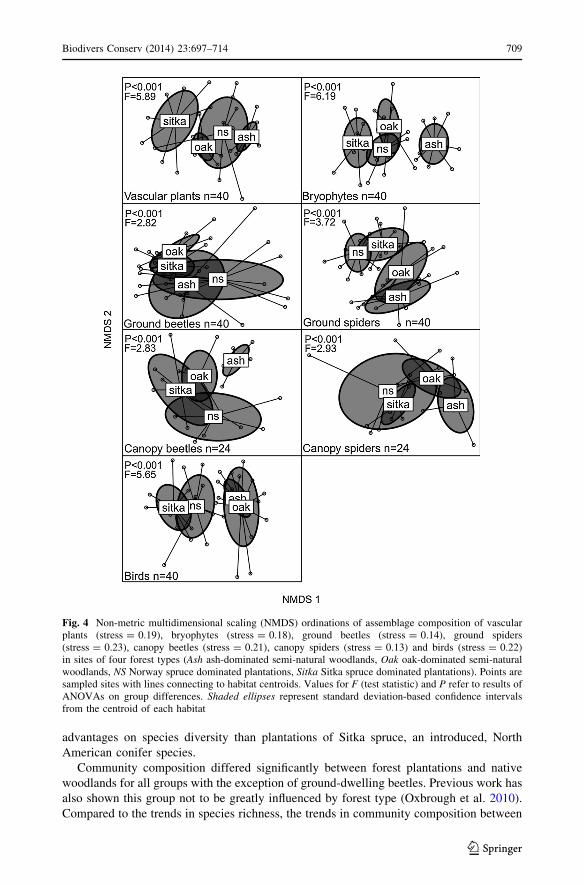
Species composition differed significantly between forest habitats for all groups (Fig. 4).
The ordination of sites according to vascular plant species composition shows that the plant
0
10
20
30
40
0 10 20 30 40
SR
in s
emi-
nat
ura
l oak
wo
od
lan
ds
SR in Sitka spruce plantations
0
10
20
30
40
0 10 20 30 40
SR
in s
emi-
nat
ura
l oak
wo
od
lan
ds
SR in Norway spruce plantations
0
10
20
30
40
0 10 20 30 40
SR
in s
emi -
nat
ura
l ash
wo
od
lan
ds
SR in Sitka spruce plantations
0
10
20
30
40
0 10 20 30 40
SR
in s
emi-
nat
ura
l ash
wo
od
lan
ds
SR in Norway spruce plantations
Fig. 2 Mean species richness (±SE) of the seven groups in spruce-dominated plantations in relation tomean species richness of these groups in semi-natural woodlands. Filled black square bryophytes, openblack square vascular plants, filled gray square ground-dwelling spiders, open gray square canopy-dwellingspiders, filled gray circle ground-dwelling beetles, open gray circle canopy-dwelling beetles, filled blackcircle birds. In these graphs the diagonal line indicates equal species richness in both forest types and theposition of a group above this line suggests a positive influence on species richness of one of the forest typesin comparison with the other
704 Biodivers Conserv (2014) 23:697–714
123

communities of spruce plantations were more variable than those of native woodlands.
Sitka spruce sites were particularly distinct, with the communities for both ash and oak
woodlands overlapping with those of Norway spruce plantations. Bryophyte communities
in ash woodlands were separated from those in other woodland types, with the commu-
nities of both oak and Sitka spruce sites overlapping with those in Norway spruce. Ground
beetles communities in the different forest sites were poorly distinguished from one
another, but ground spiders in native woodland sites were broadly distinct from those in
plantations, with communities in oak and Sitka spruce being more similar to one another
than those in ash and Norway spruce. Canopy beetles and spiders in ash were distinct from
those in spruce plantations, with canopy beetles in ash being distinct from those in oak.
Birds in native woodlands were clearly distinct from communities in spruce sites.
Cross-taxon surrogacy
Following rotation of NMDS ordinations of any two taxonomic groups, Procrustes
randomisation tests in PROTEST indicated significant concordances between assem-
blage ordinations of just fewer than half of the groups under investigation (Table 4).
Although a number of the Procrustes concordances were highly significant, none were
sufficiently strong (r [ 0.7) to regard any taxonomic groups as surrogate taxa (Heino
2010; Sauberer et al. 2004) and birds did not show significant concordance with any
other group tested.
Table 1 Results of generalised linear models (test statistic (v2 or F) and P value) comparing speciesrichness of ‘all species’ and ‘forest-associated species’ among forest types (SS Sitka spruce-dominatedplantations, NS Norway spruce-dominated plantations, Oak oak-dominated semi-natural woodlands, Ashash-dominated semi-natural woodlands)
Taxa Variable SS NS Oak Ash Test Statistic P value
Bryophytes All species1 a ab bc c F 7.20 \0.001
Forest species1 a b b b F 11.35 \0.001
Vascular plants All species1 a ab a b F 7.88 \0.001
Forest species1 a b ab c F 18.00 \0.001
Ground spiders All species1 a b b ab F 5.10 0.005
Forest species1 a a a a F 3.46 0.026
Canopy spiders All species3 a a a a v2 0.05 0.997
Forest species1 a a a a F 0.79 0.512
Ground beetles All species2 a a a a F 1.21 0.320
Forest species2 a ab b a F 4.64 0.008
Canopy beetles All species4 a b c c v2 51.66 \0.001
Forest species1 a a b b F 15.26 \0.001
Birds All species2 a b bc c F 14.21 \0.001
Forest species2 a ab bc c F 11.56 \0.001
Tukey pairwise comparisons were used to define homogenous sub-sets (a–c ranked highest to lowest); foresttypes? That share a lowercase letter do not differ significantly (P [ 0.05)
Variable superscript indicates which model type used: 1, square root; 2, linear; 3, poisson; 4, negativebinomial
Biodivers Conserv (2014) 23:697–714 705
123

Discussion
Species diversity
The potential for plantation forests to support plant and animal species is influenced by a
number of factors including preceding land use, planted tree species and management
practices (Bremer and Farley 2010; Brockerhoff et al. 2008). This study documents the
ground vegetation, ground- and canopy-dwelling spider and beetle, and bird species
diversity of Sitka spruce plantations and Norway spruce plantations during the closed
canopy stage of the forest cycle, and of unmanaged oak and ash semi-natural woodlands in
Ireland. The North American conifer Sitka spruce is the most commonly planted exotic
conifer tree species in Ireland, and Norway spruce, the most commonly planted conifer in
northern Europe (MCPFE 2011), is outside of its natural range in Ireland. Although no
truly undisturbed natural woodland remains in Ireland, the oak and ash broadleaved
woodlands included in this study were unmanaged forest sites that had, for the most part,
been established for at least 150 years. By comparison the plantation forests were highly
managed commercial production forests of non-native conifer tree species.
Each of the taxon groups included in this study responded to forest type in slightly
different ways and it is likely that the lack of a consistent effect across taxonomic groups in
the present study is related to the rarity of forest specialist species in Ireland. Here there are
relatively few forest specialists compared with other parts of Europe, and forests are
inhabited mainly by generalist species adapted to living in a range of habitat types
(Mitchell 2006; Fuller et al. 2007; Kelly 2008). Previous studies that used meta-analysis,
which rely on data collected during separate studies, to investigate species richness across a
Table 2 Correlations between species richness of each group
Vascular plants Ground spiders Canopy spiders Ground beetles Canopy beetles Birds
Bryophytes
r 0.546 0.286 -0.178 0.231 0.641 0.506
P 0.000 0.074 0.406 0.152 0.001 0.001
Vascular plants
r 0.228 -0.065 0.276 0.516 0.372
P 0.157 0.764 0.085 0.010 0.018
Ground spiders
r 0.178 0.338 0.454
P -0.217 0.106 0.003
Canopy spiders
r -0.148 -0.028 -0.193
P 0.489 0.895 0.367
Ground beetles
r -0.056 -0.088
P 0.794 0.590
Canopy beetles
r 0.629
P 0.001
Significant correlations are highlighted in bold text
706 Biodivers Conserv (2014) 23:697–714
123

number of taxonomic groups have found that species dependent on forests, such as bry-
ophytes and saproxylic beetles are more negatively affected by forest management prac-
tices than more generalist species (Paillet et al. 2010; Stephens and Wagner 2007; Paritsis
and Aizen 2008).
Both of the spruce-dominated forest plantation types in the current study supported
ground-dwelling beetle and canopy-dwelling spider species richness similar to native
woodlands, but the same was not true for other groups investigated, where significant
differences in species richness were found between forest types. The similarity in ground-
dwelling beetles and canopy-dwelling spiders between native woodlands and spruce
plantations in this study may reflect the absence of forest specialist species in Ireland (i.e.
species that are specifically adapted for living in forest habitats). Spiders are generalist
predators and are more dependent on habitat structure and prey availability than the actual
0
5
10
15
20
25
0 5 10 15 20 25
FS
R in
sem
i -n
atu
ral o
ak w
oo
dla
nd
s
FSR in Sitka spruce plantations
0
5
10
15
20
25
0 5 10 15 20 25
FS
R in
sem
i -n
atu
ral o
ak w
oo
dla
nd
s
FSR in Norway spruce plantations
0
5
10
15
20
25
0 5 10 15 20 25
FS
R in
sem
i -n
atu
ral a
sh w
oo
dla
nd
s
FSR in Sitka spruce plantations
0
5
10
15
20
25
0 5 10 15 20 25
FS
R in
sem
i-n
atu
ral a
sh w
oo
dla
nd
s
FSR in Norway spruce plantations
Fig. 3 Mean total species richness (±SE) of forest-associated species (FSR) for each of the 7 groups inspruce-dominated plantations in relation to mean species richness of these groups in semi-naturalwoodlands. Filled black square bryophytes, open black square vascular plants, filled gray square ground-dwelling spiders, open gray square canopy-dwelling spiders, filled gray circle ground-dwelling beetles,open gray circle canopy-dwelling beetles, filled black circle birds. In these graphs the diagonal lineindicates equal species richness in both forest types and the position of a group above this line suggests apositive influence on species richness of one of the forest types in comparison with the other
Biodivers Conserv (2014) 23:697–714 707
123

species of tree which they inhabit (Halaj et al. 1998, 2000; Purchart et al. 2013). By
contrast the species richness of canopy-dwelling beetles was consistently higher in oak and
ash woodlands than in forest plantations. Beetles, as a group, are more diverse than spiders
in their foraging strategies and previous studies have shown that the negative impacts of
forest plantations particularly impact beetles (Wiezik et al. 2007). The species richness of
vascular plants was higher in ash woodlands than in Sitka spruce plantation forests, but
similar to Norway spruce plantations. Understory and physical attributes of plantation
forests do differ from those of natural woodlands (Aubin et al. 2008) and greater habitat
complexity in natural woodlands has been shown to provide more suitable habitat than
managed forests for some groups (Wiezik et al. 2007; Stephens and Wagner 2007; Veinotte
et al. 2003).
Species richness of forest-associated bryophytes, vascular plants, canopy-dwelling
beetles and birds was higher in oak and ash woodlands than in Sitka spruce dominated
plantations. These patterns are most likely related to the lower light levels in spruce-
dominated plantations. The understory of conifer plantations is typically less structurally
complex than in natural woodlands (Aubin et al. 2008) where higher light levels can
contribute to increased plant diversity and understory structure (Riegel et al. 1995). This, in
turn, is important for the diversity of many species, particularly invertebrates and birds
(Hardtle et al. 2003; Messier et al. 1998; Sweeney et al. 2010; Purchart et al. 2013). For
many taxa in the current study species richness values in Norway spruce-dominated
commercial plantations showed greater similarities to those of native woodlands than those
in Sitka spruce-dominated forest plantations. This finding suggests that plantations of this
tree species, which is present in Ireland beyond its natural European range, confer more
Table 3 Correlations between species richness of forest-associated species for each group
Vascular plants Ground spiders Canopy spiders Ground beetles Canopy beetles Birds
Bryophytes
r 0.653 0.214 -0.267 0.173 0.561 0.515
P 0.000 0.186 0.208 0.286 0.004 0.001
Vascular plants
r 0.088 -0.287 0.047 0.633 0.583
P 0.589 0.175 0.775 0.001 0.000
Ground spiders
r 0.302 20.342 0.169 0.218
P 0.152 0.031 0.431 0.177
Canopy spiders
r -0.346 -0.401 -0.401
P 0.098 0.052 0.052
Ground beetles
r -0.173 -0.209
P 0.419 0.197
Canopy beetles
r 0.740
P 0.000
Significant correlations are highlighted in bold text
708 Biodivers Conserv (2014) 23:697–714
123
advantages on species diversity than plantations of Sitka spruce, an introduced, North
American conifer species.
Community composition differed significantly between forest plantations and native
woodlands for all groups with the exception of ground-dwelling beetles. Previous work has
also shown this group not to be greatly influenced by forest type (Oxbrough et al. 2010).
Compared to the trends in species richness, the trends in community composition between
Fig. 4 Non-metric multidimensional scaling (NMDS) ordinations of assemblage composition of vascularplants (stress = 0.19), bryophytes (stress = 0.18), ground beetles (stress = 0.14), ground spiders(stress = 0.23), canopy beetles (stress = 0.21), canopy spiders (stress = 0.13) and birds (stress = 0.22)in sites of four forest types (Ash ash-dominated semi-natural woodlands, Oak oak-dominated semi-naturalwoodlands, NS Norway spruce dominated plantations, Sitka Sitka spruce dominated plantations). Points aresampled sites with lines connecting to habitat centroids. Values for F (test statistic) and P refer to results ofANOVAs on group differences. Shaded ellipses represent standard deviation-based confidence intervalsfrom the centroid of each habitat
Biodivers Conserv (2014) 23:697–714 709
123

native oak and ash woodlands and plantations were more similar among the taxonomic
groups with the majority having discrete communities in native woodlands and plantation
forests. For the canopy-dwelling spiders, native woodlands had different communities to
spruce plantations while canopy-dwelling beetles were significantly different between
native woodlands and spruce plantations. For the canopy-dwelling spiders, differences in
habitat structure and prey availability between coniferous and broadleaved trees are likely
to be the reason for the patterns observed. The differences for canopy-dwelling beetles may
be related to the abundance of prey for predators in spruce, combined with the lack of
beetle guilds which specifically feed on conifer tissues, resulting in different suites of
species. Ground-dwelling beetles were the only group that did not show any clear sepa-
ration between native woodlands and plantations. The lack of forest specialist beetles in
Ireland may be the reason for this lack of distinction. For birds there was clear separation
between native woodlands and spruce plantations, which was probably related to the lower
structural diversity of plantations, as well as differences in the diet preferences of certain
species (Sweeney et al. 2010).
Cross-taxon surrogacy
Ground-dwelling beetles stood out during the investigation of species richness cross-taxon
surrogacy, having the fewest correlations with any other group for either total species
richness or forest-associated species richness. While almost half of the combinations of the
Table 4 Correlation coefficient of a symmetric Procrustes rotation (r) and level of significance (P) evalu-ating the concordance between the NMDS scores (calculated for each investigated taxonomic group sampledon a site level in all forest types combined) after Procrustes rotation
Vascular plants Ground spiders Canopy spiders Ground beetles Canopy beetles Birds
Bryophytes
r 0.533 0.447 0.429 0.221 0.475 0.140
P 0.001 0.001 0.026 0.246 0.007 0.703
Vascular plants
r 0.444 0.446 0.265 0.519 0.144
P 0.001 0.006 0.119 0.004 0.717
Ground spiders
r 0.365 0.230 0.435 0.188
P 0.086 0.226 0.023 0.470
Canopy spiders
r 0.474 0.440 0.398
P 0.022 0.013 0.060
Ground beetles
r 0.271 0.178
P 0.300 0.473
Canopy beetles
r 0.375
P 0.067
Correlations with canopy spiders and canopy beetles comprise 24 sites, all other correlations comprise 40sites. Significant results (P B 0.05) are indicated in black text. Significant correlations are highlighted inbold text
710 Biodivers Conserv (2014) 23:697–714
123
other groups were significantly correlated, indicating a broad similarity in their responses
in terms of species richness at the coarse scale of all forest types combined. While a
correlation between two taxa might be due to the species richness and assemblage of the
taxa responding to some of the same, broad differences in habitat between the forest types,
none of the groups had correlation coefficients greater than 0.7. This is the level above
which one taxonomic group may be considered a potential surrogate for another (Sauberer
et al. 2004). This is most likely due to the different levels of specialisation and mobility
among the different taxonomic groups under investigation.
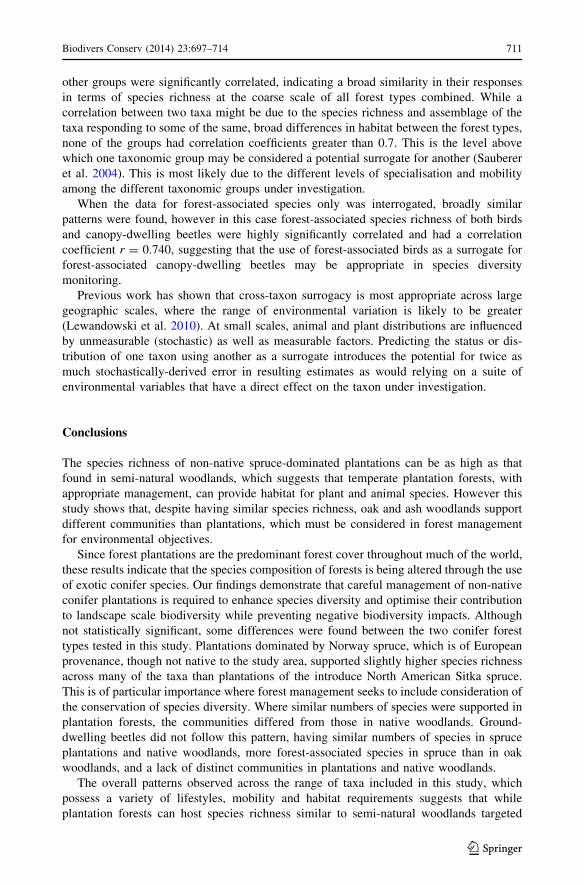
When the data for forest-associated species only was interrogated, broadly similar
patterns were found, however in this case forest-associated species richness of both birds
and canopy-dwelling beetles were highly significantly correlated and had a correlation
coefficient r = 0.740, suggesting that the use of forest-associated birds as a surrogate for
forest-associated canopy-dwelling beetles may be appropriate in species diversity
monitoring.
Previous work has shown that cross-taxon surrogacy is most appropriate across large
geographic scales, where the range of environmental variation is likely to be greater
(Lewandowski et al. 2010). At small scales, animal and plant distributions are influenced
by unmeasurable (stochastic) as well as measurable factors. Predicting the status or dis-
tribution of one taxon using another as a surrogate introduces the potential for twice as
much stochastically-derived error in resulting estimates as would relying on a suite of
environmental variables that have a direct effect on the taxon under investigation.
Conclusions
The species richness of non-native spruce-dominated plantations can be as high as that
found in semi-natural woodlands, which suggests that temperate plantation forests, with
appropriate management, can provide habitat for plant and animal species. However this
study shows that, despite having similar species richness, oak and ash woodlands support
different communities than plantations, which must be considered in forest management
for environmental objectives.
Since forest plantations are the predominant forest cover throughout much of the world,
these results indicate that the species composition of forests is being altered through the use
of exotic conifer species. Our findings demonstrate that careful management of non-native
conifer plantations is required to enhance species diversity and optimise their contribution
to landscape scale biodiversity while preventing negative biodiversity impacts. Although
not statistically significant, some differences were found between the two conifer forest
types tested in this study. Plantations dominated by Norway spruce, which is of European
provenance, though not native to the study area, supported slightly higher species richness
across many of the taxa than plantations of the introduce North American Sitka spruce.
This is of particular importance where forest management seeks to include consideration of
the conservation of species diversity. Where similar numbers of species were supported in
plantation forests, the communities differed from those in native woodlands. Ground-
dwelling beetles did not follow this pattern, having similar numbers of species in spruce
plantations and native woodlands, more forest-associated species in spruce than in oak
woodlands, and a lack of distinct communities in plantations and native woodlands.
The overall patterns observed across the range of taxa included in this study, which
possess a variety of lifestyles, mobility and habitat requirements suggests that while
plantation forests can host species richness similar to semi-natural woodlands targeted
Biodivers Conserv (2014) 23:697–714 711
123

management is required to ensure that they provide habitat for native woodland flora and
fauna. In areas where spruce plantations are the main forest type, both the preservation or
extension of existing semi-natural woodlands and the management of spruce plantations to
encourage semi-natural woodland characteristics are needed to support and enhance forest
biodiversity.
Investigation of cross-taxon surrogacy revealed that ground-dwelling beetles also had
the fewest significant correlations with the other groups, most of which were significantly
correlated, indicating a broad similarity in the responses of these other groups. Our data
show that, although some relatively easily surveyed groups, such as vascular plants and
birds, are congruent with a number of the other taxa that the similarities in response are not
strong enough to warrant use of these taxa as surrogates. Taxon surrogacy is most useful
where it predicts diversity and assemblage of hard-to-survey taxa with groupings of sites of
a similar habitat. However, congruence within site-types, as measured by inter-taxon
species richness correlations, was low in the current study. This suggests that the taxa we
studied cannot be used as surrogates of one another at the scales we studied. In order to
capture a wide range of biotic variation, assessments of species diversity in Irish forests
conducted in the name of forest management, monitoring or for research purposes, must
encompass several taxonomic groups, and/or rely on the use of non-biotic (structural or
functional) indicators of diversity.
Acknowledgments This research was funded by the Department of Food, Agriculture & the Marine andthe Irish Research Council for Science, Engineering & Technology under the National Development Plan2007–2013. We thank Coillte and the many private forest owners in Ireland who granted permission for useof their forest sites in this study. We also thank Lauren Fuller for her contribution to manuscript preparationand Sue Iremonger, Keith Kirby, Tor-Bjorn Larsson and Noel Foley for scientific advice.
References
Andelman SJ, Fagan WF (2000) Umbrellas and flagships: efficient conservation surrogates or expensivemistakes? Proc Natl Acad Sci USA 97(11):5954–5959
Aubin I, Messier C, Bouchard A (2008) Can plantations develop understory biological and physical attri-butes of naturally regenerated forests? Biol Cons 141(10):2461–2476
Berndt L, Brockerhoff E, Jactel H (2008) Relevance of exotic pine plantations as a surrogate habitat forground beetles (Carabidae) where native forest is rare. Biodivers Conserv 17(5):1171–1185
Bibby CJ, Burgess ND, Hill DA (2000) Bird census techniques. Academic Press, LondonBremer L, Farley K (2010) Does plantation forestry restore biodiversity or create green deserts? A synthesis
of the effects of land-use transitions on plant species richness. Biodivers Conserv 19(14):3893–3915Brockerhoff E, Jactel H, Parrotta J, Quine C, Sayer J (2008) Plantation forests and biodiversity: oxymoron or
opportunity? Biodivers Conserv 17(5):925–951Brukas V, Felton A, Lindbladh M, Sallnas O (2013) Linking forest management, policy and biodiversity
indicators—a comparison of Lithuania and Southern Sweden. For Ecol Man 291:181–189Buckland ST, Anderson DR, Burnham KP, Laake JL, Borchers DL, Thomas L (2001) Introduction to
distance sampling: estimating abundance of biological populations. Oxford University Press, OxfordCarle J, Holmgren P (2008) Wood from planted forests. Forest Prod J 58:7Carmel Y, Stoller-Cavari L (2006) Comparing environmental and biological surrogates for biodiversity at a
local scale. Israel J Ecol Evol 52:11–27Clarke KR, Warwick RM (1994) Change in marine communities: an approach to statistical analysis and
interpretation. Plymouth Marine Laboratory, PlymouthCoote L, French LJ, Moore KM, Mitchell FJG, Kelly D (2012) Can plantation forests support plant species
and communities of semi-natural woodland? For Ecol Man 283:86–95Curtis DJ (1980) Pitfalls in spider community studies (Arachnida, Araneae). J Arachnol 8:271–280Erwin TL (1991) How many species are there?: revisited. Conserv Biol 5:330–333
712 Biodivers Conserv (2014) 23:697–714
123

European Commission (2011) Forestry in the EU and the world—a statistical portrait. (Ed Union., P. O. o. t.E.), p 107
Fabbio G, Merlo M, Tosi V (2003) Silvicultural management in maintaining biodiversity and resistance offorests in Europe—the mediterranean region. J Environ Manage 67(1):67–76
FAO (2010) Global forest resources assessment 2010. FAO forestry paper 163. Food and AgricultureOrganization of the United Nations, Rome
FAO (2012) State of the world’s forests 2012. Food and Agriculture Organization of the United Nations,Rome
Forest Service (2007) National forest inventory, Republic of IrelandFuller RJ, Gaston KJ, Quine CP (2007) Living on the edge: British and Irish woodland birds in a European
context. Ibis 149:53–63Gardner T (2010) Monitoring forest biodiversity: improving conservation through ecologically responsible
management. Earthscan, LondonGioria M, Schaffers A, Bacaro G, Feehan J (2010) The conservation value of farmland ponds: predicting
water beetle assemblages using vascular plants as a surrogate group. Biol Cons 143:1125–1133Gower JC (1971) Statistical methods of comparing different multivariate analyses of the same data. In:
Hodson FR, Kendall DG, Tautu P (eds) Mathematics in the archaeological and historical sciences.Edinburgh University Press, Edinburgh, pp 138–149
Halaj J, Ross DW, Moldenke AR (1998) Habitat structure and prey availability as predictors of theabundance and community organization of spiders in western Oregon forest canopies. J Arachnol26:203–220
Halaj J, Ross DW, Moldenke AR (2000) Importance of habitat structure to the arthropod food-web inDouglas-fir canopies. Oikos 90:139–152
Hardtle W, von Oheimb G, Westphal C (2003) The effects of light and soil conditions on the speciesrichness of the ground vegetation of deciduous forests in northern Germany (Schleswig-Holstein). ForEcol Man 182:327–338
Hartmann H, Daoust G, Bigue B, Messier C (2010) Negative or positive effects of plantation and intensiveforestry on biodiversity: a matter of scale and perspective. For Chron 86:354–364
Heino J (2010) Are indicator groups and cross-taxon congruence useful for predicting biodiversity in aquaticecosystems? Ecol Ind 10:112–117
Humphrey JW (2005) Benefits to biodiversity from developing old-growth conditions in British uplandspruce plantations: a review and recommendations. Forestry 78:33–53
Hunter MJ (1999) Maintaining biodiversity in forest ecosystems. Cambridge University Press, CambridgeJackson DA (1995) PROTEST: a PROcrustean randomization TEST of community environment concor-
dance. Ecoscience 2:297–303Kelly TC (2008) The origin of the avifauna of Ireland. Irish Nat J Spec Suppl 2008:97–107Kent M (2012) Vegetation description and data analysis: a practical approach, 2nd edn. Wiley-Blackwell,
HobokenKlenner W, Arsenault A, Brockerhoff EG, Vyse A (2009) Biodiversity in forest ecosystems and landscapes:
a conference to discuss future directions in biodiversity management for sustainable forestry. For EcolMan 258:S1–S4
Kuuluvainen T (2009) Forest management and biodiversity conservation based on natural ecosystemdynamics in northern Europe: the complexity challenge. AMBIO 38(6):309–315
Lewandowski AS, Noss RF, Parsons DR (2010) The effectiveness of surrogate taxa for the representation ofbiodiversity. Conserv Biol 24(5):1367–1377
Lindenmayer DB, Hobbs RJ (2004) Fauna conservation in Australian plantation forests—a review. BiolCons 119:151–168
Lindenmayer DB, Margules CR, Botkin DB (2000) Indicators of biodiversity for ecologically sustainableforest management. Conserv Biol 14(4):941–950
Luff M (2007) RES handbook volume 4 part 2: the carabidae (ground beetles) of Britain and Ireland. FieldStudies Council, Shropshire
MCPFE (2011) State of forests 2011: Europe’s status & trends in sustainable forest management in Europe.MCPFE, FAO, Warsaw
MCPFE, UNECE, FAO (2007) State of Europe’s forests 2007: the MCPFE report on sustainable forestmanagement in Europe. MCPFE, UNECE, FAO, Warsaw
MEA (2005) Millennium ecosystem assessment (2005) ecosystems and human well-being: biodiversitysynthesis. World Resources Institute, Washington
Messier C, Parent S, Bergeron Y (1998) Effects of overstory and understory vegetation on the understorylight environment in mixed boreal forests. J Veg Sci 9:511–520
Mitchell FJG (2006) Where did Ireland’s trees come from? Biology and Environment 106:251–259
Biodivers Conserv (2014) 23:697–714 713
123

Moran MD (2003) Arguments for rejecting the sequential bonferroni in ecological studies. Oikos100:403–405
O’Hanlon R, Harrrington TJ (2012) Macrofungal diversity and ecology in four Irish forest types. FungalEcol 5:499–508
Oksanen J, Blanchet FG, Kindt R, Legendre P, O’Hara RB, Simpson GL, Solymos P, Henry M, Stevens H,Wagner H (2010) Vegan: community ecology package. R package version 1.17–2. http://CRAN.Rproject.org/package=vegan
Oxbrough A, Irwin S, Kelly TC, O’Halloran J (2010) Ground dwelling invertebrates in reforested coniferplantations. For Ecol Man 259:2111–2121
Oxbrough A, Irwin S, Wilson M, O’Halloran J (2013) Mechanisms and predictors of ecological change inmanaged forests: a selection of papers from the second international conference on biodiversity inforest ecosystems and landscapes. For Ecol Man. doi:10.1016/j.foreco.2013.09.038
Paillet Y, Berges L, Hjalten J, Odor P, Avon C, Bernhardt-Romermann M, Bijlsma R-J, De Bruyn LUC,Fuhr M, Grandin ULF, Kanka R, Lundin L, Luque S, Magura T, Matesanz S, Meszaros I, Sebastia MT,Schmidt W, Standovar T, Tothmeresz B, Uotila A, Valladares F, Vellak KAI, Virtanen R (2010)Biodiversity differences between managed and unmanaged forests: meta-analysis of species richness inEurope. Conserv Biol 24(1):101–112
Paradis E, Claude J, Strimmer K (2004) APE: analyses of phylogenetics and evolution in R language.Bioinformatics 20:289–290
Paritsis J, Aizen MA (2008) Effects of exotic conifer plantations on the biodiversity of understory plants,epigeal beetles and birds in Nothofagus dombeyi forests. For Ecol Man 255(5–6):1575–1583
Paton JA (1999) The liverwort flora of the British Isles. Harley Books, ColchesterPawson S, Brockerhoff E, Meenken E, Didham R (2008) Non-native plantation forests as alternative habitat
for native forest beetles in a heavily modified landscape. Biodivers Conserv 17(5):1127–1148Peres-Neto PR, Jackson DA (2001) How well do multivariate data sets match? The advantages of a
procrustean superimposition approach over the mantel test. Oecologia 129:169–178Purchart L, Tuf IH, Hula V, Suchomel J (2013) Arthropod assemblages in Norway spruce monocultures
during a forest cycle—a multi-taxa approach. For Ecol Man 306:42–51. doi:10.1016/j.foreco.2013.06.012
Riegel GM, Miller RF, Krueger WC (1995) The effects of aboveground and belowground competition onunderstory species composition in a pinus ponderosa forest. For Sci 41(4):864–889
Roberts M (1993) The spiders of great Britain and Ireland (compact edition). Part One. Harley Books,Colchester
Rodrigues ASL, Brooks TM (2007) Shortcuts for biodiversity conservation planning: the effectiveness ofsurrogates. Annu Rev Ecol Syst 38:713–737
Sauberer N, Zulka KP, Abensperg-Traun M, Berg H-M, Bieringer G, Milasowszky N, Moser D, Plutzar C,Pollheimer M, Storch C, Trostl R, Zechmeister H, Grabherr G (2004) Surrogate taxa for biodiversity inagricultural landscapes of eastern Austria. Biol Cons 117(2):181–190
Stace C (2010) New flora of the British Isles, 3rd edn. Cambridge University Press, CambridgeStephens SS, Wagner MR (2007) Forest plantations and biodiversity: a fresh perspective. J For 105(6):
307–313Stork N, Hammond P (1997) Sampling arthropods from tree crowns by fogging with knockdown insecti-
cides: lessons from studies of oak tree beetle assemblages in Richmond Park (UK). In: Stork N, Adis J,Didham R (eds) Canopy arthropods. Chapman and Hall, London, pp 3–26
Straw NA, Fielding NJ, Waters A (1996) Phytotoxicity of insecticides used to control aphids on Sitkaspruce, Picea sitchensis Carr. Crop Protection 15:451–459
Sweeney OFM, Wilson MW, Irwin S, Kelly TC, O’Halloran J (2010) Are bird density, species richness andcommunity structure similar between native woodlands and non-native plantations in an area with ageneralist bird fauna? Biodivers Conserv 19:2329–2342
The Woodland Trust (2007) Back on the map: an inventory of ancient and long established woodland forNorthern Ireland—preliminary report. The Woodland Trust, Bangor
Veinotte C, Freedman B, Maass W, Kirstein F (2003) Comparison of the ground vegetation in spruce plan-tations and natural forest in the Greater Fundy Ecosystem, New Brunswick. Can Field Nat 117:531–540
Wiezik M, Svitok M, Dovciak M (2007) Conifer introductions decrease richness and alter composition oflitter-dwelling beetles (Coleoptera) in Carpathian oak forests. For Ecol Man 247(1–3):61–71
Wolters V, Bengtsson J, Zaitsev AS (2006) Relationship among the species richness of different taxa. Ecol87(8):1886–1895
714 Biodivers Conserv (2014) 23:697–714
123