the value of herbicides in u.s. crop production april
TRANSCRIPT

THE VALUE OF HERBICIDES IN U.S. CROP PRODUCTION
APRIL 2003
LEONARD P. GIANESSI SUJATHA SANKULA
NCFAP ? 1616 P Street, NW, Suite 100 ? Washington, DC 20036
For full report, see www.ncfap.org

THIS STUDY WAS FUNDED BY CROPLIFE AMERICA. THE FOLLOWING ORGANIZATIONS HAVE REVIEWED SECTIONS OF THE REP ORT IN THEIR INTERES T
AND HAVE INDICATED THEIR SUPPORT OF THE STUDY’S FINDINGS. ALMOND BOARD OF CALIFORNIA
AMERICAN SOYBEAN ASSOCIATION
AMERICAN SUGARBEET GROWERS ASSOCIATION
BIOTECHNOLOGY INDUSTRY ORGANIZATION
CALIFORNIA ASPARAGUS COMMISSION
CALIFORNIA CITRUS MUTUAL
CALIFORNIA GRAPE AND TREE FRUIT LEAGUE
CRANBERRY INSTITUTE
GEORGIA FRUIT AND VEGETABLE GROWERS ASSOCIATION
MICHIGAN ASPARAGUS ADVISORY BOARD
MICHIGAN ONION COMMITTEE
MINNESOTA CULTIVATED WILD RICE COUNCIL
MINT INDUSTRY RESEARCH COUNCIL
NATIONAL ASSOCIATION OF WHEAT GROWERS
NATIONAL CORN GROWERS ASSOCIATION
NATIONAL COTTON COUNCIL
NATIONAL ONION ASSOCIATION
NATIONAL POTATO COUNCIL
NATIONAL SUNFLOWER ASSOCIATION
NORTHWEST HORTICULTURAL COUNCIL
OREGON WHEAT GROWERS LEAGUE
UNITED FRESH FRUIT AND VEGETABLE ASSOCIATION
UNITED SOYBEAN BOARD
TEXAS CITRUS MUTUAL
TEXAS VEGETABLE ASSOCIATION
U.S. APPLE ASSOCIATION
WASHINGTON ASPARAGUS COMMISSION
WASHINGTON HOP COMMISSION
Cover Photo Credits: Upper Right (Hand Weeders with Short-Handled Hoes): Harry Agamalian, University of California Lower Right (Cultivator Stuck in Muddy Field): Ellery Knake, University of Illinois Upper Left (Herbicide Trials in Onions): Robin Bellinder, Cornell University Lower Left (Herbicide Application to Remove Weeds Preplanting): Ed Richard, USDA/ARS

Table of Contents
1.0 Introduction
2.0 Background
A. Weeds
B. Tillage
C. Herbicides
D. Historical
3.0 The NCFAP Study
A. The 40 Crops
1. Production Data
2. Herbicide Use
3. Literature Review-Weed Control
a. Historical
b. Organic Practices
B. Herbicide Value Estimation
1. Economic Value
2. Labor Requirements
3. Soil Erosion
4.0 Summary and Conclusions
5.0 Appendices A.1-A.40
A.1 Almonds A.15 Dry Beans A.29 Sorghum A.2 Apples A.16 Grapes A.30 Soybeans A.3 Artichokes A.17 Green Beans A.31 Spinach A.4 Asparagus A.18 Green Peas A.32 Strawberries A.5 Blueberries A.19 Hops A.33 Sugarbeets A.6 Broccoli A.20 Hot Peppers A.34 Sugarcane A.7 Canola A.21 Lettuce A.35 Sunflowers A.8 Carrots A.22 Mint A.36 Sweet Corn A.9 Celery A.23 Onions A.37 Sweet Potatoes A.10 Citrus A.24 Peaches A.38 Tomatoes A.11 Corn A.25 Peanuts A.39 Wheat A.12 Cotton A.26 Potatoes A.40 Wild Rice A.13 Cranberries A.27 Raspberries A.14 Cucumbers A.28 Rice
6.0 Reference List


1
1.0 Introduction
Herbicides for weed control represent 60% of the volume and 65% of the expenditures
for all pesticides used by U.S. farmers (see Table 1). Widespread herbicide use is a
relatively recent development in U.S. agriculture in comparison to insecticides and
fungicides that were routinely used in inorganic chemical formulations on U.S. fruit and
vegetable acreage beginning in the early 1900s. By contrast, widespread use of herbicides
to kill weeds did not begin until the development of synthetic organic chemicals in the
late 1940s. Currently, herbicides are routinely used on more than 90% of the acreage of
most U.S. crops. Herbicides substituted for laborers hoeing weeds out of fields and
reduced the need for cultivation of weeds with mechanical equipment. The period
following the rapid adoption of herbicide technology was characterized by large increases
in crop yields in the U.S. Although a voluminous literature exists that documents the
contribution of herbicides in improving yields and reducing grower costs, no single
reference source has been assembled that quantifies the impacts herbicides have made in
U.S. agricultural production. This report documents for 40 crops the changes in crop
production and economic returns following the widespread adoption of herbicides to
control weeds in the U.S.
This report estimates the total expenditures on herbicides and their application currently
made by U.S. farmers and determines the value of that expenditure in terms of higher
yields and lower costs in comparison to the likely alternatives to herbicides. This report
estimates the economic value of herbicides by simulating the impacts of their nonuse.
There are nonchemical methods for weed control, and this report estimates their use as
replacements for herbicides for the 40 crops selected for study. Essentially, this question
is answered: What would be the likely economic effects if U.S. farmers did not use
herbicides? Answering this question has relevance because of three current
developments:
• Organic Agriculture Organic farmers do not use herbicides and routinely report
that weed control without chemicals is their biggest problem and cost.
Considerable information on the economics of weed control in organic production
is included in this report. By estimating the impacts on U.S. farmers not using

2
herbicides, the implications of a potential widespread conversion of U.S.
agriculture to organic methods are quantified.
• Regulatory Policies Herbicides are heavily regulated by federal and state
agencies. The costs of regulation have increased significantly, and fewer new
herbicides are being registered in the U.S. Older herbicides are also undergoing
regulatory scrutiny, and many registered uses may be withdrawn by
manufacturers or cancelled by regulatory agencies. Quantitative examples of the
impacts on farmers when there are no effective herbicides registered for their use
are included in this report. By estimating the impacts of U.S. farmers doing
without herbicides, the economic effects likely to result if regulatory actions lead
to widespread cancellations of the registered uses of herbicides are quantified.
• Weed Resistance Recently, there has been considerable media attention to the
potential development of “superweeds” that would be resistant to all herbicides.
This issue has emerged as part of the scrutiny of genetically engineered herbicide
tolerant crops and the potential for gene flow to weeds that could gain resistance.
There are numerous examples in the U.S. of specific weed species that have
developed resistance to individual, and even multiple, classes of herbicides. By
estimating the impacts of U.S. farmers doing without herbicides, the likely
impacts if widespread weed resistance develops rendering ineffective the
herbicides currently used in U.S. agriculture are quantified.
It is highly unlikely that U.S. growers will have to do without their use of herbicides in
the foreseeable future. It is highly unlikely that regulatory agencies will prohibit
herbicide use on a large scale, and it is equally unlikely that weed resistance problems
will render herbicides ineffective for all crops. Thus, this report is meant solely to provide
a means of estimating the economic value of a technology. Nevertheless, this report
should be of interest to policymakers, regulators and legislators whose decisions and
rules will affect the future availability of chemical herbicides. The report should be of
interest to the media and the public as they follow ongoing issues such as the
development of genetically engineered crops and the promotion of organic farming.

3
Table 1 Pesticide Use and Expenditures: U.S. Agriculture (1999)
Volume Expenditures % %
Herbicides 60 65 Insecticides 14 18 Fungicides 6 9 Other 20 8 Total 100 100 Source: USEPA [125]


5
2.0 Background
A. Weeds
Weeds are plants growing where they are not wanted. Weeds compete with crops for
moisture, nutrients, sunlight and space thereby resulting in significant crop losses. Weeds
deprive crop plants of natural resources. For example, a corn plant requires 368 pounds of
water to produce one pound of corn, whereas weeds such as lambsquarters and ragweed
use 800 and 950 pounds of water, respectively, to produce a pound of dry matter [148].
One cocklebur may occupy four to eight square feet of soil surface area, thereby reducing
the space available for crop growth. When weeds shade crop plants, less sunlight is
available for crop production.
Natural weed populations in most fields are high enough to cause devastating yield losses
in most crops if not controlled by some method [279]. Loss figures of 50-90% are not
uncommon for crops grown in natural weed infestations [277] [278]. Yield losses depend
on the competing weed species and its density. Corn yields were reduced 10% by giant
foxtail, 11% by common lambsquarters, 18% by velvetleaf and 22% by common
cocklebur at a density of only two plants per foot of row [45].
Weed seeds present in harvested crop can cause rejection of the crop by processors. For
example, presence of nightshade or morningglory seed, similar in size, shape and color to
pea or lima bean, leads to refusal of whole harvested loads. Weeds harvested with crops
like mint and spinach lead to product contamination and off flavors, which result in lower
prices for farmers.
Weeds are different from other pests that pose problems in crop production. Weeds are
less transient and less difficult to predict than other crop pests. Weed populations in crop
fields are relatively constant while outbreaks of insect and disease pathogens are
sporadic.
There are several characteristics that set weeds apart from crop plants. Weeds germinate
over a wide range of environmental conditions and have faster rates of development due

6
to high food production efficiency compared to crop plants. These characteristics offer
physiological advantages to weeds over crop plants. Weeds typically are able to produce
seed before the crop is harvested, are self-pollinated, and have long periods of seed
production. Moreover, weed seeds are excellent travelers. Many possess special
adaptations such as hooks, wings and spines that aid in their long and short distance
spread by wind, water, livestock, human beings or farm equipment.
Two other factors that contribute to the strong competitive nature of weeds include high
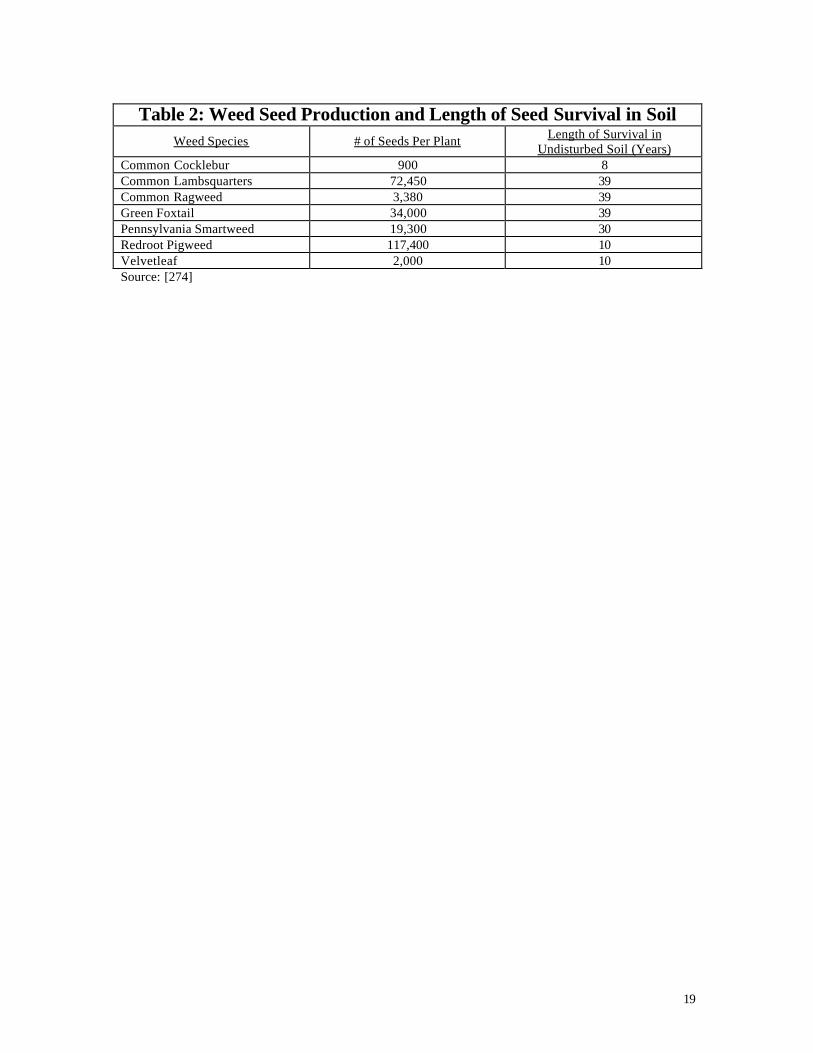
seed production, leading to high population density and survival in the soil [272]. Weed
species re-infest the soil primarily due to the large amounts of seeds produced by a single
plant. Table 2 lists the number of seeds produced per plant by several weed species of
importance to U.S. crop production. For instance, seed production of individual redroot
pigweed, common ragweed and lambsquarters can be as high as 117,400, 3,380 and
72,450, respectively [273].
The high fecundity of weeds has contributed to the millions of buried weed seeds in a
typical acre of cropland in the U.S. In Minnesota, weed seed counts at four different
locations in 24 different plots varied from 98 to 3068 weed seeds per square foot of soil
six inches deep – that converts to 4 million to 133 million seeds per acre [272]. In
western Nebraska, average cropland soil contained 200 million seeds per acre [274]. In a
similar Colorado experiment, 122 million weed seeds per acre were present in the upper
25 cm of the soil profile [346]. In California vineyards, counts of 40 million weed seeds
per acre have been estimated [412]. In Iowa, the average weed seed counts ranged from
113 million to 613 million seeds per acre [413].
The number of weed seeds that germinate and emerge in any given year is quite low in
relation to the total number of seeds present – perhaps only 5-10% of the total seed
population [275]. A very high percentage of the total weed seed population in the soil
survives from one year to the next. Seed longevity represents a major survival mechanism
for weed species; it constitutes a continuing source of emerging weeds in croplands
[273]. Table 2 lists the length of survival in soil of several common weed species in U.S.
crop fields. The seeds of these species can survive in the soil for decades. A typical
population of emerged weeds in cropland is approximately 2.5 million weeds

7
per acre.
An experiment was started in 1902 at the Arlington Experimental Farm, Rosslyn, Va., to
determine the longevity of seeds buried in the soil under natural conditions. This
experiment was terminated in 1941 when the site was occupied by the U.S. War
Department [370]. A large percent of the seeds buried in 1902 germinated when dug up
in 1941: velvetleaf (48%), morningglory (31%), jimsonweed (91%), black nightshade
(83%) and ragweed (22%) [370] (see Table 2).
On the basis of life duration, weeds are classified as annuals (winter or summer),
biennials and perennials. Annual weeds complete their life cycle in one growing season
only. While summer annuals (e.g. lambsquarters, ragweed, morningglory, pigweed)
germinate in spring, produce seed in summer and die in fall, winter annuals (e.g.
chickweed, shepherd’s-purse, redstem filaree, annual bluegrass) germinate in late
summer, go dormant during the winter, produce seed in spring and die in summer. Seeds
of biennial weeds germinate in spring, summer or fall of the first year, overwinter with a
storage root and rosette leaves and flower and produce seed in winter of the second year
upon exposure to cold. Perennial weeds, by definition, survive for an indefinite number
of years and produce new aerial stems each year from underground roots and stems.
Perennial weeds often have extensive root systems and reproduce by both vegetative (e.g.
tubers, rhizomes, stolons, suckers) and sexual (seed) means. In addition, perennial weeds
have the ability to propagate and regenerate from pieces of stems and roots. Therefore,
they are the most difficult to control weeds in field crops. Some examples of perennial
weeds are horsenettle, Canada thistle, Johnsongrass, nutsedge, and bermudagrass.
The life cycle of weeds starts with seed germination and emergence followed by
vegetative development and competition and ending in the reproductive phase and seed
production. Weed seeds remain dormant or inactive in the soil until conditions are right
for germination. Germination requirements of weeds and crop are typically similar. Four
factors affect the dormancy and germination of weed seeds: soil temperature, moisture,
oxygen and light. The soil temperature requirement of weed seeds varies between

8
species. For example, summer annuals require 650 to 950 F to germinate while winter
annuals need comparatively low temperatures between 400 and 600 F [272].
Moisture availability is a major factor that determines the onset of germination. Moisture
activates enzymes needed to break down the stored food, increase respiration and activate
cell division at growing points. Some weed species germinate over a large range of water
tensions while germination in others occur only at a specific water tension. Most weed
seeds need moisture content of at least 14% of their weight to initiate germination [272].
Weed seeds remain dormant if the desired moisture levels are not present.
Soil oxygen levels needed for germination differ between cropping systems. Soil oxygen
levels are 8 – 9% in corn but are less than 1% in rice [272]. Soil oxygen is lower in rice
fields due to the maintenance of flood conditions to prevent weed germination and
growth. Therefore, weeds in a rice cropping system are adapted to germinate at lower
oxygen levels than the weeds in upland crops. Germination of most weed seeds is
sensitive to light and does not occur in non- ideal conditions such as shade provided by
the crop canopy. Upon exposure to specific environmental cues, weed seeds germinate in
flushes. The time of this flush varies by species and the prevailing environmental
conditions. Some species may have more than one flush per season. The first flush of
germinating weeds usually originates from the top 1 – 4 inches of soil depth [273]. In
addition to germinating in flushes, some weeds germinate throughout the crop season.
Weed species differ in the time of first emergence and the length of emergence. Weeds
such as giant ragweed and woolly cupgrass are characterized as early emerging while
pigweed and crabgrass are late emerging. Some weeds, such as wild radish, have adapted
sporadic germination patterns to survive control measures [272]. However, a small
percent of all weed species emerge throughout the season. Early emerging weeds are a
major threat to crop production, as they are the most competitive and produce the most
seed. The survival of late emerging weeds is usually low due to shading by crop. Even
though few and with no impact on crop yields, late emerging weeds are still a concern
because of their contribution to soil seedbank.

9
The struggle for existence between weed and crop plants generally starts at an early stage
(seedling stage). Soon after emergence, weeds interact with nearby plants, either with
other weeds or crop, and vie for the shared growth resources (light, soil moisture, carbon
dioxide, nutrients and space). The mutually adverse effect of weeds and crop that utilize
limited resources is called competition. In other words, the competitiveness of a plant is
its relative ability to obtain a specific resource. If weeds are able to compete for and
utilize a sufficient amount of some growth factor to the detriment of the crop, the result is
an adverse impact on crop yield.
Crops vary greatly in their ability to compete with weeds. Vegetable crops such as onion
and pea, in general, are poor competitors while agronomic crops such as corn and
soybean are good competitors. Broadleaved weeds in general are more competitive than
grass weeds. This is because of the greater leaf area of broadleaf weeds, which aids in
higher light interception. For instance, common cocklebur, an important weed in soybean
production, reduced yields by 80% at a density of nine plants/square meter whereas yield
reduction from less competitive giant foxtail was 10% from six plants per square meter
[276]. Weeds that emerge prior to or along with crop exert the most effect on crop yield
than the ones that emerge later.
For most crops, it is critical that fields are kept weed-free during the first four to six
weeks after planting to prevent serious yield losses from early season weed competition.
The critical period for weed control results from the effects of weed competition not
being uniform throughout the year. Rather, yield reduction occurs only during certain,
typically brief, stages of crop growth. Weeds must be controlled during this time.
Research has shown that soybean fields should be kept weed-free four to six weeks after
planting [276]. Any weed emerging in the crop after this initial weed-free period will not
compete effectively with soybean and will not affect yield potential due to the soybean
canopy, which shades the emerging weeds. For a sweet corn variety maturing in 10
weeks, this critical period occurs from week two to week five. This means that weeds
emerging during the first week will not cause corn yield reductions if they are removed

10
before the fifth week. Weeds emerging after the fifth week will not result in yield
reduction if not controlled [271].
Critical periods of crop-weed competition vary depending on crop, weed, weather,
growing conditions, soil type and tillage. Critical weed-free period for horticultural crops
such as snap bean usually occurs sooner and stays longer than for agronomic crops,
mainly due to the poor competitive ability of horticultural crops. Environmental
conditions may affect weeds and crop differently each year and could affect the length of
critical weed-free period. The critical weed-free period concept does not mean that weeds
can be ignored except during the critical period. It merely helps determine when it is
necessary to undertake control measures to avoid yield losses. Weeds present after the
end of the weed-free period may not reduce yield but can make harvest difficult and
contribute to the soil seedbank.
A large number of weed species infest crop fields in the U.S. However, only two to four
species typically dominate the weed population in a field [274]. In a typical field in the
Midwest, weed control strategies are generally planned based on two grass weed species
and three to five broadleaf species. Table 3 lists important weed species infesting selected
crops in major producing states. This Table shows estimates of the percentage of crop
acreage in each state infested with each species. Some species are very common –
infesting more than 90% of the acreage while other species infest a much smaller area. A
combination of broadleaf and grass weed species infest a sizable portion of the acreages
in all states. Table 3 also contains estimates of the potential impacts on crop yields of
uncontrolled populations of each weed species in each state. Some weed species are very
competitive and would reduce yields by more than 80% if not controlled while other
weed species are less competitive and would likely reduce yield by 5% if not controlled.

11
B. Tillage
One of the primary reasons for growing crops in rows was to allow the passage of
cultivation equipment pulled by draft animals. Row widths were dictated by the
minimum distance needed for the draft animal. Many types and sizes of tillage equipment
are available: harrows, cultivators, tandem disks, rotary hoes and the moldboard plow.
Cultivation is used to control weeds either prior to planting the crop or during the crop
growth season. Weed control by the tillage method is achieved primarily by 1) the burial
of small annual weeds in soil thrown over them through the action of tillage tools and 2)
the disruption of the intimate relationship between the weed plant and the soil, whereby
a) the soil is loosened about the roots, resulting in disruption of water absorption and
death by desiccation, or b) the plant is “cut off” below ground. Pre-plant tillage helps in
weed management by cutting the existing weeds loose from soil and breaking them apart,
burying the weed seeds in deeper soil layers to prevent them from germinating, and
bringing the weed seeds to soil surface to trigger germination as a means to control them.
In-crop cultivation kills the weeds between crop rows by cutting the plant tops from roots
and burying them leading to desiccation and depletion of food reserves. Cultivation is
most effective at seedling stage (before secondary root formation) of weeds as this stage
has no food reserves and is vulnerable to root disturbance. Cultivation is not effective in
controlling the weeds in crop rows because of potential crop injury. Cultivation is less
effective in controlling perennial weeds as they quickly sprout from the underground
roots, tubers or rhizomes. Rather than controlling these weeds, cultivation can spread
them by dragging the self-propagating structures such as rhizomes along the rows.
Best results from cultivation are obtained with small (< 2.5 inches) weeds. Large weeds
are difficult to bury and have sufficient roots to escape total separation from the soil.
Cultivation equipment can also be clogged by the larger weeds. Effective cultivation
needs dry soil both at the surface and below the depth of cultivation. Dry soil promotes
desiccation of the uprooted weeds. Proper soil moisture for working the ground will also
avoid damage to soil structure. Cultivation while the soil is too wet will simply transplant
weeds, especially the vegetative reproduction organs of perennial weeds. The same
12
problem can occur if rainfall occurs soon after cultivation. Ample moisture in the soil
will promote weed survival after cultivation [272].
The criteria for optimal weed size and soil moisture are two limitations to the use of
cultivation for weed control. These can be especially critical if cultivation is used as the
sole means of weed control. Untimely rain that delays the use of cultivation can result in
large uncontrollable weeds [272].
Surveys of farmers who have stopped cultivation in preference to herbicide use indicate
that farmers reject cultivation because it is too time-consuming and intrusive into other
needed work [414]. Cultivation of large acreages requires continuous weeks of effort,
which is particularly burdensome on farmers who use little or no hired help. Effective
cultivation also creates an unwanted dependency on the weather. In years with a
particularly wet spring and early summer, cultivation has to be postponed, which means
farmers lose control over the timing of their operations [414].
C. Herbicides
Herbicides are chemicals that kill plants. Plants are complex organisms in which
multitudes of vital processes take place in integrated sequences. Some of these vital
metabolic plant processes include photosynthesis, amino acid and protein synthesis, lipid
synthesis, pigment synthesis, nucleic acid synthesis, respiration, cell division and
maintenance of membrane integrity. Herbicides injure and kill plants by interfering with
the normal function of one or more of these vital processes. This ability of herbicides to
kill certain plants without causing any effect on other plants is called “selectivity”.
Herbicides that kill most plant species are called nonselective herbicides. Herbicides such
as 2,4-D, fomesafen and triclopyr are phytotoxic to broadleaf weeds while clethodim and
sethyoxydim are toxic only to grass weeds. Selective herbicides do not injure crop but are
toxic to weeds only.

13
Crop plants escape the toxic effects of herbicides through physical or biochemical
mechanisms. Physical methods of selectivity are based on the difference in volume of
herbicide retained by crop and weed plants. These differences arise due to crops and
weeds having different leaf arrangements, leaf angles or surface wax properties.
Biochemical selectivity stems from reduced herbicide uptake, rapid degradation,
deactivation or metabolism of the chemical. Wheat and other grass crop plants (corn,
rice) tolerate 2,4-D and MCPA because they can metabolize these herbicides faster than
broadleaf plants. When atrazine is applied for weed control in corn, corn plants deactivate
atrazine by binding to naturally occurring plant chemicals. Similarly, soybean tolerance
to metribuzin is partially due to the deactivation of the herbicide by binding to plant sugar
molecules. Susceptible weeds either cannot metabolize the herbicide or metabolize it too
slowly for detoxification.
Herbicides are grouped based on how they kill the plants (termed as mode of
action), timing of their application and chemical structure. Herbicides are contact,
translocated, or soil applied depending on their mode of action. Contact
herbicides are those that do not readily trans locate in the plant. As a result, contact
herbicides such as glufosinate cause only localized injury at the point of contact
on plants. On the other hand, translocated or systemic herbicides such as
glyphosate and 2,4-D move within the plant system along with food or water.
Referred to as residual herbicides (e.g. trifluralin, s-metolachlor), soil applied
herbicides are the ones which need to be absorbed by roots or emerging shoots.
Timing of herbicide treatments depends on several factors: herbicide used, its persistence,
weed characteristics, weather and soil conditions. Based on the time of application,
herbicides are classified as preplant, pre-emergence (PRE), or post-emergence (POST)
herbicides. While preplant applications refer to herbicide treatments made to soil prior to
planting the crop, PRE herbicides are the ones applied after planting but before crop
and/or weeds have emerged. Both preplant and PRE herbicides need to be moved to the
top 1 inch to 3 inch soil depth by mechanical incorporation or rainfall to be active against
the germinating weed seeds. The majority of weed seeds germinate from the top 1 to 2
inches of soil surface. POST herbicide applications are made following the emergence of
weed and/or crop.

14
Weed control with PRE herbicides provides crop with a competitive advantage due to the
control of weeds early on. Pre-emergence herbicides remain active in the soil for an
extended period of time, thereby providing residual control of weeds. In orchard crops,
pre-emergence herbicides can stay active for six months. Seedlings of germinating weeds
that come in contact with PRE herbicides absorb the chemical through roots or shoots
resulting in phytotoxicity.
POST herbicides are usually applied when weeds are growing actively. A compound
called “surfactant” may be added to POST sprays to enhance the performance of the
herbicide. The surfactant improves the coverage of the herbicide on leaves by reducing
the surface tension of the spray droplets and allowing greater pesticide contact. Post-
emergence herbicides need a specified drying time for maximum effectiveness (rainfast
period). Rainfast period is the length of time that needs to pass after herbicide application
before an irrigation or rainfall event to ensure that plants had enough time to absorb the
herbicide. Rainfast period differs between different herbicides (2 min for lactofen versus
2 hr for glyphosate).
Herbicides that are chemically similar usually produce the same type of physiological
reaction in plants and control similar species. Therefore, herbicides with a common
chemistry have been organized into families. Herbicide families, based on how they kill
plants (mechanism of action), are grouped as amino acid synthesis inhibitors, cell
membrane disruptors, growth regulators, lipid synthesis inhibitors, pigment inhibitors,
photosynthesis inhibitors and seedling growth inhibitors. Generally, individual crops are
treated with two to three herbicides. For example, separate herbicides may be used pre-
emergence to control the major broadleaf and grass weeds infesting a crop. Additional
herbicides may be used post-emergence to control emerged weeds that are missed by the
pre-emergence application.

15
D. Historical
In the early years of crop production in the U.S., human labor was used to remove weeds
from fields. As late as 1850, 65% of the U.S. population lived on farms and removing
weeds was one of the main farm chores [415]. The development of machinery powered
by animals and tractors made mechanical cultivation of weeds possible. A common
recommendation for control of perennial weeds was to fallow a field for a year and
cultivate it 12-14 times [415]. Certain weed problems received congressional attention. In
1901, Congress appropriated funds to research control of Johnsongrass. In 1935,
Congress appropriated funds to research the control of field bindweed, a perennial that
was rapidly spreading across the Midwest and west. Bindweed infestations had resulted
in substantial acreages of productive wheat land being taken out of production in the
northwest [415]. In Kansas, some loan companies refused to accept mortgages on farms
infested with bindweed [417].
It had been known for centuries that certain materials, such as salt, would kill plants if
applied at heavy rates; however, it left the soil unusable for a period of time [415]. Salt
was extensively used to kill bindweed in Kansas. Salt was applied at a rate of 20 to 25
tons per acre in a layer about one fifth of an inch thick [417]. A few plants would still
come up and had to be treated the following year. Salt was used extensively on railroad
and highway rights of way [416]. However, since it left the soil barren for an extended
period of time, it was impractical for cropland. One two-acre field in Kansas was still
barren 17 years after being salted [417]. In Kansas between 1937 and 1947, farmers
applied 16 million pounds of sodium chlorate, 120 million pounds of sodium chloride and
two million pounds of borax for control of bindweed [375].
In the early 1900s, research was conducted with copper, iron and arsenic for potential in
weed control [416]. These inorganic chemicals burned or poisoned the plant tissues,
killing those parts of the plant that they touched directly. Several of these inorganic
compounds were used extensively to control weeds in non-cropland areas such as along
rights of way and irrigation ditchbanks, but were not used in agriculture. Farmers showed
little interest in inorganic chemical weed killers. They found that treatment required large

16
quantities of the chemicals with a resulting high cost-per-acre. Further, the frequently
toxic, flammable or corrosive chemicals seldom killed weeds effectively or consistently
[411]. Beginning in 1919, oils and kerosene were increasingly used to control weeds in
non-cropland areas and also found some uses in crops that tolerated their use: citrus,
cranberries and carrots [416].
At the time the federal-state research program on field bindweed was initiated (1935),
there were six full- time federal weed researchers in the U.S. and not more than ten to
twelve state experiment station workers in the U.S. These workers were spending one-
tenth to one-third of their time on weed research [416]. In contrast, there were more than
500 full-time federal and state experiment station workers in each of the fields of
entomology and plant pathology [416].
Between 1880 and the mid 1930s, several botanists pursued a different line of
investigation that made possible the discovery of herbicides. Botanists had long been
intrigued with plant shoot and root growth and the mechanisms causing plants to respond
to stimuli [393]. Plant physiologists also found that some chemicals induced rooting,
hastened the ripening and coloring of fruits or even produced seedless tomatoes. Workers
had noted that too large an amount of a growth regulator injured plant tissues. Distortion
of various parts of the plant was common; sometimes the overdose even killed the plant.
When this occurred, the scientists merely tossed the dead plants aside [411].
In the early 1940s, some researchers began to test a new plant regulator chemical
compound for herbicidal activity. The chemical was 2,4-dichlorophenoxyacetic acid
(2,4-D). Public researchers in the 1942-1944 time period tested 2,4-D as an herbicide
and reported success in killing field bindweed with the chemical. 2,4-D was tested on
lawns and golf courses with the result that broadleaf weeds were killed with no injury to
the lawn or turf grasses. The articles about field bindweed stimulated interest by
regulatory agencies with bindweed eradication programs. USDA ordered human toxicity
studies in 1945, which proved negative. The first year of widespread testing and sale of
2,4-D in the U.S. was 1945, and 917,000 pounds were produced. Production rose to 14
million pounds in 1950. 2,4-D proved useful to selectively control broadleaf weeds
without harm to grass crops (wheat, corn, rice) [411].

17
Significant plant research with chemicals was carried out in secret during World War II
by the U.S. Army at Camp Detrick, Maryland. The research was focused on the testing of
chemicals for destroying crops. All of the research at Camp Detrick was kept under
military secrecy until the end of World War II. The entire June 1946 issue of the
Botanical Gazette consisted of papers from Camp Detrick scientists. Among the
accomplishments of the Camp Detrick scientists were the development of methods for
evaluating over 1,000 chemical compounds for their herbicidal properties, defining the
selective action of sprays on broadleaf plants, identifying the herbicidal effects of soil and
water applications and determining the dosages required [393].
Chemical companies appreciated the value and potential of the market for herbicides; by
1947 they had placed 30 different preparations of herbicides containing 2,4-D on the
market. In 1949, they marketed 20 different kinds of systemic organic herbicides. These
included chemicals tested at Camp Detrick, such as IPC, which killed grasses without
harming broadleaf crops. By 1962, companies marketed about 100 herbicides in 6,000
different formulations. Increased specificity for particular weed problems in individual
crops under different soil and climatic conditions accounted for this increased
development of products [411]. Within 2 years of the introduction of 2,4-D, the acreages
in the Northwest that previously had been heavily infested with bindweed were brought
into wheat production [415].
The discovery of 2,4-D and the resultant publicity provided the stimuli that started weed
research on its way as a new science. Weed research suddenly became popular and many
scientists became interested in studying the impacts of chemicals on weeds and crops.
Calculations were made as to how many weeds could be killed at what cost using
herbicides. For example, one estimate was that for 50 cents (the cost of one pint of 2,4-D)
a spray operator could kill 20 million weeds in an hour [353]. This estimate was based on
spraying ten acres in one hour and an infestation of 50 weeds per square foot. Many
thousands of chemicals were screened and many hundreds were tested [416]. Funds for
weed control research at ARS and at state experiment stations increased from $800,000 in
1950 to $4.6 million in 1962 [416]. By 1962, the number of federal and state weed
research workers had increased to the equivalent of 246 fulltime workers [416].

18
State and regional weed control conferences had been organized in the 1930s and 1940s.
In 1949, the Association of Regional Weed Control Conferences was organized. It
initiated the first scientific periodical devoted to weeds in 1951- Weeds - and organized
the first joint weed meeting in 1953. The Weed Society of America was organized in
1954 and held its first meeting in 1956. The Society, now the Weed Science Society of
America adopted Weeds, now Weed Science, as its official journal.
University weed science researchers have played an important role in the testing of new
herbicides for efficacy and crop safety. These scientists have been responsible for making
recommendations to farmers in their states regarding the cost-effectiveness of available
weed control strategies and for conducting research into possible weed control methods
for use in controlling the most troublesome weeds facing growers.
19
Table 2: Weed Seed Production and Length of Seed Survival in Soil Weed Species # of Seeds Per Plant Length of Survival in
Undisturbed Soil (Years) Common Cocklebur 900 8 Common Lambsquarters 72,450 39 Common Ragweed 3,380 39 Green Foxtail 34,000 39 Pennsylvania Smartweed 19,300 30 Redroot Pigweed 117,400 10 Velvetleaf 2,000 10 Source: [274]

20
Table 3: Weed Species Infestations By State and Crop (Selected Species Only)
% State Crop Species Acreage Potential Infested Yield Loss ALABAMA COTTON COCKLEBUR, COMMON 48 85 ALABAMA COTTON CRABGRASS, LARGE 43 60 ALABAMA COTTON SICKLEPOD 20 45 ALABAMA SWEET POTATOES COCKLEBUR, COMMON 20 70 ALABAMA SWEET POTATOES CRABGRASS, LARGE 80 50 ALABAMA SWEET POTATOES NUTSEDGE, YELLOW 20 25 ALABAMA SWEET POTATOES SICKLEPOD 50 35 ARKANSAS RICE BARNYARDGRASS 100 50 ARKANSAS RICE RED RICE 60 50 ARKANSAS RICE SIGNALGRASS, BROADLEAF 50 30 CALIFORNIA ALMONDS BARNYARDGRASS 40 10 CALIFORNIA ALMONDS FIELD BINDWEED 15 20 CALIFORNIA ASPARAGUS GROUNDSEL, COMMON 70 10 CALIFORNIA ASPARAGUS NUTSEDGE, YELLOW 20 20 CALIFORNIA ASPARAGUS THISTLE, RUSSIAN 10 25 CALIFORNIA BROCCOLI GROUNDSEL, COMMON 50 25 CALIFORNIA BROCCOLI MALLOW, LITTLE 60 35 CALIFORNIA BROCCOLI NIGHTSHADE, HAIRY 50 40 CALIFORNIA CARROTS BARNYARDGRASS 70 100 CALIFORNIA CARROTS GROUNDSEL, COMMON 60 50 CALIFORNIA CARROTS PURSLANE, COMMON 25 50 CALIFORNIA CITRUS BARNYARDGRASS 30 5 CALIFORNIA CITRUS BERMUDAGRASS 15 20 CALIFORNIA CITRUS NUTSEDGE, YELLOW, PURPLE 15 5 CALIFORNIA GRAPES BARNYARDGRASS 70 10 CALIFORNIA GRAPES FIELD BINDWEED 15 20 CALIFORNIA GRAPES JOHNSONGRASS 20 30 CALIFORNIA LETTUCE GOOSEFOOT, NETTLELEAF 40 90 CALIFORNIA LETTUCE GROUNDSEL, COMMON 70 50 CALIFORNIA LETTUCE NETTLE, BURNING 60 50 CALIFORNIA ONIONS BARNYARDGRASS 50 90 CALIFORNIA ONIONS MALLOW, LITTLE 60 60 CALIFORNIA ONIONS SOWTHISTLES 60 90 CALIFORNIA TOMATOES BARNYARDGRASS 90 90 CALIFORNIA TOMATOES MALLOW, LITTLE 30 30 CALIFORNIA TOMATOES NIGHTSHADE, HAIRY 60 30 COLORADO DRY BEANS KOCHIA 50 50 COLORADO DRY BEANS NIGHTSHADE, HAIRY 65 30 COLORADO DRY BEANS PIGWEED, REDROOT 85 60 CONNECTICUT SWEET CORN CRABGRASS, LARGE 99 100 CONNECTICUT SWEET CORN LAMBSQUARTERS, COMMON 90 85 CONNECTICUT SWEET CORN PIGWEED, REDROOT 90 100 DELAWARE SOYBEANS CRABGRASS 80 85 DELAWARE SOYBEANS LAMBSQUARTERS 90 60 DELAWARE SOYBEANS MORNINGGLORIES 90 35 DELAWARE SOYBEANS PANICUM, FALL 70 30 FLORIDA CUCUMBERS AMARATH, SPINY 65 95 FLORIDA CUCUMBERS GOOSEGRASS 80 80 FLORIDA CUCUMBERS PUSLEY, FLORIDA 40 95 FLORIDA SUGARCANE BERMUDAGRASS 60 10 FLORIDA SUGARCANE ITCHGRASS 20 60 FLORIDA SUGARCANE PANICUM, FALL 60 50 GEORGIA COTTON COCKLEBUR, COMMON 80 70 GEORGIA COTTON MORNINGGLORIES 80 40 GEORGIA COTTON NUTSEDGE, YELLOW 45 30 GEORGIA COTTON PANICUM, TEXAS 80 40 GEORGIA COTTON PIGWEEDS 85 65

21
Table 3: Weed Species Infestations By State and Crop (Selected Species Only) % State Crop Species Acreage Potential Infested Yield Loss GEORGIA COTTON SICKLEPOD 70 40 GEORGIA PEANUTS BEGGARWEED, FLORIDA 80 32 GEORGIA PEANUTS COCKLEBUR, COMMON 35 55 GEORGIA PEANUTS CRABGRASS 90 40 GEORGIA PEANUTS MORNINGGLORY 60 28 GEORGIA PEANUTS NUTSEDGE, YELLOW 50 16 GEORGIA PEANUTS PUSLEY, FLORIDA 94 45 GEORGIA PEANUTS SICKLEPOD 80 35 IDAHO HOPS BARNYARDGRASS 100 5 IDAHO HOPS LAMBSQUARTERS, COMMON 100 20 IDAHO HOPS NIGHTSHADE 100 15 IDAHO HOPS PIGWEED 100 20 IDAHO POTATOES BINDWEED, FIELD 25 40 IDAHO POTATOES KOCHIA 40 25 IDAHO POTATOES LAMBSQUARTERS, COMMON 60 20 IDAHO POTATOES NIGHTSHADES 90 30 ILLINOIS SOYBEANS COCKLEBUR, COMMON 30 50 ILLINOIS SOYBEANS FOXTAILS, GIANT 95 20 ILLINOIS SOYBEANS JIMSONWEED 30 30 ILLINOIS SOYBEANS LAMBSQUARTERS, COMMON 60 60 ILLINOIS SOYBEANS PIGWEED, REDROOT 60 60 ILLINOIS SOYBEANS SMARTWEED, PENNSYLVANIA 40 30 IOWA CORN COCKLEBUR, COMMON 50 15 IOWA CORN CUPGRASS, WOOLLY 20 40 IOWA CORN FOXTAILS, GIANT 99 30 IOWA CORN PIGWEEDS 70 15 IOWA CORN SMARTWEED, PENNSYLVANIA 50 20 IOWA CORN VELVET LEAF 70 25 KANSAS SORGHUM COCKLEBUR, COMMON 35 70 KANSAS SORGHUM CRABGRASS, LARGE 80 60 KANSAS SORGHUM FOXTAILS 90 60 KANSAS SORGHUM PIGWEEDS 100 95 LOUISIANA SUGARCANE BERMUDAGRASS 40 15 LOUISIANA SUGARCANE ITCHGRASS 25 40 LOUISIANA SUGARCANE JOHNSONGRASS 60 50 LOUISIANA SUGARCANE JUNGLEGRASS 80 10 MAINE BLUEBERRIES BRACKENFERN 10 10 MAINE BLUEBERRIES BUNCHBERRY 50 20 MAINE BLUEBERRIES OATGRASS 50 10 MAINE BLUEBERRIES PANICUM, FALL 30 10 MAINE CORN FOXTAILS 60 50 MAINE CORN LAMBSQUARTERS 95 65 MAINE CORN NIGHTSHADES 25 50 MAINE CORN PIGWEEDS 95 70 MAINE CORN QUACKGRASS 75 80 MARYLAND CUCUMBERS CRABGRASS, LARGE 20 30 MARYLAND CUCUMBERS GOOSEGRASS 10 20 MARYLAND CUCUMBERS JIMSONWEED 30 30 MARYLAND CUCUMBERS LAMBSQUARTERS, COMMON 90 60 MARYLAND CUCUMBERS PIGWEED, SMOOTH 90 20 MARYLAND CUCUMBERS PURSLANE, COMMON 70 10 MARYLAND WHEAT CHICKWEED, COMMON 20 20 MARYLAND WHEAT GARLIC, WILD 20 10 MARYLAND WHEAT RYEGRASS, ITALIAN 15 15 MARYLAND WHEAT THISTLE, CANADA 10 10 MASSACHUSETTS APPLES DANDELION 90 20 MASSACHUSETTS APPLES ORCHARDGRASS 50 10 MASSACHUSETTS APPLES QUACKGRASS 25 10

22
Table 3: Weed Species Infestations By State and Crop (Selected Species Only) % State Crop Species Acreage Potential Infested Yield Loss MASSACHUSETTS POTATOES BARNYARDGRASS 65 35 MASSACHUSETTS POTATOES CRABGRASS, LARGE 95 35 MASSACHUSETTS POTATOES FOXTAIL, YELLOW 50 50 MASSACHUSETTS POTATOES LAMBSQUARTERS, COMMON 100 50 MASSACHUSETTS POTATOES MUSTARD, WILD 65 50 MASSACHUSETTS POTATOES PURSLANE, COMMON 50 35 MASSACHUSETTS POTATOES QUACKGRASS 35 50 MASSACHUSETTS TOMATOES BARNYARDGRASS 65 50 MASSACHUSETTS TOMATOES CRABGRASS, LARGE 95 50 MASSACHUSETTS TOMATOES DANDELION 40 25 MASSACHUSETTS TOMATOES LAMBSQUARTERS, COMMON 100 75 MASSACHUSETTS TOMATOES PIGWEED, REDROOT 100 75 MICHIGAN ASPARAGUS DANDELION 50 10 MICHIGAN ASPARAGUS HORSEWEED 30 30 MICHIGAN ASPARAGUS PANICUM, FALL 30 10 MICHIGAN ASPARAGUS VELVET LEAF 20 20 MICHIGAN ONIONS BARNYARDGRASS 80 80 MICHIGAN ONIONS LADYSTHUMB 60 50 MICHIGAN ONIONS PIGWEED, REDROOT 80 70 MICHIGAN ONIONS PURSLANE, COMMON 100 80 MICHIGAN POTATOES BARNYARDGRASS 30 30 MICHIGAN POTATOES CRABGRASS, LARGE 30 30 MICHIGAN POTATOES LAMBSQUARTERS, COMMON 50 30 MICHIGAN POTATOES NUT SEDGE, YELLOW 20 30 MICHIGAN POTATOES PIGWEED, REDROOT 60 30 MISSISSIPPI COTTON CRABGRASS, SOUTHERN 85 30 MISSISSIPPI COTTON HEMP SESBANIA 70 35 MISSISSIPPI COTTON JOHNSONGRASS 60 60 MISSISSIPPI COTTON MORNINGGLORIES 70 85 MISSISSIPPI SOYBEANS BARNYARDGRASS 35 40 MISSISSIPPI SOYBEANS COCKLEBUR, COMMON 45 55 MISSISSIPPI SOYBEANS JOHNSONGRASS 70 65 MISSISSIPPI SOYBEANS PIGWEEDS 65 60 MISSOURI SOYBEANS COCKLEBUR, COMMON 80 40 MISSOURI SOYBEANS CRABGRASS, LARGE 30 40 MISSOURI SOYBEANS LAMBSQUARTERS, COMMON 50 30 MISSOURI SOYBEANS PIGWEED, REDROOT 30 20 MONTANA WHEAT BROME, DOWNY 15 20 MONTANA WHEAT KOCHIA 40 30 MONTANA WHEAT OAT, WILD 60 40 MONTANA WHEAT THISTLE, RUSSIAN 30 20 NEW HAMPSHIRE APPLES CLOVER, WHITE 30 5 NEW HAMPSHIRE APPLES DANDELION 90 15 NEW HAMPSHIRE APPLES QUACKGRASS 95 35 NEW JERSEY CUCUMBERS GALINSOGA, HAIRY 50 100 NEW JERSEY CUCUMBERS NUTSEDGE, YELLOW 30 100 NEW JERSEY CUCUMBERS PURSLANE, COMMON 100 50 NEW JERSEY CUCUMBERS RAGWEED, COMMON 75 100 NEW JERSEY TOMATOES FOXTAILS, GIANT 50 50 NEW JERSEY TOMATOES LAMBSQUARTERS, COMMON 100 75 NEW JERSEY TOMATOES PURSLANE, COMMON 50 25 NEW JERSEY TOMATOES RAGWEED, COMMON 50 75 NEW MEXICO COTTON BARNYARDGRASS 90 15 NEW MEXICO COTTON CLUSTERGRASS 25 50 NEW MEXICO COTTON MORNINGGLORIES 60 60 NEW MEXICO COTTON PIGWEEDS 100 35 NEW MEXICO HOT PEPPERS ANODA, SPURRED 90 40 NEW MEXICO HOT PEPPERS BARNYARDGRASS 90 25 NEW MEXICO HOT PEPPERS MORNINGGLORIES 60 75 NEW MEXICO HOT PEPPERS PIGWEED 100 75

23
Table 3: Weed Species Infestations By State and Crop (Selected Species Only)
% State Crop Species Acreage Potential Infested Yield Loss NEW YORK CABBAGE CHICKWEED, COMMON 40 15 NEW YORK CABBAGE GALINSOGA, HAIRY 60 60 NEW YORK CABBAGE LAMBSQUARTERS, COMMON 100 60 NEW YORK CABBAGE PIGWEED, REDROOT 100 60 NEW YORK GRAPES CRABGRASS 100 30 NEW YORK GRAPES GROUNDSEL 90 10 NEW YORK GRAPES ORCHARDGRASS 70 50 NEW YORK GRAPES PIGWEED 90 50 NEW YORK GRAPES QUACKGRASS 70 50 NEW YORK SWEET CORN CRABGRASS, SMOOTH 30 25 NEW YORK SWEET CORN FOXTAIL, YELLOW 30 25 NEW YORK SWEET CORN LAMBSQUARTERS, COMMON 100 50 NEW YORK SWEET CORN PIGWEED, REDROOT 100 50 NORTH CAROLINA COTTON AMARANTH, PALMER 10 70 NORTH CAROLINA COTTON CRABGRASS, LARGE 85 40 NORTH CAROLINA COTTON LAMBSQUARTERS, COMMON 75 70 NORTH CAROLINA COTTON MORNINGGLORIES 85 95 NORTH CAROLINA COTTON PIGWEEDS 70 65 NORTH CAROLINA COTTON SMARTWEED, PENNSYLVANIA 20 85 NORTH CAROLINA PEANUTS ANODA, SPURRED 20 30 NORTH CAROLINA PEANUTS COCKLEBUR, COMMON 50 55 NORTH CAROLINA PEANUTS CRABGRASS 90 40 NORTH CAROLINA PEANUTS LAMBSQUARTERS, COMMON 90 35 NORTH CAROLINA PEANUTS NUTSEDGE, YELLOW 70 16 NORTH CAROLINA PEANUTS PANICUM, FALL 70 40 NORTH CAROLINA PEANUTS RAGWEED 75 38 NORTH DAKOTA POTATOES FOXTAILS 90 15 NORTH DAKOTA POTATOES LAMBSQUARTERS, COMMON 25 15 NORTH DAKOTA POTATOES MUSTARD, WILD 50 15 NORTH DAKOTA POTATOES PIGWEED, REDROOT 80 15 NORTH DAKOTA SUGARBEETS BUCKWHEAT, WILD 60 10 NORTH DAKOTA SUGARBEETS FOXTAILS 100 15 NORTH DAKOTA SUGARBEETS KOCHIA 40 25 NORTH DAKOTA SUGARBEETS LAMBSQUARTERS, COMMON 80 15 NORTH DAKOTA SUGARBEETS MUSTARD, WILD 80 20 NORTH DAKOTA SUGARBEETS PIGWEED, REDROOT 100 20 OKLAHOMA COTTON JOHNSONGRASS 40 25 OKLAHOMA COTTON MORNINGGLORIES 20 15 OKLAHOMA COTTON NIGHTSHADE, SILVERLEAF 40 15 OKLAHOMA COTTON PIGWEEDS 90 15 OKLAHOMA SORGHUM BINDWEED, FIELD 15 10 OKLAHOMA SORGHUM JOHNSONGRASS 30 20 OKLAHOMA SORGHUM KOCHIA 40 20 OKLAHOMA SORGHUM MORNINGGLORIES 20 15 OKLAHOMA SORGHUM PIGWEEDS 90 15 OREGON MINT AMARANTH, POWELL 80 30 OREGON MINT BINDWEED, FIELD 10 50 OREGON MINT FOXTAIL, GREEN 30 10 OREGON MINT GROUNDSEL, COMMON 80 5 OREGON MINT QUACKGRASS 10 30 OREGON WHEAT BINDWEED, FIELD 20 20 OREGON WHEAT BROME, DOWNY 70 30 OREGON WHEAT MUSTARD, BLUE 30 15 OREGON WHEAT OAT, WILD 50 10 OREGON WHEAT RYEGRASS, ITALIAN 30 40 OREGON WHEAT THIST LE, RUSSIAN 30 10 PENNSYLVANIA CORN FOXTAILS, GIANT 40 10 PENNSYLVANIA CORN LAMBSQUARTERS, COMMON 70 17

24
Table 3: Weed Species Infestations By State and Crop (Selected Species Only) % State Crop Species Acreage Potential Infested Yield Loss PENNSYLVANIA CORN PIGWEED, REDROOT 30 17 PENNSYLVANIA CORN QUACKGRASS 15 20 PENNSYLVANIA CORN VELVETLEAF 20 10 PENNSYLVANIA POTATOES BARNYARDGRASS 35 18 PENNSYLVANIA POTATOES BINDWEED, FIELD 20 12 PENNSYLVANIA POTATOES FOXTAIL, GREEN 40 18 PENNSYLVANIA POTATOES PANICUM, FALL 25 20 PENNSYLVANIA POTATOES PIGWEED, REDROOT 50 22 PENNSYLVANIA TOMATOES FOXTAIL, GREEN 22 12 PENNSYLVANIA TOMATOES LAMBSQUARTERS, COMMON 42 20 PENNSYLVANIA TOMATOES PIGWEED, PROSTRATE 65 15 PENNSYLVANIA TOMATOES SMARTWEED, PENNSYLVANIA 22 10 SOUTH DAKOTA WHEAT BINDWEED, FIELD 10 30 SOUTH DAKOTA WHEAT FOXTAIL, GREEN 85 7 SOUTH DAKOTA WHEAT KOCHIA 55 8 SOUTH DAKOTA WHEAT LAMBSQUARTERS, COMMON 40 7 SOUTH DAKOTA WHEAT MUSTARD, WILD 60 6 SOUTH DAKOTA WHEAT PIGWEED, REDROOT 35 5 TENNESSEE COTTON ANODA, SPURRED 15 30 TENNESSEE COTTON COCKLEBUR, COMMON 80 90 TENNESSEE COTTON CRABGRASS, LARGE 75 60 TENNESSEE COTTON MORNINGGLORIES 85 40 TENNESSEE COTTON PIGWEEDS 80 70 TENNESSEE COTTON VELVETLEAF 20 70 TENNESSEE GREEN BEANS CRABGRASS, LARGE 100 80 TENNESSEE GREEN BEANS FOXTAILS 75 60 TENNESSEE GREEN BEANS GOOSEGRASS 20 60 TENNESSEE GREEN BEANS PANICUM, FALL 75 60 TENNESSEE GREEN BEANS PIGWEEDS 80 80 TEXAS CARROTS AMARANTH, PALMER 40 40 TEXAS CARROTS CROTON, WOOLLY 30 30 TEXAS CARROTS JUNGLERICE 25 30 TEXAS CARROTS NUTSEDGE, PURPLE 40 40 TEXAS CARROTS ROCKET, LONDON 50 30 TEXAS COTTON AMARANTH, PALMER 100 70 TEXAS COTTON JOHNSONGRASS 75 50 TEXAS COTTON MORNINGGLORIES 50 75 TEXAS COTTON NUTSEDGE, PURPLE 20 50 TEXAS RICE ALLIGATORWEED 10 25 TEXAS RICE BARNYARDGRASS 90 50 TEXAS RICE JUNGLERICE 60 40 TEXAS RICE SIGNALGRASS, BROADLEAF 35 20 TEXAS RICE SPRANGLETOP, MEXICAN 25 15 VIRGINIA GRAPES JOHNSONGRASS 10 15 VIRGINIA GRAPES LAMBSQUARTERS, COMMON 30 10 VIRGINIA GRAPES MORNINGGLORIES 50 10 VIRGINIA GRAPES PIGWEED 30 10 VIRGINIA GRAPES RAGWEED, COMMON 50 10 VIRGINIA PEACHES LAMBSQUARTERS, COMMON 25 5 VIRGINIA PEACHES MORNINGGLORIES 40 7 VIRGINIA PEACHES PIGWEED 25 5 VIRGINIA PEACHES RAGWEED, COMMON 40 7 VIRGINIA PEACHES VIRGINIA CREEPER 30 15 WASHINGTON APPLES BINDWEED, FIELD 25 15 WASHINGTON APPLES FOXTAIL, YELLOW 100 5 WASHINGTON APPLES LAMBSQUARTERS, COMMON 100 8 WASHINGTON APPLES MUSTARD, TUMBLE 80 5 WASHINGTON APPLES PIGWEED, REDROOT 100 8 WASHINGTON APPLES QUACKGRASS 30 10

25
Table 3: Weed Species Infestations By State and Crop (Selected Species Only)
% State Crop Species Acreage Potential Infested Yield Loss WASHINGTON ASPARAGUS BARNYARDGRASS 90 50 WASHINGTON ASPARAGUS BINDWEED, FIELD 15 70 WASHINGTON ASPARAGUS FOXTAIL, GREEN 80 30 WASHINGTON ASPARAGUS GROUNDSEL, COMMON 40 20 WASHINGTON ASPARAGUS KOCHIA 50 60 WASHINGTON ASPARAGUS LAMBSQUARTERS, COMMON 90 60 WASHINGTON ASPARAGUS PIGWEEDS 90 60 WASHINGTON ASPARAGUS QUACKGRASS 10 75 WASHINGTON ASPARAGUS THISTLE, CANADA 15 85 WASHINGT ON GREEN PEAS BARNYARDGRASS 20 15 WASHINGTON GREEN PEAS LAMBSQUARTERS, COMMON 40 30 WASHINGTON GREEN PEAS PIGWEED, REDROOT 30 30 WASHINGTON GREEN PEAS PINEAPPLE-WEED 40 25 WASHINGTON MINT BARNYARDGRASS 80 70 WASHINGTON MINT BINDWEED, FIELD 50 80 WASHINGTON MINT FOXTAILS 30 70 WASHINGTON MINT GROUNDSEL, COMMON 40 30 WASHINGTON MINT HORSEWEED 70 40 WASHINGTON MINT LAMBSQUARTERS, COMMON 90 80 WASHINGTON MINT LETTUCE, PRICKLY 70 50 WASHINGTON MINT PIGWEEDS 90 80 WASHINGTON MINT SALSIFIES 70 30 WASHINGTON ONIONS BARNYARDGRASS 90 30 WASHINGTON ONIONS KOCHIA 50 50 WASHINGTON ONIONS LAMBSQUARTERS, COMMON 90 50 WASHINGTON ONIONS NIGHTSHADES 90 50 WASHINGTON ONIONS PIGWEEDS 90 50 WASHINGTON ONIONS THISTLE, RUSSIAN 90 50 WASHINGTON RASPBERRIES BARNYARDGRASS 20 50 WASHINGTON RASPBERRIES CHICKWEED 100 10 WASHINGTON RASPBERRIES GROUNDSEL 100 20 WASHINGTON RASPBERRIES LAMBSQUARTERS, COMMON 100 50 WASHINGTON RASPBERRIES PIGWEED, REDROOT 100 50 WISCONSIN CABBAGE BARNYARDGRASS 15 15 WISCONSIN CABBAGE LAMBSQUARTERS 80 20 WISCONSIN CABBAGE NUTSEDGE, YELLOW 60 30 WISCONSIN CABBAGE PIGWEED, REDROOT 80 20 WISCONSIN CABBAGE QUACKGRASS 80 30 WISCONSIN CABBAGE VELVET LEAF 60 20 WISCONSIN SOYBEANS BARNYARDGRASS 100 20 WISCONSIN SOYBEANS CRABGRASS, LARGE 100 20 WISCONSIN SOYBEANS FOXTAIL, GREEN 100 20 WISCONSIN SOYBEANS FOXTAILS, GIANT 80 75 WISCONSIN SOYBEANS PANICUM, FALL 80 30 WISCONSIN SOYBEANS RAGWEED, COMMON 100 30 WISCONSIN SOYBEANS VELVETLEAF 70 40 WYOMING DRY BEANS BARNYARDGRASS 10 10 WYOMING DRY BEANS FOXTAIL, GREEN 90 20 WYOMING DRY BEANS KOCHIA 70 40 WYOMING DRY BEANS PIGWEED, REDROOT 40 25 WYOMING DRY BEANS THISTLE, RUSSIAN 20 10 WYOMING WHEAT BINDWEED, FIELD 20 30 WYOMING WHEAT BROME, DOWNY 35 20 WYOMING WHEAT BUCKWHEAT, WILD 15 10 WYOMING WHEAT KOCHIA 30 40 WYOMING WHEAT MUSTARD, TANSY 30 15

26
1995 Weed Survey Respondents
Richard Ashley, University of Connecticut Arlen Klosterboer, Texas A&M University Wes Autio, University of Massachusetts Ellery Knake, University of Illinois Ford Baldwin, University of Arkansas Thomas Lanini, University of California Paul Baumann, Texas A&M University William Lord, University of New Hampshire Robin Bellinder, Cornell University Brad Majek, Rutgers University Edward Beste, University of Maryland Steve Miller, University of Wyoming Richard Bonanno, University of Massachusetts Don Morishita, University of Idaho Rick Boydston, Oregon State University Charles Mullins, University of Tennessee David Bridges, University of Georgia Don Murray, Oklahoma State University Steven Brown, University of Georgia Alex Ogg, USDA -ARS Larry Burrill, Oregon State University Michael Orzolek, Pennsylvania State University John Byrd, Jr., Mississippi State University Mike Patterson, Auburn University William Curran, Pennsylvania State University David Regehr, Kansas State University Mike DeFelice, University of Missouri Edward Richard, Jr., USDA-ARS Jeffrey Derr, Virginia Polytechnic University Ronald Ritter, University of Maryland Alan Dexter, North Dakota State University Jill Schroeder, New Mexico State University Jerry Doll, University of Wisconsin Jim Smart, USDA-ARS Joan Dusky, University of Florida William Stall, University of Florida Clyde Elmore, University of California Derby Walker, University of Delaware Peter Fay, University of Montana Philip Westra, Colorado State University Robert Hartzler, Iowa State University Leon Wrage, South Dakota State University Robert Hayes, University of Tennessee David Yarborough, University of Maine Herbert Hopen, University of Wisconsin Alan York, North Carolina State University John Jemison, University of Maine Bernie Zandstra, Michigan State University James Kamas, Texas A&M University Richard Zollinger, North Dakota State University

27
3.0 The NCFAP Study
A. The Forty Crops
1. Production Data
The 40 crops selected for this study are listed in Table 4 and include representative field
crops, vegetable crops, fruit, nut and berry crops and specialty crops. Table 4 presents
2001 national summary production and acreage estimates for each crop. The 40 crops
total 255.7 million acres, with annual production of 1.4 trillion pounds of food and fiber,
and a combined value of $66.2 billion. The 40 crops account for approximately 86% of
U.S. harvested acreage of all crops. (Hay crops are not included in this study). 91% of
the acreage of the selected crops is accounted for by five crops (corn, cotton, sorghum,
soybeans and wheat).
2. Herbicide Use
Table 5 summarizes national statistics for 2001 on herbicide use for each of the 40 crops.
An estimate of the percent of the national acreage of each crop that is treated with
herbicides is included. Nationally, it is estimated that 221 million acres of the 40 crops
(86%) are treated with herbicides. For 30 of the 40 crops, the national acreage treated
with herbicides exceeds 85%. The remaining 10 crops have considerably less acreage
treated with herbicides for a variety of reasons: for wild rice (10%), only one herbicide is
available; for strawberries (39%), most strawberry acreage is fumigated which provides
control of weeds, insects, nematodes and diseases; for broccoli (51%), many broccoli
growers use increased rates of liquid nitrogen fertilizer as foliar sprays to kill weeds; for
lettuce (62%) and cucumbers (60%), these crops are often grown in fumigated soil.
Several crops for which herbicide use has been traditionally low have seen herbicide-
treated acreage increase in recent years as farmers adopt new production practices. (See
Figure A1 [apples, more semidwarf trees], Figure A27 [wheat, more no-till acres]).
Table 5 also contains estimates of herbicide active ingredient (pounds) used annually in
each crop nationally. The 40 crops total 410 million pounds in herbicide use. These
national crop herbicide use totals are sums of use estimates of individual active
ingredients by state and crop from NCFAP’s 1997 national pesticide use database [119].

28
This data is available on NCFAP’s website. The 1997 herbicide use estimates have been
updated to 2001 for crops and states for which significant changes occurred in planted
acreage or in the use of individual active ingredients since 1997 [1] [117]. The 40 crops
account for approximately 90% of the volume of herbicides used in U.S. crop production.
The average herbicide-treated acre receives 1.85 pounds of chemical active ingredient.
Table 5 also contains estimates of the cost of herbicides for each of the 40 crops. The cost
estimate consists of three components: the cost of the product, the cost of application and
technology fees for use of biotech herbicide tolerant soybean, corn, canola and cotton
seeds.
Product costs are determined by multiplying estimates of the pounds of an herbicide’s
active ingredient by an average per-pound price for the ingredient. The average per-
pound price estimates are drawn from a previous NCFAP report [120] updated to reflect
recent prices [121] – [124]. Nationally it is estimated that growers of the 40 crops spent
$4.7 billion on herbicide products in 2001.
Application costs are calculated by assigning an average number of herbicide application
trips to each crop by state and by assigning a cost of $4/A for each application [123].
Estimates of the number of herbicide applications per treated acre are drawn from USDA
surveys [152] and from USDA’s Crop Profiles available at:
http://ipmwww.ncsu.edu/opmppiap. Technology fees are assigned to biotech acres of
corn, canola, soybeans and cotton. These technology fees are derived from a recent
NCFAP report on biotechnology [280]. The costs of herbicide use including product,
application and technology fees totals $6.6 billion. The average cost of herbicide
treatment is $30/A.
The major acreage crops (corn, cotton, sorghum, soybeans, wheat) account for 86% of
the volume of herbicide usage and 87% of the total expenditures on herbicides and their
application.
Table 6 lists the herbicide use and cost data summed for the 40 crops by state. The state
totals are sums of the data for each crop at the state level. The state totals shown in Table

29
6 do not sum to the national totals shown in Table 5 since not all crops are fully
accounted for by state. Table 5 is based on national totals, which include all producing
states, while Table 6 is based on a subset of states for each crop. Five states (Illinois,
Indiana, Iowa, Minnesota and Nebraska) account for 41% of the volume and of the
expenditures on herbicides and their application.
3. Literature Review – Weed Control
For each of the 40 crops, a literature review was conducted to collect information on
current and historical usage of herbicides. This literature review is summarized for each
crop in Appendices A.1-A.40. The literature review summaries include discussions of
weed control practices used prior to the introduction of herbicides as well as data on
weed control methods used by organic growers and experimental data comparing crop
yields of herbicide-treated plots with plots treated by nonchemical means. A list of all the
sources cited in Appendices A.1-A.40 is included in the reference list.
a. Historical
For most of the crops, the historical record shows the rapid adoption of herbicide use in
the U.S. in the 1950s-1960s and their continued use on 80-90% of the acreage since that
time (See Figure A7 [corn], Figure A8 [cotton], Figure A15 [peanuts], Figure A17
[potatoes], Figure A19 [rice], Figure A20 [soybeans], Figure A23 [sugarbeets], Figure
A26 [sweet corn] and Figure A28 [wheat]). Table 7 provides an overview of the
historical impacts of herbicide use for the 40 crops. For most crops, the historical
literature review revealed that herbicides replaced or reduced the use of hand weeding
and cultivation for weed control. Up to 120 hours of hand labor and 16 cultivation trips
per acre had been used to control weeds prior to the introduction of herbicides. For some
crops that are planted in dense mats (such as rice and blueberries), there was no reduction
in hand weeding and cultivation since these practices were not widely used. For these
crops, the impact of herbicide use was a dramatic increase in yields due to more effective
weed control (rice +70%, blueberries +200%) (see Figures A2 and A18).

30
For most crops, there are some historical data indicating an increase in yields due to
herbicide use. Most of the estimates cited in Table 7 are drawn from experiments that
compared yields using herbicide treatments with yields from standard practices used
historically. The period of rapid adoption of herbicide technology also was a time of
other yield-enhancing changes including increased fertilization and irrigation, new plant
hybrids, and the introduction of synthetic fungicides and insecticides.
Sorting out the contribution of one technological improvement is complicated. For two
crops, corn and soybeans, previous studies statistically determined the contribution of
herbicides to improved yields. Herbicides accounted for 20% of the increase in corn
yields 1964-79 and 62% of the yield increase in soybeans 1965-79[229] [153]. For both
corn and soybeans, yields increased (see Figures A6 and A21) at the same time that
herbicide use increased (see Figures A7 and A20). For other crops, although no statistical
studies have been conducted, there is a similar close relationship between increased crop
yields and increased herbicide use (see Figures A15 – A16 [peanuts], A18 - A19 [rice],
and A28 –29[wheat]). For three crops, although long-term herbicide use data are not
available, it is clear from the historical record on crop yields that significant
improvements in yield occurred only after the introduction of new effective herbicides
(See Figures A2 [blueberries], A11 [cranberries], and A24 [sugarcane]).
For several crops, dramatic improvements in crop yield did not occur following the
adoption of herbicide use (See Figures A5 [carrots], A9 [cotton], and A14 [onions]). For
these crops, an adequate amount of hand labor had been previously used to remove weeds
and prevent yield loss prior to the introduction of herbicides. The adoption of herbicides
was spurred by a desire to reduce weed control costs since labor was becoming more
expensive and scarce in the years following World War II. A mass exodus of farm labor
occurred in the late 1940s and early 1950s as workers moved from rural areas to urban
areas. As a result of a scarce labor supply, the farm wage rate quadrupled in the early
1950s (see Figure A30) and has increased even further since then (see Figure A31).
Growers who were used to paying $.10/hour were faced with paying $.50/hour in the
early 1950s and $1.00/hour in the 1960s. Herbicides were adopted to lower the costs of
weeding. For example, in a 1957 experiment in onions, an $8/A herbicide application
substituted for 55 hours of labor, which was budgeted at $41/A [82].
31
For many crops, the primary means of weed control prior to herbicides was cultivation,
which can be quite effective if performed at the optimal time for weed removal.
However, the historical record is clear that cultivation was not always performed in a
timely fashion, particularly due to wet fields that prevented the use of tractors when
weeds needed to be removed. As a result, yield losses often occurred, and in extreme
cases, fields were not harvested due to weeds. In a 1932 Illinois study, it was estimated
that on 10% of the cropland there was, in a normal year, one-half or greater crop loss due
to weeds [314]. Cultivation lowered yields of some crops, such as potatoes and apples,
due to root pruning and damage to trees. For some crops, such as corn, the need to
cultivate led to very wide plant spacing to accommodate cultivation on all four sides of
each plant. With the substitution of herbicides, crops such as corn could be planted closer
together, which increased per acre yields.
The historical review indicated that for three crops (cranberries, carrots, and citrus) a
widespread weed control tactic was the use of large quantities of oil and kerosene, which
were tolerated by the crop.
The literature was searched for recent instances in which growers had no registered
herbicides for effective weed control. These situations arise as a result of cancellations,
the development of resistant weed populations or climate changes that lead to new weed
problems. Generally, in these cases, the growers apply to EPA for an emergency
registration of an effective herbicide, which is granted and adverse effects are avoided.
An analysis of 66 emergency exemptions for herbicides granted by EPA in 2000
indicated that the total impact would have been $201 million in lost yields if the
exemptions had not been granted [388]. Three instances were found where growers faced
a weed control problem for which either no herbicide was registered, or for which
available herbicides were inadequate, and no alternative or emergency registrations were
forthcoming. New Jersey spinach production declined in 1989 because growers had no
effective herbicide to control chickweed due to a cancellation (see Figure A22). Florida
lettuce acreage declined in the 1990s due to the lack of an effective herbicide (see Figure
A13). Surviving growers paid up to $700/A for hand weeders until an effective herbicide
costing $20/A was registered. Sweet corn acreage in Wisconsin has declined significantly

32
in the 1990s (see Figure A25) due to restrictions on atrazine and the lack of an effective
replacement.
A recent development in the use of herbicides in U.S. crop production has been the
introduction of biotech herbicide tolerant crop varieties. Four of the crops included in
this Study include biotech-seeded acres, which allows the use of a herbicide that normally
would kill the crop. Table 8 shows acreage estimates for these 4 biotech crops (soybean,
corn, cotton and canola) by state. Following their introduction in 1995, the biotech
herbicide tolerant acreage had climbed to over 70 million acres in the U.S. by 2002 (see
Figure A33). Rapid expansion of canola acreage in the U.S. followed the introduction of
the biotech cultivars because the herbicides made it possible to control the weeds
infesting the crop (see Figure A4).
b. Organic Practices
USDA estimates that there were 1.3 million acres of organic-certified cropland in the
U.S. in 2001, which represents a steady increase from 400,000 acres in 1992 [297] [305].
Figure A34 shows the recent trend in organic-certified crop acreage in the U.S. Table 9
shows estimates of certified organic crop acreage by state. California and North Dakota
have more than 100,000 acres of certified organic crops. Table 10 shows estimates of
certified organic crop acres for the forty crops included in this Study. No organic crop
acreage estimates could be found for 15 of these crops, which suggests that there might
not be any organic acres in the U.S. or that they may not have been tabulated.
Organic farmers do not use synthetic chemicals for weed, insect and disease control. The
problem of controlling weeds without herbicides has been cited numerous times as the
single biggest obstacle that organic growers encounter. Out of 30 research areas, organic
farmers ranked weed control as the number one priority in three national surveys (1993,
1995, 1997) [296]. USDA has recently said that weed control costs of organic vegetable
growers in California can be in the range of $1000/A in comparison to $50/A that
conventional growers spend on herbicides [306]. The higher costs of weed control in

33
organic production have been cited as one of the main reasons that organic products cost
more for consumers [324]. Price premiums for organic soybeans and corn in 2001 were
177% and 59%, respectively [297]. Organic growers use a variety of nonchemical
techniques for weed control: cover crops, rotations, flamers, vinegar, and plastic sheets
for smothering weeds. These techniques provide partial control of weeds.
Organic growers rely extensively on cultivation and hand weeding during the growing
season to control weeds. A literature search was conducted to identify the extent to which
organic growers of the 40 crops in this Study use hand weeding and cultivation for weed
control. Details are provided for each crop in Appendix A.1 through A.40 and are
summarized in Table 11. For 14 of the crops, additional hand weeding of two to 165
hours per acre was required for organic production. For 14 of the crops, additional tillage
of one to nine trips per acre was identified for organic production. For 6 additional crops,
anecdotal information was found in the literature indicating that organic growers use
hand weeding and /or tillage, although no quantification of hours or trips was made.
Numerous publications and websites on organic production include photos of hand
weeders [298] [312] [313]. One difficulty in assessing the costs of hand weeding for
organic growers is their reliance on volunteers, interns, Mexican labor, and family
(particularly children) for weeding operations [318] [298]. Some organic growers provide
housing, meals and training for their workers in lieu of wages [300]. A 57-acre organic
farm in California pays no wages to any of its workers [319].
Table 11 shows that for 10 of the crops, organic production yields are 13 - 80 % lower
than conventional yields. Poor weed control is often cited as a major reason for lower
yields in organic production [194]. University research comparing yields between
conventional and organic practices indicate that yields are generally significantly higher
in the conventional system. For example, a 20-year study in Iowa indicated that corn
yields were 34% higher in the conventional versus the organic operations, while six to
seven year studies in Nebraska and South Dakota resulted in conventional corn yields
that were 17-20% higher than organic corn yields [418].

34
The high cost of agricultural labor in the U.S. has led to a decline in the organic acreage
of certain crops in the U.S. Organic cotton acreage in the U.S. in 2001 was 25% lower
than it was in 1995 [297] (See Figure A10). Buyers have determined that organic goods
can be bought from other countries at a lower price because of lower production costs
[326]. Thus, acreage of organic cropland is steadily increasing in countries such as Chile
and India, where labor costs for hand weeding can be as low as $1/day. The organic
farms in these countries are increasingly being certified as meeting organic standards by
U.S.-based certification organizations [301] [302].
B. Herbicide Value Estimation
Estimates of the value of herbicides were made in terms of the economic va lue to
growers and in terms of reduced need for labor and less soil erosion. These estimates are
based on a simulation of the nonuse of herbicides by U.S. growers, the substitution of
likely alternative practices, and their costs and effectiveness in comparison to herbicides.
1. Economic Value
Table 12 identifies the likely substitution of hand weeding and cultivation for each crop if
herbicides were not used. These estimates are drawn from the historical record (Table 7)
and from the information collected on organic practices (Table 11). For some crops, the
alternatives were specified in Studies that simulated the replacement of herbicides with
nonchemical practices [53]. Up to 64 hours per acre of hand weeding and up to nine
cultivations have been specified as alternatives. Table 12 also specifies the cost of the
alternatives. Each hour of hand weeding is estimated to cost $8.75, which includes a
wage, supervisory and other costs associated with employing a work crew of hand
laborers [228]. Each tillage trip is estimated to cost $4.50/A, which includes fuel,
maintenance and labor charges [123]. By multiplying the per acre cost of the likely
alternatives times the number of acres treated with herbicides, estimates are made of the
total cost of the alternative weed control practices. These estimates are shown in Table
12. For 36 of the crops, the alternatives cost more than the use of herbicides. For the
other four crops, the cost of alternatives is less because in one instance, growers are
assumed not to implement any alternative practice (wild rice); for three other crops (rice,

35
sorghum, canola), only a few cultivation trips have been specified as alternatives. The
national cost of the alternatives is $14.3 billion per year, which is $7.7 billion higher than
current expenditures on herbicides ($6.6 billion)
Estimates of the likely impacts on crop yields of not using herbicides and using the likely
alternatives are shown in Table 13. These estimates are drawn from a series of studies
conducted in the 1990s by USDA, WSSA, and AFBF [5] [17] [53] [95] [165] [182]
[270]. For 35 crops, the yields are projected to decrease from 5 to 67% without herbicide
use. These impact estimates are consistent with the historical record and with the record
of organic production (Table 7 and Table 11). All of the studies relied on University
weed science specialists to specify the likely yield changes that would result if growers
used readily available alternatives to herbicides. These expert opinions are based on
research trials conducted by the specialists as well their knowledge about experiences of
growers who have tried alternative practices. The specialists also factored into the
estimates how timely weed removal would be with cultivation and how available hand
labor would be for weeding. Some of the specialists were very pessimistic regarding the
availability of hand labor as a substitute for herbicides. Most specialists projected some
increase in hand labor but not enough to prevent some yield loss For example, as
documented in Appendix A.1-A.40, if enough hand weeding is used, yields can be
equivalent to herbicides: corn (60 hours/A), cotton (67 hours/A), lettuce (224-424
hours/A), onions (1067 hours/A), and tomatoes (182-259 hours/A). These labor
requirements are far greater than those specified as likely affordable alternatives: corn (5
hours), cotton (13 hours), lettuce (38 hours), onions (64 hours), and tomatoes (37 hours).
For four crops, no yield change is projected since the amount of tillage, hand weeding or
other alternative practice is assumed sufficient to provide control equivalent to herbicides
(celery, citrus, hot peppers and raspberries). In addition, for grapes, the national loss is
1%, which is a weighted average of no loss in California and a 12-35% loss in other
states.
This method of relying on University experts to interpret scientific data and take into
account economic and weather factors to project potential statewide yield changes has

36
been used in national pesticide benefit assessments for thirty years. This method is relied
on by the EPA when it makes decisions regarding emergency herbicide use registrations.
In these cases, the University specialists make estimates of statewide yield losses likely to
result if EPA does not grant the registration.
In total, as shown in Table 13, the nonuse of herbicides and the likely substitution of
alternatives would result in a loss of $13.3 billion in food and fiber production due to less
effective weed control. The total loss in production would amount to 288 billion pounds,
which represents approximately 21% of the national production of the 40 crops.
Table 14 summarizes the economic impacts of the nonuse of herbicides for the 40 crops
included in this Study. The total impact is a loss of $21 billion, which includes $7.7
billion in increased costs for weed control and $13.3 billion in yield losses due to less
effective weed control. Four crops (corn, cotton, soybeans and wheat) account for 71% of
the total loss. Table 14 also includes an estimated Net Return Ratio (NRR), which is the
ratio of the total impact estimate to the estimate of current expenditures on herbicides.
For the nation, the Net Return Ratio is 3.20, which means that for every dollar currently
spent on herbicides the grower gains $3.20. There are three crops for which the net return
ratio is greater than 50: carrots (75), wild rice (54) and strawberries (91).
Table 15 summarizes the economic impact estimates by state. Table 16 includes a
selected list of crop impacts for each state. Table 17 summarizes the production volume
loss by state.
2. Labor Requirements
One of the major replacements for herbicides identified in this Study is increased use of
hand labor for weeding. Field crops such as wheat, corn and soybeans are projected at 2-5
additional hours of hand weeding per acre. Most fruit and vegetable crops are projected at
20-60 hours per acre. The additional cost of hand weeding is included in the impact
estimates by crop in Table 12 and by state in Table 15. In addition, the number of
additional workers that would be required to implement the increased hand weeding is

37
estimated. Table 18 presents estimates of the total number of additional hours of hand
labor that would be required by crop. For the nation, an additional 1.2 billion hours of
hand weeding would be required. These estimates are also shown in terms of the number
of workers that would be required by assuming that for each crop the weeding would
need to be done during a 4-week period. For the nation, an additional 7.2 million laborers
would be required. Table 19 presents the labor requirement estimates by state. It should
be noted that U.S. farms currently employ approximately one million workers per year,
which is a substantial reduction from earlier times (see Figure A32).
As noted above, the hand weeding requirements specified in this Study are not sufficient
to prevent yield losses. For major acreage crops such as corn, approximately 10% of the
labor necessary to prevent yield loss is actually specified as a replacement (5 hours vs. 60
hours). An approximate estimate of the amount of labor that would be required to prevent
any yield loss in comparison to herbicides is ten times that specified in this Study, or an
additional 72 million workers at the peak time for hand weeding.
3. Soil Erosion
Erosion of cropland has been reduced in the U.S. from an estimated 3.5 billion tons in
1938 to 1.0 billion tons in 1997 [342] [343]. Sheet and rill erosion has been reduced by
soil conserving tillage and other conservation practices. The tillage reduction, which
resulted from the increased use of herbicides for weed control, played a significant role in
erosion reduction in the U.S. Herbicides replaced tillage for weed control. Acceptance of
conservation tillage by farmers has depended upon the availability of herbicides that
provide suitable weed control [344]. No-till, in which the soil is left undisturbed by
tillage and the residue is left on the soil surface, is the most effective soil-conserving
system [345]. No-till systems can reduce erosion by 90% or more. As tillage is reduced,
reliance on herbicides increases [346]. The elimination of tillage means that the grower
must rely entirely on herbicides to control weeds [347] [348]. No-till acreage has
increased steadily in the past decade (See Figure A35). Currently, there are 52 million
acres of no-till cropland in the U.S. The average rate of erosion on a cultivated crop acre
is 2.9 tons greater than the rate on an uncultivated acre. Table 20 shows estimates of no-
till acreage and estimates of the difference in erosion rates between cultivated and non-

38
cultivated acres by state. The adoption of no-till practices prevents annual erosion of 304
billion pounds.
This Study projects a significant increase in cultivation for weed control if herbicides
were not used in crop production. Much of this increase is row cultivation during the
growing season. It is not possible to quantify the impacts on soil erosion amounts as a
result of an increase in row cultivation. The scientific literature indicates that row
cultivation can reduce runoff from cropland as a result of breaking the soil crust and
improving water infiltration [349] [350]. The research has shown that soil loss is not
significantly affected by row cultivation [351].
On the other hand, without herbicides, U.S. farmers could no longer grow crops using no-
till methods. Without herbicides, farmers who currently use no-till methods would have
to use tillage not only down the row during the growing season but also for removing
weeds prior to planting. As a result, the acres that are currently in no-till would no longer
be subject to the lower erosion rates associated with non-cultivated cropland but, rather,
would be likely to erode at the higher rates associated with cultivated acres (see Table
20). This Study projects the national impact on erosion to be an increase of 304 billion
pounds/year as a result of growers no longer using no-till methods, which would occur if
herbicides were not used. Table 20 shows these erosion estimates by state.

39
Table 4: U.S. Production: 40 Crops, 2001 Production
Crop Acreage (000) Value (million $) Volume (million lbs) ALMONDS 525 732 1,354 APPLES 430 1,477 9,628 ARTICHOKES 8 58 100 ASPARAGUS 77 230 208 BLUEBERRIES 24 23 75 BROCCOLI 141 504 2,042 CANOLA 1,494 176 1,998 CARROTS 121 577 4,005 CELERY 29 277 1,882 CITRUS 1,094 2,638 34,806 CORN 75,752 19,209 736,000 COTTON 15,787 3,384 9,600 CRANBERRIES 34 99 532 CUCUMBERS 59 212 1,089 DRY BEANS 1,430 414 1,954 GRAPES 930 2,921 13,104 GREEN BEANS 210 112 1,397 GREEN PEAS 217 102 774 HOPS 36 126 66 HOT PEPPERS 33 88 311 LETTUCE 306 1,907 10,053 MINT 98 96 8 ONIONS 167 703 6,708 PEACHES 151 496 2,440 PEANUTS 1,543 1,003 4,239 POTATOES 1,267 2,591 44,476 RASPBERRIES 12 46 92 RICE 3,335 896 21,304 SORGHUM 10,252 998 28,784 SOYBEANS 74,105 12,446 174,000 SPINACH 15 17 284 STRAWBERRIES 47 1,085 1,666 SUGARBEETS 1,371 1,113 52,000 SUGARCANE 1,029 942 70,000 SUNFLOWERS 2,653 317 3,480 SWEET CORN 733 772 9,050 SWEET POTATOES 98 210 1,435 TOMATOES 411 1,665 22,192 WHEAT 59,617 5,553 120,000 WILD RICE 19 10 6 TOTAL 255,660 66,225 1,393,136 Source: [1], [2], [13], [15], [118]
Notes: Corn for grain only, spinach, green beans, and green peas for processing only. Wild Rice - Minnesota only; Blueberries – Maine only.

40
Table 5: Herbicide Use and Cost by Crop, 2001 Acres Treated
(000) Lbs./Year
(000)1 Cost $/Year (000)1
Crop %2 (000) Total Product Application and
Tech Fees ALMONDS 86 452 1,229 20,533 16,921 3,612 APPLES 63 271 1,530 17,715 16,610 1,105 ARTICHOKES 58 5 12 419 401 18 ASPARAGUS 91 70 213 2,833 2,282 551 BLUEBERRIES 95 23 14 652 472 180 BROCCOLI 51 70 211 2,398 2,109 289 CANOLA 99 1,479 718 30,603 13,278 17,325 CARROTS 98 119 169 3,739 2,871 868 CELERY 85 25 50 696 511 185 CITRUS 95 1,039 7,879 80,607 72,365 8,242 CORN 98 74,237 206,052 2,265,353 1,823,501 441,852 COTTON 95 14,998 33,113 559,963 344,195 215,768 CRANBERRIES 95 32 120 3,109 2,850 259 CUCUMBERS 60 35 252 3,505 2,701 804 DRY BEANS 99 1416 3,799 40,030 34,775 5,255 GRAPES 75 698 1,831 27,932 24,691 3,241 GREEN BEANS 96 202 743 6,548 5,108 1,440 GREEN PEAS 94 204 245 4,051 3,366 685 HOPS 95 34 71 1,201 1,065 136 HOT PEPPERS 95 31 111 1,547 1,475 72 LETTUCE 62 190 290 8,477 7,955 522 MINT 95 93 375 10,392 9,648 744 ONIONS 88 147 568 8,268 7,149 1,119 PEACHES 66 100 234 2,978 2,563 415 PEANUTS 97 1,497 3,038 63,896 48,250 15,646 POTATOES 93 1,178 3,109 45,450 38,505 6,945 RASPBERRIES 91 11 34 674 618 56 RICE 98 3,268 15,736 217,996 179,170 38,826 SORGHUM 91 9,329 16,579 134,918 103,731 31,187 SOYBEANS 96 71,141 76,604 2,110,780 1,224,075 886,705 SPINACH 90 14 37 471 414 57 STRAWBERRIES 39 18 75 1,420 1,210 210 SUGARBEETS 98 1,344 2,398 138,163 118,434 19,729 SUGARCANE 95 977 5,904 51,323 43,678 7,645 SUNFLOWERS 95 2,520 1,841 26,347 18,408 7,939 SWEET CORN 90 660 1,890 16,134 13,700 2,434 SWEET POTATOES 70 69 71 1,664 1,390 274 TOMATOES 96 394 684 11,593 8,517 3,076 WHEAT 55 32,789 21,789 649,779 503,606 146,173 WILD RICE 10 2 1 9 1 8 TOTAL3 (86) 221,181 409,619 6,574,166 4,702,569 1,871,597
1 See Text for calculation methodology. 2 These estimates are from USDA surveys and assessments [14], [16], [17], [117], [182], [270]. For crops not included in the surveys, see Appendices A.1 - A.40. Fumigants not included. 3 National per acre values: lbs/A (1.85); cost/A ($29.72)

41
Table 6: Herbicide Use and Cost By State, 2001
State Lbs (000/yr)
Application and Tech Fees
(000$/yr)
Product Cost (000$/yr)
Total Cost (000$/yr)
ALABAMA 2,866 15,824 29,310 45,134 ARIZONA 1,087 6,552 13,899 20,421 ARKANSAS 13,812 74,160 150,187 224,347 CALIFORNIA 12,606 34,167 166,999 201,166 COLORADO 2,690 14,839 32,911 47,750 CONNECTICUT 124 23 987 1,010 DELAWARE 964 3,594 12,925 16,519 FLORIDA 9,281 13,756 82,774 96,530 GEORGIA 6,056 35,767 69,115 104,882 IDAHO 3,246 12,292 73,184 85,476 ILLINOIS 44,262 192,229 460,051 652,280 INDIANA 23,768 103,780 235,261 339,041 IOWA 51,094 208,424 600,270 808,694 KANSAS 18,411 80,868 151,625 232,493 KENTUCKY 5,263 21,819 69,084 90,903 LOUISIANA 12,169 36,249 121,741 157,990 MAINE 189 466 3,478 3,944 MARYLAND 2,365 9,201 29,048 38,249 MASSACHUSETTS 169 144 2,386 2,530 MICHIGAN 10,352 41,891 96,107 137,998 MINNESOTA 22,596 151,380 373,858 525,238 MISSISSIPPI 9,343 49,931 111,669 161,600 MISSOURI 16,269 81,614 190,929 272,543 MONTANA 2,983 16,397 38,148 54,545 NEBRASKA 28,922 110,914 272,656 383,570 NEVADA 9 43 136 179 NEW HAMPSHIRE 49 13 384 397 NEW JERSEY 674 1,961 11,984 13,945 NEW MEXICO 855 2,398 7,387 9,785 NEW YORK 4,688 6,168 35,808 41,976 NORTH CAROLINA 6,311 38,004 65,893 103,897 NORTH DAKOTA 13,774 99,949 263,958 363,907 OHIO 14,973 74,478 152,534 227,012 OKLAHOMA 2,601 18,494 31,514 50,008 OREGON 1,503 6,327 23,370 29,697 PENNSYLVANIA 5,434 12,564 43,120 55,684 RHODE ISLAND 10 3 69 72 SOUTH CAROLINA 2,888 12,525 32,547 45,072 SOUTH DAKOTA 14,645 91,632 200,347 291,979 TENNESSEE 4,383 29,775 54,606 84,381 TEXAS 18,509 97,984 171,979 269,963 UTAH 183 599 1,507 2,106
VERMONT 339 11 2,337 2,348 VIRGINIA 2,803 10,471 31,307 41,778 WASHINGTON 4,393 13,824 65,690 79,514
WEST VIRGINIA 268 261 2,041 2,302 WISCONSIN 9,161 37,190 109,403 146,593 WYOMING 268 1,229 6,043 7,272 Note: Includes the 40 crops identified in Table 5 summed by state.

42
Table 7: Historical Summary, Herbicide Impacts
Crop ALMONDS Replaced 16 cultivations/A, replaced 7 hours hand labor/A [197] APPLES Replaced cultivations and 2-3 hand hoeings [333] ARTICHOKES Reduced tillage ASPARAGUS Replaced 4-6 cultivations/A [205] BLUEBERRIES Yield up 200% [212], [213] BROCCOLI Replaced 20 hours/A hand weeding; yields up 30% [249], [320] CANOLA Expanded acreage and production by 75% [202] CARROTS Replaced 28 hours/A hand weeding; replaced 50 gallons oil/A [193], [19] CELERY Replaced 30-60 hours hand weeding/A [340] CITRUS Replaced 90 gal oil/A (CA) replaced 8 cultivations, 2-3 hand weedings/A (FL) [41], [47], [52] CORN Replaced hand weeding; replaced 4 cultivations/A; yield improved 15-25% [316] COTTON Replaced 20-40 hrs hand weeding; replaced 5-7 cultivations [160], [162] CRANBERRIES Replaced 300 gallons kerosene/A [30]; yields up 150% [35], [38] CUCUMBERS Replaced cultivation; yields 24% higher [246] DRY BEANS Replaced hoeing of 16 hours/A; yields 38% higher [4] GRAPES Replaced cultivation (CA); replaced cultivation and hoeing (NY) [59], [64] GREEN BEANS Replaced hand weeding and cultivation [291] GREEN PEAS Replaced hand labor [283] HOPS Replaced 20-50 hours of hand labor [416] HOT PEPPERS Reduced hand hoeing LETTUCE Reduced hoeing time 55% [18] MINT Replaced 18 hours of hand weeding [411] ONIONS Reduced hoeing time by 120 hours/A [82] PEACHES Replaced 7 tillage trips [235] PEANUTS Replaced 5 tillage trips; replaced 14 hours hand weeding [89], [354] POTATOES Replaced 6 tillage trips [108] RASPBERRIES Replaced 9 tillage trips and 43 hours hand weeding [23], [24] RICE Yield up 70% [133] SORGHUM Replaced 3 cultivations; yields up 34% [70] SOYBEANS Replaced 4 cultivations; yields up 10% [145], [146] SPINACH Replaced hand weeding and cultivations [287] STRAWBERRIES Replaced 16-40 hours hand weeding [262] SUGARBEETS Replaced 31 hours hand weeding and thinning [186] SUGARCANE Replaced 40-70 hours hand weeding [102]; replaced 3 cultivations [105] SUNFLOWERS Significant production began in 1970’s; no history prior to herbicides SWEET CORN Reduced cultivations SWEET POTATOES Replaced hand weeding 24-30 hours/A [10], [11] TOMATOES Replaced 3-6 cultivations; 9-16 hours hand labor [174], [175] WHEAT Replaced hand weeding; reduced cultivation; improved yields [393] WILD RICE Significant production began in the 1960’s; herbicide use minimal
See Appendices A.1-A.40 for details.

43
Table 8: Biotech Herbicide Tolerant Crop Acreage by State, 2001 Thousand Acres
State Soybeans Cotton Corn Canola Total ALABAMA 112 354 466 ARIZONA 78 7 85 ARKANSAS 1920 614 24 2558 CALIFORNIA 276 30 306 COLORADO 130 130 CONNECTICUT 3 3 DELAWARE 170 19 189 FLORIDA 12 108 120 GEORGIA 128 1005 1133 IDAHO 9 9 ILLINOIS 6688 331 7019 INDIANA 4391 333 4724 IOWA 7796 960 8756 KANSAS 2000 384 2384 KENTUCKY 472 25 497 LOUISIANA 661 404 1065 MAINE 2 2 MARYLAND 335 40 375 MASSACHUSETTS 4 4 MICHIGAN 1227 158 1385 MINNESOTA 4504 726 63 5293 MISSISSIPPI 995 832 1827 MISSOURI 3450 248 277 3975 MONTANA - NEBRASKA 3477 564 4041 NEVADA - NEW HAMPSHIRE - NEW JERSEY 69 4 73 NEW MEXICO 72 72 NEW YORK 112 112 NORTH CAROLINA 1006 725 46 1777 NORTH DAKOTA 906 186 871 1963 OHIO 2842 132 2974 OKLAHOMA 186 198 8 392 OREGON - PENNSYLVANIA 316 130 446 RHODE ISLAND - SOUTH CAROLINA 352 228 580 SOUTH DAKOTA 3496 654 4150 TENNESSEE 978 502 71 1551 TEXAS 169 3657 266 4092 UTAH 7 7 VERMONT 4 4 VIRGINIA 318 72 33 423 WASHINGTON - WEST VIRGINIA 14 14 WISCONSIN 914 165 1079 WYOMING 3 3 TOTAL 50016 9301 5807 934 66058 Source: [280]

44
Table 9: Organic Crop Acreage By State State Acres
ALABAMA 35 ARIZONA 8,820 ARKANSAS 24,769 CALIFORNIA 148,664 COLORADO 67,347 CONNECTICUT 1,107 DELAWARE - FLORIDA 12,059 GEORGIA 489 IDAHO 64,982 ILLINOIS 20,459 INDIANA 3,996 IOWA 71,796 KANSAS 24,299 KENTUCKY 5,272 LOUISIANA 86 MAINE 7,756 MARYLAND 3,095 MASSACHUSETTS 1,169 MICHIGAN 45,466 MINNESOTA 98,256 MISSISSIPPI - MISSOURI 11,973 MONTA NA 71,707 NEBRASKA 43,960 NEVADA 1,856 NEW HAMPSHIRE 485 NEW JERSEY 6,795 NEW MEXICO 8,848 NEW YORK 42,099 NORTH CAROLINA 1,372 NORTH DAKOTA 144,890 OHIO 36,868 OKLAHOMA 3,530 OREGON 22,075 PENNSYLVANIA 16,272 RHODE ISLAND 163 SOUTH CAROLINA 14 SOUTH DAKOTA 49,984 TENNESSEE 300 TEXAS 45,219 UTAH 30,086 VERMONT 24,235 VIRGINIA 4,352 WASHINGTON 31,229 WEST VIRGINIA 358 WISCONSIN 79,128 WYOMING 16,196 TOTAL 1,303,916
Source: [98] Note: Certified Acres Only

45
Table 10: Organic Acreage by Crop Crop Acres % of U.S. Acreage
ALMONDS 10,000 2 APPLES 12,189 3 ARTICHOKES1 240 3 ASPARAGUS1 428 1 BLUEBERRIES NI - BROCCOLI1 2333 2 CANOLA NI - CARROTS 4,757 4 CELERY1 591 2 CITRUS 9,741 1 CORN 93,551 <1 COTTON 11,456 <1 CRANBERRIES NI - CUCUMBERS1 228 <1 DRY BEANS 15,080 1 GRAPES 14,532 2 GREEN BEANS NI - GREEN PEAS NI - HOPS NI - HOT PEPPERS NI - LETTUCE 16,073 5 MINT NI - ONIONS1 782 <1 PEACHES1 688 <1 PEANUTS 4,653 <1 POTATOES 7,533 1 RASPBERRIES NI - RICE 29,022 1 SORGHUM 938 <1 SOYBEANS 174,467 <1 SPINACH1 NI - STRAWBERRIES1 1279 3 SUGARBEETS NI - SUGARCANE NI - SUNFLOWERS 15,295 1 SWEET CORN NI - SWEET POTATOES NI - TOMATOES 3,451 1 WHEAT 194,640 <1 WILD RICE NI - Data for 2001 [98] [321] [311] NI: No Information
1 California only [389] [352]

46
Table 11: Organic Weed Control Practices/Crop Yields Crop
ALMONDS Cover crops and irrigation, 7 hours hoeing/A [199] APPLES Hand hoeing (20 hrs/A) plus two diskings [338] ARTICHOKES NI ASPARAGUS Weeds are the most serious problem [209] BLUEBERRIES Yields 75% lower [215] BROCCOLI 22 hours hand weeding/A; 4 cultivations/A [299] CANOLA NI CARROTS Hand weeding/cultivation; weeds are biggest cost [22] CELERY NI CITRUS Cultivation (5 times) hand weeding (4 times) (FL) [55] CORN 13-25% reduction in yield [361] [260] COTTON 9 cultivations; 12 hours hand weeding; yields 50% lower [323] [324] CRANBERRIES NI CUCUMBERS 30 hours hand weeding; 3 cultivations [84] DRY BEANS NI GRAPES 8 hrs hand weed & 1 cult.(CA); 8 cult. & 13 hrs hand weed, yld: –35% (NY) [60], [62] GREEN BEANS 17 hours hand weeding; 6 cultivations [299] GREEN PEAS 12 hours hand weeding [285] HOPS NI HOT PEPPERS NI LETTUCE 2 cultivations; 18 hours hand weeding [84] MINT NI ONIONS 6 cultivations; 73 hours hoeing [84] PEACHES NI PEANUTS 50-165 hours, 2 cultivations [94] POTATOES Yields 25-36% lower [303], [308] RASPBERRIES Hand weeding and cultivation [28] RICE Yields 50% lower [138]; 3 cultivations before planting [387] SORGHUM NI SOYBEANS 6 tillage trips; 5 hours hand weeding/A [304], [310] SPINACH NI STRAWBERRIES Hand weeding; yields 40-75% lower [264], [265] SUGARBEETS NI SUGARCANE NI SUNFLOWERS Yields 25% lower [260] SWEET CORN 3-5 cultivations [84]; 2 hours hand labor [299] SWEET POTATOES NI TOMATOES 6 cultivations; 15 hours hand weeding [181]; yields 17% lower [194] WHEAT Yields are 25-80% lower [260] [309] WILD RICE NI NI: No Information; See Appendices A.1-A.40 for details.

47
Table 12: No Herbicide Use, Alternative Costs by Crop Cost
Crop Hand
Weeding (Hrs/A)1
Tillage (Trips/A)1
Other ($/A) ($/A)2 (000
$/year)3
ALMONDS 7 0 364 97.25 43,957 APPLES 20 2 184.00 49,864 ARTICHOKES 23 0 201.25 1,006 ASPARAGUS 5 5 66.25 4,638 BLUEBERRIES 5 0 43.75 1,006 BROCCOLI 20 2 184.00 12,880 CANOLA 0 2 9.00 13,311 CARROTS 14 2 131.50 15,648 CELERY 60 4 543.00 13,575 CITRUS 0 0 4005 400.00 415,600 CORN 5 4 61.75 4,584,134 COTTON 13 7 145.25 2,178,459 CRANBERRIES 20 0 175.00 5,600 CUCUMBERS 30 3 276.00 9,660 DRY BEANS 16 2 149.00 210,984 GRAPES 8 2 79.00 55,142 GREEN BEANS 12 2 114.00 23,028 GREEN PEAS 12 2 114.00 23,256 HOPS 35 6 333.25 11,330 HOT PEPPERS 60 0 525.00 16,275 LETTUCE 38 2 341.50 64,885 MINT 18 0 157.50 14,647 ONIONS 64 2 569.00 83,643 PEACHES 6 0 52.50 5,250 PEANUTS 10 2 96.50 144,460 POTATOES 10 5 110.00 129,580 RASPBERRIES 43 9 416.75 4,584 RICE 0 4 18.00 58,824 SORGHUM 0 3 13.50 125,941 SOYBEANS 5 4 61.75 4,392,956 SPINACH 20 3 188.50 2,639 STRAWBERRIES 30 4 280.50 5,049 SUGA RBEETS 15 2 140.25 188,496 SUGARCANE 25 3 232.25 226,908 SUNFLOWERS 0 7 31.50 79,380 SWEET CORN 5 3 57.25 37,785 SWEET POTATOES 24 2 219.00 15,111 TOMATOES 37 8 359.75 141,741 WHEAT 2 2 26.50 868,908 WILD RICE 0 0 0 0 TOTAL (64.56) 14,280,140
1 Weighted national averages, see Appendices A.1 – A.40. 2 Hand weeding costs calculated at $8.75/hour [228], cultivation costs calculated at $4.50/trip [123]. 3 Cost per acre times number of acres treated with herbicides (Table 5) 4 Mowing, cover crops (see Appendix A.1) 5 Mowing, increased fertilizer and irrigation (see Appendix A.10)

48
Table 13: No Herbicide Use, Production Impacts By Crop Production1
Crop % Yield Loss w/o Herbicides2 Million Lbs Million $
ALMONDS 5 58.2 31.5 APPLES 15 909.8 139.6 ARTICHOKES 16 9.3 5.4 ASPARAGUS 55 104.1 115.1 BLUEBERRIES 67 47.7 14.6 BROCCOLI 14 145.8 36.0 CANOLA 45 890.1 78.4 CARROTS 48 1,884.0 271.4 CELERY 0 0 0 CITRUS 0 0 0 CORN 20 144,256.0 3,765.0 COTTON 27 2,462.4 868.0 CRANBERRIES 50 252.7 47.0 CUCUMBERS 66 431.2 84.0 DRY BEANS 25 483.6 102.5 GRAPES 1 98.3 21.9 GREEN BEANS 20 268.2 21.5 GREEN PEAS 20 145.5 19.2 HOPS 25 15.7 29.9 HOT PEPPERS 0 0 0 LETTUCE 13 810.3 153.7 MINT 58 4.4 53.0 ONIONS 43 2,538.3 266.0 PEACHES 11 177.1 36.0 PEANUTS 52 2,138.2 505.9 POTATOES 32 13,236.1 771.1 RASPBERRIES 0 0 0 RICE 53 11,065.3 465.4 SORGHUM 26 6,810.3 236.1 SOYBEANS 26 43,430.4 3,106.5 SPINACH 50 127.8 7.6 STRAWBERRIES 30 194.9 126.9 SUGARBEETS 29 14,778.4 316.3 SUGARCANE 25 16,625.0 223.7 SUNFLOWERS 16 529.0 48.2 SWEET CORN 25 2,036.2 173.7 SWEET POTATOES 20 200.9 29.4 TOMATOES 23 4,900.0 367.6 WHEAT 25 16,500.0 763.0 WILD RICE 50 0.3 0.5 TOTAL (21) 288,565.5 13,301.6
1 Calculated with % yield loss estimates (column 1), production estimates in Table 4, and % acres treated (Table 5). 2 See Appendices A.1 - A.40 for sources. Primary sources include [5], [17], [53], [95], [165], [182] and [270]. Percent lost on current herbicide-treated acres if herbicides not used.

49
Table 14: Summary of No Herbicide Use Impacts by Crop (000 $) Weed Control Cost
Crop Current Herbicide4 Alternative5 Net (+)
Production Impact (-)1
Total Impact2
(-) NRR 3
ALMONDS 20,533 43,957 23,424 31,500 54,924 2.67 APPLES 17,715 49,864 32,149 139,600 171,749 9.70 ARTICHOKES 419 1,006 587 5,400 5,987 14.29 ASPARAGUS 2,833 4,638 1,805 115,100 116,905 41.26 BLUEBERRIES 652 1,006 354 14,600 14,954 22.93 BROCCOLI 2,398 12,880 10,482 36,000 46,482 19.38 CANOLA 30,603 13,311 -17,292 78,400 61,108 2.00 CARROTS 3,739 15,648 11,909 271,400 283,309 75.77 CELERY 696 13,575 12,879 0 12,879 18.50 CITRUS 80,607 415,600 334,993 0 334,993 4.16 CORN 2,265,353 4,584,134 2,318,781 3,765,000 6,083,781 2.69 COTTON 559,963 2,178,459 1,618,496 868,000 2,486,496 4.44 CRANBERRIES 3,109 5,600 2,491 47,000 49,491 15.92 CUCUMBERS 3,505 9,660 6,155 84,000 90,155 25.72 DRY BEANS 40,030 210,984 170,954 102,500 273,454 6.83 GRAPES 27,932 55,142 27,210 21,900 49,110 1.76 GREEN BEANS 6,548 23,028 16,480 21,500 37,980 5.80 GREEN PEAS 4,051 23,256 19,205 19,200 38,405 9.48 HOPS 1,201 11,300 10,129 29,900 40,029 33.33 HOT PEPPERS 1,547 16,275 14,728 0 14,728 9.52 LETTUCE 8,477 64,885 56,408 153,700 210,108 24.79 MINT 10,392 14,647 4,255 53,000 57,255 5.51 ONIONS 8,268 83,643 75,375 266,000 341,375 41.29 PEACHES 2,978 5,250 2,272 36,000 38,272 12.85 PEANUTS 63,896 144,460 80,564 505,900 586,464 9.18 POTATOES 45,450 129,580 84,130 771,100 855,230 18.82 RASPBERRIES 674 4,584 3,910 0 3,910 5.80 RICE 217,996 58,824 -159,172 465,400 306,228 1.40 SORGHUM 134,918 125,941 -8,977 236,100 227,123 1.68 SOYBEANS 2,110,780 4,392,956 2,282,176 3,106,500 5,388,676 2.55 SPINACH 471 2,639 2,168 7,600 9,768 20.74 STRAWBERRIES 1,420 5,049 3,629 126,900 130,529 91.92 SUGARBEETS 138,163 188,496 50,333 316,300 366,633 2.65 SUGARCANE 51,323 226,908 175,585 223,700 399,285 7.78 SUNFLOWERS 26,347 79,380 53,033 48,200 101,233 3.84 SWEET CORN 16,134 37,785 21,651 173,700 195,351 12.11 SWEET POTATOES 1,664 15,111 13,447 29,400 42,847 25.75 TOMATOES 11,593 141,741 130,148 367,600 497,748 42.94 WHEAT 649,779 868,908 219,129 763,000 982,129 1.51 WILD RICE 9 0 -9 500 491 54.55 TOTAL 6,574,166 14,280,140 7,705,974 13,301,600 21,007,574 3.20
1 From Table 13 2 In calculating total impact, an increase in net cost is considered a loss. 3 NRR: Net Return Ratio; the ratio of the total impact to current herbicide costs. 4 From Table 5 5 From Table 12

50
Table 15: Summary of No Herbicide Use Impacts by State (000$) Weed Control Cost
State Production Impact Current
Herbicide Alternative Net Total
Impact
ALABAMA 164,275 45,134 124,687 79,553 243,828 ARIZONA 84,058 20,333 67,972 47,639 131,697 ARKANSAS 671,917 224,274 368,962 144,688 816,605 CALIFORNIA 899,173 201,034 560,247 359,213 1,258,386 COLORADO 109,045 47,324 138,291 90,967 200,012 CONNECTICUT 1,259 150 513 363 1,622 DELAWARE 36,195 16,162 21,012 4,850 41,045 FLORIDA 485,132 96,165 452,225 356,060 841,192 GEORGIA 532,769 104,882 300,628 195,746 728,515 IDAHO 402,178 85,089 127,801 42,712 444,890 ILLINOIS 1,191,742 652,061 1,303,069 651,008 1,842,750 INDIANA 446,818 339,007 695,882 356,875 803,693 IOWA 1,434,355 808,445 1,342,601 534,156 1,968,511 KANSAS 221,626 232,452 489,958 257,506 479,132 KENTUCKY 102,390 90,866 136,151 45,285 147,675 LOUISIANA 353,432 157,984 304,423 146,439 499,871 MAINE 35,206 3,364 8,251 4,887 40,093 MARYLAND 62,392 38,016 59,766 21,750 84,142 MASSACHUSETTS 18,654 1,829 3,302 1,473 20,127 MICHIGAN 436,220 137,923 343,486 205,563 641,783 MINNESOTA 488,454 524,251 973,653 449,402 937,856 MISSISSIPPI 335,522 161,583 335,706 174,123 509,645 MISSOURI 632,296 272,365 516,680 244,315 876,611 MONTANA 95,622 54,259 111,658 57,399 153,021 NEBRASKA 444,856 383,206 831,663 448,457 893,313 NEVADA 4,229 120 767 647 4,876 NEW HAMPSHIRE 759 48 405 357 1,116 NEW JERSEY 67,381 13,882 15,170 1,288 68,669 NEW MEXICO 27,779 9,747 38,208 28,461 56,240 NEW YORK 106,223 40,325 67,831 27,506 133,729 NORTH CAROLINA 348,218 103,847 288,803 184,956 533,174 NORTH DAKOTA 462,539 363,908 522,320 158,412 620,951 OHIO 586,622 226,715 477,752 251,037 837,659 OKLAHOMA 48,738 49,900 135,425 85,525 134,263 OREGON 165,956 29,417 62,711 33,294 199,250 PENNSYLVANIA 61,567 55,649 97,249 41,600 103,167 RHODE ISLAND 202 29 85 56 258 SOUTH CAROLINA 67,615 45,021 89,195 44,174 111,789 SOUTH DAKOTA 269,223 291,794 547,097 255,303 524,526 TENNESSEE 122,121 84,209 196,481 112,272 234,393 TEXAS 632,446 268,639 1,031,115 762,476 1,394,922 UTAH 6,250 2,095 5,215 3,120 9,370 VERMONT 1,206 32 399 367 1,573 VIRGINIA 70,950 41,624 77,371 35,747 106,697 WASHINGTON 654,552 79,118 164,088 84,970 739,522 WEST VIRGINIA 1,387 1,968 2,458 490 1,877 WISCONSIN 210,392 146,440 291,789 145,349 355,741 WYOMING 8,560 7,260 14,692 7,432 15,992 Note: Includes 40 crops identified in Table 14 summed by state.

51
Table 16: No Herbicide Use, Crop Impacts by State (% Yield Change) State
ALABAMA Cotton –25, peaches –10, peanuts –75, soybeans –45, tomatoes –30 ARIZONA Corn –23, cotton –30, lettuce –13, sorghum –14, wheat –15, ARKANSAS Apples –15, corn –48, cotton –40, rice –53, soybeans –80, tomatoes –20 CALIFORNIA Broccoli –13, carrots –45, cotton –17, lettuce –13, onions –35, tomatoes –20 COLORADO Corn –20, dry beans –23, onions –23, potatoes –7, sugarbeets –10, wheat –6 CONNECTICUT Peaches –12, sweet corn –12 DELAWARE Corn –45, potatoes –20, soybeans –35, sweet corn –30, wheat –50 FLORIDA Cotton –50, peanuts –33, potatoes –30, strawberries –55, sweet corn –17 GEORGIA Cotton –65, onions –20, peaches –25, peanuts –60, soybeans –35 IDAHO Corn –35, dry beans –25, hops –25, onions –15, potatoes –35, sugarbeets –40 ILLINOIS Corn –22, green beans –10, potatoes –5, sorghum –15, soybeans –22 INDIANA Corn –15, cucumbers –59, mint –58, soybeans –15, tomatoes –23 IOWA Corn –25, soybeans –29, wheat –5 KANSAS Corn –10, dry beans –12, sorghum –15, soybeans –15, wheat –10 KENTUCKY Corn –15, sorghum –10, soybeans –28, wheat –8 LOUISIANA Cotton –10, rice –53, sugarcane –44, sweet potatoes –30 MAINE Apples –45, blueberries –67, potatoes –15, sweet corn –15 MARYLAND Apples –9, corn –31, peaches –14, soybeans –25, tomatoes –15, wheat –9 MASSACHUSETTS Cranberries –50, potatoes –10, sweet corn –15, tomatoes –30 MICHIGAN Apples –35, asparagus –50, green beans –60, potatoes –50, soybeans –35 MINNESOTA Corn –15, dry beans –10, green peas –15, soybeans –10, wheat –30 MISSISSIPPI Corn –39, cotton –40, rice –53, soybeans –61, sweet potatoes –20 MISSOURI Corn –30, cotton –40, grapes –25, soybeans –45, wheat –15 MONTANA Corn –13, potatoes –15, sugarbeets –11, wheat –30 NEBRASKA Corn –12, dry beans –25, potatoes –13, sorghum –13, soybeans –15 NEVADA Potatoes –30, wheat –25 NEW HAMPSHIRE Apples –5, sweet corn –15 NEW JERSEY Cucumbers –50, lettuce –50, peaches –50, soybeans –55, spinach –50 NEW MEXICO Corn –20, cotton –32, onions –15, peanuts –23, wheat –10 NEW YORK Apples –17, grapes –12, green beans –18, potatoes –30, sweet corn –20 NORTH CAROLINA Cotton –70, cucumbers –25, peanuts –66, soybeans –21, sweet potatoes –20 NORTH DAKOTA Canola –45, corn –10, potatoes –9, sugarbeets –24, wheat –30 OHIO Corn –34, potatoes –52, soybeans –32, strawberries –35, tomatoes –25 OKLAHOMA Corn –15, cotton –25, peanuts –40, sorghum –10, soybeans –20, wheat –5 OREGON Grapes –15, green beans –30, mint –58, strawberries –25, sweet corn –15 PENNSYLVANIA Apples –20, corn –10, grapes –25, potatoes –22, sweet corn –20 RHODE ISLAND Apples –10, potatoes –20 SOUTH CAROLINA Cotton –30, peaches –40, peanuts –52, soybeans –23, tomatoes –15 SOUTH DAKOTA Corn –15, potatoes –21, sorghum –19, soybeans –18, sunflowers –16 TENNESSEE Apples –27, cotton –25, soybeans –30, tomatoes –27, wheat –15 TEXAS Carrots –25, corn –46, cotton –30, onions –25, peanuts –33, sorghum –45 UTAH Corn –35, dry beans –29, onions –22, potatoes –27, wheat –22 VERMONT Apples –17, sweet corn –15 VIRGINIA Corn –22, cotton –17, peanuts –22, soybeans –18, tomatoes –40 WASHINGTON Apples –8, asparagus –55, green peas –20, potatoes –55, wheat –23 WEST VIRGINIA Apples –12, corn –5, peaches –25, wheat –17 WISCONSIN Corn –10, green peas –12, potatoes –33, soybeans –15, sweet corn –15 WYOMING Corn –20, dry beans –23, sugarbeets –10, wheat –6 Note: Selected impacts only.

52
Table 17: No Herbicide Use, Crop Production Volume Impact by State
Production (Million lbs) State Loss1
ALABAMA 826 ARIZONA 482 ARKANSAS 10,833 CALIFORNIA 9,003 COLORADO 2,241 CONNECTICUT 4 DELAWARE 801 FLORIDA 4,297 GEORGIA 2,476 IDAHO 9,424 ILLINOIS 26,121 INDIANA 9,941 IOWA 31,012 KANSAS 5,447 KENTUCKY 2,106 LOUISIANA 16,361 MAINE 294 MARYLAND 1,317 MASSACHUSETTS 81 MICHIGAN 9,800 MINNESOTA 13,552 MISSISSIPPI 3,956 MISSOURI 11,832 MONTANA 1,890 NEBRASKA 10,368 NEVADA 67 NEW HAMPSHIRE 2 NEW JERSEY 442 NEW MEXICO 320 NEW YORK 1,181 NORTH CAROLINA 2,652 NORTH DAKOTA 9,527 OHIO 11,950 OKLAHOMA 607 OREGON 2,273 PENNSYLVANIA 878 RHODE ISLAND 2 SOUTH CAROLINA 708 SOUTH DAKOTA 5,992 TENNESSEE 1,756 TEXAS 10,158 UTAH 112 VERMONT 5 VIRGINIA 886 WASHINGTON 9,427 WEST VIRGINIA 21 WISCONSIN 3,796 WYOMING 235
Note: Includes 40 crops identified in Table 13 summed by state.
1 Loss without herbicides.

53
Table 18: No Herbicide Use, Labor for Hand Weeding by Crop
Crop Acres (000)1 Hours/A 2 Total Hours (000)
Total Laborers3
ALMONDS 452 7 3,164 19,775 APPLES 271 20 5,420 33,875 ARTICHOKES 5 23 115 719 ASPARAGUS 70 5 350 2,188 BLUEBERRIES 23 5 115 719 BROCCOLI 70 20 1,400 8,750 CANOLA 1,479 0 0 0 CARROTS 119 14 1,666 10,412 CELERY 25 60 1,500 9,375 CITRUS 1,039 0 0 0 CORN 74,237 5 371,185 2,319,906 COTTON 14,998 13 194,974 1,218,588 CRANBERRIES 32 20 640 4,000 CUCUMBERS 35 30 1,050 6,562 DRY BEANS 1,416 16 22,656 141,600 GRAPES 698 8 5,584 34,900 GREEN BEANS 202 12 2,424 15,150 GREEN PEAS 204 12 2,448 15,300 HOPS 34 35 1,190 7,438 HOT PEPPERS 31 60 1,860 11,625 LETTUCE 190 38 7,220 45,126 MINT 93 18 1,674 10,462 ONIONS 147 64 9,408 58,800 PEACHES 100 6 600 3,750 PEANUTS 1,497 10 14,970 93,563 POTATOES 1,178 10 11,780 73,625 RASPBERRIES 11 43 473 2,956 RICE 3,268 0 0 0 SORGHUM 9,329 0 0 0 SOYBEANS 71,141 5 355,705 2,223,156 SPINACH 14 20 280 1,750 STRAWBERRIES 18 30 540 3,375 SUGARBEETS 1,344 15 20,160 126,000 SUGARCANE 977 25 24,425 152,656 SUNFLOWERS 2,520 0 0 0 SWEET CORN 660 5 3,300 20,625 SWEET POTATOES 69 24 1,656 10,350 TOMATOES 394 37 14,578 91,112 WHEAT 32,789 2 65,578 409,862 WILD RICE 2 0 0 0 TOTAL 221,181 (5) 1,150,088 7,188,050
1 From Table 5. Acres currently treated with herbicides. 2 From Table 12. 3 Calculated by dividing the total number of hours by 160, which is the equivalent to the number of hours needed in a four-week period.

54
Table 19: No Herbicide Use, Labor for Hand Weeding by State State # Hours (000) # Laborers
ALABAMA 11,290 70,566 ARIZONA 5,723 35,771 ARKANSAS 28,751 179,695 CALIFORNIA 43,990 274,940 COLORADO 11,107 69,422 CONNECTICUT 50 317 DELAWARE 1,714 10,713 FLORIDA 16,201 101,261 GEORGIA 27,633 172,711 IDAHO 11,398 71,240 ILLINOIS 105,573 659,836 INDIANA 56,553 353,462 IOWA 108,719 679,500 KANSAS 33,861 211,636 KENTUCKY 11,057 69,111 LOUISIANA 27,770 173,565 MAINE 780 4,875 MARYLAND 4,891 30,574 MASSACHUSETTS 356 2,230 MICHIGAN 30,114 188,216 MINNESOTA 80,984 506,150 MISSISSIPPI 28,795 179,971 MISSOURI 41,908 261,928 MONTANA 8,702 54,393 NEBRASKA 67,309 420,682 NEVADA 68 428 NEW HAMPSHIRE 42 263 NEW JERSEY 1,343 8,396 NEW MEXICO 3,529 22,059 NEW YORK 6,246 39,041 NORTH CAROLINA 25,280 158,004 NORTH DAKOTA 43,344 270,900 OHIO 38,873 242,957 OKLAHOMA 10,243 64,024 OREGON 5,457 34,110 PENNSYLVANIA 8,083 50,519 RHODE ISLAND 8 53 SOUTH CAROLINA 7,696 48,104 SOUTH DAKOTA 42,204 263,777 TENNESSEE 16,730 104,567 TEXAS 87,632 547,706 UTAH 433 2,710 VERMONT 42 264 VIRGINIA 6,660 41,630 WASHINGTON 13,919 86,997 WEST VIRGINIA 222 1,388 WISCONSIN 24,305 151,910 WYOMING 1,401 8,760 Note: Includes 40 crops identified in Table 18 summed by state.

55
Table 20: Cropland Erosion Rates by State Tons/Acre Yr.1
State No-Till Acres2 Cultivated
Non-Cultivated Difference
Erosion prevented by
No-Till (million lbs)
ALABAMA 434,916 6.7 .5 6.2 5,392 ARIZONA 4,100 .7 .2 .5 4 ARKANSAS 755,413 3.5 .6 2.9 4,381 CALIFORNIA 12,692 .7 .5 .2 5 COLORADO 513,435 1.7 .2 1.5 1,540 CONNECTICUT 3,825 5.6 .7 4.9 37 DELAWARE 233,775 2.0 .4 1.6 748 FLORIDA 53,856 1.8 .5 1.3 140 GEORGIA 505,112 5.9 .3 5.6 5,657 IDAHO 233,781 3.4 .4 3.0 1,402 ILLINOIS 6,961,627 4.1 .6 3.5 48,731 INDIANA 4,908,432 3.0 .9 2.1 20,615 IOWA 5,056,840 4.9 .8 4.1 41,466 KANSAS 3,154,908 2.2 .4 1.8 11,357 KENTUCKY 1,784,529 4.4 1.2 3.2 11,420 LOUISIANA 240,186 3.3 .6 2.7 1,297 MAINE 672 3.9 .3 3.6 4 MARYLAND 686,162 4.4 1.2 3.2 4,391 MASSACHUSETTS 4,080 4.5 .1 4.4 35 MICHIGAN 1,387,500 2.0 .5 1.5 4,162 MINNESOTA 457,790 2.1 .3 1.8 1,648 MISSISSIPPI 791,984 5.3 1.2 4.1 6,494 MISSOURI 3,170,081 5.6 .7 4.9 31,066 MONTANA 1,115,249 1.9 .3 1.6 3,568 NEBRASKA 3,468,978 2.9 .5 2.4 16,651 NEVADA 0 .2 0 .2 0 NEW HAMPSHIRE 600 3.5 .4 3.1 3 NEW JERSEY 84,277 5.6 .6 5.0 842 NEW MEXICO 110,931 .9 .1 .8 177 NEW YORK 114,627 3.9 .7 3.2 733 NORTH CAROLINA 1,456,624 5.0 1.0 4.0 11,652 NORTH DAKOTA 1,906,711 1.4 .3 1.1 4,194 OHIO 4,204,204 2.6 1.4 1.2 10,090 OKLAHOMA 497,806 2.8 .5 2.3 2,289 OREGON 165,115 3.1 .4 2.7 891 PENNSYLVANIA 515,273 5.1 1.2 3.9 4,019 RHODE ISLAND 108 3.5 1.8 1.7 0 SOUTH CAROLINA 354,605 3.2 .7 2.5 1,773 SOUTH DAKOTA 2,996,322 2.0 .2 1.8 10,786 TENNESSEE 1,410,364 7.7 .6 7.1 20,027 TEXAS 447,452 2.6 .8 1.8 1,610 UTAH 11,298 1.6 .2 1.4 31 VERMONT 3,550 3.1 .7 2.4 17 VIRGINIA 665,482 5.9 1.5 4.4 5,856 WASHINGTON 342,494 4.7 .6 4.1 2,808 WEST VIRGINIA 47,655 4.3 .8 3.5 33 WISCONSIN 876,734 3.7 1.2 2.5 4,383 WYOMING 28,869 1.1 .1 1.0 58 TOTAL 52,181,024 304,483 Note: Sheet and Rill Erosion
1 Source: [342] 2 Source: [72], data for 2000.


57
4.0 Summary and Conclusions
Every year, U.S. growers choose herbicides as the primary method to kill weeds that
would otherwise significantly lower yields. An average U.S. cropland acre is treated with
two pounds of herbicide active ingredient costing $30/acre.
If U.S. farmers employed an additional 7 million hand weeders and increased cultivation,
overall crop production would decline by 21 percent, which is equivalent to 288 billion
pounds of food and fiber. If farmers could not pass along their increased costs to buyers,
then the $7.7 billion increased production cost combined with lost production valued at
$13.3 billion would result in reduced grower net income of $21 billion, or 40 percent of
the total net income of American farmers. NCFAP researchers made no attempt to
estimate the number of farmers who would stop producing crops given this reduction in
income.
To estimate the value of herbicides, NCFAP simulated their nonuse and replacement with
available alternatives. Another approach would be to simulate the amount of labor
necessary to prevent any yield loss. However, the large estimated labor requirement (70
million workers) would have been of limited use in policy discussions.
Herbicides are essential if the U.S. is to maintain current yields. Even though there is an
equally effective alternative for most crops, hand weeding, cost and labor scarcity mean it
is unlikely growers could substitute enough hand labor to maintain yields. The
Environmental Protection Agency regularly approves emergency herbicide registrations
because growers cannot afford to use hand labor to remove weeds.
NCFAP assigned sufficient hand weeding to prevent yield loss to four crops. This
assignment, however, was made merely to illustrate that hand labor could prevent yield
losses. In actuality, the growers of celery, citrus, hot peppers and raspberries would be
unlikely to employ the weeders specified, and yield losses would occur. It is equally
unlikely that growers of other crops in the study would employ the number of workers
specified because the workers needed for weeding is seven times the current number of
farm workers. As a result, yield losses would be higher for all the studied crops.
58
Therefore, the NCFAP estimates represent the minimum economic impact of the nonuse
of herbicides.
No consumer price increases and no food shortages are estimated. The estimated losses
could be made up with increased imports meaning a $13.3 billion worsening of the trade
balance.
Herbicide use is only 60 years old and yet, societal changes have occurred that make it
impossible to return to previous weed control practices. Migration of workers from rural
areas has created shortages of farm workers. The average wage rate for farm workers has
increased by 7000 percent in the last 60 years. Farmers who paid $10/acre for hand
weeding in the 1940s would face a labor cost of $700/acre at today’s rates. The use of
herbicides at $30-50/acre remains the most cost-effective alternative. To put herbicide
use in perspective, research examining weed control practices of organic growers shows
they often do not employ enough laborers to prevent yield losses. A vast expansion of
organic crop acreage in the US is unlikely due to the high costs of hand weeding. In fact,
organic growers cite weed control without herbicides as their biggest problem. Herbicides
are used on 220 million acres of cropland while organic cropland totals 1 million acres.
The amount of labor necessary for a vast expansion of organic growing is not available.
Herbicide use has enabled U.S. farmers to significantly reduce their use of tillage for
weed control. The reduction in tillage has resulted in less erosion. Without herbicides,
U.S. growers would no longer be able to practice no-till crop production. The
abandonment of no-till farming would result in an increase of 304 billion pounds of soil
erosion.
This study is the first comprehensive documentation of the role that herbicides play in
U.S. crop production. Herbicide use is routine for farmers and poorly understood by the
public and the media. This report is meant to stimulate discussion of the importance of
herbicides and to clearly indicate the choices and consequences of farming without their
use.

59
5.0 Appendices A.1 – A.40 A.1 Almonds Maintaining an orchard floor free of weed growth has many advantages for almond production. In addition to competing with almond trees for water and nutrients, weeds also interfere with the harvesting of nuts, which are picked up off the soil surface after being knocked from the tree [195]. Prior to the introduction of herbicides for weed control, it was common practice to disk in both directions with heavy equipment that tended to compact the soil, decreasing water penetration [196]. Decreased water penetration increased the amount of runoff water in orchards and led to soil erosion problems. Disking also results in mechanical injury to the lower trunk, making the tree susceptible to diseases [196]. In addition, disking cuts feeder roots in the top six inches of soil; thus, the tree cannot use the rich supply of nutrients, water and oxygen in this area [196]. Research began in 1958 for herbicides in almonds with two purposes: to increase water penetration and to eliminate the need to hand hoe weeds from around the base of trees [197]. The use of herbicides substituted for 16 cultivations (including five hours of labor) and two hours of additional hand labor for hoeing [197]. In addition, one less irrigation was necessary once tillage was eliminated. Grower savings of $21/A were reported (labor was priced at $1.65/h) [197]. Reduced tillage meant less dust, which reduced spider mite problems. Harvesting and hulling were completed faster due to fewer problems with dirt and stones [198]. Organic almond growers typically plant a cover crop that requires a post-harvest irrigation ($14/A), mow weeds three times during the season ($22/A) and use labor for hoeing and mowing (7 hours/A) [199]. In 1965, it was estimated that California almond growers applied herbicides to 27% of the state’s acreage, while in 1999, 86% of the acreage was treated [258] [14]. It has been estimated that without herbicide use, California almond yields would decline by 5% [5].

60
A.2 Apples Weeds compete with apple trees for water, light, nutrients, and space. Weeds can harbor insect, disease and rodent pests that can adversely affect apple trees [331]. The girdling of apple trees by field mice is a common problem. Since these species of mice will seldom cross a bare area to feed, it is desirable to remove all vegetation at the base of trees to help reduce the possibility of girdling. Prior to the development of herbicides, apple growers maintained the bare area by slow and costly hand labor methods [332]. At least two and sometimes three hoeings a year were needed [333]. Mechanical cultivation and mowing were also used to lessen weed cover and competition. During every cultivation, running the cultivator close to the trees raised the risk of injuring or destroying an occasional tree. The scarcity and increased cost of labor resulted in research into chemical weed control in apple orchards [335]. Residual herbicides maintained a weed-free band down the tree row for approximately six months [335]. Research showed that mouse injury could be eliminated with herbicide treatment in comparison to higher incidences with cultivation only (86% injury) or cultivation and three hand hoeings (12% injury) [334] [332]. Research also showed increased apple yields in herbicide-treated areas in comparison to tilled areas due to less root pruning and less trunk injury. Studies have shown that apple trunk girth, shoot length and yields are higher with herbicide treatments than with cultivation [331]. A recent Michigan State University study concluded that without herbicides, apple growers would be forced to switch to more costly, less effective methods for weed control [337]. Damage from mechanical weeding was estimated to reduce apple tree yields by 10%. Another alternative would be to apply mulch in the orchard (at $275/A). The mulch cover would necessitate increased irrigation water usage in the Northwest, as well as a five-fold increase in the use of rodenticides to kill mice [53]. Weed control is one of the biggest challenges in organic apple production due to the high cost of alternative methods when compared to herbicides [338]. A Colorado organic apple grower reported that mice girdled 1000 trees on their farm in 1999 [307]. A cost of production budget for organic apples in California includes 20 hours of hand weeding and 2 diskings per acre for weed control [338]. In 1964, it was estimated that 15% of U.S. apple acreage was treated with herbicides [376]. USDA surveys indicate that approximately 63% of U.S. apple acreage has been treated with herbicides annually in recent years [14]. The proportion of apple acreage treated with herbicides has increased in recent years as growers have increased plantings of dwarf trees (see Figure A1). Growers often use high-density plantings in new orchards. High-density plantings are less competitive with weeds than traditionally larger trees and make weed control more important [331]. The new orchards typically have 200 to 1500 trees per acre compared with older orchards, which had 50 to 80 trees per acre. In older orchards with larger trees, many growers tolerated weeds. Research demonstrated the importance of weed control on apple tree growth in the new high-density orchards [371]. The high-density orchards with trees 8 to 10 feet tall are designed to utilize available soil and water resources fully; thus there is less tolerance for weeds. Smaller trees with smaller roots are more sensitive to weed pressure. Experiments in high-density apple plantings resulted in an average yield increase of 32% in the herbicide-treated plots, in comparison to the mowed plots [336]. It

61
has been estimated that without herbicides, U.S. apple production would decline by 15% [5]. A.3 Artichokes Artichoke production systems are classified as either perennial or annual. Perennial artichokes are harvested for 5 to 10 seasons before replanting. Annual artichokes are harvested for one season. Approximately 80% of California’s artichokes are perennial [327]. There are two important times when herbicides are used to control weeds in perennial artichokes: planting a new field, and after irrigation ditches are made [328]. Newly planted fields need to be as weed-free as possible to ensure a good start for the plants. Most growers apply a residual herbicide at planting. Standard production practices call for new artichoke stands to be heavily watered for 30 to 60 days after transplanting. The wet environment is not only conducive to weed growth, but it also impedes hand weeding [330]. Weedy shoulders are slippery, creating a safety hazard to the harvesting crew. The second important time is after winter rains when ditches are made in perennial artichokes to assure proper drainage. Harvesting requires a walking path on the shoulders of the ditches. Weedy shoulders slow down the harvesting process and the drying rate of artichoke beds. During the rainy season, wet soils make mechanical cultivation difficult and some growers apply herbicides [329]. Perennial artichoke is planted at wide row spacing, which permits cultivation in two directions, and is cross-cultivated 4-5 times [328]. Prior to the development of herbicides, the typical perennial acre was cultivated 7 times [369]. Annual artichoke is planted more densely and cultivated in only one direction. A larger area is left uncultivated, which requires herbicide application or hand weeding [330]. A recent experiment determined that perennial artichokes would produce equivalent yields if 4 additional hours of hand weeding/A substituted for herbicides [330]. However, in annual artichoke production, yields were 32% lower even with an additional 42 hours of hand weeding/A as a substitute for herbicides [330]. USDA surveys indicate that approximately 58% of California’s artichoke acres are treated with herbicides [16]. Assuming that herbicide-treated artichoke acres are divided equally between perennials and annuals, this implies a need for 23 additional hours of hand weeding and a yield decline of 16% without herbicides.

62
A.4 Asparagus Asparagus is a perennial vegetable crop. It takes about three years for asparagus to develop from seed into a producing plant. Asparagus crowns can be productive for 20 years. Asparagus spears are usually hand harvested every one to five days in the growing season. Asparagus competes very poorly against weeds because the crop does not produce much shade until late in the season. Weeds growing around spears make harvest very difficult, since harvesters cannot see the proper spears to be cut [207]. Prior to the introduction of herbicides, weed control in asparagus was accomplished with 4-6 cultivations [205]. However, cultivating during the cutting season causes the loss of 5 to 7 days of spear production [206]. Disking up the field causes reduction in the vegetative stalks and can be reflected in reduced yield in subsequent years [377]. The use of herbicides offered relief from this mechanical injury. Early research with residual herbicides resulted in weed-free beds for 4 weeks following application, with no need for cultivation or hand hoeing [208]. Weed control has been identified as the most serious challenge facing organic asparagus growers [209]. USDA surveys in the 1990s indicate that from 81-91% of U.S. asparagus acreage is treated with herbicides [16]. It has been estimated that without herbicides, U.S. asparagus production would decline by 55% [5]. A.5 Blueberries Lowbush blueberry fields in Maine have been developed from naturally occurring stands. Through management of this wild acreage, commercial blueberry production reached 10 million pounds annually in 1927. Weeds were identified as a major factor that limited yield in 1946 and were still a major concern in a 1974 survey [210]. Weed growth not only lowered blueberry yield through competition but also made harvesting difficult with 10-30% of the crop left behind [236]. The inability to control weeds also resulted in growers’ unwillingness to fertilize blueberries, since the fertilizer resulted in dense growth of weeds [236]. The registration of terbacil in the 1970’s provided effective control of grasses and sedges, and resulted in significant yield increases when combined with increased fertilizer use [212] [213]. The subsequent registration of hexazinone in the early 1980’s provided effective control of grasses, herbaceous, and woody weed species in low bush blueberry fields [213]. As a result of improved weed control, research demonstrated that use of hexazinone increased blueberry yields by 56% [213] [214]. Since the introduction of hexazinone in 1983, blueberry production in Maine has more than tripled, from an average of 20 million pounds per year to over 75 million pounds per year (see Figure A2). The consumption of blueberries in the diet of Americans increased significantly following the increased production in Maine (see Figure A3). In addition to reduced weed competition, hexazinone has facilitated increased use of fertilizer. Approximately 95% of Maine’s wild blueberry crop is treated with herbicides [74].

63
A study comparing organic and conventional blueberry farms in Maine revealed that organic yields were 75% lower than the conventional farm yields [215]. Without herbicides, Maine’s blueberry production would decline by 67% [74]. A.6 Broccoli Broccoli is a direct-seeded crop. Although broccoli germinates rather quickly, it is very susceptible to competition from weeds during the germination and early growth stages. Prior to the development of synthetic chemical herbicides, weed control in California broccoli fields was accomplished through repeated cultivations and hand weeding with short-handled hoes. These practices were very costly, and resulted in lower yields from root damage and inadvertent loss of plants. In the late 1960s, it was estimated that hand weeding broccoli fields cost about $40/A (20 hours/A@$2/HR). The scarcity and rising costs of labor spurred research into chemical herbicides for broccoli [249]. Research demonstrated that the herbicide nitrofen could be used safely over the top of broccoli plants to control emerged weeds [249]. With the development of nitrofen, broccoli became the first seeded crop that could be planted to a stand with minimal hand weeding. When herbicides replaced hand weeding, broccoli growers reported a savings of $35/acre and a 30% increase in yield [320]. Following the cancellation of nitrofen, broccoli growers had limited weed control choices. In 1981, EPA estimated that broccoli growers might incur hand weeding costs of up to $100/A (20 hours/A @ $5/HR) [250]. Broccoli growers substituted by increasing hand weeding and increased the use of other herbicides (DCPA, trifluralin) for nitrofen. Many broccoli growers stopped using herbicides (only 51% of broccoli acreage is treated with a herbicide). These growers substituted liquid nitrogen fertilizer for killing weeds. These fertilizers have contact weed control properties, and broccoli has a protective waxy surface (cuticle) that protects it from damage [251]. At an increased fertilizer rate of 200 pounds per acre, weed control is effective, although the fertilizer treatment is not registered as an herbicide [252]. An organic broccoli grower in Rhode Island reports the need for 22 hours of hand weeding per acre following 4 cultivations [299]. It has been estimated that without herbicides, California and Arizona broccoli production would decline by 13% and 24%, respectively [5].
64
A.7 Canola Canola is an edible type of rapeseed that was developed in Canada in the 1970s. Cano la oil is usually blended with other vegetable oils for the production of various solid and liquid cooking oils and salad dressings. Canola was first planted in the U.S. in the late 1980s. Weeds are the most limiting factor in canola production. Weeds affect canola in two ways. First, weeds reduce yields by competing for available resources. Uncontrolled weeds, such as wild mustard, have been reported to reduce canola yields ranging from 19 to 77% [200]. Second, weed seeds such as wild mustard reduce the quality by contaminating canola seed. Since canola is a shallow-seeded crop, the use of a rotary hoe or harrow for weed control is discouraged. These tillage tools can injure or destroy canola seedlings [201]. Canola is commonly seeded in narrow rows. In-crop cultivation is not a viable alternative. Canola is a cool season crop that is most productive when seeded early in the spring. Broadleaf weeds and annual grasses that compete with the canola germinate and emerge along with the canola seedlings. Although delayed seeding and/or tillage can reduce weed abundance, these practices result in lower canola yields due to non-optimal planting dates. At the time of its introduction in the U.S., very few herbicides were registered for canola. Canola production was limited in the U.S. because growers were unwilling to expand acreage into areas with significant weed problems that could not be controlled. In addition, the early 1990s were a period of rapid infestation by Canada thistle in canola-growing states, which was not controllable by the previously registered herbicides. Canola growers petitioned EPA for the registration of effective herbicides, citing the potential loss in canola yield of 24 to 35% from Canada thistle. The registration of effective herbicides resulted in a 59% expansion of canola acreage, as the herbicides resulted in reduced weed competition and lower dockage in the harvested canola seed [202] (see Figure A4). Total U.S. canola production increased by 75% [1]. Research demonstrated an increase in canola yield of 73-80% as a result of using effective herbicides, in comparison with a weedy check [203] [204]. It is estimated that 99% of canola acreage is treated with herbicides [253].

65
A.8 Carrots Prior to the introduction of synthetic chemical herbicides, carrot growers controlled weeds with cultivation, hand weeding with short-handled hoes and the use of oil to kill emerged weeds. Cultivation can only be used between the rows of plants, and weeds growing in the row are uncontrolled. Carrots required 28 hours per acre for weeding and hoeing in California in the 1930s [193]. High re-registration costs resulted in the voluntary cancellation of oil for carrots. Short-handled hoes were banned in California in the 1960s. Oil was used at approximately 50 gallons per acre; oil use was generally not harmful to carrots and killed a broad spectrum of weeds [19]. Early research with synthetic chemicals, particularly linuron (at 1 lb/A), demonstrated less expensive weed control in comparison to the use of oil and hand weeding [20] [21]. Carrot yields did not dramatically increase following the widespread use of herbicides, since the hand weeding with short-handled hoes and oil treatments were effective (See Figure A5). Mechanical cultivation would be the primary substitute for herbicides, and therefore it was assumed that hand weeding would be used only as a small-scale replacement [17]. Organic carrot growers report that the biggest cost in producing organic carrots is weed control, with primary reliance on hand weeding and cultivation [22]. USDA has recently estimated that herbicides are used on 98% of U.S. carrot acreage, and that without herbicides, U.S. production of carrots would decline by 48% [17]. A.9 Celery In the 1940s, it was reported that production costs for celery were higher than any other field-grown vegetable crop in California [339]. Until the middle 1960s, weed control was one of the largest production costs for California celery growers. Each celery acre required 30 to 60 hours of weeding, with crews using short-handled hoes [340]. Research demonstrated that herbicides in celery fields would provide greater than 90% control of troublesome weed species [341]. Celery yields with the herbicide treatments were equivalent to the hand weeded plots [340]. Approximately 85% of US celery acreage receives herbicide treatments [16].
66
A. 10 Citrus After World War I, heavy tractor-drawn equipment for mechanical cultivation of weeds became increasingly common in California’s citrus orchards. However, in most orchards the frequent traffic of heavy equipment caused a gradual deterioration in soil structure. The result was decreased water penetration and damaged roots, which reduced tree growth and productivity. Cultivation destroyed citrus feeder roots in the top layers of soil, and created a soil hardpan above the remaining deeper roots, which were cut off from nutrients and water [50]. Damage to roots provided entryways for disease organisms. In the 1940s, experiments began using light petroleum oils for weed control as an alternative to mechanical cultivation. The use of non-tillage in citrus orchards was rapidly adopted in California and is regarded as the most fundamental change in soil management in the history of citrus production [41]. Citrus groves in California were treated with 90 gallons of oil per acre [41]. Oil kills weeds present at the time of treatment and requires repeated applications [42]. The first residual herbicide registered in citrus was monuron in 1955, which was followed by simazine and diuron. Research demonstrated that two applications to the soil of the residual herbicides in combination provided yearlong control of most annual weed species [44]. Post emergence contact herbicide applications are made to control weeds missed by the residual compounds. Organic citrus growers in California control weeds with hand weeding, mechanical mowing, and cover crop mulches. Organic orchards are typically weeded three times each year, with a total use of 6 hours of labor [385]. Florida’s warm and humid climate offers a very conducive environment for continuous germination of weed seeds and vigorous growth. Frequent irrigation and nutrient applications further enhance the weed problem in citrus groves, and uncontrolled weeds use a sizeable portion of nutrients and water, resulting in poor tree growth and reduced yields. Prior to herbicide use, Florida citrus groves were mechanically cultivated and hand hoed [46]. Eight to nine mechanical weedings and 2-3 hand weedings were required per acre [47] [52]. Chemical weed control became widespread in Florida in the late 1960s. Adoption of herbicide technology enabled growers to significantly reduce the costs of labor in Florida groves [48]. Florida research demonstrated that significantly better tree growth, earlier production, and less physical damage to trees occurred under herbicide programs compared to tillage programs [49]. Research showed that non-tilled groves under a chemical weed control program are 1 to 2 C warmer than trees under cultivation or sod [51]. This degree of warming is sufficient to significantly improve tree survival during cold nights. Therefore, citrus growers embraced chemical weed control, not only as a yield- improving measure but also for freeze protection. The benefits of this practice are acknowledged by the Federal Crop Insurance Corporation, in the form of discounted tree insurance premiums to growers who use chemical weed control with no tillage. A survey of Florida organic citrus growers determined that weeds are considered the single most important problem in organic citrus production [55]. Mechanical cultivation (up to 5 times) and hand weeding (up to 4 times) are required for organic production. In 1964, it was estimated that 5% of U.S. citrus acreage was treated with herbicides [376]. A 1971 survey indicated that 22 % of U.S. citrus acreage was treated with

67
herbicides; surveys conducted since 1993 indicate that 84-95% of U.S. citrus acres are treated annually with herbicides [14] [173]. A recent study, projecting the economic impacts of eliminating herbicide use in citrus, estimates that yields would remain unchanged in California and Florida [53]. Increased cultivation would occur in California without herbicides; in order to maintain yields, the use of fertilizer and irrigation water would have to double [53]. Thus, without herbicides, California growers would have to cultivate 8 times and apply an additional 30 acre inches of water and an additional 88 pounds of fertilizer per acre [54]. In Florida, herbicides would be replaced with an additional 8 mowings per year and with an additional 67 hours of labor for hand hoeing. The increased costs of the no-herbicide scenarios were estimated at $400/A in Florida, due to mowing and increased hand labor and, $359/A, in California due to increased use of fertilizer, irrigation and cultivation [53]. A.11 Corn An 18-year study in the early 1900s demonstrated that without weed control, corn yields would be reduced to zero in some years and would generally be about 80% lower than in plots where weeds were controlled [220]. A 1912 USDA study summarized the results of 125 experiments from the late 1800s and early 1900s, concluding that the only benefit from cultivating corn was weed control [230]. In the years prior to the use of herbicides, common practice for weed control in corn was to cultivate 4 to 5 times. In order to facilitate complete cultivation of cornfields, the corn plants were planted far enough apart to allow for cultivation on all four sides of each plant [221]. Certain weeds were poorly controlled by cultivation and required hand labor for removal, often by family children [372] [373] [374]. At times, cultivation lowered corn yields due to root pruning [222]. One limitation on cultivation’s effectiveness is the inability to cultivate in a timely fashion due to wet conditions [223]. A reduction of corn yield of .57 bu/A/day was expected with each day’s delay in the cultivation operation, with a 5-day delay being common [224]. In river bottomlands, where the soil was often too wet for timely cultivation, corn crops were often lost because weeds took over [225]. In some areas, farmers stopped growing corn because of weed problems [226]. The introduction of 2,4-D in the late 1940s provided corn growers with an effective post emergence control of broadleaf weeds, and led to a reduction of cultivation. Initially, chemical weed control in corn replaced two cultivations [315]. Herbicide use in corn improved yields 15-25%, compared to cultivation due to control of weeds in the row of plants and less damage to corn plants due to root pruning [316]. 2,4-D use is credited with saving some bottomland cornfields from abandonment [225]. One report from 1947 states that one million additional bushels of corn were produced from 18,000 acres of bottomlands in Kentucky as a result of 2,4-D spraying [384]. In 1947, Nebraska corn yield increases of 11-49% were recorded as a result of 2,4-D spraying [384]. In 1959, the introduction of atrazine made it possible for corn growers to control a broad spectrum of weeds with residual pre emergence herbicide treatments, creating further reductions in tillage. Research demonstrated that substituting atrazine for tillage resulted in an 8% increase in corn yield [227]. Average corn plant popula tions increased from approximately 12,000 plants/a in the 1950s, to 20,000 plants per acre at the end of the 1970s. Corn yields steadily increased in the decades following World War II (see Figure A6). A statistical analysis of the contribution of individual technological improvements to

68
corn yield credited increased herbicide use as accounting for 20% of the increase in corn yields from 1964 to 1979 [229]. In recent years, the typical corn acre was tilled once [152]. Research showed that two hand weedings, totaling 60 hours per acre, would produce corn yields equivalent to herbicide treatments. Since the hoeing would need to be done during a six-week period, a labor force of 18 million people was estimated as the total hand weeding need for corn [317]. Combining 18 hours of hand weeding/acre with cultivation also produced corn yields equivalent to herbicide treatments [317]. Numerous experiments have been conducted over the last ten years examining the effectiveness of alternative cultivation techniques for weed management in corn. Research has shown that if the timing is optimal and enough cultivation trips are made, corn yields can be equal to those in herbicide treated plots. In one experiment, 3 rotary hoeings and 2 cultivations produced corn yields equa l to those of normal rates of herbicides [231]. Research has also shown that mechanical cultivation is less effective than herbicides during years when rain prevents timely tilling [232]. In one experiment, corn yields were similar in dry years, but in one year, wet weather caused cultivations to be late, preventing the final cultivation entirely [233]. In that year, mechanical treatments, which had produced equivalent yields to herbicides in dry years, resulted in yields 26% lower than the herbicide treated plots [234]. A cost of production budget for organic corn in the Northeast, based on information from the Rodale Institute, specifies a 13% reduction in corn yield [361]. North Dakota State University has prepared budgets for organic corn, which specify a 25% yield reduction [260]. Figure A7 shows the trend in U.S. corn acreage treated with herbicides. Approximately 7% of the nation’s corn acres were treated in 1949. More than 90% of U.S. corn acres have been treated with herbicides since 1976. Nationally, it is estimated that corn yields would decline by 20% without herbicides [5].
69
A.12 Cotton Prior to the early 1900s, weeds in cotton were controlled by hand hoeing. In the early 1900s, a combination of 5 to 7 mechanical cultivations and hand hoeing provided adequate weed control [154]. In the 1930s, it was estimated that 33 hours of labor were required for hoeing an acre of cotton [155]. Hand hoeing was generally effective, but the labor needed from year to year fluctuated widely and could exceed 100 hours per acre [157]. In the early 1950s, weed control was the last key needed to complete mechanization of cotton production—following the mechanization of harvest. Prior to 1960, less than 10% of the total U.S. cotton acreage received herbicide treatment, but by 1970, most cotton acreage received herbicide treatment (see Figure A8). The impetus behind this rapidly expanded use was more selective and effective herbicides such as trifluralin and DSMA/MSMA. Also, the mass exodus of farm workers, who had provided the hand labor for hoeing weeds in cotton, continued to move from rural to urban areas [156]. The prices paid for hand labor in the 1950s and early 1960s increased three to four fold, partially because of the migration of vast numbers of farm workers from southern to northern states [158]. Several individual southern states experienced a net loss of 200,000 to 300,000 farm workers within a decade. This dramatic loss of farm labor caused the price of hoe labor to increase dramatically, and in some localized areas, to be unavailable for cotton. It has been estimated that chemical weed control reduced the labor requirements on 1 million acres of cotton in Mississippi by 20 hours per acre [160]. The hoe labor was budgeted at $.50/hour. In Arkansas and Alabama, research demonstrated that chemical applications could reduce hand labor by 75%, in most instances. This represented a reduction of 30 to 40 hours per acre of hand labor [162] [163]. Research in Georgia demonstrated that chemical weed control was equivalent to 26 hours/A of hand hoeing [164]. Because of the effectiveness of hand hoeing, the switch over to herbicides did not reduce yield losses to weeds, or lead to dramatically increased yields (see Figure A9). In the 1951-1960 time frame, it was estimated that U.S. cotton yield loss to weeds totaled 8% [148]. In 1980, it was estimated that weed interference in U.S. cotton fields reduced cotton production by 7.4% [159]. A preliminary three-year study in California resulted in equivalent yields of organic and conventional cotton [322]. However, in subsequent years the organic yields were 19% lower than the conventional ones [322]. A cost-of-production budget for California organic cotton identifies a need for 9 cultivations and 12 hours of hand weeding per acre [323]. A national survey of organic cotton growers indicated that they control weeds with cultivation and hand weeding [368]. Lower yields and higher costs for weeding are two of the main reasons that organic cotton sells at a higher price [324]. Organic cotton growers identify the greatest research need to be improved weed control [321]. After peaking at 25,000 acres in 1995, U.S. organic cotton acreage has declined to 11,000 [321] (see Figure A10) due to the withdrawal of several large apparel buyers from the organic market [325]. Expansion of organic cotton acreage in the U.S. has been stifled, due to the reluctance of clothing companies to sign contracts with U.S. growers when they can buy organic cotton much cheaper in countries like India and Turkey, where labor costs are significantly lower [326]. A national survey of organic cotton growers indicated that average yield was .9 bales per acre in 2000, which was 30% lower than average U.S. cotton yield [321].

70
Recent research has shown that it is possible to achieve cotton yields with hand hoeing equivalent to those of herbicide treatments [161]. However, 67 hours per acre was required in Alabama. A recent report from USDA estimated that, without herbicide use, U.S. cotton yield would decline 27%, despite increased cultivation and hand hoeing [165]. A recent report from Texas A&M University estimated that without herbicides, U.S. cotton yields would decline by 17%, despite 5-9 additional cultivations and 5-20 additional hours of hand weeding per acre [95]. A. 13 Cranberries An individual cranberry vine can be productive for fifty years before replacement is necessary. The leaves of the cranberry plant form a dense mat over the surface. There are no paths through a cranberry bog. Weeds are particularly troublesome in cranberry bogs, since mechanical equipment (such as cultivators) cannot be used for their control [29]. In the early 1900s, cutting with a scythe and hand pulling were the only methods of controlling weeds in cranberry bogs. It was a common sight in the “old days” to see gangs of weeders crawling over the bogs, dragging their weed baskets after them. In those days, weeders were paid about ten cents an hour, and by keeping them continually at work, some beautiful bogs were kept scrupulously clean [30]. In the 1930s, with the rising cost of labor, the realization came that hand weeding, on a large scale, was out of the question. Hand weeding also caused considerable damage to the cranberry plants [31]. Vines and berries were crushed under the workers feet. Among the labor saving methods of weed control discovered in the 1930s, the most generally accepted was the spraying of kerosene oils. Research in the 1930’s indicated that dormant cranberry vines would tolerate heavy dosages of kerosene; but that most grasses, sedges, and rushes would be killed [30]. In the 1950s, over a half a million gallons of kerosene were sprayed annually in Massachusetts cranberry fields [30]. The minimum dosage of kerosene for effective weed control in cranberry bogs is 300 gallons per acre [30]. Significant increases in oil prices in the early 1970s made the continued use of kerosene oils prohibitively expensive for cranberry growers [32]. Another common practice in the 1940s and 1950s was to broadcast spray ferrous sulfate at rates of 3,000 to 8,000 pounds per acre for control of poison ivy, chokeberry and wild bean [31]. The first synthetic chemical herbicide to receive widespread use in cranberries was dichlobenil, which was tested in 1959 and registered in 1965. Research indicated that a single application of 4 lb AI/A would provide six to eight weeks control over a broad spectrum of perennial and annual broadleaf and grassy weeds. In the 1970s, registration was granted for two other synthetic chemical herbicides: norflurazon and napropamide. These two herbicides expanded the list of weeds effectively controlled. Use of the herbicides led to the almost complete eradication of certain weed species from cranberry bogs [33] [34] [35]. The synthetic herbicides largely replaced the use of kerosene and ferrous sulfate, because they were cheaper and more effective [36]. In the early 1970s, the introduction of dichlobenil, norflurazon, and napropamide is credited as the most important factor in the doubling of cranberry yields from 1960-1978 [35] [38] (see Figure A11).

71
Another major breakthrough in weed control was the registration of glyphosate, used as a herbicide that is wiped on the portion of the weeds that is taller than the cranberry vines. This use of glyphosate controls certain weeds that had not been adequately controlled with the previously registered herbicides [37]. The introduction of glyphosate is credited with a steep increase (50%} in cranberry yields in the early 1980s [35] [38] (see Figure A11). The improved yields led to a doubling of overall volume production of cranberries, as acreage remained the same. Approximately 95% of U.S. cranberry acreage is treated with herbicides. A recent report estimates that, without the use of herbicides, cranberry yields would likely decline by 50 to 60 percent, as growers would resort to the less effective weed control methods of hand pulling and mowing [39]. The report concludes that without herbicides, up to half of U.S. cranberry growers would eventually go out of business, since it would no longer be profitable to farm when their beds became overwhelmed by weeds in 5 to 10 years [39]. A.14 Cucumbers The main alternative to herbicides in cucumber fields is mechanical cultivation. However, due to the vining nature of cucumber plants, mechanical cultivation has limited effectiveness. Each successive cultivation is less effective than the previous one, because the uncultivated row area must be increased with each cultivation, as the plant grows larger and the cultivation tool is adjusted away from the row to prevent crop injury [244]. Cultivation must be completed on schedule to control small weeds, and rainy periods often provide opportunity for weeds to grow too large for control by cultivation [244]. Early research with residual herbicides in cucumbers indicated that preplant applications provided 5-7 weeks of control [245]. A three-year experiment comparing herbicides with cultivation indicates cucumber yields were 24% higher in the herbicide treated plots [246]. In states such as Florida, where it is grown as a second crop in fumigated ground covered with plastic, a significant portion of cucumber acreage does not receive herbicide treatment [247]. Cost of Production Budgets for organic cucumber production in California include charges for 30 hours of hand weeding and 3 cultivations [84]. Approximately 60 % of U.S. cucumber acres are treated with herbicides [16]. Without herbicides, cucumber yield is projected to decline by 66% [5].

72
A.15 Dry Beans Prior to the use of herbicides, weeds were cultivated from between rows of dry beans, while hand weeders were usually employed to remove weeds growing directly in the bean row [4]. Due to increased scarcity and cost of labor for hand weeding, more than 40 chemicals were evaluated for the control of annual weeds in field bean fields in the 1950s [4]. The most effective chemical studied was EPTC, which provided excellent control of all annual weeds encountered over a three-year period without injuring the bean crop. Broadcast applications of EPTC reduced hand weeding requirements by 16.5 hours/acre, and resulted in 38% higher yields than the hand weeded check [4]. A 1978 survey of growers in the Midwest indicated that herbicides were used on 95% of dry bean acreage, while a 1992 survey indicated that 99% of the dry bean acres in Minnesota and North Dakota were treated with herbicides [3] [172]. It has been estimated that without herbicides, U.S. dry bean yields would decline by 25% [5]. A.16 Grapes Historically, weed control in California vineyards meant allowing weeds to grow during winter, disking the middles in spring, and plowing vine rows. Weeds in the middles were primarily managed mechanically. The plow used in the rows is referred to as the French plow; it has a trip arm that hydraulically moves the plow around the vine. The advent in the 1960s of pre-emergence residual herbicides, which could be applied down the row during fall or winter, provided clean rows without the need to plow close to the vines [56]. Weeds in the middle of the rows could be managed chemically or with mechanical cultivators. Growers moved away from the French plow, to the use of herbicides for several reasons: (1) Less labor was required (even with the plow, hand hoeing one time around the vines was usually essential) [56]; (2) Mechanical injury to the vine was eliminated (grapevines were sometimes accidentally torn out by the French plow); and (3) herbicides provided longer lasting weed control and were more effective on annual weeds [57]. Research showed that residual herbicides would provide more than 10 months of control of germinating weed seeds [58]. A comparison of grape yields showed a 5% increase when herbicides replaced the French plow [59]. A recent study estimated that California grape growers could go without herbicides, with no reduction in yield, by substituting one mechanical weeding in the row supplemented with 11 hours of hand weeding per acre [53]. A similar point is made in a Cost of Production Budget for organic grapes, prepared by the University of California, which includes the cost of one cultivation of weeds under the vines and 8 hours per acre for hand weeding under the vines [60]. The Report states that hand weeding requirements in organic vineyards can vary from 6-12 hours per acre [60]. Organic vineyards with high densities of perennial weeds require greater control measures [386]. In New York, grape growers began routine use of residual herbicides for weed control in the 1960s due to research trials demonstrating efficacy and the high labor input
73
previously used [61]. Research demonstrated that the labor involved in chemical weed control was approximately one-third of mechanical and hand hoeing in the row under the trellis [64]. A recent five-year study of the feasibility of organic grape production in New York indicated the need for 8 cultivation operations and 13 hours of hand weeding to replace herbicides [62]. Even with these activities, the yields of the organic grapes were 5 to 35% lower than the conventional vineyards [62]. The lack of effective weed control in the organic vineyards is the primary reason for the lower yields [63]. A recent study estimated that without herbicides, New York grape growers would cultivate and hand weed as replacements and yield would be 12% lower [53]. In 1964, approximately 25% of U.S. grape acreage was treated with herbicides [376]. USDA pesticide-use surveys conducted in the 1990s indicate that approximately two-thirds of California’s grape acreage is treated with herbicides, while approximately 90% of Eastern grape acreage is treated [14]. It is estimated that grape yields would not decline in California without herbicides; while in other states, the decline would be 12-35% [5]. Because of California’s domination of U.S. grape production, without herbicides, national grape production would decline by 1%. A.17 Green Beans Prior to the introduction of herbicides, weed control with hand weeding and cultivation represented one of the most expensive items in green bean production [291]. Weeds reduced the efficiency of mechanical bean pickers, causing yield losses during harvest [148]. In an attempt to reduce weed control costs, research began in the early 1950s with pre-emergence herbicides. In New York during the 1950s, 13 demonstrations resulted in extra yield of 375 pounds per acre in the herbicide treated plots [291]. Recently, a three-year comparative product performance experiment was conducted in New York, which compared herbicide treatments to hand weeded and cultivated plots [292]. Uncontrolled weeds reduced green bean yields by 50%, while 2 cultivations alone resulted in a 33% yield reduction, in comparison to herbicide treatments. The combination of two cultivations and 12 hours of hand weeding per acre produced yields 20% lower than herbicide treatments. Fifty-four hours of hand weeding per acre resulted in green bean yields that were only 7% lower than the herbicide treatments [292]. Processing green beans are frequently grown on large acreages, and excessive rainfall often results in heavy weed pressure and delays timely cultivation [293]. Growers find that the risks associated with relying on cultivation alone are too great. Growers have estimated that yields can be reduced by up to 50% when heavy infestations occur and up to a total loss when weeds prevent mechanical harvesting. In the early 1990s, green bean growers did not have an effective broadleaf herbicide, due to the cancellation of dinoseb and the withdrawal of the registration for chloramben. Documented dollar losses in New York, due to increased green bean weed pressure in 1992, include the following: decreased harvester efficiency (loss of small beans, increased trucking costs for culls), $249,000; field abandonment due to weeds after planting, $141,000; and load rejection at processors due to nightshade berry contamination, $10,000 [294]. An organic green bean grower in Vermont reports the need for 17.5 hours of hand weeding per acre following 6 cultivations [299]. Approximately 96 % of U.S. processed green bean acreage is treated with herbicides
74
[16]. Nationally, without herbicides, it is estimated that green bean yield would decline by 20% [5]. A.18 Green Peas Weed control in processing peas is more important than in many other crops since weed competition not only reduces yields of shelled peas, but weeds also contaminate harvested peas with seeds or fragments that reduce the quality and market value of the peas [281]. Canada thistle buds and nightshade berries are similar in size and shape to peas and are difficult to remove from harvested peas. Growers can have pea loads docked or entire fields left unharvested due to Canada thistle contamination. Removing nightshade is particularly important because the berries are poisonous [282]. It is essential to keep pea fields relatively weed-free, ensuring high quality green peas [282]. Weeds reduce the yields and the quality of peas when moisture is limiting. Weed competition under these conditions causes the typically tender, high-quality peas to become hard. These small, hard peas are difficult to separate. Therefore, they reduce the grade of the processed product. In the 1950s, it was estimated that weeds lowered U.S. green pea production by 13%, which included a 3% loss due to lower quality [148]. Since growers plant green peas in narrow rows, it is difficult to use cultivators without severely injuring the peas [282]. Prior to the development of herbicides, growers frequently found it necessary to go through pea fields with a scythe and cut the thistle plants [283]. Early experiments with herbicides showed a reduction of 90% in Canada thistle development in treated pea fields [283]. Herbicide use in peas expanded rapidly due to excellent control of Canada thistle, nightshades and annual broadleaf and grassy weeds, which had been reducing yields by up to 64% in some fields [284]. Weeds are a major problem in organic pea production [285]. Research has shown that 12 hours of hand weeding is one option for organic pea growers [285]. Another option that has been researched is to increase row spacing of peas to 18-24 inches, so that cultivation becomes possible. However, pea yields are 26-31% lower with the increased row spacing [285]. Approximately 94% of U.S. processed green pea acreage is treated with herbicides [16]. Nationally, without herbicides, it is estimated that green pea yield would decline by 20% [5].

75
A.19 Hops Dried hop cones are used as flavor components in the brewing of beers and ales. Once established, the hop rootstock will produce indefinitely, although industry practice is to rotate plantings every 10 years [216]. Herbicides are used on 100% of the hop acreage in the U.S. Herbicides are important to the industry for desiccation of hop suckers and excess foliage, as well as for control of various annual and perennial grasses and broadleaf weeds [216]. Tillage has been the primary means of weed control in hop yards. In rill- irrigated hop yards, cultivation occurs four to six times during the season to keep weeds under control. Substantial acreage has been converted to drip irrigation during the past decade, due largely to water quality-related regulatory pressures. This has resulted in growers moving away from the standard 7’x7’ hill spacing (which allowed for cross-cultivation) to 3.5’x14’ spacing (which required half as much drip tubing, but eliminates the ability to cross-cultivate). In the spring, desiccants are utilized to remove early growth prior to training. After training, herbicides are used at the base of the hop plants to remove weeds, as well as to burn back basal sucker growth and lower leaves of the hop plant. The lower leaves need to be removed from hop vines in order to improve airflow through the hop yard, and to control diseases such as powdery mildew and insect pests that spread from the lower growth up into the top growth. Prior to the development of chemical herbicides/desiccants, the lower leaves were removed by hand. Hand stripping was not always effective, since stripping wounds served as points of ent ry for diseases and often weakened the vines so that they cracked or broke off in midseason [217]. Approximately 20-50 hours of hand labor was required to manually defoliate the lower parts of the hop plants [238]. Research with herbicides indicated that they could be used to provide effective weed control at the base of the hop plants, as well as provide effective hop sucker control [239]. Prior to 1997, powdery mildew had not been observed in the Pacific Northwest. Since 1997, the disease has become established in the hop-growing region in the Northwest. Highly susceptible varieties experience 100% yield loss without control. Mildew infested hops are not marketable [216]. Control of hop powdery mildew relies on application of desiccant herbicides combined with application of protectant fungicides. The basal growth of suckers results in thick mats of vegetation that are not penetrated by fungicides, and create ideal environmental conditions for development of powdery mildew. The only effective way for managing this source of inoculum is to remove the tissue. Research has shown that herbicide desiccants reduce the incidence of powdery mildew by 25% [248].

76
A.20 Hot Peppers New Mexico is the leading producer of chile peppers in the U.S. Chile peppers are direct seeded in March, germinate in three to four weeks and are thinned by hand. Chiles grow slowly at the beginning of the season, giving rapidly growing weeds a competitive advantage. Uncontrolled weeds have been documented to reduce chile yields by up to 76% [362]. Chiles are harvested by hand, and workers will not enter weed- infested fields because weeds decrease their picking speed, and therefore their wage, since they are paid for the amount they pick, not for their time [363]. Mechanical cultivation can effectively control weeds only between the rows. Weeds in the rows can significantly reduce chile yields. Research has shown that chile yields are reduced 33% when only cultivation is used for weed control [364]. A combination of trifluralin and s-metolachlor is widely used to control a broad spectrum of weeds in chiles. A two-year research study demonstrated that chile yields could be equivalent between fields treated with trifluralin/s-metolachlor and fields that were hand weeded [365]. However, an extra 42-79 hours of hand weeding was required. Chile acreage peaked during 1992 in New Mexico and has then declined, due to increased competition and imports from Mexico, where labor costs are significantly lower (See Figure A12). Many growers cited problems obtaining labor as a reason for abandoning chile production in New Mexico [367]. A research program has been established to determine ways of reducing the amount of labor required in chile production, including the development of mechanical harvesters [366].

77
A.21 Lettuce Prior to the development of effective herbicides, severe weed infestations sometimes caused complete lettuce crop losses in California [71]. Up through the early 1960s, lettuce growers used hand weeding, with short-handled hoes, and cultivation for weed control. With increasing labor costs and the increasing scarcity of labor, more emphasis was put on chemical weed control through residual pre-emergence herbicides [73]. Research demonstrated that the use of pre-emergence herbicides could reduce hand weeding time by 55% [18]. A drawback of hand hoeing lettuce is that lettuce plants are sometimes removed along with weeds. The loss of one lettuce plant per six foot of row results in the loss of 181 cartons of lettuce per acre at harvest [75]. Lettuce is often grown in rotation with crops that have previously been fumigated for weed control. Organic lettuce growers in California typically cultivate three times and use 18 hours of hand weeding per acre [84]. Approximately 50% of California lettuce acreage is treated with herbicides [16]. Recent estimates show that without the use of herbicides, California lettuce growers would double their use of cultivation (two additional cultivations) and increase hand weeding by 38 hours per acre [53]. Even with this increase, lettuce yields are predicted to decline by 13% if herbicides are not used [53]. In Florida, lettuce is grown in mineral soils. Mineral soils have a unique soil texture that eliminates mechanical cultivation as a viable alternative, since this technique disrupts the necessary bed configuration on which the crop is growing. Very few herbicides have proved efficacious for controlling weeds in the mineral soils of the Florida Everglades region. Herbicides such as benefin, pronamide and bensulide, used by lettuce growers in other states, are not recommended for use in Florida mineral soils because they are inactivated by the high soil organic matter [76]. These herbicides degrade rapidly in the mineral soils because of the high soil microbial activity and high temperatures [77]. The herbicide CDEC (trade name Vegadex) proved to be effective for pre-emergence weed control in lettuce and was recommended for commercial plantings on organic soils in Florida [78]. In 1982, the manufacturer of CDEC ceased production of the herbicide. The existing stocks of the herbicide were used up by the middle 1980s. EPA canceled its registration in 1984. Beginning in 1985, Florida lettuce growers no longer had an herbicide available for weed control within the row of lettuce plants. Between 1985-1990, lettuce growers increased the use of hand labor for controlling weeds to approximately $200/A [79]. Because of the increased expense and difficulty of finding labor, several growers withdrew land from lettuce production [80]. Approximately 5,000 acres were withdrawn from lettuce production, reducing lettuce production annually by about 85 million pounds, valued at about $13 million (see Figure A13). Prior to the mid-1980s, pigweed was not present in economic populations in the Everglades region due to the use of CDEC. Hand hoeing alone cannot control pigweed completely. As a result, pigweed infestations steadily increased and expanded in the late 1980s and early 1990s, leading to an increase in the amount of hand labor to approximately $750/A in 1993 [80]. In the winter of 1992-1993, a crisis situation occurred because of abnormal weather conditions; high rainfall and temperatures prevented timely hand weeding, and pigweeds took over certain fields completely.

78
Approximately $900,000 in lost lettuce production occurred that year because of failure to control pigweed [80]. Further losses were prevented by the issuance of an emergency exemption for use of the herbicide imazethapyr to control emerged pigweeds in February 1993. Subsequently, imazethapyr (trade name Pursuit) received a full label for use in Florida lettuce fields. Research had demonstrated that imazethapyr would control broadleaf weeds (including pigweed) on the highly organic soils of the Everglades muck lettuce-growing region [77]. Since 1993, imazethapyr has substituted for the hand weeding at a cost of $20/A. An organic lettuce grower in Maine reports the need for six hours of hand weeding per acre following two cultivations [299]. Research in New Jersey indicated that lettuce yields were equivalent when 224-424 hours of hand weeding and two to three cultivations substituted for herbicides [83]. Approximately 95% of New Jersey’s lettuce acreage is treated with herbicides, and the likely yield loss without herbicides is projected at 50% [5]. A.22 Mint Approximately 11 million pounds of mint oil were produced in 2001 from 110,000 acres of mint grown in the U.S. This acreage is comprised of both peppermint and spearmint. About 90% of the mint oil produced annually is used in by the chewing gum and oral care industries. One of the major properties of mint oil used as a flavoring ingredient is its strength of taste and aroma. One pound (pint) of mint oil can flavor 40,000 sticks of chewing gum or between 1,000 and 1,500 tubes of toothpaste. Mint oil yield is considerably reduced when weeds compete with the mint plant for light, nutrients and soil moisture. Mint oil quality is also reduced when weeds impart off- flavors and odors to the mint oil during the distillation process [408]. Research has demonstrated that mint yields can be reduced by up to 80% from uncontrolled Canada thistle infestations while a pure stand of quackgrass can result in a complete loss of mint oil yield [408]. Combinations of annual broadleaf and grassy weeds can commonly cause mint oil yield reductions of 26-66% [408]. Infestations of horseweed, pigweed, western goldenrod, common lambsquarters and prickly lettuce (at 7 or more plants per square yard) can make mint oil unmarketable [408]. In the early 1950s fall or spring cultivation of plowing and harrowing mint fields was the most common type weed control practiced in mint [409]. Geese and/or sheep were also often brought into the fields once the plants were too large to cultivate. The animals usually preferred weeds to the mint plant. The animals were not entirely satisfactory for weeding since they ate only certain weeds and were troublesome to manage [410]. In the 1950s a fungal pathogen named verticillium wilt was widespread in U.S. mint fields and cultivation was reduced since the cultivation spread verticillium wilt. Hand weeding that typically required 4 weedings throughout the growing season then became more important in mint fields. Hand weeding crews often physically damaged the mint stands and in so doing reduced yields [408]. With the advent of new herbicides mint growers began using Sinbar (terbacil) for broad-spectrum selective weed control in the late 1960s. Research showed that using herbicides such as Sinbar in mint reduced hand weeding by 18-24 hours per acre [116]. Mint growers also significantly expanded acreage into fields that had been avoided previously due to problem weed infestations [116]. Research has estimated that the use of at least 48 hours per acre of

79
careful hand hoeing for weeds could result in mint oil yield and quality equivalent to herbicide treatment [127]. Today this amount of labor is both unavailable and unaffordable for mint growers. Without herbicides the yield of mint would be reduced by an average of 35% with a marketable value of 65% of mint oil uncontaminated by weeds [192]. A.23 Onions For several reasons, weed control in onions relies heavily on herbicides. The slow germination of the onion from the seed and the slow growth of small onions, allow weeds to get a head start on the crop. Onions do not compete well against weeds. Onions have narrow, upright leaves that do not shade the ground to inhibit competitors [81]. Pre-emergence herbicides give the onions a chance early in the season against much quicker growing and competitive weeds [81]. Research has shown that there is no marketable yield of onions if weeds are not controlled [82]. Initial research with herbicides demonstrated that hand weeding labor, with short-handled hoes, was reduced by 120 hours per acre [82]. The pre-emergence herbicides controlled weeds for seven to ten weeks [82]. Because of the widespread use of hand weeding, which was very effective, onion yields did not dramatically increase following the introduction of herbicides for weed control (see Figure A14). Recent research in New Jersey has shown that carefully hand weeded onion plots produced yield equal to the herbicide plots when 1067 hours of labor were used [83]. In California, cost of production budgets for organic onion production includes the following weed control practices: six cultivations, one flaming and 73 hours for hand weeding [84]. Each of the non-chemical practices has the potential of lowering onion yields by damaging to the crop [81] [85]. A recent study estimated that without the use of herbicides, California farmers would not be able to keep up with the increased weed population, despite cultivating two more times and hand weeding seven more times (64 hours/acre) [53]. In addition, hand weeding often disturbs the bulbs and disrupts or even curtails plant growth. Thus, increased hand weeding would have direct negative effects on onion yield [53]. Approximately 88% of U.S. onion acreage is treated with herbicides [16]. Onion yields in California are projected to decline by 35% without herbicides [53]. In Texas, onion yields are projected to decline by 25% without herbicides, despite one more cultivation and 32 more hours of hand weeding [53]. Nationally, onion yields have been projected to decline by 43% without herbicides [5].

80
A.24 Peaches Until the 1960s, bare ground culture, maintained by cross-disking until midsummer, was the predominant weed control system in Southeast peach orchards. In the 1960s, growers began to realize that herbicides could be used to reduce the need for disking. By utilizing herbicides, the need to maintain wide row spacing of trees to accommodate cross cultivation was reduced, and growers were able to plant a higher density of trees per acre. It was also determined that cultivation is detrimental to tree growth due to root pruning, and it contributed to soil erosion in peach orchards located on slopes. As a way of reducing the incidence of peach tree short life (PTSL), many growers adopted the use of herbicides in peach orchards. Research demonstrated that a 19% peach tree mortality rate occurred in four years of disc weed control, while the chemical weed control system resulted in no loss [218]. Pythium root rot was much more prevalent in orchards where roots had been damaged by disking. Research demonstrated that the total number of peach tree roots in the top 20 cm of soil surface was 435 higher in the herbicide treated plots, in comparison to the mechanically cultivated plots [219]. After two years, peach tree diameters were 27% greater in plots treated with herbicides, in comparison to trees in cultivated plots [235]. Peach yield in the herbicide plots was 167% higher than in the cultivation plots [235]. Although the cultivated plots were tilled seven times during the season, there was rapid regeneration of weeds after each tillage operation to the extent that weeds were mostly present [235]. In addition, the residual herbicides provided season- long control of most broadleaf and grass weed species [211]. The most common weed control system in Southeastern peach orchards is to use herbicides in a strip down the tree row and to maintain a weed sod between the rows. Control of winter annual weeds is recommended in the Southeast as a means of reducing plant bug damage to peaches. In 1964, it was estimated that 10% of U.S. peach acreage was treated with herbicides [376]. Recent (1990s) USDA surveys indicate that approximately 75% of U.S. peach acres are treated with herbicides [14]. While 50% of California’s peach acres are treated, close to 95% of Georgia’s peach acres are treated with herbicides [14]. A recent estimate of the impact of eliminating herbicide use in peach orchards in Georgia/South Carolina shows that peach yields would decline by 20% without herbicides [53]. This estimate assumed that growers would substitute five hours of hand weeding labor for herbicides. In California, it was estimated that peach yields would decline by 1% without herbicides, as growers substituted seven hours of hand weeding [53]. Nationally, it is estimated that peach yields would decline by 11% without herbicides [5].

81
A.25 Peanuts Before the 1960s, weeds in peanut fields were usually controlled mechanically and with hand weeding. Cultivation began soon after the plants emerged, and any weeds that escaped were removed with hoes. However, as the farm labor supply dwindled, mechanical weed control became less feasible, especially when wet weather delayed cultivation and stimulated the germination of weed seeds [86]. Peanuts can only be cultivated early in the growing season because of a sprawling growth habit [87]. Two cultivations are estimated to provide 60% control of the weed species infesting peanut fields [96]. Cultivation directly lowers peanut yield, as a result of soil being thrown on the peanut plant, covering lower nodes, thus inhibiting peanut growth [88]. In addition to the inhibition of normal flower and peg development, movement of soil around the fruiting branches of peanuts creates cond itions favorable for stem rot diseases. Southern stem rot or “white mold” losses are particularly aggravated by vine damage resulting from cultivation or movement of soil around the crown of the plant [88]. In the 1940s and 1950s, peanut yields were frequently drastically reduced by stem rots [89]. The difficulties in proper mechanical cultivation of peanuts contributed to research into use of herbicides [90]. Research demonstrated that herbicide use increased peanut yield by 47% in comparison with two cultivations, and by 18% in comparison to two cultivations plus hand hoeing [91]. Labor savings of 14 hours per acre were recorded in Georgia [89]. Figure A15 charts herbicide use on U.S. peanut acreage over time. The use of herbicides is cited as a primary factor in the doubling of peanut yields [92] (see Figure A16). Herbicides contributed to increased peanut yields directly, through better control of weeds and, indirectly, through disease prevention [90]. A Georgia peanut grower reported that without herbicides, his peanut yields would decline 50-67%, even with five additional cultivations and an additional five hoeings [354]. A research program in North Carolina for peanuts determined weed control to be the most difficult area to reduce pesticide use [93]. The primary alternative is identified as tillage, which is limited to early in the season and can increase soil-borne diseases [93]. Recent research with organic methods of pest control in peanuts determined that the largest increase in production cost in the organic system was for weed control, which included two cultivations and hand weeding costs of $296-991/A (50-165 hours) [94]. Organic peanut growers report their biggest problem is controlling weeds [298]. Approximately 97% of U.S. peanut acreage is treated with herbicides. A recent economic analysis of pesticide use estimated that without herbicides, U.S. peanut yields would decline by 29%, even with an additional two cultivations and 10 hours of hand weeding per acre [95]. Nationally, it is estimated that peanut yields would decline by 52% without herbicides [5].
82
A.26 Potatoes Prior to the introduction of chemical weed killers, U.S. potato growers relied primarily on the use of frequent cultivation for removing weeds. Potato acreage was typically cultivated four to eight times for weed control [107]. Six summer tillage operations were the most common practice [108]. Numerous studies have reported on the negative effects of cultivation on potato yields. Cultivation injures potato roots. One study demonstrated reduced potato yields of 3-21% for consecutive years due to root pruning [109]. Cultivator traffic through potato fields tends to compact the soil. Potato is not a deep-rooting plant and root penetration is impeded when soil is compacted. In a three-year study, soils that were cultivated once had an average weight of 95 pounds per cubic foot, whereas those cultivated five to seven times weighed 98 pounds. One hundred thirty thousand extra pounds of soil were packed into the surface foot of each acre [107]. Between five to seven cultivations reduced the soil air space by 15%. Cultivation has been shown to cause reduced soil moisture and an increased incidence of disease, which lower potato yields [110] [111]. Cultivation also has limited effectiveness in controlling weeds in potato fields because weeds growing in the row of potatoes are missed, and weeds that germinate after potato row closure cannot be controlled by cultivation [112]. Research has shown that growers who followed normal cultivation practices lost 12-20% of total yield production with only two cultivations [112]. Weeds that emerged after the last cultivation interfered with mechanical harvests. Losses of more than 20% were observed in the 1950s [148]. Early research with herbic ides in potatoes demonstrated that post-plant tillage could be reduced to one to two trips when residual herbicides were applied early in the season [113]. The herbicide made cultivation unnecessary for four to five weeks [107]. When weeds were controlled with an effective herbicide, there was no yield advantage to three cultivations rather than one cultivation [114]. Research has shown that the use of a residual herbicide along with one tillage operation produced potato yields 29% greater than with three cultivations [115]. Prior to the introduction of herbicides, a sizeable proportion of Long Island’s potatoes were rendered unmarketable because of nut sedge shoots growing through them. Grade losses of up to 25% were observed in the 1950s [148]. Increased use of herbicides is credited with reducing tillage in potato fields with the average acre cultivated twice [152] and is credited as a factor in increased potato yields due to more effective, less damaging weed management [66]. An experiment with organic potato production in Wisconsin resulted in a yield reduction of 36% [303]. An Oregon organic potato grower reported that organic yields are generally 25% below neighboring conventional potato fields [308]. Approximately 93 % of U.S. potato acreage is treated with herbicides. Figure A17 charts herbicide use on U.S. potato acreage over time. A recent study has estimated that without herbicides, U.S. potato growers would make five to six additional tillage trips and use eight to twelve hours of hand weeding labor per acre [53]. Potato yields were estimated to be reduced 25-30%, despite the additional tillage and hand weeding. Nationally, it is estimated that potato yields would decline by 32% without herbicides [5].

83
A. 27 Raspberries Prior to the introduction of herbicides, raspberry growers used cultivation and hand weeding to remove weeds. The typical grower from the 1920s to 1950s made nine cultivation trips for weed control purposes [23]. Forty-three hours per acre were required for cultivating and hand weeding [24]. Research with residual herbicides in the late 1950s demonstrated that control of essentially 100% of troublesome weed species could be achieved with a single application [25]. Currently, raspberry growers do not have to cultivate or hand weed since herbicides are used [26]. The adoption of chemical sprays for weed control is credited in causing the greatest reduction in production costs for raspberries [27]. In 1964, it was estimated that 25% of U.S. raspberry acreage was treated with herbicides [376]. USDA surveys of growers in the Northwest indicated that 89-92% of the raspberry acreage was typically treated with herbicides throughout the 1990s [14]. Organic raspberry growers typically utilize cultivation and hand weeding for weed control purposes [28]. A.28 Rice In the U.S., rice is direct-seeded. However, the vast majority of the world’s rice area, principally in Asia, is still transplanted. Most rice historians believe that the ancient practice of transplanting was adopted primarily to control weeds [130]. Three to five-week-old transplant seedlings have a head start on newly germinating weeds, as well as the advantage of tolerating a continuous flood that further suppresses weed growth. In the U.S., transplanting rice is labor-intensive and too expensive a practice to be practical. In California, rice was initially dry-seeded, but the rapid buildup of barnyardgrass rendered much of the land useless for rice production after three years [131]. A system of water-seeding rice in continuously flooded fields began in the 1920s as a method to control severe barnyardgrass infestations. The water-seeding method is credited with saving the California rice industry. Water-seeding of rice in Southern states followed its development in California. One of the main reasons for adoption was to control grassy weeds [132]. The change to water-seeded rice encouraged the development of other weed problems, including broadleaf aquatic species and, in California, the Eurasian variety of barnyardgrass known as “water grass.” The larger seeds of the Asian grasses enable them to germinate and emerge through deep water. Although hand weeding is the main method of weed control in Asian rice fields, where rice is grown in rows, hand weeding is not used in the U.S. Cultivation of rice after crop emergence is impossible in dry broadcast and water-seeded rice [133]. The first herbicides used in U.S. rice production were 2,4-D, 2,4-5T, and MCPA, which provided control of broadleaf weeds and sedges. The herbicides propanil and molinate were introduced in the 1960s, providing effective control of grassy weeds in rice. Research demonstrated that rice yields increased by 60% in plots treated with propanil [134]. In California, research demonstrated a 160% increase in rice yields when molinate was applied for water grass control [135]. Beginning in the 1960s until the early 1970s,

84
the use of propanil and molinate for the control of weed grasses in rice steadily increased. During this period, per acre rice yields in the U.S. increased by 35% (See Figure A18). Better weed control with the herbicides is credited as an important factor in the increased yield [133]. In the 1970s, new high-yielding, short-statured (semi-dwarf) rice cultivars were introduced. These varieties were practical for U.S. growers only because of effective weed control with herbicides [133]. The semi-dwarf varieties are less able to survive in deep water and flood levels have been reduced [136]. Semi-dwarf varieties are more erect in growth and provide less shading, which stimulates weed growth [133] [137]. Planting of the semi-dwarf varieties led to another 35% increase in U.S. rice yields [137]. Organic rice growers report that weed management is the most difficult part of organic production, and it is the major reason that organic rice yields are 50% lower than conventional yields [138]. The University of California has prepared cost of production budgets for organic and conventional rice, which indicate a 38% reduction in rice yield in the organic system [139] [140]. One prominent California organic rice grower leaves the fields in fallow for a year and cultivates three times to reduce the weed population [387]. Approximately 98% of U.S. rice acres are treated with herbicides. Figure A19 charts herbicide use on U.S. rice acreage over time. A recent report estimated that without herbicide usage, U.S. rice yields would decline by 53% [95]. A.29 Sorghum Livestock and poultry feeding account for about 98% of total U.S. sorghum use. Sorghum accounts for 6 to 8 percent of all concentrates fed to livestock and poultry. For beef cattle, sorghum’s share rises to 18 to 22 percent, primarily because a large fed beef industry has developed in the sorghum belt. Sorghum production is centered in the Central and Southern Plains. Sorghum is popular in this area because it resists drought better than crops such as wheat or corn (sorghum requires less water). Sorghum is unique, in that it can remain dormant during stress periods and renew growth when conditions are more favorable. Sorghum yields increased dramatically beginning in the 1960s. In the 1960s, the introduction of residual pre-emergence herbicides (atrazine and propazine) contributed to the yield increase; other factors included new hybrids, fertilization, and irrigation [65] [66]. Sorghum seedlings are small and weak, grow slowly, and do not compete with weeds. Prior to the use of herbicides, weeds were removed from sorghum fields with mechanical cultivation. Common practice was to cultivate out several flushes of weeds prior to planting sorghum, and to follow up with several cultivations during the growing season [67]. Cultivation resulted in lower sorghum yields for several reasons. The mechanical operations ahead of planting loosened the top few inches of soil, so that moisture was lost from the soil surface. Repeated tillage destroyed wheat stubble residue, leaving the soil surface bare and subject to crusting and erosion [68]. Weeds that emerged during the season prior to cultivation consumed moisture, and cultivation could not be used to remove weeds in the sorghum rows [69].
85
Research demonstrated that pre-emergence applications of propazine and atrazine resulted in yields 34% higher than sorghum that was cultivated three times [70]. By controlling weeds prior to planting, the herbicides allowed sorghum to be planted earlier, with no need to wait for weed flushes. As a result, growers could plant longer season (higher yielding) hybrids [66]. USDA surveys indicate that herbicide use on U.S. sorghum acreage increased from 14% of the acres treated in 1959 to 59% of the acres treated in 1982 [168]-[170] [173]. The latest USDA surveys of sorghum indicated that 78% of the acres were treated in 1991, while 91% were treated in 1998 [117]. Recent estimates of the impact of not using herbicides in sorghum show that yields would decline by 20–30 % in the central and Southern Plains states [5]. A.30 Soybeans Soybeans were grown primarily as forage crops in the U.S. through the 1930s. Prior to World War II, the U.S. imported 40% of its edible fats and oils. At the advent of the War, this supply was cut, and processors turned to domestically produced soybean oil [141]. World demand for cooking oil, salad oil and red meat increased substantially immediately after World War II. These demands stimulated the rapid expansion of soybean production in the U.S. [142]. In the 1950s, soybean meal became available as a low-cost, high-protein feed ingredient, triggering explosive growth in U.S. livestock and poultry production. In the 1940s and 1950s, tillage was the primary method used to control weeds in U.S. soybeans. The use of several cultivations prior to planting soybeans was regularly recommended. Various implements were used after planting to perform shallow tillage, which uproots very young annual weeds between the soybean rows. Research demonstrated that rotary hoeing provided 70-80% weed control three to five days after soybean emergence, with two repeat treatments at five-day intervals [143]. However, untimely rotary hoeing applied while weed seedlings were bigger (in the one to three leaf stage) decreased weed control effectiveness to 50% [143]. Timely weed removal treatments with the rotary hoe were sometimes difficult to apply due to wet conditions, i.e., mud balls up excessively on the rotary hoe. Prolonged rainy periods often delayed the use of the rotary hoe in farmers’ fields, beyond the time when hoeing is effective. If rotary hoeing is delayed, the weeds develop extensive root systems, preventing their removal with the implement [144]. The best weed removal system for soybeans in the 1950s was determined to be two timely rotary hoeings, along with two shovel cultivations [145]. Even with timely usage of cultivation, soybean yields were reduced because the tillage operations did not effectively control the weeds growing in the row alongside the soybeans. An 11-year experiment (1952-1962) in Iowa estimated soybean yield reductions resulting from weed infestations that were able to survive good cultural and mechanical weed control methods [146]. Average soybean yield reduction was 10%, despite the best mechanical weed control practices that confined weeds to a four to six inch band centered on the soybean row. In the 1950s and 1960s, soybean growers generally cultivated two to three times [144] [147]. USDA estimated that the average annual national loss in the potential production of soybeans, due to weeds, was 17% for the period between 1951 and 1960. The USDA loss estimate includes a yield loss of 14%

86
and a loss of 3 percent in quality, due to weed seed dockage, damage in cleaning to remove weed seeds, split beans due to presence of weed seeds and off- flavors [148]. U.S. soybean growers began to use herbicides for weed control in the late 1950s. By 1982, more than 90% of the national acreage was treated (see Figure A20). Research demonstrated that combinations of herbicides could provide more than 90% control of all major weeds that infest soybeans [149][150]. By the early 1990s, there were at least 70 registrations for individual herbicides or packaged herbicide mixtures for weed management in soybeans. As a result, most weeds in soybeans could be adequately controlled with herbicides [151]. In 1992, U.S. soybean losses due to weeds were estimated at 7% [5]. Increased use of herbicides led to significant reductions in the number of cultivations of U.S. soybean acreage. In 1994, only 43% of U.S. soybean acreage received any cultivation that averaged one time during the season [152]. Between 1965 and 1985, average U.S. soybean yields increased by 40% (see Figure A21). A statistical analysis of the increase in soybean yield from 1965 to 1979 concluded that weed control provided by the use of herbicides accounted for 62% of the yield increase [153]. An organic soybean grower in South Dakota reports that yields can be 15% lower [298]. This grower has 350 acres of organic soybeans and reports that after three tillage operations, soybean rows are walked by children every morning with machetes and knives to cut emerged weeds [298]. Another South Dakota organic soybean farmer reported that organic yields were 30-40% lower than conventional yields even with three to four times the tillage [43]. An organic soybean grower highlighted the problem of being unable to cultivate and rotary hoe following a wet spring. The organic grower had to spend $140/A for hand weeding crews in comparison to $25/A, which was typical in dry years [40]. A University of Illinois guide for producing organic food-grade soybeans indicated a need for six tillage trips for weed control [304]. A Michigan State University Production Budget for organic soybeans includes a charge for five hours of labor for weeding [310]. An Illinois organic soybean grower with 500 acres in three fields reported that one field was hand weeded by children, but due to a lack of time, the other two fields were not weeded [318]. Approximately 96 % of U.S. soybean acreage is treated with herbicides [117]. Nationally, it is estimated that soybean yields would decline by 26% without herbicides [5].
87
A.31 Spinach Prior to the introduction of herbicides, weeds were controlled to some extent in spinach with hand hoeing and cultivation. Hand weeding caused severe yield losses due to incidental removal of crop plants with the weeds. Yield losses of one-third were observed in the 1950s [148]. Many weeds remained in the spinach row after cultivating and hoeing [287]. Since processing spinach is mechanically harvested with mowers, any weeds present are cut along with the spinach and sent to the processor. Prior to the introduction of herbicides, weeds in spinach became one of the most common complaints that food processors received from customers [286]. It was common practice that fields, or parts of fields, were not harvested because of the presence of weeds in spinach [288]. Heavy weed infestations reduced spinach yields by 50%. In the 1950s, it was estimated that the value of U.S. spinach was lowered by 13% due to weed contamination [148]. Research with herbicides in spinach showed that the weight of weeds per acre could be reduced significantly, by up to 900 pounds per acre [289]. Spinach yields increased following the introduction of herbicides because the spacing between rows was reduced since cultivation was no longer necessary [290]. Research in New Jersey has shown that 209 hours of hand weeding per acre is required to produce spinach yields equivalent to herbicide-treated acreage [83]. Approximately 90% of U.S. processed spinach receives annual herbicide treatments [16]. In 1989, New Jersey growers had exhausted supplies of the herbicide chlorpropham, which had been cancelled for use on spinach. Without an effective alternative for post-emergence control of chickweed, many fields were disked instead of harvested [257]. Spinach production in the state was reduced by 17% (see Figure A22).

88
A.32 Strawberries Strawberry plants are shallow-rooted and compete poorly against weeds for sunlight, nutrients and moisture. Only occasional mechanical cultivation is practical dur ing the growing season, due to frequent irrigations and large quantities of fruit hanging on the row [261]. In the 1950s and early 1960s, hand weeding was the only option for strawberry growers to use and, as a result, weed control was one of the most expensive operations in strawberry operations. Hand weeding costs of $200-$400 per acre were common in California [261]. In Florida, hand weeding was necessary two to four times during the season, with a total requirement of 16 to 40 hours of labor [262]. Two strawberry production systems developed in the late 1960s. In California and Florida, strawberries are grown as annuals. Before planting, strawberry fields are fumigated with methyl bromide and then covered with plastic. Methyl bromide kills nematodes, insects, disease pathogens and germinating weed seeds. Herbicides are used in conjunction with fumigation: (1) to control weeds with hard seed coats that are not controlled by fumigation; (2) to control weeds that germinate and emerge after the effects of fumigation have dissipated - these weeds can appear from the holes in the plastic around the strawberry plant; and (3) to control weeds in the furrows between the strawberry beds. Hand weeding could be used instead of herbicides in the fumigated fields; however, additional costs of $800 to $2,000 per acre would be incurred if herbicides were not available [263]. Research has shown that equivalent strawberry yields can be obtained with the use of 142 hours of hand weeding per acre instead of fumigation and the use of herbicides [266]. In California, strawberry yields from organic fields are reported to range from 25 to 60% of the conventional yields [264]. Organic growers confirm these lower yields and report that the labor costs for hand weeding are one of the most significant costs for organic production [265]. In other strawberry producing states such as Oregon, Pennsylvania, Michigan and North Carolina, strawberries are grown as a perennial crop, often producing for three to four years. Immediately after planting, residual herbicides are applied as pre-emergent weed control [267]. Additional residual and systemic herbicides are used to reduce emerging weeds throughout the growing season. Winters in several of these states (such as Oregon) are mild-rainy and relatively warm. Such conditions allow weeds to grow throughout the winter. Hand weeding and tillage cannot be performed in a timely fashion during the rainy winter, and growers use residual herbicides to prevent the winter weed growth. Yield losses are estimated at 60 % without control [268]. Early research with residual herbicides in the perennial system demonstrated that hand weeding could be reduced 75 to 85% [269]. A recent USDA study estimated that without the use of herbicides, many of the states with perennial strawberry plantings would experience significant acreage reductions, due to the high cost of hand weeding as a replacement [270]. Overall, USDA estimated that U.S. strawberry production would decline by 30% without the use of herbicides [270].

89
A.33 Sugarbeets Hand weeding of sugarbeet fields was standard practice from the 1700s, when German scientists first discovered that the sugarbeet contained commercial quantities of sugar, until the 1950s, when selective herbicides were introduced [185]. Typically, two hoeing operations were made in-season, totaling 11 hours per acre [186]. Workers used long-handled hoes in these operations. In addition, approximately 20 hours of labor per acre were required to thin and weed sugarbeet stands early in the season [186]. The workers would go down the row, usually on their knees, with a short-handled hoe [186]. The introduction of chemical herbicides, which prevented the emergence of weeds in the row of sugarbeet plants, made it possible to reduce the hours of labor used in the weeding/thinning operation, as well as in the subsequent hand weeding operations. Research demonstrated that applications of cycloate and phenmedipham provided effective control of broadleaf and grassy weeds, reducing the need fo r labor by 90% [189]. Mechanical thinning and herbicide use were rapidly adopted on U.S. sugarbeet acreage, due to the impact on reducing the need for labor. Prior to the development of herbicides, sugarbeet growers often faced years in which the labor for control of weeds was in short supply and difficult to obtain [190]. The development of herbicides was seen as an absolute necessity if the sugarbeet industry was to survive, due to the high labor requirements for sugarbeets in comparison to other crops and the declining availability of labor [191]. Approximately 98% of U.S. sugarbeet acreage is treated with herbicides annually [117]. Figure A23 charts herbicide use in the U.S. on sugarbeets, over time. Nationally, it is estimated that sugarbeet yields would decline by 29% without herbicides [5].

90
A.34 Sugarcane Prior to 1940, a great deal of labor was available in the sugarcane area of Louisiana. Johnsongrass and all other weeds were held in check by continuous hoeing and digging [99]. Approximately 40 to 70 hours of hand labor were required to weed an acre of sugarcane [102]. Impacts of the war years resulted in a shortage of labor for hand weeding with a resultant buildup of johnsongrass infestations. In 1949, at least one-third of the sugarcane acreage of Louisiana was so thoroughly infested that the yield of cane was materially reduced, and one-sixth of the acreage was so badly infested with johnsongrass that sugarcane production was marginal [100]. Reported sugarcane yield losses to johnsongrass were 23-50% [103]. It was thought that some fields were so infested, the only recourse was to replace sugarcane with pasture [101]. More than 200 chemicals were initially evaluated for weed control in sugarcane [104]. As herbicide programs were put into practice to control johnsongrass, it was found that nearly all the other grasses and broad leaf weeds were also being eliminated [101]. Herbicides replaced hand hoeing, and also led to a reduction in the number of in-season cultivations; from seven to eight times to four to five [105][106]. Herbicide use is one of the factors that led to a significant increase in Louisiana sugarcane yields in the 1950s to 1960s (see Figure A24). Herbicide use led to increased yields as a result of more effective weed control, which also facilitated higher sugarcane plant populations and increased efficiency of fertilizers [100]. Nationally, it is estimated that sugarcane yields would decline by 25% without herbicides [5]. A.35 Sunflowers Small acreages of sunflower have been grown in the U.S. since 1900. However, the great expansion of acreage in North Dakota, South Dakota and Minnesota did not take place until the early 1970s. Research in the early 1970s in North Dakota indicated that in a weedy plot, sunflower yields were 53% lower than in a weed-free plot [254]. Since sunflowers normally do not emerge for 10 days to two weeks after planting, shallow tillage with a spike tooth or coil spring harrow can be used about one week after planting to kill many weeds [255]. Because sunflower seedlings are strongly rooted, these implements and others, such as the rotary hoe, also can be used to kill weeds after the sunflowers emerge. One to two pre-plant tillage trips can be followed by three to five harrowings and one to three cultivations during the growing season [256]. Cultivation destroys weeds between sunflower rows, but the weeds remaining in the row reduce yields. Research demonstrated sunflower yield reductions of 12-20% with cultivation (avg. 16%) [254] [259]. NDSU Extension Service has estimated that organic sunflower yields are 25% lower than conventional yields [260]. Approximately 95% of U.S. sunflower acreage is treated with herbicides [117].

91
A.36 Sweet Corn Sweet corn is a poor competitor with weeds, due to a limited root system and poor late season canopy closure [237]. Sweet corn doesn’t grow as rapidly or as tall as field corn. Sweet corn lacks a dense plant canopy and allows considerable light to enter for weed development. This late-season weed growth limits the effectiveness of mechanical cultivation in sweet corn. Late germinating weeds reduce sweet corn yields directly and also make mechanical sweet corn harvesting nearly impossible. In years of limited rainfall, weeds that remain in the row sometimes reduced sweet corn yields by as much as 50% in the 1950s [148]. Weeds are regarded as one of the most difficult problems in organic sweet corn [240]. At least three cultivations are required in organic sweet corn in New York [241]. The cost of the cultivation treatments is at least twice the cost of herbicide-treated sweet corn [242]. Some organic growers find it necessary to supplement cultivation with hand weeding crews late in the season [240]. In these cases, the cost of weed control is five times greater in the organic system, in comparison with the herbicide treated sweet corn [240]. Cost of Production Budgets for organic sweet corn includes a charge for three cultivation trips [84]. An organic sweet corn grower reports that two hours of child labor per acre is used for pulling big weeds following five cultivation trips [299]. Wisconsin is a major producer of sweet corn. Wisconsin sweet corn acreage and volume of production have declined about 45% since 1990 (see Figure A25). One of the major reasons for this decline is the state’s groundwater protection regulations, which either prohibit or limit the use of the herbicide atrazine, depending on the location [243]. This prohibition makes weed control more expensive and sometimes impossible to attain. In addit ion, availability of sweet corn raw product becomes less dependable for processors. Thus, many food-processing companies have closed or moved sweet corn acreage to other states, where atrazine can still be used at effective rates [243]. A recent report estimated that without herbicides, sweet corn growers would increase cultivation by two to three trips [53]. Cultivation is viewed as less effective, with a risk of crop failure in a very rainy year [53]. Approximately 90% of U.S. sweet corn acreage is treated with herbicides. Figure A26 charts herbicide use on U.S. sweet corn over time. It has been estimated that without herbicide use, U.S. sweet corn production would decline by 25% [5].

92
A.37 Sweet Potatoes The two leading sweet potato production states are North Carolina and Louisiana. Approximately 70% of the sweet potato acreage in these states is treated with herbicides [12]. Because of the vining nature of sweet potatoes, cultivation for weed control can be used only during the first four weeks after transplanting, to avoid undue mechanical injury to the crop [6]. In the past, cultivation was supplemented with hand weeding late in the season [7]. However, due to the increased cost and scarcity of labor, sweet potato acreage declined in Alabama and Louisiana in the 1960s and 1970s, due to the tremendous amount of labor required for weed removal [8] [9]. Studies of labor requirements, for various tasks in growing sweet potatoes, showed that it took about 24 hours per acre to hoe the weeds [11]. Research demonstrated that recommended herbicides for sweet potatoes could reduce hoeing time by more than 30 hours per acre [10]. Without the use of herbicides, it has been estimated that sweet potato production would decline by 20% in the U.S. [5]. A.38 Tomatoes In the early 1960s, California processed tomato growers relied on cultivation and hand hoeing for weed control. The typical processed tomato acre was cultivated three to six times, while nine to 16 hours were required for hand hoeing weeds [174] [175]. Despite these control measures, California processed tomato production was reduced by 10% in 1964; weed competition, reduction in stand, reduction in yield, and increased harvest cost and tomatoes left in the field because the harvesters could not find them in the dense weed growth caused the reduced yield [176] [177]. The development of mechanical harvesting, and the practice of seeding to a stand resulted in a necessity of improving weed control and reducing hand hoeing. Weeds had to be controlled for the mechanical harvesters to work efficiently [178]. Unless acceptable weed control was possible with a herbicide, it would not be economical to use precision seeding, since the hand weeding crews would reduce the tomato stand along with the weed removal process [179]. Direct seeding produced higher yields due to higher plant populations per acre [66]. UC farm advisors conducted 12 herbicide evaluation trials in 1968-1970, in cooperation with growers throughout California. More than 40 different herbicide treatments were evaluated [179]. Commercially acceptable weed control was obtained with diphenamid, trifluralin, pebulate, and napropamide [178]. In 1970, 87% of California’s processed tomato acreage was treated with herbicides [180]. The extensive use of herbicides, in combination with mechanical harvesting, resulted in the complete mechanization of growing processed tomatoes in California by the early 1970s [180]. A recent University of California analysis of organic processing tomato production in the Sacramento Valley indicated that the average acre is cultivated six times, and 15 hours were spent per acre for hand weeding [181]. An eight-year comparison of organic and conventional processing tomato production in California indicated that tomato yields were 17% lower in the organic system [194]. Weed abundance was found to be associated consistently over the years with the reduced crop yields in the organic system. Hand weeding was also largely responsible for the overall increased production cost of the organic system [194].

93
A recent study from USDA estimated that without herbicides, California’s processed tomato production would decline by 20%, with the primary substitutes being increased cultivation and hand weeding [182]. A recent study by Texas A& M University estimated that without herbicides, California’s processed tomato production would decline by 25%, despite increased hand weeding (+37 hours/acre) and increased cultivation (+eight trips/acre) [53]. Prior to the development of herbicides, tomato growers in eastern and midwestern states relied on hand weeding and cultivation for weed control [183]. Even with these methods, subsequent high-weed populations forced tomato growers in Florida to abandon cultivated fields after five or six years, and move to new land [184]. As labor for hand weeding became more expensive and less readily available, research focused on herbicides as possible replacements [183]. In Florida, three cultivations reduced weed populations by approximately 68% (from 2.5 million weeds/acre to .8 million weeds per acre) while early research with herbicides provided 79% control (to .5 million weeds per acre) [184]. In the early 1970s, the standard practice in eastern and midwestern tomato fields was the use of trifluralin pre-plant, followed by two cultivations and hand weeding [183]. In a 1978 experiment in Ohio with typical weed populations, the combination of two cultivations and 167 hours of hand weeding per hectare produced equivalent yields to an application of trifluralin, fo llowed by two applications of metribuzin [183]. In New Jersey experiments in 1983/84, two cultivations plus 182-259 hours of hand weeding per acre produced tomato yields equivalent to herbicide treatments that included trifluralin and metribuzin [83]. An organic tomato grower in New Hampshire reports on the need for 11 hours of labor per acre for four cultivation trips and for the laying of black plastic down the row of tomato plants to smother weeds [299]. The black plastic cost is $200 per acre. If eastern and midwestern fresh market tomato growers stopped the use of herbicides, the primary replacements would be hand weeding and cultivation, with an expected yield loss of 56% [182]. Approximately 96% of U.S. tomato acreage is treated with herbicides [16]. Nationally, it is estimated that tomato yields would decline by 23% without herbicides [5] [182].
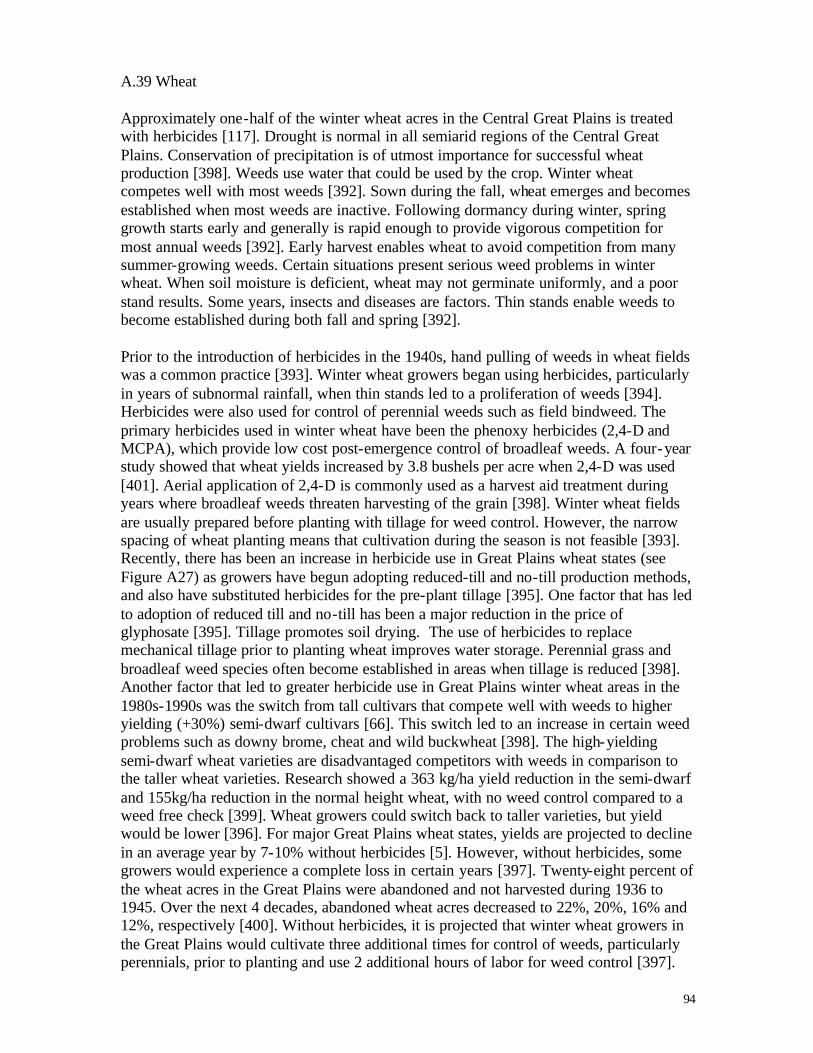
94
A.39 Wheat Approximately one-half of the winter wheat acres in the Central Great Plains is treated with herbicides [117]. Drought is normal in all semiarid regions of the Central Great Plains. Conservation of precipitation is of utmost importance for successful wheat production [398]. Weeds use water that could be used by the crop. Winter wheat competes well with most weeds [392]. Sown during the fall, wheat emerges and becomes established when most weeds are inactive. Following dormancy during winter, spring growth starts early and generally is rapid enough to provide vigorous competition for most annual weeds [392]. Early harvest enables wheat to avoid competition from many summer-growing weeds. Certain situations present serious weed problems in winter wheat. When soil moisture is deficient, wheat may not germinate uniformly, and a poor stand results. Some years, insects and diseases are factors. Thin stands enable weeds to become established during both fall and spring [392]. Prior to the introduction of herbicides in the 1940s, hand pulling of weeds in wheat fields was a common practice [393]. Winter wheat growers began using herbicides, particularly in years of subnormal rainfall, when thin stands led to a proliferation of weeds [394]. Herbicides were also used for control of perennial weeds such as field bindweed. The primary herbicides used in winter wheat have been the phenoxy herbicides (2,4-D and MCPA), which provide low cost post-emergence control of broadleaf weeds. A four-year study showed that wheat yields increased by 3.8 bushels per acre when 2,4-D was used [401]. Aerial application of 2,4-D is commonly used as a harvest aid treatment during years where broadleaf weeds threaten harvesting of the grain [398]. Winter wheat fields are usually prepared before planting with tillage for weed control. However, the narrow spacing of wheat planting means that cultivation during the season is not feasible [393]. Recently, there has been an increase in herbicide use in Great Plains wheat states (see Figure A27) as growers have begun adopting reduced-till and no-till production methods, and also have substituted herbicides for the pre-plant tillage [395]. One factor that has led to adoption of reduced till and no-till has been a major reduction in the price of glyphosate [395]. Tillage promotes soil drying. The use of herbicides to replace mechanical tillage prior to planting wheat improves water storage. Perennial grass and broadleaf weed species often become established in areas when tillage is reduced [398]. Another factor that led to greater herbicide use in Great Plains winter wheat areas in the 1980s-1990s was the switch from tall cultivars that compete well with weeds to higher yielding (+30%) semi-dwarf cultivars [66]. This switch led to an increase in certain weed problems such as downy brome, cheat and wild buckwheat [398]. The high-yielding semi-dwarf wheat varieties are disadvantaged competitors with weeds in comparison to the taller wheat varieties. Research showed a 363 kg/ha yield reduction in the semi-dwarf and 155kg/ha reduction in the normal height wheat, with no weed control compared to a weed free check [399]. Wheat growers could switch back to taller varieties, but yield would be lower [396]. For major Great Plains wheat states, yields are projected to decline in an average year by 7-10% without herbicides [5]. However, without herbicides, some growers would experience a complete loss in certain years [397]. Twenty-eight percent of the wheat acres in the Great Plains were abandoned and not harvested during 1936 to 1945. Over the next 4 decades, abandoned wheat acres decreased to 22%, 20%, 16% and 12%, respectively [400]. Without herbicides, it is projected that winter wheat growers in the Great Plains would cultivate three additional times for control of weeds, particularly perennials, prior to planting and use 2 additional hours of labor for weed control [397].

95
The states in the Midwest and Northeast produce winter wheat. Between 40-60% of the wheat acres in the Midwest and Northeast are treated with herbicides. A higher proportion of no-till wheat acres have been established in the Midwest and Northeast, in comparison to the Great Plains. Prior to planting wheat, herbicides are used to remove winter annual weeds, which germinate as soon as adequate rainfall occurs in August and September [398]. Since winter wheat grows rapidly and is a highly competitive crop, most Midwest/Northeast farmers do not routinely plan weed control programs in anticipation of serious infestations [398]. When abnormally heavy rains occur before harvest, wheat harvest may be delayed so long that weeds grow into the canopy of wheat heads. When wheat is weedy at harvest time, weeds are treated with 2,4-D, causing them to dry up and reduce harvesting problems [398]. A special weed problem in the Midwest/Northeast region is wild garlic and wild onion. If harvested and milled with wheat, they result in odors and off- flavors so that growers receive a lower price [398]. Herbicides are used to remove the wild garlic and onion plants prior to harvest. Prior to the development of herbicides, weeds in the Midwest increased combine losses by 13% because of poor grain separation from the straw [402]. Without herbicides, yield losses in Midwest and Northeast wheat are estimated at 10-50% [5]. Annually, more than 90% of the winter wheat acreage in the Pacific Northwest is treated with herbicides. Figure A28 charts herbicide use in Washington wheat since 1949. Since the early 1970s, herbicides have been applied consistently to more than 90% of the wheat acreage in Washington. The Pacific Northwest region is characterized by humid winters and dry summers. The wet, mild winters are favorable for winter wheat production. Yields are among the highest in the U.S. Figure A29 charts the increase in Washington’s wheat yields since 1947. The increased use of herbicides is partially credited for the increased wheat yields. Several dozen weed species thrive in conditions under which winter wheat is grown. Annual broadleaf weeds germinate just before or as the wheat germinates. Wheat fields frequently become a solid mat of well-established broadleaf weeds, if weed control practices are lacking [403]. If weeds are left uncontrolled, a large number of species could grow so large that harvesting would be impaired [398]. Russian thistle can significantly reduce wheat yields and harvest efficiency, and in some cases, completely prevent wheat harvest [404]. A major advance in weed control occurred in 1959 when diuron was introduced for selective weed control in winter wheat. Diuron adequately controlled Italian ryegrass and annual bluestem, as well as many species of broadleaf annuals [398]. Diclofop-methyl was instrumental in making significant inroads against wild oats. High potential yields and the severe competitiveness of weeds in the long mild season make herbicide use much more cost-effective than in other winter wheat growing regions. An organic wheat grower in Oregon reports that yields are 40-80% lower than conventional yields [309]. Without herbicides, wheat yields are projected to decline by 25-30% in the Northwest [5]. Spring wheat is planted in states (ND, SD, MT, MN) where winters are severe which would result in the freezing and death of wheat planted in the fall. Spring wheat varieties are planted from late-April to the end of May, and are harvested in the fall, from early August to late September. In these four states, the temperate summer climate is ideal for growing wheat. Herbicides are used on more than 90% of the wheat acres in the spring wheat states. Figure A28 charts herbicide use in North Dakota since 1949. A majority of the wheat acres have been treated with herbicides since the 1960s. Figure A29 shows average wheat yields in North Dakota since 1949. There is a corresponding increase in yield associated with the increase in herbicide use. Annual broadleaf weeds (kochia, wild

96
mustard), annual grassy weeds (foxtails, wild oats), and perennial broadleaves (Canada thistle, bindweed) infest wheat fields throughout the four Northern Plains states. Left unchecked, 10 wild oat or wild mustard plants per square foot will reduce wheat yield by 35%. Two or three kochia plants per square foot can reduce yields by 30%. Wild oat germinates quickly in the spring and can compete out wheat, resulting in severe wheat yield loss. Delayed seeding was recommended in the 1940s and 1950s to reduce wild oat infestation in spring wheat. By delaying seeding, wheat yields were reduced by 15% [405]. Delayed seeding was also relatively ineffective in controlling wild oats because the weed continues to emerge throughout the early summer, even if wheat is seeded very late in the first week of June after repeated spring tillage to stimulate wild oat germination [398]. Wild oat, wild mustard and Russian thistle are much less a problem now because of the use of herbicides [398]. Without herbicides, wild mustard would be likely to cause more than a 36% reduction in wheat yields in infested spring wheat acres [406]. An experiment in North Dakota indicated that without weed control, wheat yield was 67% lower than when treated with standard herbicides [407]. With 222 hours of hand weeding per acre, wheat yields were 25% lower than with herbicide treatments [407]. Organic wheat yields are estimated to be 25% lower than conventional yields in North Dakota [260]. It has been estimated that without herbicides, average wheat yields in the Northern Plains states would be reduced by 30% [95]. A.40 Wild Rice Wild rice is a cereal grain, which is native to Minnesota and has been successfully cultivated in the state since the 1960s. In the past, natural stands of this plant provided a staple in the diets of local Native American tribes. Because of the high capital investment associated with dike construction and irrigation equipment, and since land cultivated with wild rice is poorly suited for alternate crops, wild rice is commonly grown in the same field year after year [128]. This continuous monoculture has permitted the establishment of common water plantain at competitive levels in many fields. An average yield loss of 43%, with one plantain per square foot, was shown experimentally [126]. Hand weeding and cultivation are not possible because wild rice is grown in flooded paddies. The herbicide 2,4-D is the only herbicide that has been available to Minnesota wild rice growers and was available only because an emergency exemption was granted, specifically for the control of water plantain [126]. In its request to EPA for the emergency registration, the state of Minnesota estimated that without the herbicide, wild rice yields would decline by 50% on infested acreage [129]. It has been estimated that water plantain infests 10-50% of the acreage, and that 2,4-D is used on 10% of the acreage [126]. No alternative non-chemical weed control method would be used if 2,4-D were not available for Minnesota wild rice growers [393].

97
Figure A 1: Apple Herbicide Use
0
20
40
60
80
Michigan New York Pennsylvania1991 1999
Source: [14]
Figure A 2: Maine Wild Blueberry Production
0
20
40
60
80
1926 1946 1966 1986
Source: [382]
Million Lbs./Year
% Acres Treated

98
Figure A 3: U.S. Blueberry Consumption
0
0.2
0.4
0.6
0.8
1
1976 1981 1986 1991 1996
Source: [380]
Figure A 4: North Dakota Canola Production
0
0.5
1
1.5
2
1987 1997 1998 1999 2000 2001
Source: [1]
Billion Lbs./Year
Lbs./ Person/ Year

99
Figure A 5: California Carrot Yield
0
20
40
60
80
1925 1950 1975 2000
Source: [381]
Figure A 6: U.S. Corn Yields
0
20
40
60
80
1880 1910 1940 1970
Source: [355]
1,000 Lbs./ Acre
Bushels/Acre
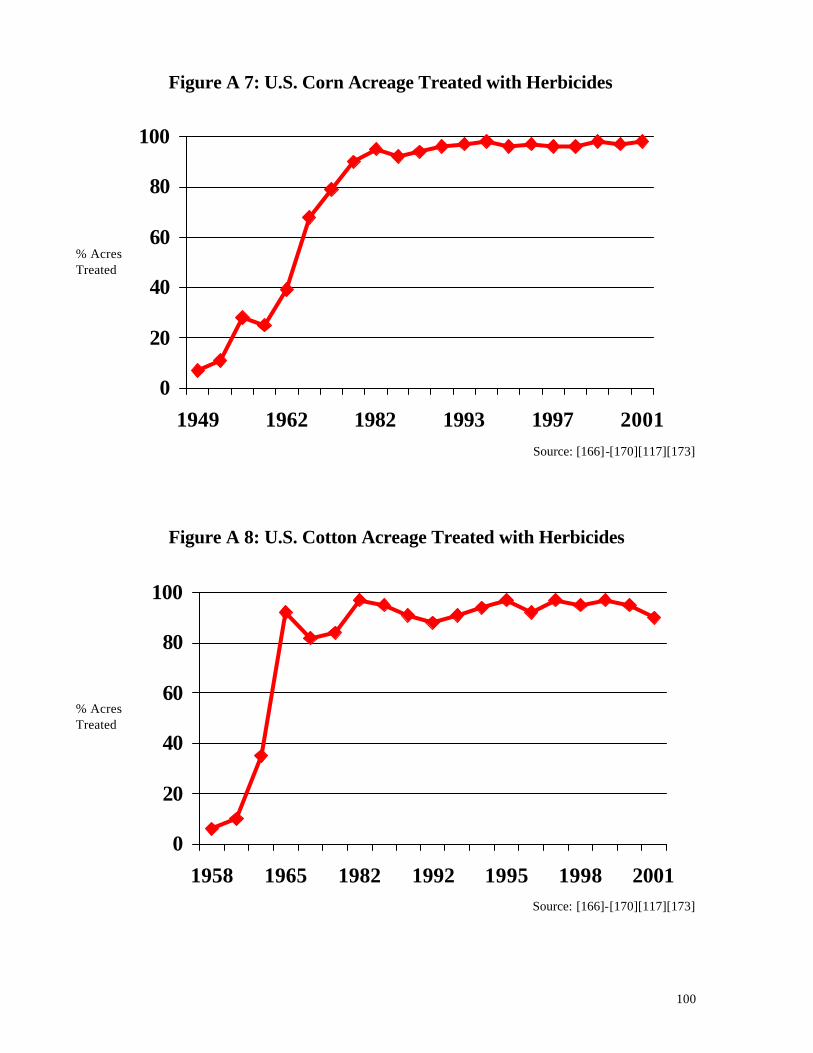
100
Figure A 7: U.S. Corn Acreage Treated with Herbicides
0
20
40
60
80
100
1949 1962 1982 1993 1997 2001
Source: [166]-[170][117][173]
Figure A 8: U.S. Cotton Acreage Treated with Herbicides
0
20
40
60
80
100
1958 1965 1982 1992 1995 1998 2001
Source: [166]-[170][117][173]
% Acres Treated
% Acres Treated
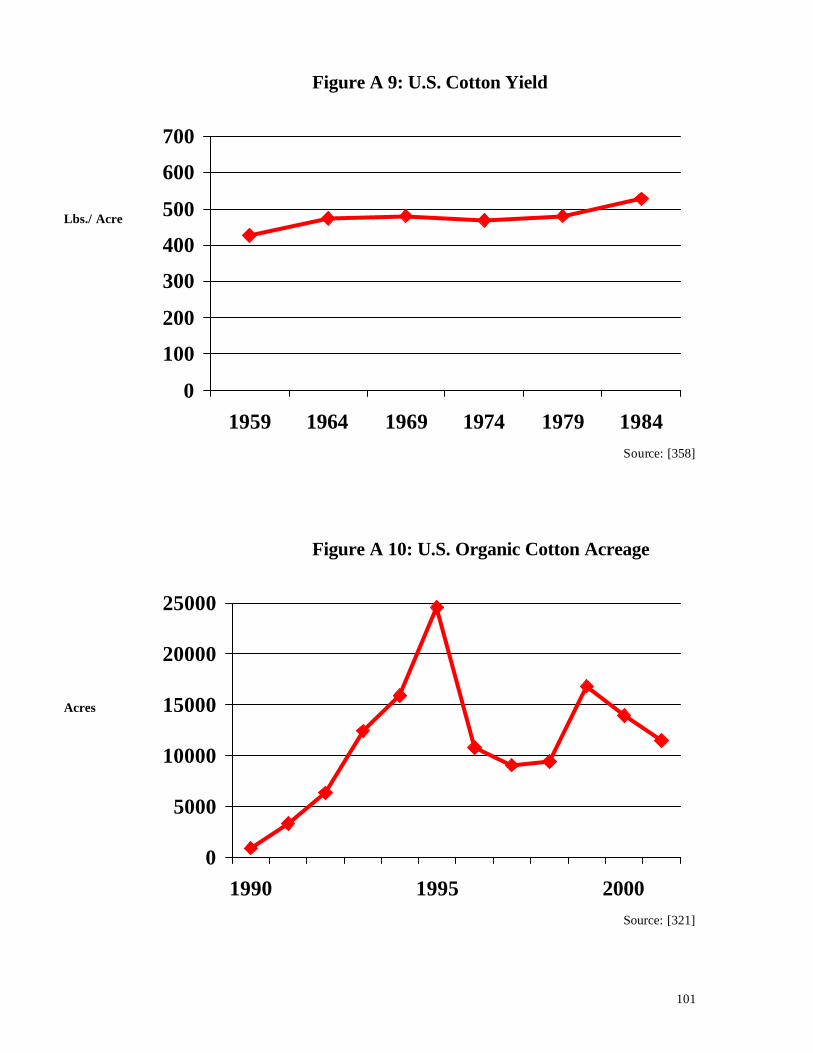
101
Figure A 9: U.S. Cotton Yield
0
100
200
300
400
500
600
700
1959 1964 1969 1974 1979 1984
Source: [358]
Figure A 10: U.S. Organic Cotton Acreage
0
5000
10000
15000
20000
25000
1990 1995 2000
Source: [321]
Lbs./ Acre
Acres

102
Figure A 11: U.S. Cranberry Production
0
200
400
600
1904 1924 1944 1964 1984 2001 Source: [38][13]
Figure A 12: New Mexico Hot Pepper Acreage
0
10000
20000
30000
40000
1974 1979 1984 1989 1994 1999 Source: [379]
Million Lbs./ Year
Acres

103
Figure A 13: Florida Lettuce Acreage
0
3
6
9
12
15
18
1979 1986 1993
Source: [359]
Figure A 14: California Onion Yields
0
20
40
60
80
1950 1970 1990
Source: [355][356]
Thousand Acres
Thousand Lbs./Acre

104
Figure A 15: U.S. Peanut Acreage Treated with Herbicides
0
20
40
60
80
100
1959 1976 1992 2001
Source: [166]-[170][117][173]
Figure A 16: U.S. Peanut Yields
0
1000
2000
3000
1944 1959 1974 1989 2001
Source: [355]
% Acres Treated
Lbs./Acre
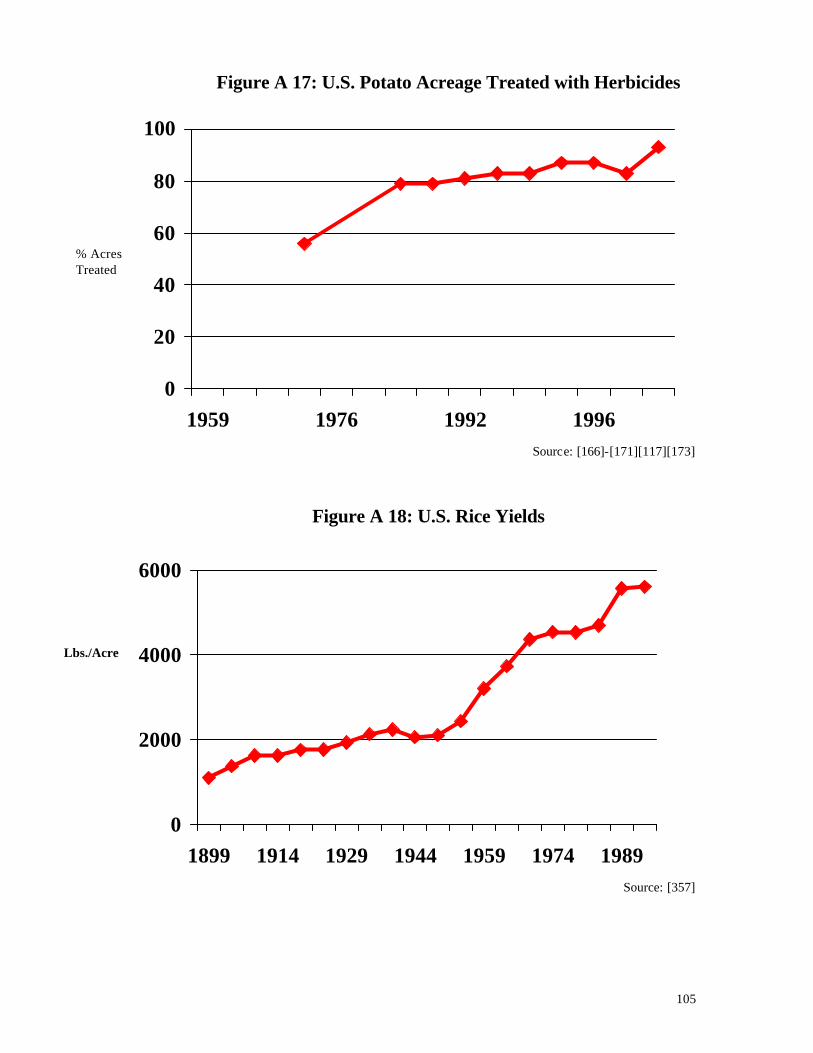
105
Figure A 17: U.S. Potato Acreage Treated with Herbicides
0
20
40
60
80
100
1959 1976 1992 1996
Source: [166]-[171][117][173]
Figure A 18: U.S. Rice Yields
0
2000
4000
6000
1899 1914 1929 1944 1959 1974 1989
Source: [357]
% Acres Treated
Lbs./Acre

106
Figure A 19: U.S. Rice Acreage Treated with Herbicides
0
20
40
60
80
100
1959 1976 1992 2001
Source: [166]-[170][117][173]
Figure A 20: U.S. Soybean Acreage Treated with Herbicides
0
20
40
60
80
100
1959 1971 1990 1993 1996 1999
Source: [166]-[170][117][173]
% Acres Treated
% Acres Treated

107
Figure A 21: U.S. Soybean Yields
0
10
20
30
40
1942 1952 1962 1972 1982 1992
Source: [355]
Figure A 22: New Jersey Spinach Production
10
12
14
16
18
1985 1988 1991
Source: [15]
Bushels/ Acre
Million Lbs./ Year

108
Figure A 23: U.S. Sugarbeet Acreage Treated with Herbicides
0
20
40
60
80
100
1959 1971 2000
Source: [166]-[170][117][173]
Figure A 24: Louisiana Sugarcane Yield
0
10
20
30
1938 1948 1958 1968 1978 1985
Source: [360]
% Acres Treated
Tons/ Acre

109
Figure A 25: Wisconsin Sweet Corn Production
0
400
800
1200
1991 2000
Source: [15]
Figure A 26: U.S. Sweet Corn Acreage Treated with Herbicides
0
20
40
60
80
100
1959 1976 1992 1996 2000
Source: [166]-[171][117][173]
% Acres Treated
Thousand Tons/Year
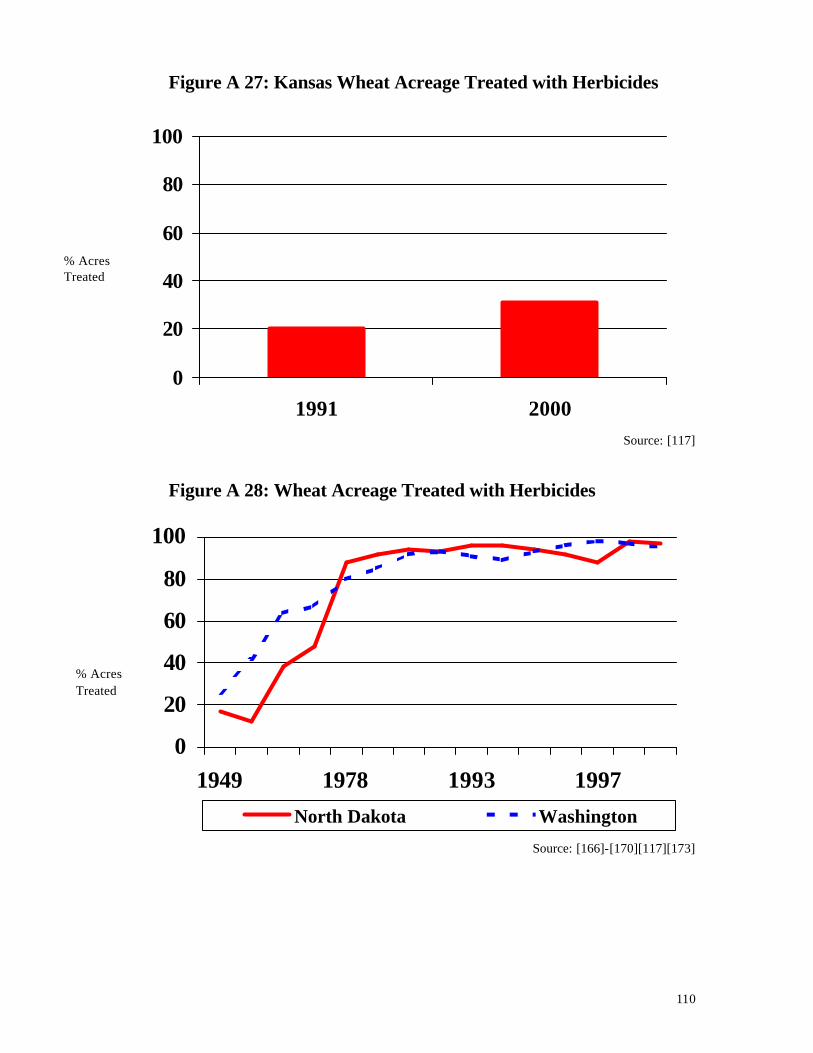
110
Figure A 27: Kansas Wheat Acreage Treated with Herbicides
0
20
40
60
80
100
1991 2000
Source: [117]
Figure A 28: Wheat Acreage Treated with Herbicides
0
20
40
60
80
100
1949 1978 1993 1997North Dakota Washington
Source: [166]-[170][117][173]
% Acres Treated
% Acres Treated

111
Figure A 29: Wheat Yields, Selected States
0
20
40
60
80
100
1947 1977 2001
Washington North Dakota
Source: [355][383][1]
Figure A 30: Indexes of Prices Paid by Farmers for Production Inputs
0
200
400
600
1935 1940 1950 1952
Farm Wage Rates Farm Machinery Motor & Farm Supplies
Source [295]
1935 = 100
Bushels/ Acre

112
Figure A 31: U.S. Hired Farm Worker Wage Rate
0.00
2.00
4.00
6.00
8.00
1910 1925 1940 1955 1970 1985 2000 Source: [378]
Figure A 32: U.S. Hired Farm Workers
0
1
2
3
4
1910 1925 1940 1955 1970 1985 2000 Source: [378]
$/Hour
Million Workers

113
Figure A 33: U.S. Biotech Herbicide Tolerant Crop Acreage
0
20
40
60
80
1994 1995 1996 1997 1998 1999 2000 2001 2002
Source: [280] [390][391]
Figure A 34: U.S. Organic Cropland Acreage
0
0.5
1
1.5
1992 1993 1994 1995 1997 2000 2001
Source: [305]
Million Acres
Million Acres
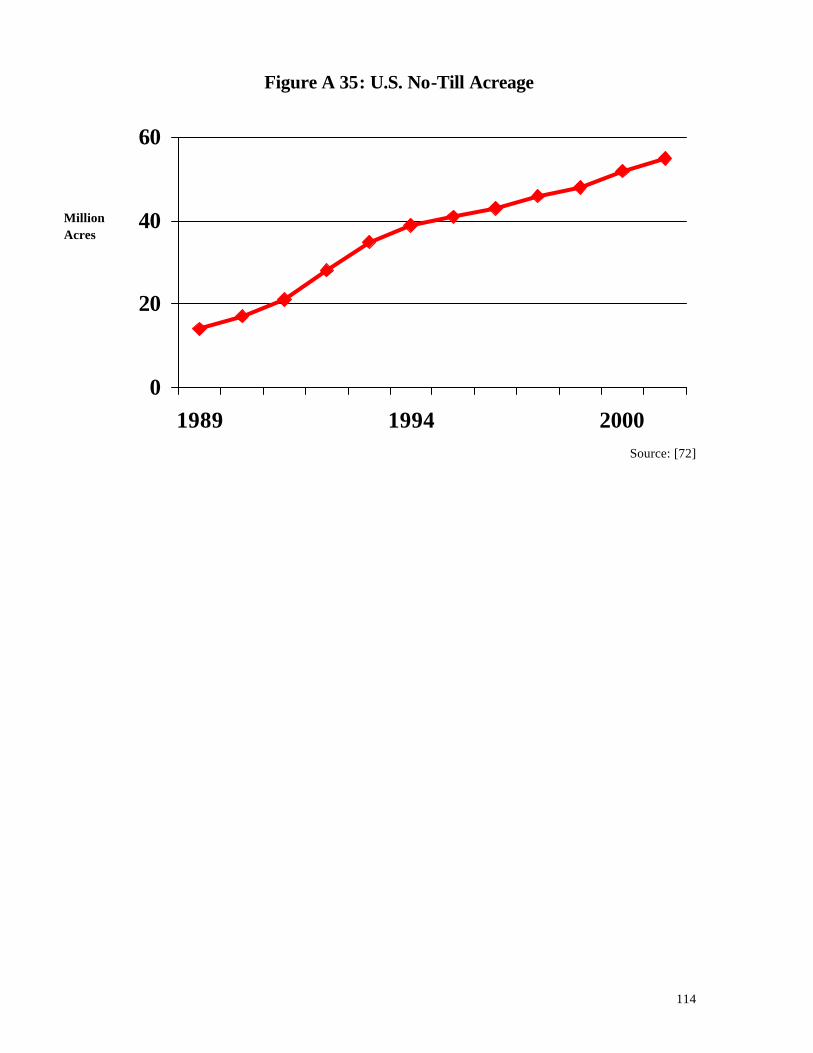
114
Figure A 35: U.S. No-Till Acreage
0
20
40
60
1989 1994 2000 Source: [72]
Million Acres

115
6.0 Reference List
1. USDA, Crop Production 2001 Summary, National Agricultural Statistics Service, January 2002.
2. USDA, Crop Values 2001 Summary, National Agricultural Statistics Service,
February 2002.
3. Lamey, H.A., et al, 1992 Dry Bean Grower Survey of Pest Problems and Pesticide Use in Minnesota and North Dakota, North Dakota State University, Extension Report No. 19, December 1994.
4. Comes, R. D., et al, Chemical Control of Annual Weeds in Pinto and Great
Northern Field Beans, Agricultural Experiment Station, University of Wyoming, Bulletin 393, July 1962.
5. Bridges, David C., Crop Losses Due to Weeds in the United States – 1992,
Weed Science Society of America, 1992.
6. Glaze, N. C., et al, “Enhancement of Herbicidal Weed Control in Sweet Potatoes with Cultivation”, Weed Science, May 1981.
7. Welker Jr., William V., “Effect of Herbicides on Quality and Yield of Sweet
Potatoes”, Weeds, April 1967.
8. Hammett, H. L. and Travis P. Hernandez, “Weed Control in Sweet Potatoes”, Louisiana Agriculture, Winter 1977-78.
9. Johnson, W. A. and Harry Amling, “Herbicides for Sweet Potatoes”,
Highlights of Agricultural Research, Alabama Agricultural Experiment Station, Spring 1962.
10. Hernandez, Travis P., et al, “Herbicides for Weed Control in Sweet Potatoes”
Louisiana Agriculture, Spring 1969.
11. Poole, Wiley D. and T. P. Hernandez, “A Progress Report on Weed Control in Mechanized Production of Sweet Potatoes”, Southern Weed Conference Fifth Proceedings, 1952.
12. Toth Jr., Stephen J., Sweet Potato Pesticide Use Survey in North Carolina,
North Carolina State University, December 12, 1997.
13. USDA, Non-Citrus Fruits and Nuts 2001 Summary, National Agricultural Statistics Service, July 2002.
14. USDA, Agricultural Chemical Usage 2001/1999/1997/1995/1993/1991 Fruit
Summary, National Agricultural Statistics Service, (Separate Volumes).
15. USDA, Vegetables 2001 Summary, National Agricultural Statistics Service, January 2002.

116
16. USDA, Agricultural Chemical Usage 2000/1998/1996/1994/1992 Vegetable
Summary, National Agricultural Statistics Service, (Separate Volumes).
17. Davis, R. Michael, et al, The Importance of Pesticides and Other Pest Management Practices in U.S. Carrot Production, USDA, National Agricultural Impact Assessment Program, University of California, Davis, Plant Pathology Document 99-007, 1999.
18. Agamalian, Harry S., “Evolution of Weed Control in Vegetables and its Many
Benefits,” Proceedings 44th Annual Meeting California Weed Science Society, 1992.
19. Watwood, Robert P., “Weed Control in Carrots and Celery,” Proceedings 11th
Annual Meeting California Weed Science Society, 1959.
20. Lange, A. H., “Weeds in California Vegetable Crops,” California Agriculture, June 1966.
21. Kempen, H., et al, “Weed Control in Carrots, Celery, and Parsley”, California
Agriculture, April 1968.
22. “Organics: Start Small and Find a Buyer”, Carrot Country, Winter 2000.
23. Locklin, H. D., “Raspberry Cultivation”, Proceedings of the Western Washington Horticultural Association’s 24th Annual Meeting, 1928.
24. Kuhlman, Gustav W. and D. Curtis Mumford, Cost of Producing Red
Raspberries for Processing in the Willamette Valley, Oregon, Oregon State College, Agricultural Experiment Station, Bulletin 472, December 1949.
25. Hatch, Duane L., “Weed Control of Small Fruits”, Proceedings 73rd Annual
Meeting of the Oregon State Horticultural Society, 1958.
26. Cross, Tim, et al., Red Raspberry Economics: The Costs of Establishing and Producing Red Raspberries in the Willamette Valley, Oregon State University, EM 8534, November 1995.
27. Waldo, George F., “The History of the Development of the Small Fruit
Industry in Oregon”, Proceedings 74th Annual Meeting of the Oregon State Horticultural Society, 1959.
28. Brenner, Loretta, “Delicious, Profitable, and Certified Organic Raspberries:
Washington Growers at Work”, Journal of Pesticide Reform, Vol. 13, No. 1, Spring 1993.
29. Aldrich, Richard J., “A Preliminary Evaluation of Weed Control in
Cranberries,” Proceedings Northeastern Weed Science Society, 1956.

117
30. Cross, Chester E., Weeds of the Massachusetts Cranberry Bogs, Agricultural Experiment Station, University of Massachusetts, Bulletin 463, April 1952.
31. Cross, C. E., “Chemical Weed Control in Massachusetts Cranberry Bogs,”
Proceedings Northeastern Weed Science Society, 1948.
32. Dana, M. N., “A Review of Cranberry Weed Control,” Cranberries, June 1975.
33. Devlin, Robert M. and I. E. Demoranville, “Influence of Devrinol on
Cranberry Vine Growth and Crop”, Proceedings Northeastern Weed Science Society, 1973.
34. Devlin, Robert M. and I. E. Demoranville, “Tolerance of Cranberry to
Alachlor and Two Fluorinated Pyridazinone Herbicides”, Hort Science, June 1971.
35. Dana, Malcom N., “The American Cranberry Industry,” Acta Horticulture, pp.
241, 287-294; 1989.
36. Peterson, Byron S., et al., The Cranberry Industry in Massachusetts, Commonwealth of Massachuesetts, Department of Agriculture, Bulletin No. 201, June 1968.
37. Devlin, Robert M. and Karl H. Dekbert, “Use of Glyphosate on Cranberry
Bogs and its Extraction from Cranberries,” Proceedings Northeastern Weed Science Society, 1980.
38. Eck, Paul, The American Cranberry, Rutgers University Press, 1990.
39. Mahr, Susan, et al., Biologic and Economic Assessment of Pesticide Usage on
Cranberry, USDA, National Agricultural Pesticide Impact Assessment Program, Report 2-CA-94, 1994.
40. Prairie Farmer, January 2000. 41. Yarrick, B. E., “Notes on Non-Tillage”, The California Citrograph, Vol. 31:
318,319, June 1946.
42. Jordan, Lowell S., et al., “Weed Control in Citrus from the Atlantic to the Pacific,” Weeds Today, Winter 1978.
43. Soybean Digest, September 1999.
44. Day, B. E., et al., “Citrus Weed Control by Monuron,” California Agriculture,
February 1957.
45. Beckett, T.H., et al., “Interference of Four Annual Weeds in Corn,” Weed Science, 1988.

118
46. Tucker, D. P. H. and R. L. Phillips, “Weed Control Demonstrations in Florida Citrus Groves”, Proceedings Southern Weed Science Society, Vol. 24, 1971.
47. Whitney, J. D. and R. L. Phillips, “A Comparison of Herbicide, Mechanical
Tree Hoe, and Flaming Treatments in a 2-Year Weed Control Experiment,” Proceedings Florida State Horticultural Society, Vol. 83, 1970.
48. “Herbicides Check Weeds in Largest Citrus Tract,” Citrus and Vegetable
Magazine, December 1975.
49. Nemec, Stan and David Tucker, “Effects of Herbicides on Endomycorrhizal Fungi in Florida Citrus Soils,” Weed Science, July 1983.
50. “Chemicals in Citriculture Options and Alternatives,” Citrograph, July 1988.
51. Mersie, Wondimagegnehu and Megh Singh, “Benefits and Problems of
Chemical Weed Control in Citrus,” Reviews of Weed Science Vol. 4:59-70, 1989.
52. Jordan, L. S. and B. E. Day, “Weed Control in Citrus,” The Citrus Industry,
Vol. 3, University of California, Division of Agricultural Sciences, 1973.
53. Knutson, Ronald D., et al., Economic Impacts of Reduced Pesticide Use on Fruits and Vegetables, American Farm Bureau Research Foundation, September 1993.
54. O’Connell, Neil, et al.,” Sample Costs to Establish an Orange Orchard and
Produce Oranges in the San Joaquin Valley, University of California Cooperative Extension Service, 1995.
55. Swisher, M. E., et al., A Profile of Florida’s Commercial Organic Citrus
Growers, Florida Cooperative Extension Service, EES-108, April 1994.
56. Flaherty, Donald L., et al., Grape Pest Management, University of California, Division of Agriculture and Natural Resources, 1992.
57. Fischer, B. B., et al., “Annual Weed Control in Vineyards and Deciduous
Orchards,” Proceedings 20th Annual California Weed Conference, 1968.
58. Lange, A., et al., “Weed Control in California Vineyards,” California Agriculture, October 1968.
59. Fischer, Bill B., “Weed Control in Vineyards,” Proceedings 26th Annual
California Weed Conference, 1974.
60. Klonsky, Karen, et al., Sample Costs to Produce Organic Wine Grapes in the North Coast, U.C. Cooperative Extension, 1992.
61. Curtis, O. F. and H. O. Bennett, “Simazine for Weeding Grape Cuttings,”
Proceedings Northeastern Weed Science Society, 1979.

119
62. White, Gerald B., “The Economics of Growing Grapes Organically,” Organic
Grape and Wine Production Symposium Special Report, Number 69, New York State Agricultural Experiment Station, 1995.
63. Pool, Robert, “The SARE Cornell Organic Grape Project,” Organic Grape and
Wine Production Symposium Special Report, Number 69, New York State Agricultural Experiment Station, 1995.
64. Shaulis, Nelson, et al., Chemical Control of Weeds in New York Vineyards,
Cornell Extension Bulletin 1026, New York State College of Agriculture, February 1961.
65. Bennett, W. F., et al., Modern Grain Sorghum Production, Iowa State
University Press, 1990.
66. Warren, G. F., “Spectacular Increases in Crop Yields in the United States in the Twentieth Century,” Weed Technology, Vol. 12:752-760, 1998.
67. Weed Control in Sorghum, Kansas Agricultural Experiment Station, Circular
360, May 1958.
68. Phillips, W. M., “Dryland Sorghum Production and Weed Control with Minimum Tillage,” Weed Science, October 1969.
69. Phillips, W. M., “A New Technique of Controlling Weeds in Sorghum in a
Wheat-Sorghum-Fallow Rotation in the Great Plains,” Weed Science, January 1964.
70. Burnside, O. C. and G. A. Wicks, “Cultivation and Herbicide Treatments of
Dryland Sorghum,” Weed Science, October 1964.
71. Fennimore, Steve A. and Stefan S. Richard, “The Evaluation of Carfentrazone in Salinas Valley Lettuce,” Proceedings California Weed Science Society, 1999.
72. http://www.ctic.purdue.edu.
73. Agamalian, H., et al., “Pre-emergence Herbicides for Weed Control in Lettuce,” California Agriculture, October 1967.
74. Yarborough, David, University of Maine, Personal Communication, January
2003.
75. Agamalian, Harry S., “Lettuce,” Principles of Weed Control in California, Second edition, Thomson Publications 1989.
76. Dusky, J. A., et al., “Evaluation of Herbicides for Weed Control in Florida
Lettuce Production,” Proceedings Florida State Horticultural Society, 1988.

120
77. Dusky, Joan A. and William M. Stall, “Weed Management Practices for
Lettuce Production Using Imazethapyr,” Proceedings Florida State Horticultural Society, 1995.
78. Guzman, V. L. and J. A. Dusky, “Effect of CDEC and Amount of Water
Carrier on Crisphead Lettuce Yield, Quality and Weed Control,” Proceedings Florida State Horticultural Society, 1980.
79. Smith, Scott A. and Timothy G. Taylor, Production Costs for Selected
Vegetables in Florida 1990-1991, University of Florida, Economic Information Report EI 91-2, June 1991.
80. “Emergency Exemption Request: Use of Pursuit Herbicide for Controlling
Amaranth (pigweed) in Florida Grown Lettuce and Escarole/Endive,” submitted by Florida Department of Agriculture and Consumer Services, February 23, 1993.
81. Bell, Carl E. and Brent E. Boutwell, “Combining Bensulide and
Pendimethalin Controls Weeds in Onions,” California Agriculture, January-February 2001.
82. Nylund, R. E., et al., “Comparative Costs of Weeding Onions by Hand or with
Monuron, CIPC, and CDAA,” Weeds, July 1958.
83. Majek, B. A., “Cost and Effectiveness of Hand Weeding and Cultivation Compared to Labeled and Experimental Herbicide Programs,” Proceedings Northeastern Weed Science Society, 1985.
84. Klonsky, Karen, et al., Cultural Practices and Sample Costs for Organic
Vegetable Production on the Central Coast of California, University of California, Giannini Foundation Information Series No. 94-2, March 1994.
85. Smith, Richard, “Potential Replacements for Dacthal in Onions,” Proceedings
California Weed Science Society, 2000.
86. Merkle, M. G., “Weed Control,” Peanut Production in Texas, Texas Agricultural Extension Service, January 1975.
87. Wilcut, John W., et al., “The Control and Interaction of Weeds in Peanut,”
Reviews of Weed Science, Vol. 6:177-205, 1994.
88. Swann, Charles W., Principles and Practices of Weed Control in Peanuts, University of Georgia, Cooperative Extension Service, Bulletin 833, June 1980.
89. Hauser, Ellis W., et al., “Herbicides and Herbicide Mixtures for Weed Control
in Peanuts,” Weeds, April 1962.

121
90. Buchanan, Gale A., et al., “Weeds and Their Control in Peanuts,” Peanut Science and Technology, American Peanut Research and Education Society, 1982.
91. Bridges, David C., et al., “Efficiency of Chemical and Mechanical Methods
for Controlling Weeds in Peanuts,” Weed Science, Vol. 32:584-591, 1984.
92. Grichar, W. James and A. Edwin Colburn, “Effect of Dinitroaniline Herbicides upon Yield and Grade of Five Runner Cultivars,” Peanut Science, Vol. 20:126-128, 1993.
93. The Peanut Project: Farmer-Focused Innovation for Sustainable Peanut
Production, The Rural Advancement Foundation International – USA.
94. Kvien, C. K, et al., “Peanut Production in Systems Restricting Use of Pesticides Based on Carcinogenicity or Leachability,” Peanut Science, July-December 1993.
95. Smith, Edward G., et al., Impacts of Chemical Use Reduction on Crop Yields
and Costs, Texas A&M University, Agricultural and Food Policy Center, 1990.
96. Bridges, David C., et al., An Analysis of the Use and Benefits of Pesticides in
U.S. Grown Peanuts: I Southeastern Production Region, Crop and Soil Science Department, University of Georgia, 1994.
97. Bridges, David C., et al, An Analysis of the Use and Benefits of Pesticides in
U.S. Grown Peanuts: II Southwestern Production Region, Crop and Soil Science Department, University of Georgia, 1994.
98. http://www.ers.usda.gov/Data/organic /.
99. Stamper, E. R. and S. J. P. Chilton, “Johnsongrass Control in Sugarcane,”
Weeds, October 1951.
100. Stamper, Ernest R., “New Developments in Weed and Grass Control in Sugarcane in Louisiana,” Proceedings American Society of Sugarcane Technologists, January 1959.
101. Domaanque, Dennis A., “Practical Aspects of Extension Chemical Weed
Control in Louisiana Sugarcane,” Proceedings American Society of Sugarcane Technologists, January 1955.
102. Smith, Dudley, Weed Control Practices in U.S. Sugarcane, Department of Soil
and Crop Sciences, Texas A&M University, December 1997.
103. Gibbens, R. T., “Control of Johnsongrass on Circlane Properties,” Proceedings American Society of Sugarcane Technologists, January 1955.

122
104. “Sugarcane,” Proceedings 10th Annual Meeting of the Southern Weed Conference, 1957.
105. Hebert, Leo P. and R. J. Matherne, “Effect of Date of Spring Dirting on
Yields of Sugarcane and Sugar in Louisiana,” Sugar Bulletin, January 15, 1963.
106. Matherne, Rouby J., “Preliminary Studies on Minimum Cultivation of
Sugarcane in Louisiana,” The Sugar Bulletin, 1968.
107. Aldrich, R. J., et al., Cultivation and Chemical Weed Control in Potatoes, New Jersey Agricultural Experiment Station, Circular 557, March 1954.
108. Maier, Melvin G. and Laurel D. Loftsgard, Potato Production Costs and
Practices in the Red River Valley, North Dakota Agricultural Experiment Station, Bulletin #451, 1964.
109. Nelson, D. C. and J. F. Giles, “Implication of Postemergence Tillage on Root
Injury and Yields of Potatoes,” American Potato Journal, 63:445, 1986.
110. Cadman, C. H., “Biology of Soil-Borne Viruses,” Amer. Rev. Phytopath, 1:143-171, 1963.
111. Pereira, H. C., “Studies in Soil Cultivation. IX. The Effect of Inter-Row
Tillage on the Yield of Potatoes,” Journal of Agricultural Science, 31:212-234, 1941.
112. Callihan, Robert H. and Robin R. Bellinder, “Management of Weeds,” Potato
Health Management, APS Press, 1993.
113. Aldrich, R. J. and J. C. Campbell, “Effect of Weeds, Cultivations and Pre-Emergence Herbicides on Potato and Corn Yields,” Proceedings Northeast Weed Control Conference, 1952.
114. Blake, G. R., et al., “Seedbed Preparation and Cultivation Studies on
Potatoes,” American Potato Journal, Vol. 39: 227-234, 1962.
115. Nelson, Donald C. and Joseph F. Giles, “Weed Management in Two Potato Cultivars Using Tillage and Pendimethalin,” Weed Science, Vol. 37:228-232, 1989.
116. Harris, James Otwell, The Agronomic, Environmental, and Economic
Implications of the Introduction of Terbacil for Weed Control in Oregon Commercial Peppermint Operations, Thesis submitted to Oregon State University, June 1976.
117. USDA, Agricultural Chemical Usage 1990-2001 Field Crops Summary
(Separate Volumes), National Agricultural Statistics Service.

123
118. USDA, Citrus Fruits 2000 Summary, National Agricultural Statistics Service, September 2000.
119. Gianessi, Leonard P. and Monica B. Marcelli, Pesticide Use in U.S. Crop
Production: 1997, National Center for Food and Agricultural Policy, November 2000, available at www.ncfap.org.
120. Gianessi, L. P. and M. B. Marcelli, Prices of Pesticide Active Ingredients
(1996), National Center for Food and Agricultural Policy, October 1996.
121. 2002 Cultural & Chemical Weed Control in Field Crops, University of Minnesota Extension Service, BU-03157-S.
122. Zollinger, R. K., et al., 2002 North Dakota Weed Control Guide, North
Dakota State University Extension Service, Circular-W-253, January 2002.
123. 2000 Weed Control Guidelines for Mississippi, Mississippi State University Extension Service.
124. Tredaway, J. A., Weeds in the Sunshine: Approximate Herbicide Pricing –
2001, University of Florida Cooperative Extension Service.
125. Donaldson, David, et al., Pesticides Industry Sales and Usage, 1998 and 1999 Market Estimates, EPA, Office of Pesticide Programs, August 2002.
126. USDA, Crop Profile for Wild Rice in Minnesota, available at
http://pestdata.ncsu.edu/cropprofiles/docs/mnwildrice.html, January 2000.
127. “Emergency Exemption Request: Use of Pyridate (Tough 5EC) to Control Redroot Pigweed in Mint,” Submitted by Office of Indiana State Chemist and Seed Commissioner, 1999.
128. Ranson, J. K. and E. A. Oelke, “Common Waterplantain Interference with
Wild Rice,” Weed Science, Vol. 30:10-14, 1982.
129. Fresvik, Michael, “Emergency Use Request for 2, 4-D for Use on Wild Rice”, Letter to Meredith Laws USEPA, Minnesota Department of Agriculture, February 10, 2000.
130. Hill, James E., “Weed Control in Rice: Where Have We Been? Where Are
We Going?,” Proceedings 50th Annual Meeting of the California Weed Science Society, 1998.
131. Dunshee, C.W. and J.W. Jones, Results of Rice Experiments at Cortena, 1923,
and Progress in Experiments in Water Grass Control at the Biggs Rice Field Station, 1922-23, University of California Agricultural Experiment Station Bulletin 375, 1924.
132. Adair, C.R. and K. Engler, “The Irrigation and Culture of Rice,” Water,
USDA Yearbook of Agriculture, 1955.

124
133. Smith, Roy J. et al., Weed Control in U.S. Rice Production, USDA,
Agriculture Handbook No. 497, March 1977.
134. Smith, Roy J., “Propanil and Mixtures with Propanil for Weed Control in Rice,” Weeds, July 1965.
135. Mueller, K.E. and E.A. Oelke, “Watergrass Control in Rice Fields with
Propanil and Ordram,” California Agriculture, July 1965.
136. Hill, James E., “New Herbicides and Improved Management Strategies for California Rice,” Proceedings 40th Annual Meeting of the California Weed Science Society, 1988.
137. Hill, James E. and David E. Bayer, “Integrated Systems for Rice Weed
Control,” Proceedings 42nd Annual Meeting of the California Weed Science Society, 1990.
138. “Long-Haul Organic,” Rice Journal, March 15, 2002.
139. Wick, Carl M. et al., Sample Costs to Produce Rice in Butte County-1992,
University of California Cooperative Extension Service.
140. Williams, John, et al., Sample Costs to Produce Organic Rice Water Seeded in the Sacramento Valley, University of California Cooperative Extension Service.
141. ASA, Soystats, 1999.
142. Smith, Keith J., and Wipada Huyser, “World Distribution and Significance of
Soybean,” Soybeans: Improvement, Production, and Uses, Second Edition, American Society of Agronomy, 1987.
143. Lovely, W.G., et al., “Effectiveness of the Rotary Hoe for Weed Control in
Soybeans,” Agronomy Journal, v.50, pp.621-625, 1958.
144. Peters, Elroy J., et al, “Rotary Hoeing in Combination with Herbicides and Other Cultivations for Weed Control in Soybeans,” Weeds, 7:449-458, 1959.
145. “Weeds – Still Your Worst Enemy,” Soybean Digest, April 1960.
146. Staniforth, D.W., et al., “Role of Herbicides in Soybean Production,” Weeds,
April 1963.
147. Weed Control Used By Illinois Farmers, 1964, Illinois Cooperative Crop Reporting Service, December 1964.
148. USDA, Losses in Agriculture, ARS, Agriculture Handbook No. 291, August
1965.

125
149. Webster, H.L., et al., “Trifluralin and Metribuzin for Broad Spectrum Weed Control in Soybeans,” Proceedings North Central Weed Control Conference, Volume 28, 1973.
150. McWhorter, C.G., and J.M. Anderson, “Bentazon Applied Postemergence for
Economical Control of Common Cocklebur in Soybeans,” Weed Science, July 1976.
151. Wilcut, John W., et al., “The Niche for Herbicide Resistant Crops in U.S.
Agriculture,” Herbicide Resistant Crops, CRC Press, 1996.
152. USDA, 1994 Pest Management on Major Field Crops, AREI Updates, Economic Research Service, Number 19, 1995.
153. Schroder, David, et al., The Contribution of Herbicides and Other
Technologies to Soybean Production in the Corn Belt Region, 1965-1979, University of Missouri, Ag Econ Paper, 1981-33, 1981.
154. Chandler, J.M. and F.T. Cooke, “Economics of Cotton Losses Caused by
Weeds,” in Weeds of Cotton: Characterization and Control, Cotton Foundation, 1992.
155. Langford, E.L. and H.B. Thibodeaux, Plantation Organization and Operation
in the Yazoo Mississippi Delta Area, U.S. Department of Agriculture, Technical Bulletin 682, 1939.
156. Abernathy, John R. and Chester G. McWhorter, “Evolution of Weed Control
in Cotton,” in Weeds of Cotton: Characterization and Control, Cotton Foundation, 1992.
157. Porter, W.K. Jr., et al., “A Critical Evaluation of the Use of Preemergence
Herbicides for Weed Control in Cotton,” Weeds, 5:237-242, 1957.
158. Mayo, S.C., “The Changing South: From Mules to Machines,” Proc. South Weed Conference, 18:12-27, 1965.
159. Whitwell, T., et al., “Report of the 1980 Cotton Weed Loss Commitee,” Proc.
Beltwide Cotton Production Research Conference, p. 175-184, 1981.
160. Holstun, J.T., et al., “Weed Control Practices, Labor Requirements and Costs in Cotton Production,” Weeds, January 1960.
161. Patterson, M.G. et al., “Herbicide, Cultivation Combination Proves Best for
Cotton Weed Control,” Highlights of Agricultural Research, Alabama Agricultural Experiment Station, Fall 1991.
162. Stephenson, K.Q., Mechanized Weed Control for Cotton Production in
Arkansas, Arkansas Agricultural Experiment Station, #87, 1959.

126
163. Searcy, V.S., “Chemical Weed Control in Cotton Cuts Hoe Labor 80-100%,” Highlights of Agricultural Research, Alabama Agricultural Experiment Station, Spring 1955.
164. Dowler, C.C. and E. Hauser, “The Effect of Cultivation on Weeds Controlled
by Fluometuron in Cotton,” Proc. South Weed Science Society, 27:112-115, 1974.
165. USDA, The Importance of Pesticides and Other Pest Management Practices in
U.S. Cotton Production, National Agricultural Pesticide Impact Assessment Program, June 1993.
166. Brodell, Albert P., et al., Extent and Cost of Spraying and Dusting on Farms-
1952, USDA Agricultural Research Service, Statistical Bulletin No. 156, April 1955.
167. Strickler, Paul E. and William C. Hinson, Extent of Spraying and Dusting on
Farms, 1958 – With Comparisons, USDA Economic Research Service, Statistical Bulletin No. 314, May 1962.
168. USDA, Extent and Cost of Weed Control With Herbicides and an Evaluation
of Important Weeds, 1965, ARS 34-102, August 1968.
169. Eichers, Theodore R. et al., Farmers’ Use of Pesticides in 1976, USDA Economics, Statistics and Cooperatives Service, Agricultural Economic Report No. 418, December 1978.
170. Duffy, Michael, Pesticide Use and Practices, 1982, USDA Economic
Research Service, Agriculture Information Bulletin No. 462, December 1983.
171. Ferguson, Walter L., 1979 Pesticide Use on Vegetables in Five Regions, USDA Economic Research Service, January 1984.
172. Waldron, Acie C. and Earl L. Park, Pesticide Use on Major Crops in the North
Central Region, 1978, Ohio Agricultural Research and Development Center, Research Bulletin 1132, July 1981.
173. Andrilenas, Paul A., Farmers’ Use of Pesticides in 1971: Extent of Crop Use,
USDA Economic Research Service, Agricultural Economic Report No. 268, September 1975.
174. Parsons, Phil, et al., “1960 Sample Costs of Growing Transplanted Tomatoes,
San Joaquin County,” California Tomato Grower, January 1961.
175. Lyons, Torrey, “Sacramento County Cost Study,” California Tomato Grower, December 1962.
176. Report by the Statewide Weed Control Committee of the California State
Chamber of Commerce, 1964.

127
177. Harvey, W.A., “Costs and Losses from Weeds,” Proceedings 17th Annual California Weed Conference, January 1965.
178. Agamalian, H., et al., “Weed Control Studies in Tomatoes, 1968-1970,”
California Agriculture, January 1972.
179. Tisdell, T.F., “Developments in Tomato Weed Control,” Proceedings 21st Annual California Weed Conference, January 1969.
180. Colbert, F.O., “Weed Control in Tomatoes,” Proceedings 26th Annual
California Weed Conference, January 1974.
181. Klonsky, Karen, et al., Production Practices and Sample Costs for Organic Processing Tomatoes in the Sacramento Valley, U.C. Cooperative Extension, 1993-1994.
182. Davis, R. M., et al., The Importance of Pesticides and Other Pest Management
Practices in U.S. Tomato Production, USDA, National Agricultural Pesticide Impact Assessment Program, 1-CA-98, 1998.
183. Henne, R.C., “Weed Control Systems for Transplanted Tomatoes,”
Northeastern Weed Science Society Proceedings, Vol. 33, January 1979.
184. Noonan, J.C., “Use of Certain Herbicides in Fields of Growing Tomatoes – Progress Report,” Florida State Horticultural Society Proceedings, 1956.
185. Bohmont, D.W., et al., Chemical Weed Control in Sugarbeets, University of
Wyoming Agricultural Experiment Station, Circular 65, April 1957.
186. The Economics of Sugar-Beet Mechanization, Colorado A&M Agricultural Experiment Station, Bul. 411-A, April 1950.
187. Schweizer, E.E. and Alan G. Dexter, “Weed Control in Sugarbeets in North
America,” Reviews of Weed Science, 3:113-133, 1987.
188. Bainer, Roy, “Science and Technology in Western Agriculture,” Agricultural History, Volume 49(1), 1975.
189. Dawson, J.H., “Full-Season Weed Control in Sugarbeets,” Weed Science,
Volume 22(4), pp.330-335, July 1974.
190. Robinson, C.W., Chemical and Mechanical Weed Control in Sugarbeets, Colorado State University Agricultural Experiment Station, Progress Report PR-195, November 1966.
191. Fults, J.L., Weed Technology in Colorado and a Program for Research,
Colorado State University Agricultural Experiment Station, General Series 779, July 1962.
128
192. “Specific Exemption Request: Use of Pyridate (Tough 5EC) for Post-Emergence Control of Kochia and Redroot Pigweed in Mint,” Submitted by Oregon Department of Agriculture, 1999.
193. Adams, R.L., Seasonal Labor Requirements for California Crops, University
of California Agricultural Experiment Station, Bulletin 623, July 1938.
194. Clark, M.S. et al, “Agronomic, Economic, and Environmental Comparison of Pest Management in Conventional and Alternative Tomato and Corn Systems in Northern California,” Agriculture, Ecosystems and Environment, 1998.
195. Almond Production Manual, University of California Division of Agriculture
and Natural Resources, Publication 3364, 1996.
196. Integrated Pest Management for Almonds, University of California Division of Agriculture and Natural Resources, Publication 3308, 1985.
197. Meith, H.C., and P.S. Parsons, “Nontillage and Strip Weed Control: Cut
Almond Production Costs in Butte County Test,” California Agriculture, June 1965.
198. Micke, Warren and Dale Kester, Almond Orchard Management, University of
California Division of Agricultural Sciences, Publication 4092, December 1978.
199. Asai, Wes et al, Sample Costs to Produce Organic Almonds in the Northern
San Joaquin Valley, University of California Cooperative Extension Service, 1992.
200. Kirkland, Kenneth J., “HOE 075032 for Wild Mustard Control in Canola,”
Weed Science, July 1995.
201. Berglund, D.R. and Kent McKay, Canola Production, North Dakota State Extension Service, A-686, June 1997.
202. Shaw, Craig, “Herbicide Tolerant Canola, A Farmers Perspective,”
Proceedings Western Society of Weed Science, v.50, pp. 11-12, 1997.
203. “Roundup Ready Canola-Optimum Application Timing,” North Dakota State Extension Service, Available at http://www.ag.ndsu.nodak.edu/minot/weeds/9829.htm.
204. Johnson, B., et al., “Herbicide-Tolerant and Conventional Canola Production
Systems Comparison,” 2000 North Dakota Weed Control Research.
205. Meggitt, W.F., et al., “An Evaluation of Cultivations and Monuron in Asparagus,” Journal American Society for Horticultural Science, Vol. 74, p.580, 1959.

129
206. Parker, Robert and R.A. Boydston, Weed Control in Asparagus, Washington State University Cooperative Extension Service, CEB 1145, February 1990.
207. Hart, James E., “Weed Control in Asparagus,” Proceedings 40th Annual
Meeting California Weed Science Society, 1988.
208. Carlson, R.F., et al., “Weed Control in Established Asparagus Plantings with CMU,” Quarterly Bulletin, Michigan State College Agricultural Experiment Station, Vol. 36, No. 2, November 1953.
209. Kuepper, George and Raeven Thomas, Organic Asparagus Production,
National Center for Appropriate Technology, December 2001.
210. Metzger, H.B. and A.A. Ismail, Management Practices and Cash Operating Costs in Lowbush Blueberry Production, Maine Agriculture Experiment Station, Bulletin # 723, 1976.
211. Arnold, C.E. and J.H. Aldrich, “Weed Control in Immature Pecan and Peach
Plantings,” Weed Science, Vol. 27, November 1979.
212. Yarborough, D.E., et al., “Weed Response, Yield, and Economics of Hexazinone and Nitrogen Use in Lowbush Blueberry Production,” Weed Science, September 1986.
213. Yarborough, D.E. and A.A. Ismail, “Hexazinone on Weeds and on Lowbush
Blueberry Growth and Yield,” HortScience, June 1985.
214. Hanchar, J.J., et al., “An Economic Evaluation of Hexazinone Use for Weed Control in Lowbush Blueberry Production,” HortScience, June 1985.
215. Marra, M.C. et al., Enterprise Budgets for Maine Blueberries: Three
Production Methods, Maine Agricultural and Forest Experiment Station, Misc. Report 394, October 1995.
216. Crop Profile for Hops in Washington, USDA, Office of Pest Management
Policy, January 1999.
217. Brooks, S.N., et al., Hop Production, USDA Information Bulletin No. 240, November 1961.
218. Taylor, Jack, “Contributions to the Control of Peach Decline in Georgia
Orchards,” Georgia Agricultural Research, University of Georgia Agricultural Experiment Station, Fall 1972.
219. Parker, M.L., et al., “Orchard Floor Management Affects Peach Rooting,”
Journal of the American Society of Horticultural Science, November 1993.
220. Nelson, Martin and C.K. McClelland, Cultivation Experiments With Corn, University of Arkansas Agricultural Experiment Station, Bulletin No. 219, June 1927.

130
221. Pike, D.R. et al., “A Case Study of Herbicide Use,” Weed Technology, July-
September 1991.
222. Buchholtz, K.P. and R.E. Doersch, “Cultivation and Herbicides for Weed Control in Corn,” Weeds, April 1968.
223. Staniforth, D.W. and W.G. Lovely, “Preemergence Herbicides in Corn
Production,” Weeds, April 1964.
224. Armstrong, D.L. et al., “Economic Comparison of Mechanical and Chemical Weed Control, ” Weed Science, July 1968.
225. Controlling Weeds in Corn with 2, 4-D, University of Illinois Agricultural
Extension Service, Circular 652, 1950.
226. Raleigh, S.M. and G.H. Berggren, “Atrazine Effective Weed Control Chemical in Corn,” Science for Farmers, Penn State University, Spring-Summer 1964.
227. Hinesly, T.D. et al, “Herbicide Versus Cultivation for Corn with Two
Methods of Seedbed Preparation,” Agronomy Journal, November-December 1967.
228. Vargas, Ron, University of California, Personal Communication, 2002.
229. Schroder, David et al., “The Contribution of Herbicides and Other
Technologies to Corn Production in the Corn Belt Region, 1964 to 1979,” North Central Journal of Agricultural Economics, January 1984.
230. Cates, J.S. and H.R. Cox, The Weed Factor in the Cultivation of Corn, USDA
Bureau of Plant Industry, Bulletin No. 257, October 1912.
231. Mulder, Thomas A., and Jerry D. Doll, “Integrating Reduced Herbicide Use with Mechanical Weeding in Corn,” Weed Technology, April-June 1993.
232. Hartzler, Robert E., et al., “On-Farm Evaluation of Mechanical and Chemical
Weed Management Practices in Corn,” Weed Technology, October-December 1993.
233. Mohler, C.L., et al., “A Comparison of Equipment for Mechanical Weed
Control in the Crop Row,” Proceedings Northeastern Weed Science Society, 1994.
234. Mohler, C.L. et al, “Evaluation of Mechanical Weed Management Programs
for Corn,” Weed Technology, January-March 1997.
235. Daniell, J.W., and W.S. Hardcastle, “Response of Peach Trees to Herbicide and Mechanical Weed Control,” Weed Science, March 1972.

131
236. Trevett, M.F., and R.E. Durgin, “Terbacil: A Promising Herbicide for the Control of Perennial Grass and Sedge in Unplowed Lowbush Blueberry Fields,” Research in Life Science, University of Maine, 19(15), 1972.
237. Van Wychen, Lee R., et al., “Tolerance of Sweet Corn Hybrids to
RPA201772,” Weed Technology, April-June 1999.
238. Romanko, R.R., “Control of Hop Downy Mildew by Chemical Desiccants,” Phytopathology, December 1964.
239. Ogg, A.G. and C.E. Zimmermann, “Effects of Paraquat and Dinoseb in
Hops,” Weed Science, September 1976.
240. Hazzard, Ruth, ed., Proceedings of the Northeast Farmer to Farmer Information Exchange, University of Massachusetts Cooperative Extension System, 1994.
241. “Organic Sweet Corn Could Be an Option for Growers,” Vegetable Growers
News, February 2001.
242. Hazzard, Ruth, et al., “Can a Biointensive System Work for Sweet Corn?,” The Grower, v. 94(2), February 1994.
243. “Application for an Emergency Exemption for the Use of the Herbicide
Liberty on Sweet Corn in Wisconsin,” State of Wisconsin Department of Agriculture, Trade, and Consumer Protection.
244. “Specific Exemption Request: Use of Clomazone to Control Annual Weeds in
Cucumbers and Watermelons in Maryland,” Submitted by Maryland Department of Agriculture, 1994.
245. Burgis, D.S., “Here’s a Chemical to Kills Weeds in Cucurbits,” Sunshine
State Agricultural Research Report, July 1957.
246. Glaze, Norman C., “Weed Control in Cucumber and Watermelon,” Journal of the American Society for Horticultural Science, Volume 100, May 1975.
247. “Crop Profile for Cucumbers in Florida,” USDA Office of Pest Management
Policy, June 2000.
248. Nelson, Mark, et al., Post-training Control of Basal Hop Suckers with Desiccant Herbicides for Reduction of Powdery Mildew, Washington State University, November 2002.
249. Fischer, B., et al., “Broccoli Weed Control Studies,” California Agriculture,
August 1971.
250. USEPA, “Preliminary Benefit Analysis of Nitrofen Use in California Broccoli,” Office of Pesticide Programs, July 1981.
132
251. Agamalian, Harry S., “Weed Control in Crucifer Crops with Nitrogen Fertilizer,” California Agriculture, November-December 1988.
252. Hale, Roy L., “Broccoli,” Principles of Weed Control in California, 2nd
Edition, Thomson Publications, 1989.
253. Jenks, Brian M., North Dakota State University, Personal Communication, August 2001.
254. Nalewaja, John D., et al., “Weeds in Sunflowers,” Farm Research, North
Dakota State University, July-August 1972.
255. Durgan, Beverly R., “Weed Control in Sunflowers,” University of Minnesota Extension Service, AG-FS-0920, 1986.
256. Berglund, Duane R., Sunflower Production, North Dakota State University
Agricultural Experiment Station Extension Bulletin 25, April 1994.
257. Majek, Brad, Rutgers University, Personal Communication.
258. Lange, A.H., “Weeds in California Fruit Crops,” California Agriculture, February 1968.
259. Robinson, R.G., The Sunflower Crop in Minnesota, Minnesota Agricultural
Extension Service, Bulletin 299, 1973.
260. Swenson, Andrew and Brad Brummond, “Projected 2000 Organic Crop Budgets South Central North Dakota,” North Dakota State University Extension Service, Available at http://www.ext.nodak.edu/extpubs/agecon/ecguides/sc-org.htm, March 2000.
261. Greathead, Arthur S., “Strawberry Weed Control,” Proceedings 11th Annual
Meeting of the California Weed Science Society, 1959.
262. Locascio, Sal J., “Strawberry Herbicides,” Sunshine State Agricultural Research Report, July 1965.
263. Aerts, Michael J. and O. Norman Nesheim, Florida Crop/Pest Management
Profile: Strawberries, University of Florida Extension Service, CIR 1239.
264. “Crop Profile for Strawberries in California,” USDA Office of Pest Management Policy, October 1999.
265. “Success May Lure New Players Into the Game,” The Packer, February 22,
1999.
266. Sances, Frank V. and Elaine R. Ingham, “Conventional and Organic Alternatives to Methyl Bromide on California Strawberries,” Compost Science and Utilization, Spring 1997.
133
267. “Crop Profile for Strawberries in Ohio,” USDA Office of Pest Management Policy.
268. “Emergency Response Request: Use of Oxyfluorfen for Control of Broadleaf
Weeds in Strawberries in Oregon,” Submitted by Oregon Department of Agriculture, October 1998.
269. Scott, D.H., et al., “Evaluation of Several Chemicals for Weed Control in
Strawberry Fields,” Weeds, April 1954.
270. Sorenson, Kenne th A., et al., The Importance of Pesticides and Other Pest Management Practices in U.S. Strawberry Production, USDA, National Agricultural Pesticide Impact Assessment Program, Document No. 1-CA-97, 1997.
271. Ashley, Richard A., “Weed IPM in Sweet Corn,” Vegetable and Small Fruit
Newsletter, University of Connecticut Cooperative Extension Service, April 1992.
272. Ashton, Floyd M. and Thomas J. Monaco, Weed Science: Principles and
Practices, Third Edition, John Wiley and Sons, 1991.
273. Anderson, Wood Powell, Weed Science: Principles, Second Edition, West Publishing Company, 1983.
274. Wilson, Robert G. and John Furrer, “Where Do Weeds Come From?,”
NebGuide, University of Nebraska, G86-807, July 1986.
275. Taylorson, R.B., “The Role of Seed Dormancy and Germination in Devis ing Weed Control Methods,” Proceedings World Soybean Research Conference III.
276. Stoller, Edward W., et al., “Weed Interference in Soybeans,” Reviews of
Weed Science, 3:155-181, 1987.
277. Coble, H.D., and R.L. Ritter, “Pennsylvania Smartweed Interference in Soybeans,” Weed Science, November 1978.
278. Coble, H.D., et al., “Common Ragweed Interference in Soybeans,” Weed
Science, May 1981.
279. Jordan, T.N., et al., “Weed Control,” Soybeans: Improvement, Production and Uses, Second Edition, American Society of Agronomy, 1987.
280. Gianessi, L.P., et al., Plant Biotechnology: Current and Potential Impact For
Improving Pest Management In U.S. Agriculture: An Analysis of 40 Case Studies, National Center for Food and Agricultural Policy, June 2002.

134
281. Jordan, G.L., and R.G. Harvey, “Response of Processing Peas and Annual Weeds to Acetanilide Herbicides,” Weed Science, Volume 26, Issue 4, July 1978.
282. Al-Khatib, Kassim, “Weed Control in Green Peas,” Western Washington
Weed Control Guide, Washington State University Cooperative Extension, EB1061, July 1994.
283. Barrons, Keith C., and Buford H. Grigsby, “The Control of Weeds in Canning
Peas With Chemical Sprays,” Michigan Quarterly Bulletin, Volume 28, No. 2.
284. Nelson, D.C., and R.E. Nylund, “Competition Between Peas Grown for Processing and Weeds,” Weeds, July 1962.
285. Jahns, Tom, “Organic Pea Row Cropping,” Pacific Northwest Sustainable
Agriculture, 4(2).
286. Kentworthy, Ralph, “Importance of Weed Control to the Food Processing Industry,” Proceedings of the California Weed Conference, pp. 83-88, 1979.
287. Wilson, Harlan R., “Weed Control in Spinach,” Proceedings 11th Annual
Meeting of the California Weed Science Society, 1959.
288. Laumeister, L.T., “Weed Control in Vegetable Crops,” Proceedings 8th Annual Meeting of the California Weed Science Society, 1956.
289. Kays, W.R., and Charles Galeotti, Studies of Weed Control in Spinach,
Oklahoma State University Agricultural Experiment Station, September 1959.
290. Bradley, G.A., et al., “Production Factors Affect Spinach Yield and Quality,” Arkansas Farm Research, July-August 1972.
291. Sweet, Robert D., “Chemical Weed Control in Beans,” Farm Research, July
1952.
292. Bellinder, Robin R., et al., “Evaluating the EPA’s Comparative Product Performance Testing Guidelines for Herbicides in Snap Bean,” Weed Technology, April-June 1998.
293. Mullins, C.A., and G.N. Rhodes, “Evaluation of New Herbicides in Snap
Beans,” Tennessee Farm and Home Science, Spring 1988.
294. “Specific Exemption Request: Use of Fomesafen to Control Broadleaf Weeds in Snap and Dry Beans Grown in New York State,” Submitted by New York State Department of Environmental Conservation, February 2000.
295. Edmondson, Vance W., Costs of Chemical and Flame Control of Weeds in
Cotton, Arkansas Experiment Station, Bulletin 569, 1956.

135
296. Walz, Erica, Final Results of the Third Biennial National Organic Farmers’ Survey, Organic Farming Research Foundation, 1999.
297. Dimitri, Carolyn and Catherine Greene, Recent Growth Patterns in the U.S.
Organic Foods Market, USDA Economic Research Service, Bulletin No. 777, September 2002.
298. Brown, Valerie, The New American Farmer, USDA Sustainable Agriculture
Research and Education Program, 2001, http://www.sare.org.
299. Grubinger, Vernon P., Sustainable Vegetable Production From Start-Up To Market, University of Vermont Cooperative Extension, NRAES-104.
300. Smith, Miranda, The Real Dirt: Farmers Tell About Organic and Low-Input
Practices in the Northeast, Northeast Organic Farming Association, 1994.
301. “U.S. Organic Farmers Also Face Competition From Foreign Growers,” Capital Press, May 4, 2001.
302. “Future of Organic Farming, Sales to Be Topics at Annual Tilth Gathering
October 7,” Capital Press, October 5, 2001.
303. Wyman, Jeff, Organic Potatoes: They Can Be Grown, But Can They Be Profitable?, Center for Integrated Agricultural Systems, University of Wisconsin, April 2001
304. Organic Food-Grade Soybeans, Agroecology/Sustainable Agriculture
Program, University of Illinois, April 2001.
305. Greene, Catherine and Amy Kremen, “U.S. Organic Farming: A Decade of Expansion,” Agricultural Outlook, USDA Economic Research Service, November 2002.
306. Wood, Marcia, et al., “Organic Grows on America!,” Agricultural Research,
v.50(2), February 2002.
307. “First Fruits Finds Orchard Success Organically,” The Fruit Growers News, November 1999.
308. “Organic Spud Market Same as Conventional – Down,” Capital Press, August
25, 2000.
309. “Where Philosophy, a Niche Market and Price Override Yield,” Capital Press, September 13, 2002.
310. Dartt, Barbara A. and Gerald D. Schwab, 2001 Crops and Livestock Budgets
Estimates for Michigan, Michigan State University, Department of Agricultural Economics, Agricultural Economics Report 609, September 2001.

136
311. Heintz, Chris, Almond Board of California, Personal Communication, February 2003.
312. Kramm, Otto, “Why I Farm Organically,” Earthbound Farm,
www.ebfarm.com, 2003.
313. Klinkenborg, Verlyn, “A Farming Revolution,” National Geographic, December 1995.
314. Case, H.C.M. and M.L. Mosher, Farm Practices That Pay, University of
Illinois College of Agriculture and Agricultural Experiment Station, Circular 389, March 1932.
315. Shaw, W.C., “Advances in Weed Control Research,” Proceedings 15th Annual
California Weed Conference, January 1963.
316. Behrens, Richard, “Corn and Weeds,” Weeds Today, Late Winter 1975.
317. Nalewaja, John D., “Herbicidal Weed Control Uses Energy Efficiently,” Weeds Today, Fall 1975.
318. “Organic Farmers Teach Consumers About Growing Methods, Benefits,”
Chicago Tribune, August 26, 2002.
319. “Volunteers Pitch in on Farms and Watch Themselves Grow Sometimes from Afar, They Travel to Gather Organic Crops, Reap Happy Experiences,” Los Angeles Times, September 9, 2002.
320. Marcroft, John, “Growers Viewpoint on the Use of Herbicides,” Proceedings
23rd Annual California Weed Conference, January 1971.
321. Marquardt, Sandra, “Organic Cotton: Production and Market Trends in the U.S. and Globally – 2001,” 2002 Beltwide Cotton Conferences Proceedings.
322. Swezey, Sean L., et al., “Preliminary Studies Show Yield and Quality
Potential of Organic Cotton,” California Agriculture, July-August 1999.
323. Klonsky, Karen, et al., Production Practices and Sample Costs for Organic Cotton – Northern San Joaquin Valley, USDA, University of California Cooperative Extension, 1995.
324. “The Cotton Brief,” New York Times, June 20, 1993.
325. Boone, David, “Market Overview of Organically Grown Cotton,” 1998
Beltwide Cotton Conferences Proceedings.
326. “Organic Cotton: The Fabric of Change,” The Cultivar, Vol. 18, No. 2, Fall/Winter 2000.

137
327. Crop Profile for Artichokes in California, USDA Office of Pest Management Policy, 1999.
328. Bari, Mohammad A., Pest Management Evaluation for Artichokes, Artichoke
Research Association, March 1999.
329. Rubatzky, V.E., et al., “California Globe Artichoke Production,” Proc. 2nd Intern. Congr. Artichoke Studies, 1976.
330. Haar, Milton J., et al., “Economics of Pronamide and Pendimethalin Use in
Weed Management During Artichoke Stand Establishment,” HortScience, Vol. 36, No. 4, July 2001.
331. Derr, Jeffrey F., “Biological Assessment of Herbicide Use in Apple
Production,” HortTechnology, Vol. 11, No. 1, January-March 2001.
332. Holm, LeRoy, et al., “Elimination of Rodent Cover Adjacent to Apple Trees,” Weeds, October 1959.
333. Burrell, A.B., “Tests with Herbicides in Champlain Valley Apple Orchards”
Proceedings New York State Horticultural Society, 1957.
334. Curtis, O.F., “Weeding Apple Orchards,” Farm Research, January-March 1965.
335. Lange, A.H., et al., “Herbicides for Control of Annual Weeds in California
Apples and Pears,” California Agriculture, March 1967.
336. Mullins, C.A., and D.L. Coffey, “Effect of Herbicides on Weed Control, Yields, and Tree Growth in a High Density Apple Orchard,” Compact Fruit Tree, June 1980.
337. Ricks, Donald, et al., Impact on the Apple Industry of Reduced Pesticide Use,
Michigan State University Department of Agricultural Economics, Staff Paper No. 93-46, March 1993.
338. Swezey, Sean L., et al., Organic Apple Production Manual, University of
California Agriculture and Natural Resources, Publication 3403, 2000.
339. Schwalm, H.W., “Celery Production Expensive,” California Agriculture, September 1949.
340. Lange, A.H., and R.A. Brendler, “Weed Control in Transplanted Celery,”
California Agriculture, February 1965.
341. Shadbolt, C.A., et al., “Use of Herbicides in Transplanted Celery,” California Agriculture, April 1960.
342. USDA, Summary Report 1997 National Resources Inventory, Natural
Resources Conservation Service, revised December 2000.

138
343. Utz, E.J., et al., “The Problem: The Nation as a Whole,” 1938 Yearbook of
Agriculture.
344. Koskinen, William C., and Chester G. McWhorter, “Weed Control in Conservation Tillage,” Journal of Soil and Water Conservation, November-December 1986.
345. Fawcett, Richard, and Dan Towery, Conservation Tillage and Plant
Biotechnology, Conservation Technology Information Center, 2002.
346. Schweizer, Edward E., et al., “Weed Control in Corn as Affected by Till-Plant Systems and Herbicides,” Weed Technology, January-March 1989.
347. Triplett, Glover B., Jr., and David M. Van Doren, Jr., “Agriculture Without
Tillage,” Scientific American, v. 236(1), January 1977.
348. Triplett, G.B., Jr., “Principles of Weed Control for Reduced-Tillage Corn Production,” in Weed Central in Limited Tillage Systems, Weed Science Society of America, Monograph Series Number 2, 1985.
349. McIsaac, G.F., et al., “Row Cultivation Effects on Runoff, Soil Loss and Corn
Grain Yield,” Transactions of the ASAE, January-February 1987.
350. Bertrand, A.R., and J.V. Mannering, “Cut That Crust!,” Crops and Soils, March 1963.
351. McIsaac, G.F., et al., “The Effect of Row Cultivation on Runoff, Soil Loss,
and Corn Grain Yield,” Presentation at the Summer Meetings of the ASAE, 1986.
352. Klonsky, Karen, et al., A Statistical Picture of California’s Organic
Agriculture 1995-1998, University of California Agricultural Issues Center, August 2001.
353. Smith, Norman J., “How to Kill 20 Million Weeds an Hour!,” American
Vegetable Grower, May 1956.
354. Martin, James L., “Weeds and Empty Pockets,” Proceedings of the 32nd Annual Southern Weed Science Society, January 1979.
355. USDA, Agricultural Statistics, National Agricultural Statistics Service, 1950-
2000.
356. Love, John M., U.S. Onion Statistics, 1960-93, Economic Research Service, USDA, Statistical Bulletin No. 880, May 1994.
357. Setia, Parveen, et al., The U.S. Rice Industry, Economic Research Service,
USDA, Agricultural Economic Report No. 700, September 1994.
139
358. Supak, James R., et al., “Trends in Cotton Production: History, Culture, Mechanization and Economics,” Weeds of Cotton: Characterization and Control, Cotton Foundation, 1992.
359. Florida Agricultural Statistics: Vegetable Summary, Florida Agricultural
Statistics Service, (1980-1995).
360. Fielder, Lonnie L., et al., Agricultural Statistics and Prices for Louisiana, 1909-1985, Louisiana Agricultural Experiment Station, DAE Research Report No. 659, September 1986.
361. Organic Production Practices - Northeastern United States, New Jersey
Agricultural Experiment Station, 2001.
362. Schroeder, J., “Oxyfluorfen for Directed Postmergence Weed Control in Chile Peppers,” Weed Technology, October-December 1992.
363. Schroeder, J., “Late-Season Interference of Spurred Anoda in Chile Peppers,”
Weed Science, April-June 1993.
364. “Emergency Exemption Application: Use of Oxyfluorfen on Chile Peppers for Weed Control,” Submitted by New Mexico Department of Agriculture, 2000.
365. Schroeder, Jill and James Libben, “Herbicide Influence on Yield, Quality, and
Cost of Managing Weeds in Chile Peppers,” Western Region Pesticide Impact Assessment Program Progress Report, March-November 1994.
366. Ford, D’Lyn, “Peppers Under Pressure,” Resources, New Mexico State
University Agricultural Experiment Station, Spring 2000.
367. Crop Profile for Chile Peppers in New Mexico, USDA, Office of Pest Management Policy, November 1999.
368. Ayers, Van H., “Weed Control Methods of Organic Cotton Producers,” 2000
Beltwide Cotton Conferences Proceedings.
369. Parsons, Philip S., and R.H. Sciaroni, “Artichoke Production,” California Agriculture, July 1957.
370. Toole, E.H., “Final Results of the Duvel Buried Seed Experiment,” Journal of
Agricultural Research, Vol. 72, No. 6, March 1946.
371. Stiles, W.C., “Effects of Weed Control on Apple Tree Growth,” 1987 Proceedings of the Northeastern Weed Science Society.
372. “How We Control Weeds on the Farm,” Proceedings 12th Annual Meeting of
the North Central Weed Control Conference, 1955.
373. “How We Control Weeds on Our Farm,” Proceedings 16th Annual Meeting of the North Central Weed Control Conference, 1959.

140
374. McMillen, Wheeler, “Father’s War Against Weeds,” Agricultural History,
Fall 1989.
375. Stahler, L.M, “Where Do We Stand on Weed Control,” Proceedings 8th Annual Meeting of the North Central Weed Control Conference, 1951.
376. Hemphill, D.D., “Status of Weed Control in Fruit Crops,” Proceedings 21st
Annual Meeting of the North Central Weed Control Conference, 1964.
377. Grigsby, B.H., “Post Harvest Control of Weeds in Asparagus,” Proceedings 7th Annual Meeting of the North Central Weed Control Conference, 1950.
378. USDA, Chart for “U.S. Hired Farm Workers and Wage Rates,” Available at
www.usda.gov/nass/aggraphs/fl_hired.htm.
379. USDA, Chile Pepper Charts, Available at www.nass.usda.gov/nm.
380. National American Blueberry Council.
381. California Agricultural Statistics Service.
382. www.wildblueberries.maine.edu/PDFs/Miscellaneous/BBCropStatiistics.pdf.
383. Langley, Jim and Suchada Langley, State-Level Wheat Statistics, 1949-88, Economic Research Service, USDA, Statistical Bulletin No. 779, March 1989.
384. Hanson, Noel S., “Past, Present, and Future in the North Central Weed
Control Conference,” Proceedings 4th Annual Meeting of the North Central Weed Control Conference, 1947.
385. Klonsky, Karen and Laura Tourte, Production Practices and Sample Costs for
Fresh Market Organic Lemons, South Coast, 1997, University of California Cooperative Extension, available at http://www.sarep.ucdavis.edu/pubs/costs/97/lemon/.
386. Klonsky, Karen and Laura Tourte, Production Practices and Sample Costs for
Organic Raisin Grapes, Southern San Joaquin Valley, 1997, University of California Cooperative Extension, available at http://www.sarep.ucdavis.edu/pubs/costs/97/rasin/.
387. National Research Council, Alternative Agriculture, Washington, DC,
National Academy Press, 1989.
388. Perry, Sandy, “IR-4 and Section 18’s: High Value Work Behind the Scenes,” IR-4 Newsletter, 32:4, pp.18, 2002.
389. Klonsky, Karen M., University of California, Personal Communication,
February 2003.
141
390. USDA, Acreage, National Agricultural Statistics Service, 2001.
391. Carpenter, Janet E., and Leonard P. Gianessi, Agricultural Biotechnology: Updated Benefit Estimates, National Center for Food and Agricultural Policy, 2001.
392. Growing Wheat in Kansas, Kansas Agricultural Experiment Station, Bulletin
#463, 1954.
393. Burnside, Orvin C., et al., Biologic and Economic Assessment of Benefits from Use of Phenoxy Herbicides in the United States, National Agricultural Pesticide Impact Assessment Program, USDA, 1996.
394. Phillips, W. M., “Effect of Some Selective Herbicides on Fall Planted Small
Grains,” Proceedings of the Sixth North Central Weed Control Conference, 1949.
395. Smith, Elwin G., and Douglas L. Young, “Requiem for Summer Fallow,”
Choices, First Quarter, 2000.
396. “Weed Control on the Central Plains,” Agricultural Research, May 1997.
397. Fox, Austin, et al., Restricting the Use of Phenoxy Herbicides, Costs to Farmers, USDA, Agricultural Economic Report # 194, 1970.
398. Donald, William W. Ed., Systems of Weed Control in Wheat in North
America, Weed Science Society of America, 1990.
399. Behrens, R., and A. C. Darwent, “Comparison of the Influence of Weed Competition on Semidwarf and Normal Varieties of Wheat,” North Central Weed Control Conference Research Reports, V. 27, pp. 42, 1970.
400. Greb, B. W., “Water Conservation: Central Great Plains,” Dryland
Agriculture, ASA-CSSA-SSSA, Agronomy Monograph No. 23, 1983.
401. Winter Wheat Production in Wyoming, University of Wyoming, Agricultural Experiment Station, Bulletin # 603, 1974.
402. McCuen, G. W. and E. A. Silver, Combine Harvester Investigations, Ohio
Agricultural Experiment Station, Bulletin # 643, 1943.
403. Al-Khatib, Kassim, “Weed Control in Wheat,” Western Washington Weed Control Guide, Washington State University, Extension Bulletin 1803, June 1995, available at http://cru.cahe.wsu.edu/CEPublications/eb1803/eb1803.html.
404. Veseth, Roger, “Russian Thistle Control in a Wheat-Fallow Rotation,” Weed
Control, Pacific Northwest Conservation Tillage Handbook Series, # 7, 1987.

142
405. Dexter, Alan G., “Weedonomics,” 1982 North Central Weed Control Conference Proceedings.
406. Nalewaja, John D., “Weeds: Coexistence or Control,” Journal of
Environmental Quality, Vol. 1, No. 4, 1972.
407. Nalewaja, John D., “Weed Control Research Needed to Slash Wheat Productivity and Profitability Losses,” Wheat Grower, March 1983.
408. Heap, Ian, The Effect of Weeds on Mint Oil Yield and Quality, Oregon State
University, Department of Crop and Soil Science, 1993.
409. Rinehold, John and Jeffrey J. Jenkins, Oregon Pesticide Use Estimates for Seed and Specialty Crops, 1992, Oregon State University Extension Service, September 1994.
410. Ogg, Alex G., Evaluation of Herbicides for Weed Control in Mint,
Washington State University College of Agriculture Research Center, Bulletin 810, May 1975.
411. Peterson, Gale E., “The Discovery and Development of 2,4-D,” Agricultural
History, Vol. 41(3), 1967.
412. Lanini, W. Thomas and Warren E. Bendixen, “Characteristics of Important Vineyard Weeds,” Grape Pest Management, University of California, Division of Agriculture and Natural Resources, 1992.
413. Hartzler, Robert G., “Utilizing Potential Weed Pressures to Improve
Efficiency of Weed Management Programs,” Leopold Center for Sustainable Agriculture, Competitive Grant Report 90-20, Vol. 2, 1993.
414. Rikoon, J. Sanford, et al., “Factors Affecting Initial Use and Decis ions to
Abandon Banded Pesticide Applications,” Agricultural Research to Protect Water Quality, Proceedings of the Conference, Sponsored by Soil and Water Conservation Society, February 1993.
415. Freed, Virgil H., “Weed Science: The Emergence of a Vital Technology,”
Weed Science, November 1980.
416. Timmons, F.L., “A History of Weed Control in the United States and Canada,” Weed Science, July 1969.
417. Zahnley, J.W., and W.F. Pickett, Field Bindweed and Methods of Control,
Kansas State University Agricultural Experiment Station, Bulletin 269, July 1934.
418. Welsh, Rick, Economics of Organic Grain and Soybean Production in the
Midwestern United States, Policy Studies Report No. 13, Henry A. Wallace Institute for Alternative Agriculture, May 1999.