the validity of measures of socioeconomic status of ... · pdf filethe validity of measures of...
TRANSCRIPT
JOURNAL OF ADOLESCENT RESEARCH / May 2000Ensmingeret al. / VALIDITY OF MEASURES OF SES
The Validity of Measures ofSocioeconomic Status of Adolescents
Margaret E. EnsmingerChristopher B. Forrest
Anne W. RileyMyungsa KangBert F. Green
Barbara StarfieldJohns Hopkins University
Sheryl A. RyanUniversity of Rochester
This study examines the validity of measures of socioeconomic status (SES) as reportedby adolescents. Adolescents completed a self-administered questionnaire that includedeight measures of SES. Mothers also reported on selected measures of SES. Supportingcriterion validity, adolescents and mothers had relatively high agreement on the SESmeasures. Older adolescents, those less involved in risk behaviors, and those who dobetter in school gave more accurate SES reports and/or were less likely to have missingSES data. Those in households without fathers were less likely to know fathers’information. Income was not asked of the adolescents. However, mostadolescent-reported SES questions varied systematically and in the expected directionwith mothers’ income report. In terms of construct validity, the SES measures related toadolescent health measures in the predicted way—that is, those with higher SES weremore likely to report better physical and emotional health.
This article examines the extent to which adolescents can be seen as validreporters of their family background and socioeconomic status (SES). Theconstruct of SES is central to understanding how individual development is
392
This research was supported in part by the Agency for Health Care Policy and Research, Grant No. HS07045,and by the Bureau of Maternal and Child Health, HHS, Grant No. MCJ247307. We acknowledge the invalu-able contributions of Kelly V. Crawford (project coordinator). Special thanks to Dr. Kelly Kelleher, who col-lected the data in Arkansas, and to Judy Robertson, who helped with data analysis. Correspondence concern-ing this article should be addressed to Margaret E. Ensminger, Department of Health Policy and Management,Johns Hopkins University, School of Public Health, 624 North Broadway, Baltimore, MD 21205; e-mail:[email protected].
Journal of Adolescent Research, Vol. 15 No. 3, May 2000 392-419© 2000 Sage Publications, Inc.
at WELCH MEDICAL LIBRARY on September 2, 2010jar.sagepub.comDownloaded from

shaped by the processes that occur in key social contextsincluding families,schools, neighborhoods, and health organizations (Alwin &Thornton, 1984;Bidwell & Friedkin, 1989; Blau & Duncan, 1967; Demo & Acock, 1996).Furthermore, recent trends in family and economic life have increased thediversity experienced in the lives of children and adolescents (Hernandez,1997). Understanding how the family’s socioeconomic background affectsthem would be facilitated if it were possible to obtain accurate informationfrom the adolescents themselves.
Three articles have made recommendations about the measures of SES tobe included in research on youth. Entwisle and Astone (1994), Hauser (1994),and Hernandez (1997) suggested guidelines to help researchers assign chil-dren and adolescents to SES groups. Based on Coleman’s (1988) concept thatsuccessful development requires three kinds of capital—financial, human,and social—Entwisle and Astone (1994) suggested measures of income,mothers’education, and household and family structure. They addressed theproblem of whose resources to measure, noting that the traditional practice ofmeasuring the characteristics of the householder, who is assumed to be thechild’s father or father figure, is inadequate in many studies because of theplurality of family forms in the United States. Hauser (1994) recommendedgathering information about the major adult earner in the household to ascer-tain the education, labor force status, and occupational position of that personregardless of gender. Hernandez (1997) suggested using questions on house-hold composition, family income, educational attainment, race and ethnicity,and employment worded as in the census so that information can be com-pared with national population data.
In an excellent review of measurement of social class, Liberatos, Link,and Kelsey (1988) concluded that there is no one best measure. They sug-gested nine criteria for selecting measures: conceptual relevance, the possi-ble role of social class in the study, the applicability of the measures to thespecific populations being studied, the relevance of a measure to the timeperiod of study, the reliability and validity of the measures, the number ofindicators included, the level of measurement, the simplicity of the measure,and comparability with other studies. In the case of children and adolescents,more attention needs to address whose characteristics are measured—mother, father, or both.
Another issue in the measurement of SES is whether an index or separatecomponents should be examined. Entwisle and Astone (1994) recommendedthat multiple indicators of social class be used with each included separatelyin analyses. Mechanic (1989) suggested that important information may belost when education, income, occupation, and residence are combined in oneindex because each indicator may have differing effects on specific out-
Ensminger et al. / VALIDITY OF MEASURES OF SES 393
at WELCH MEDICAL LIBRARY on September 2, 2010jar.sagepub.comDownloaded from

comes. Liberatos et al. (1988) concluded that the three indicators of socialclass most commonly used—occupation, education, and income—appear tobe related to health, yet are not themselves highly intercorrelated. Each indi-cator is often associated with health outcomes independent of the other two.Given the evidence supporting the multifaceted nature of social class, theyrecommended that researchers incorporate at least two indicators of socialclass in their measurement and suggested that composite measures mayobscure the differential impact of different measures. However, an indexmeasure may be useful when data are obtained from reporters who may notbe able to report adequately on all indicators. If some SES information ismissing (e.g., family income), an index that combines indicators may providea reasonable substitute for the missing information.
Such an approach is likely to be needed when adolescents rather than par-ents are the study respondents. None of the four previously cited overviewarticles (Entwisle & Astone, 1994; Hauser, 1994; Hernandez, 1997; Libera-tos et al., 1988) discussed the problems arising when adolescents rather thanparents provide the SES information. Both Entwisle and Astone (1994) andHauser (1994) suggested that if at all possible, ethnicity and socioeconomicmeasures be obtained from the parents, perhaps when gaining consent forthe child to participate in the study. However, questions concerning incomeare among the most sensitive questions to many respondents as indicated bythe high rate of missing answers on income questions. For example, in theNational Survey of Families and Households, 17.5% of mothers did notreport their family income (Demo & Acock, 1996). Questions concerningincome may not be the best questions to pose to parents at the same time thatconsent for their child’s participation is being obtained.
It is unclear how accurate adolescents are in reporting information abouttheir families. In a review of studies that have used children as proxy reportersfor parental educational status and father’s occupation, Looker (1989) con-cluded that among school-aged children and adolescents, the higher thegrade, the more accurate the report; there was no evidence that gender wasrelated to accuracy. (Many of the reviewed studies included reports fromadult children about their parents’ status and are not relevant for the issueaddressed here.) Most of the reviewed studies had collected data in the 1950sor 1960s, so the populations did not have the diversity in family structure thatis present in current studies of American families. The SES measures weremore restricted than those that might be included in current studies. Adoles-cents probably cannot accurately report some important aspects of familyresources, especially family income.
394 JOURNAL OF ADOLESCENT RESEARCH / May 2000
at WELCH MEDICAL LIBRARY on September 2, 2010jar.sagepub.comDownloaded from

The purpose of this article is to evaluate the validity of the measurement ofSES as reported by adolescents. Because many studies of adolescents do notinclude parents as respondents, the validity of adolescents’ reports of familybackground is important to assess. Furthermore, knowledge about how theaccuracy of these measures varies by age, gender, family type, and other ado-lescent characteristics will help researchers to better design their studies. Weexamine whether adolescents can report SES information, the differencesamong adolescents in terms of the accuracy and completeness of theiranswers, and how the measures of SES relate to other indicators of health. Wediscuss content validity first. Second, criterion validity is indicated by theagreement of adolescents’ answers with their mothers’. Third, we evaluatewhether adolescents can give information about their family SES as indicatedby missing data on SES questions. Fourth, we examine whether adolescentsvary in the accuracy and the completeness of the SES information they giveby their geographic location, household type, gender, and age. Fifth, weexamine the relationship between a composite SES index and the single SESindicators. Sixth, we compare each SES measure with a measure of familyincome as reported by the mothers. Finally, as an indicator of construct valid-ity, we examine the relationship between several key health measures and theSES measures.
The adolescents were assessed on the Child Health and Illness Profile-Adolescent Edition (CHIP-AE™) (Starfield, Bergner, et al., 1993; Starfield,Riley, et al., 1995) in three different locations—urban Baltimore, rural West-ern Maryland, and rural Arkansas—during five different survey administra-tions. The overall aim was to design a broad-based instrument for the meas-urement of adolescent health. We defined and measured six domains ofhealth (Starfield, Bergner, et al., 1993; Starfield, Riley, et al., 1995).Although not conceptually part of health status, measures of SES wereincluded because of the consistent relationship of SES and health shown inpast studies (although very few studies have examined this relationshipamong adolescents). We chose to include traditional SES measures if theymet two criteria: first, that adolescents would know the information, and sec-ond, that the items could be incorporated in a self-administered question-naire. These caveats eliminated two of the common measures of SES—family income and parental occupation—because adolescents would not beexpected to know their family’s income, and accurate occupational informa-tion is best obtained in a face-to-face interview that allows for probingrespondents for information necessary for coding occupation.
Ensminger et al. / VALIDITY OF MEASURES OF SES 395
at WELCH MEDICAL LIBRARY on September 2, 2010jar.sagepub.comDownloaded from

MEASURES OF SES: CONTENT VALIDITY
Content validity refers to how much a measure covers the range of mean-ings of a construct (Carmines & Zeller, 1979). We rely on the definitions andmeasures as described by Entwisle and Astone (1994)—financial capital,human capital, and social capital—and examine how our measures fit withthose constructs.
Financial capital. Several measures of financial capital were included inthe CHIP-AE™. Students were asked whether their mothers and fathers wereemployed full-time, employed part-time, or not working. The family’s par-ticipation in means-tested programs was assessed in three questions.
Conceptually, participation in means-tested programs has a special socio-logical significance (Coser, 1965; Simmel, 1965). Simmel (1965) stated thefollowing:
No one is socially poor until he has been assisted and this has a general validity:sociologically speaking, poverty does not come first and then assistance. . . buta person is called poor who receives assistance or should receive it given his so-ciological situation. (p. 138)
Participation in means-tested programs may be important not only because itindicates low financial capital but also because it represents societal ac-knowledgment of need.
Students were asked whether their family received a welfare check,received food stamps, or whether they or any of their siblings receive free orreduced lunch. Each of these questions was used separately. Both Entwisleand Astone (1994) and Hauser (1994) argued strongly against participationin a school lunch program as a measure of SES. They suggested that locationsdiffer in the availability of these programs, many eligible families do not par-ticipate, and older children are even less likely to participate. However, therehas been little empirical examination of school-lunch participation, althoughit is often used as an indicator of SES in studies of schoolchildren or adoles-cents. We evaluate how accurate adolescents’ reports are (using parentalreports as the gold standard), whether adolescents are able to report their fam-ily’s participation in these programs, and how participation in the programsvaries by location. We attempted to address the problem of older childrenbeing less likely to participate in lunch programs by asking whether any childin the family received free or reduced price lunch.
396 JOURNAL OF ADOLESCENT RESEARCH / May 2000
at WELCH MEDICAL LIBRARY on September 2, 2010jar.sagepub.comDownloaded from

For the one study site in which mothers reported on family income, weexamine how well the adolescents’ reports of financial and other SES meas-ures relate to family income.
Human capital. Parental education, specifically mother’s education, is thebest measure of human capital according to Entwisle and Astone (1994).They suggested using only mother’s education in determining this aspect ofSES because it usually has a low rate of missing responses and it is highlycorrelated with father’s education. The CHIP-AE™ included questionsabout both mothers’and fathers’education. Students were asked to report thehighest grade in school that their mother or father finished: did not finish highschool; received a high school diploma or general equivalency diploma(GED); had some college; finished college; finished graduate school, lawschool, or medical school; and do not know. These questions are very similarto Entwisle and Astone’s (1994) suggestions to ask the highest degree andhighest grade achieved.
Social capital. To assess social capital, the resources embodied in socialrelationships, Entwisle and Astone (1994) recommend measures of house-hold and family structure. Household structure has been shown to be highlyrelated to financial capital as well (Duncan, 1984). Students are asked tocheck all the people living in their home (10 relationships and an “other”category are listed). We coded the families by whether they included bothmother and father, mother only, parent and stepparent, or mother and someother adult (such as a grandmother).
Table 1 shows the domains of SES and the measures for each. Theseinclude the broad range of meanings of the SES domain as described byEntwisle and Astone (1994).
SES index measure. Although discrete measures of SES are generally pre-ferred, the value of composite measures has not been examined as anapproach for overcoming the inability to directly ask about family incomeand parental occupation of adolescents. We constructed a composite measureof SES to compare its usefulness to the single measures. The index was calcu-lated by taking the mean score of the eight SES items shown in Table 1. Ascore was generated for a student if at least six of the eight items wereanswered; this allows a respondent’s data to be used even if it is not complete.The composite was multiplied by 100 to put the score on a 0 to 100 scale tofacilitate comparisons across groups.
Ensminger et al. / VALIDITY OF MEASURES OF SES 397
at WELCH MEDICAL LIBRARY on September 2, 2010jar.sagepub.comDownloaded from

DATA COLLECTION
Instrument. The CHIP-AE™ is a comprehensive health status instrumentdesigned to assess six broad domains of health—satisfaction, discomfort,resilience, risks, disorders, and achievement (Starfield, Bergner, et al., 1993;Starfield, Riley, et al., 1995). In addition to the health measures, the instru-ment includes items about sociodemographic characteristics including sex,age, ethnicity, and the SES measures.
Sample. The CHIP-AE™ was administered to middle school and highschool students from schools in eastern Baltimore in 1991, from schools innorth Baltimore in 1992, and schools in both eastern and north Baltimore in
398 JOURNAL OF ADOLESCENT RESEARCH / May 2000
TABLE 1: Measures of Socioeconomic Status
Domain Measure Coding
Financial capital Mother’s employment 0 = not working.5 = working part-time1 = working-full time
Father’s employment 0 = not working.5 = working part-time1 = working full-time
Aid to Families withDependent Children 0 = yes
1 = noFood stamps 0 = yes
1 = noFree or reduced-cost
lunches 0 = yes1= no
Human capital Mother’s education 0 = less than high school graduate.5 = high school graduate,
vocational school, and/orsome college
1 = college graduateFather’s education 0 = less than high school graduate
.5 = high school graduate,vocational school, and/orsome college
1 = college graduateSocial capital Family structure 0 = single parent
.5 = parent and stepparent,other adult
1 = mother and father
at WELCH MEDICAL LIBRARY on September 2, 2010jar.sagepub.comDownloaded from

1993 (Starfield, B., Ensminger, M. E., Green, B. F. et al., 1995). In addition,in 1992, schools from a county in rural Maryland and schools in two ruralcounties in Arkansas were included. Whereas all samples were randomlyrecruited from each school or included the full student body, the data do notrepresent a random sample of either Maryland or Arkansas students.
Procedures. In all administrations, parents were mailed consent formsexplaining the survey and requesting permission for their child to participate.All students whose parents did not refuse permission and who themselves didnot decline were administered the questionnaire during a class period.Response rates were 62% in Baltimore 1991, 92% in Baltimore 1992, 77% inBaltimore 1993, 89% in rural Maryland, and 39% in Arkansas. Except inArkansas, nonrespondents were either absent from school or refused to par-ticipate. For example, of the 38% of those who did not participate in the Balti-more 1991 survey, 22% were absent during survey administration, 15% wererefusals, and 1% of surveys were dropped because of a high rate of incompleteanswers. At least four or five follow-up attempts were made to allow studentswho had been absent to complete the survey in all sites. Many of those who didnot participate were chronic absentees who were on the school roster but hadnot officially dropped out of school. The Arkansas response rate is lowbecause students were part of a follow-up study of students who had been sur-veyed in the previous year. If students had changed schools (either becausethey moved or graduated from middle school), they were not followed.
In the three Baltimore school samples, subsamples of mothers or femaleguardians were recruited to respond to the parent version of the CHIP-AE™to determine parent-adolescent agreement for purposes of assessing reliabil-ity and validity. There are 165 mothers from Baltimore 1991 and 225responses from Baltimore 1992. This represents about 75% to 82% of the tar-get population of 200 mothers in 1991 and 250 mothers in 1992. The motherwas administered the survey no later than a month after the child hadresponded in these two administrations. The 291 parents participating (80%of those recruited) in the Baltimore 1993 sample were in a subset specificallyrecruited to participate in a follow-up study, and the time interval betweentheir responses and those of their children could have been as long as a year.
Analysis
The overall purpose of the analyses is to understand how much adoles-cents know and can report on their family background, how well these reportsagree with their mothers’ reports, what characteristics of adolescents influ-ence the quality of their reporting, and how the SES reports relate to health
Ensminger et al. / VALIDITY OF MEASURES OF SES 399
at WELCH MEDICAL LIBRARY on September 2, 2010jar.sagepub.comDownloaded from

measures. Criterion validity is based on how well the measure relates to someexternal criterion. For the adolescent measures of SES, we rely on the moth-ers’ reports as the external criteria. To evaluate the accuracy of the adoles-cents’ reports of SES, we compare the adolescents’ reports on the SES itemswith reports on the same items from their mothers. The agreement betweenadolescents and mothers is evaluated by kappa statistics and by the propor-tions of mothers and adolescents who agree.
To better understand the influences on the accuracy of adolescents’reportsof SES, we examine the accuracy by age, gender, family type, school achieve-ment, the adolescents’ participation in risk behaviors (such as alcohol anddrug use), levels of family involvement, and school location using logisticregression analyses. Older adolescents, those who live in families with bothparents present, those who perform better in school, those with higher familyinvolvement, and those with less participation in individual risk behaviorsmight be expected to know more and report more accurately about their fam-ily background than their counterparts. We do not have specific expectationsabout how gender or location may influence accuracy.
Because a major issue concerns what information adolescents can report,we compare the proportions of missing data across the SES measures as itreflects students’ “do not know” responses. We examine whether age, gender,family type, school location, the adolescents’ participation in risk behaviors,the reports of family involvement by the adolescents, and school performancehelp explain variations in missing data. We also examine whether adolescentswho are missing SES information were also more likely to have high rates ofmissing information on the remainder of the questions on the CHIP-AE™.
We examine the correlation of the SES measures with one another. Ifmeasures of SES are highly interrelated, then we could reasonably substituteone measure for another if there were high rates of missing information onone measure or if some indicators were more difficult to obtain. Also, thecomposite measure of SES is compared with the separate indicators. For con-struct validity, we examine how well the SES measures relate to health meas-ures as reported by the adolescents.
RESULTS
Sample Characteristics
The descriptive characteristics of the five samples, including the frequen-cies of the SES measures, are shown in Table 2. The mean age ranged from14.0 to 14.9 across the sites. The percentage of the samples that was female
400 JOURNAL OF ADOLESCENT RESEARCH / May 2000
at WELCH MEDICAL LIBRARY on September 2, 2010jar.sagepub.comDownloaded from

ranged from 48% to 57%. Minority status varied greatly by site, with the ruralMaryland sample having only 3% minority students, whereas Baltimore1992 and rural Arkansas had 81% to 88% minority students (most of whomwere African American).
The five sites differed in SES. Those from Baltimore 1992 and westernMaryland generally had higher socioeconomic status than those from Balti-more 1991 or Arkansas. Those from rural western Maryland were muchmore likely to be living in a two-parent household than those from any otherlocation. Rates of participation in the means-tested programs were particu-larly high in Arkansas.
Criterion Validity: Adolescent-MotherAgreement on SES Measures
We compared the answers given by the adolescents to those given by theirmothers on the SES measures. In Baltimore 1991, all the SES questions wereasked of mothers, whereas selected questions were asked in Baltimore 1992and Baltimore 1993. Cohen’s kappa is a widely used measure of interraterreliability for quantitative ratings. Values higher than .75 represent excellentagreement beyond chance, whereas those between .4 and .75 may be inter-preted to reflect fair to good agreement beyond chance, and those lower than.4 indicate poor agreement beyond chance (Fleiss, 1981).
Table 3 shows the kappas for younger and older adolescents in the threesites and the percentage of responses of the adolescents and their mothers thatwere in agreement. We present separate kappas for father’s education andfather’s employment depending on whether the father was present in thehousehold. In Baltimore 1991, the kappas ranged from .35 (father’s employ-ment when the father was not in the household) to .72 (free/reduced lunch)for the younger adolescents and from .59 (free/reduced lunch) to .70 (foodstamps) for the older adolescents. The kappas for the Baltimore 1992 andBaltimore 1993 data are also shown on Table 3. In general, the younger ado-lescents have lower kappas than the older (although there are exceptions,most notably whether the adolescents or any siblings received a free schoollunch). The kappas on father’s education and father’s employment are alsoalways lower when the father is not in the household. We also compared thekappas for the males and females. There were no systematic differences inthe kappas between the males and females (data not shown).
By way of comparison, the kappas on other items of the CHIP-AE™ com-paring the mothers’ and adolescents’ responses were generally lower. Forexample, the kappa for whether the family ate meals together was .15; for earinfections, it was .12; and for the number of days the adolescent missed
Ensminger et al. / VALIDITY OF MEASURES OF SES 401
at WELCH MEDICAL LIBRARY on September 2, 2010jar.sagepub.comDownloaded from

school in the past year, it was .19. All but three kappas presented here for theolder adolescents were higher than .55. The kappa for father’s educationwhen he was not in the household was .27 (Baltimore 1993). This is con-trasted with a kappa of .82 for the same item in the same population when thefather was present in the household. For younger adolescents, two kappaswere in the poor range—father’s employment when fathers were not in thehousehold (Baltimore 1991) and whether the family received food stamps(Baltimore 1992).
The percentage agreement between adolescent and mother was alwayshigher than 70% except for those questions asking about fathers when theywere not in the household.
Predictors of Accuracy
To examine whether adolescent or family characteristics predicted whichadolescents were accurate in their responses, we examined in logistic regres-
402 JOURNAL OF ADOLESCENT RESEARCH / May 2000
TABLE 2: Descriptive Characteristics by Sample
WesternBaltimore Baltimore Baltimore Maryland Arkansas
Characteristic ( N = 1,406) ( N = 877) ( N = 957) ( N = 1,878) ( N = 354)
Year data collected 1991 1992 1993 1992 1992Age (mean) 14.9 14.3 14.3 14.6 14.0Female 56.2% 53.6% 57.1% 48.1% 53.4%Minority 47.0% 88.4% 62.1% 3.1% 89.4%Measures of
socioeconomic statusMothers not working 33.6% 13.4% 23.5% 29.6% 37.4%Fathers not working 14.8% 11.1% 14.6% 14.7% 14.0%Receiving Aid to
Families withDependent Children 13.4% 5.7% 13.6% 3.7% 19.4%
Receiving food stamps 26.2% 8.5% 7.9% 8.4% 51.9%Receiving free/reduced
lunch 48.7% 36.1% 44.7% 29.2% 74.8%Mothers without high
school diploma 34.1% 7.0% 18.0% 13.1% 20.1%Father without high
school diploma 31.4% 12.4% 21.5% 15.7% 29.2%Living with both
biological parents 33.8% 37.0% 35.7% 68.7% 40.9%Mean socioeconomic
status composite 61.1 76.4 68.1 76.7 53.2
at WELCH MEDICAL LIBRARY on September 2, 2010jar.sagepub.comDownloaded from

sion analyses the factors that related to the accuracy of the adolescents’responses. The dependent variable was an indicator of whether all of the ado-lescent and mother responses to the SES questions were identical. If theywere all matching, the code was 1; if even one did not match, the code was 0.Predictor variables were age, gender, family type, achievement, resilience,and risks. The achievement domain reflects the adolescent’s performance in
Ensminger et al. / VALIDITY OF MEASURES OF SES 403
TABLE 3: Agreement Between Adolescent and Parent Responses for Meas-ures of Socioeconomic Status: Kappas (percentage agreement).
Younger Adolescents Older AdolescentsItem Aged 10 to 13 Aged 14 to 19
Baltimore 1991Mother’s education .53 (77.1) .68 (81.8)Mother’s employment .62 (76.9) .69 (80.7)Father’s education
Father in household .45 (76.0) .68 (82.5)Father not in household —a (58.8) .48 (74.1)
Father’s employmentFather in household .58 (83.9) .62 (86.7)Father not in household .35 (66.7) .58 (81.3)
Welfare .40 (84.5) .68 (92.0)Food stamps .68 (87.5) .70 (89.7)Free/reduced lunch .72 (86.0) .59 (79.8)Household composition .49 (69.2) .61 (78.4)n 65 97
Baltimore 1992Welfare .50 (93.5) .60 (91.3)Food stamps .33 (85.7) .57 (88.6)Free/reduced lunch .73 (87.1) .63 (81.9)n 69 154
Baltimore 1993Mother’s education .47 (70.0) .70 (82.3)Mother’s employment .58 (76.5) .57 (78.4)Father’s education
Father in household .63 (77.1) .82 (88.2)Father not in household .43 (66.7) .27 (58.1)
Father’s employmentFather in household —a (84.4) .77 (93.3)Father not in household —a (73.7) .55 (80.4)
Welfare .58 (89.8) .48 (89.6)Food stamps .71 (88.7) .51 (88.4)Household composition .54 (73.9) .70 (82.0)n 119 169
a. The kappa could not be calculated for this measure because one of the respondentgroups (i.e., adolescents or mothers) did not endorse one of the response categories al-though the other group did.
at WELCH MEDICAL LIBRARY on September 2, 2010jar.sagepub.comDownloaded from

the school setting. The resilience domain assesses states and behaviorsknown to foster good health and reduce the likelihood of subsequent illnessor injury. It consists of four subdomains: family involvement, problem solv-ing, physical activity, and home safety and health. The risks domain—com-prising the subdomains of individual risks, behavioral threats to achieve-ment, and peer influences—includes states and behaviors that are known toheighten the likelihood of subsequent ill health or injury (Starfield, Riley, et al.,1995). All domains are scored so that a higher score indicates a higher level ofthe construct being measured; higher scores for achievement and resilienceare considered better for health, but a higher score for risks is consideredworse for health.
Two logistic regression analyses were performed: one on the data from theBaltimore 1991 administration and one on the Baltimore 1993 administra-tion. These were the two survey administrations with sufficient numbers of
404 JOURNAL OF ADOLESCENT RESEARCH / May 2000
TABLE 4: Logistic Regression Results for Agreement Between Adolescents’and Parents’ Reports on Seven Measures of Socioeconomic Statusa
East Baltimore 1991 ( N=165) Baltimore 1993 ( N = 291)
Odds 95% Confidence Odds 95% ConfidenceCovariate Ratio Interval Ratio Interval
GenderMale 1.1 (0.5, 2.6) 1.0Female 1.0 1.4 (0.7, 2.8)
Age10 to 13 1.0 1.0Older than 14 2.9 (1.1, 7.7) 1.7 (0.8, 3.3)
Family structureSingle mother 1.1 (0.5, 2.8) 1.0 (0.7, 2.8)Two parent 1.0 1.4
Achievement domainLower 75% 1.0 1.1 (0.5, 2.3)Top 25% 1.1 (0.3, 3.2) 1.0
ResilienceLower 75% 1.0 1.7 (0.8, 3.6)Top 25% 2.0 (0.6, 6.3) 1.0
RisksLower 75% 2.5 (0.8, 8.0) 2.5 (1.2, 5.5)Top 25% 1.0 1.0
a. Adolescents whose responses agreed with their mothers’ on all measures of socio-economic status were compared to the reference group in which there was at least onenonmatching response between mothers and adolescents.
at WELCH MEDICAL LIBRARY on September 2, 2010jar.sagepub.comDownloaded from

parents and adolescents. See Table 4 for the results. In Baltimore 1991, olderadolescents were almost 3 times more likely to report accurately on theirSES. In both sites, those adolescents in the top quartile on risk behavior wereabout 2½ times less likely to report accurately on their family background.However, as can be seen by the confidence intervals, only the Baltimore 1993results are statistically significant. None of the other variables were signifi-cantly related to agreement between the mother and adolescent.
Missing Data on SES Measures
As can be seen in Table 5, the percentages of missing responses to severalSES questions are relatively high. The rates of missing data are highest forfather’s education across all sites, especially if the father is not present inthe household. If the father was present, missing data ranged from 32.5% inArkansas to 12.9% in Western Maryland compared to 47.4% in Arkansasand 33.3% in Western Maryland if the father was not present. The missingrates for mother’s education range from 11.1% in Baltimore 1992 to 22.7%in Arkansas. For most questions, students in Arkansas had the highest pro-portion of missing data. The percentages of missing data are generally lessthan 10% for the financial assistance questions and are 1% or less for familystructure.
The rates of missing information for the items from the mothers’question-naires were all less than 7% except those items asking about fathers who werenot living in the household (data not shown).
Predictors of Missing Data
To identify possible factors contributing to the missing data, logistic re-gression analyses were performed comparing those who provided responsesand those who did not for mother’s education and father’s education, respec-tively, using data from the three 1992 administrations (Baltimore 1992, ruralMaryland, and rural Arkansas). Included as independent variables in bothmodels were gender, age, school site, and family structure (two-parent fami-lies vs. other); scores on three CHIP-AE™ domains (achievement, resil-ience, and risks); and the number of the 20 CHIP-AE™ subdomains thatwere missing 30% or more of the data.
The analysis indicates that all of the variables were associated with miss-ing data for maternal education except family structure and the risks domainscore (see Table 6). Boys were 1.5 times more likely than girls to have miss-ing information on maternal education. Younger adolescents were 3.0 times
Ensminger et al. / VALIDITY OF MEASURES OF SES 405
at WELCH MEDICAL LIBRARY on September 2, 2010jar.sagepub.comDownloaded from

TAB
LE
5:P
erce
nta
ge
Mis
sin
gIn
form
atio
no
nS
oci
oec
on
om
icS
tatu
sV
aria
ble
sby
Sit
e:A
do
lesc
ent
Rep
ort
Bal
timor
e19
91B
altim
ore
1992
Bal
timor
e19
93W
este
rnM
aryl
and
Ark
ansa
sTo
tal
Var
iabl
e(
N=
1,40
6)(
N=
877)
(N
=95
7)(
N=
1,87
8)(
N=
354)
(N
=5,
472)
Mot
her’s
empl
oym
ent
2.1
2.4
7.4
7.0
14.0
6.6
Fath
er’s
empl
oym
ent
Inho
useh
old
4.5
3.7
7.2
5.0
14.9
5.6
Not
inho
useh
old
35.4
31.3
36.1
28.2
40.3
33.8
Aid
toFa
mili
esw
ithD
epen
dent
Chi
ldre
n12
.34.
89.
35.
413
.68.
3F
ood
stam
ps9.
64.
66.
34.
48.
56.
4Fr
ee/r
educ
ed-c
ostl
unch
6.0
5.6
5.5
3.8
7.9
5.2
Mot
her’s
educ
atio
n16
.111
.116
.113
.322
.714
.8Fa
ther
’sed
ucat
ion
Inho
useh
old
20.9
16.7
21.9
12.9
32.5
17.2
Not
inho
useh
old
39.8
35.3
42.8
33.3
47.4
39.0
Fam
ilyty
pe0.
41.
10.
51.
10.
50.
6S
ocio
econ
omic
stat
usco
mpo
site
12.3
6.8
11.1
8.3
18.1
10.2
406
at WELCH MEDICAL LIBRARY on September 2, 2010jar.sagepub.comDownloaded from

more likely to have missing information than older adolescents. Those in theArkansas sample were 2 times as likely as those in the Baltimore 1992 orwestern Maryland samples to have missing responses. Adolescents who hadlower achievement or were less resilient were more likely to be missingmaternal education than those adolescents with higher scores on achieve-ment and resilience.
The results from the analysis of missing information on paternal educa-tion indicate that all variables are significantly associated with missing pater-nal education data except gender and risks. Adolescents who lived with bothparents were 2.8 times more likely to know their father’s education than those
Ensminger et al. / VALIDITY OF MEASURES OF SES 407
TABLE 6: Logistic Regression Results for Missing Data on Maternal and Pa-ternal Education in 1992 Sample (N = 3,109)
Maternal Education Paternal Education
Odds 95% Confidence Odds 95% ConfidenceCovariate Ratio Interval Ratio Interval
GenderMale 1.5 (1.2, 2.0) 1.0 (0.8, 1.3)Female 1.0 1.0
Age10 to 13 3.0 (2.3, 4.0) 2.0 (1.6, 2.4)Older than 14 1.0 1.0
SiteRural Maryland 1.2 (0.9, 1.6) 1.0 (1.0, 1.7)Baltimore City 1.0 1.3Arkansas 1.9 (1.3, 2.8) 1.6 (1.2, 2.2)Baltimore City 1.0 1.0
Family structureSingle mother 1.0 2.8 (2.2, 3.4)Two parent 1.3 (0.9, 1.8) 1.0
AchievementLower 75% 1.7 (1.2, 2.4) 1.5 (1.2, 2.1)Top 25% 1.0 1.0
ResilienceLower 75% 1.9 (1.4, 2.7) 2.0 (1.5, 2.6)Top 25% 1.0 1.0
RisksLower 75% 1.0 1.0Top 25% 1.0 (0.8, 1.4) 1.2 (0.9, 1.5)
Number of missingsubdomain scoresMore than 3 2.3 (1.4, 3.7) 2.1 (1.4, 3.3)0 to 2 1.0 1.0
at WELCH MEDICAL LIBRARY on September 2, 2010jar.sagepub.comDownloaded from

who did not live with both parents. Arkansas students were 1.6 times morelikely to have missing responses than those in Baltimore and those in WesternMaryland. Higher achieving and more resilient adolescents were less likelyto have missing data than their lower achieving, less resilient counterparts.Those adolescents with a higher number of missing CHIP-AE™ subdomainscores were more likely to also be missing SES information.
Correlation Among SES Measures
The Spearman’s correlations among the various adolescent measures ofSES are shown in Table 7. The highest correlations are between mother’seducation and father’s education (.49) and between Aid to Families withDependent Children (AFDC) and food stamps (.64). The SES compositescores had the highest correlations with the financial capital variables, spe-cifically, those variables indicating participation in means-tested programs.
Relation of Income to SES Measures
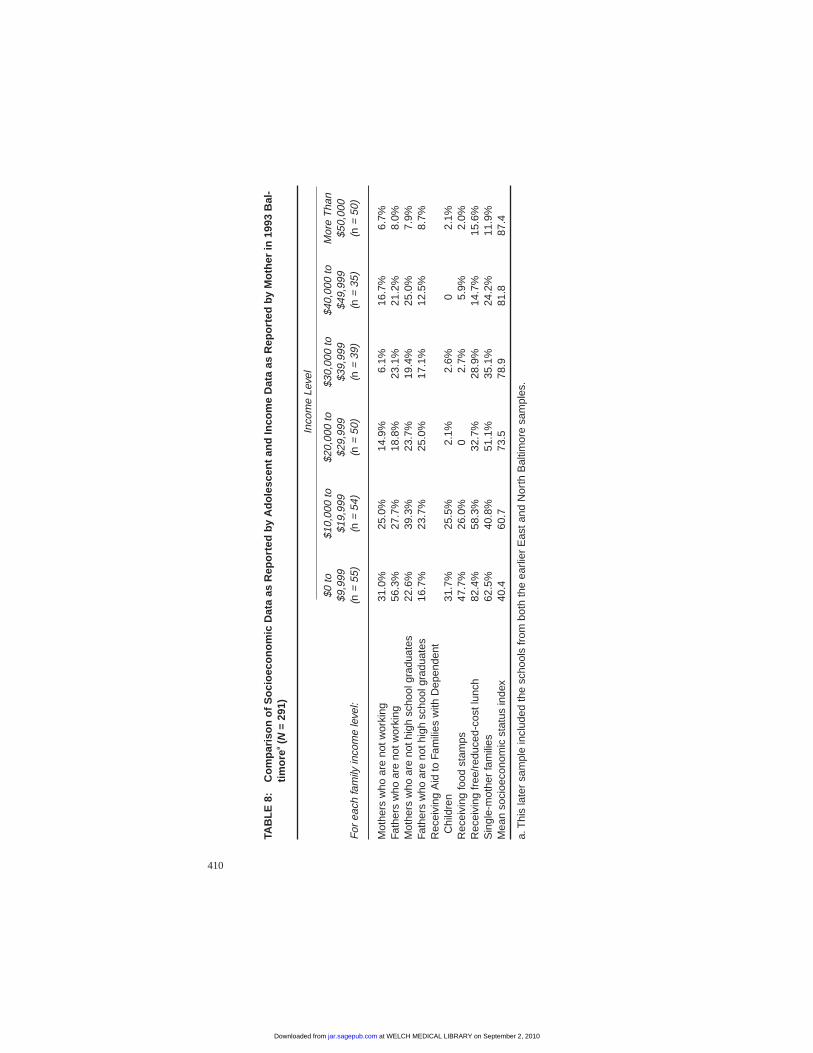
Only in Baltimore 1993 were the mothers asked to report their familyincome. Mothers’ reports of family income are strongly associated with theSES measures as reported by the adolescents (see Table 8). The higher thecategory of income, the higher the SES as indicated by the percentage receiv-ing a reduced or free lunch, percentage single mothers, and the compositeSES measure. Other measures distinguish between higher SES and lowerSES but not as finely as the three measures listed earlier. Those receivingAFDC and/or food stamps are overrepresented among those with incomesbelow $20,000 but do not discriminate among those who make more than$20,000. The percentage of mothers not working is highest in the lowestincome category (56%) and lowest in the highest income category (8%); thefour middle-income categories do not differ from one to another and rangebetween 19% and 28%.
Construct Validity: The Relationshipof SES to Health Measures
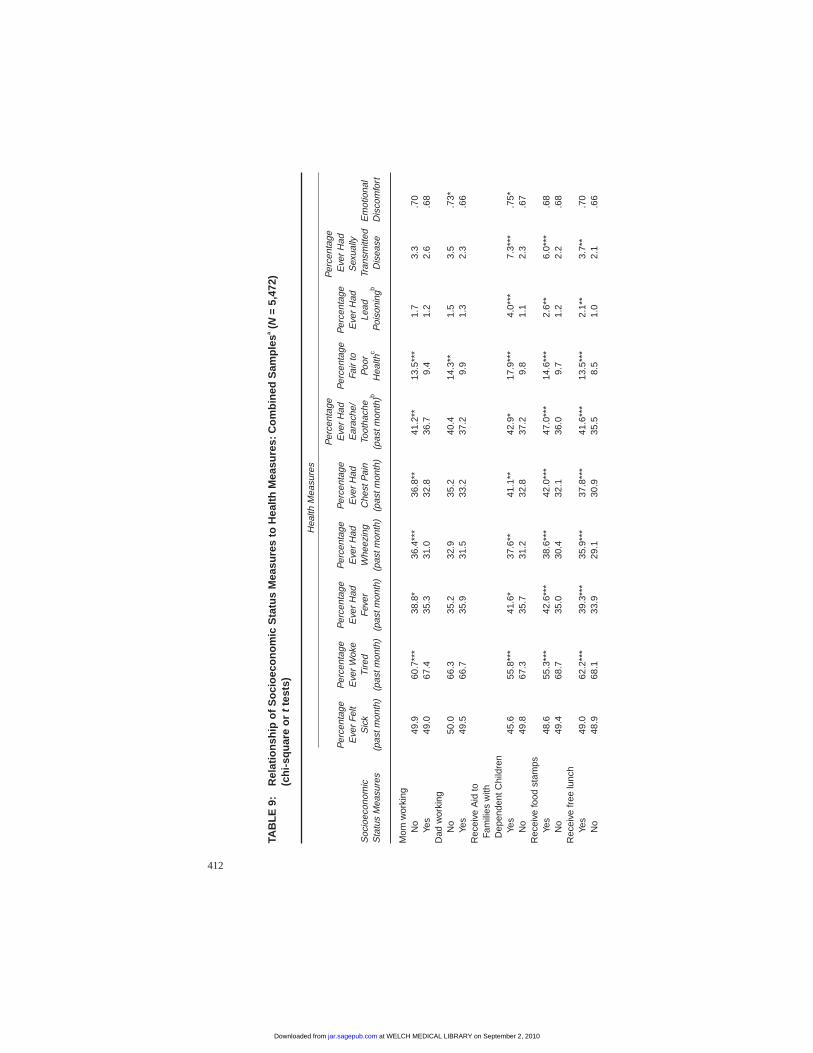
We chose 10 measures from the CHIP-AE™ health questionnaire to relateto the SES measures to examine whether the relationships we expect betweenthe measures of SES and health are present in these data. We chose healthmeasures that had sufficient frequency of occurrence and that reflected bothphysical and emotional health symptoms. They are shown in Table 9. Emo-tional discomfort is a scale consisting of seven items. As shown in Table 9,
408 JOURNAL OF ADOLESCENT RESEARCH / May 2000
at WELCH MEDICAL LIBRARY on September 2, 2010jar.sagepub.comDownloaded from

TAB
LE
7:S
pea
rman
’sC
orr
elat
ion
sB
etw
een
So
cio
eco
no
mic
Sta
tus
Var
iab
les
for
Co
mb
ined
Fiv
eS
amp
les
Aid
toFa
mili
esFr
ee/
Mot
her’s
Mot
her’s
Fath
er’s
Fath
er’s
With
Dep
ende
ntFo
odR
educ
edFa
mily
Edu
catio
nE
mpl
oym
ent
Edu
catio
nE
mpl
oym
ent
Chi
ldre
nS
tam
psLu
nch
Type
Mot
her’s
empl
oym
ent
.24
—Fa
ther
’sed
ucat
ion
.49
.12
—Fa
ther
’sem
ploy
men
t.0
8.0
8.1
8—
Aid
toFa
mili
esw
ithD
epen
dent
Chi
ldre
n.1
6.2
9.1
0.1
6—
Foo
dst
amps
.18
.28
.15
.22
.64
—Fr
ee/r
educ
ed-c
ostl
unch
.19
.20
.18
.19
.29
.40
—Fa
mily
type
.04
–.03
.02
.09
.23
.26
.26
—S
ocio
econ
omic
com
posi
tea
.24
.22
.30
.22
.43
.49
.41
.20
a.F
orea
chco
mpa
rison
,the
soci
oeco
nom
icst
atus
was
calc
ulat
edex
clud
ing
that
part
icul
arva
riabl
e.
409
at WELCH MEDICAL LIBRARY on September 2, 2010jar.sagepub.comDownloaded from
TAB
LE
8:C
om
par
iso
no
fS
oci
oec
on
om
icD
ata
asR
epo
rted
byA
do
lesc
ent
and
Inco
me
Dat
aas
Rep
ort
edby
Mo
ther
in19
93B
al-
tim
ore
a(N
=29
1)
Inco
me
Leve
l
$0to
$10,
000
to$2
0,00
0to
$30,
000
to$4
0,00
0to
Mor
eT
han
$9,9
99$1
9,99
9$2
9,99
9$3
9,99
9$4
9,99
9$5
0,00
0Fo
rea
chfa
mily
inco
me
leve
l:(n
=55
)(n
=54
)(n
=50
)(n
=39
)(n
=35
)(n
=50
)
Mot
hers
who
are
notw
orki
ng31
.0%
25.0
%14
.9%
6.1%
16.7
%6.
7%Fa
ther
sw
hoar
eno
twor
king
56.3
%27
.7%
18.8
%23
.1%
21.2
%8.
0%M
othe
rsw
hoar
eno
thig
hsc
hool
grad
uate
s22
.6%
39.3
%23
.7%
19.4
%25
.0%
7.9%
Fath
ers
who
are
noth
igh
scho
olgr
adua
tes
16.7
%23
.7%
25.0
%17
.1%
12.5
%8.
7%R
ecei
ving
Aid
toFa
mili
esw
ithD
epen
dent
Chi
ldre
n31
.7%
25.5
%2.
1%2.
6%0
2.1%
Rec
eivi
ngfo
odst
amps
47.7
%26
.0%
02.
7%5.
9%2.
0%R
ecei
ving
free
/red
uced
-cos
tlun
ch82
.4%
58.3
%32
.7%
28.9
%14
.7%
15.6
%S
ingl
e-m
othe
rfa
mili
es62
.5%
40.8
%51
.1%
35.1
%24
.2%
11.9
%M
ean
soci
oeco
nom
icst
atus
inde
x40
.460
.773
.578
.981
.887
.4
a.T
his
late
rsa
mpl
ein
clud
edth
esc
hool
sfr
ombo
thth
eea
rlier
Eas
tand
Nor
thB
altim
ore
sam
ples
.
410
at WELCH MEDICAL LIBRARY on September 2, 2010jar.sagepub.comDownloaded from

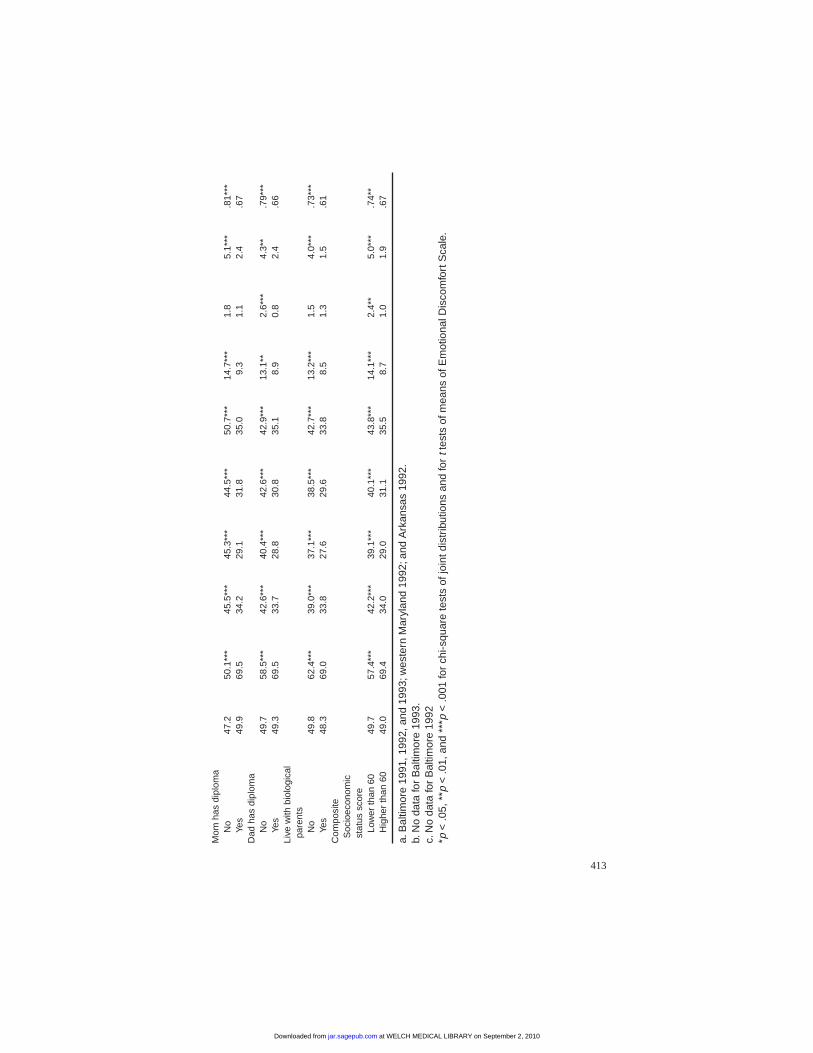
most of the health measures were related to SES in the predicted direction.For example, those adolescents reporting they were infair to poorhealth (ascompared toexcellent, very good, or goodhealth) were more likely to scorelower on every SES measure. One item was consistently related to the SESmeasures in the opposite direction to what was predicted. Those whoreported that they woke up tired in the past month were more likely to havehigher SES than those who reported that they never woke up tired. One itemwas not related to the SES measures—those who reported that they felt sickin the past month did not differ in their SES from those who reported that theyhad not felt sick. Other than these exceptions, the SES items were consis-tently related to the health measures in the predicted direction. Mothers’andfathers’ employment was related to fewer of the health items than the otherSES measures—mother’s employment related to 5 of the 10 health measures,whereas father’s employment related to 2 of the 10 measures. The other SESmeasures were related to 7 or 8 of the health measures. In general, theseresults are consistent with the theoretical proposition that measures of healthand SES are related.
SUMMARY AND DISCUSSION
Summary
The validity of the CHIP-AETMSES measures was examined. In terms ofcontent validity, the measures included a wide range of variables measuringfinancial capital, human capital, and social capital.
In terms of criterion validity, we compared the adolescents’reports of SESmeasures with their mothers’ reports. Overall, adolescents do know and areable to report this information regarding their family SES as indicated bothby the relatively high kappas (compared to other kinds of information thatmothers and adolescents report) and the percentage with perfect agreementwith mothers’ reports. We found that some adolescents—older adolescentsand those less involved in risk behaviors—were more accurate reporters oftheir SES than others.
In general, there was a small amount of missing data on the SES variables.However, those who lived in households where the father was absent weremuch less likely to answer questions concerning their fathers’ education oremployment. Older adolescents and those who do better in school were lesslikely to have missing data on the SES questions.
A traditional measure of financial capital for adults, income, was notasked of the adolescents. However, most of the adolescent-reported SES
Ensminger et al. / VALIDITY OF MEASURES OF SES 411
at WELCH MEDICAL LIBRARY on September 2, 2010jar.sagepub.comDownloaded from
TAB
LE
9:R
elat
ion
ship
of
So
cio
eco
no
mic
Sta
tus
Mea
sure
sto
Hea
lth
Mea
sure
s:C
om
bin
edS
amp
lesa
(N=
5,47
2)(c
hi-
squ
are
or
tte
sts)
Hea
lthM
easu
res
Per
cent
age
Per
cent
age
Per
cent
age
Per
cent
age
Per
cent
age
Per
cent
age
Per
cent
age
Eve
rH
adP
erce
ntag
eP
erce
ntag
eE
ver
Had
Eve
rFe
ltE
ver
Wok
eE
ver
Had
Eve
rH
adE
ver
Had
Ear
ache
/Fa
irto
Eve
rH
adS
exua
llyS
ocio
econ
omic
Sic
kT
ired
Feve
rW
heez
ing
Che
stP
ain
Toot
hach
eP
oor
Lead
Tran
smitt
edE
mot
iona
lS
tatu
sM
easu
res
(pas
tmon
th)
(pas
tmon
th)
(pas
tmon
th)
(pas
tmon
th)
(pas
tmon
th)
(pas
tmon
th)b
Hea
lthc
Poi
soni
ngb
Dis
ease
Dis
com
fort
Mom
wor
king
No
49.9
60.7
***
38.8
*36
.4**
*36
.8**
41.2
**13
.5**
*1.
73.
3.7
0Ye
s49
.067
.435
.331
.032
.836
.79.
41.
22.
6.6
8D
adw
orki
ngN
o50
.066
.335
.232
.935
.240
.414
.3**
1.5
3.5
.73*
Yes
49.5
66.7
35.9
31.5
33.2
37.2
9.9
1.3
2.3
.66
Rec
eive
Aid
toFa
mili
esw
ithD
epen
dent
Chi
ldre
nYe
s45
.655
.8**
*41
.6*
37.6
**41
.1**
42.9
*17
.9**
*4.
0***
7.3*
**.7
5*N
o49
.867
.335
.731
.232
.837
.29.
81.
12.
3.6
7R
ecei
vefo
odst
amps
Yes
48.6
55.3
***
42.6
***
38.6
***
42.0
***
47.0
***
14.6
***
2.6*
*6.
0***
.68
No
49.4
68.7
35.0
30.4
32.1
36.0
9.7
1.2
2.2
.68
Rec
eive
free
lunc
hYe
s49
.062
.2**
*39
.3**
*35
.9**
*37
.8**
*41
.6**
*13
.5**
*2.
1**
3.7*
*.7
0N
o48
.968
.133
.929
.130
.935
.58.
51.
02.
1.6
6
412
at WELCH MEDICAL LIBRARY on September 2, 2010jar.sagepub.comDownloaded from
Mom
has
dipl
oma
No
47.2
50.1
***
45.5
***
45.3
***
44.5
***
50.7
***
14.7
***
1.8
5.1*
**.8
1***
Yes
49.9
69.5
34.2
29.1
31.8
35.0
9.3
1.1
2.4
.67
Dad
has
dipl
oma
No
49.7
58.5
***
42.6
***
40.4
***
42.6
***
42.9
***
13.1
**2.
6***
4.3*
*.7
9***
Yes
49.3
69.5
33.7
28.8
30.8
35.1
8.9
0.8
2.4
.66
Live
with
biol
ogic
alpa
rent
sN
o49
.862
.4**
*39
.0**
*37
.1**
*38
.5**
*42
.7**
*13
.2**
*1.
54.
0***
.73*
**Ye
s48
.369
.033
.827
.629
.633
.88.
51.
31.
5.6
1C
ompo
site
Soc
ioec
onom
icst
atus
scor
eLo
wer
than
6049
.757
.4**
*42
.2**
*39
.1**
*40
.1**
*43
.8**
*14
.1**
*2.
4**
5.0*
**.7
4**
Hig
her
than
6049
.069
.434
.029
.031
.135
.58.
71.
01.
9.6
7
a.B
altim
ore
1991
,199
2,an
d19
93;w
este
rnM
aryl
and
1992
;and
Ark
ansa
s19
92.
b.N
oda
tafo
rB
altim
ore
1993
.c.
No
data
for
Bal
timor
e19
92*p
<.0
5,**
p<
.01,
and
***p
<.0
01fo
rch
i-squ
are
test
sof
join
tdis
trib
utio
nsan
dfo
rtt
ests
ofm
eans
ofE
mot
iona
lDis
com
fort
Sca
le.
413
at WELCH MEDICAL LIBRARY on September 2, 2010jar.sagepub.comDownloaded from

questions varied systematically and in the expected direction with mothers’reports of income. The SES composite score was highly correlated with themothers’ income report.
In terms of construct validity, the SES measures related to adolescenthealth measures in the predicted way. For seven of the nine health measures,those with higher SES were more likely to report better physical and emo-tional health.
Whose Status Should Be Measured?
Hernandez (1997) cited the change in living arrangements of children asone of the major demographic trends in recent years. These data are consis-tent with this observation and have implications for SES measures. Whereastraditionally, father’s status has been considered the most important for indi-cating other family members’ status, the number of families in which thefather was absent made it infeasible to use characteristics of the father todetermine SES of adolescents in the populations we assessed. Furthermore, ifthe father was absent, there were high rates of missing information and lowaccuracy.
Measures of Financial Capital
In study populations likely to have a full range of SES or to have an over-representation of those in the lower SES categories, as in the populations thatwe assessed, measures of participation in means-tested programs should beconsidered. These indicators—AFDC, food stamps, and free schoollunches—had fair to good agreement between the mothers and adolescents.They had low rates of missing data across the five sites. Participation inAFDC and food stamps differentiated those in the bottom income categoriesfrom those who had an income of $20,000 or more. Free or reduced-costlunch did vary in the expected way across the income levels. It was the onevariable that had higher agreement between the adolescent and mother for theyounger adolescents compared to the older adolescents—it may be thatyounger adolescents are more likely to participate and so therefore are able tomore accurately report on their family’s participation. These measures wereconsistently related to the health measures.
Although we share concerns about different criteria and inconsistentenrollment in means-tested programs, we observed much consistency in thisvariable with other available data. Those in rural Arkansas reported the mostparticipation in this program, but those in rural Arkansas also reported lowerSES on most other indicators as well. In addition, the relationship to the
414 JOURNAL OF ADOLESCENT RESEARCH / May 2000
at WELCH MEDICAL LIBRARY on September 2, 2010jar.sagepub.comDownloaded from

income level was fairly direct with 82% of the adolescents in the lowestincome level reporting participation in free/reduced-cost lunch with decreas-ing participation with higher income levels so that only 15% to 16% reportparticipation in the two highest income categories. Because of its relationshipto other measures of SES and its low rates of missing data, we are not as readyto dismiss this measure of SES level as Entwisle and Astone (1994) andHauser (1994), especially for studies that are local or regional rather thannational in scope.
For mother’s employment, we found strong agreement between adoles-cents and their mothers and relatively low rates of missing information. It wasrelated to family income. Father’s employment was the weakest of the finan-cial capital measures. It was not related to income as reported by the mothers.Across the five samples, the proportion of fathers who were not employedonly varied by a small percentage—from about 11% to 15%. Because mostfathers were working, the influence of father’s employment on familyresources may be due to whether the father is present in the household and tothe wages or salary that the father makes from his job. The two employmentvariables were least likely to be related to the health measures.
Measures of Human Capital
Agreement between the mother and adolescent on mother’s and father’seducation was in the good to excellent range. The big drawback was the rela-tively higher number of missing data compared to the other measures.Mother’s and father’s education were moderately correlated with each other(.49). Furthermore, education seemed to be measuring aspects of SES thatwere independent of the other measures as indicated by relatively low corre-lation coefficients with the other SES variables.
Despite the higher rates of missing information on parents’education, wethink these items should be included in adolescent-reported measures of SESbecause of the long history as a measure of family background influencingadolescent achievement and health outcomes. Further work is needed todevelop assessment procedures that may improve the adolescents’ ability torecall or estimate their parents’ education.
Measures of Social Capital
Family structure worked well as a measure of social capital. It had thehighest agreement between mothers and adolescents and the least missingdata of all the measures. Being from a single-parent family (almost alwaysmother-only families) was predictive of missing information on father’s edu-
Ensminger et al. / VALIDITY OF MEASURES OF SES 415
at WELCH MEDICAL LIBRARY on September 2, 2010jar.sagepub.comDownloaded from

cation and employment measures, as we would expect. Family structure hada strong direct relationship with maternal reports of income level in Balti-more 1993 with 63% of the lowest income category being in a single-parentfamily compared to only 12% of those in the highest income category. Thepercentage of adolescents living with both biological parents varied littleacross the sites except that those in rural Maryland were more likely to reportliving with both parents than those in the other four sites.
SES Composite
We were not able to evaluate the SES composite measure by examiningthe agreement between adolescents and mothers because mothers were notasked as many of the SES measures as the adolescents. However, in the onesite where mothers were asked income, there was a direct linear relationshipbetween the SES composite from the adolescent reports and income level asreported by the mother (r= .65,p < .001). The correlations between the SEScomposite score and the other seven SES measures were relatively high andranked either first or second for five of the seven SES measures. (The correla-tions between the SES composite and each variable excluded the target vari-able in the composite score for that correlation.) Furthermore, it was consis-tently related to the health measures.
An adolescent composite measure may be useful as a way to overcomedifficulties in the limited information that adolescents can report. We wereable to construct a composite measure of SES with meaningful distributionsthat related to family income. Because income is not likely to be known byadolescents, the SES composite may prove useful as a proxy measure forfinancial capital.
Strengths and Limitations
The study has several important strengths. It was conducted in five sitesand involved a large number of adolescents. Both adolescents and motherswere assessed. There was a sufficient range of both SES and health measuresincluded in the study. Although the population was not a nationally represen-tative sample, there was considerable diversity among the adolescentsincluding both rural and urban, White and Black, younger and older, andmale and female adolescents.
Whereas there are many strengths to this study, there are also limitations.The samples were concentrated at the middle to lower SES levels; under-standing how these measures might work in upper-middle class or upper-class samples cannot be determined from these analyses. Three of the seven
416 JOURNAL OF ADOLESCENT RESEARCH / May 2000
at WELCH MEDICAL LIBRARY on September 2, 2010jar.sagepub.comDownloaded from

measures related to participation in means-tested programs. These measuresare unlikely to be useful in samples with higher SES. In terms of ethnicity,Whites and African Americans were represented, but there were few Hispan-ics or Asian Americans. Regional representation was also lacking—all butone of the five samples were from the middle-Atlantic region, and althoughthere were urban and rural sites, there were none from suburban areas.
The study procedures did not test different methods of data collection. Forexample, the Entwisle and Astone (1994) discussion implicitly assumed thatSES questions will be asked in an interview. Self-administered question-naires are most frequently used to collect data from adolescents and wereemployed in this study; the findings are most applicable to that method ofdata collection.
Implications
Increasingly, studies of health, educational attainment, and risk-takingbehaviors show differences by socioeconomic status. Yet, few studies haveconsidered how SES may best be measured among adolescents. The findingsfrom this study indicate that adolescents have relatively high agreement withtheir mothers on basic background information. Their reports of their SESrelated to their mother’s reports of the families’ SES. However, adolescentsdo vary in how well they are able to report on SES characteristics by age, fam-ily structure, school performance, and risk-taking behavior. We need morestudy of whether and how these variations may affect our substantive conclu-sions. We also need more work on how we can improve the accuracy ofreporting by adolescents and how adolescent reports can be supplementedwith other information from parents and schools.
REFERENCES
Alwin, D. F., & Thornton, A. (1984). Family origins and the schooling process: Early versus lateinfluence of parental characteristics.American Sociological Review, 49, 784-802.
Bidwell, C. E., & Friedkin, N. E. (1989). The sociology of education. In N. J. Smelser (Ed.),Handbook of sociology(pp. 449-472). Newbury Park, CA: Sage.
Blau, P. M., & Duncan, O. D. (1967).The American occupational structure. New York: JohnWiley.
Carmines, E. G., & Zeller, R. A. (1979).Reliability and validity assessment. Beverly Hills, CA:Sage.
Coleman, J. S. (1988). Social capital in the creation of human capital.American Journal of Soci-ology, 94(Suppl.), S95-S120.
Coser, L. A. (1965). The sociology of poverty.Social Problems,13, 140-148.
Ensminger et al. / VALIDITY OF MEASURES OF SES 417
at WELCH MEDICAL LIBRARY on September 2, 2010jar.sagepub.comDownloaded from
Demo, D. H., & Acock, A. C. (1996). Family structure, family process, and adolescent well-being.Journal of Research on Adolescence, 6, 457-488.
Duncan, G. J. (1984).Years of poverty/years of plenty. Ann Arbor, MI: University of MichiganPress.
Entwisle, D. R., & Astone, N. M. (1994). Some practical guidelines for measuring youth’s race/ethnicity and socioeconomic status.Child Development,65, 1521-1540.
Fleiss, J. L. (1981).Statistical methods for rates and proportions. New York: John Wiley.Hauser, R. M. (1994). Measuring socioeconomic status in studies of child development.Child
Development,65, 1541-1545.Hernandez, D. J. (1997). Child development and the social demography of childhood.Child
Development,68, 149-169.Liberatos, P., Link, B. G., & Kelsey, J. L. (1988). The measurement of social class in epidemiol-
ogy.Epidemiologic Reviews,10, 87-121.Looker, E. D. (1989). Accuracy of proxy reports of parental status characteristics.Sociology of
Education,62, 257-276.Mechanic, D. (1989). Socioeconomic status and health: An examination of underlying
processes. In J. P. Bunker, D. S. Gomby, & B. S. Kehrer (Eds.),Pathways to health: The roleof social factors(pp. 9-26). Menlo Park, CA: Henry J. Kaiser Family Foundation.
Simmel, G. (1965). The Poor.Social Problems,13, 118-140.Starfield, B., Bergner, M., Ensminger, M. E., Riley, A. W., Ryan, S., Green, B. F., McGauhey, P.,
Skinner, A., & Kim, S. (1993). Adolescent health status measurement: Development of theChild Health and Illness Profiles.Pediatrics,91, 430-435.
Starfield, B., Ensminger, M. E., Green, B. F., Riley, A. W., Ryan, S., Kim-Harris S., Crawford, K.V., & Johnston, D. (1995).The Child Health and Illness Profile: Adolescent edition™(CHIP-AE™) manual. Baltimore, MD: Johns Hopkins University Press.
Starfield, B., Riley, A. W., Green, B. F., Ensminger, M. E., Ryan, S., Kelleher, K., Kim-Harris, S.,Johnston, D., & Vogel, K. (1995). The adolescent Child Health and Illness Profile: Apopulation-based measure of health.Medical Care, 33, 553-566.
Margaret E. Ensminger, Ph.D., is a professor in the Department of Health Policy andManagement, School of Public Health, Johns Hopkins University. She is a sociologistinterested in the impact of early social resources and family environments on later healthand behavior outcomes.
Christopher B. Forrest, M.D., Ph.D., is an assistant professor in the Department ofHealth Policy and Management, School of Public Health, Johns Hopkins University. Heis a pediatrician who focuses on the impact of health services on the health of childrenand youth.
Anne W. Riley, Ph.D., is an associate professor in the Department of Health Policy andManagement, School of Public Health, Johns Hopkins University. She is a clinical psy-chologist focused on the mental health and social functioning aspects of the measure-ment of health status and access to mental health care by youth.
Myungsa Kang, M.H.S., is a medical student at the University of Albany, State Universityof New York.
418 JOURNAL OF ADOLESCENT RESEARCH / May 2000
at WELCH MEDICAL LIBRARY on September 2, 2010jar.sagepub.comDownloaded from

Bert F. Green, Ph.D., is a professor of psychology at Johns Hopkins University. As a psy-chologist, he has been a leader in the field of psychometric analysis.
Barbara Starfield, M.D., M.P.H., is University Distinguished Service Professor in theDepartment of Health Policy and Management, School of Public Health, Johns HopkinsUniversity. She has a long-standing interest in the impact of social inequality on thehealth status of children and adolescents.
Sheryl A. Ryan, M.D., is in the Department of Pediatrics, Rochester General Hospital,Rochester, New York. She is an adolescent medicine specialist interested in factors re-lated to access to care.
Ensminger et al. / VALIDITY OF MEASURES OF SES 419
at WELCH MEDICAL LIBRARY on September 2, 2010jar.sagepub.comDownloaded from