the validation study of the persistent academic … · the validation study of the persistent...
TRANSCRIPT

The Validation Study of the Persistent Academic Possible Selves Scale
for Adolescents
by
Ji Eun Lee
A Dissertation Presented in Partial Fulfillment
of the Requirements for the Degree
Doctor of Philosophy
Approved July 2013 by the
Graduate Supervisory Committee:
Jenefer Husman, Chair
Samuel Green
Roger Millsap
Sarah Brem
ARIZONA STATE UNIVERSITY
August 2013
i
ABSTRACT
Possible selves researchers have uncovered many issues associated with the
current possible selves measures. For instance, one of the most famous possible selves
measures, Oyserman (2004)’s open-ended possible selves, has proven to be difficult to
score reliably and also involves laborious scoring procedures. Therefore, this study was
initiated to develop a close-ended measure, called the Persistent Academic Possible
Selves Scale for Adolescents (PAPSS), that meets these challenges. The PAPSS
integrates possible selves theories (personal and social identities) and educational
psychology (self-regulation in social cognitive theory). Four hundred and ninety five
junior high and high school students participated in the validation study of the PAPSS. I
conducted confirmatory factor analyses (CFA) to compare fit for a baseline model to the
hypothesized models using Mplus version 7 (Muthén & Muthén, 2012). A weighted least
square means and a variance adjusted (WLSMV) estimation method was used for
handling multivariate nonnormality of ordered categorical data. The final PAPSS has
validity evidence based on the internal structure. The factor structure is composed of
three goal-driven factors, one self-regulated factor that focuses on peers, and four self-
regulated factors that emphasize the self. Oyserman (2004)’s open-ended questionnaire
was used for exploring the evidence of convergent validity. Many issues regarding
Oyserman (2003)’s instructions were found during the coding process of academic
plausibility. It was complicated to detect hidden academic possible selves and strategies
from non-academic possible selves and strategies. Also, interpersonal related strategies
were over weighted in the scoring process compared to interpersonal related academic
possible selves. The study results uncovered that all of the academic goal-related factors

ii
in the PAPSS are significantly related to academic plausibility in a positive direction.
However, self-regulated factors in the PAPSS are not. The correlation results between the
self-regulated factors and academic plausibility do not provide the evidence of
convergent validity. Theoretical and methodological explanations for the test results are
discussed.

iii
DEDICATION
I dedicate this dissertation to my God and Lord.
Father, take all the accomplishments because I know it's not from what I've done
but from your graciousness.

iv
ACKNOWLEDGMENTS
First of all, I would like to thank God. I love the Lord my God with all my heart
and with all my soul and with all my strength. Use me for your glory and let my life
honor you.
I gratefully acknowledge endless academic inspiration and utmost motivation of
my chair, Dr. Jenefer Husman. She is a true mentor and role model and I will never forget
her priceless support throughout my graduate program. I also want to acknowledge
profound scholarship and generous support of my committee members, Dr. Samuel
Green, Dr. Sarah Brem, and Dr. Roger Millsap.
I would like to thank my family members, Gaejin Lee (Father), Yoonsoo Lee
(Mother), Jisoo Lee (Sister), Seungbum Lee (Brother), and Eunsoo Lee (Aunt). I thank
my dear friends, Bhujon Kang, Eunae Kim, Jaeyeol Shin, Eunyeo Kim, Glenda Stump,
Yuning Xu, and Liz Barnes. Without their kind support, I would not have been able to
complete this project.
I appreciate support from the GPSA JumpStart Research Grant, GPSA Research
Support Program, and ABOR Doctoral Research Grant Program. My dissertation was
also supported by the National Science Foundation (NSF) under No. EHR- 0546856 and
EHR-0833773. Any opinions, findings and conclusions or recommendations expressed in
this material are those of the author and do not necessarily reflect those of NSF.

v
TABLE OF CONTENTS
Page
LIST OF TABLES………………………………………………………………………..ix
LIST OF FIGURES……………………………………………………………………….x
CHAPTER
1 INTRODUCTION…………………………………………………………… 1
2 LITERATURE REVIEW……………………………………………………..4
Possible Selves……………………………………………………………..5
Operationalization……………………………………………...…..5
Measurement Issues………………………………………………..5
Self-regulation in Possible Selves Research...……………………………...7
Operationalization……………………………………………...…..7
Measurement Issues………………………………………………..8
Identity, Self-concept, and the Self…………………………………………9
Social Identity…………………………………………………………….10
Personal Identity…………………………………………………………..11
Identity-based Motivation Model…………………………………………12
Social Cognitive Theory…………………………………………………..14
Self-regulation………………………………………………….....16
Self-regulated Learning Strategies…..…………………………....18
Social Cognitive Theory vs. Possible Selves.……………………..19
The Purpose of the Study…………………………………………………19
Research Questions……………………………………………………….20

vi
CHAPTER Page
3 ITEM DESIGN AND PILOT STUDY……………………………….……...21
Academic Possible Selves Categories………….………………….……...21
The Initial Item Revisions………………………………………………...24
The Pilot Study………………………………………………....................24
4 DISSERTATION STUDY METHOD………………………………………25
Procedure………………………………………………………………….25
Engineering Summer Camps ….……………………………….....25
Public Schools ……………..….……………………………….....25
Participants……………………………………………………………..…26
Measures……………………………………………………....………..…27
The Persistent Academic Possible Selves Scale for Adolescents…27
Oyserman’s Open-ended Possible Selves Questionnaire...…….....27
Quantitative Data Analysis…..………………………………....................28
Confirmatory Factor Analysis..........................................................28
Internal Construct Validity Evidence.….…….................................28
Convergent Validity Evidence…..……………………….…….....29
Qualitative Data Analysis …..……………………………….....................30
Content Analysis of Academic Plausibility…………...….…….....30
5 DISSERTATION STUDY RESULTS………………………………………36
The Final Scale…………..………………………………………………..36
Construct …………...….……..........................................................36
Scoring…………………………………...…………...….…….....36

vii
CHAPTER Page
Items……………………………………..…………...….…….....36
Internal Construct Validity Evidence……………………………………..37
Baseline Model..……………….……..............................................37
Academic Possible Goal Model…...……....…………….…….......38
Three Factor Model I…………………….……………….…….....38
Three Factor Model II…………………...……………….…….....39
Five Factor Model....…………………….……………….…….....40
Six Factor Model…………...…………………………….…….....42
Complex Factor Model…...……......………….………….…….....44
More Complex Factor Model…………………………….…….....46
Reduced Complex Factor Model……....……………….……........48
More Reduced Complex Factor Model.......…………………........50
Final Reduced Complex Factor Model..………………….…….....52
Convergent Validity Evidence………………….……………….…….....54
6 DISCUSSION….…………………………………….……………………... 57
Implications of the Study………………………………………………….57
Future Directions………………………………………………………….62
REFERENCES……………………………………………………………………………64
APPENDIX
A DESCRIPTIVE STATISTICS……………………………………………. 69
B THE PERSISTENT ACADEMIC POSSIBLE SELVES SCALE FOR
ADOELSCENTS (PAPSS)………………………………………………73

viii
APPENDIX Page
C STANDARDIZED FACTOR LOADINGS……………………………….77
D POLYCHORIC CORRELATION MATRIX..…………………………….81
E IRB APPROVAL LETTERS………………..……….…………………….89

ix
LIST OF TABLES
Table Page
1. Domains and Examples for Positive and Negative Possible Selves…………21
2. Categories of Academic Possible Selves………………………………...…..22
3. Factor Correlations…………………………………………………………..54

x
LIST OF FIGURES
Figure Page
1. Baseline Model……………………………………………………….……...37
2. Academic Possible Goal Model……………………………………………...38
3. Three Factor Model I…………...……………………………………………39
4. Three Factor Model II ……………...………………………………………..40
5. Five Factor Model....………………………………………………………....41
6. Six Factor Model ………...……..…………………………………………...43
7. Complex Factor Model………………………………………………………45
8. More Complex Factor Model ……………………………………………….47
9. Reduced Complex Factor Model…………………………………………….49
10. More Reduced Complex Factor Model.……………………………………..51
11. Final Reduced Complex Factor Model ……………………………………...53
12. Convergent Model………………….………………………………………..56
1
Chapter 1
INTRODUCTION
Possible selves refer to one’s temporal goals in a future state or one’s clear picture
of their future possibilities (Oyserman & Fryberg, 2006; Oyserman & James, 2008).
Researchers demonstrated that adolescents can differentiate between positive possible
selves, what they expect to become next year, and negative possible selves, what they
want to avoid having next year (e.g., Oyserman, Terry, & Bybee, 2002; Oyserman,
Bybee, & Terry, 2006). Researchers argue that adolescents can achieve positive possible
selves and prevent negative possible selves by self-regulation associated with these
possible selves (Oyserman & James, 2008).
While I was working for the CompuGirls: A Culturally Relevant Technology
Program for Girls (NSF: 0833773) as a research assistant, I administered Oyserman
(2004)’s open-ended possible selves questionnaire and coded the data for both the
program participants and control group. My colleagues and I discovered that coding the
girls’ open-ended responses had many challenges, such as difficulties in reliable scoring
and laborious scoring procedures (Lee, Husman, Maez, & Scott, 2011). We also
uncovered that analyzing the longitudinal data of academic possible selves and strategies
has problems due to limited in-depth information. The students generated very general
academic possible selves (e.g., 7th
grader) and strategies (e.g., going to school) over time.
(Lee et al., 2011).
Therefore, I reviewed the possible selves literature, focusing on measures of
possible selves and strategies to achieve these possible selves. First, I uncovered that
researchers measured possible selves using diverse operationalization (e.g., hope-for

2
selves vs. expected selves). Second, researchers coded possible selves and strategies
using different coding procedures (e.g., simple counting vs. complex coding schemes).
Third, there is no standard time framework for measuring possible selves (e.g., next year
vs. in the future). Fourth, current close-ended measures of possible selves and strategies
have not extensively incorporated empirical findings such as the role of social identities
(e.g., Kemmelmeier & Oyserman, 2001). Based on the reviews, I argue that open-ended
possible selves measures have shortcomings such as complex instructions used to
produce reliable scoring and laborious scoring procedures. Moreover, a majority of close-
ended possible selves measures have not incorporated sufficient empirical findings (Lee
& Husman, 2012).
More recently, Oyserman (2007) proposed the identity-based motivation model.
The identity-based motivation model has been invented under social psychology and has
adopted social identity, personal identity, and social cognition theories (Oyserman, 2007;
Oyserman & Destin, 2010). The identity-based motivation model aims to describe the
process of actualization of possible selves or possible identities by means of self-
regulation. However, there is no questionnaire that was specifically developed to measure
the identity-based motivation (Oyserman & James, 2011). As a result, I decided to
develop a close-ended measure of the Persistent Academic Possible Selves Scale for
Adolescents (PAPSS) which incorporates important components such as social and
personal identities as well as self-regulation.
I adopted social cognitive theory to develop the items associated with self-
regulation. Social cognitive theory was originated from Albert Bandura and applied to
educational settings in the 1980s by Dale Schunk (Bandura & Schunk, 1981).

3
Educational psychologists have long investigated the process of goals, self-regulation,
and self-reflection in academic settings (Zimmerman & Martinez-Pons, 2007).
Zimmerman (2000)’s forethought phase and performance phase in self-regulated learning
strategies had been utilized in the item generation process. To explore the validity
evidence of the internal structure, I will use confirmatory factor analysis (CFA) to
compare fit of a baseline model and the hypothesized models. I will correlate Oyserman
(2003)’s academic plausibility and the final factors in the PAPSS to examine validity
evidence of the relations to other measures. In the next chapter, I will explain the
theoretical framework and empirical findings of academic possible selves and self-
regulation in both possible selves and social cognitive research.

4
Chapter 2
LITERATURE REVIEW
Impoverished adolescents experience greater difficulties developing academic
possible selves and conducting actions to achieve those possible selves compared to other
adolescents. For example, if a student, we will call her Cecelia, has no family members
with a postsecondary degree, she may not think that a college education is important for
her future, whereas her friend whose parents have postsecondary degrees, may see a
postsecondary degree as an unquestionably vital part of her future plans. Even if Cecelia
were to attend college, she is likely to encounter special challenges unique to her
socioeconomic situation, such as limited resources. She may even harbor guilt as a result
of not being able to take care of her younger siblings at home because she had to study
for the SATs.
Many adolescents from minority groups in the United States live in poverty, and
both their socioeconomic status and membership in a marginalized group creates
significant challenges for these students when pursuing their future academic goals
(Oyserman & Fryberg, 2006). In fact, research has shown that students who come from
economically stressed families often do not envision themselves as academically
successful adults and have difficulty developing and exerting academic self-regulation
(Oyserman & Fryberg, 2006; Oyserman 2013). On the other hand, other researchers have
found that minority students from low-income families frequently report high academic
aspirations. However, when these students do not also possess an education-related adult
identity, they are less likely to spend time on studying (Destin & Oyserman, 2010).
Possible selves researchers have investigated how adolescents can project, pursue, and

5
attain academic possible selves in spite of limited success, personally or vicariously,
through family and friends.
Possible Selves
Operationalization. Possible selves are temporal goals in a future state or clear
pictures of one’s possible future (Oyserman & Fryberg, 2006; Oyserman & James, 2008).
Salient possible selves can guide individuals’ current self-regulation toward achieving
their future goals (Oyserman, Bybee, Terry, & Hart-Johnson, 2004). Possible selves have
been widely studied in many areas under psychology since the mid-1980s (Packard &
Conway, 2006). Empirical study results reveal that adolescents can express their positive
possible selves, such as what they want to achieve and what they would like to become in
the future. Also, adolescents can state negative possible selves, such as what they want to
avoid having or becoming in the future (Oyserman et al. 2002; Oyserman et al. 2006).
Given that possible selves can be positive or negative, researchers argue that possible
selves are distinct from fantasies or dreams, which are more likely to be used to induce a
positive mood, to distract from negative thoughts, or to directly oppose them (Oyserman
& Fryberg, 2006).
Measurement issues. Recently, many issues regarding the measurement of future
possible selves have been identified. The first issue is the use of arbitrary time
frameworks for measuring possible selves (Oyserman & Fryberg, 2006). Researchers
have measured possible selves using diverse time frameworks: abstract time (e.g., “the
future”), exact time (e.g., “next year”), or developmental stages (e.g., “as adults”).
Consequently, definitions of possible selves have been operationalized using different
time frameworks, creating challenges in generalizing the research findings. In general,

6
“next year” is widely used for measuring academic possible selves (e.g., Oyserman et al.,
2002; 2006) and “in the future” is often used for measuring various possible selves (e.g.,
Leondari, Syngollitou, & Kiosseoglou, 1998). However, there is no standardized time
framework for measuring possible selves at the present, and few researchers have tested
impacts of different time frameworks associated with possible selves measures
(Oyserman & Fryberg, 2006).
The second issue arises in coding open-ended possible selves measures.
Researchers conducting possible selves studies use either open-ended or close-ended
measures (Oyserman & Fryberg, 2006). One of the most widely-used measures in
possible selves research is Oyserman (2004)’s open-ended questionnaire (Oyserman et
al., 2002; 2006). However, open-ended measures have well-known challenges such as
difficulty in achieving reliable scoring and laborious scoring procedures (Reynolds,
Livingston, & Willson, 2009). Longitudinally, problems relating to reliability of Oyserman
(2004)’s open-ended questionnaire have been documented (Lee et al., 2011).
The third issue is limited in-depth information gathered by possible selves
measures (Lee et al., 2011). When my colleagues and I analyzed academic possible
selves in girls of color during a two-year intervention program, we found that the girls’
responses were very general (e.g., I want to be a 7th grader next year). We cannot know
from this whether the students' future possible selves are not well-developed, or whether
the students have more detailed and specific models that the open-ended measure fails to
elicit. Therefore, we recommended further investigation to explore the effects of gender
and ethnicity on the outcome space of the questionnaire (Lee et al., 2011).

7
Finally, there is no close-ended measure which is adequately grounded in both
theoretical positions and empirical findings (Lee & Husman, 2012). Although possible
selves researchers have discovered and posited many factors that significantly impact
actualization of possible selves, existing close-ended measures do not reflect these
hypotheses and findings sufficiently. Thus, possible selves researchers need a close-
ended measure that more fully identifies and explains students’ academic possible selves
and self-regulation to achieve their possible selves. Students’ response to the measure
should also reflect the reciprocal relationship between possible selves and self-regulation.
Self-regulation in Possible Selves Research
Operationalization. Possible selves researchers have investigated the influence
of self-regulation on students' achievement of possible selves (Oyserman & James, 2008).
Many researchers did not distinguish self-regulation from possible selves (e.g.,
Anderman, Anderman, & Griesinger, 1999; Leondari et al., 1998). However, Oyserman
and her colleagues demonstrated the need to separate self-regulation from expected and
avoided possible selves. Oyserman and her colleagues operationalized self-regulation as
“the extent to which achievement possible selves and the strategies connected to them
were plausibly self-regulating” (Oyserman et al., 2004; p. 136). In this notion, more
academic possible selves and relevant strategies mean higher plausibility of conducting
self-regulation.
Researchers have used Oyserman (2004)’s open-ended questionnaire to measure
self-regulation (e.g., Oyserman et al., 2004). Students first describe a positive possible
self (i.e., a future goal in the next year). Then, the students are asked to describe their
current actions to achieve the possible self. They repeat the same procedure four times to

8
answer a maximum number of four positive possible selves and strategies. Next, the
students are asked to write a negative possible self (i.e., a future concern in the next year).
Then, they are asked to describe their current actions to avoid actualizing the negative
possible self. The students repeat the same procedure four times to write a maximum
number of four negative possible selves and strategies. Students can leave blanks if they
cannot provide four of each type of possible self. Students are also allowed to leave
blanks for a strategy if they are not taking any particular steps to achieve or avoid a
possible self.
Measurement issues. Measuring possible selves and self-regulation in this
manner raises several issues. First, it is uncertain how a student links possible selves to
actions. A student may state a goal, and only then consider how they might reach it,
choosing any current activity that can be somehow related to the goal, even if the link is
tenuous or unclear. For example, a student might state the goal of becoming tech savvy
next year, and then start searching his current activities for something relevant to this
goal. He might choose a current action that has some relationship with the possible self
(e.g., playing a computer game every day), but the link between playing computer games
and becoming tech savvy is left unexplained and unexamined as to whether it is likely to
help the student achieve his goal.
Second, how to evaluate self-regulation is also questionable. Oyserman and her
colleagues have examined self-regulation either using a simple procedure (e.g., counting
the numbers of self-regulative strategies) or applying for a complex coding scheme (e.g.,
how plausible the strategy is to achieve a possible self). Study results demonstrated that
self-regulation scores from the complex coding scheme have more power to predict

9
students’ academic behaviors (e.g., spending more time on homework) than those
resulting from the simpler procedure (Oyserman et al, 2004). It is reasonable that the
quantity of strategies functions differently from the quality of strategies, but how to best
take each of these into consideration has not yet been determined. Although possible
selves researchers have considered linkages between possible selves and self-regulation,
many unanswered questions still exist in theoretical and methodological perspectives.
Identity, Self-concept, and the Self
Research in self-concept and identity have focused on elemental inquiries such as
“Who am I?,” “Where do I belong?,” and “How do I fit (or fit in)?” (Oyserman, 2001, p.
499). Oyserman and her colleagues have published extensively on identity, self-concept,
and the self, as well as clarifying these terminologies (e.g., Oyserman, 2001; Oyserman,
Elmore, & Smith, 2012). Oyserman and her colleagues view identities as determinants
(e.g., traits, characteristics, relationships, and social roles) that we can use when we judge
who we are (Oyserman et al., 2012). Self-concepts are composed of many different
identities and the perceptions of who we are. For example, adolescents can differentiate
their academic self-concepts in diverse subject areas (Marsh, 2007, Marsh, Byrne, &
Shavelson, 1988). All kinds of self-relevant information (e.g., self-images and self-
feelings) can be subsumed under a global notion of the self (James, 1890/1963;
Oyserman et al., 2012).
Whereas social identities emphasize social contexts (e.g., socioeconomic status)
and social group memberships (e.g., gender and age), cultural identities focus on genetic
and historical aspects of the self, such as Asian versus Western cultures (Oyserman,

10
2007). In possible selves theory, social and cultural identities can manifest as preferred or
persistent social group memberships. Oyserman (2007) articulated that:
It seems reasonable that social identity and cultural perspectives be integrated to
provide an identity-based sociocultural model of motivation, in
which content of self-concept differs both chronically (based on differences in
cultural milieu) and momentarily (based on momentary salience of social roles or
group memberships; p. 436).
I adopted Oyserman’s notions and regard social identity and/or social identities as salient
social group memberships that one possesses at the present.
Social Identity
Social identity is one’s perception of his or her social group memberships, which
play a role in one’s plans and also guides a person's choices regarding goals and actions
(Oyserman, 2007). Social identity influences the strength of the relationship between
future possible selves and the current self (Oyserman, 2007). When one’s social identity
does not support specific future selves, a person often devalues efforts that are needed for
pursuing the possible selves. In addition, the gap between social identity and possible
selves affect the implementation of self-regulation. For example, when a student aims for
studying better at home, which is at odds with the actions of her sociable parents, who are
frequently having parties at home, she may undervalue studying at home or abandon the
goal altogether. Thus, Oyserman (2007; 2008) has argued that social identity is essential
to not only create possible selves but also to develop self-regulation to achieve these
possible selves.

11
The reciprocal, sometimes incompatible, relationships between social identity,
possible selves, and self-regulation can be applied to many settings and groups, including
women in engineering programs, especially women of color. Women of color have been
under-represented in most undergraduate engineering programs (Riegle-Crumb & King,
2010; Seymour & Hewitt, 1997). For example, even when a girl of color has maintained a
desire to become an engineer throughout her youth, participating in numerous
engineering camps and entering a college of engineering, she may here encounter
challenges not previously experienced. A lack of social support may make her feel
“unwelcome” in the college and this conflict between her environment and identity may
negatively affect her ability to use self-regulation strategies to survive the challenging
curriculums in the college. Girls of color often struggle with the perceived mismatch
between their social identity and engineering identity. Additional support to encourage
these women to persist in postsecondary engineering education is needed (American
Association of University Women, 2010).
Personal Identity
People develop distinctive personal identities but are still greatly influenced by
their social identities (Oyserman, 2007). For example, if a white male student wants to
become a mechanical engineer (a possible self), as an extension of perceiving himself to
be a smart student (personal identity), the origin of his possible self may be traced to his
engineer father or friends who want to become mechanical engineers (social identity).
Thus, Oyserman (2007) claimed that both social and personal identities are important to
actualize possible selves. Destin and Oyserman (2009) found that when adolescents are
focused on routes of open access to college (e.g., financial aid), they are willing to study

12
more time than adolescents focusing on reasons why access may be limited (e.g., tuition).
Oyserman and her colleagues developed and implemented a 9-week possible
selves intervention program (School-to-Jobs intervention; Oyserman et al., 2002). The
intervention study results demonstrated that changes in students' possible selves can
promote academic behaviors regardless of changes in their social group memberships.
Before the program, academic perceptions held by the program participants and control
group students were not significantly different. However, at the end of the program, the
participants exceeded the control group students on many academic performance
variables (Oyserman et al., 2002). The study results indicated possible selves can change
one’s personal identity without changing their social group memberships.
Identity-based Motivation Model
Oyserman and her colleagues postulated that if adolescents can develop, employ,
and monitor self-regulation, they are more likely to achieve positive possible selves and
prevent negative possible selves becoming a reality (Oyserman & James, 2008;
Oyserman, 2008). Oyserman (2007) emphasized that people are motivated by goals that
are congruent to their social group memberships. Oyserman’s identity-based motivation
model explains the process of actualizing possible selves by means of self-regulation.
Important factors that affect the strength of the relationship between possible selves and
self-regulation are social identity, personal identity, social cognition, and self-schema
theories (Oyserman, 2007).
Initially, the model did not specifically describe how adolescents conduct self-
regulation to achieve academic possible selves in educational settings. Since then,
Oyserman and her colleagues have published theoretical and empirical articles referring

13
to “identity-based motivation” rather than “possible selves” (Oyserman & Destin, 2010;
Oyserman 2013). The main reasons for the terminology change were to enhance social
and contextual aspects as well as to refocus current trends in possible selves research,
which has emphasized more specific identities than the general self (Oyserman & Destin,
2010). Oyserman maintained that “People interpret situations and difficulties in ways that
are congruent with currently active identities and prefer identity-congruent to identity-
incongruent actions” (Oyserman & Destin, 2010, p. 1001).
However, I will continue using the original terminology. The new terminology
may bring new insights and foci, but it also represents a significant break with past
research, without indicating how researchers might link this new framework with the past
20 years of possible selves research (e.g. Markus & Nurius, 1986).
Of particular concern, identity-based motivation model sheds light on social
identity as a trigger for particular actions, but at the cost of reducing the importance of
the self as an actor who uses self-regulation to bring about their academic possible selves.
Oyserman and Destin (2010) articulated that “social identity theory does not specify
whether contexts are likely to make social (e.g., being a boy) or personal (e.g., being a
good speller) identities salient; rather it predicts that when an identity is salient in context
it will matter” (p.1008).
I believe that this possibly tautological model fails to adequately explain what
influences a student when, nor does it explain how the influence leads to variation in
students’ actions when they develop academic possible selves and maintain self-
regulation to achieve academic possible goals. I believe that social cognitive theory can
be used here to provide greater insight.

14
Social Cognitive Theory
Social cognitive theory was originated from Albert Bandura and adapted to
educational settings in the 1980s by Dale Schunk (Bandura & Schunk, 1981). The
research under social cognitive theory has long investigated the process of goals, self-
regulation, and self-reflection in academic settings. Social cognitive theorists argue that
people behave according to their thoughts, goals, beliefs, and values that are developed in
social contexts (Schunk, Pintrich, & Meece, 2008). Social cognitive theory addresses
social and personal factors to describe the process of self-regulation. Zimmerman (2000)
mentioned that “A social cognitive perspective entails not only behavioral skill in self-
managing environmental contingencies, but also the knowledge and the sense of personal
agency to enact this skill in relevant contests” (pp.13-14). The interaction of social and
personal factors can be explained by the process model of triadic reciprocality (Bandura,
1997).
In the triadic model, there are person, environment, and behavior factors and these
three factors interact with each other (Schunk et al., 2008). An example of the behavior
and environment link is that a teacher (environment) directs a student’s action (behavior).
The behavior and person link is illustrated by self-efficacy theory (Bandura, 1997). Self-
efficacy is one’s perceived ability to engage action to complete a specific task. For
example, if a student completed a task according to his teacher’s directions (behavior),
the student will assess his expected performance (person). High self-appraisal will result
in high self-efficacy for the task. The person and environment relation is illustrated in the
teacher’s evaluation of the students’ performance. If the teacher gives a relatively high

15
score to the student (environment), the student’s self-efficacy for completing that task in
the future will be increased (person).
Bandura and Schunk (1981) articulated that “Self-efficacy is concerned with
judgments about how well one can organize and execute courses of action required to
deal with prospective situations containing many ambiguous, unpredictable, and often
stressful elements” (p. 587). Self-efficacy and outcome expectations are related but are
not identical (Schunk et al., 2008). For instance, a high efficacious student playing a
piano may have low outcome expectations of her national competition results because of
notorious competition. Conversely, low self-efficacy for a certain task can interact with
either low outcome expectations or high outcome expectations. For example, a low
efficacious student in algebra may expect a low outcome from an algebra test and this
may make him feel like he would like to give up studying for the test. If the student feels
pressure for his parents’ high expectation for the test, he may blame himself for not being
able to get a good grade on the test.
People with high self-efficacy beliefs tend to employ efforts and persist in actions
to achieve higher goals (Schunk, 1999). Positive peer modeling and external rewards can
also play with goal settings (Schunk et al., 2008). Researchers found that adolescent
friendship affect academic motivation and performances. Adolescents are relatively
malleable in amending their self-beliefs and behaviors that can bring better reputation in
their peer groups (Jones, Audley-Piotrowski, & Kiefer, 2012). Models can be a
motivational force for students. While observing the models’ actions and performance
results, students can estimate their own outcome expectations based on a comparison of
themselves with the models (Schunk, 1999). For example, if a student has a peer group

16
who focuses on high academic achievement, the student will set up similar goals (e.g.,
studying harder) to other friends in the group. In terms of external rewards, Schunk and
his colleagues (Schunk et al., 2008) stated that external rewards are effective when goals
are easy to moderate difficulty levels. For example, a student can reward himself with a
movie as a result of his improvement toward achieving his goal. Such self-rewards can
motivate and persist in self-regulatory behaviors for pursuing goals (Schunk &
Zimmerman, 1997).
Self-regulation. In this context self-regulation is adoption of self-regulative
strategies to achieve specific goals (Schunk et al., 2008). Zimmerman (2000) stated that
“Self-regulation refers to self-generated thoughts, feelings, and actions that are planned
and cyclically adapted to the attainment of personal goals” (p. 14). Zimmerman and his
colleagues developed three phases of self-regulation: Forethought, Performance or
Volitional control, and Self-reflection (Zimmerman, 2000; Zimmerman & Martinez-Pons,
2007). Zimmerman (2000) stated that “Forethought refers to influential processes that
precede efforts to act and set the stage for it” (p. 16). In the forethought phase, a student
analyzes a task (e.g., goal setting) and considers self-motivational beliefs (e.g., self-
efficacy). Zimmerman (2000) explained that “Performance or volitional control involves
processes that occur during motoric efforts and affect attention and action” (p. 16). In the
performance phase, the student controls her performance (e.g., attention focusing) and
observes her strategies (e.g., metacognitive monitoring). Zimmerman (2000) stated that
“Self-reaction involves processes that occur after performance efforts and influence a
person’s response to that experience” (p. 16). In the self-reflection phase, the student

17
judges her performance (e.g., self-evaluation) and relates her past strategies (e.g.,
adaptive or defensive). The three phases are cyclical.
Zimmerman and his colleagues created developmental levels of self-regulation
(Schunk & Zimmerman, 1997). In the model, there are four levels, each describing how
people develop regulatory skills by applying what they learn in social contexts to
themselves (Schunk & Zimmerman, 1997). At the observation level, students observe a
model’s skills or strategies but are not required to perform them (Schunk, 1999).
Zimmerman (2000) stated that “Despite the value of this vicarious information, most
learners also need to perform the strategies personally to incorporate them into their
behavioral repertories” (p. 29). At the emulation level, the students’ performances imitate
the model’s skills and strategies. The students approximate the model’s behaviors and
will then improve their behaviors if the model takes a teaching role and offers feedback
and suggestions (Zimmerman, 2000). The first two levels are mainly influenced by social
resources similar to social identities in identity based motivation theory. At the self-
controlled level, the students can use the model’s skills and strategies regardless of the
presence of the model. Zimmerman (2000) stated that “The learner’s success in matching
that covert standard during practice efforts will determine the amount of self-
reinforcement he or she will experience” (p. 30). The last level is self-regulation and the
students can modify their skills and strategies based on their own unique social and
personal contexts, distinct from those of any model. They also can adjust their self-
regulation while consideration of outcome expectation (Zimmerman, 2000).
I argue that the self-controlled and self-regulation levels are related to personal
identity, and that this element is under-represented in the identity-based motivation model

18
that Oyserman espouses. These levels can affect and explain the variation in students’
efforts for persisting in self-regulation to achieve their academic possible selves.
Self-regulated learning strategies. Zimmerman and his colleagues articulated
that students’ academic self-regulation is an active approach to utilizing self-regulated
learning strategies in order to achieve academic goals above and beyond adults’ direct
guidance (Zimmerman & Martinez-Pons, 2007). Zimmerman & Martinez-Pons (1986;
1988) defined self-regulated learning strategies using the Self-regulated Learning
Interview Schedule (SRLIS). The interview includes six learning contexts based on pilot
interviews: in classroom situations, at home, when completing writing assignments
outside class, when completing mathematics assignments outside class, when preparing
for and taking tests, and when poorly motivated. An exemplary interview item is that
“Most teachers give tests at the end of marking periods, and these tests greatly determine
report card grades. Do you have any particular method for preparing for this type of test
in English or history?” (Zimmerman & Martinez-Pons, 1986, p.617)
The researchers recruited high achieving and lower achieving high school
students and coded these students’ data using 14 self-regulated learning strategies as
defined from the literature review: self-evaluation, organizing and transforming, goal-
setting and planning, seeking information, keeping records and monitoring,
environmental structuring, self-consequences, rehearsing and memorizing, seeking peer,
teacher, or adult assistance, and reviewing tests, notes, and textbooks. A non-self-
regulatory learning category was added for a coding purpose (Zimmerman & Martinez-
Pons, 1986). The researchers found that high achieving students used significantly more
self-regulatory learning strategies than lower achieving students except for the self-

19
evaluation category (Zimmerman & Martinez-Pons, 1986). In addition, the researchers
uncovered that these students’ self-reported scores of self-regulated learning strategies
were highly correlated with teachers’ reports of the students’ self-regulated learning
(Zimmerman & Martinez-Pons, 1988).
Social cognitive theory vs. Possible selves. Although self-efficacy concerns an
outcome expectation for a specific task, possible selves consider students’ expectation
about their future (Garcia & Pintrich, 1995). Garcia and Pintrich (1995) stated that
“Possible selves can be seen as student characteristics, representing the personalized,
cognitive-affective organizations of previous experiences and the acknowledgment of
one’s aptitudes” (p.9). Study results uncovered that although self-efficacy explains the
highest portion of the variance in self-regulation, possible selves accounts for a
significant portion of the variance in self-regulation beyond self-efficacy. Therefore,
Garcia and Pintrich (1995) argued that possible selves encourage self-regulation above
and beyond self-efficacy. The researchers mentioned that “By projecting oneself into the
future, one need not be limited to what one is at the present” (p. 9). Thus, the virtue of
possible selves is that self-efficacy is greatly influenced by an outcome expectation for a
specific task at the present, but possible selves are relatively free from outcome
expectations and have power to generate self-regulation for the future goals.
The Purpose of the Study
This study was initiated to solve measurement issues associated with current
possible selves measures as well as to enhance possible selves research by encompassing
social cognitive theory. The results of this study will be the development of a new
measure, the Persistent Academic Possible Selves Scale for Adolescents (PAPSS). The

20
PAPSS integrates important factors that have revealed their significant influence on
academic achievements such as social identity, personal identity, and self-regulation. The
PAPSS will measure how students can achieve academic possible selves by means of
self-regulation, adopted from social cognitive theory.
Research Questions
First: Does integration of social cognitive theory into possible selves theory
improve the measurement of academic possible selves and self-regulation for attaining
academic possible selves? I expect that self-regulation items, which were derived from
self-regulated learning strategies in social cognitive theory, will provide more knowledge
about how students use self-regulated strategies to achieve academic possible goals next
year.
Second: Does the PAPSS provide reliable and valid score interpretation of
academic possible selves and self-regulation? I will test a baseline model and the
hypothesized models in the study. I believe that fit comparisons of the models using
confirmatory factor analysis (CFA) will result in a best fitting model which provides the
validity evidence of the internal structure. The model should be theoretically sound in
terms of possible selves and social cognitive theories.
Third: Does the PAPSS provide more practical administration and efficient
scoring interpretation compared to Oyserman (2004)’s possible selves questionnaire? I
anticipate that complex coding procedures of Oyserman’s open-ended questionnaire
including inter-rater reliability will demonstrate issues associated with score
interpretation of the scale. Therefore, the convergent evidence between the PAPSS and
Oyserman’s open-ended questionnaire is of interest in this study.

21
Chapter 3
ITEM DESIGN AND PILOT STUDY
Academic Possible Selves Categories
I used existing data of a general comparison group in the CompuGirls (PI: Dr.
Kimberly Scott; EHR-0833773). 63 participants took the first survey, 52 participants took
the second survey, and 37 participants took the third survey. In total, 72 participants
participated in the survey at least one time. Oyserman (2004)’s open-ended possible
selves questionnaire was used. Students’ open-ended responses of positive and negative
possible selves were summarized in the five domains (see Table 1). The students’
individual responses were then coded using the five domains. All data was double-coded
by a research assistant and I. The interrater agreement was 89% (Lee et al., 2011).
Table 1
Domains and Examples for Positive and Negative Possible Selves
Domain Example
1. Academic Going to next grade
Joining extra classes
Failing a class
2. Social Family
Social Club
Peers
3. Personality Being more nice
Acting more responsible

22
Being more mature
4. Health Beauty
Drugs
Pregnancy
5. Career Part time jobs
Working for family
Future profession
Etc. Cooking
Saving money
Religion
Note. Adopted from Lee et al. (2011)
Then, we separated academic possible selves responses from other possible selves
responses and reviewed categories of the academic possible selves. The analysis resulted
in seven categories for positive and eight categories for negative academic possible selves
(see Table 2). We coded individual responses of academic possible selves using the 15
categories and the interrater agreement was 89%.
Table 2
Categories of Academic Possible Selves
Academic Possible Selves Category
Positive Direction
1 Being a good student
2 Getting good grades

23
3 Being smart
4 Passing onto the next grade
5 Staying in school
6 Taking advanced/extra classes
7 Etc
Negative Direction
1 Being a bad student
2 Getting bad grades
3 Not being smart
4 Not passing onto the next grade
5 Dropping out of school
6 Poor attendance
7 Failing classes
8 Etc
Note. Adopted from Lee et al. (2011).
As part of our work with this data, our research team determined that the domains
of possible selves responses and the categories of academic possible selves responses are
limited (Lee et al., 2011). Previously, other researchers found that students in under-
resourced areas have less positive academic possible selves than students from high-
resource districts (Kao, 2000). Thus, we recommended replicating this study with other
groups of students (e.g., girls from middle class) to investigate the effect of social
contexts on the outcome space of the questionnaire (Lee et al., 2011).

24
The Initial Item Revisions
I initially developed 42 items according to the categories of academic possible
selves. The initial PAPSS items were revised based on the analysis results of content
validity evidence. The initial 42 items were reduced to 32 items using the four topics:
“Advancing a grade”, “Getting good grades”, “Being a better student” and “Having good
school attendance”. The PAPSS scoring was changed from a seven-point Likert scale (1
= Not at all true of me; 7 = Very true of me) into a five-point Likert scale (1 = strongly
disagree; 5 = strongly agree). The main reason was that an expert recommended using the
five Likert scale and I wondered if it would make scales seems smaller and more
manageable to students.
The Pilot Study
Twenty-five high school students participated in the pre survey and 28 students
participated in the post survey with a three-week interval. 43 students took either pre or
post surveys and 10 students took both of the surveys. In the pre survey, students were
firstly asked to match items to theoretical statements. Then, the students were asked to
answer the PAPSS. In the post survey, students were asked to answer the PAPSS items,
only. The test-retest reliability is high (r = .97). Fifteen experts who are affiliated with
either the school of education or the school of social and family dynamics at a large
southwestern university took the expert survey. Experts were asked to match items to
theoretical statements. Overall, the experts provided more accurate answers in the
matching questions. As I learned that less choice options tended to generate more discrete
data, I changed the response option from a five-point to a seven-point Likert scale.

25
Chapter 4
DISSERTATION STUDY METHOD
Procedure
Engineering summer camps. I contacted two engineering summer camps held at
a large southwestern university via email and introduced the Persistent Academic
Possible Selves Scale for Adolescents (PAPSS) in the spring of 2012. The two directors
of the camps allowed me to conduct data collections during their camps in the coming
summer. I scheduled the data collections at the beginning of the camps to avoid the
program’s effect on students’ responses. I followed three steps to collect student assent
and parental consent forms before the camps started. First, the camps sent out flyers
containing information about the PAPSS study, parental consent forms, and student
assent forms. Second, I collected the students’ consent and assent forms at the beginning
of the camps. Third, I administered the PAPSS survey along with other measures at the
camp for about 30 minutes. I distributed pens to the participant as survey incentives.
Public schools. I received approval from the district and school levels in Mesa in
the fall of 2012. Then, I conducted data collections from one high school and one junior
high school from the fall of 2012 and the spring of 2013. I collected data from two social
studies teachers’ classrooms in the junior high school and three science teachers’
classrooms in the high school. I followed the three steps to collect parental consent and
student assent forms from the participants. First, I explained my study at the beginning of
the class and distributed survey flyers, parental consent forms, and student assent forms.
Second, I came back to the class a week later, collected those forms, and administered my
survey for approximately 20-30 minutes during the class. Third, I revisited the class a

26
week later and distributed survey incentives to the participants. I used movie tickets in
the fall of 2012 and five dollars in the spring of 2013.
Participants
One hundred and forty two students in two engineering camps participated in the
study in the summer of 2012. In Mesa district, fifty one junior high school students and
65 high school students participated in the study in the fall of 2012. Eighty five junior
high school students and 152 high school students participated in the study in the spring
of 2013. In total, 495 students participated in the study. The average age of the students
was 14 years with a range of 10 to 18 years. Most of the students were 7th (28%), 8th
(15%), and 9th (18%) graders. A majority of them were White, non-Hispanic (56%) and
Hispanic (23%). There were approximately even male and female students (47% male
and 53% female).
For the convergent analysis, I used 320 students’ data who participated in both the
Persistent Academic Possible Selves Scale for Adolescents (PAPSS) and Oyserman
(2004)’s open-ended questionnaire. I did not administer Oyserman (2004)’s open-ended
questionnaire to 124 summer camp participants and 51 junior high school students
because of administrative issues (i.e., time-constraints). The average age of the 320
students was 15 years with a range of 12 to 18 years. Most of the students were 7th
(26%), 9th (25%), and 11th (19%) graders. A majority of them were White, non-Hispanic
(64%) and Hispanic (20%). There were more female students (61%) than male students
(39%).

27
Measures
The persistent academic possible selves scale for adolescents (PAPSS). The
PAPSS (Lee & Husman, 2012) was administered in the study. The PAPSS was
developed to measure adolescents’ academic possible selves and self-regulation to
achieve those academic possible selves. The students answered each item using a seven-
point Likert scale (1= Strongly Disagree; 2=Disagree; 3=Disagree Somewhat; 4=Neutral;
5=Agree Somewhat; 6=Agree; 7=Strongly Agree). I would describe the validity evidence
of the PAPSS score interpretation in the analysis and results sections.
Oyserman’s open-ended possible selves questionnaire. Oyserman (2004)’s
open-ended possible selves questionnaire was used for investigating students’ academic
possible selves and self-regulation. The students were asked to write their positive
possible self (“Next year, I expect to be….”). If they were doing something to become the
possible self, they were asked to write a strategy for attaining the positive possible self
(“What I am doing now to be that way next year….”). The students repeated the
procedure four times to provide up to four positive possible selves and strategies
associated with those possible selves. Then, the students were asked to write their
negative possible self (“Next year, I want to avoid….”). If they were doing something to
avoid this, they were asked to write a strategy for avoiding the negative possible self
(“What I am doing now to avoid being that way next year….”). The students replicated
the process four times to provide up to four negative possible selves and strategies
associated with those possible selves.

28
Quantitative Data Analysis
Confirmatory factor analysis. I conducted confirmatory factor analysis (CFA) to
compare fit for a baseline model and hypothesized models using Mplus version 7
(Muthén & Muthén, 2012). CFA is a more advanced analysis than explanatory factor
analysis (EFA) in terms of directly testing a hypothesized factor model with constraining
parameters (Curran, West, & Finch, 1996; Flora & Curran, 2004). The rules of thumb for
testing CFA using real data is a ratio of 1 (a number of item) to 10 (a sample size) based
on commonly used criteria (Myers, Ahn, & Jin, 2011). The criteria supported that the
current sample size (N= 495) is approximately adequate to testing CFA with 51 items in
the PAPSS.
To detect multivariate nonnormality, I checked univariate nonnormality of item
scores according to Curran et al (1996)’s recommendation (univariate skewness > 2.00
and kurtosis > 7.00). Based on the investigation in descriptive statistics results (see
Appendix A), I decided to treat the item scores as categorical and tested the fit of the
proposed models against the data using a weighted least square means and variance
adjusted (WLSMV) estimation. WLSMV (i.e., Robust WLS) is a highly recommended
estimation method for handling with multivariate nonnormality of ordered categorical
data (e.g., a Likert-scale) for CFA (Flora & Curran, 2004).
Internal construct validity evidence. I investigated how well the PAPSS items
are loaded to hypothesized factors that were specified in advance based on academic
possible selves and social cognitive theories. To compare fit of the baseline model and
the hypothetical factor models, I checked global fit and local fit indices. The global fit
evaluates the overall closeness of a fitted (or a model implied) covariance matrix to an

29
actual (or observed) covariance matrix. The global fit was assessed using the
Comparative Fit Index (CFI), the Tucker Lewis Index (TLI), the Root Mean Square Error
of Approximation (RMSEA), and the Weighted Root Mean Square Residual (WRMR). I
reviewed Hu and Benltler (1999)’s cut-off criterion which are the most popular for
assessing global fit indices for normal data using Maximum likelihood (ML) based
estimation. Since I used WLSMV estimation for nonnormal, ordered categorical data, I
followed Yu (2002)’s suggestions (values of .95 or .96 for CFI and TLI; values of .05
or .06 for RMSEA; values close to .95 or 1.00 for WRMR).
After evaluating global fit, I examined individual item loadings to the factors in
the model. I also investigated local fit indices for checking fitness of the item level. First,
I checked a modification index. The modification index shows that by freeing the specific
parameter constraint in request, a chi-square will be reduced by that value (Muthén &
Muthén, 2012). A high value of the index means that the parameter constraint causes a
significant lack of fit. Next, I checked the Expected Parameter Change (E.P.C.). An
E.P.C. shows that if a parameter constraint in request is freed, the estimated parameter
(i.e., loading) will be of the value (Muthén & Muthén, 2012). A high value of the E.P.I.
means that the parameter constraint causes a significant lack of fit.
During the process of model fit evaluation, I also conducted specification searches
(i.e., exploratory analyses). I slightly altered factor loadings in the hypothesized models
and tested the models to find a final factor model which has adequate fit as well as is
supported by possible selves and social cognitive theories.
Convergent validity evidence. I added academic plausibility which was coded
based on Oyserman (2003)’s instructions to the final factor model. The coding process

30
was described in the qualitative data analysis section. I explored the convergent validity
evidence between the factors in the PAPSS and academic plausibility. Individual factor
correlations with academic plausibility were examined. I checked the global fit indices of
the model.
Qualitative Data Analysis
Content analysis of academic plausibility. Fraenkel and Wallen (2000)
described that “Content analysis is a technique that enables researchers to study human
behavior in an indirect way, through an analysis of their communications” (p. 469).
Content analysis is beneficial in terms of analyzing open-ended responses as a form of
quantitative data after coding the responses using appropriate categories or ratings
(Fraenkel & Wallen, 2000). Oyserman and her colleagues conducted content analysis of
students’ open-ended responses of possible selves and strategies to achieve these possible
selves using the Instructions for Coding Academic Plausibility (Oyserman, 2003).
Oyserman (2003) stated that “We coined the term ‘plausibility’ to convey the idea that
possible selves differ in the extent that a youth could plausibly use these visions and
strategies as a way to guide behavior toward achievement goal” (p. 1).
A research assistant and I reviewed the instructions and conducted four trial
sessions with randomly selected samples of 10 from the entire pool of participants.
Overall, our agreement rates progressively improved and reached 90% twice in a row
(80%, 60%, 90%, and 90%). After completing the trial sessions, we coded 1/3 of the data
for checking inter-rater reliability. We reviewed positive and negative (i.e., expected and
feared in the instructions) possible selves and counted possible selves that are related to
school/academics (e.g., gaining a 3.5 or higher GPA). In the instructions, possible selves

31
that are linked to job achievement and school activities should not be counted. More
specifically, music, band, and choir are counted but physical education, art, and dance are
not counted. No rationale for the distinctions is described. Two categories of academic
possible selves are listed on the instructions: school and teachers. However, there are no
instructions for other important categories in school settings such as peers and academic
related clubs. Therefore, it is uncertain whether or not possible selves that are related to
peers and academic related clubs should be counted. In this study, possible selves that are
related to peers in school (e.g., avoiding bad students in my classroom) are counted. In
addition, academic related clubs (e.g., National Honor Society) are counted.
For counting strategies, Oyserman (2003) displayed two types of strategies,
“achievement focused strategies” and “interpersonal relationships” and provided
examples. For example, “doing all my homework” and “asking teachers for help” are
listed as achievement focused strategies and “avoiding the bad students” and “asking for
help” are listed as strategies that indicate an interpersonal relationship aspect. However,
making a distinction for some strategies are uncertain given the condition that no
clarifications for the two types of strategies are provided. For instance, making a
distinction for “asking teachers for help” and “asking for help” is uncertain based on the
given condition. Therefore, we decided to consider strategies as interpersonal
relationships when the strategies involve others (e.g., teachers and friends) in doing
something positive for academic achievement in school settings. For example, if a student
wrote “tutoring” as a strategy, we counted it as a strategy containing an interpersonal
relationship aspect. After counting the numbers of academic possible selves and

32
strategies to achieve these possible selves, we calculated an academic plausibility score
for each student using Oyserman (2003)’s instructions.
When calculating academic plausibility scores, we found two issues described on
the instructions. The first issue is to decide whether “at least one of the possible selves
and/or strategies that are provided are detailed/concrete, that is if specific action is
implied and possible selves are not redundant” (p. 1). Given that no clarifications or solid
examples are provided in the instructions, it is very subjective to judge how
detailed/concrete the possible selves and/or strategies are. Therefore, “detailed/concrete”
was less weighted during the coding process in the study. For example, if a student has
four academic possible selves and two strategies, the student has a plausibility score of
three regardless of how “detailed/concrete” his academic possible selves and/or strategies
are. The second issue is related to academic plausibility score of five (the highest
plausibility score). To receive the score, a student should have four or more academic
possible selves and four or more strategies with “at least one strategy for an academic self
is focused on interpersonal aspects of school context” (p. 3). However, there are no
explanations why interpersonal aspect strategies over weighted for academic plausibility
score. In many cases, students wrote academic possible selves that are related to an
interpersonal aspect (e.g., peer pressure). However, since they are not academic
strategies, those students did not receive the highest plausibility score of five, even
though their possible selves clearly represented an interpersonal aspect to their academic
life.
On the instructions, there is a troubleshooting section. Oyserman (2003) explains
three cases in the section. The first case is the ambiguous possible selves. If a possible

33
self is uncertain, a strategy or strategies should clarify whether or not the possible self is
academically related. For example, when a student wrote “hard working” as a possible
self and “preparing for classes” as a strategy, then the possible self can be counted as an
academic possible self. However, if the student wrote “helping my father” as a strategy,
the possible self (“hard working”) should not be counted as an academic possible self.
The second case is the non-academic possible selves with academic strategies. For
example, if a student wrote they want to avoid “living at home” as a possible self and
“Preparing for college” as a strategy, neither the possible self nor the strategy were
counted. The third case is the multiple strategies for an academic possible self. If a
student wrote “a better student” as a possible self and “ I’m studying more and taking
classes more seriously” as a strategy, the “studying more” and “ taking classes more
seriously” should be counted as two strategies.
Although the trouble shooting section was helpful for solving many issues
associated with coding academic possible selves and strategies, we discovered other
coding issues that appeared often. The first case is related to the multiple academic
possible selves. Sometimes students wrote two or more academic possible selves in a
blank. For example, if a student wrote “Decided on a college and working for
scholarships”, “decided on a college” and “working for scholarships” were counted as
two academic possible selves in this study. The second case is the hidden academic
possible selves and strategies. Some students wrote two or more academic and other
possible selves in a blank. For example, if a student wrote “physically fit and mentally
strong” as a possible self and “ Working out (i.e. weights) and taking challenging classes”

34
as a strategy, “mentally strong” was counted as an academic possible self and “taking
challenging classes” was counted as a strategy in the study.
On the last page of the instructions, Oyserman (2003) provided three coding
examples and explanations for the coding results. Example A covers a redundant
academic possible self. If a student wrote “in the ninth grade” and “in high school” as
two positive academic possible selves, the possible selves are redundant and should be
counted one. Example B explains strategies that are restatements of academic possible
selves. If a student wrote “getting C’s” as a negative possible self and “Keeping A’s and
B’s” as a strategy, the strategy is a restatement of the possible self and should not be
counted. Example C describes redundant strategies with different academic possible
selves. For example, if a student wrote “in 9th
grader” as a positive academic possible self
and “work hard as an 8th
grader” as a first strategy; “the 8th
grade” as a negative academic
possible self and “work hard” as a second strategy, the student had a plausibility score of
two based on the two academic possible selves and two strategies. Oyserman (2003)
stated that:
The only time strategies are not double counted is when the possible selves
themselves are redundant or exact opposites (e.g., a 9th
grader, in the 8th
grade).
The only other strategies that are not counted are when the words do not form a
strategy but explain or add detail as to why a possible self is import. (p. 4)
However, it is not clear why “dropping out” can be an academic possible self and
“staying in school” can be a strategy of the academic possible self, as Oyserman also
indicated in the instructions. In this study, we followed the instructions and did not count
strategies that are restatements or exact opposites of academic possible selves. For

35
example, if a student wrote “A straight “A” student” as an academic possible self and
“getting mostly A’s” as a strategy, the strategy was not counted because it is a
restatement of the possible self.
For the 320 participants, we independently coded 1/3 of the data and compared
the results for checking inter-rater reliability. Eighty nine out of 109 students’ plausibility
scores were matched (82%). We checked and resolved the disagreements. Then, we
divided the remaining data and individually coded.

36
Chapter 5
DISSERTATION STUDY RESULTS
The Final Scale
Construct. The PAPSS construct explains the conditions under which students
are motivated for developing academic possible selves and conducting self-regulation for
attainting these academic possible selves.
Scoring. The PAPSS adopted a seven-point Likert scale (1= Strongly Disagree;
2=Disagree; 3=Disagree Somewhat; 4=Neutral; 5=Agree Somewhat; 6=Agree;
7=Strongly Agree). The estimated minimum score was 51, when a student selected
“Strongly Disagree” for all items (score 1 x 51 items) and the estimated maximum score
was 357, when a student selected “Strongly Agree” for all items (score 7 x 51 items).
Items. The final items were developed using three academic goals based on the
content analysis of students’ academic possible selves: improving classroom grades,
being a better student, and paying more attention in class (see Appendix B). The final
items also encompass three theoretical components (social identity, personal identity, and
self-regulation). Social identity and personal identities were derived from possible selves
theory under social psychology. Self-regulation was adopted from social cognitive theory
in educational psychology (Schunk & Zimmerman, 1997; Zimmerman, 2000). Among
three cyclical phases of self-regulation, the forethought phase and performance phase
were utilized for developing self-regulation items in the PAPSS. However, the self-
reflection phase was excluded because the PAPSS was intended to measure students’
planning and utilization of self-regulation to achieve academic possible selves rather than
evaluating and altering self-regulation based on the past results. I argue that students can

37
undergo the self-reflection phase after they have attained or failed to achieve their
academic possible selves in the following year. Social identity theory was utilized to
measure social identity based academic possible selves and self-regulation. Personal
identity and forethought phase were combined to measure students’ personal identity
based academic possible selves and self-regulation. The performance phase was used to
develop self-regulated learning strategies.
Internal Construct Validity Evidence
Baseline model. I tested a general one factor model as a baseline model (see
Figure 1). The factor variance is fixed to one. The model fits poorly based on global fit
indices (CFI = .79, TLI = .78, RMESA = .13, 90% CI [.12, .13], WRMR = 3.32).
Figure 1. Baseline model.

38
Academic possible goal model (3 factors). I tested an academic possible goal
model (see Figure 2). Three factors are academic possible goals in the PAPSS. The first
factor is improving classroom grades. The second factor is being a better student. The
third factor is paying more attention. The factor variances are fixed to one. Factors 1, 2,
and 3 are correlated. The model fits poorly based on the global fit indices (CFI = .81, TLI
= .80, RMESA = .12, 90% CI [.12, .12], WRMR = 3.11).
Figure 2. Academic possible goal model.
Three factor model I. I tested a three factor model I (see Figure 3). Three factors
are theoretical components in the PAPSS. The first factor is social identity. The second
factor is personal identity and the forethought phase in self-regulation. The third factor is
the performance phase in self-regulation. The factor variances are fixed to one. Factors 1,

39
2, and 3 are correlated. The model fits slightly better based on the global fit indices (CFI
= .85, TLI = .84, RMESA = .11, 90% CI [.10, .11], WRMR = 2.83).
Figure 3. Three factor model I. * = Forethought phase and performance phase in self-
regulation.
Three factor model II. I tested a three factor model II (see Figure 4). The first
factor is identity-based academic possible selves. The second factor is identity-based self-
regulation. The third factor is the performance phase in self-regulation. The factor
variances are fixed to one. Factors 1, 2, and 3 are correlated. The model fits poorly based
on the global fit indices (CFI = .82, TLI = .81, RMESA = .12, 90% CI [.11, .12], WRMR
= 3.05).

40
Figure 4. Three factor model II. * = Performance phase in self-regulation.
Five factor model. I tested a five factor model (see Figure 5). The first factor is
social identity-based academic possible selves. The second factor is social identity-based
self-regulation. The third factor is personal identity-based APS. The fourth factor is
personal identity-based self-regulation. The fifth factor is the performance phase in self-
regulation. The factor variances are fixed to one. Factors 1, 2, 3, 4, and 5 are correlated.
The model fits slightly better based on the global fit indices (CFI = .86, TLI = .85,
RMESA = .10, 90% CI [.10, .11], WRMR = 2.74).

41

42
Six factor model. I tested a six factor model (see Figure 6). There are four
domain specific factors and a general factor, the academic possible selves factor. The first
domain specific factor is social identity-based academic possible selves. The second
domain specific factor is social identity-based self-regulation. The third domain specific
factor is personal identity-based academic possible selves. The fourth domain specific
factor is personal identity-based self-regulation. The fifth factor is a general factor, the
academic possible selves factor. The sixth factor is the performance phase in self-
regulation. The factor variances are fixed to one. Factors 5 and 6 are correlated. The
model fits better but were not satisfied based on the global fit indices (CFI = .89, TLI
= .89, RMESA = .09, 90% CI [.09, .09], WRMR = 2.27).

43

44
Complex factor model. I tested a complex factor model (see Figure 7). The first
factor is improving grades. The second factor is better student. The third factor is paying
attention. The fourth factor is social identity. The fifth factor is personal identity. The
sixth factor is identity-based academic possible selves. The seventh factor is identity-
based self-regulation. The eighth factor is the performance phase in self-regulation. The
factor variances are fixed to one. Factors 1, 2, and 3 are correlated. Factors 4 and 5 are
correlated. Factors 6, 7, and 8 are correlated. The model has a much better fit based on
the global fit indices (CFI = .95, TLI = .95, RMESA = .06, 90% CI [.06, .06], WRMR =
1.39).

45

46
More complex factor model. I tested a more complex factor model (see Figure
8). The first factor is improving grades. The second factor is better student. The third
factor is paying attention. The fourth factor is social identity. The fifth factor is personal
identity. The sixth factor is identity-based academic possible selves. The seventh factor is
identity-based self-regulation. The eighth factor is the performance phase in self-
regulation. The factor variances are fixed to one. Factors 1, 2 and 3 are correlated.
Factors 4, 5, and 8 are correlated. Factors 6, 7, and 8 are correlated. The model has a
slightly better fit according to the results of global fit indices (CFI = .96; TLI = .95;
RMESA = .06, 90% CI [.06, .06], WRMR = 1.36).

47

48
Reduced complex factor model. Although the more complex factor model has
good fit, several items under some factors have negative or very low factor loadings
(< .20). So, I created a reduced complex factor model after removing problematic factor
loadings taking into consideration the theories I used to develop the original scale,
possible selves theory and social cognitive theory (see Figure 9). Note that names for
factors 4, 5, 6, 7, and 8 have been changed. Once I considered the common themes in
each subscale, within context of the existing self-concept research (Marsh, 2007); social
cognitive theory (Zimmerman, 2000; Schunk, 1999) it was clear that these new factor
scores were reflecting peer modeling (factor four); self-rewards (factor five); self-concept
(factor six); self-control (factor seven); and self-regulation strategies (factor eight). The
set of factors (factor one, factor two, and factor three) which represent the shared
variance of each of the content areas of the possible selves, held the factor structure I
proposed when writing the items. The factor variances are fixed to one. Factors 1, 2 and 3
are correlated. Factors 4 and 5 are correlated. Factors 6, 7, and 8 are correlated. The
model has a slightly poor fit but still satisfying results based on the global fit indices (CFI
= .95, TLI = .94, RMESA = .06, 90% CI [.06, .07], WRMR = 1.56).

49

50
More reduced complex factor model. Although the reduced complex factor
model has a good fit, the correlation between factor 4 and factor 5 is not significant (r = -
.01; p = .785). In addition, items 12, 29, 46 have low factor loadings to the self-control
factor (.17, .21, and .24). After a consideration of self-regulation in social cognitive
theory, I removed the correlation as well as the problematic factor loadings (see Figure
10). The first factor is improving grades. The second factor is better student. The third
factor is paying attention. The fourth factor is peer modeling. The fifth factor is self-
rewards. The sixth factor is self-concept. The seventh factor is self-control. The eighth
factor is self-regulated strategies. The factor variances are fixed to one. Factors 1, 2 and 3
are correlated. Factors 6, 7, and 8 are correlated. The model has a slightly better fit based
on the global fit indices (CFI = .95, TLI = .94, RMESA = .06, 90% CI [.06, .07], WRMR
= 1.58).

51

52
Final reduced complex factor model. I checked the modification index (M.I.)
and Expected Parameter Change (E.P.C.) of the more reduced complex factor model. I
found that a correlation of the factors 5 and 8 has M.I. of 93.30 and E.P.C. of .23. Since
the factors 5 and 8 are related to self-regulation in social cognitive theory, I decided to
correlate the factors 5 and 8 (see Figure 11). The first factor is improving grades. The
second factor is better student. The third factor is paying attention. The fourth factor is
peer modeling. The fifth factor is self-rewards. The sixth factor is self-concept. The
seventh factor is self-control. The eighth factor is self-regulated strategies. The factor
variances are fixed to one. Factors 1, 2 and 3 are correlated. Factors 5 and 8 are
correlated. Factors 6, 7, and 8 are correlated. The model has the best fit based on the
global fit indices (CFI = .95, TLI = .95, RMESA = .06, 90% CI [.06, .07], WRMR =
1.55). The model is selected as a final model of the PAPSS because of the theoretical
clarity and the fit results. The factor correlations are listed in Table 3. The standardized
factor loadings and polychoric correlation matrix are listed in Appendix C and Appendix
D.

53

54
Table 3
Factor Correlations
F1 F2 F3 F4 F5 F6 F7 F8
F1 -
F2 .94* -
F3 .75* .84* -
F4 - - - -
F5 - - - - -
F6 - - - - - -
F7 - - - - - .73* -
F8 - - - - .22* .31* .70* -
Note. *p < .001
Convergent Validity Evidence
Academic plausibility score (PLS) was added to the final model of the PAPSS to
explore the convergent validity evidence (see Figure 12). The first factor is improving
grades. The second factor is better student. The third factor is paying attention. The
fourth factor is peer modeling. The fifth factor is self-rewards. The sixth factor is self-
concept. The seventh factor is self-control. The eighth factor is self-regulated strategies.
The factor variances are fixed to one. Factors 1, 2 and 3 are correlated. Factors 5 and 8
are correlated. Factors 6, 7, and 8 are correlated. The model has the adequate fit based on
the global fit indices (CFI = .94; TLI = .94; RMESA = .07, 90% CI [.06, .07], WRMR =
1.42).

55
The PLS and F1 (r = .20, p < .001); PLS and F2 (r = .20, p < .001); PLS and F3 (r
= .13, p =.026); PLS and F6 (r = .15, p = .024) are significantly correlated. However, PLS
and F4 (r = -.10, p = .065); PLS and F5 (r = .05, p = .365); PLS and F7 (r = .04, p
= .605); PLS and F8 (r = .01, p = .923) are not significantly correlated.

56

57
Chapter 6
DISCUSSION
Implications of the Study
Possible selves researchers have uncovered many issues associated with the
current possible selves measures. For instance, one of the most famous possible selves
measures, Oyserman (2004)’s open-ended possible selves questionnaire, has proven to be
difficult to score reliably and also involves laborious scoring procedures (Lee et al.,
2011). In addition, there is no standardized measure that incorporates sufficient empirical
evidence and theoretical components in possible selves research (Packard & Conway,
2006; Oyserman & James, 2011). Therefore, this study was initiated to develop a close-
ended measure, called the Persistent Academic Possible Selves Scale for Adolescents
(PAPSS), that meets these challenges. The PAPSS integrates possible selves theories
(personal and social identities) and educational psychology (self-regulation in social
cognitive theory). Particularly, I was interested in expending self-regulation items using
self-regulated learning strategies in social cognitive theory, investigating the validity
evidence based on internal structure, and exploring the validity evidence based on
relation to Oyserman (2004)’s open-ended questionnaire.
The development of the PAPSS was followed by the multiple iterative processes
for scale development (Spector, 1992; DeVellis, 2003). I examined the validity evidence
based on test content and the evidence of test-retest reliability and refined the scale
during the iterative processes. First, the initial construct of the PAPSS was generated
based on the reviews of social and personal identity theories in the possible selves
literature. Spector (1992) argued that when developing a measure, construct clarity is key

58
before writing items. Then, the initial items were written based on the construct of the
PAPSS as well as the content analysis results from female junior high and high school
students. The initial items were refined based on subsequent research. This included
extended participants such as female and male junior high and high school students as
well as field experts. I gathered the evidence of test-retest reliability after administering
the revised items to the same participants in a three week interval. Self-regulated learning
strategies in social cognitive theory were integrated into the item revision process.
The PAPSS reframed the construct of self-regulation for achieving academic
possible selves by adopting forethought and performance phases in self-regulation. The
two phases describe how students can plan, develop, and manage academic self-
regulation. This adaptation is meaningful in both methodological perspectives and theory
development. Possible selves researchers have dealt with self-regulation with insufficient
construct clarity. For example, Oyserman (2004)’s open-ended questionnaire asks
students’ possible selves (“Next year, I want to be….) and strategies (“What I am doing
now to be that way next year….”). Oyserman and her colleagues argued that the coded
results of students’ academic possible selves and strategies (i.e., academic plausibility)
are keenly related to self-regulation. The researchers, in fact, referred to academic
plausibility as self-regulation (Oyserman et al., 2004). Other close-ended possible selves
consist of general strategy questions such that “I will use my time wisely” and “I will
cope well with distractions” (Kemmelmeir & Oyserman, 2001; p. 138). Therefore, self-
regulation items in the PAPSS are important in terms of improving the construct clarity
of self-regulation for achieving academic possible selves and examining the construct in
future possible selves research.

59
The PAPSS has the validity evidence based on the internal structure. The factor
analysis results uncovered the underlying factor structure in the PAPSS. The eight factors
are three goal-driven factors (improving grades, better students, and paying attention),
one self-regulated factor that focuses on peers (peer modeling), and four self-regulated
factors that emphasize the self (self-rewards, self-concept, self-control, and self-regulated
strategies). The goal-related factors are highly correlated with one another, which
demonstrates that they are equally important academic goals for junior high and high
school students. The self-rewards, self-concept, and self-control factors are significantly
related to the self-related strategies factor, which supports the students’ consistency in
utilizing self-regulation. However, the peer modeling factor is not significantly related to
other self-regulated factors. My colleagues and I (Lee & Husman, 2013) argued that
students likely have much more experience and detailed understanding of their academic
possible selves and self-regulation, whereas their understanding of other’s beliefs may be
less detailed.
It is noteworthy that this study did not provide evidence of convergent validity for
the whole scale. Convergent validity evidence is necessary when test developers compare
a new test and an existing test that measures a similar construct (Reynolds et al., 2009).
The constructs of the PAPSS and Oyserman’s academic plausibility are similar, however,
the two scales differ in both empirically and theoretically in regard to measuring
characteristics of strategies. The strategies measured by the PAPSS are self-regulated
learning strategies (Zimmerman, 2000) for achieving academic possible selves, whereas
the strategies assessed by Oyserman (2004)’s scale are unrestricted, in other words, more
diverse and general strategies for attaining academic possible selves (e.g., tutoring). The

60
study results confirmed that academic goal-related factors in the PAPSS as well as the
self-concept factor are significantly related to academic plausibility. However, the self-
regulated factors: peer modeling, self-rewards, self-control, and self-regulated strategies
in the PAPSS are not significantly related to academic plausibility.
I argue that the significant correlation between academic goal-related factors and
academic plausibility can be used as the evidence of concurrent validity. The concurrent
validity evidence is needed when test developers compare participants’ current status on a
test and a criterion (Reynolds et al., 2009). There are reasons for why the academic
plausibility score measured by Oyserman (2004)’s questionnaire can be a criterion of
academic goal factors in the PAPSS. The three goals in the PAPSS were selected based
on the content analysis of students’ responses using Oyserman (2004)’s questionnaire.
Although the PAPSS limited the number of students’ academic future goals, it did
measure three academic future goals, which should accurately reflect students’ self-
defined goals for next year. Since, Oyserman (2004)’s questionnaire provides more free
space to write down academic possible selves for next year, academic plausibility can be
a criterion of the academic goal-related factors in the PAPSS.
However, many issues associated with Oyserman (2003)’s instructions were
found during the coding process. It was very tricky to differentiate hidden academic
possible selves and strategies from non-academic possible selves and strategies. I also
detected that interpersonal related strategies were over weighted in the scoring process
compared to interpersonal related academic possible selves. Wasting students’ data
during the coding process is also critical. Oyserman (2004)’s questionnaire was
developed to measure possible selves and strategies not for academic possible selves and

61
strategies. Thus, my colleague and I discarded a great deal of students’ possible selves
and strategies that are related to other domains (e.g., social and career). Oyserman and
James (2011) pointed out the significant loss of students’ open-ended response in the
process of coding. I recommend changing the current instructions on Oyserman (2004)’s
open-ended questionnaire to more emphasize school and education contexts for academic
plausibility coding. For example, “Next year, I expect to be…..in school” would be better
for measuring academic possible selves and strategies than “Next year, I expect to be….”
Like most measures, the PAPSS has limitations. One would be incorporating a
restricted numbers of academic possible goals and self-regulated learning strategies into
one scale. Oyserman and James (2011) articulated that “….a pre-selected list reduces
changes of learning what is salient to the respondent and increases the chance of social
desirability influences” (p. 123). If researchers predict significant variations in
participants’ academic goals and self-regulated learning strategies based on pilot studies,
the PAPSS may be inappropriate. The PAPSS was developed based on the content
analysis of general junior high and high school students, so it may not fully capture
diverse academic possible goals and self-regulated learning strategies of students in other
boundaries (i.e., dropt out students). In this case, conducting content analysis of those
students’ open-ended responses of academic possible selves and self-regulation would be
a more powerful tool to predict those students’ future academic achievements. In sum,
selecting appropriate measures of possible selves based on characteristics of participants
and study purposes should be of a primary concern for possible selves researchers. In
addition, I take into account the importance of the PAPSS direction for preventing
students’ pressure from choosing socially desirable answers. The direction emphasizes

62
the diversity in students’ academic possible goals and strategies as well as focuses on
personal thoughts and feelings.
Future Directions
The next step of the PAPSS study will be gathering more validity evidence. First,
the validity evidence with an existing self-regulation scale which is reliable and valid is
needed. It is interesting to compare the strength of relationship between self-regulation
factors in the PAPSS and the existing self-regulation scale to the strength of relationship
between academic plausibility and the existing self-regulation scale. I expect that the first
correlation will be stronger because self-regulation items in the PAPSS were generated
based on self-regulated learning strategies. One theoretical question before conducting
the study is whether a construct of self-regulation for achieving academic goals with no
time boundary is similar to a construct of self-regulation for achieving academic future
goals for next year. Depending on the level of similarity of the two constructs, the study
results can be the evidence of convergent validity or the evidence of divergent validity
evidence of self-regulation factors in the PAPSS.
In addition, the evidence of convergent validity of the overall PAPSS is required.
If an intervention program is designed to improve students’ academic future goals and
self-regulation for achieving these goals, the PAPSS should capture the program effect
(i.e., growth over time). However, developing an intervention program and examining the
program effect on both academic possible selves and self-regulation should proceed
before testing the evidence of convergent validity of the PAPSS. In addition, the
program effect should be measured by multiple methods such as interviews with
participants, ratings from teachers and parents, and participants’ academic achievement in

63
the following year (e.g., GPA) to check any bias associated with self-reported scores of
the PAPSS.
The current factor structure of the PAPSS is a complex, multi-dimensional factor
structure which can be interpretable within the Structural Equation Modeling (SEM)
framework. Therefore, it would be the next step for researchers to investigate how to use
the PAPSS scores in convenient way in secondary education (e.g., a mean score of an
individual factor). The research question would be how we can meaningfully interpret
subscale means and an average score of the PAPSS and how we can use these scores for
better understanding students’ academic possible selves and self-regulation. It can be
valuable to test whether summated scores by factors in the PAPSS can predict students’
academic performance for the coming year. The study results can be used as the evidence
of predictive validity of the PAPSS.
After consecutive validation study, the PAPSS will be a beneficial tool for
researchers to use for examining students’ academic possible selves and self-regulation,
for evaluating a program effect on promoting academic possible selves and self-
regulation, and for investigating the processes of actualizing academic possible selves by
means of self-regulated learning strategies. For teachers, the PAPSS will be a useful tool
for developing curriculums and instructions to motivate students’ academic possible
selves and self-regulation, encouraging students’ congruency with academic possible
selves, and educating the significance of self-regulation toward achieving academic
possible selves. For parents, the PAPSS will be a helpful device for understanding
important aspects of academic possible selves of their children and providing valuable
directions for guiding their children’s academic possible selves and self-regulation.

64
REFERENCES
American Association of University Women. (2010). Why so few? Women in science,
technology, engineering, and mathematics. Washington, DC: Author.
Anderman, E. M., Anderman, L. H., & Griesinger, T. (1999). The relation of present and
possible academic selves during early adolescence to grade point average and
achievement goals. Elementary School Journal, 100, 3-17.
Bandura, A. (1997). Self-efficacy: The exercise of control. New York, NY: Freeman.
Bandura, A., & Schunk, D. H. (1981). Cultivating competence, self-efficacy, and intrinsic
interest through proximal self-motivation. Journal of Personality and Social
Psychology, 41, 586-598.
Correll, S. J. (2001). Gender and the career choice process: The role of biased self‐assessments. The American Journal of Sociology, 106, 1691-1730.
Curran, P. J., West, S. G., & Finch, J. F. (1996). The robustness of test statistics to
nonnormality and specification error in confirmatory factor analysis.
Psychological Methods, 1, 16-29.
Destin, M. & Oyserman, D. (2009). From assets to school outcomes: How finances shape
children’s perceived possibilities and intentions. Psychological Science, 20(4),
414-418.
Destin, M. & Oyserman, D. (2010). Incentivizing education: Seeing schoolwork as an
investment, not a chore. Journal of Experimental Social Psychology, 46, 846–849.
DeVellis, R. (2003). Scale development: Theory and applications. Thousand Oaks, CA:
Sage Publications.
Flora, D. B. & Curran, P. J. (2004). An empirical evaluation of alternative methods of
estimation for confirmatory factor analysis with ordinal data. Psychological
Methods, 9(4), 466–491.
Fraenkel, J. R. & Wallen, N. E. (2000). How to design and evaluate research in
education (4th ed.). Boston, MA: McGraw Hill.
Garcia, T. & Pintrich, P. R. (1995, April). The role of possible selves in adolescents’
perceived competence and self-regulation. Paper session presented at the annual
meeting of the American Educational Research Association, San Francisco, CA

65
Hu, L. & Bentler, P. M. (1999). Cutoff criteria for fit indices in covariance structure
analysis: Conventional criteria versus new alternatives. Structural Equation
Modeling, 6, 1 – 55.
James, W. (1890). The principles of psychology. New York, NY: Dover.
Jones, M. H., Audley-Piotrowski, S. R., & Kiefer, S. M. (2012). Relationships among
adolescents’ perceptions of friends’ behaviors, academic self-concept, and math
performance. Journal of Educational Psychology, 104(1), 19-31.
Kao, G. (2000). Group images and possible selves among adolescents: Linking
stereotypes to expectations by race and ethnicity. Sociological Forum, 15(3), 407-
430.
Kemmelmeier, M. & Oyserman, D. (2001). Gendered influence of downward social
comparisons on current and possible selves. Journal of Social Issues, 57, 129-148.
Lee, J., & Husman, J. (2012, September). The pilot study of the persistent academic
possible selves scale for adolescents (PAPSS). In W. Lens (Chair), The Future
Motivates the Present. Symposium conducted at the meeting of the 1st
International Conference on Time Perspective, Coimbra, Portugal.
Lee, J., & Husman, J. (2013). The pilot study of the persistent academic possible selves
scale for adolescents (PAPSS). Manuscript submitted for publication.
Lee, J., Husman, J., Maez, C., & Scott, K. (2011, April). The outcome space of the open-
ended possible selves questionnaire of female adolescents in poverty. Poster
session presented at the annual meeting of the American Educational Research
Association, New Orleans, LA.
Leondari, A., Syngollitou, E., & Kiosseoglou, G. (1998). Academic achievement,
motivation, and future selves. Educational Studies, 4(2), 153-163.
Markus, H., & Nurius, H. (1986). Possible selves. American Psychologist, 41, 954-969.
Marsh, H. W. (2007). Self-concept theory, measurement and research into practice: The
role of self-concept in educational psychology. Education, 91. British
Psychological Society Leicester, UK. Retrieved from
http://66.216.90.50/News/Seminars/sem-selfconf.pdf
Marsh, H. W., Byrne, B. M., & Shavelson, R. J. (1988). A multifaceted academic self-
concept: Its hierarchical structure and its relation to academic achievement.
Journal of Educational Psychology, 80, 366-380.

66
Muthén, L. K., & Muthén, B. O. (2012). Mplus user’s guide. (7th Ed.). Los Angeles, CA:
Muthén, & Muthén.
Myers, N. D., Ahn, S., & Jin, Y. (2011). Sample size and power estimates for a
confirmatory factor analytic model in exercise and sport: A monte carlo approach,
Research Quarterly for Exercise and Sport, 82(3), 412–423.
Oyserman, D. (2001). Self-concept and identity. In A. Tesser & N. Schwarz, The
Blackwell Handbook of Social Psychology (pp. 499-517). Malden, MA:
Blackwell.
Oyserman, D. (2003). Instructions for Coding Academic Plausibility. Ann Arbor, MI:
University of Michigan. Retrieved from
http://www.sitemaker.umich.edu/culture.self/files/plausibility_instructions_only0
12903.doc
Oyserman, D. (2004). Possible selves citations, measure, and coding instructions. Ann
Arbor, MI: University of Michigan. Retrieved from
http://www.sitemaker.umich.edu/culture.self/files/possible_selves_measure.doc
Oyserman, D. (2007). Social identity and self‐regulation. In A. Kruglanski & T. Higgins
(Eds.) Handbook of Social Psychology (2nd ed.). (pp. 432‐453). New York, NY:
Guilford Press.
Oyserman, D. (2008). Possible selves: Identity-based motivation and school success. In
H. Marsh, R. Craven, & D., McInerney (Eds.), Self-Processes, Learning and
Enabling Human Potential Dynamic New Approaches (pp. 269-288). Charlotte,
NC: Information Age Press.
Oyserman, D. (2013). Not just any path: Implications of identity-based motivation for
disparities in school outcomes. Economics of Education Review, 33, 179–190.
Oyserman, D., Bybee, D., & Terry, K. (2006). Possible selves and academic outcomes:
How and when possible selves impel action. Journal of Personality and Social
Psychology, 91, 188-204.
Oyserman, D., Bybee, D., Terry, K., & Hart-Johnson, T. (2004). Possible selves as
roadmaps. Journal of Research and Personality, 38, 130-149.
Oyserman, D. & Destin, M. (2010) Identity-based motivation: Implications for
intervention. The Counseling Psychologist, 38(7), 1001-1043.
Oyserman, D., Elmore, K., & Smith, G. (2012). Self, self-concept, and identity. In M.
Leary & J. Tangney (Eds). Handbook of self and Identity, 2nd Ed (pp. 69-104).
New York, NY: Guilford Press.

67
Oyserman, D. & Fryberg, S. A. (2006). The possible selves of diverse adolescents:
Content and function across gender, race and national origin. In C. Dunkel & J.
Kerpelman (Eds.), Possible selves: Theory, research, and applications (pp. 17-
39). Huntington, NY: Nova.
Oyserman, D. & James, L. (2008). Possible selves: From content to process. In K.
Markman, W.M.P. Klein, & J.A. Suhr (Eds.). The Handbook of Imagination and
Mental Stimulation (pp. 373-394). NY: Psychology Press.
Oyserman, D., & James, L. (2011). Possible identities. In S. Schwartz, K. Luyckx, & V.
Vignoles (Eds.) Handbook of Identity Theory and Research (pp. 117-148). Berlin,
Germany: Springer-Verlag.
Oyserman, D., Terry, K., & Bybee, D. (2002). A possible selves intervention to enhance
school involvement. Journal of Adolescence, 25, 313-326.
Packard, B. W. & Conway, P. F. (2006). Methodological choice and its consequences for
possible selves research. An International Journal of Theory and Research, 6,
251-271.
Reynolds, C. R., Livingston, R. B., & Wilson, V. (2009). Measurement and assessment in
education (2nd ed.). Upper Saddle River, NJ: Merrill - Pearson.
Riegle-Crumb, C., & King, B. (2010). Questioning a white male advantage in STEM:
Examining disparities in college major by gender and race/ethnicity. Educational
Researcher, 39(9), 656-664.
Schunk, D. H. (1999). Social-Self Interaction and Achievement Behavior. Educational
Psychologist, 34(4), 219-227.
Schunk, D. H., Pintrich, P. R. & Meece, J. L. (2008). Motivation in education: Theory,
research, and applications (3rd ed.). Columbus, OH: Merrill.
Schunk, D. H. & Zimmerman, B. J. (1997). Social origins of self-regulatory competence,
Educational Psychologist, 32(4), 195-208.
Seymour, E. & Hewitt, N. M. (1997). Talking about leaving: Why undergraduates leave
the sciences. Boulder, CO: Westview Press.
Spector, P. E. (1992). Summated rating scale construction. Thousand Oaks, CA: Sage.
Yu, C. (2002). Evaluating cutoff criteria of model fit indices for latent variable models
with binary and continuous outcomes (Doctoral dissertation). Retrieved from
http://www.statmodel.com/download/Yudissertation.pdf

68
Zimmerman, B. J. (2000). Attaining self-regulation: A social cognitive perspective. In M.
Boekaerts, P. R. Pintrich, & M. Zeidner (Eds.), Handbook of self-regulation (pp.
13-39). San Diego, CA: Academic Press.
Zimmerman, B. J., & Martinez-Pons, M. (1986). Development of a structured interview
for assessing student use of self-regulated learning strategies, American
Educational Research Journal, 23(4), 614-628.
Zimmerman, B. J., & Martinez-Pons, M. (1988). Construct validation of a strategy model
of student self-regulated learning, Journal of Educational Psychology, 80(3), 284-
290.
Zimmerman, B. J., & Martinez-Pons, M. (2007). Pursuing academic self-regulation: A
20-year methodological quest. In Jessie Ee and Agnes Chang (eds.) Studies on
motivation and self-regulated learning (pp. 3-30). London, UK: World Scientific
Publishing Co. Limited.

69
APPENDIX A
DESCRIPTIVE STATISTICS

70
N Min Max M SD Skewness Kurtosis
P1 495 1.00 7.00 5.91 1.13 -1.07 0.89
P2 495 1.00 7.00 6.35 0.94 -2.07 6.23
P3 493 2.00 7.00 5.55 1.11 -0.58 -0.12
P4 494 1.00 7.00 5.67 1.27 -1.24 1.68
P5 493 1.00 7.00 6.15 0.95 -1.59 4.03
P6 495 1.00 7.00 5.15 1.26 -0.65 0.28
P7 495 1.00 7.00 6.57 0.82 -2.70 9.55
P8 493 1.00 7.00 6.17 0.96 -1.73 4.78
P9 493 1.00 7.00 6.14 1.01 -1.47 3.19
P10 494 1.00 7.00 5.64 1.27 -1.03 0.94
P11 495 1.00 7.00 6.43 0.88 -2.34 7.97
P12 495 1.00 7.00 5.57 1.41 -0.96 0.46
P13 495 1.00 7.00 5.50 1.21 -1.10 1.16
P14 495 1.00 7.00 5.88 1.17 -1.30 1.89
P15 495 1.00 7.00 6.21 1.00 -1.84 4.91
P16 492 2.00 7.00 5.98 0.95 -0.87 0.34
P17 494 1.00 7.00 5.75 1.15 -1.15 1.54
P18 493 1.00 7.00 5.92 1.10 -1.16 1.70
P19 492 1.00 7.00 6.08 1.09 -1.58 3.32
P20 493 1.00 7.00 5.54 1.15 -0.65 0.27
P21 494 1.00 7.00 5.70 1.21 -1.25 1.85

71
P22 494 1.00 7.00 6.06 1.07 -1.68 3.85
P23 493 1.00 7.00 5.25 1.24 -0.61 0.14
P24 493 1.00 7.00 6.51 0.76 -2.24 8.16
P25 494 1.00 7.00 6.22 0.95 -1.52 3.22
P26 493 1.00 7.00 6.24 0.92 -1.41 2.74
P27 494 1.00 7.00 5.69 1.27 -1.12 1.10
P28 495 1.00 7.00 6.43 0.84 -2.20 7.77
P29 494 1.00 7.00 5.59 1.43 -1.05 0.68
P30 495 1.00 7.00 5.57 1.22 -0.99 0.94
P31 495 1.00 7.00 5.84 1.15 -1.31 2.02
P32 494 1.00 7.00 5.87 1.14 -1.15 1.38
P33 495 1.00 7.00 5.82 1.13 -1.17 1.64
P34 494 1.00 7.00 5.68 1.19 -1.05 1.08
P35 495 1.00 7.00 5.69 1.21 -1.08 1.30
P36 495 1.00 7.00 5.86 1.25 -1.39 1.90
P37 493 1.00 7.00 5.17 1.34 -0.69 0.33
P38 494 1.00 7.00 5.53 1.34 -1.17 1.40
P39 495 1.00 7.00 5.88 1.21 -1.70 3.75
P40 493 1.00 7.00 5.13 1.43 -0.75 0.17
P41 495 1.00 7.00 6.16 1.01 -1.48 2.71
P42 494 1.00 7.00 5.88 1.16 -1.28 2.00
P43 492 1.00 7.00 5.97 1.11 -1.28 1.76

72
P44 495 1.00 7.00 5.52 1.41 -1.10 0.89
P45 494 1.00 7.00 6.18 1.06 -1.65 3.14
P46 494 1.00 7.00 5.37 1.52 -0.89 0.19
P47 495 1.00 7.00 5.40 1.36 -0.97 0.78
P48 495 1.00 7.00 5.60 1.40 -1.13 0.91
P49 495 1.00 7.00 5.23 1.53 -0.84 0.17
P50 495 1.00 7.00 5.29 1.47 -0.94 0.39
P51 495 1.00 7.00 5.38 1.51 -1.02 0.54
PLS 320 0.00 5.00 2.97 1.24 -0.50 -0.24
Note. P = The persistent academic possible selves scale for adolescents (PAPSS); PLS =
Academic plausibility score.

73
APPENDIX B
THE PERSISTENT ACADEMIC POSSIBLE SELVES SCALE FOR ADOELSCENTS
(PAPSS)

74
Theoretical
Components
Goal 1: Improving
classroom grades
Goal 2: Being a better
student
Goal 3: Paying more
attention in class
Social
Identity
1. People who
care about me
think I will
improve my
classroom
grades next
year.
18. People who
care about me
think I will be
a better
student next
year.
35. People who
care about me
think I will
pay more
attention in
class next
year.
2. People who
care about me
will encourage
me to improve
my classroom
grades next
year.
19. People who
care about me
will encourage
me to be a
better student
next year.
36. People who
care about me
will encourage
me to pay
more attention
in class next
year.
3. In general my
friends want to
improve their
classroom
grades next
year.
20. In general my
friends want to
be better
students next
year.
37. In general my
friends want to
pay more
attention in
class next
year.
4. People who
care about me
think I can
create a plan to
improve my
classroom
grades next
year.
21. People who
care about me
think I can
create a plan to
be a better
student next
year.
38. People who
care about me
think I can
create a plan to
pay more
attention in
class next
year.
5. People who
care about me
will encourage
my efforts to
improve my
classroom
grades next
year.
22. People who
care about me
will encourage
my efforts to
be a better
student next
year.
39. People who
care about me
will encourage
my efforts to
pay more
attention in
class next
year.
6. In general my
friends are
likely to use
study skills to
improve their
classroom
grades next
23. In general my
friends are
likely to use
study skills to
be better
students next
year.
40. In general my
friends are
likely to use
study skills to
pay more
attention in
class next

75
year. year.
Personal
Identity &
Forethought
phase in self-
regulation
7. I would like to
improve my
classroom
grades next
year.
24. I would like to
be a better
student next
year.
41. I would like to
pay more
attention in
class next
year.
8. I can see
myself
improving my
classroom
grades next
year.
25. I can see
myself being a
better student
next year.
42. I can see
myself paying
more attention
in class next
year.
9. I am confident
that I can
improve my
classroom
grades next
year.
26. I am confident
that I can be a
better student
next year.
43. I am confident
that I can pay
more attention
in class next
year.
10. I am confident
that I will have
a plan to
improve my
classroom
grades next
year.
27. I am confident
that I will have
a plan to be a
better student
next year.
44. I am confident
that I will have
a plan to pay
more attention
in class next
year.
11. With hard
work, I can
improve my
classroom
grades next
year.
28. With hard
work, I can be
a better
student next
year.
45. With hard
work, I can
pay more
attention in
class next
year.
12. If I improve
my classroom
grades next
year, I will
treat myself to
something I
like.
29. If I am a better
student next
year, I will
treat myself to
something I
like.
46. If I pay more
attention in
class next
year, I will
treat myself to
something I
like.
Performance
phase in self-
regulation
13. Throughout
next year I will
evaluate my
plan to
improve my
classroom
grades.
30. Throughout
next year I will
evaluate my
plan to be a
better student.
47. Throughout
next year I will
evaluate my
plan to pay
more attention
in class.

76
14. Throughout
next year I will
look for help
when I face
problems in
improving my
classroom
grades.
31. Throughout
next year I will
look for help
when I face
problems in
being a better
student.
48. Throughout
next year I will
look for help
when I face
problems in
paying more
attention in
class.
15. Throughout
next year I will
keep track of
my classroom
grades.
32. Throughout
next year I will
keep track of
my progress in
becoming a
better student.
49. Throughout
next year I will
keep track of
how much I
pay attention
in class.
16. Throughout
next year I will
assess my
classroom
grades.
33. Throughout
next year I will
assess my
progress in
becoming a
better student.
50. Throughout
next year I will
assess how
much I pay
attention in
class.
17. Throughout
next year I will
seek ways to
create a better
plan for
improving my
classroom
grades.
34. Throughout
next year I will
seek ways to
create a better
plan for being
a better
student.
51. Throughout
next year I will
seek ways to
create a better
plan for
paying more
attention in
class.

77
APPENDIX C
STANDARDIZED FACTOR LOADINGS

78
Estimate S.E. Est./S.E. p
F1 Improving Grades
P1 .74 .03 28.05 p < .001
P2 .73 .03 25.17 p < .001
P3 .37 .04 8.89 p < .001
P4 .77 .02 35.40 p < .001
P5 .73 .03 29.45 p < .001
P6 .48 .04 13.18 p < .001
P7 .61 .04 15.03 p < .001
P8 .62 .03 20.65 p < .001
P9 .66 .03 23.31 p < .001
P10 .71 .02 29.18 p < .001
P11 .58 .04 15.12 p < .001
P12 .38 .04 9.37 p < .001
P13 .69 .02 28.12 p < .001
P14 .55 .03 18.40 p < .001
P15 .53 .04 14.42 p < .001
P16 .56 .03 16.59 p < .001
P17 .73 .02 31.59 p < .001
F2 Better Student
P18 .75 .02 31.73 p < .001
P19 .81 .02 39.88 p < .001
P20 .47 .04 13.22 p < .001
P21 .82 .02 46.21 p < .001
P22 .81 .02 41.37 p < .001
P23 .60 .03 18.89 p < .001
P24 .68 .03 21.65 p < .001
P25 .63 .03 20.76 p < .001
P26 .68 .03 22.22 p < .001
P27 .72 .03 29.20 p < .001
P28 .64 .03 20.34 p < .001
P29 .40 .04 10.51 p < .001
P30 .74 .02 34.93 p < .001
P31 .57 .03 18.81 p < .001
P32 .65 .03 22.75 p < .001
P33 .68 .03 25.52 p < .001
P34 .72 .02 30.96 p < .001
F3 Paying Attention
P35 .84 .02 45.65 p < .001
P36 .84 .02 49.71 p < .001
P37 .62 .03 19.55 p < .001
P38 .90 .02 52.42 p < .001
P39 .87 .02 52.69 p < .001
P40 .67 .03 22.97 p < .001
P41 .69 .03 23.91 p < .001

79
P42 .67 .03 23.67 p < .001
P43 .67 .03 22.40 p < .001
P44 .71 .02 29.51 p < .001
P45 .66 .03 23.15 p < .001
P46 .52 .04 15.00 p < .001
P47 .73 .02 31.12 p < .001
P48 .66 .03 23.66 p < .001
P49 .63 .03 22.30 p < .001
P50 .66 .03 25.18 p < .001
P51 .71 .02 29.17 p < .001
F4 Peer Modeling
P3 .55 .04 15.45 p < .001
P6 .61 .03 20.17 p < .001
P20 .67 .03 24.78 p < .001
P23 .65 .03 22.32 p < .001
P37 .54 .03 19.21 p < .001
P40 .52 .03 18.32 p < .001
F5 Self-rewards
P12 .83 .02 44.52 p < .001
P29 .86 .02 43.40 p < .001
P46 .76 .02 40.32 p < .001
F6 Self-concept
P7 .26 .04 6.07 p < .001
P8 .53 .03 17.80 p < .001
P9 .49 .03 17.35 p < .001
P24 .26 .04 6.99 p < .001
P25 .59 .03 22.08 p < .001
P26 .60 .03 18.42 p < .001
P41 .33 .04 8.74 p < .001
P42 .57 .03 20.56 p < .001
P43 .58 .03 21.00 p < .001
F7 Self-control
P10 .43 .03 14.84 p < .001
P11 .31 .04 7.45 p < .001
P27 .48 .03 14.94 p < .001
P28 .35 .04 8.87 p < .001
P44 .56 .03 20.12 p < .001
P45 .36 .03 10.68 p < .001
F8 Self-regulated Strategies
P13 .45 .03 15.70 p < .001
P14 .45 .03 14.56 p < .001
P15 .30 .04 7.56 p < .001
P16 .31 .03 9.09 p < .001
P17 .42 .03 14.46 p < .001
P30 .48 .02 20.21 p < .001

80
P31 .48 .03 16.66 p < .001
P32 .54 .03 20.09 p < .001
P33 .56 .03 21.93 p < .001
P34 .47 .03 18.20 p < .001
P47 .55 .02 23.25 p < .001
P48 .49 .03 19.40 p < .001
P49 .55 .03 21.96 p < .001
P50 .55 .02 23.37 p < .001
P51 .54 .03 20.97 p < .001
Note. P = The persistent academic possible selves scale for adolescents (PAPSS).

81
APPENDIX D
POLYCHORIC CORRELATION MATRIX

82
P1 P2 P3 P4 P5
P1 -
P2 .67 -
P3 .16 .26 -
P4 .58 .58 .25 -
P5 .54 .69 .29 .63 -
P6 .22 .25 .49 .36 .27
P7 .50 .47 .21 .42 .46
P8 .47 .40 .27 .45 .46
P9 .50 .39 .25 .46 .44
P10 .40 .39 .30 .55 .40
P11 .40 .40 .22 .39 .43
P12 .27 .25 .14 .27 .24
P13 .42 .39 .23 .53 .36
P14 .36 .32 .23 .33 .36
P15 .25 .33 .26 .34 .40
P16 .37 .38 .24 .42 .41
P17 .45 .48 .23 .58 .44
P18 .65 .54 .25 .58 .54
P19 .60 .67 .30 .53 .64
P20 .23 .26 .65 .31 .29
P21 .53 .51 .23 .67 .53
P22 .55 .66 .31 .61 .73
P23 .28 .27 .49 .38 .31
P24 .48 .47 .24 .44 .46
P25 .47 .44 .29 .39 .42
P26 .47 .43 .36 .44 .44
P27 .39 .37 .28 .52 .36
P28 .47 .43 .25 .38 .42
P29 .25 .29 .12 .26 .22
P30 .43 .37 .29 .53 .36
P31 .40 .42 .25 .40 .35
P32 .45 .42 .18 .43 .45
P33 .46 .42 .22 .43 .43
P34 .45 .39 .24 .53 .37
P35 .55 .43 .26 .51 .47
P36 .51 .54 .24 .50 .55
P37 .29 .27 .48 .33 .26
P38 .51 .48 .22 .59 .48
P39 .52 .57 .28 .52 .58
P40 .27 .25 .33 .38 .28
P41 .41 .39 .15 .35 .34
P42 .40 .34 .22 .36 .34
P43 .43 .38 .23 .42 .40
P44 .39 .34 .19 .46 .32
P45 .43 .39 .13 .39 .39
P46 .34 .28 .12 .28 .22
P47 .43 .36 .14 .46 .31
P48 .43 .37 .17 .40 .38
P49 .38 .33 .12 .40 .35
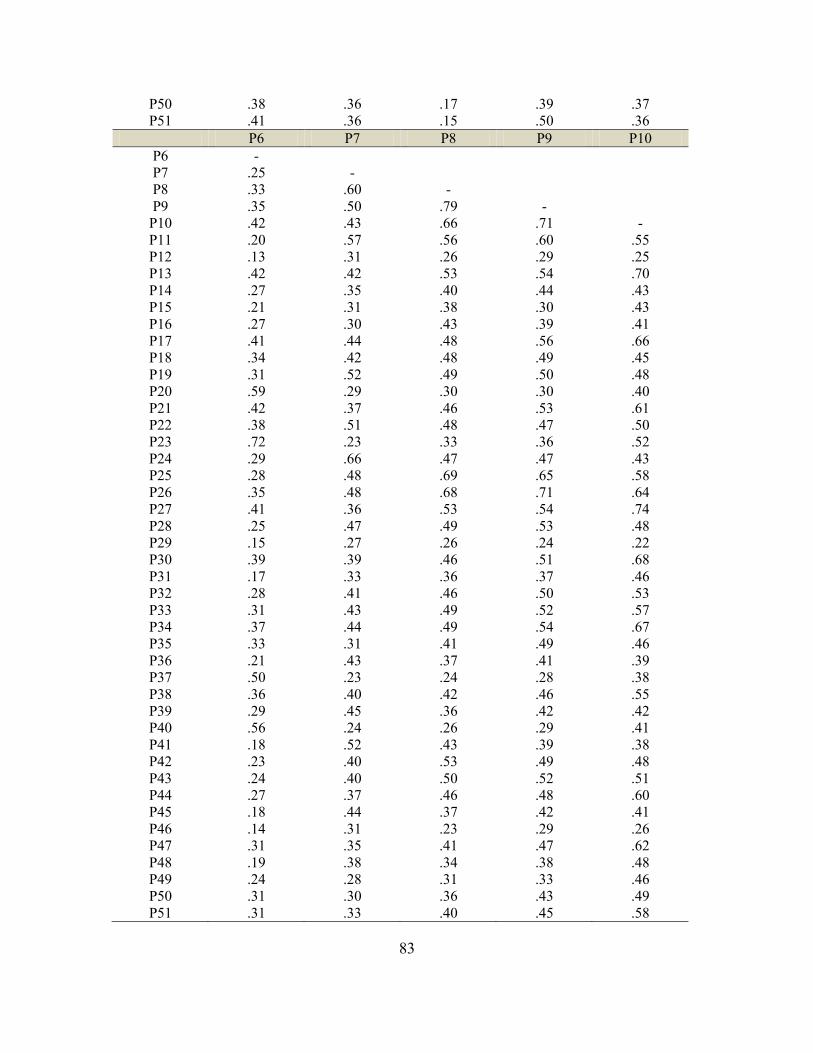
83
P50 .38 .36 .17 .39 .37
P51 .41 .36 .15 .50 .36
P6 P7 P8 P9 P10
P6 -
P7 .25 -
P8 .33 .60 -
P9 .35 .50 .79 -
P10 .42 .43 .66 .71 -
P11 .20 .57 .56 .60 .55
P12 .13 .31 .26 .29 .25
P13 .42 .42 .53 .54 .70
P14 .27 .35 .40 .44 .43
P15 .21 .31 .38 .30 .43
P16 .27 .30 .43 .39 .41
P17 .41 .44 .48 .56 .66
P18 .34 .42 .48 .49 .45
P19 .31 .52 .49 .50 .48
P20 .59 .29 .30 .30 .40
P21 .42 .37 .46 .53 .61
P22 .38 .51 .48 .47 .50
P23 .72 .23 .33 .36 .52
P24 .29 .66 .47 .47 .43
P25 .28 .48 .69 .65 .58
P26 .35 .48 .68 .71 .64
P27 .41 .36 .53 .54 .74
P28 .25 .47 .49 .53 .48
P29 .15 .27 .26 .24 .22
P30 .39 .39 .46 .51 .68
P31 .17 .33 .36 .37 .46
P32 .28 .41 .46 .50 .53
P33 .31 .43 .49 .52 .57
P34 .37 .44 .49 .54 .67
P35 .33 .31 .41 .49 .46
P36 .21 .43 .37 .41 .39
P37 .50 .23 .24 .28 .38
P38 .36 .40 .42 .46 .55
P39 .29 .45 .36 .42 .42
P40 .56 .24 .26 .29 .41
P41 .18 .52 .43 .39 .38
P42 .23 .40 .53 .49 .48
P43 .24 .40 .50 .52 .51
P44 .27 .37 .46 .48 .60
P45 .18 .44 .37 .42 .41
P46 .14 .31 .23 .29 .26
P47 .31 .35 .41 .47 .62
P48 .19 .38 .34 .38 .48
P49 .24 .28 .31 .33 .46
P50 .31 .30 .36 .43 .49
P51 .31 .33 .40 .45 .58

84
P11 P12 P13 P14 P15
P11 -
P12 .24 -
P13 .47 .36 -
P14 .36 .34 .54 -
P15 .36 .24 .42 .48 -
P16 .33 .21 .49 .43 .68
P17 .47 .29 .72 .53 .48
P18 .34 .33 .47 .40 .35
P19 .49 .29 .42 .43 .43
P20 .26 .09 .35 .25 .21
P21 .44 .20 .57 .39 .36
P22 .43 .24 .49 .39 .48
P23 .29 .19 .47 .33 .29
P24 .56 .29 .45 .39 .46
P25 .51 .33 .50 .44 .43
P26 .53 .28 .51 .48 .37
P27 .44 .26 .65 .49 .41
P28 .68 .24 .41 .38 .37
P29 .16 .86 .31 .33 .25
P30 .45 .31 .78 .58 .41
P31 .33 .28 .47 .68 .43
P32 .43 .25 .59 .57 .57
P33 .40 .30 .64 .55 .55
P34 .39 .23 .67 .54 .44
P35 .41 .32 .46 .43 .29
P36 .41 .32 .38 .37 .36
P37 .22 .21 .39 .34 .22
P38 .40 .22 .54 .38 .35
P39 .40 .31 .41 .42 .42
P40 .21 .15 .41 .29 .12
P41 .43 .24 .39 .35 .33
P42 .38 .28 .44 .43 .35
P43 .43 .24 .43 .45 .33
P44 .35 .24 .59 .49 .35
P45 .54 .23 .40 .37 .39
P46 .19 .78 .35 .31 .19
P47 .34 .30 .66 .50 .37
P48 .31 .32 .49 .58 .36
P49 .29 .29 .55 .48 .38
P50 .28 .29 .56 .42 .37
P51 .32 .29 .62 .50 .37
P16 P17 P18 P19 P20
P16 -
P17 .57 -
P18 .38 .51 -
P19 .40 .50 .70 -
P20 .29 .36 .37 .37 -
P21 .37 .63 .61 .61 .35

85
P22 .41 .54 .60 .72 .39
P23 .28 .49 .44 .33 .69
P24 .39 .47 .49 .58 .32
P25 .46 .52 .50 .49 .37
P26 .42 .52 .52 .53 .39
P27 .48 .69 .46 .47 .44
P28 .38 .48 .40 .52 .33
P29 .26 .32 .29 .27 .11
P30 .48 .71 .49 .49 .43
P31 .36 .52 .44 .45 .28
P32 .52 .66 .42 .54 .26
P33 .58 .64 .45 .55 .30
P34 .46 .74 .48 .49 .39
P35 .34 .44 .60 .55 .32
P36 .32 .43 .56 .70 .29
P37 .24 .40 .34 .36 .63
P38 .41 .56 .51 .60 .34
P39 .42 .44 .55 .68 .29
P40 .22 .43 .40 .28 .53
P41 .36 .45 .35 .41 .23
P42 .38 .41 .38 .38 .27
P43 .39 .43 .37 .38 .24
P44 .40 .60 .42 .41 .28
P45 .39 .47 .40 .46 .25
P46 .21 .32 .29 .30 .12
P47 .44 .67 .41 .47 .30
P48 .28 .54 .43 .47 .24
P49 .34 .53 .39 .41 .21
P50 .47 .57 .46 .46 .29
P51 .46 .64 .43 .43 .28
P21 P22 P23 P24 P25
P21 -
P22 .73 -
P23 .49 .42 -
P24 .52 .62 .32 -
P25 .41 .46 .39 .64 -
P26 .50 .44 .43 .65 .85
P27 .61 .48 .53 .47 .68
P28 .50 .50 .30 .63 .62
P29 .25 .27 .26 .33 .33
P30 .62 .52 .49 .49 .56
P31 .45 .45 .33 .37 .45
P32 .52 .54 .36 .51 .54
P33 .53 .60 .38 .55 .55
P34 .60 .51 .50 .47 .55
P35 .59 .49 .41 .47 .48

86
P36 .55 .63 .32 .54 .44
P37 .40 .31 .62 .32 .32
P38 .67 .56 .45 .45 .44
P39 .57 .65 .37 .55 .44
P40 .43 .29 .72 .26 .31
P41 .45 .45 .30 .59 .50
P42 .43 .33 .36 .44 .62
P43 .43 .38 .30 .45 .59
P44 .53 .39 .37 .41 .51
P45 .45 .41 .28 .51 .44
P46 .27 .28 .27 .29 .31
P47 .55 .47 .46 .40 .48
P48 .46 .49 .36 .39 .40
P49 .48 .41 .37 .30 .37
P50 .47 .43 .41 .37 .44
P51 .51 .45 .41 .42 .44
P26 P27 P28 P29 P30
P26 -
P27 .71 -
P28 .67 .59 -
P29 .31 .25 .23 -
P30 .61 .77 .55 .32 -
P31 .47 .52 .41 .37 .60
P32 .56 .61 .49 .33 .70
P33 .58 .65 .49 .38 .72
P34 .61 .73 .50 .29 .76
P35 .49 .50 .49 .33 .55
P36 .47 .43 .53 .31 .47
P37 .37 .46 .36 .27 .50
P38 .49 .64 .53 .26 .65
P39 .51 .50 .55 .32 .52
P40 .39 .50 .32 .24 .51
P41 .51 .49 .51 .34 .47
P42 .63 .56 .50 .36 .52
P43 .63 .55 .51 .30 .50
P44 .58 .67 .44 .33 .67
P45 .48 .46 .63 .27 .44
P46 .28 .32 .27 .82 .40
P47 .53 .72 .49 .36 .79
P48 .44 .53 .42 .36 .60
P49 .39 .55 .39 .31 .62
P50 .47 .56 .41 .36 .62
P51 .52 .65 .44 .36 .70
P31 P32 P33 P34 P35
P31 -
P32 .59 -
P33 .57 .85 -
P34 .60 .67 .73 -

87
P35 .47 .52 .54 .51 -
P36 .41 .47 .51 .46 .74
P37 .33 .37 .35 .42 .49
P38 .44 .56 .57 .63 .67
P39 .48 .52 .55 .47 .68
P40 .38 .37 .39 .48 .50
P41 .44 .46 .48 .46 .54
P42 .46 .46 .48 .48 .59
P43 .48 .46 .48 .47 .55
P44 .56 .60 .62 .68 .59
P45 .44 .49 .47 .50 .52
P46 .41 .36 .41 .34 .43
P47 .58 .65 .72 .72 .57
P48 .74 .57 .62 .62 .55
P49 .53 .63 .62 .57 .52
P50 .51 .64 .71 .64 .53
P51 .54 .65 .67 .70 .56
P36 P37 P38 P39 P40
P36 -
P37 .43 -
P38 .70 .49 -
P39 .81 .46 .76 -
P40 .40 .72 .57 .45 -
P41 .60 .40 .59 .59 .47
P42 .52 .44 .56 .54 .51
P43 .50 .34 .57 .55 .46
P44 .51 .43 .65 .54 .55
P45 .56 .40 .52 .57 .44
P46 .40 .31 .37 .40 .36
P47 .54 .48 .67 .58 .54
P48 .56 .41 .56 .58 .48
P49 .49 .46 .58 .55 .48
P50 .49 .49 .58 .53 .58
P51 .50 .49 .63 .58 .55
P41 P42 P43 P44 P45
P41 -
P42 .69 -
P43 .63 .85 -
P44 .62 .73 .75 -
P45 .68 .66 .69 .67 -
P46 .40 .41 .38 .44 .38
P47 .54 .58 .58 .77 .56
P48 .48 .53 .53 .66 .53
P49 .44 .49 .49 .64 .53
P50 .48 .53 .53 .65 .54
P51 .56 .60 .59 .74 .58
P46 P47 P48 P49 P50
P46 -
P47 .50 -

88
P48 .53 .73 -
P49 .48 .72 .72 -
P50 .48 .72 .65 .82 -
P51 .46 .78 .68 .75 .81
Note. P = The persistent academic possible selves scale for adolescents (PAPSS).

89
APPENDIX E
IRB APPROVAL LETTERS

90

91

92