the usual suspects: using excel to identify problematic ... dakota state university the usual...
TRANSCRIPT

North Dakota State University
The Usual Suspects: Using Excel to Identify Problematic Items and
Response Patterns from Multiple Choice Tests with Small Samples
Jeremy Penn, Ph.D.Director of Assessment
North Dakota State UniversityAALHE, 2017

In Memory:Del Harnisch1949-2016
Advisor, teacher, friend

North Dakota State University
What is the most interesting exam cheating incident you’ve experienced?
Jeremy PennAALHE, 2017

North Dakota State University
When you suspect there is an issue with an exam you’ve given in class (say, cheating)…who do you investigate?
I’ve lined up some suspects for you to consider:
Jeremy PennAALHE, 2017

Nick Nolte, 2002

Justin Bieber, 2014

Shia LeBeouf, 2007

Shia LeBeouf, 2014

Shia LeBeouf, 2015

Shia LeBeouf, 2017

Or was it one of these guys?

North Dakota State University
Unfortunately,
• No item statistic can catch all cheaters as cheating takes many forms!
• If you are specifically interested in detecting cheating behaviors you might consider research like:
• Wesolowsky, G. O. (2000). Detecting excessive similarity in answers on multiple choice exams. Journal of Applied Statistics, 27(7), 909-921.
Jeremy PennAALHE, 2017

North Dakota State University
Ways an examinee’s test score can go wrong
• Cheating (copying from someone else answers the examinee would not have been able to answer correctly on his / her own)
• Careless responding (answers certain items wrong that he / she should have gotten correct)
• Lucky guessing (get some correct answers by chance)• Creative responding (miss easy items because they interpret
the items in a creative manner)• Random responding (can also happen at the end of a test if
the examinee runs out of time)
Jeremy PennAALHE, 2017
North Dakota State University
For assessment we are also interested in: • Identifying test items that aren’t working well• Identifying poorly written test items• Identifying common mistakes from students• Identify unusual response patterns from students
• Did the student miss a class where the topic was covered?• Was the item biased against students from particular groups? • How can I change my teaching to help all students be
successful?
Jeremy PennAALHE, 2017

North Dakota State University
Most item analysis techniques:• Require large samples (at least 300 examinees, maybe more -
see Nunnally (1967))• Can require substantial expertise, computer programming, or
use of special software
• Today’s technique will work for small samples (within reason, such as within a single class)
• Uses an Excel template (you can also program it into other systems if you wish)
• Intended for multiple-choice tests (use with rubrics or other types of assessments are a talk for another year!)
• Provides information on the items and on the examinees
Jeremy PennAALHE, 2017

North Dakota State University
Review of Core Concepts
• Item Difficulty• Item Discrimination• Distractor Analysis
Jeremy PennAALHE, 2017

North Dakota State University
Item Difficulty
North Dakota State University
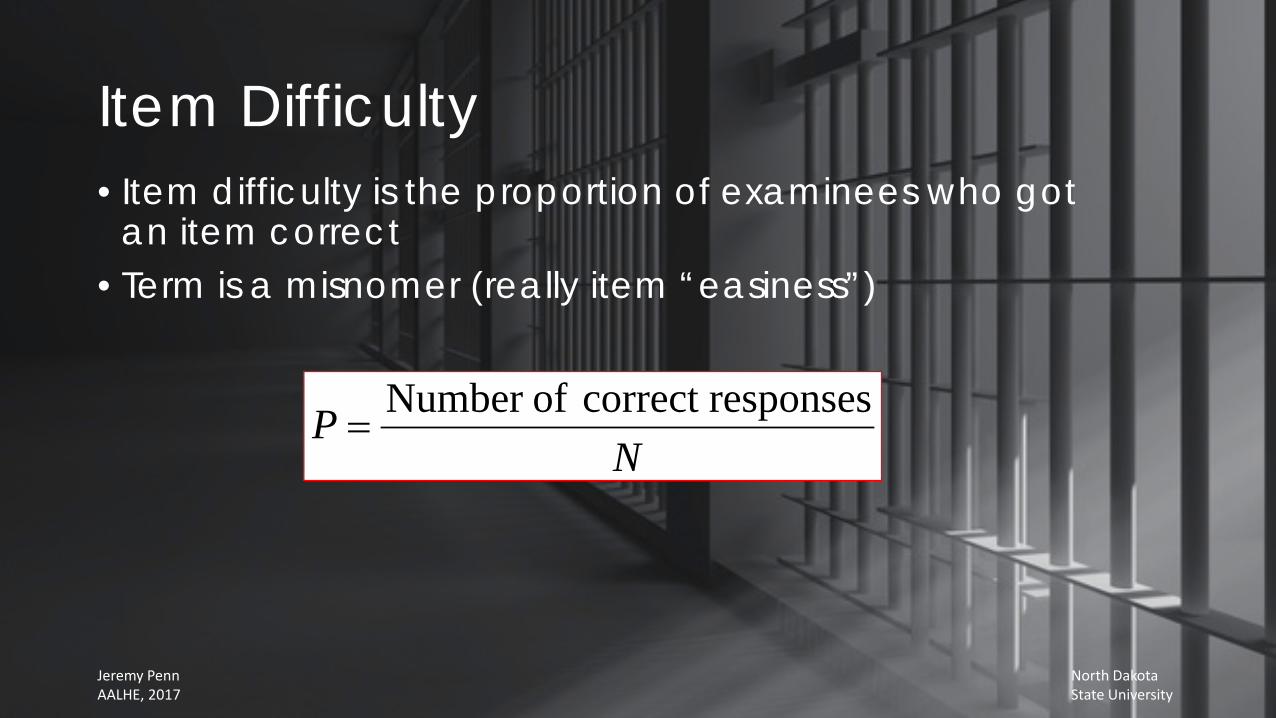
Item Difficulty• Item difficulty is the proportion of examinees who got
an item correct• Term is a misnomer (really item “easiness”)
NP responsescorrectofNumber=
Jeremy PennAALHE, 2017

North Dakota State University
Item Difficulty
Jeremy PennAALHE, 2017

North Dakota State University
Item Difficulty ExampleItem Difficulty
1 0.502 1.003 0.684 0.225 0.14
• Everyone got item 2 correct
• Items 4 and 5 were very hard (few got them correct)
Jeremy PennAALHE, 2017

North Dakota State University
Interpretation depends on the purpose of the test:Mastery (criterion-referenced)• Purpose is to determine
whether or not students gained specific knowledge, skills, abilities
• High item difficulties (items that most students got correct) are acceptable because it suggests students mastered the intended content
Ranking / sorting (norm-referenced)• Purpose is to sort or rank
students from “most” to “least” of the thing that you are testing
• High item difficulties (items that most students got correct) are USESLESS because they provide no information about which students have “more” or “less” of the thing you are testing
Jeremy PennAALHE, 2017

North Dakota State University
Item Difficulty by GroupItem Domestic
Students International
Students1 0.51 0.492 1.00 1.003 0.97 0.394 0.20 0.245 0.09 0.19
• Item 3 may have group bias (differential item functioning, or DIF)
• Check wording of item for possible bias
• Check for equal opportunity to learn
• Could represent actual performance difference between groups
Jeremy PennAALHE, 2017

North Dakota State University
Item Discrimination: Can you tell the difference?

North Dakota State University
Item Discrimination
Item discrimination is the extent to which an item differentiates students on the attribute of interest.
That is, the item’s ability to correctly separate those with “high” and “low” knowledge in the subject area or “more” or “less” of whatever you are testing
Jeremy PennAALHE, 2017

North Dakota State University
Item Discrimination
Maximum discrimination (D = 1.00) occurs when everyone in the “high” group gets the item correct and everyone in the “low” group gets the item wrong
Negative or 0 discrimination is bad!
Jeremy PennAALHE, 2017
North Dakota State University
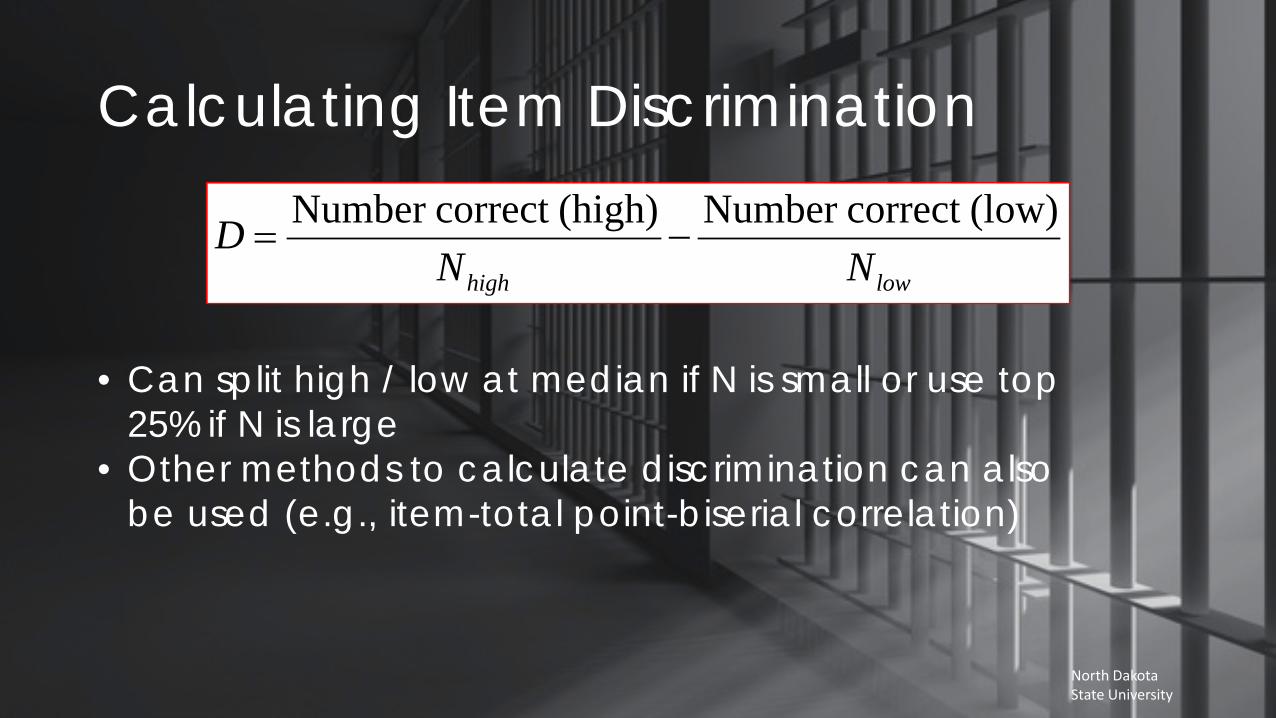
Calculating Item Discrimination
lowhigh NND (low)correctNumber(high)correctNumber
−=
• Can split high / low at median if N is small or use top 25% if N is large
• Other methods to calculate discrimination can also be used (e.g., item-total point-biserial correlation)

North Dakota State University
Item Discriminations• Generally want discrimination
to be 0.30 or higher (but see notes on next slide)
• Item 2 provides no information about which students have “more” or “less” of the thing you are testing
• Item 5 had the biggest gap in performance between the high-achieving group and the low-achieving group
Item Discrimination1 0.302 0.03 0.154 0.675 0.75

North Dakota State University
Interpretation again depends on the purpose of the test:Mastery (criterion-referenced)
• Purpose is to determine whether or not students gained specific knowledge, skills, abilities
• Will have low discrimination if lots of students get the item correct
• May not be that concerned about low item discriminations
Ranking / sorting (norm-referenced)• Purpose is to sort or rank
students from “most” to “least” of the thing that you are testing
• Would remove items that don’t provide reasonable discrimination
• Why waste time with items that don’t separate students into performance groups?
Jeremy PennAALHE, 2017

North Dakota State University
Distractor Analysis

North Dakota State University
Distractors in a Multiple-Choice Test• These are the possible response options that are not the
correct answer (“distract” from the right answer)• Analyzing students’ choice of distractor can improve test
creation:• Distractors that are not chosen at all or infrequently should be
replaced (obviously incorrect)• Distractors that are selected more than the correct answer might
be misleading• Analyzing students’ choice of distractor can improve
teaching:• Identify common errors • Can be used to modify teaching in the future
Jeremy PennAALHE, 2017

North Dakota State University
Let’s Play a Kahoot to see what you’ve learned!
Each person / team needs an internet-connected device
North Dakota State University
Modified Caution IndexDeveloped by Harnisch, Linn, and Sato in the 1980s

North Dakota State University
Modified Caution Index (MCI)
• Uses item difficulty and item discrimination together to generate a new index
• Higher MCI scores suggest additional “caution” when interpreting score results
• Works reasonably well even on small samples (such as a typical classroom)
• Still requires professional judgment – don’t let item statistics be deterministic
• Easy to calculate in Excel or with statistical software
Jeremy PennAALHE, 2017
North Dakota State University
Key references:
Harnisch, D. L., & Linn, R. L. (1981). Analysis of item response patterns: Questionable test data and dissimilar curriculum practices. Journal of Educational Measurement, 18(3), 133-146. Harnisch, D. L. (1983). Item Response Patterns: Applications for educational practice. Journal of Educational Measurement, 20(2), 191-206.
Jeremy PennAALHE, 2017

North Dakota State University
Modified Caution Index: People• Produces an index from 0 to 1 (≥0.26 generally considered
problematic – see Karabatsos, 2003)• In combination with achievement on the test, the MCI is
used to ‘categorize’ the score pattern
Jeremy PennAALHE, 2017
i = 1, 2, … I, indexes the examinee,j = 1, 2, … J, indexes the item,uij = 1 if examinee i answers item j correctly (0 otherwise),ni. = total correct for the ith examinee,n.j = total number correct responses to the jth item

North Dakota State University
Consider these four students:
A. Got nearly all the items correct except for the very hardest question
B. Got nearly all the items correct but surprisingly missed the two “gimmie” questions
C. Got the five easiest questions correct but missed all the hard questions
D. Got the two hardest questions right but missed everything else
Jeremy PennAALHE, 2017

North Dakota State University
The Modified Caution Index offers the ability to classify these four students:A - High achieving student with a regular response pattern.B - High achieving student with an irregular response pattern.C – Low achieving student with a regular response pattern.D – Low achieving student with an irregular response pattern.
From: Harnisch and Kelberlau
Jeremy PennAALHE, 2017
*Can use different values for the MCI and % correct cutoff depending on the context of the test

North Dakota State University
Said another way:
A. Doing everything fineB. Making careless mistakes (or good at “guessing” the
hard items)C. In need of more study or sporadic habitsD. Insufficient readiness
Jeremy PennAALHE, 2017
North Dakota State University
Modified Caution Index: Items• Same exact calculation as for people, but reverses the
role of the people and the items
Jeremy PennAALHE, 2017

North Dakota State University
Consider these four items:
W. Only your best students answered it correctly.X. Only a few students answered it correctly and it was not
your best students.Y. Most students answered it correctly including all of your
best students. Z. Most students answered it correctly but some of your
best students missed it.
Jeremy PennAALHE, 2017

North Dakota State University
The Modified Caution Index has the ability to classify these four items:
W. Difficult item with expected response patternX. Difficult item with an irregular response patternY. Easy item with expected response patternZ. Easy item with an irregular response pattern
Jeremy PennAALHE, 2017

North Dakota State University
Said another way:
W. Seems to work well and discriminates between high and low performing students (few students get it correct)X. Item might need revision, low performing students are getting the item correct while high performing students are missing the item (few students get it correct)Y. Seems to work well and discriminates between high and low performing students (most students get it correct)Z. Item might need revision, low performing students are getting the item correct while high performing students are missing the item (most students get it correct)Jeremy PennAALHE, 2017

North Dakota State University
Item Analysis Using Excel
Jeremy PennAALHE, 2017
North Dakota State University
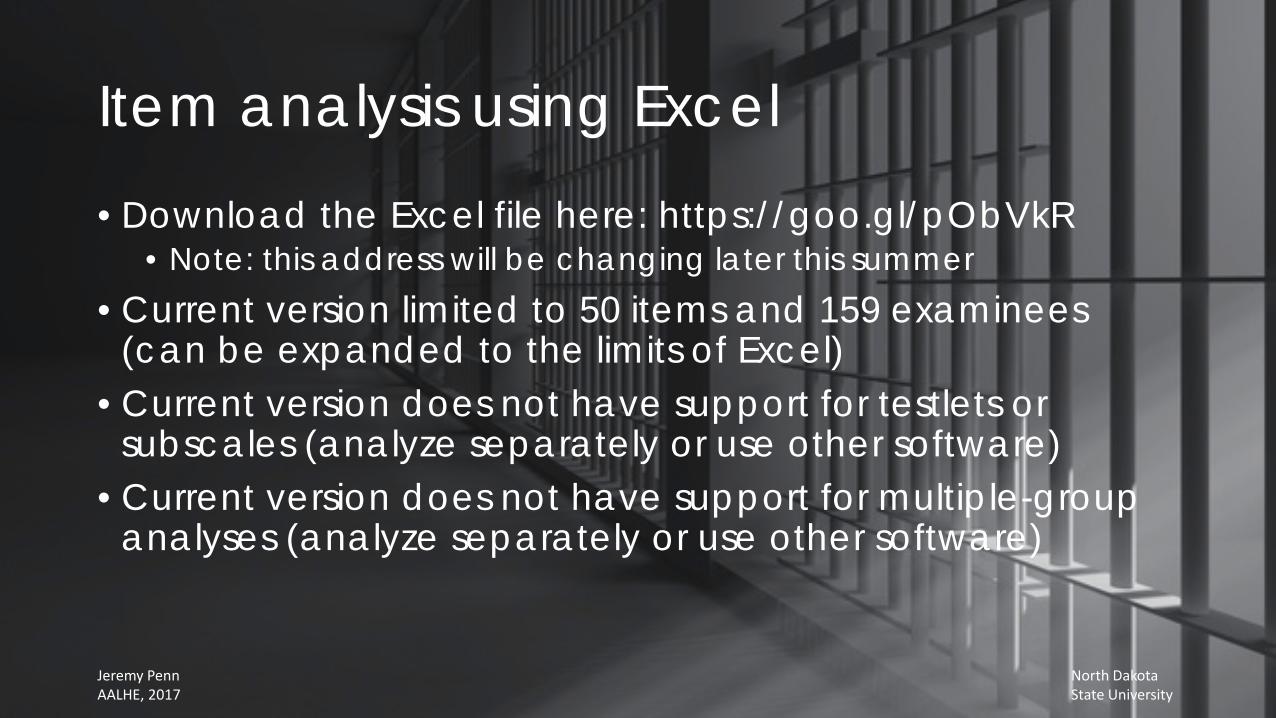
Item analysis using Excel
• Download the Excel file here: https://goo.gl/pObVkR• Note: this address will be changing later this summer
• Current version limited to 50 items and 159 examinees (can be expanded to the limits of Excel)
• Current version does not have support for testlets or subscales (analyze separately or use other software)
• Current version does not have support for multiple-group analyses (analyze separately or use other software)
Jeremy PennAALHE, 2017

North Dakota State University
Getting Started: Put your data (and answer key) into an Excel file
Jeremy PennAALHE, 2017
Items

North Dakota State University
Getting Started: Put your data (and answer key) into an Excel file
Jeremy PennAALHE, 2017
People

North Dakota State University
Getting Started: Put your data (and answer key) into an Excel file
Jeremy PennAALHE, 2017
Answer key is the first row

North Dakota State University
Copy and paste your data into the scoring template on the ‘data’ tab, beginning in cell B2. Then move to tab “Step 1”
Jeremy PennAALHE, 2017

North Dakota State University
Step 1 tab
• Your data have been scored correct / incorrect (1 = correct, 0 = incorrect)
• In order for scoring to be done correctly, YOU MUST DELETE THE ‘1’ OUT OF ALL OF THE CELLS YOU ARE NOT USING
Jeremy PennAALHE, 2017

North Dakota State University
In this example we only had 40 items, so we must delete the ‘1’s out of these columns. DO NOT DELETE THE ENTIRE COLUMN OR ROW, JUST THE DATA.
Jeremy PennAALHE, 2017

North Dakota State University
It will look like this for these 10 items for all 159 respondents.
Move to the “sorted” tab.
Jeremy PennAALHE, 2017

North Dakota State University
Sorted tab
You must manually sort the table so the items with the highest difficulty (largest number in row 1) is at the left in cell B1 and the item with the lowest difficulty is all the way to the right.
#1
#2
#3Jeremy PennAALHE, 2017

North Dakota State University
Repeat these steps on the “sortedtransposed” tab (this will calculate the item indices).
Jeremy PennAALHE, 2017

North Dakota State University
#1 #2
#3
Jeremy PennAALHE, 2017

North Dakota State University
Move to tab “Step 2”
Jeremy PennAALHE, 2017
North Dakota State University
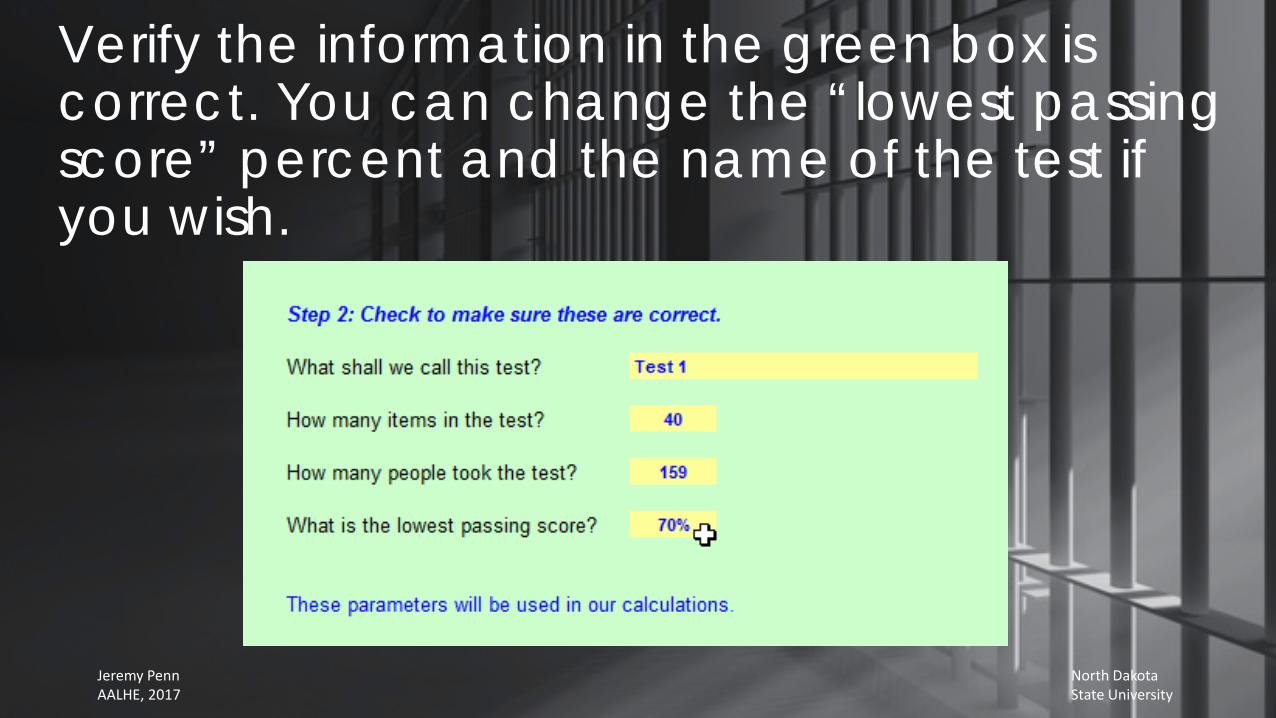
Verify the information in the green box is correct. You can change the “lowest passing score” percent and the name of the test if you wish.
Jeremy PennAALHE, 2017

North Dakota State University
Jeremy PennAALHE, 2017

North Dakota State University
Delete the cells for the items you are not using (in this case, #41 – 50). Just delete the data, not the entire column / row.
Jeremy PennAALHE, 2017

North Dakota State University
Jeremy PennAALHE, 2017

North Dakota State University
Move to “Step 3”

North Dakota State University
Delete any cells for examinees you don’t have • Delete just the cells, not the entire row. (In our example, we have 159 examinees so there is nothing to delete.)
All that is left is to analyze your results!
Jeremy PennAALHE, 2017

North Dakota State University
Analyzing results

North Dakota State University
Step 4a tab

North Dakota State University
Test Summary Information
Jeremy PennAALHE, 2017

North Dakota State University
Test Reliability• Three different measures of
reliability• These will be misleading if your
test covers different content areas (“Testlets” analyze separately). EG:
• World history• Economics• Star Wars Trivia• Should be analyzed separately for
accurate reliability estimates
Jeremy PennAALHE, 2017

North Dakota State University
Item statistics
• Item #37 has negative discrimination, should be revised• Item #36 and #15 have borderline discrimination• #6, #9, #10, #15, #28 all have difficulties outside ideal parameters
(but this depends on the purpose of the test, as discussed earlier).

North Dakota State University
Step 4b tab

North Dakota State University
Step 4b has a scatter plot that shows the items plotted by discrimination and difficulty

North Dakota State University
You can show data labels for these items if you want
Right click on a data point and select “Add Data Labels,” and “Add Data Labels.”
Jeremy PennAALHE, 2017

North Dakota State University
Then….
Right click again and select “format data labels.”
Jeremy PennAALHE, 2017

North Dakota State University
…then…
Select ‘Value from Cells.’
Jeremy PennAALHE, 2017

North Dakota State University
…then…
Use the “Select Data Label Range” to select the appropriate labels for the items
Jeremy PennAALHE, 2017

North Dakota State University
…then…
Highlight the item names (I typed these in a blank spot in one of the other tabs), and hit enter and ‘Ok.’ In the Format Data Labels you can then unselect “Y Value.”
Jeremy PennAALHE, 2017

North Dakota State University

North Dakota State University
Step 4c tab

North Dakota State University
This is a chart for the distribution of scores for examinees –top score of 38, lowest score of 5.Most common score was 31.

North Dakota State University
Distractors

North Dakota State University
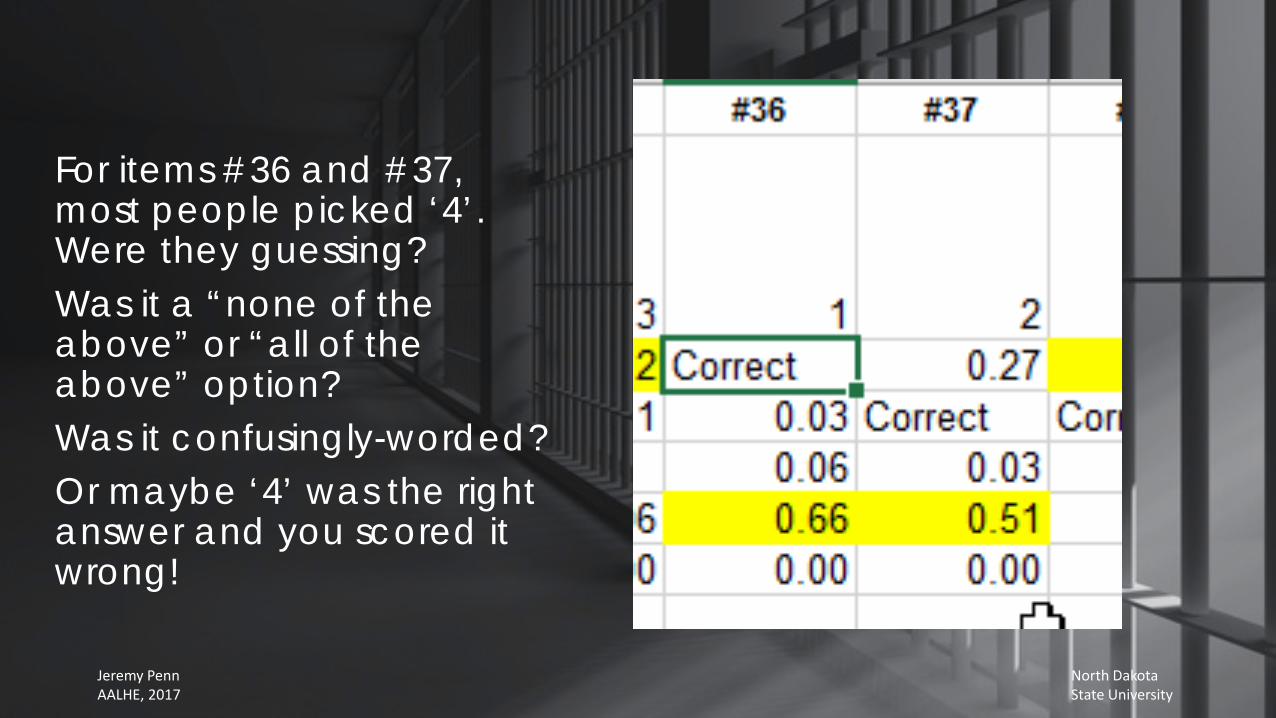
• For each item the most-selected distractor is highlighted.
• The numbers show the proportion of examinees who selected each distractor.
• For item #1, 0.18 or 18% of respondents selected “2” instead of the correct answer “3.”
Jeremy PennAALHE, 2017
North Dakota State University
For items #36 and #37, most people picked ‘4’. Were they guessing? Was it a “none of the above” or “all of the above” option? Was it confusingly-worded? Or maybe ‘4’ was the right answer and you scored it wrong!
Jeremy PennAALHE, 2017

North Dakota State University
Caution Index: People

North Dakota State University
Provides the caution index score (“Person MCI”) and the category based on cutoff of 0.30 for MCI and 50% for test performance. You can adjust these values in the coding if you wish. Person ID 2: Scored 19 (48%) but had a regular response pattern (missed the harder items and got the easy items correct).Person ID 20: Scored 12 (30%) but had an irregular response pattern.Person ID 13: Scored 34 (85%) but missed some items he / she should have gotten correct.

North Dakota State University
Caution Index: Items
North Dakota State University
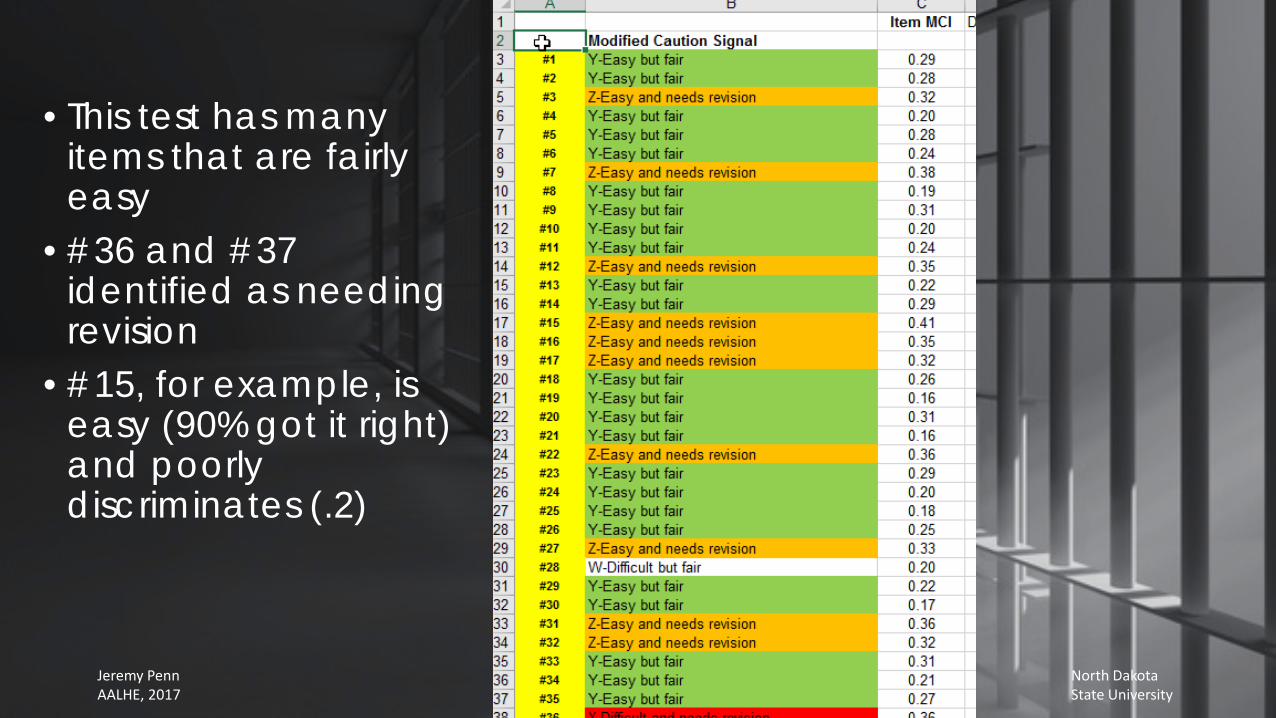
• This test has many items that are fairly easy
• #36 and #37 identified as needing revision
• #15, for example, is easy (90% got it right) and poorly discriminates (.2)
Jeremy PennAALHE, 2017

North Dakota State University
What does all this mean?

North Dakota State University
If all you do when you complete an assessment is summarize the overall scores, you are missing out on a tremendous amount of important information!
Jeremy PennAALHE, 2017

North Dakota State University
Item analysis provides information about examinees• Teach your students how to be good students!• Use this information to work with students who made
careless mistakes – if they can correct the mistakes, they will likely greatly improve!
• Those who need more study have the basics but struggle with the more difficult tasks – remediate and get caught up
Jeremy PennAALHE, 2017

North Dakota State University
Will item analysis prove a student has cheated? • No, but it can be one component of building a case
when cheating is suspected
Jeremy PennAALHE, 2017
North Dakota State University
Item analysis provides information about the test and your teaching• Based on personal experience alone, most classroom tests
are not very good• Careful attention to the performance of the items in your
exams can help you improve your tests – remove misleading or biased items
• Helps you be clear about the purpose of testing
Jeremy PennAALHE, 2017

North Dakota State University
Look for biased items
Examine the items coded as X (“difficult and needs revision”) and Z (“easy and needs revision”)
Jeremy PennAALHE, 2017

North Dakota State University
Review the items to determine if they follow the best-practice guidance on writing effective items (see, for example, Haladyna, T. M., Downing, S. M., & Rodriquez, M. C. (2002). A review of multiple-choice item-writing guidelines for classroom assessment. Applied Measurement in Education, 15(3), 309-334.
Jeremy PennAALHE, 2017

North Dakota State University
Can statistically test for group differences on individual items
Online calculation of statistics for 2x2 contingency tables: http://vassarstats.net/odds2x2.html (Should have expected frequency of at least 5 for each cell.)
Item #36Correct Incorrect Total
Group A 5 15 20Group B 8 5 13Total 13 20 33
Statistically significant in this example, p = 0.04. 25% of group A got it correct vs. 62% of group B.
Jeremy PennAALHE, 2017

North Dakota State University
Interview students!
• Group differences do not prove the existence of bias. Sometimes groups score differently on items and this can represent a real difference.
• You can simply ask students to explain their reasoning and how they answered the item – this can reveal more about how students were thinking about the item and whether or not it is biased.
Jeremy PennAALHE, 2017

North Dakota State University
Can statistics of this sort be automatically programmed into the testing software your institution uses?
Jeremy PennAALHE, 2017

North Dakota State University
Use item analysis as a tool to improve student learning! Isn’t that why we are all here?
Jeremy PennAALHE, 2017